User login
How to defeat radial artery spasm in transradial PCI
PARIS – The threat of radial artery spasm is the chief impediment to broader use of transradial access cardiac catheterization and percutaneous coronary intervention, but Dr. Julien Adjedj has a series of tips and tricks to defeat it.
At Cochin University Hospital in Paris, where he is chief of the interventional cardiology clinic, 95% of all PCIs are done transradially.

“With the tips and tricks we use, we have a transradial approach failure rate of only 1.5% at our center,” Dr. Adjedj said at the annual congress of the European Association of Percutaneous Cardiovascular Interventions.
He and his colleagues have conducted a series of prospective, randomized studies of various prophylactic vasodilator regimens in 1,950 patients undergoing transradial PCI.
The winning strategy? Place 2.5-5.0 mg of the calcium channel blocker verapamil in the arterial sheath as first-line preventive therapy.
In a multivariate analysis adjusted for potential confounders – for example, the investigators found that the incidence of radial artery spasm (RAS) is higher in women and younger patients – the use of prophylactic verapamil placed in the arterial sheath reduced the likelihood of RAS by 75% and 72%, respectively, compared with placebo.
Intra-arterial diltiazem at 5 mg, isosorbide dinitrate at 1 mg, and molsidomine at 1 mg were also more effective than placebo. However, diltiazem and isosorbide dinitrate were associated with an unacceptable increased risk of severe hypotension compared to placebo, and molsidomine is not widely available outside France.
In contrast, verapamil was not linked to severe hypotension.
Overall, RAS occurred in 22.2 % of patients on placebo, 7.1% of those on verapamil at 2.5 mg, 7.9% with verapamil at 5 mg, 6.5% with isosorbide dinitrate at 1 mg, 9.1% of those on diltiazem at 5 mg, 13.3% with molsidomine at 1 mg, and 4.8% with verapamil 2.5 mg plus molsidomine 1 mg.
When it proves difficult to advance the catheter during a transradial PCI despite prophylactic verapamil, the first thing to do is check whether the problem really is RAS or is instead a matter of having entered a remnant artery. This is accomplished by supplementing the verapamil with 1 mg of intra-arterial isosorbide dinitrate; if the catheter still won’t pass, seriously consider the possibility of a remnant artery.
Among Dr. Adjedj’s tips on how to successfully pass the catheter through a drug-refractory RAS: Use a hydrophilic 0.035-inch guide wire, switch from a 6 Fr to a smaller 5 or 4 Fr catheter, or use a long multipurpose 5 Fr catheter inside the 6 Fr guiding catheter.
“It’s like nested Russian dolls. It can pass through the spasm without any pain,” said Dr. Adjedj.
He reported having no financial conflicts regarding his presentation.
PARIS – The threat of radial artery spasm is the chief impediment to broader use of transradial access cardiac catheterization and percutaneous coronary intervention, but Dr. Julien Adjedj has a series of tips and tricks to defeat it.
At Cochin University Hospital in Paris, where he is chief of the interventional cardiology clinic, 95% of all PCIs are done transradially.
“With the tips and tricks we use, we have a transradial approach failure rate of only 1.5% at our center,” Dr. Adjedj said at the annual congress of the European Association of Percutaneous Cardiovascular Interventions.
He and his colleagues have conducted a series of prospective, randomized studies of various prophylactic vasodilator regimens in 1,950 patients undergoing transradial PCI.
The winning strategy? Place 2.5-5.0 mg of the calcium channel blocker verapamil in the arterial sheath as first-line preventive therapy.
In a multivariate analysis adjusted for potential confounders – for example, the investigators found that the incidence of radial artery spasm (RAS) is higher in women and younger patients – the use of prophylactic verapamil placed in the arterial sheath reduced the likelihood of RAS by 75% and 72%, respectively, compared with placebo.
Intra-arterial diltiazem at 5 mg, isosorbide dinitrate at 1 mg, and molsidomine at 1 mg were also more effective than placebo. However, diltiazem and isosorbide dinitrate were associated with an unacceptable increased risk of severe hypotension compared to placebo, and molsidomine is not widely available outside France.
In contrast, verapamil was not linked to severe hypotension.
Overall, RAS occurred in 22.2 % of patients on placebo, 7.1% of those on verapamil at 2.5 mg, 7.9% with verapamil at 5 mg, 6.5% with isosorbide dinitrate at 1 mg, 9.1% of those on diltiazem at 5 mg, 13.3% with molsidomine at 1 mg, and 4.8% with verapamil 2.5 mg plus molsidomine 1 mg.
When it proves difficult to advance the catheter during a transradial PCI despite prophylactic verapamil, the first thing to do is check whether the problem really is RAS or is instead a matter of having entered a remnant artery. This is accomplished by supplementing the verapamil with 1 mg of intra-arterial isosorbide dinitrate; if the catheter still won’t pass, seriously consider the possibility of a remnant artery.
Among Dr. Adjedj’s tips on how to successfully pass the catheter through a drug-refractory RAS: Use a hydrophilic 0.035-inch guide wire, switch from a 6 Fr to a smaller 5 or 4 Fr catheter, or use a long multipurpose 5 Fr catheter inside the 6 Fr guiding catheter.
“It’s like nested Russian dolls. It can pass through the spasm without any pain,” said Dr. Adjedj.
He reported having no financial conflicts regarding his presentation.
AT EUROPCR 2016
Key clinical point: Placing 2.5-5.0 mg of verapamil in the arterial sheath when performing transradial access PCI reduces the risk of radial artery spasm by three-quarters compared with placebo.
Major finding: The incidence of radial artery spasm during transradial access PCI was 7.1% when 2.5 mg of verapamil was introduced through the arterial sheath, compared with 22.2% with placebo.
Data source: This series of prospective randomized studies comprised 1,950 patients undergoing transradial access PCI by way of various intra-arterial vasodilators or placebo.
Disclosures: The presenter reported having no financial conflicts regarding the study, conducted free of commercial support.
End-of-life aggressive cancer care continues despite recommendations
CHICAGO – Aggressive care for most patients with incurable solid tumors continued in the final 30 days of life, and one-third died in the hospital, a recent, large retrospective study of health claims data on more than 28,000 patients shows, and there was no decrease in this practice over a recent 7-year period, despite recommendations to the contrary.
“Aggressive medical care for patients with incurable cancers at the end of life is widely recognized to be harmful to patients and their families,” Dr. Ronald Chen of the University of North Carolina at Chapel Hill said at the annual meeting of the American Society of Clinical Oncology.

As part of the Choosing Wisely campaign in 2012, the American Society of Clinical Oncology’s first recommendation was not to use cancer-directed therapy for patients with solid tumors when there is no strong evidence supporting the clinical value of further anticancer treatment. It also recommended more use of palliative and supportive care. However, the impact of these recommendations on clinical care in younger cancer populations was unknown.
In a study of patients younger than 65 years with solid tumors who died in 2007-2014, Dr. Chen and his associates studied the use of several items that could be considered to be aggressive therapy. They included chemotherapy, radiotherapy, invasive procedures, emergency room visits, hospitalization, intensive care use, and in-hospital death. Patients had any of five common metastatic diseases: breast, lung, prostate, colorectal, or pancreatic cancers (n = 5,855; 12,764; 1,508; 5,207; 3,397, respectively).
The source material for the study was large commercial insurance claims data on patients across 14 states. Investigators evaluated the proportion of patients who received forms of aggressive care in the final 30 days of life.
“Overall, the findings are remarkably consistent across the five diseases. And overall, about three-quarters of patients received at least one form of aggressive care in the last 30 days of life,” Dr. Chen said (range, 71.2%-75.9% of patients). Almost two-thirds of patients (61.6%-65.1%) were admitted to the hospital or went to the emergency department, about 20% of patients (15.9%-20.6%) received intensive care, and one-third of patients (30.3%-35.4%) died in the hospital instead of at home. About 25%-30% of patients received chemotherapy or an invasive procedure, such as a biopsy or a form of surgery. Radiation therapy was used the least and was administered to about 5%-20% of patients.
Looking at the overall use of aggressive care for each of the cancers studied, the researchers found virtually no trend over time, that is, from the second quarter of 2012, when ASCO issued its Choosing Wisely guidelines, through the fourth quarter of 2014. For each of the cancers, aggressive care was delivered to just about 75% of patients across all quarters. Looking further back, the investigators found the same proportions of patients receiving aggressive care in the last 30 days of life during the years 2007-2011.
They also looked specifically at the use of chemotherapy and did not find a change after the Choosing Wisely recommendations, “nor did we find a significant increase in the use of hospice from before 2012 to afterward,” Dr. Chen said. “Additional efforts are critically needed to improve end-of-life care for patients with terminal cancers to ensure that the care provided meets the goals and preferences of patients and their families.” Fewer than one-fifth of patients used hospice care.
Press conference moderator Dr. Patricia Ganz, director of cancer prevention and control research at the Jonsson Comprehensive Cancer Center of the University of California, Los Angeles, called the study “interesting and important for several reasons.” First, there have been very few studies on the topic on the younger (up to age 65) cancer population although the SEER-Medicare database has been used as a source of claims data for older cancer patients. One may like to know if the younger population is being treated more aggressively than the older population is, as well as other patterns of care.
“Giving chemotherapy in the last 30 days of life has been a coping measure for a very long time,” she said. “It’s been nationally looked at as one of our failures in giving good end-of-life care, and so the fact that there wasn’t any dramatic change at 2012 doesn’t bother me in the sense that we’ve been talking about this for a very long time, and we haven’t seen any movement.” She said there is a lot left to do in delivering high quality end-of-life care.
Dr. Chen said more education of both patients and physicians is needed to improve conversations about goals and expectations, as well as palliative care and hospice. These types of care need to be made more accessible, he said.
Limitations of the study include a lack of information on the cause of death (whether related to the cancer, the treatment received, or other), and researchers did not review the medical records to investigate the medical reasons for the use of aggressive care near the end of life.
CHICAGO – Aggressive care for most patients with incurable solid tumors continued in the final 30 days of life, and one-third died in the hospital, a recent, large retrospective study of health claims data on more than 28,000 patients shows, and there was no decrease in this practice over a recent 7-year period, despite recommendations to the contrary.
“Aggressive medical care for patients with incurable cancers at the end of life is widely recognized to be harmful to patients and their families,” Dr. Ronald Chen of the University of North Carolina at Chapel Hill said at the annual meeting of the American Society of Clinical Oncology.
As part of the Choosing Wisely campaign in 2012, the American Society of Clinical Oncology’s first recommendation was not to use cancer-directed therapy for patients with solid tumors when there is no strong evidence supporting the clinical value of further anticancer treatment. It also recommended more use of palliative and supportive care. However, the impact of these recommendations on clinical care in younger cancer populations was unknown.
In a study of patients younger than 65 years with solid tumors who died in 2007-2014, Dr. Chen and his associates studied the use of several items that could be considered to be aggressive therapy. They included chemotherapy, radiotherapy, invasive procedures, emergency room visits, hospitalization, intensive care use, and in-hospital death. Patients had any of five common metastatic diseases: breast, lung, prostate, colorectal, or pancreatic cancers (n = 5,855; 12,764; 1,508; 5,207; 3,397, respectively).
The source material for the study was large commercial insurance claims data on patients across 14 states. Investigators evaluated the proportion of patients who received forms of aggressive care in the final 30 days of life.
“Overall, the findings are remarkably consistent across the five diseases. And overall, about three-quarters of patients received at least one form of aggressive care in the last 30 days of life,” Dr. Chen said (range, 71.2%-75.9% of patients). Almost two-thirds of patients (61.6%-65.1%) were admitted to the hospital or went to the emergency department, about 20% of patients (15.9%-20.6%) received intensive care, and one-third of patients (30.3%-35.4%) died in the hospital instead of at home. About 25%-30% of patients received chemotherapy or an invasive procedure, such as a biopsy or a form of surgery. Radiation therapy was used the least and was administered to about 5%-20% of patients.
Looking at the overall use of aggressive care for each of the cancers studied, the researchers found virtually no trend over time, that is, from the second quarter of 2012, when ASCO issued its Choosing Wisely guidelines, through the fourth quarter of 2014. For each of the cancers, aggressive care was delivered to just about 75% of patients across all quarters. Looking further back, the investigators found the same proportions of patients receiving aggressive care in the last 30 days of life during the years 2007-2011.
They also looked specifically at the use of chemotherapy and did not find a change after the Choosing Wisely recommendations, “nor did we find a significant increase in the use of hospice from before 2012 to afterward,” Dr. Chen said. “Additional efforts are critically needed to improve end-of-life care for patients with terminal cancers to ensure that the care provided meets the goals and preferences of patients and their families.” Fewer than one-fifth of patients used hospice care.
Press conference moderator Dr. Patricia Ganz, director of cancer prevention and control research at the Jonsson Comprehensive Cancer Center of the University of California, Los Angeles, called the study “interesting and important for several reasons.” First, there have been very few studies on the topic on the younger (up to age 65) cancer population although the SEER-Medicare database has been used as a source of claims data for older cancer patients. One may like to know if the younger population is being treated more aggressively than the older population is, as well as other patterns of care.
“Giving chemotherapy in the last 30 days of life has been a coping measure for a very long time,” she said. “It’s been nationally looked at as one of our failures in giving good end-of-life care, and so the fact that there wasn’t any dramatic change at 2012 doesn’t bother me in the sense that we’ve been talking about this for a very long time, and we haven’t seen any movement.” She said there is a lot left to do in delivering high quality end-of-life care.
Dr. Chen said more education of both patients and physicians is needed to improve conversations about goals and expectations, as well as palliative care and hospice. These types of care need to be made more accessible, he said.
Limitations of the study include a lack of information on the cause of death (whether related to the cancer, the treatment received, or other), and researchers did not review the medical records to investigate the medical reasons for the use of aggressive care near the end of life.
AT THE 2016 ASCO ANNUAL MEETING
Key clinical point: End-of-life aggressive cancer care continues unabated despite Choosing Wisely recommendations.
Major finding: Three-quarters of cancer patients received aggressive therapies at end of life.
Data source: Retrospective study of health claims data on 28,731 patients younger than 65 years with incurable cancers.
Disclosures: The study received funding from the North Carolina Translational and Clinical Sciences Institute. Dr. Chen reported consulting or advisory roles with Medivation/Astellas and research funding from Accuray. Dr. Patricia Ganz reported stock and other ownership interest in Abbott Laboratories, GlaxoSmithKline, Johnson & Johnson, Merck, Novartis, Pfizer, and Teva.

VIDEO: Locum Tenens in Hospital Medicine
Dr. Geeta Arora is a locum tenens hospitalist; James Levy is a PA who hires locums as the VP of Human Resources for Indigo Health Partners in Northern Michigan. They share their experiences navigating "freelance hospital medicine," from both the medical practice and business perspective.
The video associated with this article is no longer available on this site. Please view all of our videos on the MDedge YouTube channel

Dr. Gloviczki: Of Ties, VAM and a New Challenge
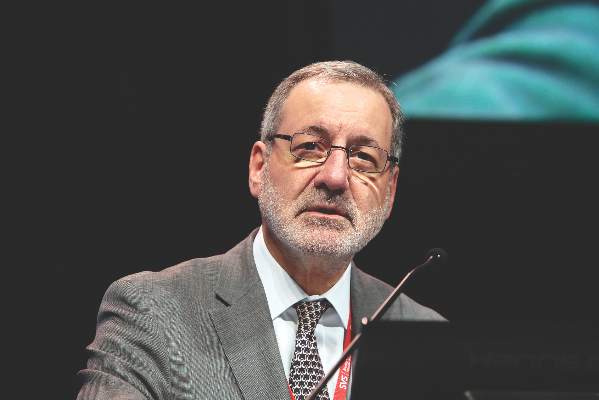
On Wednesday morning, the Society for Vascular Surgery bumped into SVS Past President Dr. Peter Gloviczki. Here’s what we learned about one of our leaders – who is stepping into a new role with the Society – and his participation at VAM this year.
The first thing to note is that he was wearing the very first SVS tie! “It’s the one I designed,” he said.
Dr. Gloviczki is about to start his term, with Dr. Peter Lawrence, as editors-in-chief of the Journal of Vascular Surgery. “We’re very excited,” he said. “We have a new cover and a new format."
The two are expanding the Journal to include much more public media, Dr. Gloviczki said. They have set up a recording studio (National Harbor 1), and after participants give their presentations at VAM, they can record a five-minute video of his or her presentation, Dr. Gloviczki said. When their articles of original research are published, these interviews will be posted online on JVS, SVS and YouTube websites.
As for what he hopes to take from VAM this year: “I’m looking for ideas, for new topics we can include in the Journal. There are differences between European and U.S. colleagues on how to treat vascular disease. I want to learn about that.”
And how many VAMs has he attended? “Almost all of them,” he allowed.

Vandetanib shows variable response, toxicity in RET-positive NSCLC
CHICAGO – The RET tyrosine kinase inhibitor vandetanib shows marked yet variable antitumor activity and toxicity in patients whose RET-positive non–small cell lung cancer (NSCLC) was unsuccessfully treated with chemotherapy, according to results of two small phase II trials presented at the annual meeting of the American Society of Clinical Oncology.
The overall response rates were 53% and 61% in two independent trials conducted by Dr. Takashi Seto of the National Kyushu Cancer Center, Japan, and by Dr. Se-Hoon Lee of Sungkyunkwan University, South Korea, respectively.
Compared to previous studies with other RET inhibitors, though all had small cohorts, there were many similarities in response rates. Progression-free survival was the most variable, but was much higher in the cabozantinib data reported at the 2015 ASCO annual meeting, according to moderator Dr. Karen Reckamp of the City of Hope Comprehensive Cancer Center, Duarte, Calif. “Vandetanib may have lower response rates than some of the others,” she said.
RET is a tyrosine kinase domain that fuses to and undergoes rearrangements with KIF5B and CCDC6 genes. This fusion and subsequent rearrangement results in ligand-dependent dimerization, which causes tumor growth. RET rearrangements were first identified in thyroid cancers.
“RET fusions were identified as new driver oncogenes of NSCLC in 2012 and observed in 1%-2% of all NSCLC,” Dr. Seto said. “Non–small cell lung cancer with RET rearrangement is regarded as a unique entity in terms of pathogenesis,” said Dr. Lee. There are currently multiple RET inhibitors in various stages of development.
In the trial headed by Dr. Seto, the Japanese genetic screening network was utilized to identify 34 NSCLC patients with RET rearrangements. Among the 34 patients, 17 met the eligibility requirements of having failed at least one prior chemotherapy treatment. Of those 17 patients, the median age was 59 years, 74% were female, all had adenocarcinomas, and 68% were nonsmokers.
All 17 patients received vandetanib at a dose of 300 mg once daily. The overall response rate was 53% (90% confidence interval, 31-74), and the disease control rate was 88%. The median progression-free survival was 4.7 months (90% CI, 2.8-8.3).
There was a marked difference in overall response rate and progression-free survival among RET fusion subtypes. For CCDC6-RET, the overall response was 83% and the progression-free survival was 8.3 months. For KIF5B-RET, the overall response was 20% with a median progression-free survival of 2.9 months.
Dr. Seto noted that there was no known biological explanation for the observed discrepancy in response rate or survival.

Dr. Seto reported that the safety profile was similar to previous reports. Four patients ended treatment due to adverse events while 16 experienced dose interruptions due to treatment-related toxicities. The most common grade three and four toxicities were hypertension (58%), rash (16%), and diarrhea (11%).
In the trial headed by Dr. Lee, 18 patients with RET rearrangements (confirmed by fluorescent in situ hybridization) met the eligibility requirement of having failed platinum-based chemotherapy. The median age of the cohort was 55 years, and 33% were female.
Similar to Dr. Seto’s study, all 18 patients received vandetanib at 300 mg once daily. Of the 18 patient cohort, 17% achieved partial remission and 44% achieved stable disease. Seven patients had no remission or stabilization. There were no treatment-related mortalities or grade 4 adverse events. Two grade 3 adverse events were reported.
“Looking at these two studies together, I think the important thing about the characteristics you see [is] that the age range is very similar [with a] median in the 50’s,” commented Dr. Reckamp. “The male to female ratio is actually opposite in both so [this] can occur in both men and women. The smoking status, interestingly is similar in both, where about a third of patients were former smokers. Most of the patients had adenocarcinoma. Many of these patients were highly previously treated. Only the Seto group looked at RET fusion partner, which may be important in looking at efficacy for these agents.” Vandetanib is a “challenging drug to tolerate,” Dr. Reckamp also noted.
“Is there a preferred RET inhibitor in small cell lung cancer?” Dr. Reckamp asked. “There are many RET inhibitors approved for other cancer types at this point, and they are multitargeted tyrosine kinases. In small studies they have similar efficacy. Toxicities vary because of the off-target effects, and most of the [treatment] decisions were made based on potential toxicities rather than differing efficacy. So none is really differentiated as the best choice, and it is unlikely that we are going to have the trials to evaluate them head to head.”
Dr. Reckamp suggested that “most patients with adenocarcinoma” should be tested for RET rearrangements. “Both men and women, both smokers and nonsmokers. And if you don’t test, you won’t find it. And if you don’t find it, you won’t be able to treat.” Dr. Reckamp also noted that next generation sequencing (NGS) should be the preferred method of identifying RET status because NGS uses less tissue, provides genetic sequencing, and allows for the identification of binding partners.
“Does targeting RET improve patient outcomes?” she continued. “Because that is really the question we need to answer if we need to move forward with RET inhibition for lung cancer. So there are variable response rates, less than other inhibitors of other oncogenic-driven tumors, that’s for sure... But if you look at the data, and these are [for] heavily pretreated patients for the most part, the response rates are better than second-line cytotoxic chemotherapy that we have had in the past and similar to unselected checkpoint inhibition. So there is potential for improving outcomes, and again if we don’t know someone is RET, we potentially are not going to offer a treatment that could help them live longer or better.”
When asked how she would treat a newly-diagnosed patient with RET-positive NSCLC, Dr. Reckamp said she would treat with first-line chemotherapy rather than a tyrosine kinase inhibitor (TKI) but would enroll the patient in whatever TKI trial was ongoing at that point in time.
“There are multiple trials that are ongoing,” Dr. Reckamp said. “It is unlikely that a comparison trial will be completed and so we are going to have to look at these trials next to each other and differentiate based on toxicity [and] perceived efficacy.”
Specifically, Dr. Reckamp believes the medical community needs to move toward “universal testing” for RET status in lung cancer patients. Resistance and combination therapies will also need to be assessed in future studies.
“RET is important in lung cancer, and should be targeted. We now need to find the best way to do that,” Dr. Reckamp concluded.
The trial headed by Dr. Seto was funded by the Japan Agency for Medical Research and Development, AMED, and AstraZeneca. Dr. Seto reported receiving honoraria and research funding from multiple companies including AstraZeneca. The trial headed by Dr. Lee was funded by AstraZeneca Korea. Dr. Lee reported having a consulting or advisory role and receiving honoraria and research funding from AstraZeneca, Pfizer, and Roche/Genentech.
CHICAGO – The RET tyrosine kinase inhibitor vandetanib shows marked yet variable antitumor activity and toxicity in patients whose RET-positive non–small cell lung cancer (NSCLC) was unsuccessfully treated with chemotherapy, according to results of two small phase II trials presented at the annual meeting of the American Society of Clinical Oncology.
The overall response rates were 53% and 61% in two independent trials conducted by Dr. Takashi Seto of the National Kyushu Cancer Center, Japan, and by Dr. Se-Hoon Lee of Sungkyunkwan University, South Korea, respectively.
Compared to previous studies with other RET inhibitors, though all had small cohorts, there were many similarities in response rates. Progression-free survival was the most variable, but was much higher in the cabozantinib data reported at the 2015 ASCO annual meeting, according to moderator Dr. Karen Reckamp of the City of Hope Comprehensive Cancer Center, Duarte, Calif. “Vandetanib may have lower response rates than some of the others,” she said.
RET is a tyrosine kinase domain that fuses to and undergoes rearrangements with KIF5B and CCDC6 genes. This fusion and subsequent rearrangement results in ligand-dependent dimerization, which causes tumor growth. RET rearrangements were first identified in thyroid cancers.
“RET fusions were identified as new driver oncogenes of NSCLC in 2012 and observed in 1%-2% of all NSCLC,” Dr. Seto said. “Non–small cell lung cancer with RET rearrangement is regarded as a unique entity in terms of pathogenesis,” said Dr. Lee. There are currently multiple RET inhibitors in various stages of development.
In the trial headed by Dr. Seto, the Japanese genetic screening network was utilized to identify 34 NSCLC patients with RET rearrangements. Among the 34 patients, 17 met the eligibility requirements of having failed at least one prior chemotherapy treatment. Of those 17 patients, the median age was 59 years, 74% were female, all had adenocarcinomas, and 68% were nonsmokers.
All 17 patients received vandetanib at a dose of 300 mg once daily. The overall response rate was 53% (90% confidence interval, 31-74), and the disease control rate was 88%. The median progression-free survival was 4.7 months (90% CI, 2.8-8.3).
There was a marked difference in overall response rate and progression-free survival among RET fusion subtypes. For CCDC6-RET, the overall response was 83% and the progression-free survival was 8.3 months. For KIF5B-RET, the overall response was 20% with a median progression-free survival of 2.9 months.
Dr. Seto noted that there was no known biological explanation for the observed discrepancy in response rate or survival.
Dr. Seto reported that the safety profile was similar to previous reports. Four patients ended treatment due to adverse events while 16 experienced dose interruptions due to treatment-related toxicities. The most common grade three and four toxicities were hypertension (58%), rash (16%), and diarrhea (11%).
In the trial headed by Dr. Lee, 18 patients with RET rearrangements (confirmed by fluorescent in situ hybridization) met the eligibility requirement of having failed platinum-based chemotherapy. The median age of the cohort was 55 years, and 33% were female.
Similar to Dr. Seto’s study, all 18 patients received vandetanib at 300 mg once daily. Of the 18 patient cohort, 17% achieved partial remission and 44% achieved stable disease. Seven patients had no remission or stabilization. There were no treatment-related mortalities or grade 4 adverse events. Two grade 3 adverse events were reported.
“Looking at these two studies together, I think the important thing about the characteristics you see [is] that the age range is very similar [with a] median in the 50’s,” commented Dr. Reckamp. “The male to female ratio is actually opposite in both so [this] can occur in both men and women. The smoking status, interestingly is similar in both, where about a third of patients were former smokers. Most of the patients had adenocarcinoma. Many of these patients were highly previously treated. Only the Seto group looked at RET fusion partner, which may be important in looking at efficacy for these agents.” Vandetanib is a “challenging drug to tolerate,” Dr. Reckamp also noted.
“Is there a preferred RET inhibitor in small cell lung cancer?” Dr. Reckamp asked. “There are many RET inhibitors approved for other cancer types at this point, and they are multitargeted tyrosine kinases. In small studies they have similar efficacy. Toxicities vary because of the off-target effects, and most of the [treatment] decisions were made based on potential toxicities rather than differing efficacy. So none is really differentiated as the best choice, and it is unlikely that we are going to have the trials to evaluate them head to head.”
Dr. Reckamp suggested that “most patients with adenocarcinoma” should be tested for RET rearrangements. “Both men and women, both smokers and nonsmokers. And if you don’t test, you won’t find it. And if you don’t find it, you won’t be able to treat.” Dr. Reckamp also noted that next generation sequencing (NGS) should be the preferred method of identifying RET status because NGS uses less tissue, provides genetic sequencing, and allows for the identification of binding partners.
“Does targeting RET improve patient outcomes?” she continued. “Because that is really the question we need to answer if we need to move forward with RET inhibition for lung cancer. So there are variable response rates, less than other inhibitors of other oncogenic-driven tumors, that’s for sure... But if you look at the data, and these are [for] heavily pretreated patients for the most part, the response rates are better than second-line cytotoxic chemotherapy that we have had in the past and similar to unselected checkpoint inhibition. So there is potential for improving outcomes, and again if we don’t know someone is RET, we potentially are not going to offer a treatment that could help them live longer or better.”
When asked how she would treat a newly-diagnosed patient with RET-positive NSCLC, Dr. Reckamp said she would treat with first-line chemotherapy rather than a tyrosine kinase inhibitor (TKI) but would enroll the patient in whatever TKI trial was ongoing at that point in time.
“There are multiple trials that are ongoing,” Dr. Reckamp said. “It is unlikely that a comparison trial will be completed and so we are going to have to look at these trials next to each other and differentiate based on toxicity [and] perceived efficacy.”
Specifically, Dr. Reckamp believes the medical community needs to move toward “universal testing” for RET status in lung cancer patients. Resistance and combination therapies will also need to be assessed in future studies.
“RET is important in lung cancer, and should be targeted. We now need to find the best way to do that,” Dr. Reckamp concluded.
The trial headed by Dr. Seto was funded by the Japan Agency for Medical Research and Development, AMED, and AstraZeneca. Dr. Seto reported receiving honoraria and research funding from multiple companies including AstraZeneca. The trial headed by Dr. Lee was funded by AstraZeneca Korea. Dr. Lee reported having a consulting or advisory role and receiving honoraria and research funding from AstraZeneca, Pfizer, and Roche/Genentech.
AT THE 2016 ASCO ANNUAL MEETING
Key clinical point: Vandetanib shows marked yet variable anti-tumor activity and toxicity in patients with RET-rearranged NSCLC.
Major finding: The overall response rates were 53% and 61% in two independent trials.
Data source: Two independently-conducted multicenter phase II trials of patients with RET-rearranged non-small cell lung cancer.
Disclosures: The trial headed by Dr. Seto was funded by the Japan Agency for Medical Research and Development, AMED, and AstraZeneca. Dr. Seto reported receiving honoraria and research funding from multiple companies including AstraZeneca. The trial headed by Dr. Lee was funded by AstraZeneca Korea Ltd. Dr. Lee reported having a consulting or advisory role and receiving honoraria and research funding from AstraZeneca, Pfizer, and Roche/Genentech.
We Must Lead on BEST-CLI Trial, Enroll Patients: Dr. Conte
Dr. Michael Conte issued an urgent call Thursday for vascular surgeons to enroll patients in the BEST-CLI Trial, designed to answer this question: What’s the best treatment for advanced critical limb ischemia?
“This is a key opportunity to define optimal care for patients with critical limb-threatening ischemia,” said Dr. Conte to the audience at the E. Stanley Crawford Critical Issues Forum. “Vascular surgeons are the dominant providers, and we must be the leaders.”

Investigators hope to enroll 2,100 patients; to date the trial is at “barely one-third of that enrollment,” he said.
The National Institutes of Health is closely monitoring the trial, officially the “Best Endovascular vs. Best Surgical Therapy in Patients with Critical Limb Ischemia” trial, he said, adding, “and we must execute on this important opportunity.
“Most importantly, the trial will help us define an evidenced-based standard of care. Vascular surgeons must play a leading role in this landmark trial,” he said.
To participate and learn more, visit: www.bestcli.com.
Dr. Michael Conte issued an urgent call Thursday for vascular surgeons to enroll patients in the BEST-CLI Trial, designed to answer this question: What’s the best treatment for advanced critical limb ischemia?
“This is a key opportunity to define optimal care for patients with critical limb-threatening ischemia,” said Dr. Conte to the audience at the E. Stanley Crawford Critical Issues Forum. “Vascular surgeons are the dominant providers, and we must be the leaders.”
Investigators hope to enroll 2,100 patients; to date the trial is at “barely one-third of that enrollment,” he said.
The National Institutes of Health is closely monitoring the trial, officially the “Best Endovascular vs. Best Surgical Therapy in Patients with Critical Limb Ischemia” trial, he said, adding, “and we must execute on this important opportunity.
“Most importantly, the trial will help us define an evidenced-based standard of care. Vascular surgeons must play a leading role in this landmark trial,” he said.
To participate and learn more, visit: www.bestcli.com.
Mogamulizumab achieves objective responses in relapsed/refractory adult T-cell leukemia-lymphoma
CHICAGO – The anti-CCR4 monoclonal antibody mogamulizumab was superior to other investigator-selected therapies for the treatment of patients with relapsed/refractory adult T-cell leukemia-lymphoma (ATL), based on results from 71 patients in a prospective, multicenter, randomized study reported at the annual meeting of the American Society of Clinical Oncology.
Commonly used cytotoxic regimens provided limited therapeutic benefit for these patients, but mogamulizumab resulted in an objective response rate that supports its therapeutic potential in this setting, reported Dr. Adrienne Alise Phillips of New York Presbyterian/Weill Cornell Medical College, New York.

A malignancy of T-cells infected with HTLV-1, ATL has a poor prognosis with a median overall survival of less than 3 months in patients with relapsed/refractory disease. CCR4 is expressed in over 90% of ATL patients, and mogamulizumab is approved in Japan for ATL as well as for peripheral T-cell lymphoma and cutaneous T-cell lymphoma.
The 71 patients in the study were from the United States, the European Union and Latin America. The study is the largest randomized clinical trial of relapsed/refractory adult T-cell leukemia-lymphoma thus far conducted. The patients were randomized in 2:1 fashion 47:24 patients) to mogamulizumab, 1.0 mg/kg, given weekly for the first 4-week cycle and then biweekly, or to one of three investigator choice regimens [gemcitabine and oxaliplatin, DHAP (dexamethasone, high-dose cytarabine, and cisplatin), or pralatrexate]. Patients who were in the investigator-choice arm and whose disease progressed were permitted to cross over to mogamulizumab.
The primary endpoint was objective response rate based on modified Tsukasaki criteria and assessed by the treating investigator and in blinded fashion by independent review.
The objective response rate in the mogamulizumab-treated group was 23.4% (11 of 47) by independent review and 34% (16 of 47) by the treating investigator. In the investigator choice group, the overall response rate was 2 of 24 by independent review and 0 of 24 by the treating investigator.
The confirmed objective response rate after 1 month in the mogamulizumab-treated group was 10.6% by independent review and 14.9% by the treating investigator; there were no confirmed responses in the investigator-choice arm. Of 18 patients who crossed over to mogamulizumab, 3 responded. The median duration of response for mogamulizumab was 5 months; one patient had a complete response that lasted over 9 months and the survival data are not yet mature.
Mogamulizumab had few drug-related adverse events, primarily infusion reactions (46.8%), rash/drug eruption (25.5%) and infections (14.9%).
Dr. Phillips disclosed ties to Celgene, Genentech, and Takeda, as well as research funding from Kyowa Hakko Kirin, the sponsor of the study.
On Twitter @maryjodales
|
| Mary Jo Dales/Frontline Medical News Dr. Sonali M. Smith |
Mogamulizumab was superior to investigator’s choice therapy in the largest prospective randomized trial of this very rare disease. Approximately one-third of patients responded, while the response to investigator’s choice therapies was zero. The potential impact of mogamulizumab on T-cell regulation is intriguing. Could it have applications in other T-cell non-Hodgkin’s lymphomas and cutaneous T-cell lymphomas?
Dr. Sonali M. Smith is with the University of Chicago and was the invited discussant of the study.
|
|
| Mary Jo Dales/Frontline Medical News Dr. Sonali M. Smith |
Mogamulizumab was superior to investigator’s choice therapy in the largest prospective randomized trial of this very rare disease. Approximately one-third of patients responded, while the response to investigator’s choice therapies was zero. The potential impact of mogamulizumab on T-cell regulation is intriguing. Could it have applications in other T-cell non-Hodgkin’s lymphomas and cutaneous T-cell lymphomas?
Dr. Sonali M. Smith is with the University of Chicago and was the invited discussant of the study.
CHICAGO – The anti-CCR4 monoclonal antibody mogamulizumab was superior to other investigator-selected therapies for the treatment of patients with relapsed/refractory adult T-cell leukemia-lymphoma (ATL), based on results from 71 patients in a prospective, multicenter, randomized study reported at the annual meeting of the American Society of Clinical Oncology.
Commonly used cytotoxic regimens provided limited therapeutic benefit for these patients, but mogamulizumab resulted in an objective response rate that supports its therapeutic potential in this setting, reported Dr. Adrienne Alise Phillips of New York Presbyterian/Weill Cornell Medical College, New York.
A malignancy of T-cells infected with HTLV-1, ATL has a poor prognosis with a median overall survival of less than 3 months in patients with relapsed/refractory disease. CCR4 is expressed in over 90% of ATL patients, and mogamulizumab is approved in Japan for ATL as well as for peripheral T-cell lymphoma and cutaneous T-cell lymphoma.
The 71 patients in the study were from the United States, the European Union and Latin America. The study is the largest randomized clinical trial of relapsed/refractory adult T-cell leukemia-lymphoma thus far conducted. The patients were randomized in 2:1 fashion 47:24 patients) to mogamulizumab, 1.0 mg/kg, given weekly for the first 4-week cycle and then biweekly, or to one of three investigator choice regimens [gemcitabine and oxaliplatin, DHAP (dexamethasone, high-dose cytarabine, and cisplatin), or pralatrexate]. Patients who were in the investigator-choice arm and whose disease progressed were permitted to cross over to mogamulizumab.
The primary endpoint was objective response rate based on modified Tsukasaki criteria and assessed by the treating investigator and in blinded fashion by independent review.
The objective response rate in the mogamulizumab-treated group was 23.4% (11 of 47) by independent review and 34% (16 of 47) by the treating investigator. In the investigator choice group, the overall response rate was 2 of 24 by independent review and 0 of 24 by the treating investigator.
The confirmed objective response rate after 1 month in the mogamulizumab-treated group was 10.6% by independent review and 14.9% by the treating investigator; there were no confirmed responses in the investigator-choice arm. Of 18 patients who crossed over to mogamulizumab, 3 responded. The median duration of response for mogamulizumab was 5 months; one patient had a complete response that lasted over 9 months and the survival data are not yet mature.
Mogamulizumab had few drug-related adverse events, primarily infusion reactions (46.8%), rash/drug eruption (25.5%) and infections (14.9%).
Dr. Phillips disclosed ties to Celgene, Genentech, and Takeda, as well as research funding from Kyowa Hakko Kirin, the sponsor of the study.
On Twitter @maryjodales
AT THE 2016 ASCO ANNUAL MEETING
Key clinical point: The anti-CCR4 monoclonal antibody mogamulizumab was superior to other investigator-selected therapies for the treatment of patients with relapsed/refractory adult T-cell leukemia-lymphoma.
Major finding: The confirmed objective response rate after 1 month in the mogamulizumab-treated group was 10.6% by independent review and 14.9% by the treating investigator; there were no confirmed responses in the investigator-choice arm.
Data source: Prospective, multicenter, randomized study of 71 patients from the United States, the European Union, and Latin America.
Disclosures: Dr. Phillips disclosed ties to Celgene, Genentech, and Takeda, as well as research funding from Kyowa Hakko Kirin, the sponsor of the study.
Crawford Forum: Clarifying SFA-Popliteal Treatment Options
“In a follow-up to Peter Lawrence’s Presidential Address last year about appropriateness of care, I have selected the topic ‘In Search of Clarity – SFA-Popliteal Interventions for Claudication,’” said Dr. Ronald Fairman, in his introduction to the 2016 Crawford Critical Issues Forum.
Each year, the Vascular Annual Meeting is highlighted by the Forum, which is moderated and organized by the incoming SVS president. This year, Dr. Fairman, of the University of Pennsylvania Health System, Philadelphia, assembled six speakers from a variety of disciplines to address the treatment of claudication as an area of concern for vascular specialists in an era of changing interventional technology and medical therapies.

Dr. Mary McDermott, of Northwestern University, Chicago, discussed the growing area of exercise training for claudication. She pointed out that numerous studies have demonstrated the value of supervised treadmill exercise, but more recent research is focusing on a more achievable goal of home exercise walking coupled to behavioral counseling and monitoring as an effective method of treatment.
The medical management of claudication was addressed by Dr. Elizabeth Ratchford, of Johns Hopkins University, Baltimore. She pointed out that medical management focuses on the two aspects: Live Longer and Feel Better, with the current focus on the former due primarily to the lack of drugs that can affect the latter.
Dr. Michael S. Conte, of the University of California San Francisco, detailed the variety of interventions available, and addressed current guidelines and best practices. “Vascular surgeons are now the predominant specialty doing peripheral interventions,” said Dr. Conte. “Our guidelines suggest that firstline therapy should be exercise, either supervised or home-based. But importantly, we were the first to suggest that maybe there should be some threshold, such that patients should have a reasonable chance of at least 50% improvement that lasts for at least two years,” for any intervention.
Dr. Peter Schneider, Kaiser Permanente Medical Group, Honolulu, provided the example of the Kaiser Model for using technology. He pointed out that having to make a strong case for using a new technology before it was implemented was a good check on the introduction of new methods into practice.
How to make decisions on treatment in community practice was addressed by Dr. Dennis Gable, of Texas Vascular Associates, Dallas. After detailing the various issues involved, he concluded that there was no great difference between the treatment concerns of private and academic practice, other than the greater opportunity to participate in clinical trials that academia provides.
And finally, Robert M. Zwolak, MD, PhD, Dartmouth-Hitchcock Medical Center, Lebanon, dealt with the always thorny issue of the financial side of treating claudication. He pointed out that the difference between reimbursement to hospitals as compared with office-based practice is complex and can go either way depending on the type of treatment, he pointed out. “Supervised exercise is effective for claudication, but it is not covered by Medicare; percutaneous lower extremity intervention is expensive, but is covered by Medicare,” he said, pointing out the complexity of the issue.
“In a follow-up to Peter Lawrence’s Presidential Address last year about appropriateness of care, I have selected the topic ‘In Search of Clarity – SFA-Popliteal Interventions for Claudication,’” said Dr. Ronald Fairman, in his introduction to the 2016 Crawford Critical Issues Forum.
Each year, the Vascular Annual Meeting is highlighted by the Forum, which is moderated and organized by the incoming SVS president. This year, Dr. Fairman, of the University of Pennsylvania Health System, Philadelphia, assembled six speakers from a variety of disciplines to address the treatment of claudication as an area of concern for vascular specialists in an era of changing interventional technology and medical therapies.
Dr. Mary McDermott, of Northwestern University, Chicago, discussed the growing area of exercise training for claudication. She pointed out that numerous studies have demonstrated the value of supervised treadmill exercise, but more recent research is focusing on a more achievable goal of home exercise walking coupled to behavioral counseling and monitoring as an effective method of treatment.
The medical management of claudication was addressed by Dr. Elizabeth Ratchford, of Johns Hopkins University, Baltimore. She pointed out that medical management focuses on the two aspects: Live Longer and Feel Better, with the current focus on the former due primarily to the lack of drugs that can affect the latter.
Dr. Michael S. Conte, of the University of California San Francisco, detailed the variety of interventions available, and addressed current guidelines and best practices. “Vascular surgeons are now the predominant specialty doing peripheral interventions,” said Dr. Conte. “Our guidelines suggest that firstline therapy should be exercise, either supervised or home-based. But importantly, we were the first to suggest that maybe there should be some threshold, such that patients should have a reasonable chance of at least 50% improvement that lasts for at least two years,” for any intervention.
Dr. Peter Schneider, Kaiser Permanente Medical Group, Honolulu, provided the example of the Kaiser Model for using technology. He pointed out that having to make a strong case for using a new technology before it was implemented was a good check on the introduction of new methods into practice.
How to make decisions on treatment in community practice was addressed by Dr. Dennis Gable, of Texas Vascular Associates, Dallas. After detailing the various issues involved, he concluded that there was no great difference between the treatment concerns of private and academic practice, other than the greater opportunity to participate in clinical trials that academia provides.
And finally, Robert M. Zwolak, MD, PhD, Dartmouth-Hitchcock Medical Center, Lebanon, dealt with the always thorny issue of the financial side of treating claudication. He pointed out that the difference between reimbursement to hospitals as compared with office-based practice is complex and can go either way depending on the type of treatment, he pointed out. “Supervised exercise is effective for claudication, but it is not covered by Medicare; percutaneous lower extremity intervention is expensive, but is covered by Medicare,” he said, pointing out the complexity of the issue.
Preoperative chemotherapy improves survival in patients with large anorectal GIST
LOS ANGELES – The size of anorectal gastrointestinal stroma tumors is the most important determinant of survival following resection, results from an analysis of national data showed.
In addition, preoperative chemotherapy appears to improve survival rate in patients with tumors 5 cm in size or greater.
Anorectal gastrointestinal stromal tumors (GISTs) are rare, making up about 3% of all GIST cases, lead study author Dr. Alexander T. Hawkins reported at the annual meeting of the American Society of Colon and Rectal Surgeons. However, “optimal management remains elusive with questions regarding the role of local excision and the use of preoperative chemotherapy,” said Dr. Hawkins of the section of colon and rectal surgery at Washington University in St. Louis.
In an effort to determine the impact of tumor size, the benefits of using neoadjuvant imatinib, and the impact of a surgical approach, the researchers used the National Cancer Database (NCD) to identify 333 cases of anorectal GIST from 1998 through 2012. The NCD collects data from more than 1,500 cancer centers in the United States, and it’s estimated to account for 70% of all newly diagnosed cases of cancer.

The mean age of patients was 62 years, the median tumor size was 4 cm, 47% had a high-grade tumor, six presented with metastatic disease, and the overall 5-year survival rate was 78%. Of the 333 cases, 163 underwent local excision, 158 underwent radical excision, and 12 had no resection data. Of the radical excision cases, 89 had tumors of 5 cm in size or larger, while 69 had tumors of less than 5 cm in size.
Tumors treated with local resection tended to be smaller, compared with those treated by radical resection (a median of 2.5 cm vs. a median of 6.2 cm, respectively; P less than .001). Bivariate analysis revealed that patients who underwent treatment with local resection had a shorter hospital length of stay (a median of 0 vs. 7 days; P less than .001), but similar rates of 30-day readmission (5.5% vs. 4.4%, P = .65), 30-day mortality (0.6% vs. 1.3%, P = .54) and 90-day mortality (1.2% vs. 2.5%, P = .38). The rates of 5-year survival were higher in the local resection group (80.1% vs. 74.1%, P = .04).
Multivariable survival analysis revealed that advanced age (HR, 2.41) and tumor size greater than 5 cm (HR 2.48; P = .004) were associated with increased mortality. When Dr. Hawkins and his associates evaluated the role of chemotherapy, patients who received preoperative chemotherapy had a 5-year survival of 76.7%, compared with 50.4% in those who did not (P = .04). However, in this same group, chemotherapy did not improve the rate of margin-negative resection (80% vs. 78.6%, P = .88).
Dr. Hawkins also reported that, compared with patients who underwent radical resection, those who underwent local resection had lower rates of preoperative chemotherapy (9.2% vs. 25.3%, respectively; P = .0001) and smaller median tumor size (2.5 cm vs. 6.2 cm, P less than .0001). For tumors smaller than 5 cm in size, there was no difference in 5-year survival by surgical approach (82.3% vs. 82.6%, P = .71).
“Size in the most important determinant of survival after resection of anorectal GIST,” Dr. Hawkins concluded. “For smaller tumors, local excision may be an adequate therapy. Perhaps our most important finding is that preoperative chemotherapy appears to result in improved survival for large tumors treated with radical resection.”
Dr. Hawkins reported having no relevant financial disclosures.
LOS ANGELES – The size of anorectal gastrointestinal stroma tumors is the most important determinant of survival following resection, results from an analysis of national data showed.
In addition, preoperative chemotherapy appears to improve survival rate in patients with tumors 5 cm in size or greater.
Anorectal gastrointestinal stromal tumors (GISTs) are rare, making up about 3% of all GIST cases, lead study author Dr. Alexander T. Hawkins reported at the annual meeting of the American Society of Colon and Rectal Surgeons. However, “optimal management remains elusive with questions regarding the role of local excision and the use of preoperative chemotherapy,” said Dr. Hawkins of the section of colon and rectal surgery at Washington University in St. Louis.
In an effort to determine the impact of tumor size, the benefits of using neoadjuvant imatinib, and the impact of a surgical approach, the researchers used the National Cancer Database (NCD) to identify 333 cases of anorectal GIST from 1998 through 2012. The NCD collects data from more than 1,500 cancer centers in the United States, and it’s estimated to account for 70% of all newly diagnosed cases of cancer.
The mean age of patients was 62 years, the median tumor size was 4 cm, 47% had a high-grade tumor, six presented with metastatic disease, and the overall 5-year survival rate was 78%. Of the 333 cases, 163 underwent local excision, 158 underwent radical excision, and 12 had no resection data. Of the radical excision cases, 89 had tumors of 5 cm in size or larger, while 69 had tumors of less than 5 cm in size.
Tumors treated with local resection tended to be smaller, compared with those treated by radical resection (a median of 2.5 cm vs. a median of 6.2 cm, respectively; P less than .001). Bivariate analysis revealed that patients who underwent treatment with local resection had a shorter hospital length of stay (a median of 0 vs. 7 days; P less than .001), but similar rates of 30-day readmission (5.5% vs. 4.4%, P = .65), 30-day mortality (0.6% vs. 1.3%, P = .54) and 90-day mortality (1.2% vs. 2.5%, P = .38). The rates of 5-year survival were higher in the local resection group (80.1% vs. 74.1%, P = .04).
Multivariable survival analysis revealed that advanced age (HR, 2.41) and tumor size greater than 5 cm (HR 2.48; P = .004) were associated with increased mortality. When Dr. Hawkins and his associates evaluated the role of chemotherapy, patients who received preoperative chemotherapy had a 5-year survival of 76.7%, compared with 50.4% in those who did not (P = .04). However, in this same group, chemotherapy did not improve the rate of margin-negative resection (80% vs. 78.6%, P = .88).
Dr. Hawkins also reported that, compared with patients who underwent radical resection, those who underwent local resection had lower rates of preoperative chemotherapy (9.2% vs. 25.3%, respectively; P = .0001) and smaller median tumor size (2.5 cm vs. 6.2 cm, P less than .0001). For tumors smaller than 5 cm in size, there was no difference in 5-year survival by surgical approach (82.3% vs. 82.6%, P = .71).
“Size in the most important determinant of survival after resection of anorectal GIST,” Dr. Hawkins concluded. “For smaller tumors, local excision may be an adequate therapy. Perhaps our most important finding is that preoperative chemotherapy appears to result in improved survival for large tumors treated with radical resection.”
Dr. Hawkins reported having no relevant financial disclosures.
AT THE ASCRS ANNUAL MEETING
Key clinical point: Anorectal gastrointestinal stroma tumors greater than 5 cm in size were associated with worse survival.
Major finding: Anorectal gastrointestinal stroma tumors greater than 5 cm in size were associated with increased mortality (HR 2.48; P = .004).
Data source: A review of National Cancer Database records to identify 333 cases of anorectal GIST from 1998 through 2012.
Disclosures: Dr. Hawkins reported having no relevant financial disclosures.
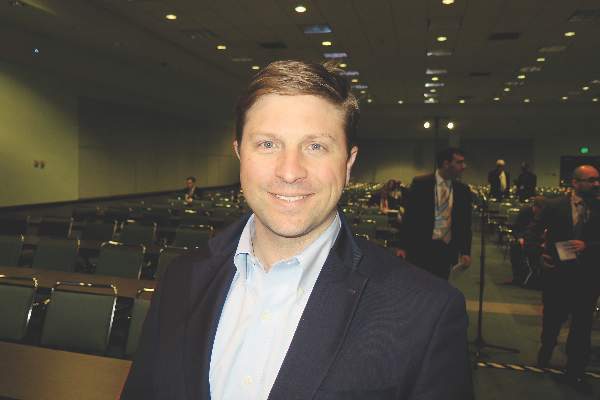
Scenes from the Vascular Annual Meeting
Beyond the Plenary Sessions and scientific abstract presentations, there were many exciting events in which to participate and presentations to attend throughout the Vascular Annual Meeting, including sessions especially planned for residents and students. These photos capture some of the action:

Beyond the Plenary Sessions and scientific abstract presentations, there were many exciting events in which to participate and presentations to attend throughout the Vascular Annual Meeting, including sessions especially planned for residents and students. These photos capture some of the action:
Beyond the Plenary Sessions and scientific abstract presentations, there were many exciting events in which to participate and presentations to attend throughout the Vascular Annual Meeting, including sessions especially planned for residents and students. These photos capture some of the action:
