User login
Retrospective Review of Dual CGRP-Targeted Regimens for Acute and Preventive Treatment of Migraines in a Veteran Population
Retrospective Review of Dual CGRP-Targeted Regimens for Acute and Preventive Treatment of Migraines in a Veteran Population
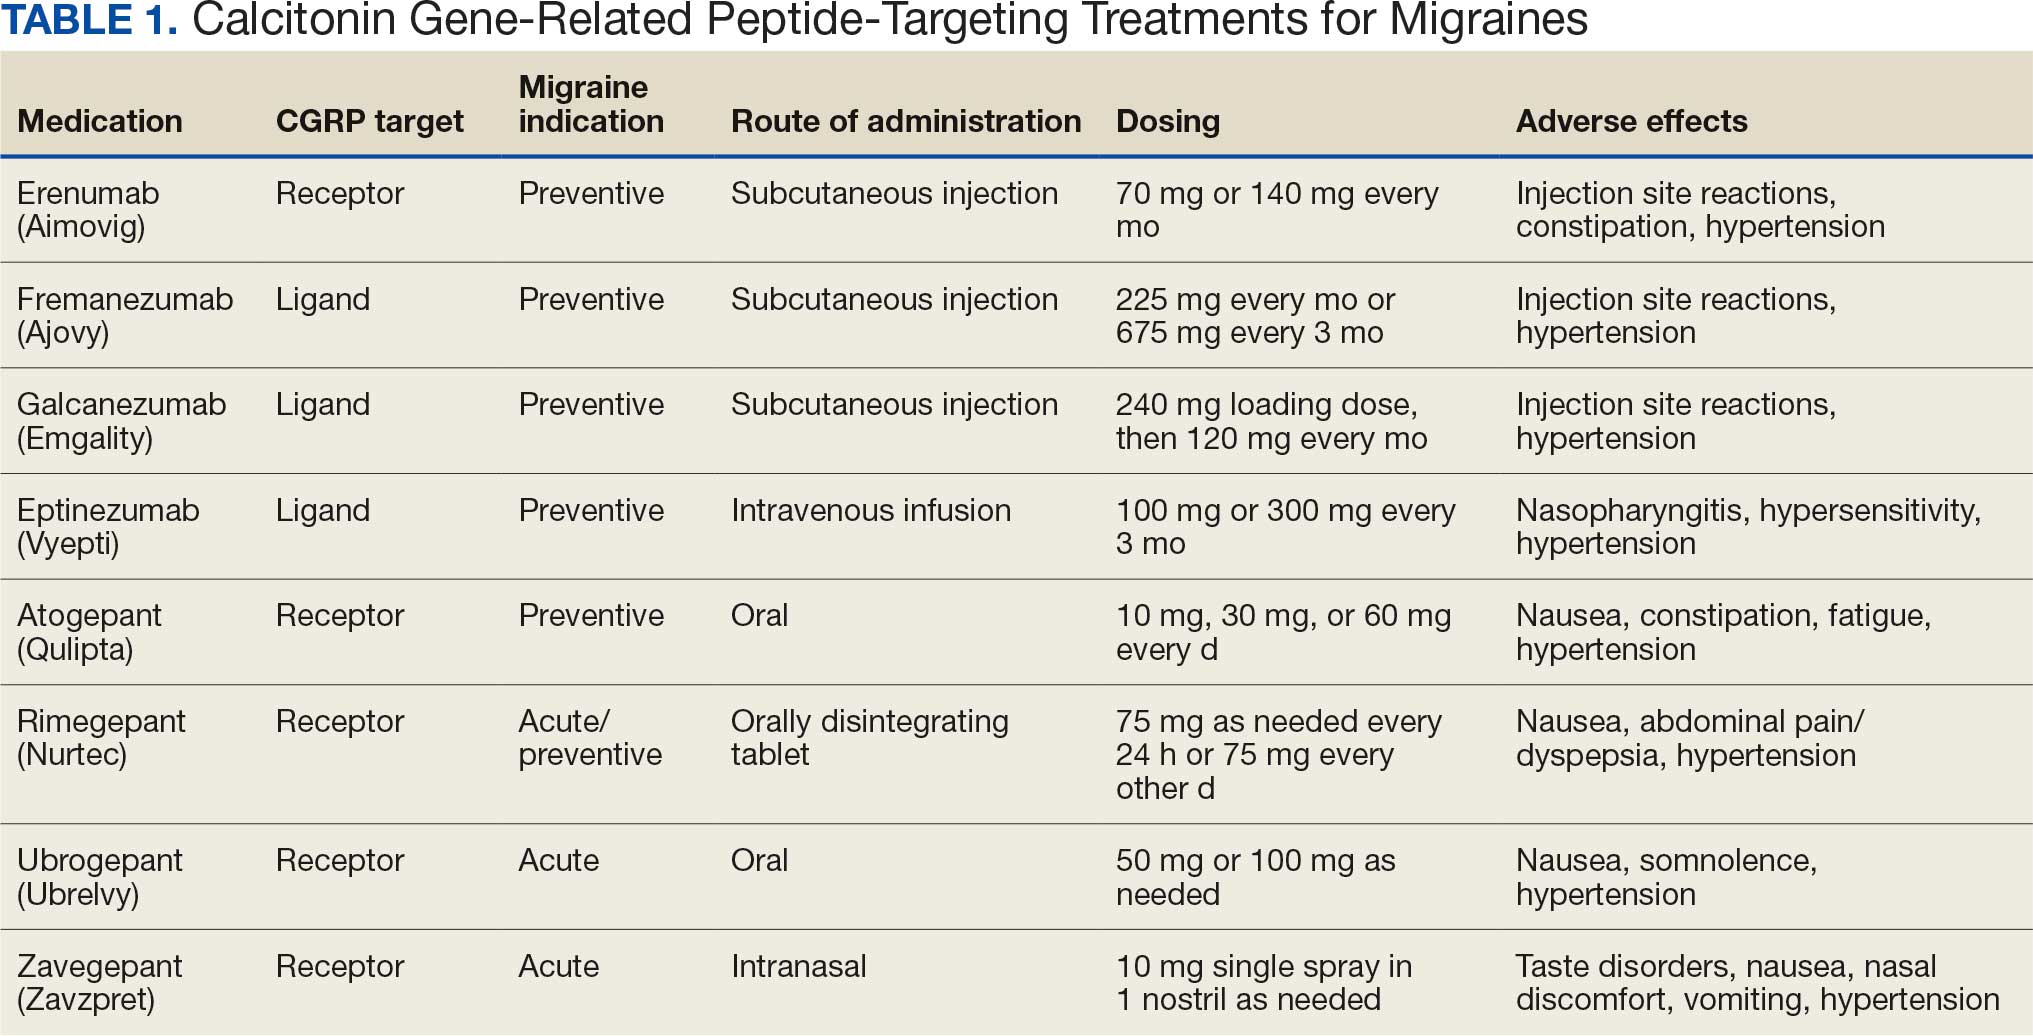
Calcitonin gene-related peptide (CGRP) is a neuropeptide that plays a key role in migraine pathophysiology by promoting the dilation of cerebral blood vessels and transmitting pain signals.1 CGRP has generated interest for the prevention and acute treatment of migraine. Since 2018, 8 novel CGRP-targeting therapies have been approved by the US Food and Drug Administration (FDA) for the management of migraines.2,3 For migraine prevention, there are 4 injectable monoclonal antibodies (mAbs) directed against the CGRP receptor (erenumab) or the CGRP ligand (fremanezumab, galcanezumab, and eptinezumab). There are also 2 oral small-molecule CGRP receptor antagonists, termed gepants, that also are approved for migraine prevention (atogepant and rimegepant). Three gepants are approved for acute migraine treatment and are administered orally (rimegepant and ubrogepant) or intranasally (zavegepant) (Table 1).
CGRP-targeting therapies have received attention for their role in vasodilation within the cerebral, coronary, and renal vasculature.4 CGRP-mediated vasodilatory effects cause systemic regulation of blood pressure (BP) and play a protective role in hypertension.2 Some studies, particularly with erenumab, have shown that the inhibitory role of the agent leads to an increase in BP, as well as gastrointestinal issues such as constipation.2,5 The FDA recently updated monitoring recommendations for all CGRP-targeting therapies to include the potential for BP elevations and hypertension. Outside of this, there is no definitive evidence linking dual CGRP-targeted therapy to higher cardiovascular or gastrointestinal risks and prescribing information does not carry contraindications.6
In a 2021 consensus statement, the American Headache Society (AHS) recommended CGRP-targeting therapies for migraine prevention after inability to tolerate or inadequate response to an 8-week trial of ≥ 2 drug classes including antihypertensives, antiseizure medications, antidepressants, and onabotulinumtoxinA.7 For acute treatment, AHS recommended gepant use after contraindication to or inadequate response to ≥ 2 triptans. Guidance on combination CGRP-targeting therapies for both prevention and acute treatment was not provided.7 More recently, the AHS published a position statement noting substantial efficacy and safety data for CGRP-targeting therapies and suggested its consideration as a first-line option for migraine prevention, though use for acute treatment or combination CGRP-targeting therapies for both prevention and acute treatment were not addressed.8
The International Headache Society guidelines for the acute treatment of migraines recommend nonopioid analgesics as first-line therapy for mild migraine attacks. For moderate to severe attacks, triptans with or without a nonopioid analgesic were recommended as first-line therapy, prior to consideration of CGRP-targeted therapy.9 The increased use of this new drug class has also led to combination use of CGRP-targeting therapies for migraine prevention and acute treatment as seen in clinical practice and reflected by some case reports, case series, and small studies describing such use.10-14 In light of the similar mechanism of action of these therapies and the physiologic role of CGRP, there have been calls for safety evaluation.15
To our knowledge, no studies have evaluated dual CGRP-targeting regimens for migraine in the veteran population. In 2023, the US Department of Veterans Affairs (VA) and US Department of Defense (DoD) updated their clinical practice guidelines for the management of headache.3 For migraine prevention, the VA/DoD guidelines include a strong recommendation for the use of erenumab, fremanezumab, and galcanezumab; a weak recommendation for the use of atogepant; and a recommendation neither for nor against the use of rimegepant. For acute treatment, the guidelines assign a weak recommendation for the use of rimegepant and ubrogepant. Combination use was not addressed.3
Prior to the VA/DoD guidelines, the Veterans Health Administration restricted the dual use of CGRP-targeting therapies for both preventive and acute migraine treatment. However, the VA Pharmacy Benefit Management Service removed the restriction in the Criteria for Use documents, allowing broader access to these medications for veterans.16-22 This change permits the use of CGRP-targeting drugs for both acute and preventive migraine treatment after initial data reflecting real-world case reports and open-label studies suggested possible efficacy without a clear safety concern.11,12 This study aims to fill the gap in the literature by evaluating the safety, efficacy, and overall outcomes of combination CGRP-targeting treatment for migraine prevention and acute treatment in a veteran population.
Methods
This single-center, retrospective, medication use evaluation at the Ralph H. Johnson VA Medical Center (RHJVAMC) was reviewed by the RHJVAMC Research and Development Committee and Quality Improvement Program Evaluation Self Certification Tool, which both determined that institutional review board approval was not required because it was considered part of routine care and quality improvement. Computerized Patient Record System (CPRS) data were reviewed between April 1, 2023 (after the Criteria for Use for CGRP-targeting therapies was updated), through January 31, 2025. Patients were included if they had a confirmed diagnosis of migraine using the International Classification of Headache Disorders, 3rd edition criteria and had concomitant active prescriptions for both a preventive and acute treatment CGRP-targeting agent during the project period.23 Only patients receiving care from the RHJVAMC neurology department were included.
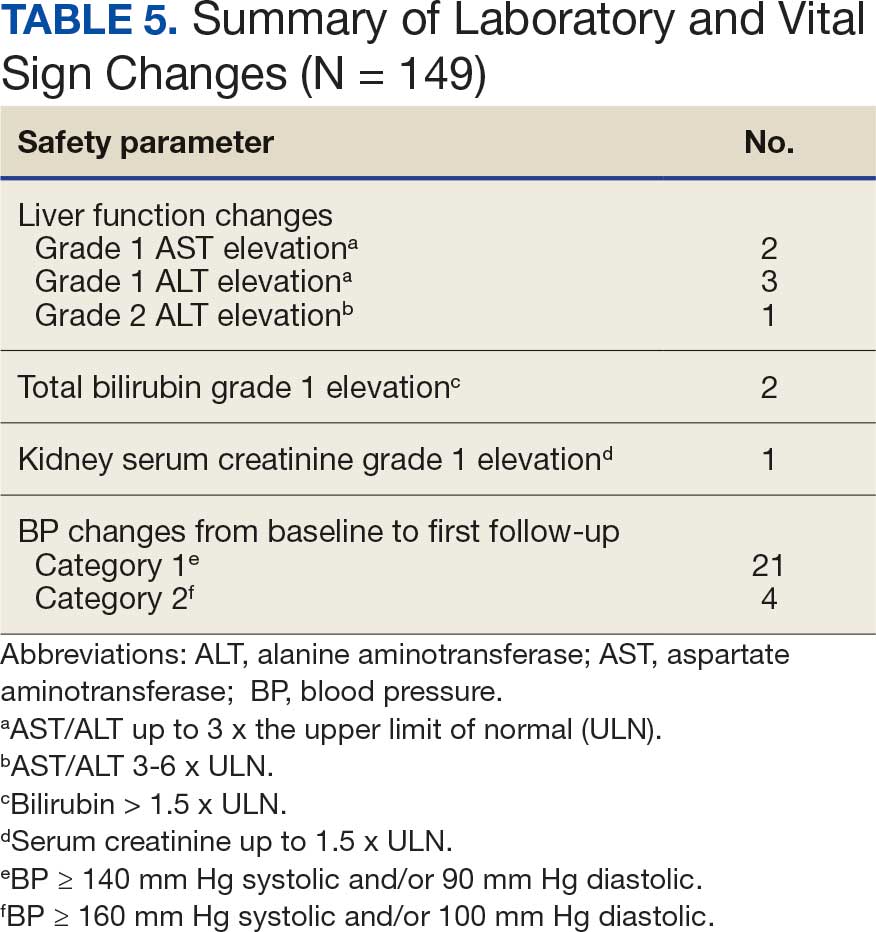
The primary objective was to assess the safety of dual CGRP-targeting therapies for migraine treatment. Key safety endpoints included effects on liver function, kidney function, and BP. Safety outcomes were graded using Common Terminology Criteria for Adverse Events.24 Changes in liver function were categorized as grade 1, 2, or 3 elevations: grade 1 (aspartate aminotransferase [AST]/alanine aminotransferase [ALT] up to 3x the upper limit of normal [ULN] or bilirubin > 1.5 x ULN); grade 2 (AST/ALT 3-6 x ULN or bilirubin 1.5-3 x ULN); and grade 3 (AST/ALT 5-10 x ULN or bilirubin 3-10 x ULN). Kidney function changes were assessed by serum creatinine levels using a similar grading system: Grade 1 (≤ 1.5 x ULN); grade 2 (1.5-3 x baseline of normal); and grade 3 (3-6 x ULN or baseline). Changes in BP were monitored from baseline to the time of the first neurology follow-up. Elevations were grouped into 2 categories, defined as BP ≥ 140 mm Hg systolic and/or 90 mm Hg diastolic (category 1) and ≥ 160 mm Hg systolic and/or 100 mm Hg diastolic (category 2). Neurology documentation was also reviewed in CPRS for individual patient-reported adverse effects (AEs). Safety endpoints were tracked for any occurrence during the project period.
The secondary objective was to describe the patient-reported efficacy of adding a gepant for acute migraine treatment to existing CGRP-targeting therapies for migraine prevention, in those patients who were stable for ≥ 12 weeks on the preventive therapy. Neurology documentation of headache characteristics, including headache severity as rated on a numerical pain score from 0 (no pain) to 10 (worst pain), and duration of headaches (in hours) were recorded during the project period. Changes in headache characteristics were tracked from baseline (ie, the neurology visit when the gepant was first requested) to the first neurology follow-up within 6 months of initiating gepant for acute treatment. If ranges were provided within documentation, a mean was calculated and used for data collection. Neurology documentation was also reviewed for any patient report of overall effectiveness with the added gepant, and categorized as symptoms improved, worsened, or did not change based on subjective report. Descriptive statistics were used for data analysis. A 1-sample Wilcoxon signed rank test was performed as an exploratory analysis for change in headache characteristics from baseline to first neurology follow-up within 6 months. Each individual CGRP regimen was counted as a unique data point to adequately describe changes associated with each new medication and/or dose adjustment. Therefore, patients could be included more than once to account for each distinct treatment regimen.
Results
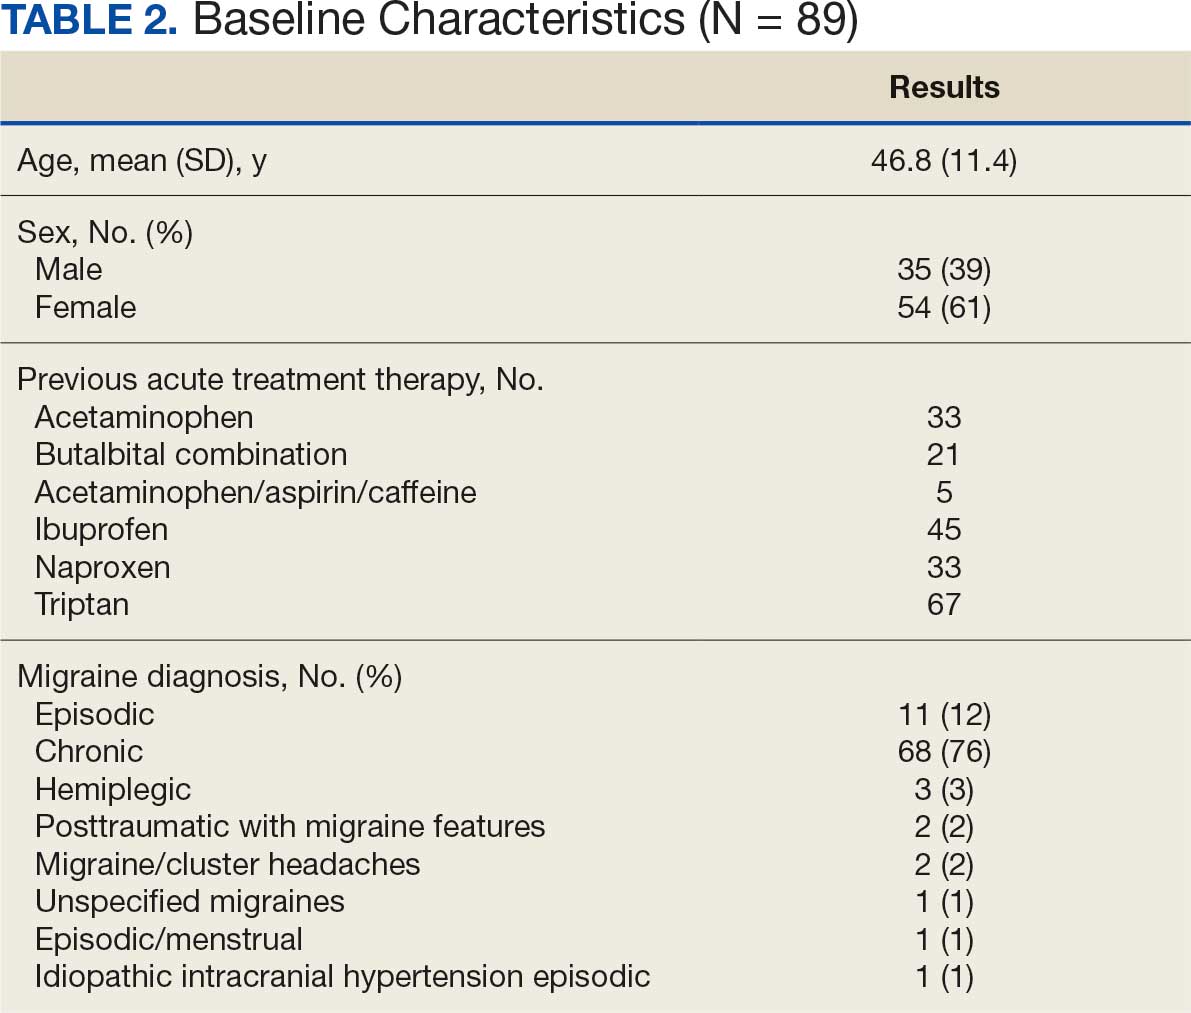
From April 1, 2023, to January 31, 2025, 96 patients were identified with active prescriptions for dual CGRP-targeting therapies. Of the 96 patients, 89 were included in the final analysis; 1 patient lacked a migraine diagnosis and 6 did not have a concomitant dual CGRP-targeted regimen and were excluded. The mean age of patients was 46.8 years and 54 (61%) were female. The most common migraine diagnosis was chronic migraine in 68 patients (76%). Triptans, ibuprofen, and acetaminophen were the most commonly used acute treatment medications (Table 2).
Safety Assessment
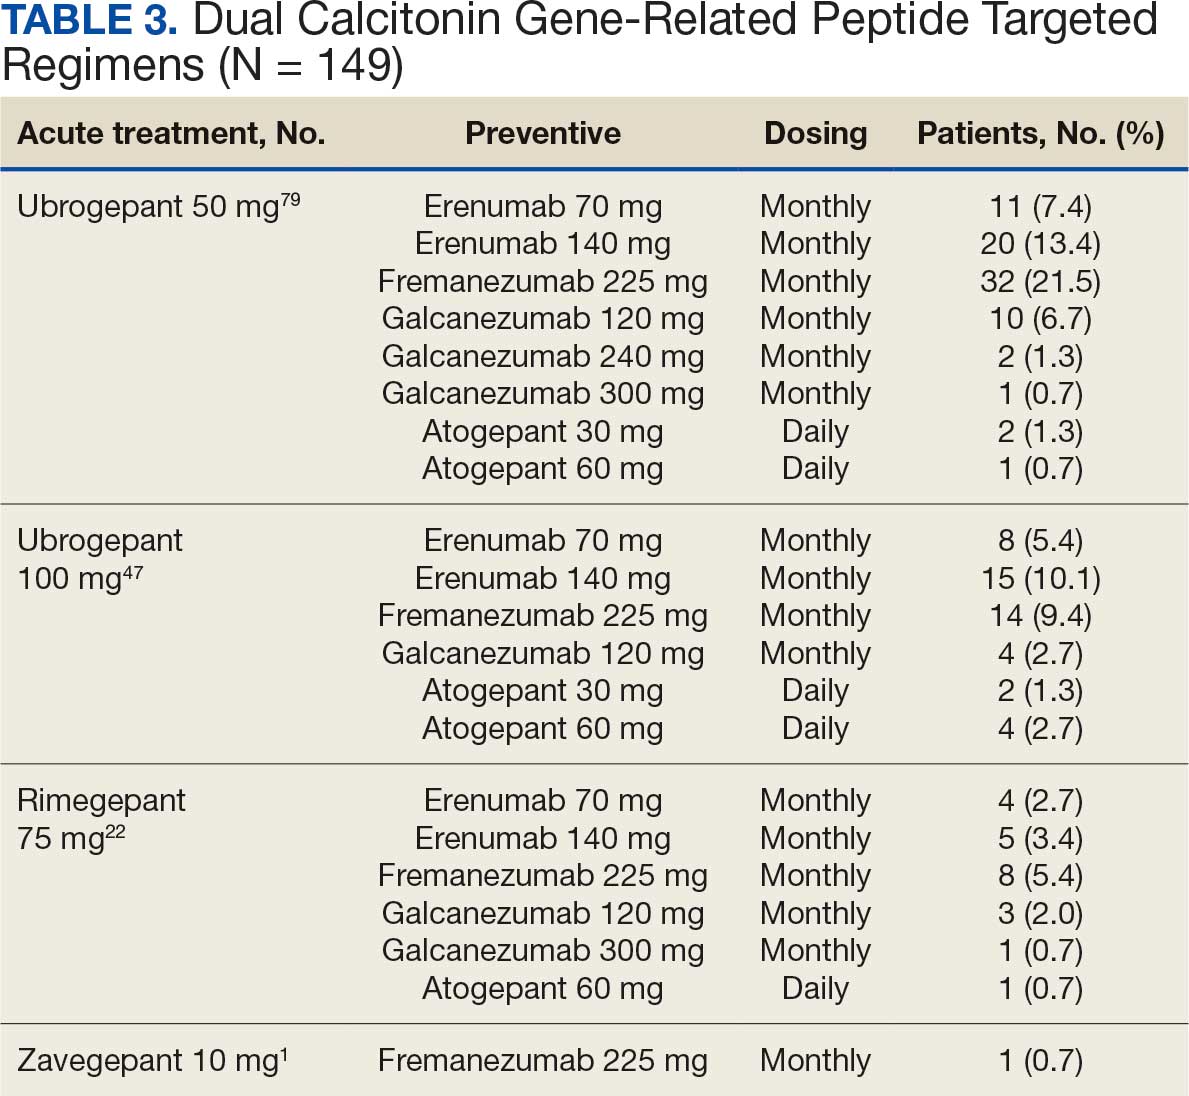
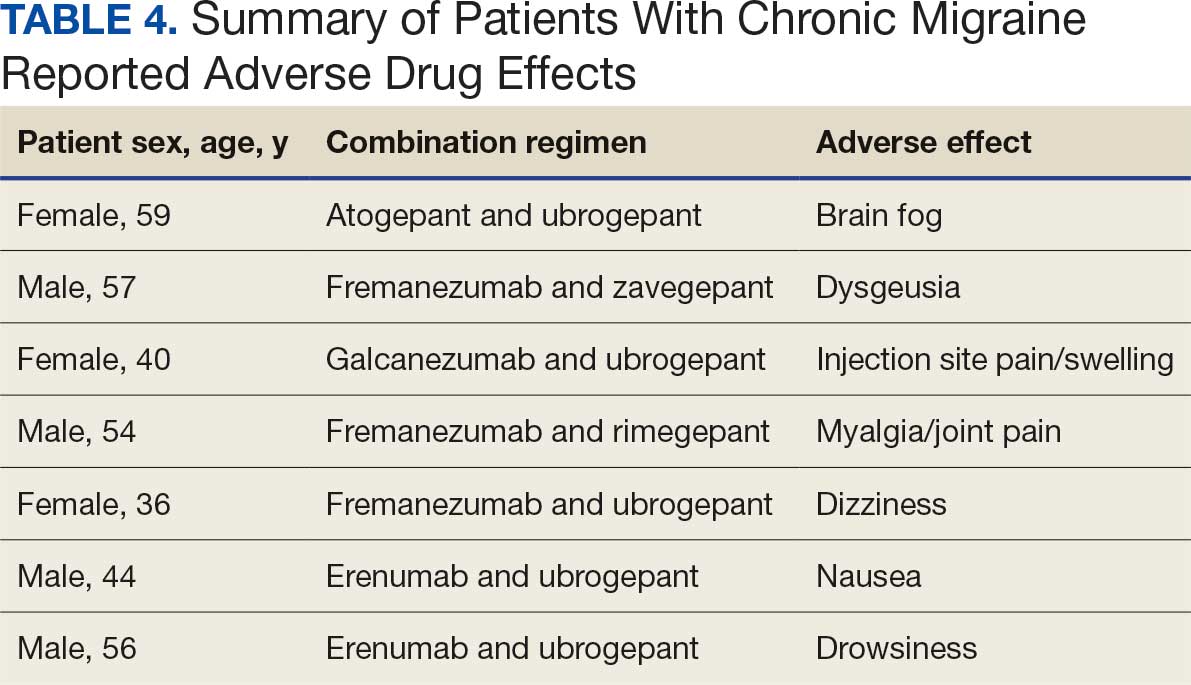
Many of the 89 unique patients trialed > 1 regimen. Thus, for the safety analysis, we analyzed 149 patients on unique dual CGRP-targeting regimens (Table 3). Ubrogepant was used by 126 patients (84.6%) for acute treatment. For preventive therapy, 63 patients (42.3%) used erenumab injections and 55 (36.9%) used fremanezumab injections. Seven patients (4.7%) reported AEs (Table 4). Five of the 7 AEs were noted in the package inserts.25-32 One patient taking both atogepant and ubrogepant reported brain fog that resolved after a dose reduction of atogepant to every other day dosing. A patient taking fremanezumab and rimegepant reported myalgia/joint pain after the first fremanezumab injection, which resolved after a few days and did not recur during the study period.
Nine of 149 patient regimens (6.0%) were associated with changes in liver function tests or serum creatinine, though all but 1 were grade 1 (1 patient had a grade 2 ALT elevation). Twenty-five patients (16.8%) experienced changes in BP, most of which were category 1 elevations. Four patients had systolic or diastolic BP ≥ 160 mm Hg or 100 mm Hg, respectively (Table 5).
Efficacy Assessment
Of the 149 unique dual CGRP regimens, 59 were eligible for the exploratory efficacy analysis. Data were excluded from the efficacy analysis if patients had not been on a stable CGRP preventive migraine regimen for ≥ 12 weeks prior to the addition of a gepant. Fourteen regimens were excluded due to a lack of clear documentation on efficacy, leaving 45 analyzed regimens. Of the 45 regimens, 34 were from unique patients. There was no median change in migraine intensity or duration found in the efficacy analysis (0.0, P = .18, and 0.0, P = .92, respectively). Ten patients on dual CGRP therapy reported that the addition of a gepant for acute treatment improved their symptoms, 20 reported that their symptoms were unchanged and/or worsened, and 29 lacked documentation.
Discussion
This study aimed to describe the safety and efficacy of concomitant CGRP regimens for migraine prevention and acute treatment. To our knowledge, this was the first descriptive study of these agents in a veteran population. The potential for increased AEs with concomitant use of CGRP antagonists is due to the similarities in the mechanism of action between the agents, which both target the same receptor/ligand pathway. Given CGRP activity in both the gastrointestinal and cardiovascular systems, the potential for related AEs is speculative. Patient-reported AEs occurred in 7 of 149 unique treatment regimens reviewed for an incidence rate < 5%. All AEs were nonserious and self-limiting.
Our findings are consistent with available research. A 2024 retrospective, exploratory real-world study evaluating the safety and tolerability of combining CGRP-targeting mAbs with gepants reported findings consistent with our results. This analysis included adult patients treated with ≥ 1 previous anti-CGRP mAb and found that 234 of 516 patients included received a combination of a gepant in addition to a CGRP-targeting mAb. Of these 234 patients, 1.3% reported nonserious AEs.33 Similarly, in a multicenter, open-label, long-term safety study in adults experiencing multiple monthly migraine attacks, a subgroup of 13 participants taking a stable dose of an anti-CGRP mAb also took rimegepant 75 mg as needed for acute treatment for 12 weeks. These patients experienced no serious AEs or any AEs leading to discontinuation.14 A study evaluating the drug-drug interaction, safety, and tolerability of dual therapy (atogepant 60 mg daily and ubrogepant 100 mg every 3 days) in 26 patients found no serious AEs, including no significant changes from baseline in laboratory results, vital signs, or safety-related 12-lead electrocardiogram parameters.15The TANDEM real-world, open-label, prospective study demonstrated similar results. It evaluated the safety and tolerability of concomitant use of ubrogepant and atogepant in patients with episodic migraines and found no increase in AEs when comparing atogepant alone with combination therapy. Twenty-six patients (9.9%) discontinued treatment due to AEs. The most common treatment-related AEs were constipation, nausea, decreased appetite, and fatigue. Efficacy data were also noted to be an exploratory endpoint in the TANDEM study; however, results have not been published.12
Within this safety analysis, new onset gastrointestinal AEs, specifically nausea, only occurred in 1 patient. Hypertension occurred in 25 treatment regimens (16.8%) for 21 unique patients (4 BP elevations occurred in 1 patient on 4 different regimens). However, the retrospective nature of reporting may limit accurate assessment. A closer analysis determined that elevated BP readings correlated with elevated pain scores at the time of the readings, which could have factored into the BP elevations. However, ongoing monitoring is needed due to an increased risk of hypertension, particularly given recent FDA labeling updates for CGRP-targeting therapies including gepants. In light of this, and the overall low incidence of hypertension reported, no new safety concerns were identified.
Limitations
Efficacy data in this project were exploratory. This evaluation did not show a significant difference in migraine intensity or duration after adding a gepant for acute treatment. The study was not powered to detect a significant difference. Limited data exist assessing efficacy outcomes with dual CGRP-targeting treatment regimens. The COURAGE study assessed the real-world effectiveness of ubrogepant and CGRP mAbs with or without the addition of onabotulinumtoxinA. The final analysis of the ubrogepant and CGRP mAb arm included 245 total patients and assessed meaningful migraine pain relief, restoration of normal function after a migraine, and treatment satisfaction. By hour 2, 61.6% of patients reported achieving migraine pain relief, rising to 80.4% by hour 4. Return to normal function occurred in 34.7% at hour 2 and 55.5% by hour 4.13 The long-term safety and efficacy of combining erenumab and rimegepant were described in a case series involving 2 patients. Both patients reported that the concomitant CGRP-targeted therapies were effective and reported no AEs.14
The retrospective design of this study meant that there was potential for limited documentation and introduction of bias into the results. Data were collected at a single VA health care system, and thus, results may not be generalizable to a broader population. However, the study population was consistent with the higher incidence of migraine expected in females in the general population. The sample size was limited, particularly in the exploratory efficacy endpoint assessment.
Limitations were observed due to inconsistent documentation regarding headache characteristics, making it challenging to draw meaningful conclusions from this data set. Additional confounding factors, including polypharmacy, nonadherence to medications, and comorbidities, may have skewed results. For example, while our study design required that the preventive CGRP-targeting medication be stable for 12 weeks for inclusion in further efficacy analysis, other medications commonly used for migraine prevention may have been adjusted (which was not accounted for in this analysis). Given this, more large-scale, placebo-controlled, randomized studies are needed to continue to assess the safety and efficacy of these combination treatment regimens.
Conclusions
Few AEs or safety events were reported with combination CGRP-targeting treatment for acute and preventive treatment of migraine. Those that were identified were considered mild. Efficacy data were limited, and further studies are needed to fully assess outcomes.
- Wattiez AS, Sowers LP, Russo AF. Calcitonin gene-related peptide (CGRP): role in migraine pathophysiology and therapeutic targeting. Expert Opin Ther Targets. 2020;24:91-100. doi:10.1080/14728222.2020.1724285
- Shah T, Bedrin K, Tinsley A. Calcitonin gene relating peptide inhibitors in combination for migraine treatment: a mini-review. Front Pain Res (Lausanne). 2023;4:1130239. doi:10.3389/fpain.2023.1130239
- Department of Veterans Affairs/Department of Defense. VA/DoD clinical practice guideline for management of headache. September 2023. Accessed February 4, 2026. https://www.healthquality.va.gov/guidelines/pain/headache/VA-DoD-CPG-Headache-Full-CPG.pdf
- Russell FA, King R, Smillie SJ, et al. Calcitonin gene-related peptide: physiology and pathophysiology. Physiol Rev. 2014;94:1099-1142. doi:10.1152/physrev.00034.2013
- de Vries Lentsch S, van der Arend BWH, VanDenBrink AM, et al. Blood pressure in patients with migraine treated with monoclonal anti-CGRP (receptor) antibodies: a prospective follow-up study. Neurology. 2022;99:e1897-e1904. doi:10.1212/WNL.0000000000201008
- Favoni V, Giani L, Al-Hassany L, et al. CGRP and migraine from a cardiovascular point of view: what do we expect from blocking CGRP?. J Headache Pain. 2019;20:27. doi:10.1186/s10194-019-0979-y
- Ailani J, Burch RC, Robbins MS, et al. The American Headache Society Consensus Statement: update on integrating new migraine treatments into clinical practice. Headache. 2021;61:1021-1039. doi:10.1111/head.14153
- Charles AC, Digre KB, Goadsby PJ, et al. Calcitonin gene-related peptide-targeting therapies are a first-line option for the prevention of migraine: an American Headache Society position statement update. Headache. 2024;64:333-341. doi:10.1111/head.14692
- Puledda F, Sacco S, Diener HC, et al. International Headache Society global practice recommendations for the acute pharmacological treatment of migraine. Cephalalgia. 2024;44:3331024241252666. doi:10.1177/03331024241252666
- Berman G, Croop R, Kudrow D, et al. Safety of rimegepant, an oral CGRP receptor antagonist, plus CGRP monoclonal antibodies for migraine. Headache. 2020;60:1734-1742. doi:10.1111/head.13930
- Blumenfeld AM, Boinpally R, De Abreu Ferreira R, et al. Phase Ib, open-label, fixed-sequence, drug-drug interaction, safety, and tolerability study between atogepant and ubrogepant in participants with a history of migraine. Headache. 2023;63:322-332. doi:10.1111/head.14433
- Ailani J, Lipton RB, Blumenfeld AM, et al. Safety and tolerability of ubrogepant for the acute treatment of migraine in participants taking atogepant for the preventive treatment of episodic migraine: results from the TANDEM study. Headache. 2025;65:1005-1014. doi:10.1111/head.14871
- Lipton RB, Contreras-De Lama J, Serrano D, et al. Real-world use of ubrogepant as acute treatment for migraine with an anti-calcitonin gene-related peptide monoclonal antibody: results from COURAGE. Neurol Ther. 2024;13:69-83. doi:10.1007/s40120-023-00556-8
- Mullin K, Kudrow D, Croop R, et al. Potential for treatment benefit of small molecule CGRP receptor antagonist plus monoclonal antibody in migraine therapy. Neurology. 2020;94:e2121-e2125. doi:10.1212/WNL.0000000000008944
- Ihara K, Takizawa T, Watanabe N, et al. Potential benefits and possible risks of CGRP-targeted multitherapy in migraine. Expert Opin Drug Metab Toxicol. 2024;20:1-4. doi:10.1080/17425255.2024.2316131
- US Department of Veterans Affairs, Pharmacy Benefits Management Services. Ubrogepant (Ubrelvy) criteria for use. July 2025. Accessed March 4, 2026. https://www.va.gov/formularyadvisor/DOC_PDF/CFU_Ubrogepant_UBRELVY_CFU_Rev_Jul_2025.pdf
- US Department of Veterans Affairs, Pharmacy Benefits Management Services. Rimegepant (Nurtec) for abortive migraine treatment criteria for use. July 2025. Accessed March 4, 2026. https://www.va.gov/formularyadvisor/DOC_PDF/CFU_Rimegepant_NURTEC_for_abortive_migraine_CFU_rev_Jul_2025.pdf
- US Department of Veterans Affairs, Pharmacy Benefits Management Services. Rimegepant (Nurtec) for episodic migraine prevention criteria for use. July 2025. Accessed March 4, 2026. https://www.va.gov/formularyadvisor/DOC_PDF/CFU_Rimegepant_NURTEC_for_episodic_migraine_prevention_CFU_rev_Jul_2025.pdf
- US Department of Veterans Affairs, Pharmacy Benefits Management Services. Erenumab-aooe (Aimovig) for chronic migraine prevention criteria for use. July 2025. Accessed March 4, 2026. https://www.va.gov/formularyadvisor/DOC_PDF/CFU_Erenumab_AIMOVIG_for_chronic_migraine_CFU_rev_Jul_2025.pdf
- US Department of Veterans Affairs, Pharmacy Benefits Management Services. Erenumab-aooe (Aimovig) for episodic migraine prevention criteria for use. July 2025. Accessed March 4, 2026. https://www.va.gov/formularyadvisor/DOC_PDF/CFU_Erenumab_AIMOVIG_for_episodic_migraine_CFU_rev_Jul_2025.pdf
- US Department of Veterans Affairs, Pharmacy Benefits Management Services. Galcanezumab-gnlm (Emgality) for cluster headache criteria for use. July 2025. Accessed March 4, 2026. https://www.va.gov/formularyadvisor/DOC_PDF/CFU_Galcanezumab_EMGALITY_for_cluster_headache_CFU_rev_Jul_2025.pdf
- US Department of Veterans Affairs, Pharmacy Benefits Management Services. Atogepant (Qulipta) for chronic migraine prevention criteria for use. July 2025. Accessed March 4, 2026. https://www.va.gov/formularyadvisor/DOC_PDF/CFU_Atogepant_QULIPTA_for_chronic_migraine_prevention_CFU_rev_Jul_2025.pdf
- Headache Classification Committee of the International Headache Society (IHS) The International Classification of Headache Disorders, 3rd edition. Cephalalgia. 2018;38:1-211. doi:10.1177/0333102417738202
- US Dept of Health and Human Services. Common Terminology Criteria for Adverse Events (CTCAE) version 5.0. November 27, 2017. Accessed March 4, 2026. https://dctd.cancer.gov/research/ctep-trials/for-sites/adverse-events/ctcae-v5-5x7.pdf
- Aimovig (erenumab-aooe) injection prescribing information. Amegen Inc. Updated March 2025. Accessed March 4, 2026. https://www.accessdata.fda.gov/drugsatfda_docs/label/2025/761077s026lbl.pdf
- Ajovy (fremanezumab-vfrm) injection prescribing information. Teva Pharmaceuticals. Updated August 2025. Accessed March 4, 2026. https://www.accessdata.fda.gov/drugsatfda_docs/label/2025/761089s031lbl.pdf
- Vyepti (eptinezumab-jjmr) injection prescribing information. Lundbeck Seattle Biopharmaceuticals. Updated October 2025. Accessed March 4, 2026. https://www.accessdata.fda.gov/drugsatfda_docs/label/2025/761119s011lbl.pdf
- Emgality (galcanezumab-gnlm) injection prescribing information. Eli Lilly and Company. Updated March 2025. Accessed March 4, 2026. https://www.accessdata.fda.gov/drugsatfda_docs/label/2025/761063s010lbl.pdf
- Qulipta (atogepant) tablets prescribing information. AbbVie Inc. Updated September 2025. Accessed March 4, 2026. https://www.accessdata.fda.gov/drugsatfda_docs/label/2025/215206s013lbl.pdf
- Nurtec ODT (rimegepant) orally disintegrating tablets prescribing information. Pfzier Labs. Updated August 2025. Accessed March 4, 2026. https://www.accessdata.fda.gov/drugsatfda_docs/label/2025/212728s028lbl.pdf
- Ubrelvy (Ubrogepant) tablets prescribing information. AbbVie Inc. Updated June 2025. Accessed March 4, 2026. https://www.accessdata.fda.gov/drugsatfda_docs/label/2025/211765s012lbl.pdf
- Zavzpret (zavegepant) intranasal spray prescribing information. Pfzier Labs. Updated August 2025. Accessed March 4, 2026. https://www.accessdata.fda.gov/drugsatfda_docs/label/2025/216386s007lbl.pdf
- Alsaadi T, Suliman R, Santos V, et al. Safety and tolerability of combining CGRP monoclonal antibodies with gepants in patients with migraine: a retrospective study. Neurol Ther. 2024;13:465-473. doi:10.1007/s40120-024-00586-w
Calcitonin gene-related peptide (CGRP) is a neuropeptide that plays a key role in migraine pathophysiology by promoting the dilation of cerebral blood vessels and transmitting pain signals.1 CGRP has generated interest for the prevention and acute treatment of migraine. Since 2018, 8 novel CGRP-targeting therapies have been approved by the US Food and Drug Administration (FDA) for the management of migraines.2,3 For migraine prevention, there are 4 injectable monoclonal antibodies (mAbs) directed against the CGRP receptor (erenumab) or the CGRP ligand (fremanezumab, galcanezumab, and eptinezumab). There are also 2 oral small-molecule CGRP receptor antagonists, termed gepants, that also are approved for migraine prevention (atogepant and rimegepant). Three gepants are approved for acute migraine treatment and are administered orally (rimegepant and ubrogepant) or intranasally (zavegepant) (Table 1).
CGRP-targeting therapies have received attention for their role in vasodilation within the cerebral, coronary, and renal vasculature.4 CGRP-mediated vasodilatory effects cause systemic regulation of blood pressure (BP) and play a protective role in hypertension.2 Some studies, particularly with erenumab, have shown that the inhibitory role of the agent leads to an increase in BP, as well as gastrointestinal issues such as constipation.2,5 The FDA recently updated monitoring recommendations for all CGRP-targeting therapies to include the potential for BP elevations and hypertension. Outside of this, there is no definitive evidence linking dual CGRP-targeted therapy to higher cardiovascular or gastrointestinal risks and prescribing information does not carry contraindications.6
In a 2021 consensus statement, the American Headache Society (AHS) recommended CGRP-targeting therapies for migraine prevention after inability to tolerate or inadequate response to an 8-week trial of ≥ 2 drug classes including antihypertensives, antiseizure medications, antidepressants, and onabotulinumtoxinA.7 For acute treatment, AHS recommended gepant use after contraindication to or inadequate response to ≥ 2 triptans. Guidance on combination CGRP-targeting therapies for both prevention and acute treatment was not provided.7 More recently, the AHS published a position statement noting substantial efficacy and safety data for CGRP-targeting therapies and suggested its consideration as a first-line option for migraine prevention, though use for acute treatment or combination CGRP-targeting therapies for both prevention and acute treatment were not addressed.8
The International Headache Society guidelines for the acute treatment of migraines recommend nonopioid analgesics as first-line therapy for mild migraine attacks. For moderate to severe attacks, triptans with or without a nonopioid analgesic were recommended as first-line therapy, prior to consideration of CGRP-targeted therapy.9 The increased use of this new drug class has also led to combination use of CGRP-targeting therapies for migraine prevention and acute treatment as seen in clinical practice and reflected by some case reports, case series, and small studies describing such use.10-14 In light of the similar mechanism of action of these therapies and the physiologic role of CGRP, there have been calls for safety evaluation.15
To our knowledge, no studies have evaluated dual CGRP-targeting regimens for migraine in the veteran population. In 2023, the US Department of Veterans Affairs (VA) and US Department of Defense (DoD) updated their clinical practice guidelines for the management of headache.3 For migraine prevention, the VA/DoD guidelines include a strong recommendation for the use of erenumab, fremanezumab, and galcanezumab; a weak recommendation for the use of atogepant; and a recommendation neither for nor against the use of rimegepant. For acute treatment, the guidelines assign a weak recommendation for the use of rimegepant and ubrogepant. Combination use was not addressed.3
Prior to the VA/DoD guidelines, the Veterans Health Administration restricted the dual use of CGRP-targeting therapies for both preventive and acute migraine treatment. However, the VA Pharmacy Benefit Management Service removed the restriction in the Criteria for Use documents, allowing broader access to these medications for veterans.16-22 This change permits the use of CGRP-targeting drugs for both acute and preventive migraine treatment after initial data reflecting real-world case reports and open-label studies suggested possible efficacy without a clear safety concern.11,12 This study aims to fill the gap in the literature by evaluating the safety, efficacy, and overall outcomes of combination CGRP-targeting treatment for migraine prevention and acute treatment in a veteran population.
Methods
This single-center, retrospective, medication use evaluation at the Ralph H. Johnson VA Medical Center (RHJVAMC) was reviewed by the RHJVAMC Research and Development Committee and Quality Improvement Program Evaluation Self Certification Tool, which both determined that institutional review board approval was not required because it was considered part of routine care and quality improvement. Computerized Patient Record System (CPRS) data were reviewed between April 1, 2023 (after the Criteria for Use for CGRP-targeting therapies was updated), through January 31, 2025. Patients were included if they had a confirmed diagnosis of migraine using the International Classification of Headache Disorders, 3rd edition criteria and had concomitant active prescriptions for both a preventive and acute treatment CGRP-targeting agent during the project period.23 Only patients receiving care from the RHJVAMC neurology department were included.
The primary objective was to assess the safety of dual CGRP-targeting therapies for migraine treatment. Key safety endpoints included effects on liver function, kidney function, and BP. Safety outcomes were graded using Common Terminology Criteria for Adverse Events.24 Changes in liver function were categorized as grade 1, 2, or 3 elevations: grade 1 (aspartate aminotransferase [AST]/alanine aminotransferase [ALT] up to 3x the upper limit of normal [ULN] or bilirubin > 1.5 x ULN); grade 2 (AST/ALT 3-6 x ULN or bilirubin 1.5-3 x ULN); and grade 3 (AST/ALT 5-10 x ULN or bilirubin 3-10 x ULN). Kidney function changes were assessed by serum creatinine levels using a similar grading system: Grade 1 (≤ 1.5 x ULN); grade 2 (1.5-3 x baseline of normal); and grade 3 (3-6 x ULN or baseline). Changes in BP were monitored from baseline to the time of the first neurology follow-up. Elevations were grouped into 2 categories, defined as BP ≥ 140 mm Hg systolic and/or 90 mm Hg diastolic (category 1) and ≥ 160 mm Hg systolic and/or 100 mm Hg diastolic (category 2). Neurology documentation was also reviewed in CPRS for individual patient-reported adverse effects (AEs). Safety endpoints were tracked for any occurrence during the project period.
The secondary objective was to describe the patient-reported efficacy of adding a gepant for acute migraine treatment to existing CGRP-targeting therapies for migraine prevention, in those patients who were stable for ≥ 12 weeks on the preventive therapy. Neurology documentation of headache characteristics, including headache severity as rated on a numerical pain score from 0 (no pain) to 10 (worst pain), and duration of headaches (in hours) were recorded during the project period. Changes in headache characteristics were tracked from baseline (ie, the neurology visit when the gepant was first requested) to the first neurology follow-up within 6 months of initiating gepant for acute treatment. If ranges were provided within documentation, a mean was calculated and used for data collection. Neurology documentation was also reviewed for any patient report of overall effectiveness with the added gepant, and categorized as symptoms improved, worsened, or did not change based on subjective report. Descriptive statistics were used for data analysis. A 1-sample Wilcoxon signed rank test was performed as an exploratory analysis for change in headache characteristics from baseline to first neurology follow-up within 6 months. Each individual CGRP regimen was counted as a unique data point to adequately describe changes associated with each new medication and/or dose adjustment. Therefore, patients could be included more than once to account for each distinct treatment regimen.
Results
From April 1, 2023, to January 31, 2025, 96 patients were identified with active prescriptions for dual CGRP-targeting therapies. Of the 96 patients, 89 were included in the final analysis; 1 patient lacked a migraine diagnosis and 6 did not have a concomitant dual CGRP-targeted regimen and were excluded. The mean age of patients was 46.8 years and 54 (61%) were female. The most common migraine diagnosis was chronic migraine in 68 patients (76%). Triptans, ibuprofen, and acetaminophen were the most commonly used acute treatment medications (Table 2).
Safety Assessment
Many of the 89 unique patients trialed > 1 regimen. Thus, for the safety analysis, we analyzed 149 patients on unique dual CGRP-targeting regimens (Table 3). Ubrogepant was used by 126 patients (84.6%) for acute treatment. For preventive therapy, 63 patients (42.3%) used erenumab injections and 55 (36.9%) used fremanezumab injections. Seven patients (4.7%) reported AEs (Table 4). Five of the 7 AEs were noted in the package inserts.25-32 One patient taking both atogepant and ubrogepant reported brain fog that resolved after a dose reduction of atogepant to every other day dosing. A patient taking fremanezumab and rimegepant reported myalgia/joint pain after the first fremanezumab injection, which resolved after a few days and did not recur during the study period.
Nine of 149 patient regimens (6.0%) were associated with changes in liver function tests or serum creatinine, though all but 1 were grade 1 (1 patient had a grade 2 ALT elevation). Twenty-five patients (16.8%) experienced changes in BP, most of which were category 1 elevations. Four patients had systolic or diastolic BP ≥ 160 mm Hg or 100 mm Hg, respectively (Table 5).
Efficacy Assessment
Of the 149 unique dual CGRP regimens, 59 were eligible for the exploratory efficacy analysis. Data were excluded from the efficacy analysis if patients had not been on a stable CGRP preventive migraine regimen for ≥ 12 weeks prior to the addition of a gepant. Fourteen regimens were excluded due to a lack of clear documentation on efficacy, leaving 45 analyzed regimens. Of the 45 regimens, 34 were from unique patients. There was no median change in migraine intensity or duration found in the efficacy analysis (0.0, P = .18, and 0.0, P = .92, respectively). Ten patients on dual CGRP therapy reported that the addition of a gepant for acute treatment improved their symptoms, 20 reported that their symptoms were unchanged and/or worsened, and 29 lacked documentation.
Discussion
This study aimed to describe the safety and efficacy of concomitant CGRP regimens for migraine prevention and acute treatment. To our knowledge, this was the first descriptive study of these agents in a veteran population. The potential for increased AEs with concomitant use of CGRP antagonists is due to the similarities in the mechanism of action between the agents, which both target the same receptor/ligand pathway. Given CGRP activity in both the gastrointestinal and cardiovascular systems, the potential for related AEs is speculative. Patient-reported AEs occurred in 7 of 149 unique treatment regimens reviewed for an incidence rate < 5%. All AEs were nonserious and self-limiting.
Our findings are consistent with available research. A 2024 retrospective, exploratory real-world study evaluating the safety and tolerability of combining CGRP-targeting mAbs with gepants reported findings consistent with our results. This analysis included adult patients treated with ≥ 1 previous anti-CGRP mAb and found that 234 of 516 patients included received a combination of a gepant in addition to a CGRP-targeting mAb. Of these 234 patients, 1.3% reported nonserious AEs.33 Similarly, in a multicenter, open-label, long-term safety study in adults experiencing multiple monthly migraine attacks, a subgroup of 13 participants taking a stable dose of an anti-CGRP mAb also took rimegepant 75 mg as needed for acute treatment for 12 weeks. These patients experienced no serious AEs or any AEs leading to discontinuation.14 A study evaluating the drug-drug interaction, safety, and tolerability of dual therapy (atogepant 60 mg daily and ubrogepant 100 mg every 3 days) in 26 patients found no serious AEs, including no significant changes from baseline in laboratory results, vital signs, or safety-related 12-lead electrocardiogram parameters.15The TANDEM real-world, open-label, prospective study demonstrated similar results. It evaluated the safety and tolerability of concomitant use of ubrogepant and atogepant in patients with episodic migraines and found no increase in AEs when comparing atogepant alone with combination therapy. Twenty-six patients (9.9%) discontinued treatment due to AEs. The most common treatment-related AEs were constipation, nausea, decreased appetite, and fatigue. Efficacy data were also noted to be an exploratory endpoint in the TANDEM study; however, results have not been published.12
Within this safety analysis, new onset gastrointestinal AEs, specifically nausea, only occurred in 1 patient. Hypertension occurred in 25 treatment regimens (16.8%) for 21 unique patients (4 BP elevations occurred in 1 patient on 4 different regimens). However, the retrospective nature of reporting may limit accurate assessment. A closer analysis determined that elevated BP readings correlated with elevated pain scores at the time of the readings, which could have factored into the BP elevations. However, ongoing monitoring is needed due to an increased risk of hypertension, particularly given recent FDA labeling updates for CGRP-targeting therapies including gepants. In light of this, and the overall low incidence of hypertension reported, no new safety concerns were identified.
Limitations
Efficacy data in this project were exploratory. This evaluation did not show a significant difference in migraine intensity or duration after adding a gepant for acute treatment. The study was not powered to detect a significant difference. Limited data exist assessing efficacy outcomes with dual CGRP-targeting treatment regimens. The COURAGE study assessed the real-world effectiveness of ubrogepant and CGRP mAbs with or without the addition of onabotulinumtoxinA. The final analysis of the ubrogepant and CGRP mAb arm included 245 total patients and assessed meaningful migraine pain relief, restoration of normal function after a migraine, and treatment satisfaction. By hour 2, 61.6% of patients reported achieving migraine pain relief, rising to 80.4% by hour 4. Return to normal function occurred in 34.7% at hour 2 and 55.5% by hour 4.13 The long-term safety and efficacy of combining erenumab and rimegepant were described in a case series involving 2 patients. Both patients reported that the concomitant CGRP-targeted therapies were effective and reported no AEs.14
The retrospective design of this study meant that there was potential for limited documentation and introduction of bias into the results. Data were collected at a single VA health care system, and thus, results may not be generalizable to a broader population. However, the study population was consistent with the higher incidence of migraine expected in females in the general population. The sample size was limited, particularly in the exploratory efficacy endpoint assessment.
Limitations were observed due to inconsistent documentation regarding headache characteristics, making it challenging to draw meaningful conclusions from this data set. Additional confounding factors, including polypharmacy, nonadherence to medications, and comorbidities, may have skewed results. For example, while our study design required that the preventive CGRP-targeting medication be stable for 12 weeks for inclusion in further efficacy analysis, other medications commonly used for migraine prevention may have been adjusted (which was not accounted for in this analysis). Given this, more large-scale, placebo-controlled, randomized studies are needed to continue to assess the safety and efficacy of these combination treatment regimens.
Conclusions
Few AEs or safety events were reported with combination CGRP-targeting treatment for acute and preventive treatment of migraine. Those that were identified were considered mild. Efficacy data were limited, and further studies are needed to fully assess outcomes.
- Wattiez AS, Sowers LP, Russo AF. Calcitonin gene-related peptide (CGRP): role in migraine pathophysiology and therapeutic targeting. Expert Opin Ther Targets. 2020;24:91-100. doi:10.1080/14728222.2020.1724285
- Shah T, Bedrin K, Tinsley A. Calcitonin gene relating peptide inhibitors in combination for migraine treatment: a mini-review. Front Pain Res (Lausanne). 2023;4:1130239. doi:10.3389/fpain.2023.1130239
- Department of Veterans Affairs/Department of Defense. VA/DoD clinical practice guideline for management of headache. September 2023. Accessed February 4, 2026. https://www.healthquality.va.gov/guidelines/pain/headache/VA-DoD-CPG-Headache-Full-CPG.pdf
- Russell FA, King R, Smillie SJ, et al. Calcitonin gene-related peptide: physiology and pathophysiology. Physiol Rev. 2014;94:1099-1142. doi:10.1152/physrev.00034.2013
- de Vries Lentsch S, van der Arend BWH, VanDenBrink AM, et al. Blood pressure in patients with migraine treated with monoclonal anti-CGRP (receptor) antibodies: a prospective follow-up study. Neurology. 2022;99:e1897-e1904. doi:10.1212/WNL.0000000000201008
- Favoni V, Giani L, Al-Hassany L, et al. CGRP and migraine from a cardiovascular point of view: what do we expect from blocking CGRP?. J Headache Pain. 2019;20:27. doi:10.1186/s10194-019-0979-y
- Ailani J, Burch RC, Robbins MS, et al. The American Headache Society Consensus Statement: update on integrating new migraine treatments into clinical practice. Headache. 2021;61:1021-1039. doi:10.1111/head.14153
- Charles AC, Digre KB, Goadsby PJ, et al. Calcitonin gene-related peptide-targeting therapies are a first-line option for the prevention of migraine: an American Headache Society position statement update. Headache. 2024;64:333-341. doi:10.1111/head.14692
- Puledda F, Sacco S, Diener HC, et al. International Headache Society global practice recommendations for the acute pharmacological treatment of migraine. Cephalalgia. 2024;44:3331024241252666. doi:10.1177/03331024241252666
- Berman G, Croop R, Kudrow D, et al. Safety of rimegepant, an oral CGRP receptor antagonist, plus CGRP monoclonal antibodies for migraine. Headache. 2020;60:1734-1742. doi:10.1111/head.13930
- Blumenfeld AM, Boinpally R, De Abreu Ferreira R, et al. Phase Ib, open-label, fixed-sequence, drug-drug interaction, safety, and tolerability study between atogepant and ubrogepant in participants with a history of migraine. Headache. 2023;63:322-332. doi:10.1111/head.14433
- Ailani J, Lipton RB, Blumenfeld AM, et al. Safety and tolerability of ubrogepant for the acute treatment of migraine in participants taking atogepant for the preventive treatment of episodic migraine: results from the TANDEM study. Headache. 2025;65:1005-1014. doi:10.1111/head.14871
- Lipton RB, Contreras-De Lama J, Serrano D, et al. Real-world use of ubrogepant as acute treatment for migraine with an anti-calcitonin gene-related peptide monoclonal antibody: results from COURAGE. Neurol Ther. 2024;13:69-83. doi:10.1007/s40120-023-00556-8
- Mullin K, Kudrow D, Croop R, et al. Potential for treatment benefit of small molecule CGRP receptor antagonist plus monoclonal antibody in migraine therapy. Neurology. 2020;94:e2121-e2125. doi:10.1212/WNL.0000000000008944
- Ihara K, Takizawa T, Watanabe N, et al. Potential benefits and possible risks of CGRP-targeted multitherapy in migraine. Expert Opin Drug Metab Toxicol. 2024;20:1-4. doi:10.1080/17425255.2024.2316131
- US Department of Veterans Affairs, Pharmacy Benefits Management Services. Ubrogepant (Ubrelvy) criteria for use. July 2025. Accessed March 4, 2026. https://www.va.gov/formularyadvisor/DOC_PDF/CFU_Ubrogepant_UBRELVY_CFU_Rev_Jul_2025.pdf
- US Department of Veterans Affairs, Pharmacy Benefits Management Services. Rimegepant (Nurtec) for abortive migraine treatment criteria for use. July 2025. Accessed March 4, 2026. https://www.va.gov/formularyadvisor/DOC_PDF/CFU_Rimegepant_NURTEC_for_abortive_migraine_CFU_rev_Jul_2025.pdf
- US Department of Veterans Affairs, Pharmacy Benefits Management Services. Rimegepant (Nurtec) for episodic migraine prevention criteria for use. July 2025. Accessed March 4, 2026. https://www.va.gov/formularyadvisor/DOC_PDF/CFU_Rimegepant_NURTEC_for_episodic_migraine_prevention_CFU_rev_Jul_2025.pdf
- US Department of Veterans Affairs, Pharmacy Benefits Management Services. Erenumab-aooe (Aimovig) for chronic migraine prevention criteria for use. July 2025. Accessed March 4, 2026. https://www.va.gov/formularyadvisor/DOC_PDF/CFU_Erenumab_AIMOVIG_for_chronic_migraine_CFU_rev_Jul_2025.pdf
- US Department of Veterans Affairs, Pharmacy Benefits Management Services. Erenumab-aooe (Aimovig) for episodic migraine prevention criteria for use. July 2025. Accessed March 4, 2026. https://www.va.gov/formularyadvisor/DOC_PDF/CFU_Erenumab_AIMOVIG_for_episodic_migraine_CFU_rev_Jul_2025.pdf
- US Department of Veterans Affairs, Pharmacy Benefits Management Services. Galcanezumab-gnlm (Emgality) for cluster headache criteria for use. July 2025. Accessed March 4, 2026. https://www.va.gov/formularyadvisor/DOC_PDF/CFU_Galcanezumab_EMGALITY_for_cluster_headache_CFU_rev_Jul_2025.pdf
- US Department of Veterans Affairs, Pharmacy Benefits Management Services. Atogepant (Qulipta) for chronic migraine prevention criteria for use. July 2025. Accessed March 4, 2026. https://www.va.gov/formularyadvisor/DOC_PDF/CFU_Atogepant_QULIPTA_for_chronic_migraine_prevention_CFU_rev_Jul_2025.pdf
- Headache Classification Committee of the International Headache Society (IHS) The International Classification of Headache Disorders, 3rd edition. Cephalalgia. 2018;38:1-211. doi:10.1177/0333102417738202
- US Dept of Health and Human Services. Common Terminology Criteria for Adverse Events (CTCAE) version 5.0. November 27, 2017. Accessed March 4, 2026. https://dctd.cancer.gov/research/ctep-trials/for-sites/adverse-events/ctcae-v5-5x7.pdf
- Aimovig (erenumab-aooe) injection prescribing information. Amegen Inc. Updated March 2025. Accessed March 4, 2026. https://www.accessdata.fda.gov/drugsatfda_docs/label/2025/761077s026lbl.pdf
- Ajovy (fremanezumab-vfrm) injection prescribing information. Teva Pharmaceuticals. Updated August 2025. Accessed March 4, 2026. https://www.accessdata.fda.gov/drugsatfda_docs/label/2025/761089s031lbl.pdf
- Vyepti (eptinezumab-jjmr) injection prescribing information. Lundbeck Seattle Biopharmaceuticals. Updated October 2025. Accessed March 4, 2026. https://www.accessdata.fda.gov/drugsatfda_docs/label/2025/761119s011lbl.pdf
- Emgality (galcanezumab-gnlm) injection prescribing information. Eli Lilly and Company. Updated March 2025. Accessed March 4, 2026. https://www.accessdata.fda.gov/drugsatfda_docs/label/2025/761063s010lbl.pdf
- Qulipta (atogepant) tablets prescribing information. AbbVie Inc. Updated September 2025. Accessed March 4, 2026. https://www.accessdata.fda.gov/drugsatfda_docs/label/2025/215206s013lbl.pdf
- Nurtec ODT (rimegepant) orally disintegrating tablets prescribing information. Pfzier Labs. Updated August 2025. Accessed March 4, 2026. https://www.accessdata.fda.gov/drugsatfda_docs/label/2025/212728s028lbl.pdf
- Ubrelvy (Ubrogepant) tablets prescribing information. AbbVie Inc. Updated June 2025. Accessed March 4, 2026. https://www.accessdata.fda.gov/drugsatfda_docs/label/2025/211765s012lbl.pdf
- Zavzpret (zavegepant) intranasal spray prescribing information. Pfzier Labs. Updated August 2025. Accessed March 4, 2026. https://www.accessdata.fda.gov/drugsatfda_docs/label/2025/216386s007lbl.pdf
- Alsaadi T, Suliman R, Santos V, et al. Safety and tolerability of combining CGRP monoclonal antibodies with gepants in patients with migraine: a retrospective study. Neurol Ther. 2024;13:465-473. doi:10.1007/s40120-024-00586-w
Retrospective Review of Dual CGRP-Targeted Regimens for Acute and Preventive Treatment of Migraines in a Veteran Population
Retrospective Review of Dual CGRP-Targeted Regimens for Acute and Preventive Treatment of Migraines in a Veteran Population

Heart Failure Diagnostic Alerts to Prompt Pharmacist Evaluation and Medication Optimization
Heart Failure Diagnostic Alerts to Prompt Pharmacist Evaluation and Medication Optimization
Heart failure (HF) is a prevalent disease in the United States affecting > 6.5 million adults and contributing to significant morbidity and mortality.1 The disease course associated with HF includes potential symptom improvement with intermittent periods of decompensation and possible clinical deterioration. Multiple therapies have been developed to improve outcomes in people with HF—to palliate HF symptoms, prevent hospitalizations, and reduce mortality.2 However, the risks of decompensation and hospitalization remain. HF decompensation development may precede clear actionable symptoms such as worsening dyspnea, noticeable edema, or weight gain. Tools to identify patient deterioration and trigger interventions to prevent HF admissions are clinically attractive compared with reliance on subjective factors alone.
Cardiac resynchronization therapy (CRT) and implantable cardioverter-defibrillator (ICD) devices made by Boston Scientific include the HeartLogic monitoring feature. Five main sensors produce an index risk score; an index score > 16 warns clinicians that the patient is at an increased risk for a HF event.3 The 5 sensors are thoracic impedance, first (S1) and third heart sounds (S3), night heart rate (NHR), respiratory rate (RR), and activity. Each sensor can draw attention to the primary driver of the alert and guide health care practitioners (HCPs) to the appropriate interventions.3 A HeartLogic alert example is shown in Figure 1.
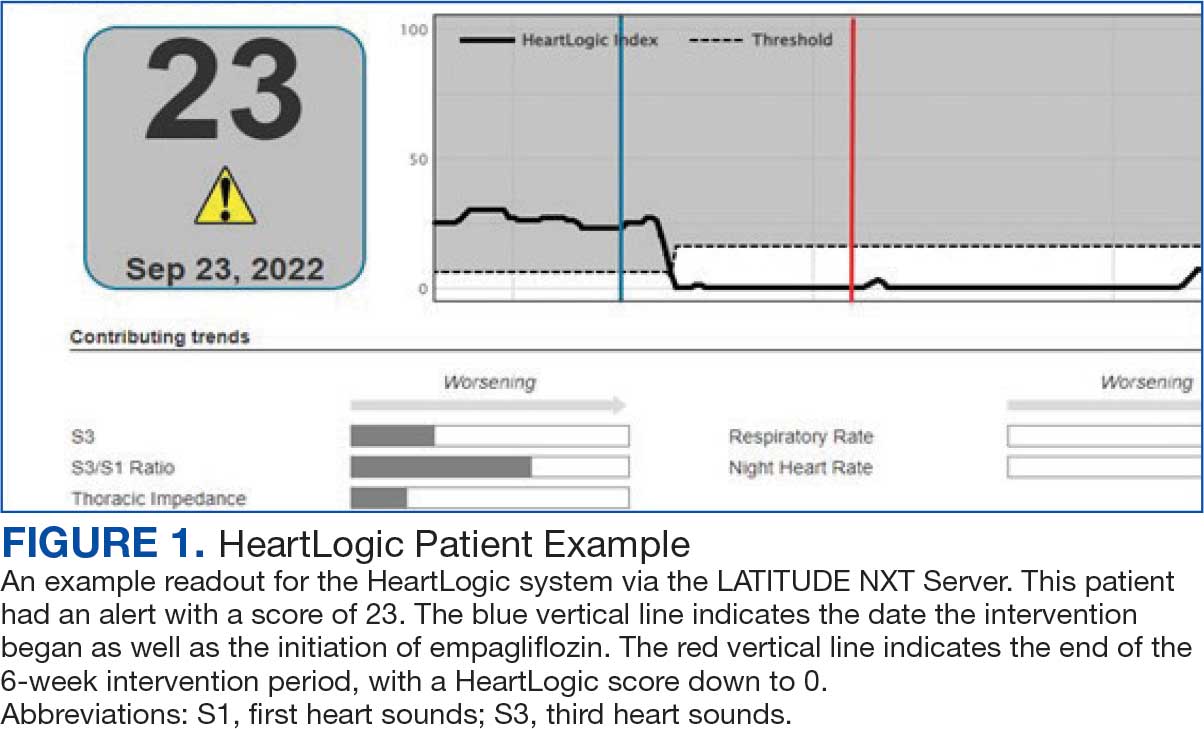
The S3 occurs during the early diastolic phase when blood moves into the ventricles. As HF worsens, with a combination of elevated filling pressures and reduced cardiac muscle compliance, S3 can become more pronounced.4 The S1 is correlated with the contractility of the left ventricle and will be reduced in patients at risk for HF events.5 Physical activity is a long-term prognostic marker in patients with HF; reduced activity is associated with mortality and increased risk of an HF event.6 Thoracic impedance is a sensor used to identify pulmonary congestion, pocket infections, pleural/pericardial effusion, and respiratory infections. The accumulation of intrathoracic fluid during pulmonary congestion increases conductance, causing a decrease in impedance.7 RR will increase as patients experience dyspnea with a more rapid, shallow breath and may trigger alerts closer to the actual HF event than other sensors. Nearly 90% of patients hospitalized for HF experience shortness of breath.8,9 NHR is used as a surrogate for resting heart rate (HR). A high resting HR is correlated with the progression of coronary atherosclerosis, harmful effects on left ventricular function, and increased risk of myocardial ischemia and ventricular arrhythmias.10
One of the challenges with preventing hospitalizations may be the lack of patient reported symptoms leading up to the event. The purpose of the sensors and HeartLogic index is to identify patients a median of 34 days before an HF event (HF admission or unscheduled intervention with intravenous treatment) with a sensitivity rate of 70%.3 According to real-word experience data, alerts have been found to precede HF symptoms by a median of 12 days and HF events such as hospitalizations by a median of 38 days, with an overall 67% reduction in HF hospitalizations when integrated into clinical care.11,12
MANAGE-HF evaluated 191 patients with HF with reduced ejection fraction (HFrEF) (< 35%), New York Heart Association class II-III symptoms, and who had an implanted CRT and/or ICD to develop an alert management guide to optimize medical treatment.12 It aimed to adjust patient regimen within 6 days of an elevated Heart- Logic index by either initiation, escalation, or maintenance of HF treatment depending on the index trend after the initial alert. This trial found that by focusing on such optimization, HF treatment was augmented during 74% of the 585 alert cases and during 54% of 3290 weekly alerts.
Initiation and uptitration of the 4 primary components of guideline-directed medical therapy (GDMT) are recommended by the 2022 Heart Failure Guidelines to reduce mortality and morbidity in patients with HFrEF.2 The 4 pillars of GDMT consist of -blockers (BB), sodium-glucose cotransporter type 2 inhibitors (SGLT2i), mineralocorticoid receptor antagonists (MRA), and renin-angiotensin-system inhibitors (RASi) including angiotensin II receptor blocker/neprilysin inhibitors (ARNi), angiotensin-converting enzyme inhibitors (ACEi) and angiotensin II receptor blockers (ARB) (Appendix 1). Obtaining and titrating to target doses wherever possible is recommended, as those were the doses that established safety and efficacy in patients with HFrEF in clinical trials.2 Pharmacists are adequately equipped to optimize HF GDMT and appropriately monitor drug response.
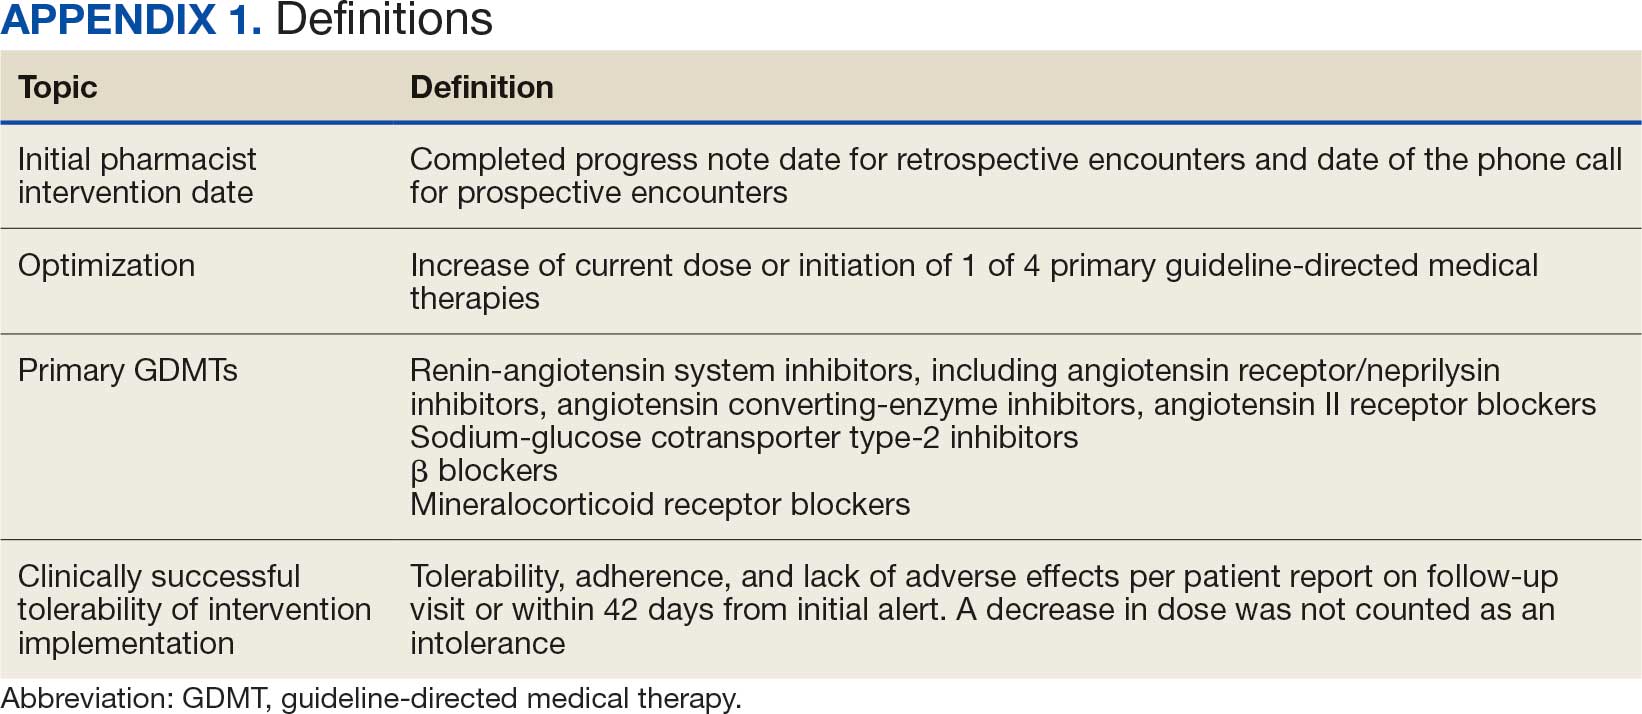
Through the use of HeartLogic in clinical practice, patients with HF have been shown to have improved clinical outcomes and are more likely to receive effective care; 80% of alerts were shown to provide new information to clinicians.13 This project sought to quantify the total number and types of pharmacist interventions driven by integration of HeartLogic index monitoring into practice.
Methods
The West Palm Beach Veterans Affairs Medical Center (WPBVAMC) Research Program Office approved this project and determined it was exempt from institutional review board oversight. Patients were screened retrospectively and prospectively from May 26, 2022, through December 31, 2022, by a cardiology clinical pharmacist practitioner (CPP) and a cardiology pharmacy resident using the local monitoring suite for the HeartLogic-compatible device, LATITUDE NXT. Read-only access to the local monitoring suit was granted by the National Cardiac Device Surveillance Program. Training for HeartLogic was completed through continuing education courses provided by Boston Scientific. Additional information was provided by Boston Scientific representative presentations and collaboration with WPBVAMC pacemaker clinic HCPs.
Individuals included were patients with HeartLogic-capable ICDs. A HeartLogic alert had to be present at initial patient contact. Patients were also contacted as part of routine clinical practice, but no formal number or frequency of calls to patients was required. The initial contact must be with a pharmacist for the patient to be included, but subsequent contact by other HCPs was included. Patients in the cardiology clinic are required to meet with a cardiologist at least annually; however, interim visits can be completed by advanced practice registered nurse practitioners, physicians assistants, or CPPs.
Patients in alert status were contacted by telephone and appropriate modifications of HF therapy were made by the CPP based on score metrics, medical record review, and patient interview. Information surrounding the initial alert, baseline patient data, medication and monitoring interventions made, and clinical outcomes such as hospitalization, symptom improvement, follow-up, and mortality were collected. Information for each encounter was collected until 42 days from the initial date of pharmacist contact.
Clinically successful tolerability of intervention implementation was defined as tolerability, adherence, and lack of adverse effects (AEs) per patient report at follow-up or within 42 days from initial alert (Appendix 2). A decrease in dose was not counted as intolerance. A single patient may have been counted as multiple encounters if the original intervention resulted in treatment intolerance and the patient remained in alert or if an additional alert occurred after 42 days of the initial alert. There were no specific time criteria for follow-up, which occurred at the CPP’s discretion.
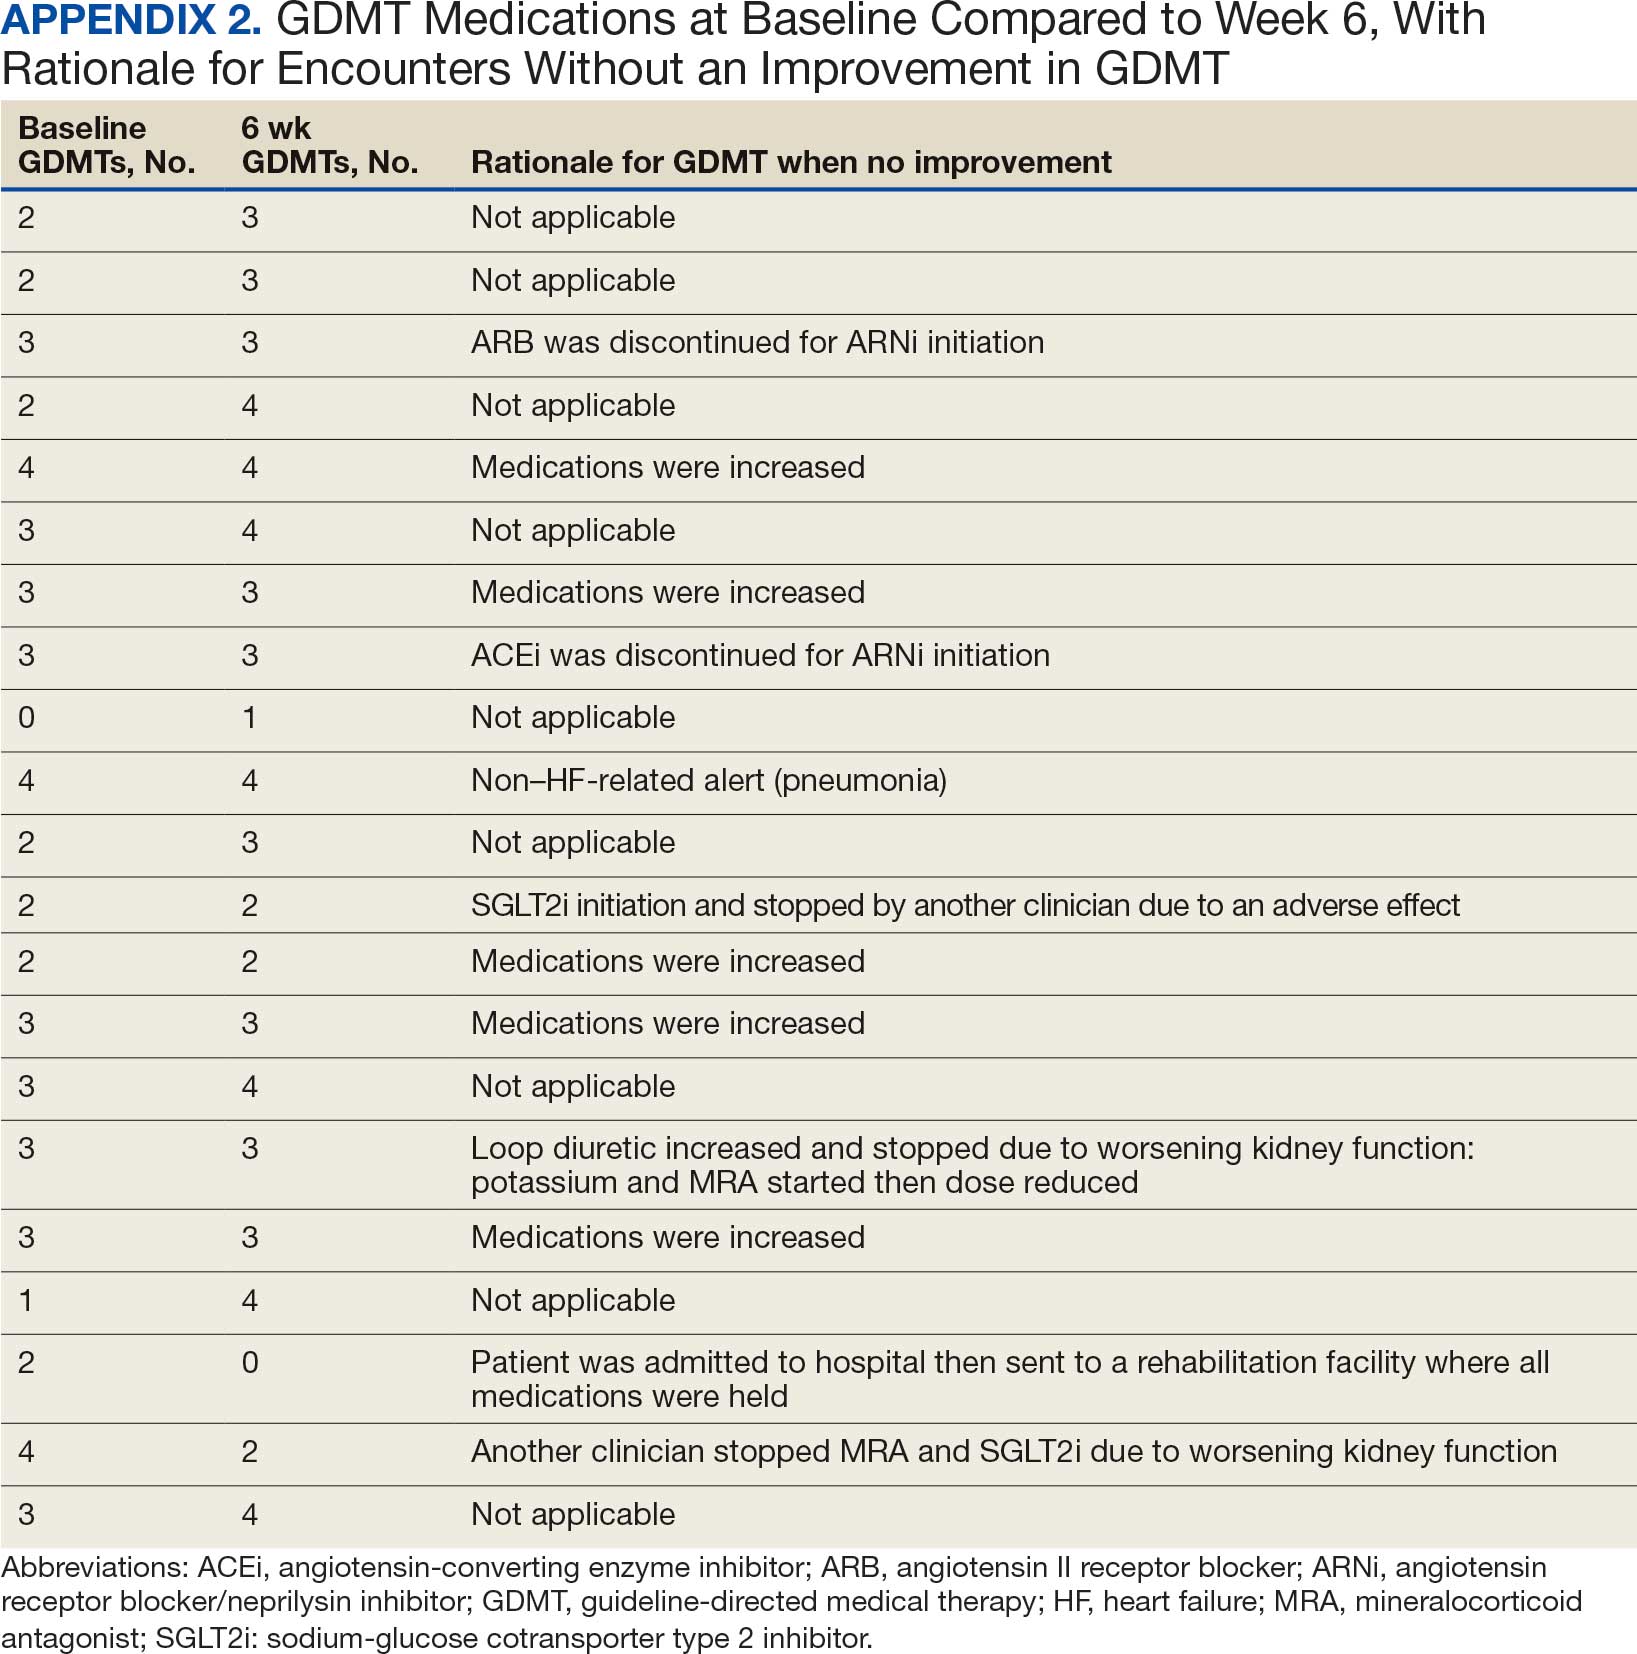
There was no mandated algorithm used to alter medications based on the Heart- Logic score, nor were there required minimum or maximum numbers of interventions after an alert. Patient contact by telephone initiated an encounter. The types of interventions included medication increases, decreases, initiation, discontinuation, or no medication change. Each medication change and rationale, if applicable, was recorded for the encounter ≤ 42 days after the initial contact date. If a medication with required monitoring parameters was augmented, the pharmacist was responsible for ordering laboratory testing and follow-up. Most interventions were completed by telephone; however, some patients had in-person visits in the HF CPP clinic.
Outcomes
The primary outcome was the number of pharmacist interventions made to optimize GDMT, defined as either an initiation or dose increase. Key intervention analysis included the use and dosing of the 4 primary components of HF GDMT: BB, SGLT2i, MRA, and ARNi/ARB/ACEi. In addition to the 4 primary components of GDMT, loop diuretic changes were also recorded and analyzed. Secondary endpoints were the number of HF hospitalizations ≤ 42 days after the initial alert, and the effect of medication interventions on device metrics, patient symptoms, and tolerability. Successful tolerability was defined as continued use of augmented GDMT without intolerance or discontinuation. The primary analysis was analyzed through descriptive statistics. Median changes in HeartLogic scores and metrics from baseline were analyzed using a paired, 2-sided t test with an α of .05 to detect significance.
Results
There were 39 WPBVAMC patients with a HeartLogic-capable device. Twenty-one alert encounters were analyzed in 16 patients (41%) over 31 weeks of data collection. The 16 patients at baseline had a mean age of 74 years, all were male, and 12 (75%) were White. Eight patients (50%) had a recent ejection fraction (EF) between 30% and 40%. Three patients had an EF ≥ 40%. At the time of alert, 15 patients used BB (94%), 10 used loop diuretics (63%), and 9 used ARNi (56%) (Table 1).
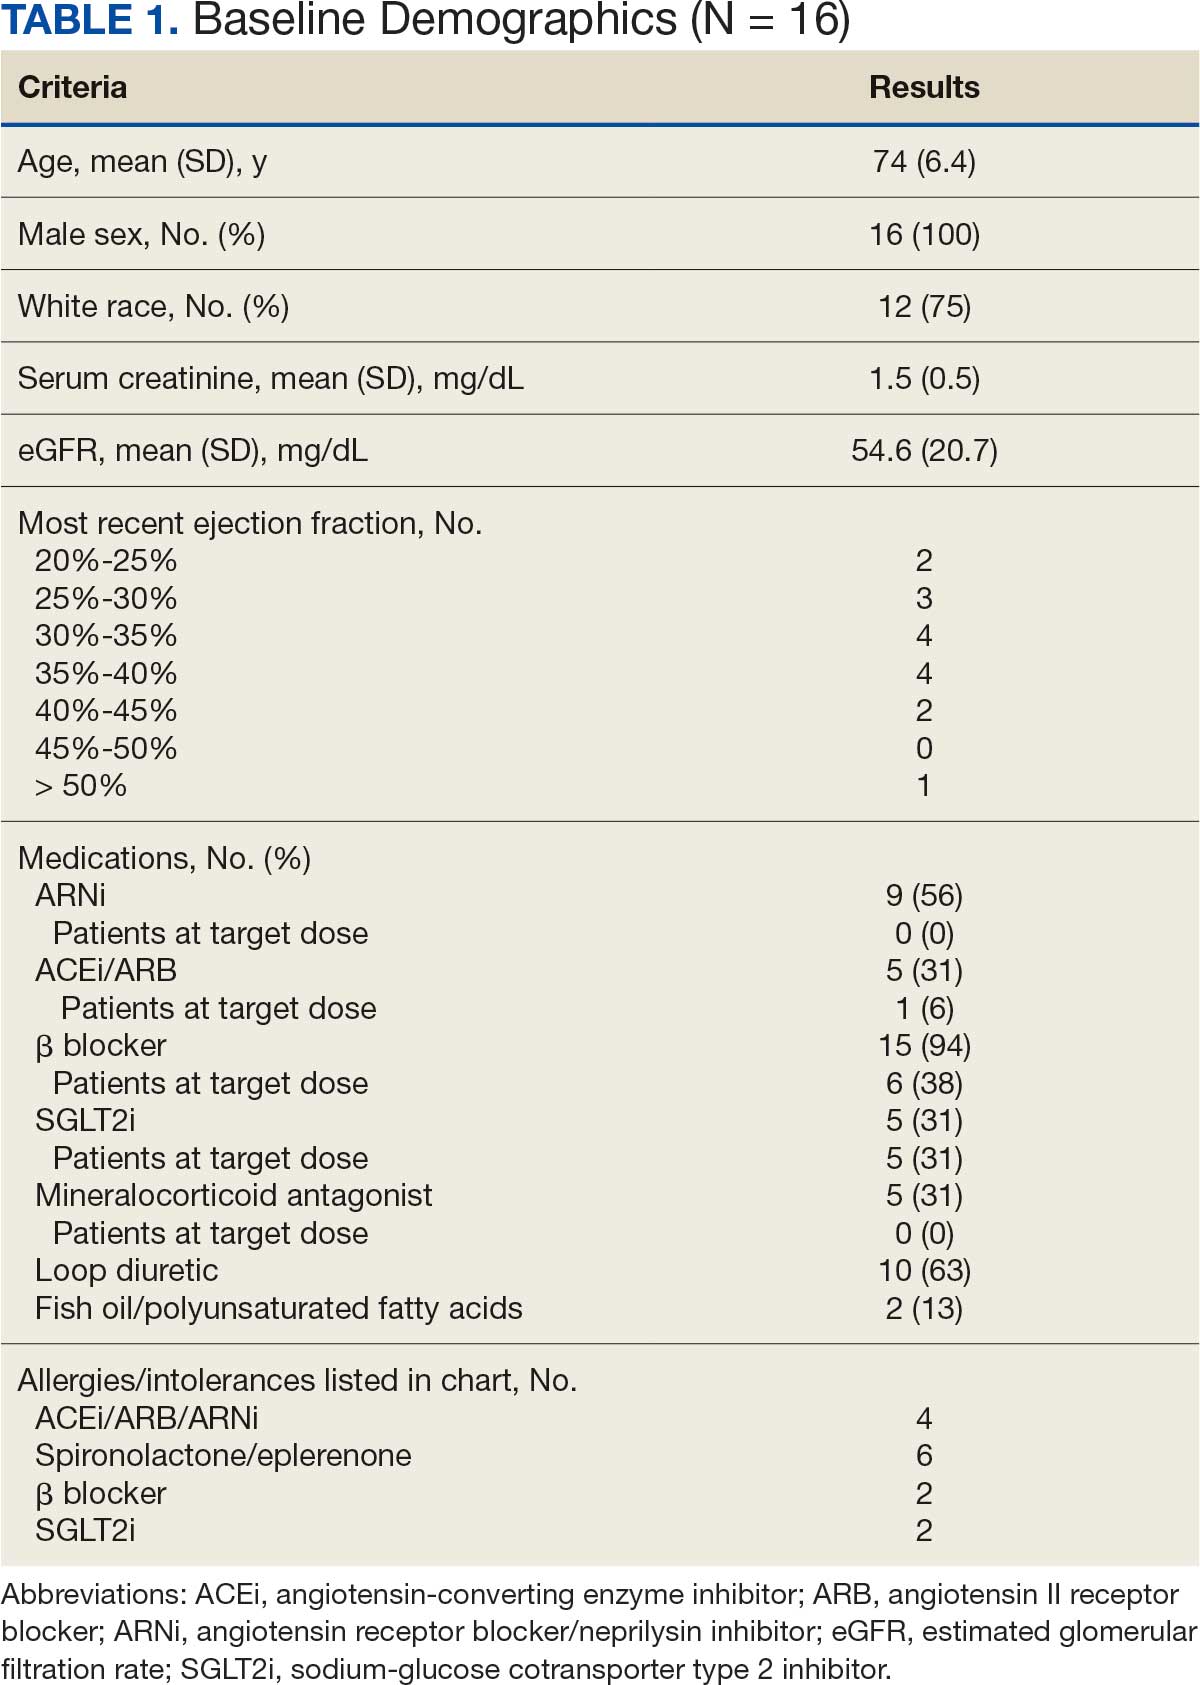
There were 23 medication changes made during initial contact. The most common change was starting an SGLT2i (30%; n = 7), followed by starting an MRA (22%; n = 5), and increasing the ARNi dose (22%; n = 5). At the initial contact, ≥ 1 medication optimization occurred in 95% (n = 20) of encounters. The CPP contacted patients a mean of 4.8 days after the initial alert.
Patients were taking a mean of 2.6 primary GDMT medications at baseline and 3.0 at 42 days. CPP encounters led to a mean of 1.8 medication changes over the 6-week period (range, 0-5). Seventeen medications were started, 13 medications were increased, 3 medications were decreased, and 4 medications were stopped (Table 2). One ACEi and 1 ARB were switched as a therapy escalation to an ARNi. One patient was on 1 of 4 primary GDMTs at baseline, which increased to 4 GDMT agents at 42 days.
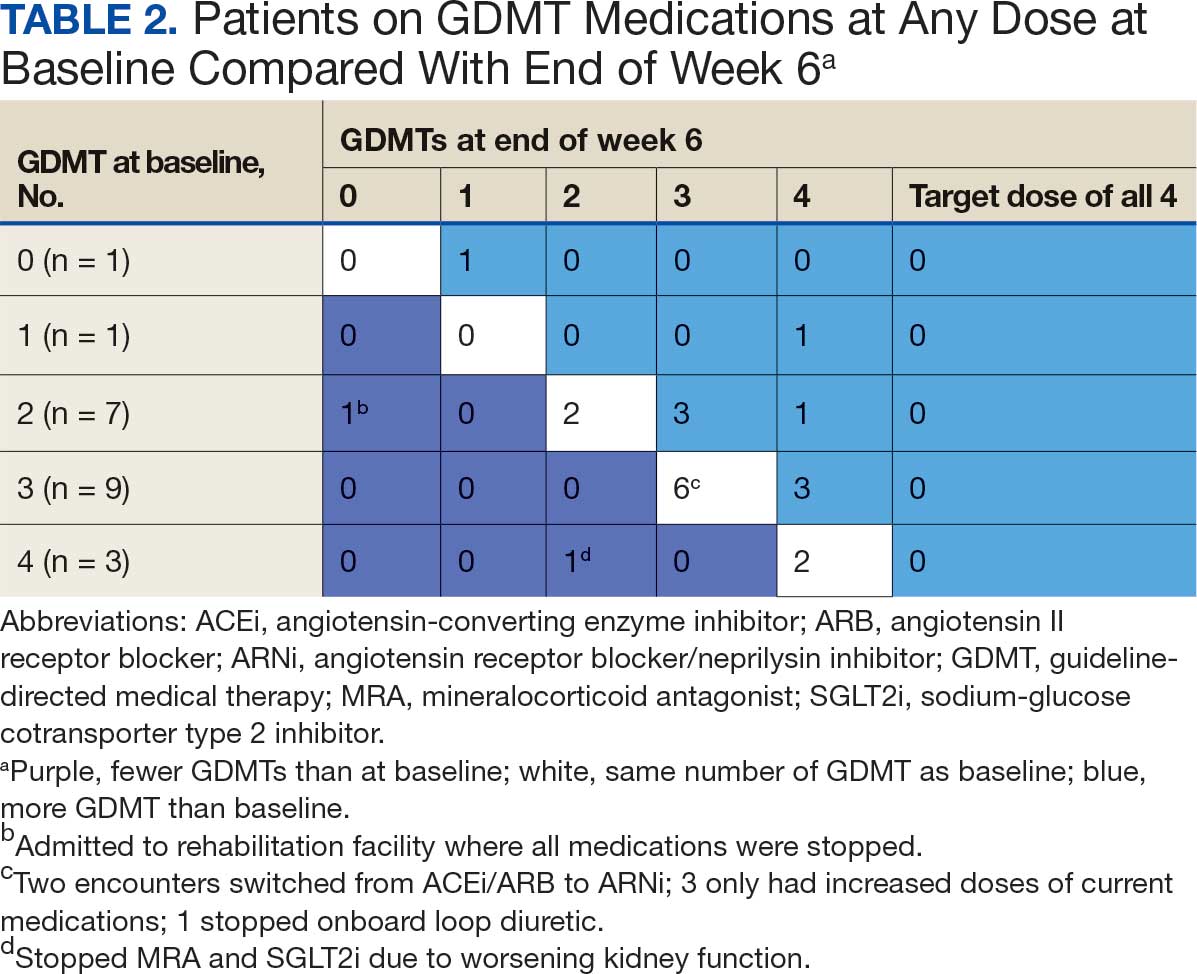
SGLT2 inhibitors were added most often at initial contact (54%) and throughout the 42-day period (41%). The most common successfully tolerated optimizations were RASi, followed by MRA, SGLT2 inhibitors, BB, and loop diuretics with 11, 6, 5, 3, and 2 patients, respectively. Interventions were tolerated by 90% of patients, and no HF hospitalization occurred during follow-up. All possible rationales for patients with the same or reduced number of GDMT at 42 days compared with baseline are shown in Appendix 2.
Device Metrics
During initial contact, the most common HeartLogic metric category that was predominantly worsening were heart sounds (S1, S3, and S3/S1 ratio), followed by compensatory mechanism sensors (NHR and RR) and congestion (impedance) at rates of 61.9%, 23.8%, and 14.3%, respectively (Figure 2).
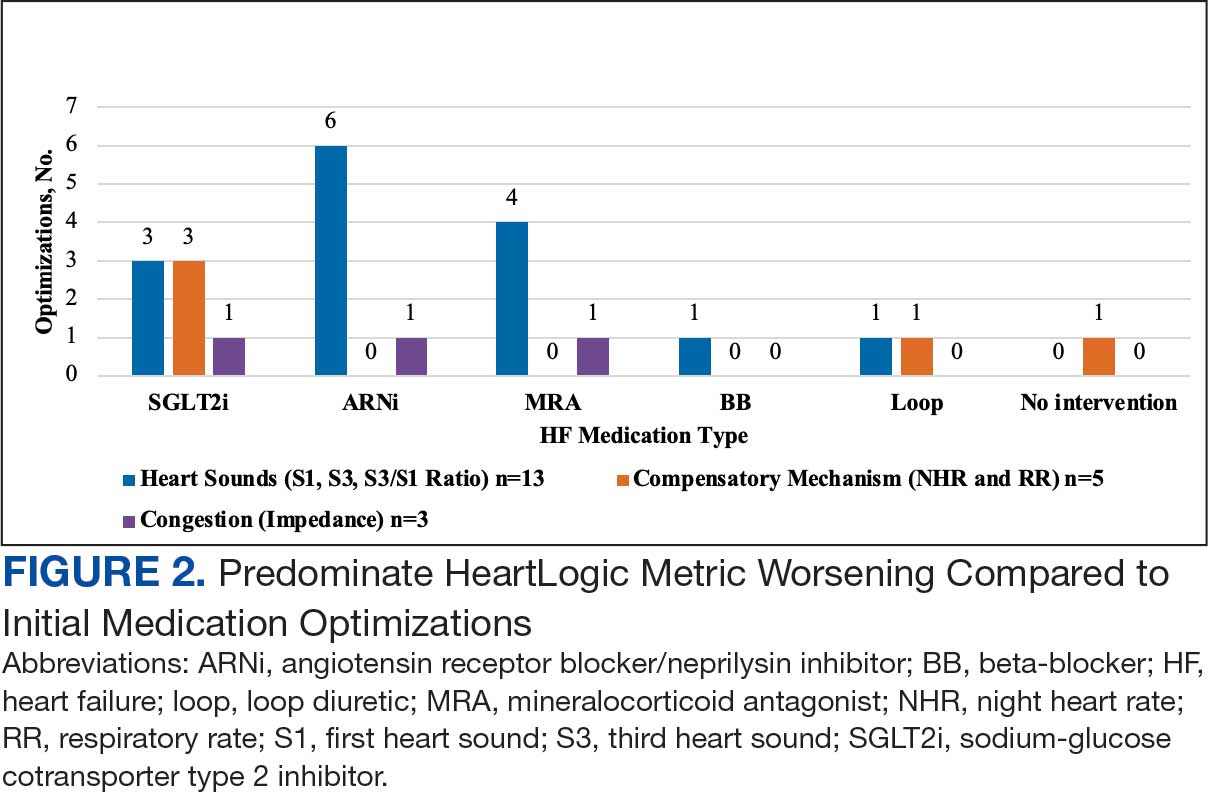
The median HeartLogic index score was 18 at baseline and 5 at the end of the follow-up period (P < .001). The changes in score and metrics were compared with the type of successfully tolerated GDMT optimization made (Table 3). The GDMT optimization analysis included SGLT2i, RASi, MRA, BB, and loop diuretics. All interventions reduced the overall HeartLogic index score, ranging from a 9.5-point reduction (loop diuretics) to a 16-point reduction (SGLT2i and BB). Optimization of SGLT2i, RASi, and loop diuretics had a positive impact on S1 score. For S3 score, SGLT2i, MRA, and BB had a positive impact. All medications, except for SGLT2i therapy, reduced the NHR score. Optimization of MRA, SGLT2i, and BB had positive impacts on the impedance score. All medications reduced RR from baseline. Only SGLT2i and loop diuretics had positive impacts on the activity score.
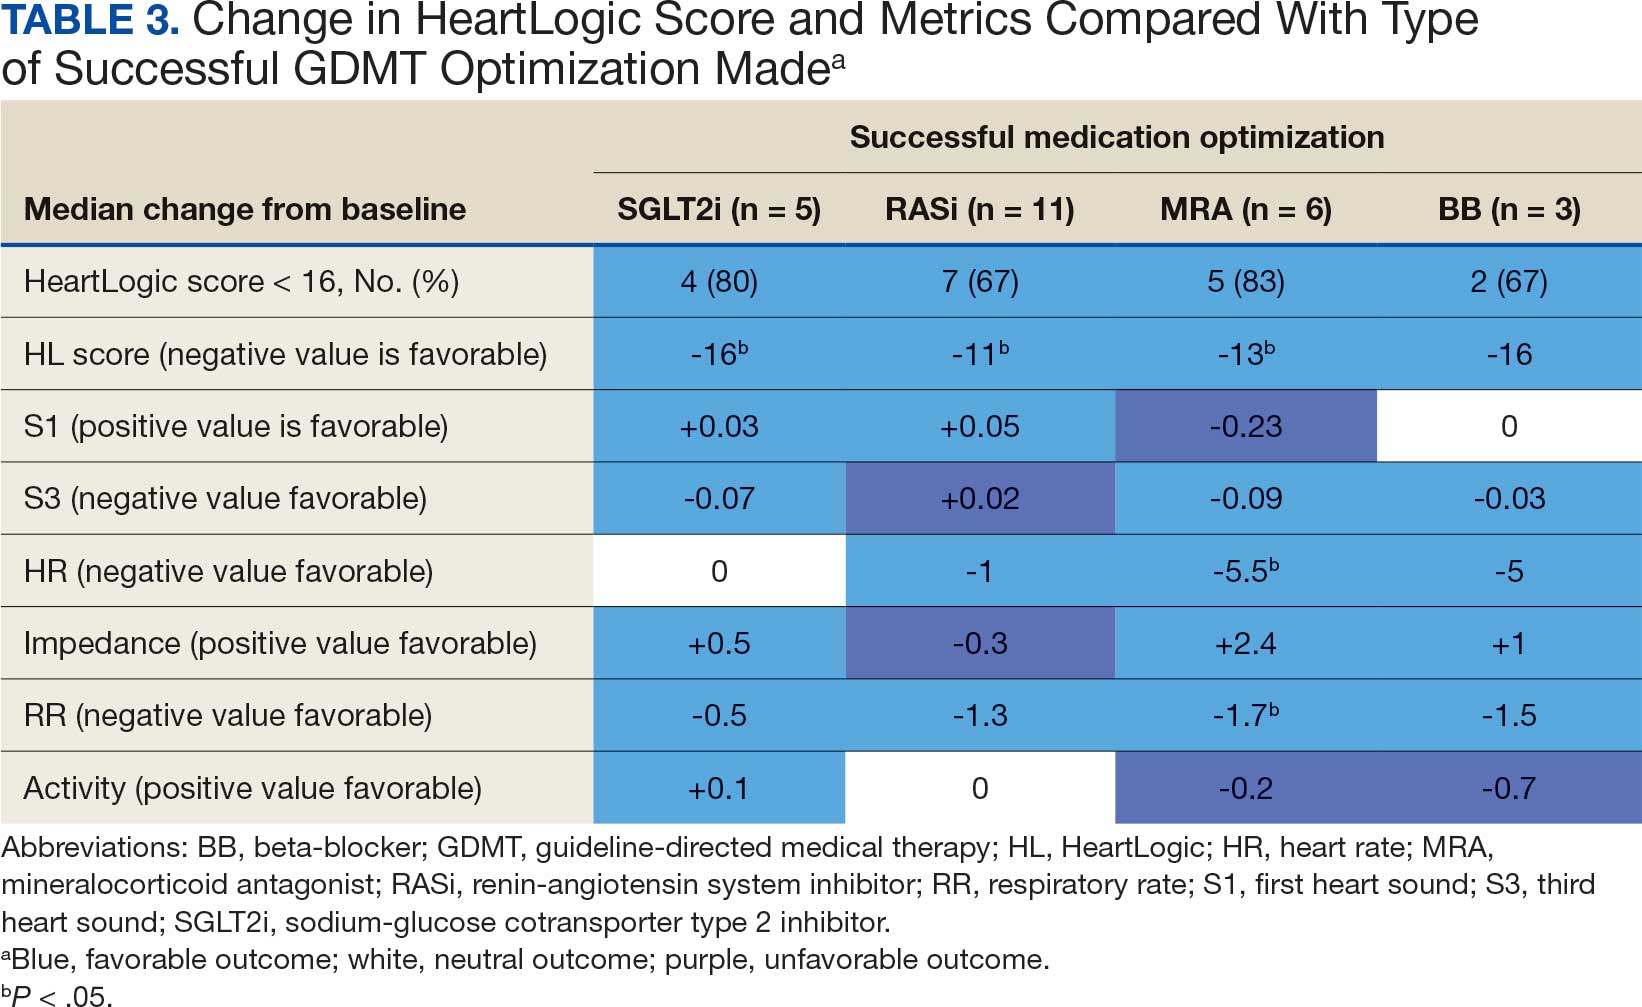
Clinical Outcomes and Adverse Effects
Within 42 days of contact, 17 encounters (81%) had ≥ 1 follow-up appointment with a CPP and all 21 patients had ≥ 1 follow-up health care team member. One patient had a HF-related hospitalization within 42 days of contact; however, that individual refused the recommended medication intervention. There were 13 encounters (62%) with reported symptoms at the time of the initial alert and 10 (77%) had subjective symptom improvement at 42 days (Appendix 3).
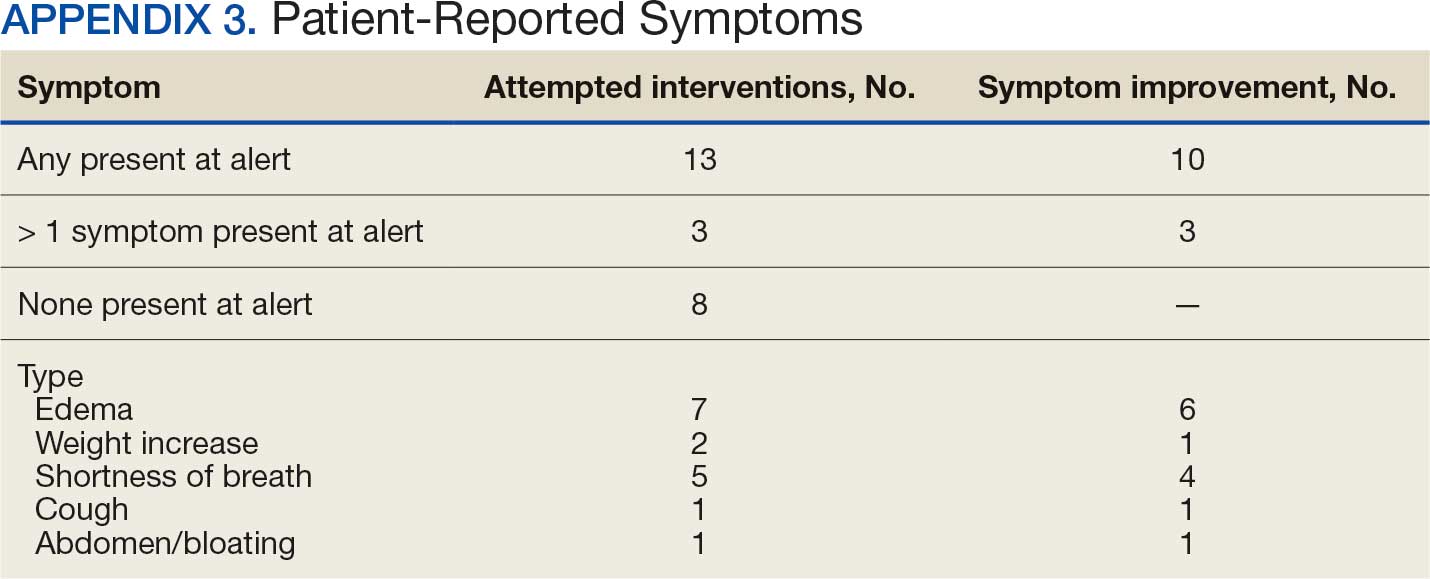
Of 30 medication optimizations, 27 primary GDMT medications were tolerated. Two medication intolerances led to discontinuation (1 SGLT2i and 1 loop diuretic) and 1 patient never started the SGLT2i (Table 4). There was only 1 known patient who did not follow the directions to adjust their medications. That individual was included because the patient agreed to the change during the CPP visit but later reported that he had never started the SGLT2i.
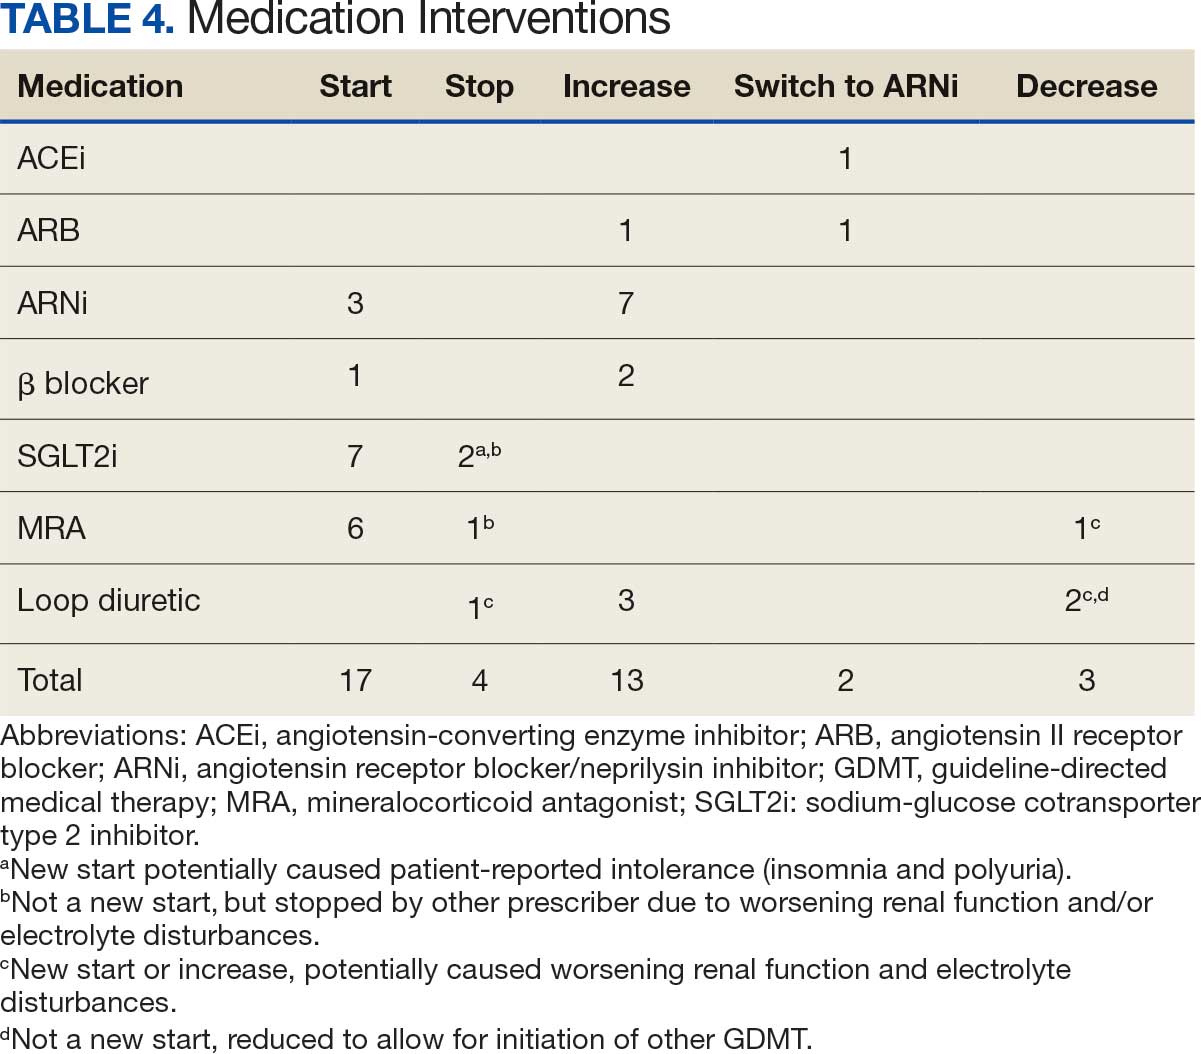
Discussion
The HeartLogic tool created a bridge for patients with HF to work with CPPs as soon as possible to optimize medication therapy to reduce HF events. This study highlights an additional area of expertise and service that CPPs may offer to their specialty HF clinic team. Over 31 weeks, 21 encounters and 30 medication optimizations were completed. These interventions led to significant reductions in HeartLogic scores, improvements in symptoms, and optimization of HF care, most of which were well tolerated.
Additional hemodynamic monitoring devices are available. Similar to HeartLogic, OptiVol is a tool embedded in select Medtronic implantable devices that monitors fluid status. 14 CardioMEMS is an implantable pulmonary artery pressure sensor used as a presymptomatic data point to alert clinicians when HF is worsening. In the CHAMPION trial, the use of CardioMEMS showed a 28% reduction in HF-related hospitalization at 6 months.15 Conversely, in the GUIDE-HF trial, monitoring with CardioMEMS did not significantly reduce the composite endpoint of mortality and total HF events.16 Therefore, remote hemodynamic monitoring has variable results and the use of these tools remains uncertain per the clinical guidelines.2
The MANAGE-HF study that contributed to the validation of the HeartLogic tool may provide a comparison with this smaller single-center project. The time to follow-up within 7 days of alert was noted in only 54% of the patients in MANAGE-HF.12 In this study, 86% of patients received follow-up within 7 days, with a mean of 4.8 days. The quick turnaround from the time of alert to intervention portrays pharmacists as readily available HCPs.
In MANAGE-HF, 89% of medication augmentation involved loop diuretics or thiazides; in our project, loop diuretics were the least frequently changed medication. Most optimizations in this project included ARNi, SGLT2i, BB, and MRA, which have been shown to reduce morbidity and mortality.2 Our project included use of SGLT2i therapy to affect HeartLogic metrics, which has not been evaluated previously. SGLT2i were the most commonly initiated medication after an alert. Of the 5 tolerated SGLT2i optimization encounters, 4 were out of alert at 42 days.
SGLT2i resulted in a significant decrease in HeartLogic index score from baseline and were the only class of medication that did not produce a negative change in any metric. In this study, CPPs utilizing and acting on HeartLogic alerts led to 1 (4.8%) hospitalization with HF as the primary reason for admission and no hospitalizations as a secondary cause in 42 days, compared to 37% and 7.9% in the MANAGE-HF in 1 year, respectively. An additional screening 1 year after the initial alert found that 2 (12.5%) of 12 patients had been admitted with 1 HF hospitalization each.
A strength of this study was the ability to use HeartLogic to identify high-risk patients, provide a source of patient contact and monitoring, interpret 5 cardiac sensors, and optimize all HF GDMT, not just volume management. By focusing efforts on making patient contact and pharmacotherapy interventions with morbidity and mortality benefit, remote hemodynamic monitoring may show a clear clinical benefit and become a vital part of HF care.
Limitations
Checking for adherence and tolerance to medications were mainly patient reported if there was a CPP follow-up within 42 days, or potentially through refill history when unclear. However, this limitation is reflective of current practice where patients may have multiple clinicians working to optimize HF care and where there is reliance on patients in order to guide continued therapy. Although unable to explicitly show a reduction in HF events given lack of comparator group, the interventions made are associated with improved outcomes and thus would be expected to improve patient outcomes. Changes in vital signs were not tracked as part of this project, however the main rationale for changes made were to optimize GDMT therapy, not specifically to impact vital sign measures.
HeartLogic alerts prompted identification of high-risk patients with HF, pharmacist evaluation and outreach, patient-focused pharmacotherapy care, and beneficial patient outcomes. With only 2 cardiology CPPs checking alerts once weekly, future studies may be needed with larger samples to create algorithms and protocols to increase the clinical utility of this tool on a greater scale.
Conclusions
Cardiology CPP-led HF interventions triggered by HeartLogic alerts lead to effective patient identification, increased access to care, reductions in HeartLogic scores, improvements in symptoms, and optimization of HF care. This project demonstrates the practical utility of the HeartLogic suite in conjunction with CPP care to prioritize treatment for highrisk patients with HF in an efficient manner. The data highlight the potential value of the HeartLogic tool and a CPP in HF care to facilitate initiation and optimization of GDMT to ultimately improve the morbidity and mortality in patients with HF.
- Tsao CW, Aday AW, Almarzooq ZI, et al. Heart disease and stroke statistics-2023 update: a report from the American Heart Association. Circulation. 2023;147:e93-e621. doi:10.1161/CIR.0000000000001123
- Heidenreich PA, Bozkurt B, Aguilar D, et al. 2022 AHA/ ACC/HFSA guideline for the management of heart failure: a report of the American College of Cardiology/ American Heart Association Joint Committee on Clinical Practice Guidelines. Circulation. 2022;145:e895-e1032. doi:10.1161/CIR.0000000000001063
- Boehmer JP, Hariharan R, Devecchi FG, et al. A multisensor algorithm predicts heart failure events in patients with implanted devices: results from the MultiSENSE study. J Am Coll Cardiol HF. 2017;5:216-225. doi:10.1016/j.jchf.2016.12.011
- Cao M, Gardner RS, Hariharan R, et al. Ambulatory monitoring of heart sounds via an implanted device is superior to auscultation for prediction of heart failure events. J Card Fail. 2020;26:151-159. doi:10.1016/j.cardfail.2019.10.006
- Calò L, Capucci A, Santini L, et al. ICD-measured heart sounds and their correlation with echocardiographic indexes of systolic and diastolic function. J Interv Card Electrophysiol. 2020;58:95-101. doi:10.1007/s10840-019-00668
- Del Buono MG, Arena R, Borlaug BA, et al. Exercise intolerance in patients with heart failure: JACC state-of-the- art review. J Am Coll Cardiol. 2019;73:2209-2225. doi:10.1016/j.jacc.2019.01.072
- Yu CM, Wang L, Chau E, et al. Intrathoracic impedance monitoring in patients with heart failure: correlation with fluid status and feasibility of early warning preceding hospitalization. Circulation. 2005;112:841-848. doi:10.1161/CIRCULATIONAHA.104.492207
- Rials S, Aktas M, An Q, et al. Continuous respiratory rate is superior to routine outpatient dyspnea assessment for predicting heart failure events. J Card Fail. 2018;24:S45.
- Fonarow GC, ADHERE Scientific Advisory Committee. The Acute Decompensated Heart Failure National Registry (ADHERE): opportunities to improve care of patients hospitalized with acute decompensated heart failure. Rev Cardiovasc Med. 2003;4(suppl 7):S21-S30. doi:10.1016/j.cardfail.2018.07.130
- Fox K, Borer JS, Camm AJ, et al. Resting heart rate in cardiovascular disease. J Am Coll Cardiol. 2007;50:823-830. doi:10.1016/j.jacc.2007.04.079
- De Ruvo E, Capucci A, Ammirati F, et al. Preliminary experience of remote management of heart failure patients with a multisensor ICD alert [abstract P1536]. Eur J Heart Fail. 2019;21(suppl S1):370.
- Hernandez AF, Albert NM, Allen LA, et al. Multiple cardiac sensors for management of heart failure (MANAGE- HF) - phase I evaluation of the integration and safety of the HeartLogic multisensor algorithm in patients with heart failure. J Card Fail. 2022;28:1245-1254. doi:10.1016/j.cardfail.2022.03.349
- Santini L, D’Onofrio A, Dello Russo A, et al. Prospective evaluation of the multisensor HeartLogic algorithm for heart failure monitoring. Clin Cardiol. 2020;43:691-697. doi:10.1002/clc.23366
- Yu CM, Wang L, Chau E, et al. Intrathoracic impedance monitoring in patients with heart failure: correlation with fluid status and feasibility of early warning preceding hospitalization. Circulation. 2005;112:841-848. doi:10.1161/CIRCULATIONAHA.104.492207
- Adamson PB, Abraham WT, Stevenson LW, et al. Pulmonary artery pressure-guided heart failure management reduces 30-day readmissions. Circ Heart Fail. 2016;9:e002600. doi:10.1161/CIRCHEARTFAILURE.115.002600
- Lindenfeld J, Zile MR, Desai AS, et al. Haemodynamic-guided management of heart failure (GUIDE-HF): a randomised controlled trial. Lancet. 2021;398:991-1001. doi:10.1016/S0140-6736(21)01754-2
Heart failure (HF) is a prevalent disease in the United States affecting > 6.5 million adults and contributing to significant morbidity and mortality.1 The disease course associated with HF includes potential symptom improvement with intermittent periods of decompensation and possible clinical deterioration. Multiple therapies have been developed to improve outcomes in people with HF—to palliate HF symptoms, prevent hospitalizations, and reduce mortality.2 However, the risks of decompensation and hospitalization remain. HF decompensation development may precede clear actionable symptoms such as worsening dyspnea, noticeable edema, or weight gain. Tools to identify patient deterioration and trigger interventions to prevent HF admissions are clinically attractive compared with reliance on subjective factors alone.
Cardiac resynchronization therapy (CRT) and implantable cardioverter-defibrillator (ICD) devices made by Boston Scientific include the HeartLogic monitoring feature. Five main sensors produce an index risk score; an index score > 16 warns clinicians that the patient is at an increased risk for a HF event.3 The 5 sensors are thoracic impedance, first (S1) and third heart sounds (S3), night heart rate (NHR), respiratory rate (RR), and activity. Each sensor can draw attention to the primary driver of the alert and guide health care practitioners (HCPs) to the appropriate interventions.3 A HeartLogic alert example is shown in Figure 1.
The S3 occurs during the early diastolic phase when blood moves into the ventricles. As HF worsens, with a combination of elevated filling pressures and reduced cardiac muscle compliance, S3 can become more pronounced.4 The S1 is correlated with the contractility of the left ventricle and will be reduced in patients at risk for HF events.5 Physical activity is a long-term prognostic marker in patients with HF; reduced activity is associated with mortality and increased risk of an HF event.6 Thoracic impedance is a sensor used to identify pulmonary congestion, pocket infections, pleural/pericardial effusion, and respiratory infections. The accumulation of intrathoracic fluid during pulmonary congestion increases conductance, causing a decrease in impedance.7 RR will increase as patients experience dyspnea with a more rapid, shallow breath and may trigger alerts closer to the actual HF event than other sensors. Nearly 90% of patients hospitalized for HF experience shortness of breath.8,9 NHR is used as a surrogate for resting heart rate (HR). A high resting HR is correlated with the progression of coronary atherosclerosis, harmful effects on left ventricular function, and increased risk of myocardial ischemia and ventricular arrhythmias.10
One of the challenges with preventing hospitalizations may be the lack of patient reported symptoms leading up to the event. The purpose of the sensors and HeartLogic index is to identify patients a median of 34 days before an HF event (HF admission or unscheduled intervention with intravenous treatment) with a sensitivity rate of 70%.3 According to real-word experience data, alerts have been found to precede HF symptoms by a median of 12 days and HF events such as hospitalizations by a median of 38 days, with an overall 67% reduction in HF hospitalizations when integrated into clinical care.11,12
MANAGE-HF evaluated 191 patients with HF with reduced ejection fraction (HFrEF) (< 35%), New York Heart Association class II-III symptoms, and who had an implanted CRT and/or ICD to develop an alert management guide to optimize medical treatment.12 It aimed to adjust patient regimen within 6 days of an elevated Heart- Logic index by either initiation, escalation, or maintenance of HF treatment depending on the index trend after the initial alert. This trial found that by focusing on such optimization, HF treatment was augmented during 74% of the 585 alert cases and during 54% of 3290 weekly alerts.
Initiation and uptitration of the 4 primary components of guideline-directed medical therapy (GDMT) are recommended by the 2022 Heart Failure Guidelines to reduce mortality and morbidity in patients with HFrEF.2 The 4 pillars of GDMT consist of -blockers (BB), sodium-glucose cotransporter type 2 inhibitors (SGLT2i), mineralocorticoid receptor antagonists (MRA), and renin-angiotensin-system inhibitors (RASi) including angiotensin II receptor blocker/neprilysin inhibitors (ARNi), angiotensin-converting enzyme inhibitors (ACEi) and angiotensin II receptor blockers (ARB) (Appendix 1). Obtaining and titrating to target doses wherever possible is recommended, as those were the doses that established safety and efficacy in patients with HFrEF in clinical trials.2 Pharmacists are adequately equipped to optimize HF GDMT and appropriately monitor drug response.
Through the use of HeartLogic in clinical practice, patients with HF have been shown to have improved clinical outcomes and are more likely to receive effective care; 80% of alerts were shown to provide new information to clinicians.13 This project sought to quantify the total number and types of pharmacist interventions driven by integration of HeartLogic index monitoring into practice.
Methods
The West Palm Beach Veterans Affairs Medical Center (WPBVAMC) Research Program Office approved this project and determined it was exempt from institutional review board oversight. Patients were screened retrospectively and prospectively from May 26, 2022, through December 31, 2022, by a cardiology clinical pharmacist practitioner (CPP) and a cardiology pharmacy resident using the local monitoring suite for the HeartLogic-compatible device, LATITUDE NXT. Read-only access to the local monitoring suit was granted by the National Cardiac Device Surveillance Program. Training for HeartLogic was completed through continuing education courses provided by Boston Scientific. Additional information was provided by Boston Scientific representative presentations and collaboration with WPBVAMC pacemaker clinic HCPs.
Individuals included were patients with HeartLogic-capable ICDs. A HeartLogic alert had to be present at initial patient contact. Patients were also contacted as part of routine clinical practice, but no formal number or frequency of calls to patients was required. The initial contact must be with a pharmacist for the patient to be included, but subsequent contact by other HCPs was included. Patients in the cardiology clinic are required to meet with a cardiologist at least annually; however, interim visits can be completed by advanced practice registered nurse practitioners, physicians assistants, or CPPs.
Patients in alert status were contacted by telephone and appropriate modifications of HF therapy were made by the CPP based on score metrics, medical record review, and patient interview. Information surrounding the initial alert, baseline patient data, medication and monitoring interventions made, and clinical outcomes such as hospitalization, symptom improvement, follow-up, and mortality were collected. Information for each encounter was collected until 42 days from the initial date of pharmacist contact.
Clinically successful tolerability of intervention implementation was defined as tolerability, adherence, and lack of adverse effects (AEs) per patient report at follow-up or within 42 days from initial alert (Appendix 2). A decrease in dose was not counted as intolerance. A single patient may have been counted as multiple encounters if the original intervention resulted in treatment intolerance and the patient remained in alert or if an additional alert occurred after 42 days of the initial alert. There were no specific time criteria for follow-up, which occurred at the CPP’s discretion.
There was no mandated algorithm used to alter medications based on the Heart- Logic score, nor were there required minimum or maximum numbers of interventions after an alert. Patient contact by telephone initiated an encounter. The types of interventions included medication increases, decreases, initiation, discontinuation, or no medication change. Each medication change and rationale, if applicable, was recorded for the encounter ≤ 42 days after the initial contact date. If a medication with required monitoring parameters was augmented, the pharmacist was responsible for ordering laboratory testing and follow-up. Most interventions were completed by telephone; however, some patients had in-person visits in the HF CPP clinic.
Outcomes
The primary outcome was the number of pharmacist interventions made to optimize GDMT, defined as either an initiation or dose increase. Key intervention analysis included the use and dosing of the 4 primary components of HF GDMT: BB, SGLT2i, MRA, and ARNi/ARB/ACEi. In addition to the 4 primary components of GDMT, loop diuretic changes were also recorded and analyzed. Secondary endpoints were the number of HF hospitalizations ≤ 42 days after the initial alert, and the effect of medication interventions on device metrics, patient symptoms, and tolerability. Successful tolerability was defined as continued use of augmented GDMT without intolerance or discontinuation. The primary analysis was analyzed through descriptive statistics. Median changes in HeartLogic scores and metrics from baseline were analyzed using a paired, 2-sided t test with an α of .05 to detect significance.
Results
There were 39 WPBVAMC patients with a HeartLogic-capable device. Twenty-one alert encounters were analyzed in 16 patients (41%) over 31 weeks of data collection. The 16 patients at baseline had a mean age of 74 years, all were male, and 12 (75%) were White. Eight patients (50%) had a recent ejection fraction (EF) between 30% and 40%. Three patients had an EF ≥ 40%. At the time of alert, 15 patients used BB (94%), 10 used loop diuretics (63%), and 9 used ARNi (56%) (Table 1).
There were 23 medication changes made during initial contact. The most common change was starting an SGLT2i (30%; n = 7), followed by starting an MRA (22%; n = 5), and increasing the ARNi dose (22%; n = 5). At the initial contact, ≥ 1 medication optimization occurred in 95% (n = 20) of encounters. The CPP contacted patients a mean of 4.8 days after the initial alert.
Patients were taking a mean of 2.6 primary GDMT medications at baseline and 3.0 at 42 days. CPP encounters led to a mean of 1.8 medication changes over the 6-week period (range, 0-5). Seventeen medications were started, 13 medications were increased, 3 medications were decreased, and 4 medications were stopped (Table 2). One ACEi and 1 ARB were switched as a therapy escalation to an ARNi. One patient was on 1 of 4 primary GDMTs at baseline, which increased to 4 GDMT agents at 42 days.
SGLT2 inhibitors were added most often at initial contact (54%) and throughout the 42-day period (41%). The most common successfully tolerated optimizations were RASi, followed by MRA, SGLT2 inhibitors, BB, and loop diuretics with 11, 6, 5, 3, and 2 patients, respectively. Interventions were tolerated by 90% of patients, and no HF hospitalization occurred during follow-up. All possible rationales for patients with the same or reduced number of GDMT at 42 days compared with baseline are shown in Appendix 2.
Device Metrics
During initial contact, the most common HeartLogic metric category that was predominantly worsening were heart sounds (S1, S3, and S3/S1 ratio), followed by compensatory mechanism sensors (NHR and RR) and congestion (impedance) at rates of 61.9%, 23.8%, and 14.3%, respectively (Figure 2).
The median HeartLogic index score was 18 at baseline and 5 at the end of the follow-up period (P < .001). The changes in score and metrics were compared with the type of successfully tolerated GDMT optimization made (Table 3). The GDMT optimization analysis included SGLT2i, RASi, MRA, BB, and loop diuretics. All interventions reduced the overall HeartLogic index score, ranging from a 9.5-point reduction (loop diuretics) to a 16-point reduction (SGLT2i and BB). Optimization of SGLT2i, RASi, and loop diuretics had a positive impact on S1 score. For S3 score, SGLT2i, MRA, and BB had a positive impact. All medications, except for SGLT2i therapy, reduced the NHR score. Optimization of MRA, SGLT2i, and BB had positive impacts on the impedance score. All medications reduced RR from baseline. Only SGLT2i and loop diuretics had positive impacts on the activity score.
Clinical Outcomes and Adverse Effects
Within 42 days of contact, 17 encounters (81%) had ≥ 1 follow-up appointment with a CPP and all 21 patients had ≥ 1 follow-up health care team member. One patient had a HF-related hospitalization within 42 days of contact; however, that individual refused the recommended medication intervention. There were 13 encounters (62%) with reported symptoms at the time of the initial alert and 10 (77%) had subjective symptom improvement at 42 days (Appendix 3).
Of 30 medication optimizations, 27 primary GDMT medications were tolerated. Two medication intolerances led to discontinuation (1 SGLT2i and 1 loop diuretic) and 1 patient never started the SGLT2i (Table 4). There was only 1 known patient who did not follow the directions to adjust their medications. That individual was included because the patient agreed to the change during the CPP visit but later reported that he had never started the SGLT2i.
Discussion
The HeartLogic tool created a bridge for patients with HF to work with CPPs as soon as possible to optimize medication therapy to reduce HF events. This study highlights an additional area of expertise and service that CPPs may offer to their specialty HF clinic team. Over 31 weeks, 21 encounters and 30 medication optimizations were completed. These interventions led to significant reductions in HeartLogic scores, improvements in symptoms, and optimization of HF care, most of which were well tolerated.
Additional hemodynamic monitoring devices are available. Similar to HeartLogic, OptiVol is a tool embedded in select Medtronic implantable devices that monitors fluid status. 14 CardioMEMS is an implantable pulmonary artery pressure sensor used as a presymptomatic data point to alert clinicians when HF is worsening. In the CHAMPION trial, the use of CardioMEMS showed a 28% reduction in HF-related hospitalization at 6 months.15 Conversely, in the GUIDE-HF trial, monitoring with CardioMEMS did not significantly reduce the composite endpoint of mortality and total HF events.16 Therefore, remote hemodynamic monitoring has variable results and the use of these tools remains uncertain per the clinical guidelines.2
The MANAGE-HF study that contributed to the validation of the HeartLogic tool may provide a comparison with this smaller single-center project. The time to follow-up within 7 days of alert was noted in only 54% of the patients in MANAGE-HF.12 In this study, 86% of patients received follow-up within 7 days, with a mean of 4.8 days. The quick turnaround from the time of alert to intervention portrays pharmacists as readily available HCPs.
In MANAGE-HF, 89% of medication augmentation involved loop diuretics or thiazides; in our project, loop diuretics were the least frequently changed medication. Most optimizations in this project included ARNi, SGLT2i, BB, and MRA, which have been shown to reduce morbidity and mortality.2 Our project included use of SGLT2i therapy to affect HeartLogic metrics, which has not been evaluated previously. SGLT2i were the most commonly initiated medication after an alert. Of the 5 tolerated SGLT2i optimization encounters, 4 were out of alert at 42 days.
SGLT2i resulted in a significant decrease in HeartLogic index score from baseline and were the only class of medication that did not produce a negative change in any metric. In this study, CPPs utilizing and acting on HeartLogic alerts led to 1 (4.8%) hospitalization with HF as the primary reason for admission and no hospitalizations as a secondary cause in 42 days, compared to 37% and 7.9% in the MANAGE-HF in 1 year, respectively. An additional screening 1 year after the initial alert found that 2 (12.5%) of 12 patients had been admitted with 1 HF hospitalization each.
A strength of this study was the ability to use HeartLogic to identify high-risk patients, provide a source of patient contact and monitoring, interpret 5 cardiac sensors, and optimize all HF GDMT, not just volume management. By focusing efforts on making patient contact and pharmacotherapy interventions with morbidity and mortality benefit, remote hemodynamic monitoring may show a clear clinical benefit and become a vital part of HF care.
Limitations
Checking for adherence and tolerance to medications were mainly patient reported if there was a CPP follow-up within 42 days, or potentially through refill history when unclear. However, this limitation is reflective of current practice where patients may have multiple clinicians working to optimize HF care and where there is reliance on patients in order to guide continued therapy. Although unable to explicitly show a reduction in HF events given lack of comparator group, the interventions made are associated with improved outcomes and thus would be expected to improve patient outcomes. Changes in vital signs were not tracked as part of this project, however the main rationale for changes made were to optimize GDMT therapy, not specifically to impact vital sign measures.
HeartLogic alerts prompted identification of high-risk patients with HF, pharmacist evaluation and outreach, patient-focused pharmacotherapy care, and beneficial patient outcomes. With only 2 cardiology CPPs checking alerts once weekly, future studies may be needed with larger samples to create algorithms and protocols to increase the clinical utility of this tool on a greater scale.
Conclusions
Cardiology CPP-led HF interventions triggered by HeartLogic alerts lead to effective patient identification, increased access to care, reductions in HeartLogic scores, improvements in symptoms, and optimization of HF care. This project demonstrates the practical utility of the HeartLogic suite in conjunction with CPP care to prioritize treatment for highrisk patients with HF in an efficient manner. The data highlight the potential value of the HeartLogic tool and a CPP in HF care to facilitate initiation and optimization of GDMT to ultimately improve the morbidity and mortality in patients with HF.
- Tsao CW, Aday AW, Almarzooq ZI, et al. Heart disease and stroke statistics-2023 update: a report from the American Heart Association. Circulation. 2023;147:e93-e621. doi:10.1161/CIR.0000000000001123
- Heidenreich PA, Bozkurt B, Aguilar D, et al. 2022 AHA/ ACC/HFSA guideline for the management of heart failure: a report of the American College of Cardiology/ American Heart Association Joint Committee on Clinical Practice Guidelines. Circulation. 2022;145:e895-e1032. doi:10.1161/CIR.0000000000001063
- Boehmer JP, Hariharan R, Devecchi FG, et al. A multisensor algorithm predicts heart failure events in patients with implanted devices: results from the MultiSENSE study. J Am Coll Cardiol HF. 2017;5:216-225. doi:10.1016/j.jchf.2016.12.011
- Cao M, Gardner RS, Hariharan R, et al. Ambulatory monitoring of heart sounds via an implanted device is superior to auscultation for prediction of heart failure events. J Card Fail. 2020;26:151-159. doi:10.1016/j.cardfail.2019.10.006
- Calò L, Capucci A, Santini L, et al. ICD-measured heart sounds and their correlation with echocardiographic indexes of systolic and diastolic function. J Interv Card Electrophysiol. 2020;58:95-101. doi:10.1007/s10840-019-00668
- Del Buono MG, Arena R, Borlaug BA, et al. Exercise intolerance in patients with heart failure: JACC state-of-the- art review. J Am Coll Cardiol. 2019;73:2209-2225. doi:10.1016/j.jacc.2019.01.072
- Yu CM, Wang L, Chau E, et al. Intrathoracic impedance monitoring in patients with heart failure: correlation with fluid status and feasibility of early warning preceding hospitalization. Circulation. 2005;112:841-848. doi:10.1161/CIRCULATIONAHA.104.492207
- Rials S, Aktas M, An Q, et al. Continuous respiratory rate is superior to routine outpatient dyspnea assessment for predicting heart failure events. J Card Fail. 2018;24:S45.
- Fonarow GC, ADHERE Scientific Advisory Committee. The Acute Decompensated Heart Failure National Registry (ADHERE): opportunities to improve care of patients hospitalized with acute decompensated heart failure. Rev Cardiovasc Med. 2003;4(suppl 7):S21-S30. doi:10.1016/j.cardfail.2018.07.130
- Fox K, Borer JS, Camm AJ, et al. Resting heart rate in cardiovascular disease. J Am Coll Cardiol. 2007;50:823-830. doi:10.1016/j.jacc.2007.04.079
- De Ruvo E, Capucci A, Ammirati F, et al. Preliminary experience of remote management of heart failure patients with a multisensor ICD alert [abstract P1536]. Eur J Heart Fail. 2019;21(suppl S1):370.
- Hernandez AF, Albert NM, Allen LA, et al. Multiple cardiac sensors for management of heart failure (MANAGE- HF) - phase I evaluation of the integration and safety of the HeartLogic multisensor algorithm in patients with heart failure. J Card Fail. 2022;28:1245-1254. doi:10.1016/j.cardfail.2022.03.349
- Santini L, D’Onofrio A, Dello Russo A, et al. Prospective evaluation of the multisensor HeartLogic algorithm for heart failure monitoring. Clin Cardiol. 2020;43:691-697. doi:10.1002/clc.23366
- Yu CM, Wang L, Chau E, et al. Intrathoracic impedance monitoring in patients with heart failure: correlation with fluid status and feasibility of early warning preceding hospitalization. Circulation. 2005;112:841-848. doi:10.1161/CIRCULATIONAHA.104.492207
- Adamson PB, Abraham WT, Stevenson LW, et al. Pulmonary artery pressure-guided heart failure management reduces 30-day readmissions. Circ Heart Fail. 2016;9:e002600. doi:10.1161/CIRCHEARTFAILURE.115.002600
- Lindenfeld J, Zile MR, Desai AS, et al. Haemodynamic-guided management of heart failure (GUIDE-HF): a randomised controlled trial. Lancet. 2021;398:991-1001. doi:10.1016/S0140-6736(21)01754-2
Heart Failure Diagnostic Alerts to Prompt Pharmacist Evaluation and Medication Optimization
Heart Failure Diagnostic Alerts to Prompt Pharmacist Evaluation and Medication Optimization

Assessment of Automated vs Conventional Blood Pressure Measurements in a Veterans Affairs Clinical Practice Setting
Assessment of Automated vs Conventional Blood Pressure Measurements in a Veterans Affairs Clinical Practice Setting
Hypertension remains one of the most important modifiable risk factors for the prevention of cardiovascular (CV) events. According to a population-based study, 25% of CV events (CV death, heart disease, coronary revascularization, stroke, or heart failure) are attributable to hypertension.1 Recent guidelines have emphasized the importance of accurate blood pressure (BP) measurement in facilitating appropriate hypertension diagnosis and management.2-4
Currently, there are different BP measurement methods endorsed by practice guidelines. These include conventional in-office measurement, 24-hour ambulatory BP monitoring (ABPM), home BP monitoring (HBPM), and automated office BP (AOBP) measurement.2-4 AOBP device protocols vary but generally involve devices automatically taking multiple BP measurements while the patient is unattended. These measurements are then presented as a single averaged reading, with individual BP values available for review by the clinician.
Researchers have found that AOBP measurements have a greater association with ABPM values and can mitigate the white coat effect observed in a substantial proportion of patients during in-clinic BP measurement.5 A meta-analysis found that the use of AOBP was associated with a 10.5 mm Hg reduction in systolic BP (SBP) compared with traditional office-based BP assessments.5 Similarly, a separate meta-analysis found that AOBP SBP measures were on average 14.5 mm Hg lower than routine office or research setting values.6 In addition, CV risk outcomes data support the use of AOBP to screen and manage patients with hypertension. The Cardiovascular Health Awareness Program (CHAP) study used AOBP values to determine the risk for CV events (myocardial infarction, congestive heart failure, and stroke) in community-based patients aged ≥ 65 years.7 The study showed a significantly higher risk of CV events in patients with an SBP of 135 to 144 mm Hg and a diastolic BP (DBP) of 80 to 89 mm Hg. Therefore, the CHAP study researchers suggested an AOBP target of < 135/85 mm Hg to decrease the risk of CV events.7The landmark SPRINT trial, which was a major contributor to the development of BP target recommendations in guidelines, utilized AOBP to classify hypertension and guide management.2-4,8 SPRINT ultimately showed that intensive BP-lowering treatment (to SBP < 120 mm Hg) was associated with a 25% reduction in major CV events and a 27% reduction in all-cause mortality.8 Other evaluations found a close association between AOBP values and left ventricular mass index and carotid artery wall thickness as surrogate markers for end-organ damage.9,10 These data show AOBP as a reliable method to guide antihypertensive therapy interventions in the clinical setting.
Considering these proposed advantages, the 2017 Canadian guidelines for hypertension management recommend AOBP as the preferred method for clinic-based BP measurement, and the 2018 European Society of Cardiology/European Society of Hypertension blood pressure guidelines recommend the use of AOBP when feasible.3,4 The 2017 American College of Cardiology/American Heart Association Guideline for the Prevention, Detection, Evaluation, and Management of High Blood Pressure in Adults also discusses AOBP as a method to minimize potential confounders in BP values.2
This study evaluated the difference between AOBP and conventional in-office BP measurements obtained during cardiology clinic visits at the West Palm Beach Veterans Affairs Medical Center (WPBVAMC).
METHODS
A retrospective review of AOBP measurements was performed at the WPBVAMC cardiology clinic between May 26, 2017, and February 19, 2019. These AOBP measurements were taken at the discretion of a nurse or other clinician after initial, conventional BP measurements had been taken as part of clinic check-in procedures. No formal protocols dictated the use or timing of AOBP measurements. Similarly, the AOBP results were factored into clinical care decisions.
Clinicians at the cardiology clinic used AOBP averages that were derived using the BpTRU BPM-100 (BpTRU Medical Devices) meter, which averaged 5 BP readings taken at 1-minute intervals. Clinicians selected cuff size based on manufacturer recommendations. The testing was done with the patient seated alone in either a nursing triage area or a clinic office.
Data collected during the retrospective review included the clinician associated with the visit, the patient’s physical location and accompaniment status during AOBP measurement, conventionally measured BP and heart rates, and AOBP-derived BP and heart rate averages. Differences in BP values were compared with the paired t test, while binary comparisons were conducted through the McNemar test. Data collection and analysis were performed using Microsoft Excel.
During data collection, all information was stored in a secure drive accessible only to the investigators. The project was approved by the West Palm Beach Veterans Affairs Healthcare System Research and Development Committee as a nonresearch activity in accordance with Veterans Health Administration Handbook 1058.05; thus, institutional review board approval was not required.
RESULTS
Ninety-five nonconsecutive patients were included in the analysis. AOBP measurements were taken with the patient sitting alone in either a clinic office (n = 83) or nursing triage area (n = 12). Most patients were coming in for follow-up appointments; 13 patients (14%) had appointments related to a 24-hour ABPM session.
The mean SBP and DBP values were lower for the AOBP measurements vs the conventional BP measurements (mean SBP difference, 14.6 mm Hg; P < .001; mean DBP difference, 3.5 mm Hg; P = .0002) (Table). There were no appreciable differences in heart rates. The white coat effect was suggested based on an SBP reduction of > 20 mm Hg from conventional to AOBP measurements in 22 patients (23%), a DBP reduction of > 10 mm Hg in 21 patients (22%), and a reduction in both values in 8 patients (8%).
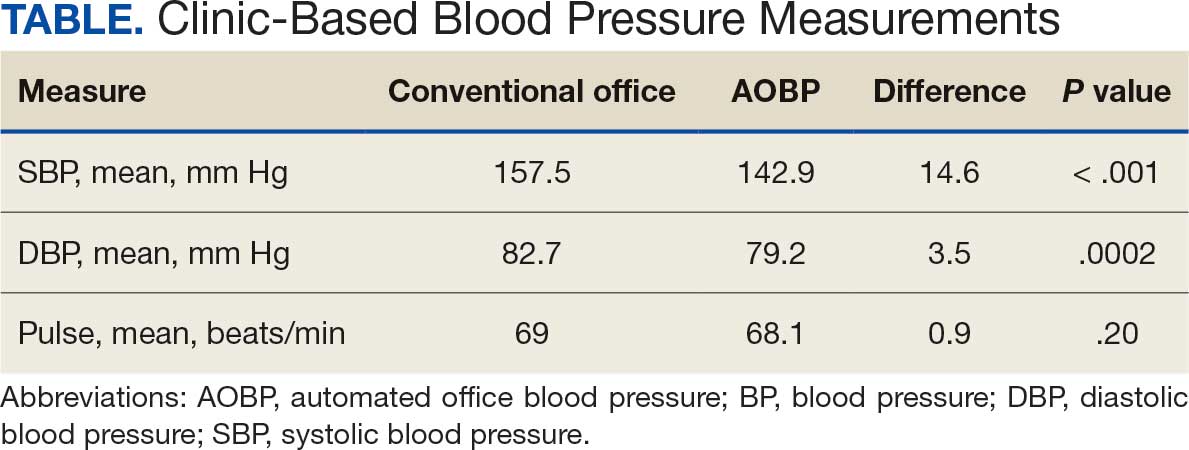
A controlled BP (< 130/80 mm Hg) was more common in the AOBP group than in the conventional group (22% vs 7%, respectively; P =.001).2 Review of conventional BP measurements indicated that 11 patients had systolic readings ≥ 180 mm Hg, 2 had diastolic readings ≥ 110 mm Hg, and 1 had a reading that was ≥ 180/110 mm Hg. AOBP measurements indicated that these 14 patients had SBP readings < 180 mm Hg and DBP readings < 110 mm Hg. The use of AOBP measurements may have mitigated unnecessary emergency room visits for these patients.
On review of clinic notes and actions associated with episodes of AOBP testing during routine follow-up clinic appointments, AOBP was determined to be useful with regard to clinical decision-making for 65 (79%) patients. Impacts of AOBP inclusion vs conventional BP assessments included clinician notation of AOBP, support for making changes that would have been considered based on conventional BP assessment. AOBP results gave support to forgoing a therapeutic intervention (ie, therapy addition or intensification) that may have been pursued based on conventional BP measurements in 25 of 82 patients (30%). These data suggest that AOBP readings can be useful and actionable by clinicians.
DISCUSSION
The findings of this study add to the growing evidence regarding AOBP use, application, and advantages in clinical practice. In this evaluation, the mean difference in SBP and DBP was 14.6 mm Hg and 3.5 mm Hg, respectively, from the conventional office measurements to the AOBP measurements. This difference is similar to that reported by the CAMBO trial and other evaluations, where the use of AOBP measurements corresponded to a reduction in SBP of between 10 and 20 mm Hg vs conventional measures.5,11-18
These findings showed a significantly higher percentage of controlled BP values (< 130/80 mm Hg) with AOBP values compared with conventional office measurements. The data supported the decision to defer antihypertensive therapy intervention in 30% of patients. Without AOBP data, patients may have been classified as uncontrolled, prompting therapy addition or intensification that could increase the risk of adverse events. Additionally, 14 patients would have met the criteria for hypertensive urgency under the guidelines at that time.2 With the use of AOBP readings, none of these patients were identified as having a hypertensive urgency, and they avoided an acute care referral or urgent intervention.
The discrepancy between AOBP and conventional office BP measurements suggested a white coat effect based on SBP and DBP readings in 22 (23%) and 21 (22%) patients, respectively. Practice guidelines recommend ABPM to mitigate a potential white coat effect.2-4 However, ABPM can be inconvenient for patients, as they need to travel to and from the clinic for fitting and removal (assuming that a facility has the device available for patient use). In addition, some patients may find it uncomfortable. Based on the correlation between AOBP and awake ABPM values, AOBP represents a feasible way to identify a white coat effect.
AOBP monitoring does not appear to be affected by the type of practice setting, as it has been evaluated in a variety of locations, including community-based pharmacies, primary care offices, and waiting rooms.12,19-22 However, potential AOBP implementation challenges may include office space constraints, clinician perception that it will delay workflow, and device cost. Costs associated with an AOBP meter vary widely based on device and procurement source, but have been estimated to range from $650 to > $2000.23 Published reports have described how to overcome AOBP implementation barriers.24,25
Limitations
The results of this evaluation should be interpreted cautiously due to several limitations. First, the retrospective study was conducted at a single clinic that may not be representative of other Veterans Health Administration or community-based populations. In addition, patient data such as age, sex, and body mass index were not available. AOBP measurements were obtained at the discretion of the clinician and not according to a prespecified protocol.
Conclusions
This analysis showed AOBP measurement leads to a greater percentage of controlled BP values compared with conventional office BP measurement, positioning it as a way to reduce BP misclassification, prevent potentially unnecessary therapeutic interventions, and mitigate the white coat effect.
- Cheng S, Claggett B, Correia AW, et al. Temporal Trends in the Population Attributable Risk for Cardiovascular Disease: The Atherosclerosis Risk in Communities Study. Circulation. 2014;130:820-828. doi.org/10.1161/CIRCULATIONAHA.113.008506
- Whelton PK, Carey RM, Aronow WS, et al. 2017 ACC/AHA/AAPA/ABC/ACPM/AGS/APhA/ASH/ASPC/NMA/PCNA guideline for the prevention, detection, evaluation, and management of high blood pressure in adults: a report of the American College of Cardiology/American Heart Association Task Force on Clinical Practice Guidelines. Hypertension. 2018;71(6):1269-1324. doi:10.1161/HYP.0000000000000066
- Leung AA, Daskalopoulou SS, Dasgupta K, et al. Hypertension Canada’s 2017 guidelines for diagnosis, risk assessment, prevention, and treatment of hypertension in adults. Can J Cardiol. 2017;33(5):557-576. doi:10.1016/j.cjca.2017.03.005
- Williams B, Mancia G, Spiering W, et al. 2018 ESC/ESH guidelines for the management of arterial hypertension. Eur Heart J. 2018;39(33):3021-3104. doi:10.1093/eurheartj/ehy339
- Pappaccogli M, Di Monaco S, Perlo E, et al. Comparison of automated office blood pressure with office and out-off-office measurement techniques. Hypertension. 2019;73(2):481-490. doi:10.1161/HYPERTENSIONAHA.118.12079
- Roerecke M, Kaczorowski J, Myers MG. Comparing automated office blood pressure readings with other methods of blood pressure measurement for identifying patients with possible hypertension - a systematic review and meta-analysis. JAMA Intern Med. 2019;179:351-362. doi:10.1001/jamainternmed.2018.6551
- Kaczorowski J, Chambers LW, Karwalajtys T, et al. Cardiovascular Health Awareness Program (CHAP): a community cluster-randomised trial among elderly Canadians. Prev Med. 2008;46(6):537-544. doi:10.1016/j.ypmed.2008.02.005
- SPRINT Research Group. A randomized trial of intensive versus standard blood-pressure control. N Engl J Med. 2015;373(22):2103-2116. doi:10.1056/NEJMoa1511939
- Andreadis EA, Agaliotis GD, Angelopoulos ET, et al. Automated office blood pressure and 24-h ambulatory measurements are equally associated with left ventricular mass index. Am J Hypertens. 2011;24(6):661-666. doi:10.1038/ajh.2011.38
- Campbell NRC, McKay DW, Conradson H, et al. Automated oscillometric blood pressure versus auscultatory blood pressure as a predictor of carotid intima-medial thickness in male firefighters. J Hum Hypertens. 2007;21(7):588-590. doi:10.1038/sj.jhh.1002190
- Myers MG, Godwin M, Dawes M et al. Conventional versus automated measurement of blood pressure in primary care patients with systolic hypertension: randomised parallel design controlled trial. BMJ. 2011;342:d286. doi:10.1136/bmj.d286
- Beckett L, Godwin M. The BpTRU automatic blood pressure monitor compared to 24 hour ambulatory blood pressure monitoring in the assessment of blood pressure in patients with hypertension. BMC Cardiovasc Disord. 2005;5(1):18. doi:10.1186/1471-2261-5-18
- Myers MG, Valdivieso M, Kiss A. Use of automated office blood pressure measurement to reduce the white coat response. J Hypertens. 2009;27(2):280-286. doi:10.1097/HJH.0b013e32831b9e6b
- Myers MG, Valdivieso M, Kiss A. Consistent relationship between automated office blood pressure recorded in different settings. Blood Press Monit. 2009;14(3):108-111. doi:10.1097/MBP.0b013e32832c5167
- Myers MG, Valdivieso M, Kiss A. Optimum frequency of office blood pressure measurement using an automated sphygmomanometer. Blood Press Monit. 2008;13(6):333-338. doi:10.1097/MBP.0b013e3283104247
- Myers MG. A proposed algorithm for diagnosing hypertension using automated office blood pressure measurement. J Hypertens. 2010;28(4):703-708. doi:10.1097/HJH.0b013e328335d091
- Godwin M, Birtwhistle R, Delva D, et al. Manual and automated office measurements in relation to awake ambulatory blood pressure monitoring. Fam Pract. 2011;28(1):110-117. doi:10.1093/fampra/cmq067
- Myers MG, Valdivieso M, Chessman M, Kiss A. Can sphygmomanometers designed for self-measurement of blood pressure in the home be used in office practice? Blood Press Monit. 2010;15(6):300-304. doi:10.1097/MBP.0b013e328340d128
- Leung AA, Nerenberg K, Daskalopoulou SS, et al. Hypertension Canada’s 2016 Canadian hypertension education program guidelines for blood pressure measurement, diagnosis, assessment of risk, prevention, and treatment of hypertension. Can J Cardiol. 2016;32(5):569-588. doi:10.1016/j.cjca.2016.02.066
- Myers MG. A short history of automated office blood pressure - 15 years to SPRINT. J Clin Hypertens (Greenwich). 2016;18(8):721-724. doi:10.1111/jch.12820
- Myers MG, Kaczorowski J, Dawes M, Godwin M. Automated office blood pressure measurement in primary care. Can Fam Physician. 2014;60(2):127-132.
- Armstrong D, Matangi M, Brouillard D, Myers MG. Automated office blood pressure - being alone and not location is what matters most. Blood Press Monit. 2015;20(4):204-208. doi:10.1097/MBP.0000000000000133
- Yarows SA. What is the Cost of Measuring a Blood Pressure? Ann Clin Hypertens. 2018;2:59-66. doi:10.29328/journal.ach.1001012
- Cabana MD, Rand CS, Powe NR, et al. Why don’t physicians follow clinical practice guidelines? A framework for improvement. JAMA. 1999;282(15):1458-1465. doi:10.1001/jama.282.15.1458
- Doane J, Buu J, Penrod MJ, et al. Measuring and managing blood pressure in a primary care setting: a pragmatic implementation study. J Am Board Fam Med. 2018;31(3):375-388. doi:10.3122/jabfm.2018.03.170450
Hypertension remains one of the most important modifiable risk factors for the prevention of cardiovascular (CV) events. According to a population-based study, 25% of CV events (CV death, heart disease, coronary revascularization, stroke, or heart failure) are attributable to hypertension.1 Recent guidelines have emphasized the importance of accurate blood pressure (BP) measurement in facilitating appropriate hypertension diagnosis and management.2-4
Currently, there are different BP measurement methods endorsed by practice guidelines. These include conventional in-office measurement, 24-hour ambulatory BP monitoring (ABPM), home BP monitoring (HBPM), and automated office BP (AOBP) measurement.2-4 AOBP device protocols vary but generally involve devices automatically taking multiple BP measurements while the patient is unattended. These measurements are then presented as a single averaged reading, with individual BP values available for review by the clinician.
Researchers have found that AOBP measurements have a greater association with ABPM values and can mitigate the white coat effect observed in a substantial proportion of patients during in-clinic BP measurement.5 A meta-analysis found that the use of AOBP was associated with a 10.5 mm Hg reduction in systolic BP (SBP) compared with traditional office-based BP assessments.5 Similarly, a separate meta-analysis found that AOBP SBP measures were on average 14.5 mm Hg lower than routine office or research setting values.6 In addition, CV risk outcomes data support the use of AOBP to screen and manage patients with hypertension. The Cardiovascular Health Awareness Program (CHAP) study used AOBP values to determine the risk for CV events (myocardial infarction, congestive heart failure, and stroke) in community-based patients aged ≥ 65 years.7 The study showed a significantly higher risk of CV events in patients with an SBP of 135 to 144 mm Hg and a diastolic BP (DBP) of 80 to 89 mm Hg. Therefore, the CHAP study researchers suggested an AOBP target of < 135/85 mm Hg to decrease the risk of CV events.7The landmark SPRINT trial, which was a major contributor to the development of BP target recommendations in guidelines, utilized AOBP to classify hypertension and guide management.2-4,8 SPRINT ultimately showed that intensive BP-lowering treatment (to SBP < 120 mm Hg) was associated with a 25% reduction in major CV events and a 27% reduction in all-cause mortality.8 Other evaluations found a close association between AOBP values and left ventricular mass index and carotid artery wall thickness as surrogate markers for end-organ damage.9,10 These data show AOBP as a reliable method to guide antihypertensive therapy interventions in the clinical setting.
Considering these proposed advantages, the 2017 Canadian guidelines for hypertension management recommend AOBP as the preferred method for clinic-based BP measurement, and the 2018 European Society of Cardiology/European Society of Hypertension blood pressure guidelines recommend the use of AOBP when feasible.3,4 The 2017 American College of Cardiology/American Heart Association Guideline for the Prevention, Detection, Evaluation, and Management of High Blood Pressure in Adults also discusses AOBP as a method to minimize potential confounders in BP values.2
This study evaluated the difference between AOBP and conventional in-office BP measurements obtained during cardiology clinic visits at the West Palm Beach Veterans Affairs Medical Center (WPBVAMC).
METHODS
A retrospective review of AOBP measurements was performed at the WPBVAMC cardiology clinic between May 26, 2017, and February 19, 2019. These AOBP measurements were taken at the discretion of a nurse or other clinician after initial, conventional BP measurements had been taken as part of clinic check-in procedures. No formal protocols dictated the use or timing of AOBP measurements. Similarly, the AOBP results were factored into clinical care decisions.
Clinicians at the cardiology clinic used AOBP averages that were derived using the BpTRU BPM-100 (BpTRU Medical Devices) meter, which averaged 5 BP readings taken at 1-minute intervals. Clinicians selected cuff size based on manufacturer recommendations. The testing was done with the patient seated alone in either a nursing triage area or a clinic office.
Data collected during the retrospective review included the clinician associated with the visit, the patient’s physical location and accompaniment status during AOBP measurement, conventionally measured BP and heart rates, and AOBP-derived BP and heart rate averages. Differences in BP values were compared with the paired t test, while binary comparisons were conducted through the McNemar test. Data collection and analysis were performed using Microsoft Excel.
During data collection, all information was stored in a secure drive accessible only to the investigators. The project was approved by the West Palm Beach Veterans Affairs Healthcare System Research and Development Committee as a nonresearch activity in accordance with Veterans Health Administration Handbook 1058.05; thus, institutional review board approval was not required.
RESULTS
Ninety-five nonconsecutive patients were included in the analysis. AOBP measurements were taken with the patient sitting alone in either a clinic office (n = 83) or nursing triage area (n = 12). Most patients were coming in for follow-up appointments; 13 patients (14%) had appointments related to a 24-hour ABPM session.
The mean SBP and DBP values were lower for the AOBP measurements vs the conventional BP measurements (mean SBP difference, 14.6 mm Hg; P < .001; mean DBP difference, 3.5 mm Hg; P = .0002) (Table). There were no appreciable differences in heart rates. The white coat effect was suggested based on an SBP reduction of > 20 mm Hg from conventional to AOBP measurements in 22 patients (23%), a DBP reduction of > 10 mm Hg in 21 patients (22%), and a reduction in both values in 8 patients (8%).
A controlled BP (< 130/80 mm Hg) was more common in the AOBP group than in the conventional group (22% vs 7%, respectively; P =.001).2 Review of conventional BP measurements indicated that 11 patients had systolic readings ≥ 180 mm Hg, 2 had diastolic readings ≥ 110 mm Hg, and 1 had a reading that was ≥ 180/110 mm Hg. AOBP measurements indicated that these 14 patients had SBP readings < 180 mm Hg and DBP readings < 110 mm Hg. The use of AOBP measurements may have mitigated unnecessary emergency room visits for these patients.
On review of clinic notes and actions associated with episodes of AOBP testing during routine follow-up clinic appointments, AOBP was determined to be useful with regard to clinical decision-making for 65 (79%) patients. Impacts of AOBP inclusion vs conventional BP assessments included clinician notation of AOBP, support for making changes that would have been considered based on conventional BP assessment. AOBP results gave support to forgoing a therapeutic intervention (ie, therapy addition or intensification) that may have been pursued based on conventional BP measurements in 25 of 82 patients (30%). These data suggest that AOBP readings can be useful and actionable by clinicians.
DISCUSSION
The findings of this study add to the growing evidence regarding AOBP use, application, and advantages in clinical practice. In this evaluation, the mean difference in SBP and DBP was 14.6 mm Hg and 3.5 mm Hg, respectively, from the conventional office measurements to the AOBP measurements. This difference is similar to that reported by the CAMBO trial and other evaluations, where the use of AOBP measurements corresponded to a reduction in SBP of between 10 and 20 mm Hg vs conventional measures.5,11-18
These findings showed a significantly higher percentage of controlled BP values (< 130/80 mm Hg) with AOBP values compared with conventional office measurements. The data supported the decision to defer antihypertensive therapy intervention in 30% of patients. Without AOBP data, patients may have been classified as uncontrolled, prompting therapy addition or intensification that could increase the risk of adverse events. Additionally, 14 patients would have met the criteria for hypertensive urgency under the guidelines at that time.2 With the use of AOBP readings, none of these patients were identified as having a hypertensive urgency, and they avoided an acute care referral or urgent intervention.
The discrepancy between AOBP and conventional office BP measurements suggested a white coat effect based on SBP and DBP readings in 22 (23%) and 21 (22%) patients, respectively. Practice guidelines recommend ABPM to mitigate a potential white coat effect.2-4 However, ABPM can be inconvenient for patients, as they need to travel to and from the clinic for fitting and removal (assuming that a facility has the device available for patient use). In addition, some patients may find it uncomfortable. Based on the correlation between AOBP and awake ABPM values, AOBP represents a feasible way to identify a white coat effect.
AOBP monitoring does not appear to be affected by the type of practice setting, as it has been evaluated in a variety of locations, including community-based pharmacies, primary care offices, and waiting rooms.12,19-22 However, potential AOBP implementation challenges may include office space constraints, clinician perception that it will delay workflow, and device cost. Costs associated with an AOBP meter vary widely based on device and procurement source, but have been estimated to range from $650 to > $2000.23 Published reports have described how to overcome AOBP implementation barriers.24,25
Limitations
The results of this evaluation should be interpreted cautiously due to several limitations. First, the retrospective study was conducted at a single clinic that may not be representative of other Veterans Health Administration or community-based populations. In addition, patient data such as age, sex, and body mass index were not available. AOBP measurements were obtained at the discretion of the clinician and not according to a prespecified protocol.
Conclusions
This analysis showed AOBP measurement leads to a greater percentage of controlled BP values compared with conventional office BP measurement, positioning it as a way to reduce BP misclassification, prevent potentially unnecessary therapeutic interventions, and mitigate the white coat effect.
- Cheng S, Claggett B, Correia AW, et al. Temporal Trends in the Population Attributable Risk for Cardiovascular Disease: The Atherosclerosis Risk in Communities Study. Circulation. 2014;130:820-828. doi.org/10.1161/CIRCULATIONAHA.113.008506
- Whelton PK, Carey RM, Aronow WS, et al. 2017 ACC/AHA/AAPA/ABC/ACPM/AGS/APhA/ASH/ASPC/NMA/PCNA guideline for the prevention, detection, evaluation, and management of high blood pressure in adults: a report of the American College of Cardiology/American Heart Association Task Force on Clinical Practice Guidelines. Hypertension. 2018;71(6):1269-1324. doi:10.1161/HYP.0000000000000066
- Leung AA, Daskalopoulou SS, Dasgupta K, et al. Hypertension Canada’s 2017 guidelines for diagnosis, risk assessment, prevention, and treatment of hypertension in adults. Can J Cardiol. 2017;33(5):557-576. doi:10.1016/j.cjca.2017.03.005
- Williams B, Mancia G, Spiering W, et al. 2018 ESC/ESH guidelines for the management of arterial hypertension. Eur Heart J. 2018;39(33):3021-3104. doi:10.1093/eurheartj/ehy339
- Pappaccogli M, Di Monaco S, Perlo E, et al. Comparison of automated office blood pressure with office and out-off-office measurement techniques. Hypertension. 2019;73(2):481-490. doi:10.1161/HYPERTENSIONAHA.118.12079
- Roerecke M, Kaczorowski J, Myers MG. Comparing automated office blood pressure readings with other methods of blood pressure measurement for identifying patients with possible hypertension - a systematic review and meta-analysis. JAMA Intern Med. 2019;179:351-362. doi:10.1001/jamainternmed.2018.6551
- Kaczorowski J, Chambers LW, Karwalajtys T, et al. Cardiovascular Health Awareness Program (CHAP): a community cluster-randomised trial among elderly Canadians. Prev Med. 2008;46(6):537-544. doi:10.1016/j.ypmed.2008.02.005
- SPRINT Research Group. A randomized trial of intensive versus standard blood-pressure control. N Engl J Med. 2015;373(22):2103-2116. doi:10.1056/NEJMoa1511939
- Andreadis EA, Agaliotis GD, Angelopoulos ET, et al. Automated office blood pressure and 24-h ambulatory measurements are equally associated with left ventricular mass index. Am J Hypertens. 2011;24(6):661-666. doi:10.1038/ajh.2011.38
- Campbell NRC, McKay DW, Conradson H, et al. Automated oscillometric blood pressure versus auscultatory blood pressure as a predictor of carotid intima-medial thickness in male firefighters. J Hum Hypertens. 2007;21(7):588-590. doi:10.1038/sj.jhh.1002190
- Myers MG, Godwin M, Dawes M et al. Conventional versus automated measurement of blood pressure in primary care patients with systolic hypertension: randomised parallel design controlled trial. BMJ. 2011;342:d286. doi:10.1136/bmj.d286
- Beckett L, Godwin M. The BpTRU automatic blood pressure monitor compared to 24 hour ambulatory blood pressure monitoring in the assessment of blood pressure in patients with hypertension. BMC Cardiovasc Disord. 2005;5(1):18. doi:10.1186/1471-2261-5-18
- Myers MG, Valdivieso M, Kiss A. Use of automated office blood pressure measurement to reduce the white coat response. J Hypertens. 2009;27(2):280-286. doi:10.1097/HJH.0b013e32831b9e6b
- Myers MG, Valdivieso M, Kiss A. Consistent relationship between automated office blood pressure recorded in different settings. Blood Press Monit. 2009;14(3):108-111. doi:10.1097/MBP.0b013e32832c5167
- Myers MG, Valdivieso M, Kiss A. Optimum frequency of office blood pressure measurement using an automated sphygmomanometer. Blood Press Monit. 2008;13(6):333-338. doi:10.1097/MBP.0b013e3283104247
- Myers MG. A proposed algorithm for diagnosing hypertension using automated office blood pressure measurement. J Hypertens. 2010;28(4):703-708. doi:10.1097/HJH.0b013e328335d091
- Godwin M, Birtwhistle R, Delva D, et al. Manual and automated office measurements in relation to awake ambulatory blood pressure monitoring. Fam Pract. 2011;28(1):110-117. doi:10.1093/fampra/cmq067
- Myers MG, Valdivieso M, Chessman M, Kiss A. Can sphygmomanometers designed for self-measurement of blood pressure in the home be used in office practice? Blood Press Monit. 2010;15(6):300-304. doi:10.1097/MBP.0b013e328340d128
- Leung AA, Nerenberg K, Daskalopoulou SS, et al. Hypertension Canada’s 2016 Canadian hypertension education program guidelines for blood pressure measurement, diagnosis, assessment of risk, prevention, and treatment of hypertension. Can J Cardiol. 2016;32(5):569-588. doi:10.1016/j.cjca.2016.02.066
- Myers MG. A short history of automated office blood pressure - 15 years to SPRINT. J Clin Hypertens (Greenwich). 2016;18(8):721-724. doi:10.1111/jch.12820
- Myers MG, Kaczorowski J, Dawes M, Godwin M. Automated office blood pressure measurement in primary care. Can Fam Physician. 2014;60(2):127-132.
- Armstrong D, Matangi M, Brouillard D, Myers MG. Automated office blood pressure - being alone and not location is what matters most. Blood Press Monit. 2015;20(4):204-208. doi:10.1097/MBP.0000000000000133
- Yarows SA. What is the Cost of Measuring a Blood Pressure? Ann Clin Hypertens. 2018;2:59-66. doi:10.29328/journal.ach.1001012
- Cabana MD, Rand CS, Powe NR, et al. Why don’t physicians follow clinical practice guidelines? A framework for improvement. JAMA. 1999;282(15):1458-1465. doi:10.1001/jama.282.15.1458
- Doane J, Buu J, Penrod MJ, et al. Measuring and managing blood pressure in a primary care setting: a pragmatic implementation study. J Am Board Fam Med. 2018;31(3):375-388. doi:10.3122/jabfm.2018.03.170450
Assessment of Automated vs Conventional Blood Pressure Measurements in a Veterans Affairs Clinical Practice Setting
Assessment of Automated vs Conventional Blood Pressure Measurements in a Veterans Affairs Clinical Practice Setting

Anticoagulation Stewardship Efforts Via Indication Reviews at a Veterans Affairs Health Care System
Anticoagulation Stewardship Efforts Via Indication Reviews at a Veterans Affairs Health Care System
Due to the underlying mechanism of atrial fibrillation (Afib), clots can form within the left atrial appendage. Clots that become dislodged may lead to ischemic stroke and possibly death. The 2023 guidelines for atrial fibrillation from the American College of Cardiology and American Heart Association recommend anticoagulation therapy for patients with an Afib diagnosis and a CHA2DS2-VASc (congestive heart failure, hypertension, age ≥ 75 years, diabetes, stroke/vascular disease, age 65 to 74 years, and female sex) score pertinent for ≥ 1 non–sex-related factor (score ≥ 2 for women; ≥ 1 for men) to prevent stroke-related complications. The CHA2DS2-VASc score is a 9-point scoring tool based on comorbidities and conditions that increase risk of stroke in patients with Afib. Each value correlates to an annualized stroke risk percentage that increases as the score increases.
In clinical practice, patients meeting these thresholds are indicated for anticoagulation and are considered for indefinite use unless ≥ 1 of the following conditions are present: bleeding risk outweighs the stroke prevention benefit, Afib is episodic (< 48 hours) or a nonpharmacologic intervention, such as a left atrial appendage occlusion (LAAO) device is present.1
In patients with a diagnosed venous thromboembolism (VTE), such as deep vein thrombosis or pulmonary embolism, anticoagulation is used to treat the current thrombosis and prevent embolization that can ultimately lead to death. The 2021 guideline for VTE from the American College of Chest Physicians identifies certain risk factors that increase risk for VTE and categorizes them as transient or persistent. Transient risk factors include hospitalization > 3 days, major trauma, surgery, cast immobilization, hormone therapy, pregnancy, or prolonged travel > 8 hours. Persistent risk factors include malignancy, thrombophilia, and certain medications.
The guideline recommends therapy durations based on event frequency, the presence and classification of provoking risk factors, and bleeding risk. As the risk of recurrent thrombosis and other potential complications is greatest in the first 3 to 6 months after a diagnosed event, at least 3 months anticoagulation therapy is recommended following VTE diagnosis. At the 3-month mark, all regimens are suggested to be re-evaluated and considered for extended treatment duration if the event was unprovoked, recurrent, secondary to a persistent risk factor, or low bleed risk.2Anticoagulation is an important guideline-recommended pharmacologic intervention for various disease states, although its use is not without risks. The Institute for Safe Medication Practices has classified oral anticoagulants as high-alert medications. This designation was made because anticoagulant medications have the potential to cause harm when used or omitted in error and lead to life-threatening bleed or thrombotic complications.3Anticoagulation stewardship ensures that anticoagulation therapy is appropriately initiated, maintained, and discontinued when indicated. Because of the potential for harm, anticoagulation stewardship is an important part of Afib and VTE management. Pharmacists can help verify and evaluate anticoagulation therapies. Research suggests that pharmacist-led anticoagulation stewardship efforts may play a role in ensuring safer patient outcomes.4The purpose of this quality improvement (QI) study was to implement pharmacist-led anticoagulation stewardship practices at Veterans Affairs Phoenix Health Care System (VAPHCS) to identify veterans with Afib not currently on anticoagulation, as well as to identify veterans with a history of VTE events who have completed a sufficient treatment duration.
Methods
Anticoagulation stewardship efforts were implemented in 2 cohorts of patients: those with Afib who may be indicated to initiate anticoagulation, and those with a history of VTE events who may be indicated to consider anticoagulation discontinuation. Patient records were reviewed using a standardized note template, and recommendations to either initiate or discontinue anticoagulation therapy were documented. The VAPHCS Research Service reviewed this study and determined that it was not research and was exempt from institutional review board review.
Atrial Fibrillation Cohort
A population health dashboard created by the Stroke Prevention in Atrial Fibrillation/Flutter Targeting the uNTreated: a focus on health care disparities (SPAFF-TNT-D) national VA study team was used to identify veterans at VAPHCS with a diagnosis of Afib without an active VA prescription for an anticoagulant. The dashboard filtered and produced data points from the medical record that correlated to the components of the CHA2DS2-VASc score. All veterans identified by the dashboard with scores of 7 or 8 were included. No patients had a score of 9. Comprehensive chart reviews of available VA and non–VA-provided care records were conducted by the investigators, and a standardized note template designed by the SPAFF-TNT-D team (eAppendix 1) was used to document findings within the electronic health record (EHR). If anticoagulation was deemed to be indicated, the assigned primary care practitioner (PCP) as listed in the EHR was alerted to the note by the investigators for further evaluation and consideration of prescribing anticoagulation.
Venous Thromboembolism Cohort
VAPHCS pharmacy informatics pulled data that included veterans with documented VTE and an active VA anticoagulant prescription between November 2022 and November 2023. Veterans were reviewed in chronological order based on when the anticoagulant prescription was written. All veterans were included until an equal number of charts were reviewed in both the Afib and VTE cohorts. Comprehensive chart review of available VA- and non–VA-provided care records was conducted by the investigators, and a standardized note template as designed by the investigators (eAppendix 2) was used to document findings within the EHR. If the duration of anticoagulation therapy was deemed sufficient, the assigned anticoagulation clinical pharmacist practitioner (CPP) was alerted to the note by the investigators for further evaluation and consideration of discontinuing anticoagulation.
EHR reviews were conducted in October and November 2023 and lasted about 10 to 20 minutes per patient. To evaluate completeness and accuracy of the documented findings within the EHR, both investigators reviewed and cosigned the completed note template and verified the correct PCP was alerted to the recommendation for appropriate continuity of care. Results were reviewed in March 2024.
Outcomes
Atrial fibrillation cohort. The primary outcome was the number of veterans with Afib who were recommended to start anticoagulation therapy. Additional outcomes evaluated included the number of interventions completed, action taken by PCPs in response to the provided recommendation, and reasons provided by the investigators for not recommending initiation of anticoagulation therapy in specific veteran cases.
Venous thromboembolism cohort. The primary outcome was the number of veterans with a history of VTE events recommended to discontinue anticoagulation therapy. Additional outcomes included number of interventions completed, action taken by the anticoagulation CPP in response to the provided recommendation, and reasons provided by the investigators for not recommending discontinuation of anticoagulation therapy in specific veteran cases.
Analysis
Sample size was determined by the inclusion criteria and was not designed to attain statistical power. Data embedded in the Afib cohort standardized note template, also known as health factors, were later used for data analysis. Recommendations in the VTE cohort were manually tracked and recorded by the investigators. Results for this study were analyzed using descriptive statistics.
Results
A total of 114 veterans were reviewed and included in this study: 57 in each cohort. Seven recommendations were made regarding anticoagulation initiation for patients with Afib and 7 were made for anticoagulation discontinuation for patients with VTE (Table 1).
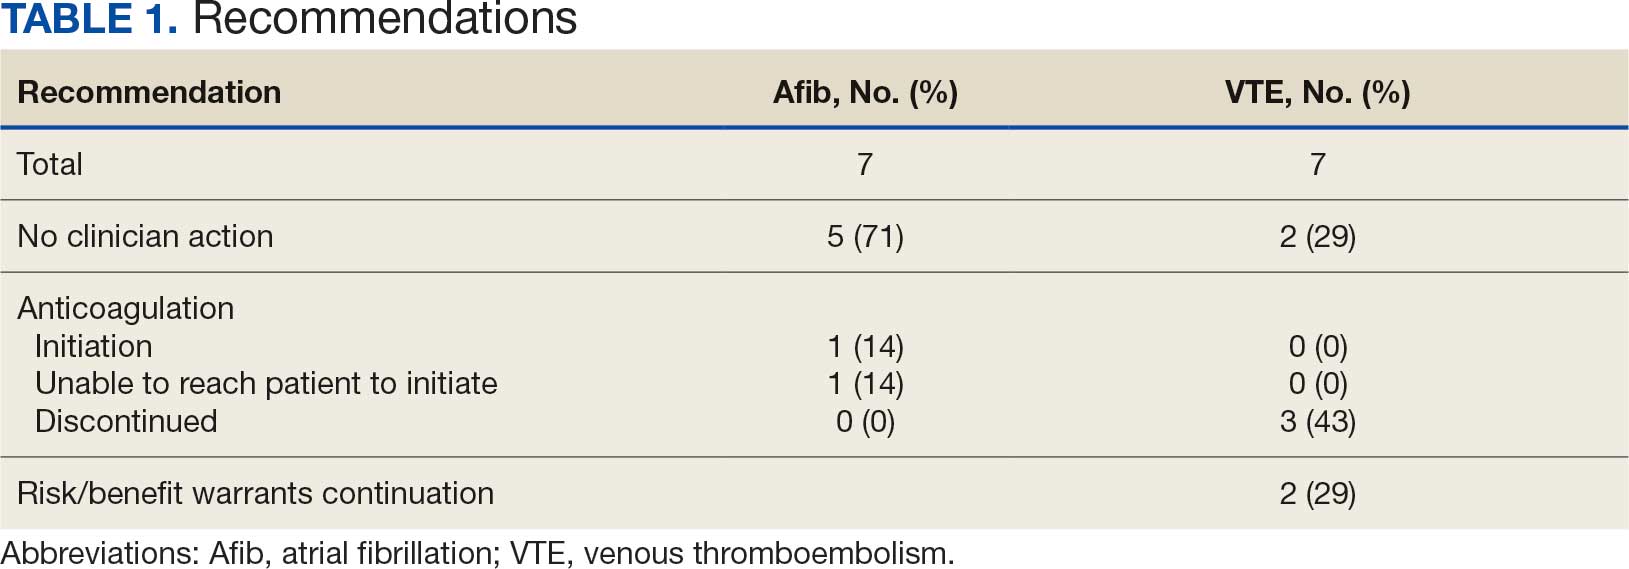
In the Afib cohort, 1 veteran was successfully initiated on anticoagulation therapy and 1 veteran was deemed appropriate for initiation of anticoagulation but was not reachable. Of the 5 recommendations with no action taken, 4 PCPs acknowledged the alert with no further documentation, and 1 PCP deferred the decision to cardiology with no further documentation. In the VTE cohort, 3 veterans successfully discontinued anticoagulation therapy and 2 veterans were further evaluated by the anticoagulation CPP and deemed appropriate to continue therapy based on potential for malignancy. Of the 2 recommendations with no action taken, 1 anticoagulation CPP acknowledged the alert with no further documentation and 1 anticoagulation CPP suggested further evaluation by PCP with no further documentation.
In the Afib cohort, a nonpharmacologic approach was defined as documentation of a LAAO device. An inaccurate diagnosis was defined as an Afib diagnosis being used in a previous visit, although there was no further confirmation of diagnosis via chart review. Veterans classified as already being on anticoagulation had documentation of non–VA-written anticoagulant prescriptions or receiving a supply of anticoagulants from a facility such as a nursing home. Anticoagulation was defined as unfavorable if a documented risk/benefit conversation was found via EHR review. Anticoagulation was defined as not indicated if the Afib was documented as transient, episodic, or historical (Table 2).
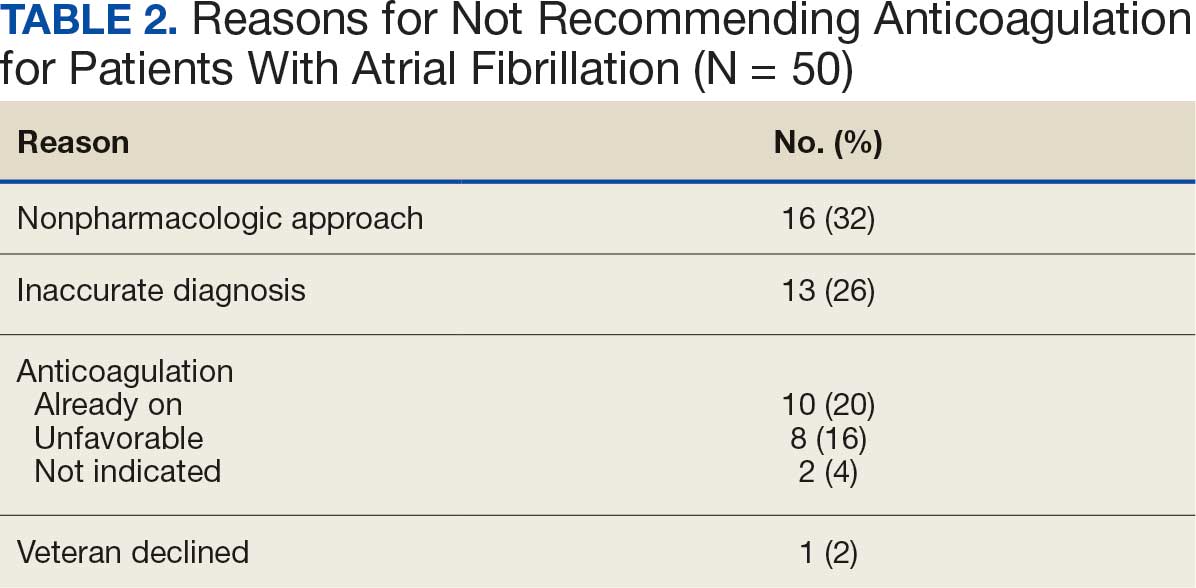
In the VTE cohort, no recommendations for discontinuation were made for veterans indicated to continue anticoagulation due to a concurrent Afib diagnosis. Chronic or recurrent events were defined as documentation of multiple VTE events and associated dates in the EHR. Persistent risk factors included malignancy or medications contributing to hypercoagulable states. Thrombophilia was defined as having documentation of a diagnosis in the EHR. An unprovoked event was defined as VTE without any documented transient risk factors (eg, hospitalization, trauma, surgery, cast immobilization, hormone therapy, pregnancy, or prolonged travel). Anticoagulation had already been discontinued in 1 veteran after the data were collected but before chart review occurred (Table 3).
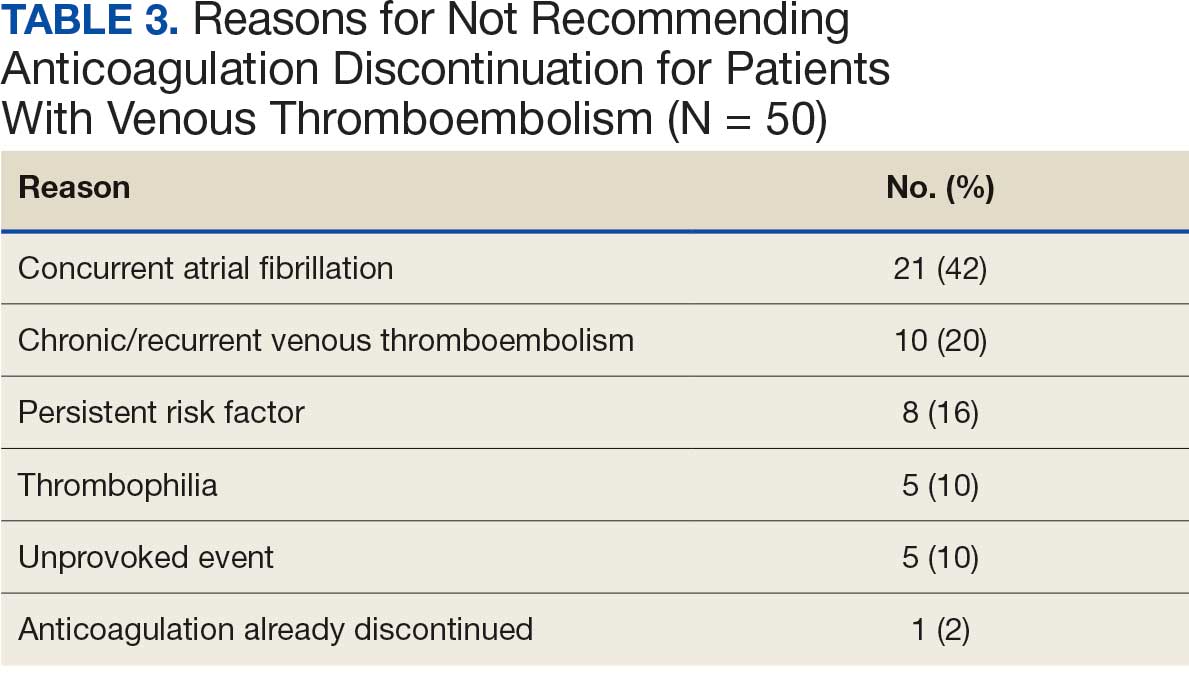
Discussion
Pharmacy-led indication reviews resulted in appropriate recommendations for anticoagulation use in veterans with Afib and a history of VTE events. Overall, 12.3% of chart reviews in each cohort resulted in a recommendation being made, which was similar to the rate found by Koolian et al.5 In that study, 10% of recommendations were related to initiation or interruption of anticoagulation. This recommendation category consisted of several subcategories, including “suggesting therapeutic anticoagulation when none is currently ordered” and “suggesting anticoagulation cessation if no longer indicated,” but specific numerical prevalence was not provided.5
Online dashboard use allowed for greater population health management and identification of veterans with Afib who were not on active anticoagulation, providing opportunities to prevent stroke-related complications. Wang et al completed a similarly designed study that included a population health tool to identify patients with Afib who were not on anticoagulation and implemented pharmacist-led chart review and facilitation of recommendations to the responsible clinician. This study reviewed 1727 patients and recommended initiation of anticoagulation therapy for 75 (4.3%).6 The current study had a higher percentage of patients with recommendations for changes despite its smaller size.
Evaluating the duration of therapy for anticoagulation in veterans with a history of VTE events provided an opportunity to reduce unnecessary exposure to anticoagulation and minimize bleeding risks. Using a chart review process and standardized note template enabled the documentation of pertinent information that could be readily reviewed by the PCP. This process is a step toward ensuring VAPHCS PCPs provide guideline-recommended care and actively prevent stroke and bleeding complications. Adoption of this process into the current VAPHCS Anticoagulation Clinic workflow for review of veterans with either Afib or VTE could lead to more EHRs being reviewed and recommendations made, ultimately improving patient outcomes.
Therapeutic interventions based on the recommendations were completed for 1 of 7 veterans (14%) and 3 of 7 veterans (43%) in the Afib and VTE cohorts, respectively. The prevalence of completed interventions in this anticoagulation stewardship study was higher than those in Wang et al, who found only 9% of their recommendations resulted in PCPs considering action related to anticoagulation, and only 4% were successfully initiated.6
In the Afib cohort, veterans identified by the dashboard with a CHA2DS2-VASc of 7 or 8 were prioritized for review. Reviewing these veterans ensured that patients with the highest stroke risk were sufficiently evaluated and started on anticoagulation as needed to reduce stroke-related complications. In contrast, because these veterans had higher CHA2DS2-VASc scores, they may have already been evaluated for anticoagulation in the past and had a documented rationale for not being placed on anticoagulation (LAAO device placement was the most common rationale). Focusing on veterans with a lower CHA2DS2-VASc score such as 1 for men or 2 for women could potentially include more opportunities for recommendations. Although stroke risk may be lower in this population compared with those with higher CHA2DS2-VASc scores, guideline-recommended anticoagulation use may be missed for these patients.
In the VTE cohort, veterans with an anticoagulant prescription written 12 months before data collection were prioritized for review. Reviewing these veterans ensured that anticoagulation therapy met guideline recommendations of at least 3 months, with potential for extended duration upon further evaluation by a provider at that time. Based on collected results, most veterans were already reevaluated and had documented reasons why anticoagulation was still indicated; concurrent Afib was most common followed by chronic or recurrent VTE. Reviewing veterans with more recent prescriptions just over the recommended 3-month duration could potentially include more opportunities for recommendations to be made. It is more likely that by 3 months another PCP had not already weighed in on the duration of therapy, and the anticoagulation CPP could ensure a thorough review is conducted with guideline-based recommendations.
Most published literature on anticoagulation stewardship efforts is focused on inpatient management and policy changes, or concentrate on attributes of therapy such as appropriate dosing and drug interactions. This study highlighted that gaps in care related to anticoagulation use and discontinuation are present in the VAPHCS population and can be appropriately addressed via pharmacist-led indication reviews. Future studies designed to focus on initiating anticoagulation where appropriate, and discontinuing where a sufficient treatment period has been completed, are warranted to minimize this gap in care and allow health systems to work toward process changes to ensure safe and optimized care is provided for the patients they serve.
Limitations
In the Afib cohort, 5 of 7 recommendations (71%) had no further action taken by the PCP, which may represent a barrier to care. In contrast, 2 of 7 recommendations (29%) had no further action in the VTE cohort. It is possible that the difference can be attributed to the anticoagulation CPP receiving VTE alerts and PCPs receiving Afib alerts. The anticoagulation CPP was familiar with this QI study and may have better understood the purpose of the chart review and the need to provide a timely response. PCPs may have been less likely to take action because they were unfamiliar with the anticoagulation stewardship initiative and standardized note template or overwhelmed by too many EHR alerts.
The lack of PCP response to a virtual alert or message also was observed by Wang et al, whereas Koolian et al reported higher intervention completion rates, with verbal recommendations being made to the responsible clinicians. To further ensure these pertinent recommendations for anticoagulation initiation in veterans with Afib are properly reviewed and evaluated, future research could include intentional follow-up with the PCP regarding the alert, PCP-specific education about the anticoagulation stewardship initiative and the role of the standardized note template, and collaboration with PCPs to identify alternative ways to relay recommendations in a way that would ensure the completion of appropriate and timely review.
Conclusions
This study identified gaps in care related to anticoagulation needs in the VAPHCS veteran population. Utilizing a standardized indication review process allows pharmacists to evaluate anticoagulant use for both appropriate indication and duration of therapy. Providing recommendations via chart review notes and alerting respective PCPs and CPPs results in veterans receiving safe and optimized care regarding their anticoagulation needs.
- Joglar JA, Chung MK, Armbruster AL, et al. 2023 ACC/AHA/ACCP/HRS guideline for the diagnosis and management of atrial fibrillation: a report of the American College of Cardiology/American Heart Association Joint Committee on Clinical Practice Guidelines. Circulation. 2024;149:e1-e156. doi:10.1161/CIR.0000000000001193
- Stevens SM, Woller SC, Kreuziger LB, et al. Antithrombotic therapy for VTE disease: second update of the CHEST guideline and expert panel report. Chest. 2021;160:e545-e608. doi:10.1016/j.chest.2021.07.055
- Institute for Safe Medication Practices (ISMP). List of high-alert medications in community/ambulatory care settings. ISMP. September 30, 2021. Accessed September 11, 2025. https://home.ecri.org/blogs/ismp-resources/high-alert-medications-in-community-ambulatory-care-settings
- Burnett AE, Barnes GD. A call to action for anticoagulation stewardship. Res Pract Thromb Haemost. 2022;6:e12757. doi:10.1002/rth2.12757
- Koolian M, Wiseman D, Mantzanis H, et al. Anticoagulation stewardship: descriptive analysis of a novel approach to appropriate anticoagulant prescription. Res Pract Thromb Haemost. 2022;6:e12758. doi:10.1002/rth2.12758
- Wang SV, Rogers JR, Jin Y, et al. Stepped-wedge randomised trial to evaluate population health intervention designed to increase appropriate anticoagulation in patients with atrial fibrillation. BMJ Qual Saf. 2019;28:835-842. doi:10.1136/bmjqs-2019-009367
Due to the underlying mechanism of atrial fibrillation (Afib), clots can form within the left atrial appendage. Clots that become dislodged may lead to ischemic stroke and possibly death. The 2023 guidelines for atrial fibrillation from the American College of Cardiology and American Heart Association recommend anticoagulation therapy for patients with an Afib diagnosis and a CHA2DS2-VASc (congestive heart failure, hypertension, age ≥ 75 years, diabetes, stroke/vascular disease, age 65 to 74 years, and female sex) score pertinent for ≥ 1 non–sex-related factor (score ≥ 2 for women; ≥ 1 for men) to prevent stroke-related complications. The CHA2DS2-VASc score is a 9-point scoring tool based on comorbidities and conditions that increase risk of stroke in patients with Afib. Each value correlates to an annualized stroke risk percentage that increases as the score increases.
In clinical practice, patients meeting these thresholds are indicated for anticoagulation and are considered for indefinite use unless ≥ 1 of the following conditions are present: bleeding risk outweighs the stroke prevention benefit, Afib is episodic (< 48 hours) or a nonpharmacologic intervention, such as a left atrial appendage occlusion (LAAO) device is present.1
In patients with a diagnosed venous thromboembolism (VTE), such as deep vein thrombosis or pulmonary embolism, anticoagulation is used to treat the current thrombosis and prevent embolization that can ultimately lead to death. The 2021 guideline for VTE from the American College of Chest Physicians identifies certain risk factors that increase risk for VTE and categorizes them as transient or persistent. Transient risk factors include hospitalization > 3 days, major trauma, surgery, cast immobilization, hormone therapy, pregnancy, or prolonged travel > 8 hours. Persistent risk factors include malignancy, thrombophilia, and certain medications.
The guideline recommends therapy durations based on event frequency, the presence and classification of provoking risk factors, and bleeding risk. As the risk of recurrent thrombosis and other potential complications is greatest in the first 3 to 6 months after a diagnosed event, at least 3 months anticoagulation therapy is recommended following VTE diagnosis. At the 3-month mark, all regimens are suggested to be re-evaluated and considered for extended treatment duration if the event was unprovoked, recurrent, secondary to a persistent risk factor, or low bleed risk.2Anticoagulation is an important guideline-recommended pharmacologic intervention for various disease states, although its use is not without risks. The Institute for Safe Medication Practices has classified oral anticoagulants as high-alert medications. This designation was made because anticoagulant medications have the potential to cause harm when used or omitted in error and lead to life-threatening bleed or thrombotic complications.3Anticoagulation stewardship ensures that anticoagulation therapy is appropriately initiated, maintained, and discontinued when indicated. Because of the potential for harm, anticoagulation stewardship is an important part of Afib and VTE management. Pharmacists can help verify and evaluate anticoagulation therapies. Research suggests that pharmacist-led anticoagulation stewardship efforts may play a role in ensuring safer patient outcomes.4The purpose of this quality improvement (QI) study was to implement pharmacist-led anticoagulation stewardship practices at Veterans Affairs Phoenix Health Care System (VAPHCS) to identify veterans with Afib not currently on anticoagulation, as well as to identify veterans with a history of VTE events who have completed a sufficient treatment duration.
Methods
Anticoagulation stewardship efforts were implemented in 2 cohorts of patients: those with Afib who may be indicated to initiate anticoagulation, and those with a history of VTE events who may be indicated to consider anticoagulation discontinuation. Patient records were reviewed using a standardized note template, and recommendations to either initiate or discontinue anticoagulation therapy were documented. The VAPHCS Research Service reviewed this study and determined that it was not research and was exempt from institutional review board review.
Atrial Fibrillation Cohort
A population health dashboard created by the Stroke Prevention in Atrial Fibrillation/Flutter Targeting the uNTreated: a focus on health care disparities (SPAFF-TNT-D) national VA study team was used to identify veterans at VAPHCS with a diagnosis of Afib without an active VA prescription for an anticoagulant. The dashboard filtered and produced data points from the medical record that correlated to the components of the CHA2DS2-VASc score. All veterans identified by the dashboard with scores of 7 or 8 were included. No patients had a score of 9. Comprehensive chart reviews of available VA and non–VA-provided care records were conducted by the investigators, and a standardized note template designed by the SPAFF-TNT-D team (eAppendix 1) was used to document findings within the electronic health record (EHR). If anticoagulation was deemed to be indicated, the assigned primary care practitioner (PCP) as listed in the EHR was alerted to the note by the investigators for further evaluation and consideration of prescribing anticoagulation.
Venous Thromboembolism Cohort
VAPHCS pharmacy informatics pulled data that included veterans with documented VTE and an active VA anticoagulant prescription between November 2022 and November 2023. Veterans were reviewed in chronological order based on when the anticoagulant prescription was written. All veterans were included until an equal number of charts were reviewed in both the Afib and VTE cohorts. Comprehensive chart review of available VA- and non–VA-provided care records was conducted by the investigators, and a standardized note template as designed by the investigators (eAppendix 2) was used to document findings within the EHR. If the duration of anticoagulation therapy was deemed sufficient, the assigned anticoagulation clinical pharmacist practitioner (CPP) was alerted to the note by the investigators for further evaluation and consideration of discontinuing anticoagulation.
EHR reviews were conducted in October and November 2023 and lasted about 10 to 20 minutes per patient. To evaluate completeness and accuracy of the documented findings within the EHR, both investigators reviewed and cosigned the completed note template and verified the correct PCP was alerted to the recommendation for appropriate continuity of care. Results were reviewed in March 2024.
Outcomes
Atrial fibrillation cohort. The primary outcome was the number of veterans with Afib who were recommended to start anticoagulation therapy. Additional outcomes evaluated included the number of interventions completed, action taken by PCPs in response to the provided recommendation, and reasons provided by the investigators for not recommending initiation of anticoagulation therapy in specific veteran cases.
Venous thromboembolism cohort. The primary outcome was the number of veterans with a history of VTE events recommended to discontinue anticoagulation therapy. Additional outcomes included number of interventions completed, action taken by the anticoagulation CPP in response to the provided recommendation, and reasons provided by the investigators for not recommending discontinuation of anticoagulation therapy in specific veteran cases.
Analysis
Sample size was determined by the inclusion criteria and was not designed to attain statistical power. Data embedded in the Afib cohort standardized note template, also known as health factors, were later used for data analysis. Recommendations in the VTE cohort were manually tracked and recorded by the investigators. Results for this study were analyzed using descriptive statistics.
Results
A total of 114 veterans were reviewed and included in this study: 57 in each cohort. Seven recommendations were made regarding anticoagulation initiation for patients with Afib and 7 were made for anticoagulation discontinuation for patients with VTE (Table 1).
In the Afib cohort, 1 veteran was successfully initiated on anticoagulation therapy and 1 veteran was deemed appropriate for initiation of anticoagulation but was not reachable. Of the 5 recommendations with no action taken, 4 PCPs acknowledged the alert with no further documentation, and 1 PCP deferred the decision to cardiology with no further documentation. In the VTE cohort, 3 veterans successfully discontinued anticoagulation therapy and 2 veterans were further evaluated by the anticoagulation CPP and deemed appropriate to continue therapy based on potential for malignancy. Of the 2 recommendations with no action taken, 1 anticoagulation CPP acknowledged the alert with no further documentation and 1 anticoagulation CPP suggested further evaluation by PCP with no further documentation.
In the Afib cohort, a nonpharmacologic approach was defined as documentation of a LAAO device. An inaccurate diagnosis was defined as an Afib diagnosis being used in a previous visit, although there was no further confirmation of diagnosis via chart review. Veterans classified as already being on anticoagulation had documentation of non–VA-written anticoagulant prescriptions or receiving a supply of anticoagulants from a facility such as a nursing home. Anticoagulation was defined as unfavorable if a documented risk/benefit conversation was found via EHR review. Anticoagulation was defined as not indicated if the Afib was documented as transient, episodic, or historical (Table 2).
In the VTE cohort, no recommendations for discontinuation were made for veterans indicated to continue anticoagulation due to a concurrent Afib diagnosis. Chronic or recurrent events were defined as documentation of multiple VTE events and associated dates in the EHR. Persistent risk factors included malignancy or medications contributing to hypercoagulable states. Thrombophilia was defined as having documentation of a diagnosis in the EHR. An unprovoked event was defined as VTE without any documented transient risk factors (eg, hospitalization, trauma, surgery, cast immobilization, hormone therapy, pregnancy, or prolonged travel). Anticoagulation had already been discontinued in 1 veteran after the data were collected but before chart review occurred (Table 3).
Discussion
Pharmacy-led indication reviews resulted in appropriate recommendations for anticoagulation use in veterans with Afib and a history of VTE events. Overall, 12.3% of chart reviews in each cohort resulted in a recommendation being made, which was similar to the rate found by Koolian et al.5 In that study, 10% of recommendations were related to initiation or interruption of anticoagulation. This recommendation category consisted of several subcategories, including “suggesting therapeutic anticoagulation when none is currently ordered” and “suggesting anticoagulation cessation if no longer indicated,” but specific numerical prevalence was not provided.5
Online dashboard use allowed for greater population health management and identification of veterans with Afib who were not on active anticoagulation, providing opportunities to prevent stroke-related complications. Wang et al completed a similarly designed study that included a population health tool to identify patients with Afib who were not on anticoagulation and implemented pharmacist-led chart review and facilitation of recommendations to the responsible clinician. This study reviewed 1727 patients and recommended initiation of anticoagulation therapy for 75 (4.3%).6 The current study had a higher percentage of patients with recommendations for changes despite its smaller size.
Evaluating the duration of therapy for anticoagulation in veterans with a history of VTE events provided an opportunity to reduce unnecessary exposure to anticoagulation and minimize bleeding risks. Using a chart review process and standardized note template enabled the documentation of pertinent information that could be readily reviewed by the PCP. This process is a step toward ensuring VAPHCS PCPs provide guideline-recommended care and actively prevent stroke and bleeding complications. Adoption of this process into the current VAPHCS Anticoagulation Clinic workflow for review of veterans with either Afib or VTE could lead to more EHRs being reviewed and recommendations made, ultimately improving patient outcomes.
Therapeutic interventions based on the recommendations were completed for 1 of 7 veterans (14%) and 3 of 7 veterans (43%) in the Afib and VTE cohorts, respectively. The prevalence of completed interventions in this anticoagulation stewardship study was higher than those in Wang et al, who found only 9% of their recommendations resulted in PCPs considering action related to anticoagulation, and only 4% were successfully initiated.6
In the Afib cohort, veterans identified by the dashboard with a CHA2DS2-VASc of 7 or 8 were prioritized for review. Reviewing these veterans ensured that patients with the highest stroke risk were sufficiently evaluated and started on anticoagulation as needed to reduce stroke-related complications. In contrast, because these veterans had higher CHA2DS2-VASc scores, they may have already been evaluated for anticoagulation in the past and had a documented rationale for not being placed on anticoagulation (LAAO device placement was the most common rationale). Focusing on veterans with a lower CHA2DS2-VASc score such as 1 for men or 2 for women could potentially include more opportunities for recommendations. Although stroke risk may be lower in this population compared with those with higher CHA2DS2-VASc scores, guideline-recommended anticoagulation use may be missed for these patients.
In the VTE cohort, veterans with an anticoagulant prescription written 12 months before data collection were prioritized for review. Reviewing these veterans ensured that anticoagulation therapy met guideline recommendations of at least 3 months, with potential for extended duration upon further evaluation by a provider at that time. Based on collected results, most veterans were already reevaluated and had documented reasons why anticoagulation was still indicated; concurrent Afib was most common followed by chronic or recurrent VTE. Reviewing veterans with more recent prescriptions just over the recommended 3-month duration could potentially include more opportunities for recommendations to be made. It is more likely that by 3 months another PCP had not already weighed in on the duration of therapy, and the anticoagulation CPP could ensure a thorough review is conducted with guideline-based recommendations.
Most published literature on anticoagulation stewardship efforts is focused on inpatient management and policy changes, or concentrate on attributes of therapy such as appropriate dosing and drug interactions. This study highlighted that gaps in care related to anticoagulation use and discontinuation are present in the VAPHCS population and can be appropriately addressed via pharmacist-led indication reviews. Future studies designed to focus on initiating anticoagulation where appropriate, and discontinuing where a sufficient treatment period has been completed, are warranted to minimize this gap in care and allow health systems to work toward process changes to ensure safe and optimized care is provided for the patients they serve.
Limitations
In the Afib cohort, 5 of 7 recommendations (71%) had no further action taken by the PCP, which may represent a barrier to care. In contrast, 2 of 7 recommendations (29%) had no further action in the VTE cohort. It is possible that the difference can be attributed to the anticoagulation CPP receiving VTE alerts and PCPs receiving Afib alerts. The anticoagulation CPP was familiar with this QI study and may have better understood the purpose of the chart review and the need to provide a timely response. PCPs may have been less likely to take action because they were unfamiliar with the anticoagulation stewardship initiative and standardized note template or overwhelmed by too many EHR alerts.
The lack of PCP response to a virtual alert or message also was observed by Wang et al, whereas Koolian et al reported higher intervention completion rates, with verbal recommendations being made to the responsible clinicians. To further ensure these pertinent recommendations for anticoagulation initiation in veterans with Afib are properly reviewed and evaluated, future research could include intentional follow-up with the PCP regarding the alert, PCP-specific education about the anticoagulation stewardship initiative and the role of the standardized note template, and collaboration with PCPs to identify alternative ways to relay recommendations in a way that would ensure the completion of appropriate and timely review.
Conclusions
This study identified gaps in care related to anticoagulation needs in the VAPHCS veteran population. Utilizing a standardized indication review process allows pharmacists to evaluate anticoagulant use for both appropriate indication and duration of therapy. Providing recommendations via chart review notes and alerting respective PCPs and CPPs results in veterans receiving safe and optimized care regarding their anticoagulation needs.
- Joglar JA, Chung MK, Armbruster AL, et al. 2023 ACC/AHA/ACCP/HRS guideline for the diagnosis and management of atrial fibrillation: a report of the American College of Cardiology/American Heart Association Joint Committee on Clinical Practice Guidelines. Circulation. 2024;149:e1-e156. doi:10.1161/CIR.0000000000001193
- Stevens SM, Woller SC, Kreuziger LB, et al. Antithrombotic therapy for VTE disease: second update of the CHEST guideline and expert panel report. Chest. 2021;160:e545-e608. doi:10.1016/j.chest.2021.07.055
- Institute for Safe Medication Practices (ISMP). List of high-alert medications in community/ambulatory care settings. ISMP. September 30, 2021. Accessed September 11, 2025. https://home.ecri.org/blogs/ismp-resources/high-alert-medications-in-community-ambulatory-care-settings
- Burnett AE, Barnes GD. A call to action for anticoagulation stewardship. Res Pract Thromb Haemost. 2022;6:e12757. doi:10.1002/rth2.12757
- Koolian M, Wiseman D, Mantzanis H, et al. Anticoagulation stewardship: descriptive analysis of a novel approach to appropriate anticoagulant prescription. Res Pract Thromb Haemost. 2022;6:e12758. doi:10.1002/rth2.12758
- Wang SV, Rogers JR, Jin Y, et al. Stepped-wedge randomised trial to evaluate population health intervention designed to increase appropriate anticoagulation in patients with atrial fibrillation. BMJ Qual Saf. 2019;28:835-842. doi:10.1136/bmjqs-2019-009367
Anticoagulation Stewardship Efforts Via Indication Reviews at a Veterans Affairs Health Care System
Anticoagulation Stewardship Efforts Via Indication Reviews at a Veterans Affairs Health Care System

Comprehensive Genomic Profiles of Melanoma in Veterans Compared to Reference Databases
Comprehensive Genomic Profiles of Melanoma in Veterans Compared to Reference Databases
The veteran population, with its unique and diverse types of exposure and military service experiences, faces distinct health factors compared with the general population. These factors can be categorized into exposures during military service and those occurring postservice. While the latter phase incorporates psychological issues that may arise while transitioning to civilian life, the service period is associated with major physical, chemical, and psychological exposures that can impact veterans’ health. Carcinogenesis related to military exposures is concerning, and different types of malignancies have been associated with military exposures.1 The 2022 introduction of the Cancer Moonshot initiative served as a breeding ground for multiple projects aimed at investigation of exposure-related carcinogenesis, prompting increased attention and efforts to linking specific exposures to specific malignancies.2
Melanoma is the deadliest skin cancer, accounting for 1.3% of all cancer deaths.3 Although it may only account for 1% to 5% of skin cancer diagnoses, its incidence in the United States’ population has been increasing.4,5 There were 97,610 estimated new cases of melanoma in 2023, according to the National Cancer Institute.6
The incidence of melanoma may be higher in the military population compared with the general population.7 Melanoma is the fourth-most common cancer diagnosed in veterans.8
Several demographic characteristics of the US military population are associated with higher melanoma incidence and poorer prognosis, including male sex, older age, and White race. Apart from sun exposure—a known risk factor for melanoma development—other factors, such as service branch, seem to contribute to risk, with the highest melanoma rates noted in the Air Force.9 According to a study by Chang et al, veterans have a higher risk of stage III (18%) or stage IV (13%) melanoma at initial diagnosis.8
Molecular testing of metastatic melanoma is currently the standard of care for guiding the use of US Food and Drug Administration-approved targeted therapies such as BRAF, MEK, and KIT inhibitors. This comparative analysis details the melanoma comprehensive genomic profiles observed at a large US Department of Veterans Affairs (VA) medical center (VAMC) and those reported in reference databases.
Methods
A query to select all metastatic melanomas sent for comprehensive genomic profiling from the Kansas City VAMC (KCVAMC), identified 35 cases from 2019 through 2023 as the study population. The health records of these patients were reviewed to collect demographic information, military service history, melanoma history, other medical, social, and family histories. The comprehensive genomic profiling reports were reviewed to collect the reported pathogenic variants, microsatellite instability (MSI) status, and tumor mutational burden (TMB) for each case.
The Catalogue of Somatic Mutations in Cancer (COSMIC) was used to identify the most commonly mutated genes in melanomas from The Cancer Genome Atlas for the general population.4,5 The literature was consulted to determine the MSI status and TMB in melanomas from The Cancer Genome Atlas for separate reference populations.6,7 The frequency of MSI-high (MSI-H) status, TMB ≥ 10 mutations/megabase (mut/Mb), and mutations in each of the 20 most commonly mutated genes was determined and compared between melanomas from The Cancer Genome Atlas and KCVAMC cases. Corresponding P values were calculated to identify significant differences. Values were calculated for the entire sample as well as a subgroup with Agent Orange (AO) exposure. The study was approved by the KCVAMC Institutional Review Board.
Results
The mean (SD) age of study participants was 72.9 (9.4) years (range, 39-90 years). The mean (SD) duration of military service was 1654 (1421) days (about 4 years, 6 months, and 10 days). Of the 35 patients included, 22 (63%) served during the Vietnam era (November 1, 1965, to April 30, 1975) and 2 (6%) served during the Persian Gulf War era (August 2, 1990, to February 28, 1991). Seventeen veterans (49%) served in the Army, 9 in the Navy (26%), 5 in the Air Force (14%), and 4 in the Marine Corps (11%). Definitive AO exposure was noted in 13 patients (37%) (Table 1).
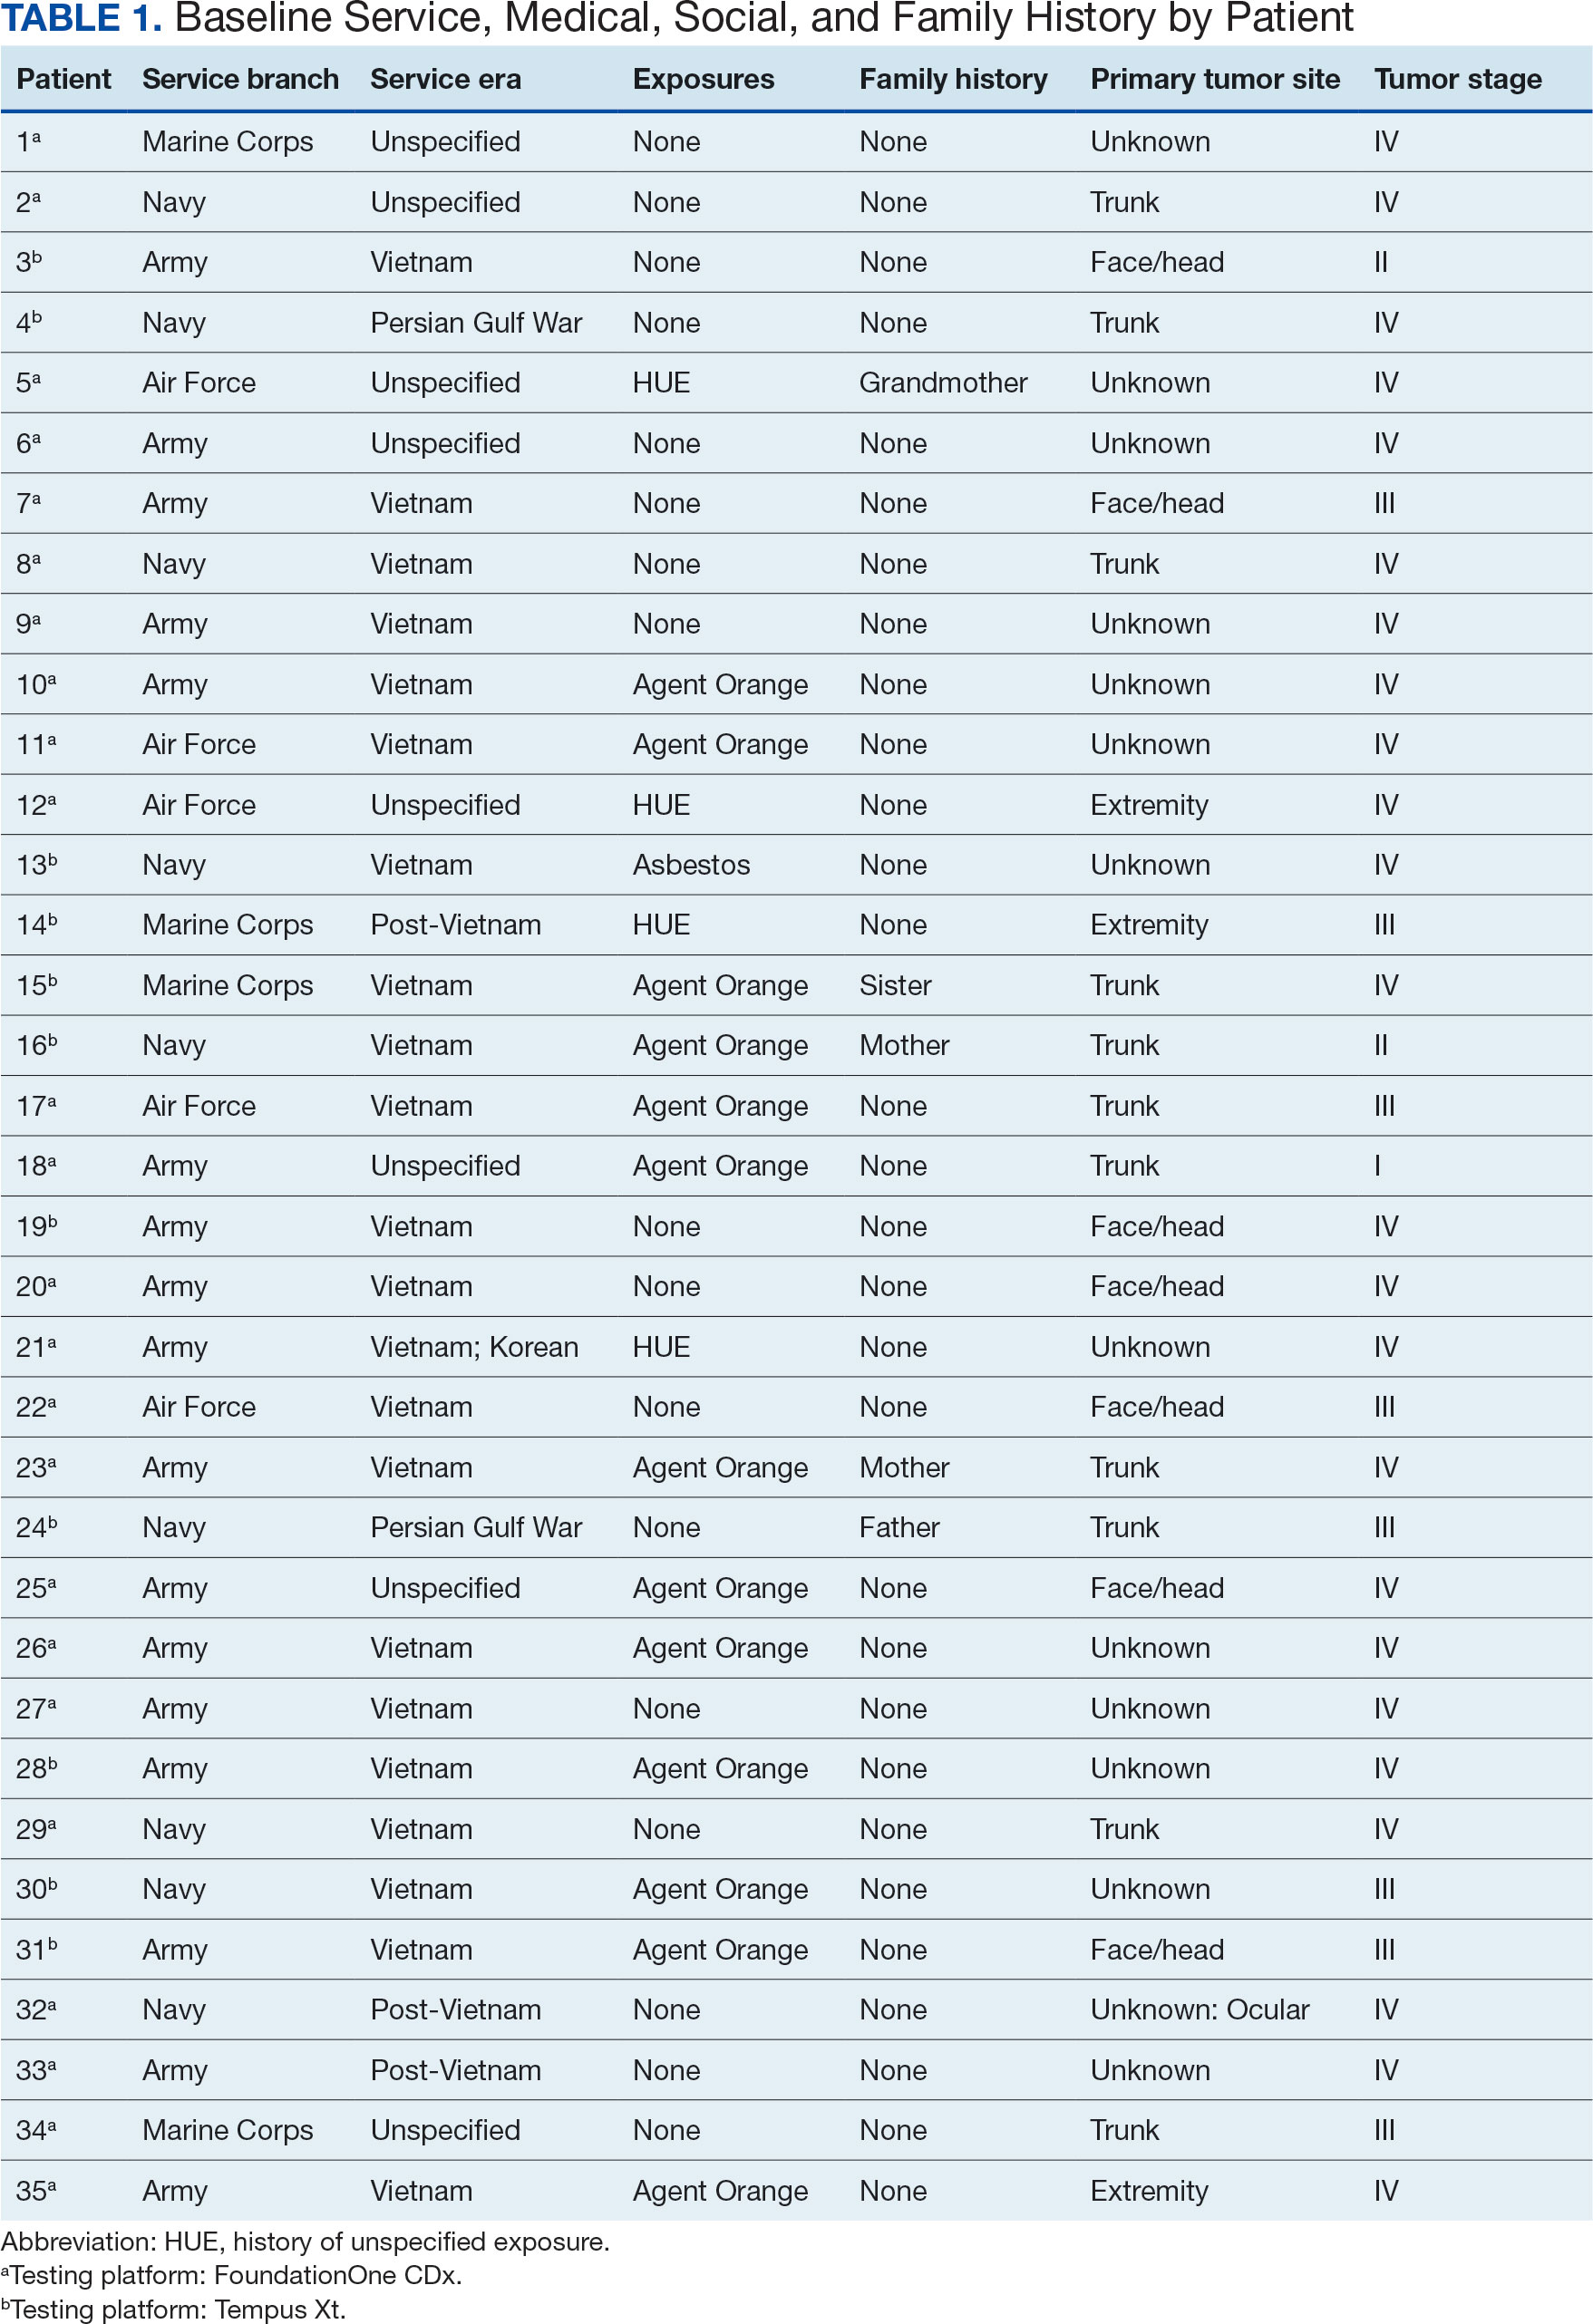
Of the 35 patients, 24 (69%) had metastatic disease and the primary site of melanoma was unknown in 14 patients (40%). One patient (Patient 32) had an intraocular melanoma. The primary site was the trunk for 11 patients (31%), the face/head for 7 patients (20%) and extremities for 3 patients (9%). Eight patients (23%) were pT3 stage (thickness > 2 mm but < 4 mm), 7 patients (20%) were pT4 stage (thickness > 4 mm), and 5 patients (14%) were pT1 (thickness ≥ 1 mm). One patient had a primary lesion at pT2 stage, and 1 had a Tis stage lesion. Three patients (9%) had a family history of melanoma in a first-degree relative.
The list of genes mutated in melanoma cells in the study population is provided in the eAppendix.10,11 Twenty-seven patients (77%) had mutations in TERT promoter, 15 (43%) in CDKN2A/B, 13 (37%) in BRAF, 11 (31%) in NF1, 9 (26%) in TP53, and 8 (23%) in NRAS (Table 2). The majority of mutations in TERT promoter were c.- 146C>T (18 of 27 patients [67%]), whereas c.-124C>T was the second-most common (8 of 27 patients [30%]). The 2 observed mutations in the 13 patients with BRAF mutations were V600E and V600K, with almost equal distribution (54% and 46%, respectively). The mean (SD) TMB was 33.2 (39) mut/Mb (range, 1-203 mut/Mb). Ten patients (29%) had a TMB < 10 mut/Mb, whereas 24 (69%) had a TMB > 10 mut/Mb. The TMB could not be determined in 1 case. The frequency of TMB-high tumors in the study population compared with frequency in the reference population is shown in Table 3.12 Only 3 patients (0.64%) in the reference population had MSI-H tumors, and the microsatellite status could not be determined in those tumors (Table 4).13 Table 5 outlines statistically significant findings.
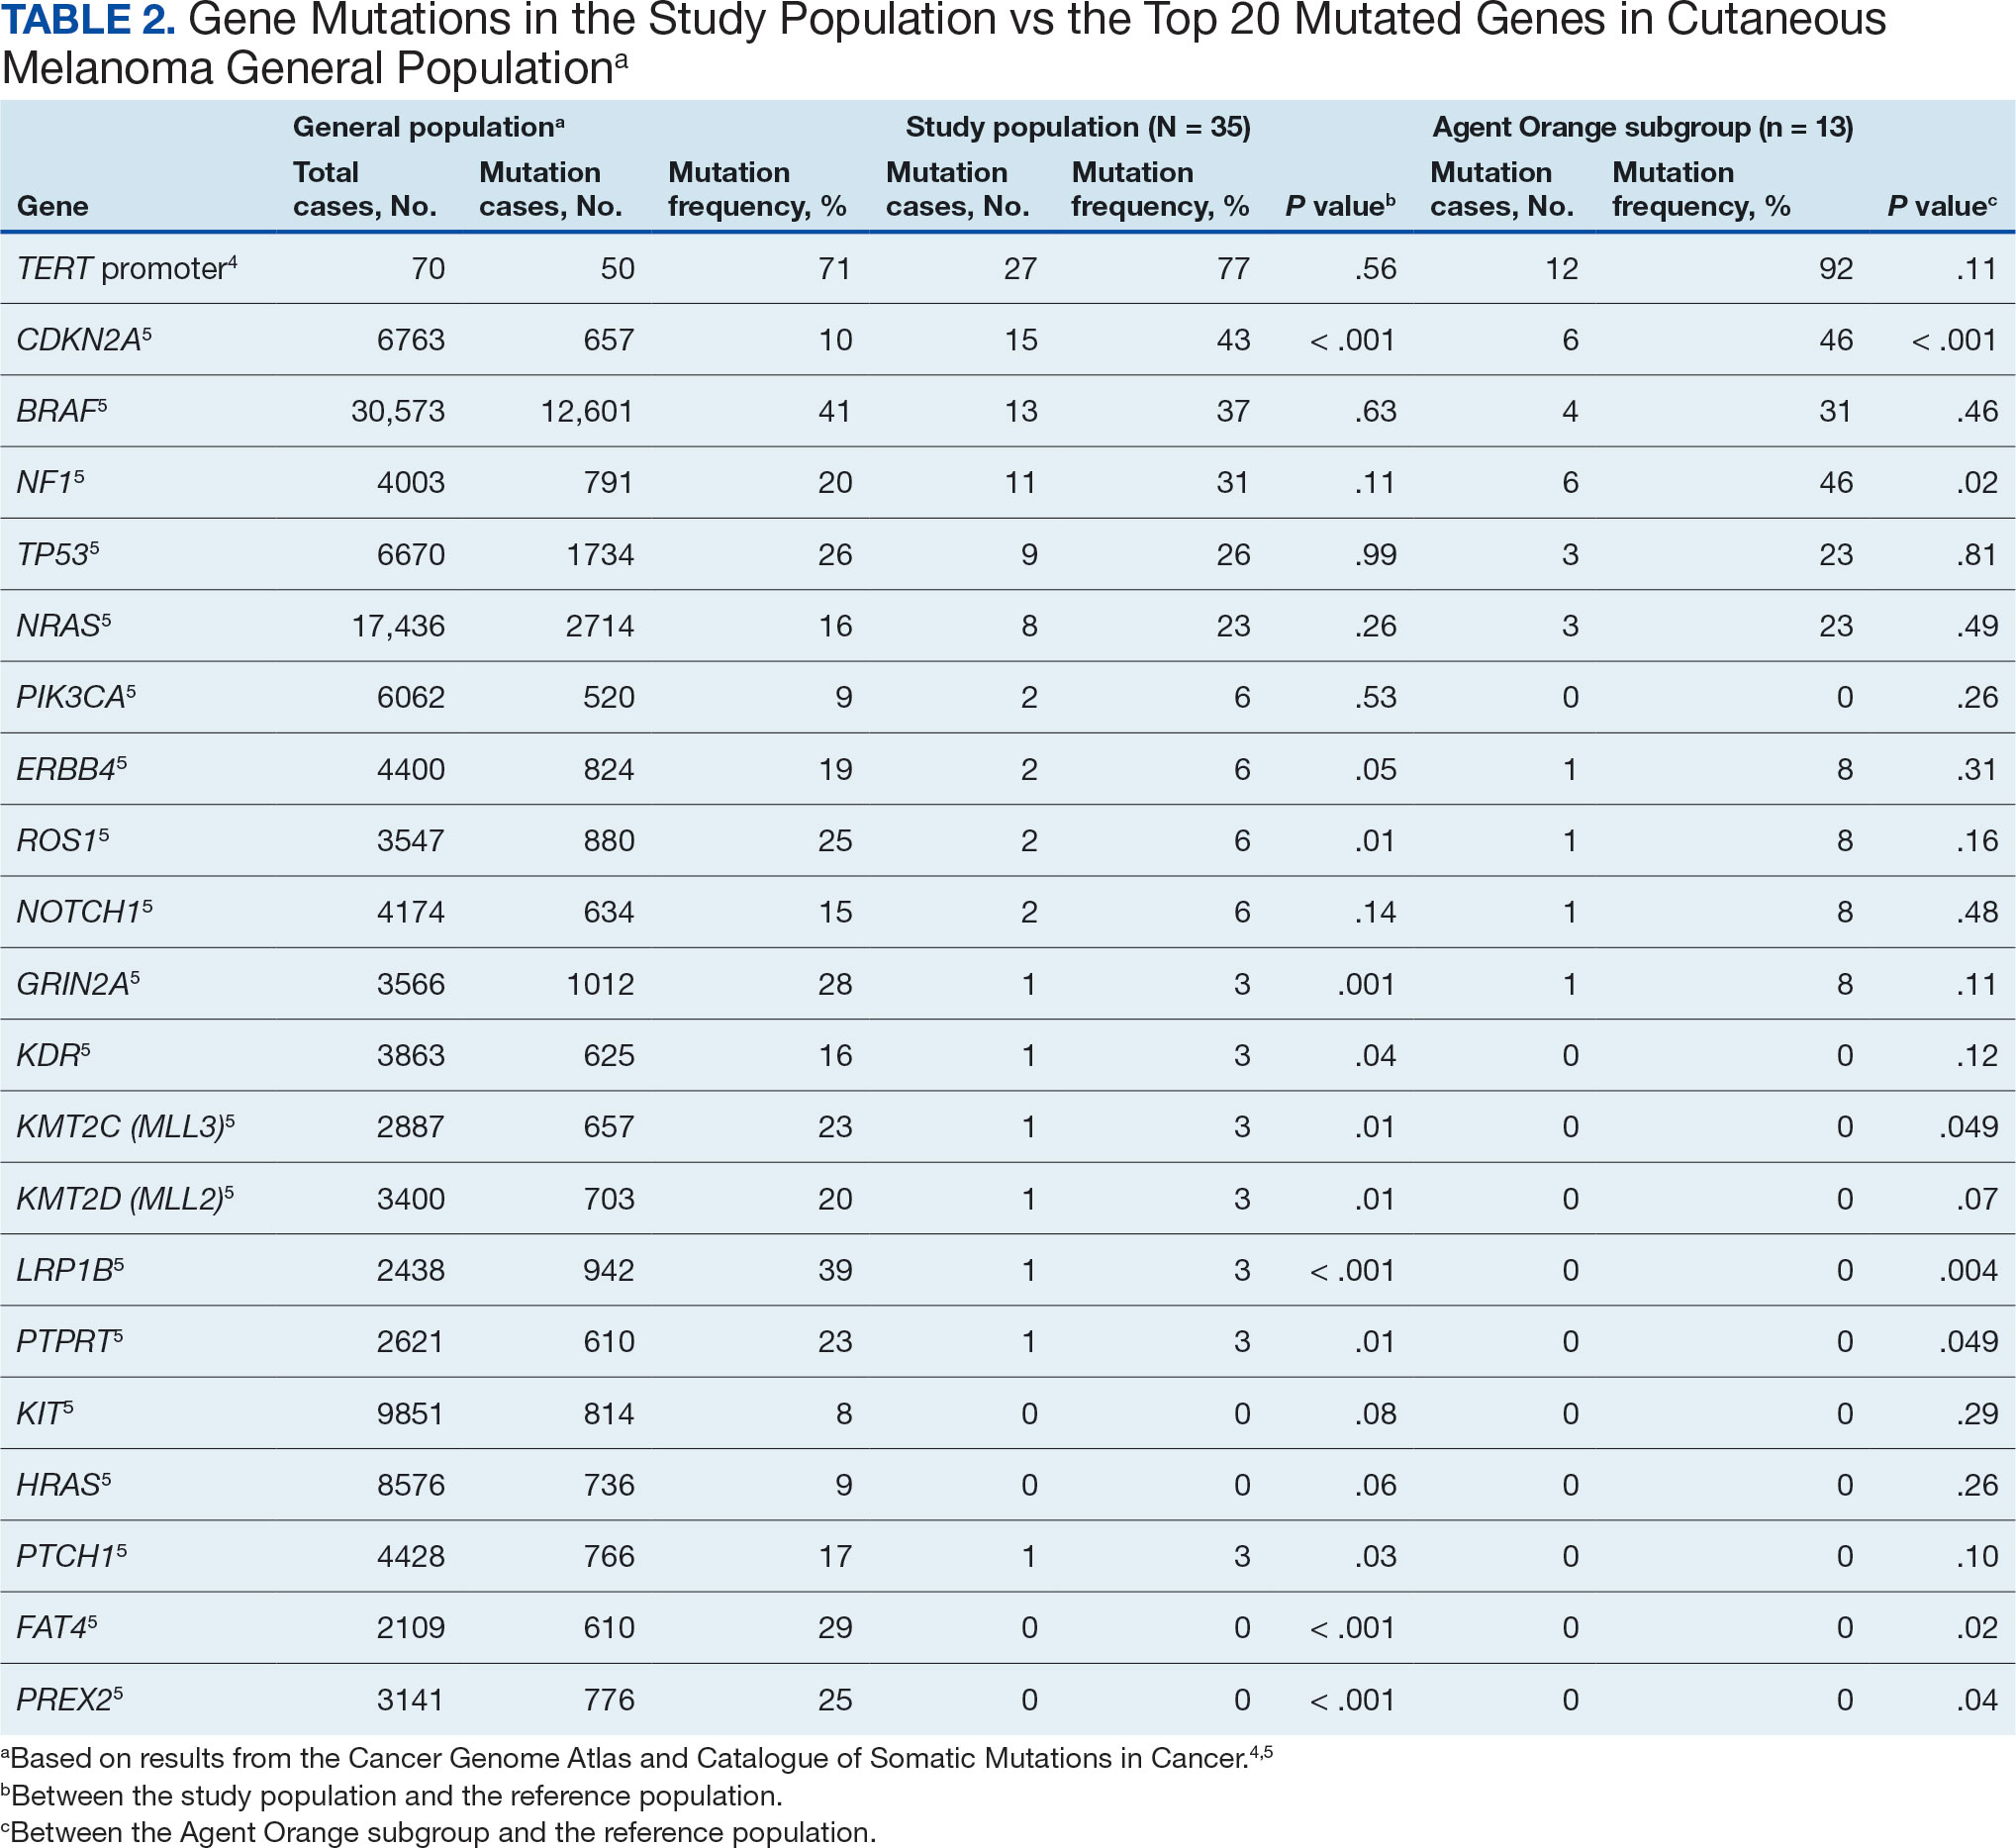
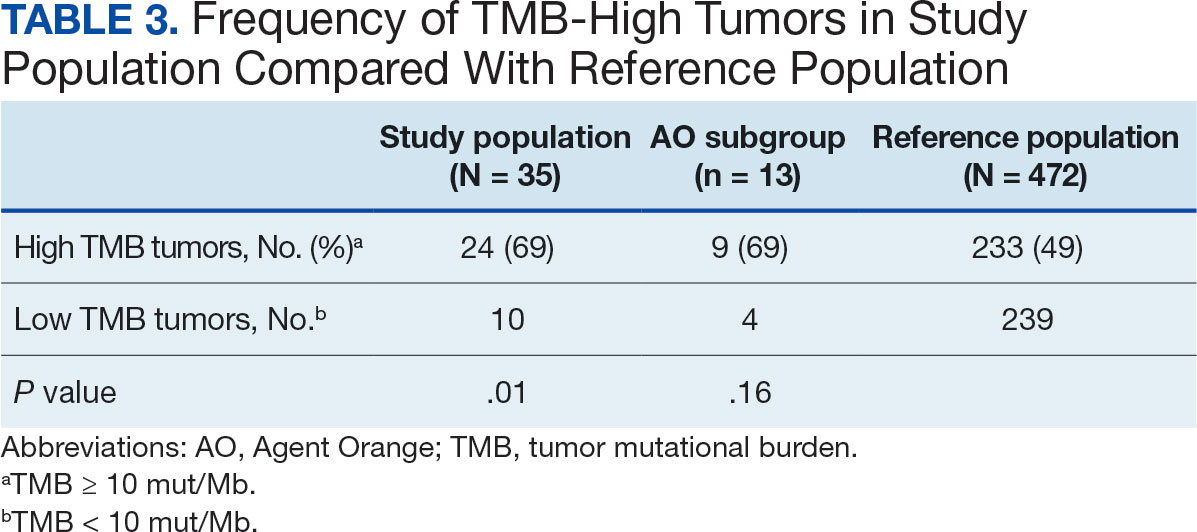
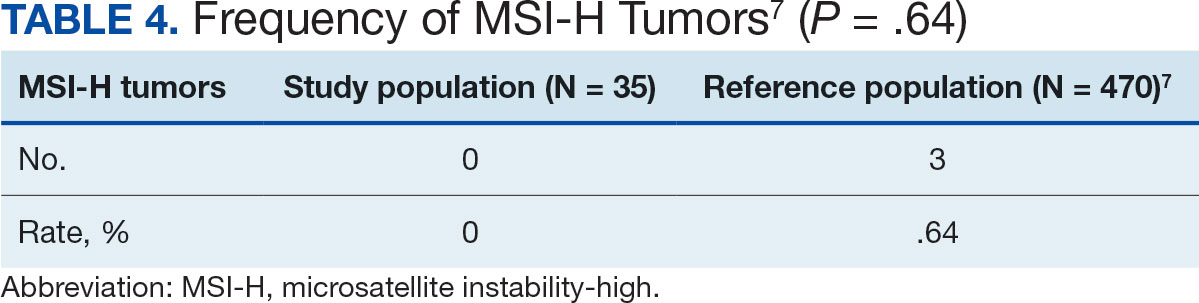
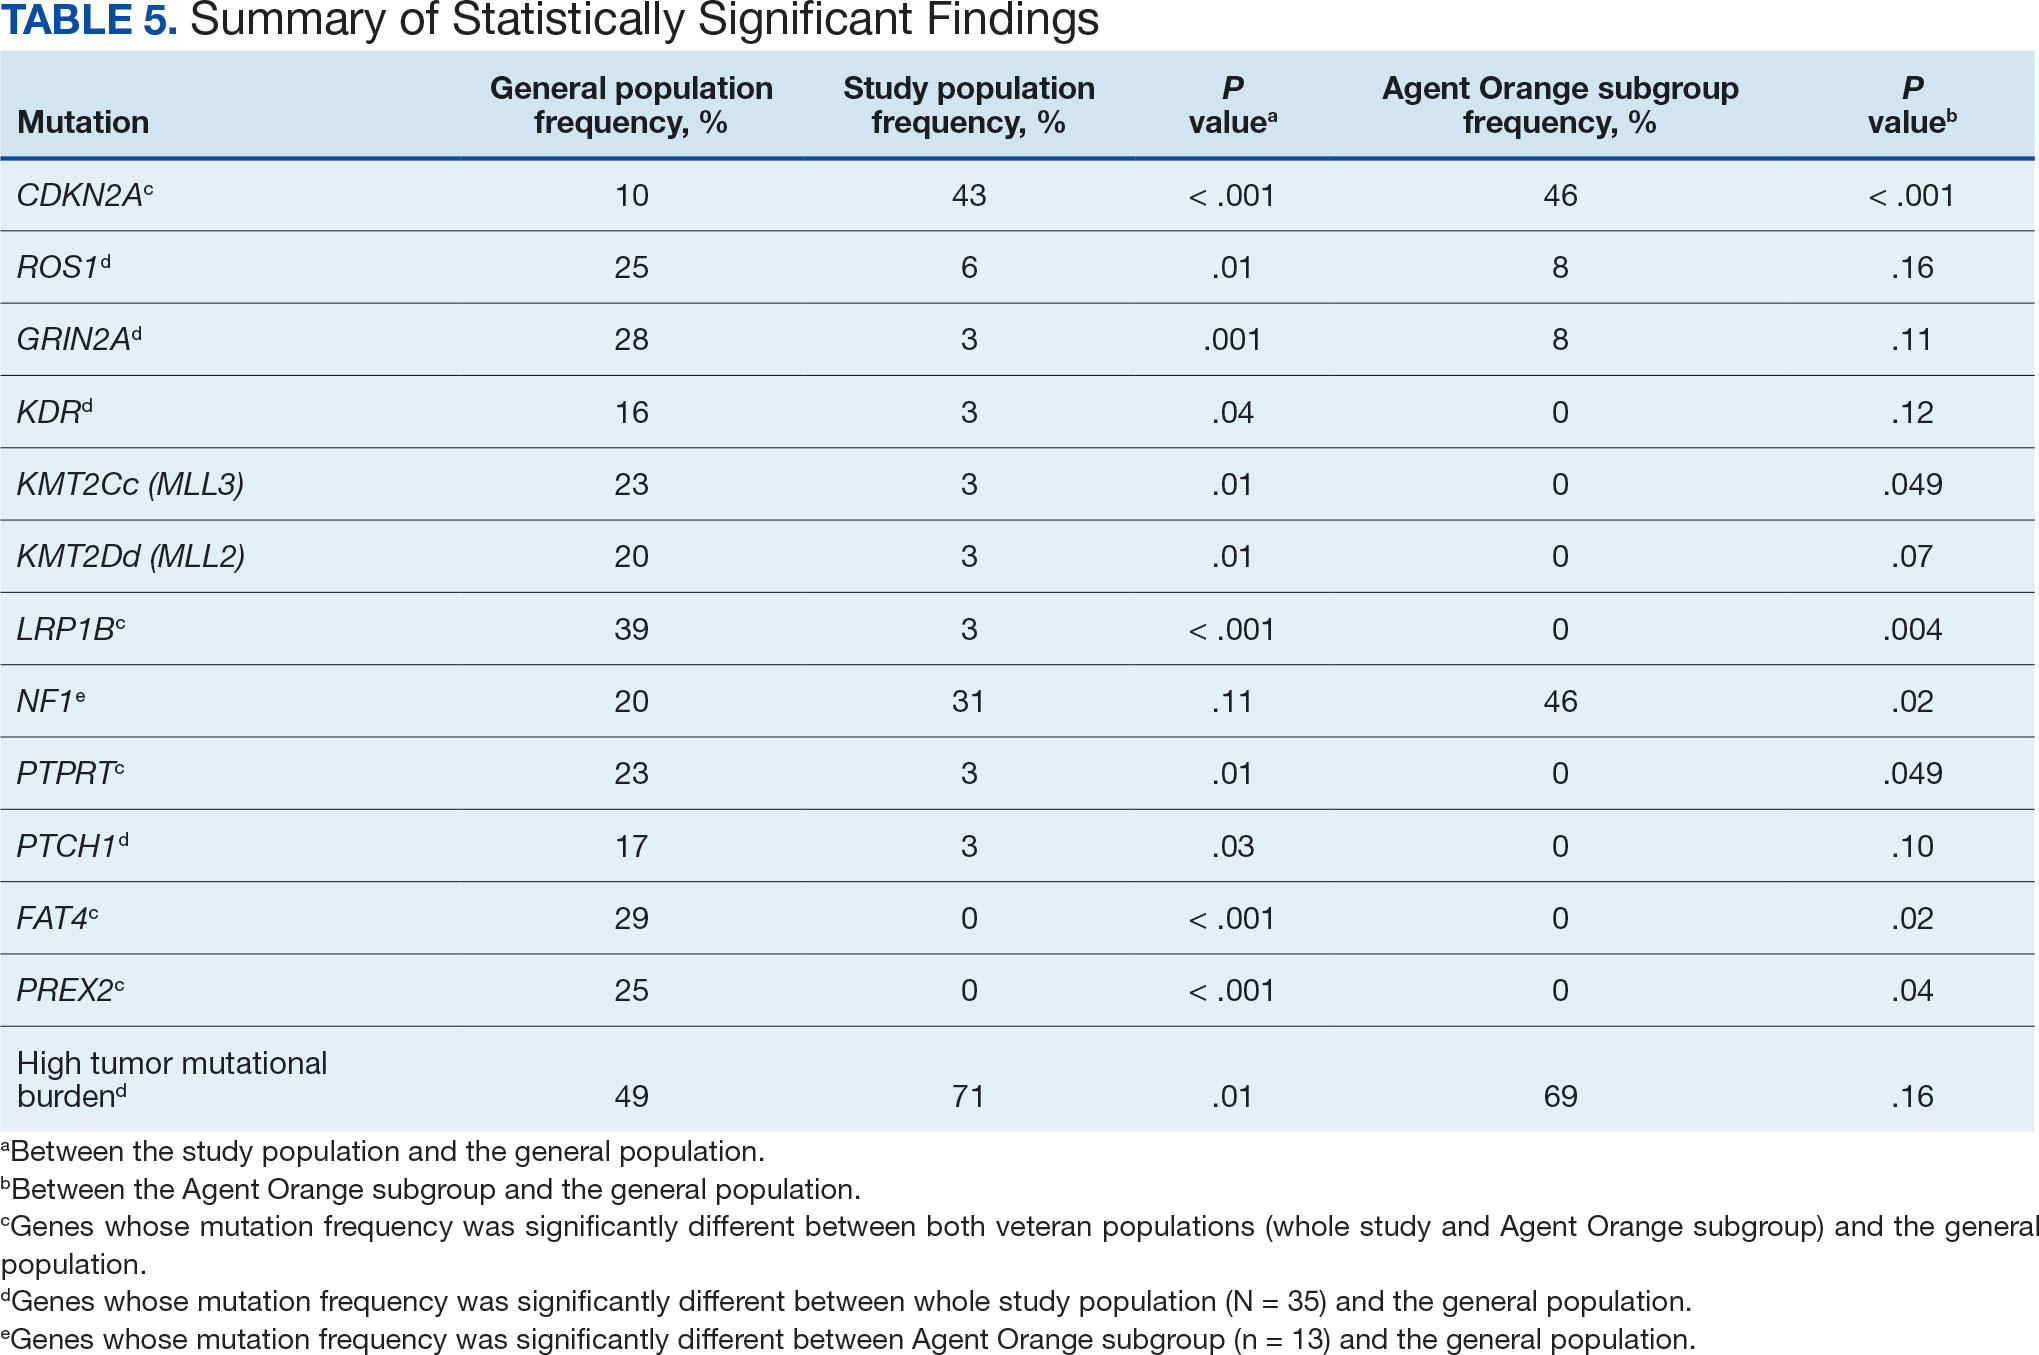
Agent Orange Subgroup
AO was a tactical herbicide used by the US military, named for the orange band around the storage barrels. Possible mutagenic properties of AO have been attributed to its byproduct, dioxin. Among the most common cancers known to be associated with AO exposure are bladder and prostate carcinoma and hematopoietic neoplasms. The association between genetic alterations and AO exposure was studied in veterans with prostate cancer.14 However, to our knowledge, insufficient information is available to determine whether an association exists between exposure to herbicides used in Vietnam or the contaminant dioxin and melanoma. Because a significant proportion of this study population had a well-documented history of AO exposure (37.1%), we were able to analyze them as a subgroup and to separately compare their mutation frequency with the general population.
Results were notable for different distributions of the most frequently mutated genes in the AO subgroup compared with the whole study population. As such, TERT promoter remained the most frequently mutated gene (92%), followed by CDKN2A/B (46%); however, frequency of mutations in NF1 (46%) outnumbered those of BRAF (31%), the fourth-most common mutation. Moreover, when compared with the general melanoma population, a significantly higher frequency of mutations in the NF1 gene was observed in the AO subgroup—not the entire study population.
Discussion
Given that veterans constitute a distinct population, there is reasonable interest in investigating characteristic health issues related to military service. Skin cancer—melanoma in particular—has been researched recently in a veteran population. The differences in demographics, tumor characteristics, and melanoma- specific survival in veterans compared with the general population have already been assessed. According to Chang et al, compared with the general population, veterans are more likely to present with metastatic disease and have lower 5-year survival rates.8
Melanoma is one of the most highly mutated malignancies.15 Fortunately, the most common mutation in melanoma, BRAF V600E, is now considered therapeutically targetable. However, there are still many mutations that are less often discussed and not well understood. Regardless of therapeutic implications, all mutations observed in melanoma are worth investigating because a tumor’s genomic profile also can provide prognostic and etiologic information. Developing comprehensive descriptions of melanoma mutational profiles in specific populations is critical to advancing etiologic understanding and informing prevention strategies.
Our results demonstrate the high prevalence of TERT promoter mutations with characteristic ultraviolet signature (C>T) in the study population. This aligns with general evidence that TERT promoter mutations are common in cutaneous melanomas: 77% of this study sample and up to 86% of all mutations are TERT promoter mutations, according to Davis et al.15 TERT promoter mutations are positively associated with the initiation, invasion, and metastasis of melanoma. In certain subtypes, there is evidence that the presence of TERT promoter mutations is significantly associated with risk for extranodal metastasis and death.16 The second-most common mutated gene in the veteran study population was CDKN2A/B (43%), and the third-most mutated gene was BRAF (37%).
In chronically sun-exposed skin NF1, NRAS, and occasionally BRAF V600K mutations tend to predominate. BRAF V600E mutations, on the other hand, are rare in these melanomas.15 In our study population, the most prevalent melanoma site was the trunk (31%), which is considered a location with an intermittent pattern of sun exposure.17
This study population also had a higher frequency of CDKN2A/B mutations. High frequencies of CDKN2A/B mutations have been reported in familial melanomas, but only 1 patient with CDKN2A/B mutations had a known family history of melanoma.15 Tumors in the study population showed significantly lower frequency of mutations in ROS1, GRIN2A, KDR, KMT2C (MLL3), KMT2D (MLL2), LRP1B, PTPRT, PTCH1, FAT4, and PREX2 (P < .05).
In this study the subgroup of veterans with AO exposure differed from the whole study population. As such, CDKN2A/B mutations were observed with the same frequency as NF1 mutations (46% each); however, BRAF mutations constituted only 31% of the mutations. In addition, the frequency of NF1 mutations was significantly higher in the AO subgroup compared with the general population, but not in the whole study population.
Our sample also differed from the reference population by showing a significantly higher frequency of TMB-high (ie, ≥ 10 mut/Mb) tumors (71% vs 49%; P = .01).12 Interestingly, no significant difference in the frequency of TMB-high tumors was observed between the AO subgroup and the reference population (69% vs 49%; P = .16). There also was no statistically significant difference between the frequency of MSI-H tumors in our study population and the reference population (P = .64).13
One patient in the study population had uveal melanoma. Mutations encountered in this patient’s tumor differed from the general mutational profile of tumors. None of the 21 mutations depicted in Table 2 were present in this sample.10,11 On the other hand, those mutations frequently observed in intraocular melanomas, BAP1 and GNA11, were present in this patient.18 Additionally, this particular melanoma possessed mutations in genes RICTOR, RAD21, and PIK3R1.
Limitations
This study population consisted exclusively of male patients, introducing sex as a potential confounder in analyzing differences between the study population and the general population. As noted in a 2020 systematic review, there were no sex-based differences in the frequency of mutations in BRAF, NRAS, and KIT genes.19
Regarding NF1 mutations, only NF1-mutated acral and mucosal melanomas were more frequently observed in female patients, whereas nonacral NF1-mutated melanomas were more frequently observed in male patients.20 However, there is currently no clear evidence of whether the mutational landscapes of cutaneous melanoma differ by sex.21 Among the 11 cases with NF1-mutatation, site of origin was known in 6, 5 of which originated at nonacral sites. Although the AO subgroup also consisted entirely of male patients, this does not explain the observed increased frequency of NF1 mutations relative to the general population. No such difference was observed between the whole study population, which also consisted exclusively of male patients, and the general population. The similar frequencies of nonacral location in the whole study population (3 acral, 18 nonacral, 14 unknown site of origin) and AO subgroup (1 acral, 7 nonacral, 5 unknown site of origin) preclude location as an explanation.
The Cancer Genome Atlas Network proposed a framework for genomic classification of melanoma into 4 subtypes based on the pattern of the most prevalent significantly mutated genes: mutant BRAF, mutant RAS, mutant NF1, and triple–wild-type. According to that study, BRAF mutations were indeed associated with younger age, in contrast to the NF1-mutant genomic subtype, which was more prevalent in older individuals with higher TMB.22 This emphasizes the need to interpret the potential association of AO exposure and NF1 mutation in melanoma with caution, although additional studies are required to observe the difference between the veteran population and age-matched general population.
On the other hand, Yu et al reported no significant differences of TMB values between patients aged < 60 and ≥ 60 years with melanoma.23 In short, the observed differences we report in our limited study warrant additional investigation with larger sample sizes, sex-matched controlling, and age-matched controlling. The study was limited by its small sample size and the single location.
Conclusion
The genomic profile of melanomas in the veteran population appears to be similar to that of the general population with a few possible differences. Melanomas in the veteran study population showed a higher frequency of CDKN2A/B mutations; lower frequency of ROS1, GRIN2A, KDR, KMT2C (MLL3), KMT2D (MLL2), LRP1B, PTPRT, PTCH1, FAT4, and PREX2 mutations; and higher TMB. In addition, melanomas in the AO subgroup showed higher frequencies of NF1 mutations. The significance of such findings remains to be determined by further investigation.
- Bytnar JA, McGlynn KA, et al. Cancer incidence in the US military: An updated analysis. Cancer. 2024;130(1):96-106. doi:10.1002/cncr.34978
- Singer DS. A new phase of the Cancer Moonshot to end cancer as we know it. Nat Med. 2022;28(7):1345-1347. doi:10.1038/s41591-022-01881-5
- Koczkodaj P, Sulkowska U, Didkowska J, et al. Melanoma mortality trends in 28 European countries: a retrospective analysis for the years 1960-2020. Cancers (Basel). 2023;15(5):1514. Published 2023 Feb 28. doi:10.3390/cancers15051514
- Okobi OE, Abreo E, Sams NP, et al. Trends in melanoma incidence, prevalence, stage at diagnosis, and survival: an analysis of the United States Cancer Statistics (USCS) database. Cureus. 2024;16(10):e70697. doi:10.7759/cureus.70697
- Bartling SJ, Rivard SC, Meyerle JH. Melanoma in an active duty marine. Mil Med. 2017;182:e2034-e2039. doi:10.7205/MILMED-D-17-00127
- American Cancer Society. Cancer facts & figures 2023. American Cancer Society; 2023. Accessed June 20, 2025. https://www.cancer.org/content/dam/cancer-org/research/cancer-facts-and-statistics/annual-cancer-facts-and-figures/2023/2023-cancer-facts-and-figures.pdf
- Rezaei SJ, Kim J, Onyeka S, et al. Skin cancer and other dermatologic conditions among US veterans. JAMA Dermatol. 2024;160(10):1107-1111. doi:10.1001/jamadermatol.2024.3043
- Chang MS, La J, Trepanowski N, et al. Increased relative proportions of advanced melanoma among veterans: a comparative analysis with the Surveillance, Epidemiology, and End Results registry. J Am Acad Dermatol. 2022;87:72-79. doi:10.1016/j.jaad.2022.02.063
- Riemenschneider K, Liu J, Powers JG. Skin cancer in the military: a systematic review of melanoma and nonmelanoma skin cancer incidence, prevention, and screening among active duty and veteran personnel. J Am Acad Dermatol. 2018;78:1185-1192. doi:10.1016/j.jaad.2017.11.062
- Huang FW, Hodis E, Xu MJ, et al. Highly recurrent TERT promoter mutations in human melanoma. Science. 2013;339:957-959. doi:10.1126/science.1229259
- Tate JG, Bamford S, Jubb HC, et al. COSMIC: the Catalogue of Somatic Mutations in Cancer. Nucleic Acids Res. 2019;47:D941-D947. doi:10.1093/nar/gky1015
- Li M, Gao X, Wang X. Identification of tumor mutation burden-associated molecular and clinical features in cancer by analyzing multi-omics data. Front Immunol. 2023;14:1090838. doi:10.3389/fimmu.2023.1090838
- Bonneville R, Krook MA, Kautto EA, et al. Landscape of microsatellite instability across 39 cancer types. JCO Precis Oncol. 2017;2017:PO.17.00073. doi:10.1200/PO.17.00073
- Lui AJ, Pagadala MS, Zhong AY, et al. Agent Orange exposure and prostate cancer risk in the Million Veteran Program. medRxiv [Preprint]. 2023:2023.06.14.23291413. doi:10.1101/2023.06.14.23291413
- Davis EJ, Johnson DB, Sosman JA, et al. Melanoma: what do all the mutations mean? Cancer. 2018;124:3490-3499. doi:10.1002/cncr.31345
- Guo Y, Chen Y, Zhang L, et al. TERT promoter mutations and telomerase in melanoma. J Oncol. 2022;2022:6300329. doi:10.1155/2022/6300329
- Whiteman DC, Stickley M, Watt P, et al. Anatomic site, sun exposure, and risk of cutaneous melanoma. J Clin Oncol. 2006;24:3172-3177. doi:10.1200/JCO.2006.06.1325
- Decatur CL, Ong E, Garg N, et al. Driver mutations in uveal melanoma: associations with gene expression profile and patient outcomes. JAMA Ophthalmol. 2016;134:728-733. doi:10.1001/jamaophthalmol.2016.0903
- Gutiérrez-Castañeda LD, Nova JA, Tovar-Parra JD. Frequency of mutations in BRAF, NRAS, and KIT in different populations and histological subtypes of melanoma: a systemic review. Melanoma Res. 2020;30:62- 70. doi:10.1097/CMR.0000000000000628
- Thielmann CM, Chorti E, Matull J, et al. NF1-mutated melanomas reveal distinct clinical characteristics depending on tumour origin and respond favourably to immune checkpoint inhibitors. Eur J Cancer. 2021;159:113-124. doi:10.1016/j.ejca.2021.09.035
- D’Ecclesiis O, Caini S, Martinoli C, et al. Gender-dependent specificities in cutaneous melanoma predisposition, risk factors, somatic mutations, prognostic and predictive factors: a systematic review. Int J Environ Res Public Health. 2021;18:7945. doi:10.3390/ijerph18157945
- Cancer Genome Atlas Network. Genomic classification of cutaneous melanoma. Cell. 2015;161:1681-1696. doi:10.1016/j.cell.2015.05.044
- Yu Z, Wang J, Feng L, et al. Association of tumor mutational burden with age in solid tumors. J Clin Oncol. 2020;38:e13590-e13590. doi:10.1200/JCO.2020.38.15_suppl.e13590
The veteran population, with its unique and diverse types of exposure and military service experiences, faces distinct health factors compared with the general population. These factors can be categorized into exposures during military service and those occurring postservice. While the latter phase incorporates psychological issues that may arise while transitioning to civilian life, the service period is associated with major physical, chemical, and psychological exposures that can impact veterans’ health. Carcinogenesis related to military exposures is concerning, and different types of malignancies have been associated with military exposures.1 The 2022 introduction of the Cancer Moonshot initiative served as a breeding ground for multiple projects aimed at investigation of exposure-related carcinogenesis, prompting increased attention and efforts to linking specific exposures to specific malignancies.2
Melanoma is the deadliest skin cancer, accounting for 1.3% of all cancer deaths.3 Although it may only account for 1% to 5% of skin cancer diagnoses, its incidence in the United States’ population has been increasing.4,5 There were 97,610 estimated new cases of melanoma in 2023, according to the National Cancer Institute.6
The incidence of melanoma may be higher in the military population compared with the general population.7 Melanoma is the fourth-most common cancer diagnosed in veterans.8
Several demographic characteristics of the US military population are associated with higher melanoma incidence and poorer prognosis, including male sex, older age, and White race. Apart from sun exposure—a known risk factor for melanoma development—other factors, such as service branch, seem to contribute to risk, with the highest melanoma rates noted in the Air Force.9 According to a study by Chang et al, veterans have a higher risk of stage III (18%) or stage IV (13%) melanoma at initial diagnosis.8
Molecular testing of metastatic melanoma is currently the standard of care for guiding the use of US Food and Drug Administration-approved targeted therapies such as BRAF, MEK, and KIT inhibitors. This comparative analysis details the melanoma comprehensive genomic profiles observed at a large US Department of Veterans Affairs (VA) medical center (VAMC) and those reported in reference databases.
Methods
A query to select all metastatic melanomas sent for comprehensive genomic profiling from the Kansas City VAMC (KCVAMC), identified 35 cases from 2019 through 2023 as the study population. The health records of these patients were reviewed to collect demographic information, military service history, melanoma history, other medical, social, and family histories. The comprehensive genomic profiling reports were reviewed to collect the reported pathogenic variants, microsatellite instability (MSI) status, and tumor mutational burden (TMB) for each case.
The Catalogue of Somatic Mutations in Cancer (COSMIC) was used to identify the most commonly mutated genes in melanomas from The Cancer Genome Atlas for the general population.4,5 The literature was consulted to determine the MSI status and TMB in melanomas from The Cancer Genome Atlas for separate reference populations.6,7 The frequency of MSI-high (MSI-H) status, TMB ≥ 10 mutations/megabase (mut/Mb), and mutations in each of the 20 most commonly mutated genes was determined and compared between melanomas from The Cancer Genome Atlas and KCVAMC cases. Corresponding P values were calculated to identify significant differences. Values were calculated for the entire sample as well as a subgroup with Agent Orange (AO) exposure. The study was approved by the KCVAMC Institutional Review Board.
Results
The mean (SD) age of study participants was 72.9 (9.4) years (range, 39-90 years). The mean (SD) duration of military service was 1654 (1421) days (about 4 years, 6 months, and 10 days). Of the 35 patients included, 22 (63%) served during the Vietnam era (November 1, 1965, to April 30, 1975) and 2 (6%) served during the Persian Gulf War era (August 2, 1990, to February 28, 1991). Seventeen veterans (49%) served in the Army, 9 in the Navy (26%), 5 in the Air Force (14%), and 4 in the Marine Corps (11%). Definitive AO exposure was noted in 13 patients (37%) (Table 1).
Of the 35 patients, 24 (69%) had metastatic disease and the primary site of melanoma was unknown in 14 patients (40%). One patient (Patient 32) had an intraocular melanoma. The primary site was the trunk for 11 patients (31%), the face/head for 7 patients (20%) and extremities for 3 patients (9%). Eight patients (23%) were pT3 stage (thickness > 2 mm but < 4 mm), 7 patients (20%) were pT4 stage (thickness > 4 mm), and 5 patients (14%) were pT1 (thickness ≥ 1 mm). One patient had a primary lesion at pT2 stage, and 1 had a Tis stage lesion. Three patients (9%) had a family history of melanoma in a first-degree relative.
The list of genes mutated in melanoma cells in the study population is provided in the eAppendix.10,11 Twenty-seven patients (77%) had mutations in TERT promoter, 15 (43%) in CDKN2A/B, 13 (37%) in BRAF, 11 (31%) in NF1, 9 (26%) in TP53, and 8 (23%) in NRAS (Table 2). The majority of mutations in TERT promoter were c.- 146C>T (18 of 27 patients [67%]), whereas c.-124C>T was the second-most common (8 of 27 patients [30%]). The 2 observed mutations in the 13 patients with BRAF mutations were V600E and V600K, with almost equal distribution (54% and 46%, respectively). The mean (SD) TMB was 33.2 (39) mut/Mb (range, 1-203 mut/Mb). Ten patients (29%) had a TMB < 10 mut/Mb, whereas 24 (69%) had a TMB > 10 mut/Mb. The TMB could not be determined in 1 case. The frequency of TMB-high tumors in the study population compared with frequency in the reference population is shown in Table 3.12 Only 3 patients (0.64%) in the reference population had MSI-H tumors, and the microsatellite status could not be determined in those tumors (Table 4).13 Table 5 outlines statistically significant findings.
Agent Orange Subgroup
AO was a tactical herbicide used by the US military, named for the orange band around the storage barrels. Possible mutagenic properties of AO have been attributed to its byproduct, dioxin. Among the most common cancers known to be associated with AO exposure are bladder and prostate carcinoma and hematopoietic neoplasms. The association between genetic alterations and AO exposure was studied in veterans with prostate cancer.14 However, to our knowledge, insufficient information is available to determine whether an association exists between exposure to herbicides used in Vietnam or the contaminant dioxin and melanoma. Because a significant proportion of this study population had a well-documented history of AO exposure (37.1%), we were able to analyze them as a subgroup and to separately compare their mutation frequency with the general population.
Results were notable for different distributions of the most frequently mutated genes in the AO subgroup compared with the whole study population. As such, TERT promoter remained the most frequently mutated gene (92%), followed by CDKN2A/B (46%); however, frequency of mutations in NF1 (46%) outnumbered those of BRAF (31%), the fourth-most common mutation. Moreover, when compared with the general melanoma population, a significantly higher frequency of mutations in the NF1 gene was observed in the AO subgroup—not the entire study population.
Discussion
Given that veterans constitute a distinct population, there is reasonable interest in investigating characteristic health issues related to military service. Skin cancer—melanoma in particular—has been researched recently in a veteran population. The differences in demographics, tumor characteristics, and melanoma- specific survival in veterans compared with the general population have already been assessed. According to Chang et al, compared with the general population, veterans are more likely to present with metastatic disease and have lower 5-year survival rates.8
Melanoma is one of the most highly mutated malignancies.15 Fortunately, the most common mutation in melanoma, BRAF V600E, is now considered therapeutically targetable. However, there are still many mutations that are less often discussed and not well understood. Regardless of therapeutic implications, all mutations observed in melanoma are worth investigating because a tumor’s genomic profile also can provide prognostic and etiologic information. Developing comprehensive descriptions of melanoma mutational profiles in specific populations is critical to advancing etiologic understanding and informing prevention strategies.
Our results demonstrate the high prevalence of TERT promoter mutations with characteristic ultraviolet signature (C>T) in the study population. This aligns with general evidence that TERT promoter mutations are common in cutaneous melanomas: 77% of this study sample and up to 86% of all mutations are TERT promoter mutations, according to Davis et al.15 TERT promoter mutations are positively associated with the initiation, invasion, and metastasis of melanoma. In certain subtypes, there is evidence that the presence of TERT promoter mutations is significantly associated with risk for extranodal metastasis and death.16 The second-most common mutated gene in the veteran study population was CDKN2A/B (43%), and the third-most mutated gene was BRAF (37%).
In chronically sun-exposed skin NF1, NRAS, and occasionally BRAF V600K mutations tend to predominate. BRAF V600E mutations, on the other hand, are rare in these melanomas.15 In our study population, the most prevalent melanoma site was the trunk (31%), which is considered a location with an intermittent pattern of sun exposure.17
This study population also had a higher frequency of CDKN2A/B mutations. High frequencies of CDKN2A/B mutations have been reported in familial melanomas, but only 1 patient with CDKN2A/B mutations had a known family history of melanoma.15 Tumors in the study population showed significantly lower frequency of mutations in ROS1, GRIN2A, KDR, KMT2C (MLL3), KMT2D (MLL2), LRP1B, PTPRT, PTCH1, FAT4, and PREX2 (P < .05).
In this study the subgroup of veterans with AO exposure differed from the whole study population. As such, CDKN2A/B mutations were observed with the same frequency as NF1 mutations (46% each); however, BRAF mutations constituted only 31% of the mutations. In addition, the frequency of NF1 mutations was significantly higher in the AO subgroup compared with the general population, but not in the whole study population.
Our sample also differed from the reference population by showing a significantly higher frequency of TMB-high (ie, ≥ 10 mut/Mb) tumors (71% vs 49%; P = .01).12 Interestingly, no significant difference in the frequency of TMB-high tumors was observed between the AO subgroup and the reference population (69% vs 49%; P = .16). There also was no statistically significant difference between the frequency of MSI-H tumors in our study population and the reference population (P = .64).13
One patient in the study population had uveal melanoma. Mutations encountered in this patient’s tumor differed from the general mutational profile of tumors. None of the 21 mutations depicted in Table 2 were present in this sample.10,11 On the other hand, those mutations frequently observed in intraocular melanomas, BAP1 and GNA11, were present in this patient.18 Additionally, this particular melanoma possessed mutations in genes RICTOR, RAD21, and PIK3R1.
Limitations
This study population consisted exclusively of male patients, introducing sex as a potential confounder in analyzing differences between the study population and the general population. As noted in a 2020 systematic review, there were no sex-based differences in the frequency of mutations in BRAF, NRAS, and KIT genes.19
Regarding NF1 mutations, only NF1-mutated acral and mucosal melanomas were more frequently observed in female patients, whereas nonacral NF1-mutated melanomas were more frequently observed in male patients.20 However, there is currently no clear evidence of whether the mutational landscapes of cutaneous melanoma differ by sex.21 Among the 11 cases with NF1-mutatation, site of origin was known in 6, 5 of which originated at nonacral sites. Although the AO subgroup also consisted entirely of male patients, this does not explain the observed increased frequency of NF1 mutations relative to the general population. No such difference was observed between the whole study population, which also consisted exclusively of male patients, and the general population. The similar frequencies of nonacral location in the whole study population (3 acral, 18 nonacral, 14 unknown site of origin) and AO subgroup (1 acral, 7 nonacral, 5 unknown site of origin) preclude location as an explanation.
The Cancer Genome Atlas Network proposed a framework for genomic classification of melanoma into 4 subtypes based on the pattern of the most prevalent significantly mutated genes: mutant BRAF, mutant RAS, mutant NF1, and triple–wild-type. According to that study, BRAF mutations were indeed associated with younger age, in contrast to the NF1-mutant genomic subtype, which was more prevalent in older individuals with higher TMB.22 This emphasizes the need to interpret the potential association of AO exposure and NF1 mutation in melanoma with caution, although additional studies are required to observe the difference between the veteran population and age-matched general population.
On the other hand, Yu et al reported no significant differences of TMB values between patients aged < 60 and ≥ 60 years with melanoma.23 In short, the observed differences we report in our limited study warrant additional investigation with larger sample sizes, sex-matched controlling, and age-matched controlling. The study was limited by its small sample size and the single location.
Conclusion
The genomic profile of melanomas in the veteran population appears to be similar to that of the general population with a few possible differences. Melanomas in the veteran study population showed a higher frequency of CDKN2A/B mutations; lower frequency of ROS1, GRIN2A, KDR, KMT2C (MLL3), KMT2D (MLL2), LRP1B, PTPRT, PTCH1, FAT4, and PREX2 mutations; and higher TMB. In addition, melanomas in the AO subgroup showed higher frequencies of NF1 mutations. The significance of such findings remains to be determined by further investigation.
- Bytnar JA, McGlynn KA, et al. Cancer incidence in the US military: An updated analysis. Cancer. 2024;130(1):96-106. doi:10.1002/cncr.34978
- Singer DS. A new phase of the Cancer Moonshot to end cancer as we know it. Nat Med. 2022;28(7):1345-1347. doi:10.1038/s41591-022-01881-5
- Koczkodaj P, Sulkowska U, Didkowska J, et al. Melanoma mortality trends in 28 European countries: a retrospective analysis for the years 1960-2020. Cancers (Basel). 2023;15(5):1514. Published 2023 Feb 28. doi:10.3390/cancers15051514
- Okobi OE, Abreo E, Sams NP, et al. Trends in melanoma incidence, prevalence, stage at diagnosis, and survival: an analysis of the United States Cancer Statistics (USCS) database. Cureus. 2024;16(10):e70697. doi:10.7759/cureus.70697
- Bartling SJ, Rivard SC, Meyerle JH. Melanoma in an active duty marine. Mil Med. 2017;182:e2034-e2039. doi:10.7205/MILMED-D-17-00127
- American Cancer Society. Cancer facts & figures 2023. American Cancer Society; 2023. Accessed June 20, 2025. https://www.cancer.org/content/dam/cancer-org/research/cancer-facts-and-statistics/annual-cancer-facts-and-figures/2023/2023-cancer-facts-and-figures.pdf
- Rezaei SJ, Kim J, Onyeka S, et al. Skin cancer and other dermatologic conditions among US veterans. JAMA Dermatol. 2024;160(10):1107-1111. doi:10.1001/jamadermatol.2024.3043
- Chang MS, La J, Trepanowski N, et al. Increased relative proportions of advanced melanoma among veterans: a comparative analysis with the Surveillance, Epidemiology, and End Results registry. J Am Acad Dermatol. 2022;87:72-79. doi:10.1016/j.jaad.2022.02.063
- Riemenschneider K, Liu J, Powers JG. Skin cancer in the military: a systematic review of melanoma and nonmelanoma skin cancer incidence, prevention, and screening among active duty and veteran personnel. J Am Acad Dermatol. 2018;78:1185-1192. doi:10.1016/j.jaad.2017.11.062
- Huang FW, Hodis E, Xu MJ, et al. Highly recurrent TERT promoter mutations in human melanoma. Science. 2013;339:957-959. doi:10.1126/science.1229259
- Tate JG, Bamford S, Jubb HC, et al. COSMIC: the Catalogue of Somatic Mutations in Cancer. Nucleic Acids Res. 2019;47:D941-D947. doi:10.1093/nar/gky1015
- Li M, Gao X, Wang X. Identification of tumor mutation burden-associated molecular and clinical features in cancer by analyzing multi-omics data. Front Immunol. 2023;14:1090838. doi:10.3389/fimmu.2023.1090838
- Bonneville R, Krook MA, Kautto EA, et al. Landscape of microsatellite instability across 39 cancer types. JCO Precis Oncol. 2017;2017:PO.17.00073. doi:10.1200/PO.17.00073
- Lui AJ, Pagadala MS, Zhong AY, et al. Agent Orange exposure and prostate cancer risk in the Million Veteran Program. medRxiv [Preprint]. 2023:2023.06.14.23291413. doi:10.1101/2023.06.14.23291413
- Davis EJ, Johnson DB, Sosman JA, et al. Melanoma: what do all the mutations mean? Cancer. 2018;124:3490-3499. doi:10.1002/cncr.31345
- Guo Y, Chen Y, Zhang L, et al. TERT promoter mutations and telomerase in melanoma. J Oncol. 2022;2022:6300329. doi:10.1155/2022/6300329
- Whiteman DC, Stickley M, Watt P, et al. Anatomic site, sun exposure, and risk of cutaneous melanoma. J Clin Oncol. 2006;24:3172-3177. doi:10.1200/JCO.2006.06.1325
- Decatur CL, Ong E, Garg N, et al. Driver mutations in uveal melanoma: associations with gene expression profile and patient outcomes. JAMA Ophthalmol. 2016;134:728-733. doi:10.1001/jamaophthalmol.2016.0903
- Gutiérrez-Castañeda LD, Nova JA, Tovar-Parra JD. Frequency of mutations in BRAF, NRAS, and KIT in different populations and histological subtypes of melanoma: a systemic review. Melanoma Res. 2020;30:62- 70. doi:10.1097/CMR.0000000000000628
- Thielmann CM, Chorti E, Matull J, et al. NF1-mutated melanomas reveal distinct clinical characteristics depending on tumour origin and respond favourably to immune checkpoint inhibitors. Eur J Cancer. 2021;159:113-124. doi:10.1016/j.ejca.2021.09.035
- D’Ecclesiis O, Caini S, Martinoli C, et al. Gender-dependent specificities in cutaneous melanoma predisposition, risk factors, somatic mutations, prognostic and predictive factors: a systematic review. Int J Environ Res Public Health. 2021;18:7945. doi:10.3390/ijerph18157945
- Cancer Genome Atlas Network. Genomic classification of cutaneous melanoma. Cell. 2015;161:1681-1696. doi:10.1016/j.cell.2015.05.044
- Yu Z, Wang J, Feng L, et al. Association of tumor mutational burden with age in solid tumors. J Clin Oncol. 2020;38:e13590-e13590. doi:10.1200/JCO.2020.38.15_suppl.e13590
Comprehensive Genomic Profiles of Melanoma in Veterans Compared to Reference Databases
Comprehensive Genomic Profiles of Melanoma in Veterans Compared to Reference Databases


Colorectal Cancer Characteristics and Mortality From Propensity Score-Matched Cohorts of Urban and Rural Veterans
Colorectal Cancer Characteristics and Mortality From Propensity Score-Matched Cohorts of Urban and Rural Veterans
Colorectal cancer (CRC) is the second-leading cause of cancer-related deaths in the United States, with an estimated 52,550 deaths in 2023.1 However, the disease burden varies among different segments of the population.2 While both CRC incidence and mortality have been decreasing due to screening and advances in treatment, there are disparities in incidence and mortality across the sociodemographic spectrum including race, ethnicity, education, and income.1-4 While CRC incidence is decreasing for older adults, it is increasing among those aged < 55 years.5 The incidence of CRC in adults aged 40 to 54 years has increased by 0.5% to 1.3% annually since the mid-1990s.6 The US Preventive Services Task Force now recommends starting CRC screening at age 45 years for asymptomatic adults with average risk.7
Disparities also exist across geographical boundaries and living environment. Rural Americans faces additional challenges in health and lifestyle that can affect CRC outcomes. Compared to their urban counterparts, rural residents are more likely to be older, have lower levels of education, higher levels of poverty, lack health insurance, and less access to health care practitioners (HCPs).8-10 Geographic proximity, defined as travel time or physical distance to a health facility, has been recognized as a predictor of inferior outcomes.11 These aspects of rural living may pose challenges for accessing care for CRC screening and treatment.11-13 National and local studies have shown disparities in CRC screening rates, incidence, and mortality between rural and urban populations.14-16
It is unclear whether rural/urban disparities persist under the Veterans Health Administration (VHA) health care delivery model. This study examined differences in baseline characteristics and mortality between rural and urban veterans newly diagnosed with CRC. We also focused on a subpopulation aged ≤ 45 years.
Methods
This study extracted national data from the US Department of Veterans Affairs (VA) Corporate Data Warehouse (CDW) hosted in the VA Informatics and Computing Infrastructure (VINCI) environment. VINCI is an initiative to improve access to VA data and facilitate the analysis of these data while ensuring veterans’ privacy and data security.17 CDW is the VHA business intelligence information repository, which extracts data from clinical and nonclinical sources following prescribed and validated protocols. Data extracted included demographics, diagnosis, and procedure codes for both inpatient and outpatient encounters, vital signs, and vital status. This study used data previously extracted from a national cohort of veterans that encompassed all patients who received a group of commonly prescribed medications, such as statins, proton pump inhibitors, histamine-2 blockers, acetaminophen-containing products, and hydrocortisone-containing skin applications. This cohort encompassed 8,648,754 veterans, from whom 2,460,727 had encounters during fiscal years (FY) 2016 to 2021 (study period). The cohort was used to ensure that subjects were VHA patients, allowing them to adequately capture their clinical profiles.
Patients were identified as rural or urban based on their residence address at the date of their first diagnosis of CRC. The Geospatial Service Support Center (GSSC) aggregates and updates veterans’ residence address records for all enrolled veterans from the National Change of Address database. The data contain 1 record per enrollee. GSSC Geocoded Enrollee File contains enrollee addresses and their rurality indicators, categorized as urban, rural, or highly rural.18 Rurality is defined by the Rural Urban Commuting Area (RUCA) categories developed by the Department of Agriculture and the Health Resources and Services Administration of the US Department of Health and Human Services.19 Urban areas had RUCA codes of 1.0 to 1.1, and highly rural areas had RUCA scores of 10.0. All other areas were classified as rural. Since the proportion of veterans from highly rural areas was small, we included residents from highly rural areas in the rural residents’ group.
Inclusion and Exclusion Criteria
All veterans newly diagnosed with CRC from FY 2016 to 2021 were included. We used the ninth and tenth clinical modification revisions of the International Classification of Diseases (ICD-9-CM and ICD-10-CM) to define CRC diagnosis (Supplemental materials).4,20 To ensure that patients were newly diagnosed with CRC, this study excluded patients with a previous ICD-9-CM code for CRC diagnosis since FY 2003.
Comorbidities were identified using diagnosis and procedure codes from inpatient and outpatient encounters, which were used to calculate the Charlson Comorbidity Index (CCI) at the time of CRC diagnosis using the weighted method described by Schneeweiss et al.21 We defined CRC high-risk conditions and CRC screening tests, including flexible sigmoidoscopy and stool tests, as described in previous studies (Supplemental materials).20
The main outcome was total mortality. The date of death was extracted from the VHA Death Ascertainment File, which contains mortality data from the Master Person Index file in CDW and the Social Security Administration Death Master File. We used the date of death from any cause, as cause of death was not available.
A propensity score (PS) was created to match rural (including highly rural) and urban residents at a ratio of 1:1. Using a standard procedure described in prior publications, multivariable logistic regression used all baseline characteristics to estimate the PS and perform nearest-number matching without replacement.22,23 A caliper of 0.01 maximized the matched cohort size and achieved balance (Supplemental materials). We then examined the balance of baseline characteristics between PS-matched groups.
Analyses
Cox proportional hazards regression analysis estimated the hazard ratio (HR) of death in rural residents compared to urban residents in the PS-matched cohort. The outcome event was the date of death during the study’s follow-up period (defined as period from first CRC diagnosis to death or study end), with censoring at the study’s end date (September 30, 2021). The proportional hazards assumption was assessed by inspecting the Kaplan-Meier curves. Multiple analyses examined the HR of total mortality in the PS-matched cohort, stratified by sex, race, and ethnicity. We also examined the HR of total mortality stratified by duration of follow-up.
Another PS-matching analysis among veterans aged ≤ 45 years was performed using the same techniques described earlier in this article. We performed a Cox proportional hazards regression analysis to compare mortality in PS-matched urban and rural veterans aged ≤ 45 years. The HR of death in all veterans aged ≤ 45 years (before PS-matching) was estimated using Cox proportional hazard regression analysis, adjusting for PS.
Dichotomous variables were compared using X2 tests and continuous variables were compared using t tests. Baseline characteristics with missing values were converted into categorical variables and the proportion of subjects with missing values was equalized between treatment groups after PS-matching. For subgroup analysis, we examined the HR of total mortality in each subgroup using separate Cox proportional hazards regression models similar to the primary analysis but adjusted for PS. Due to multiple comparisons in the subgroup analysis, the findings should be considered exploratory. Statistical tests were 2-tailed, and significance was defined as P < .05. Data management and statistical analyses were conducted from June 2022 to January 2023 using STATA, Version 17. The VA Orlando Healthcare System Institutional Review Board approved the study and waived requirements for informed consent because only deidentified data were used.
Results
After excluding 49 patients (Supplemental materials, available at doi:10.12788/fp.0560), we identified 30,219 veterans with newly diagnosed CRC between FY 2016 to 2021 (Table 1). Of these, 19,422 (64.3%) resided in urban areas and 10,797 (35.7%) resided in rural areas (Table 2). The mean (SD) duration from the first CRC diagnosis to death or study end was 832 (640) days, and the median (IQR) was 723 (246–1330) days. Overall, incident CRC diagnoses were numerically highest in FY 2016 and lowest in FY 2020 (Figure 1). Patients with CRC in rural areas vs urban areas were significantly older (mean, 71.2 years vs 70.8 years, respectively; P < .001), more likely to be male (96.7% vs 95.7%, respectively; P < .001), more likely to be White (83.6% vs 67.8%, respectively; P < .001) and more likely to be non-Hispanic (92.2% vs 87.5%, respectively; P < .001). In terms of general health, rural veterans with CRC were more likely to be overweight or obese (81.5% rural vs 78.5% urban; P < .001) but had fewer mean comorbidities as measured by CCI (5.66 rural vs 5.90 urban; P < .001). A higher proportion of rural veterans with CRC had received stool-based (fecal occult blood test or fecal immunochemical test) CRC screening tests (61.6% rural vs 57.2% urban; P < .001). Fewer rural patients presented with systemic symptoms or signs within 1 year of CRC diagnosis (54.4% rural vs 57.5% urban, P < .001). Among urban patients with CRC, 6959 (35.8%) deaths were observed, compared with 3766 (34.9%) among rural patients (P = .10).
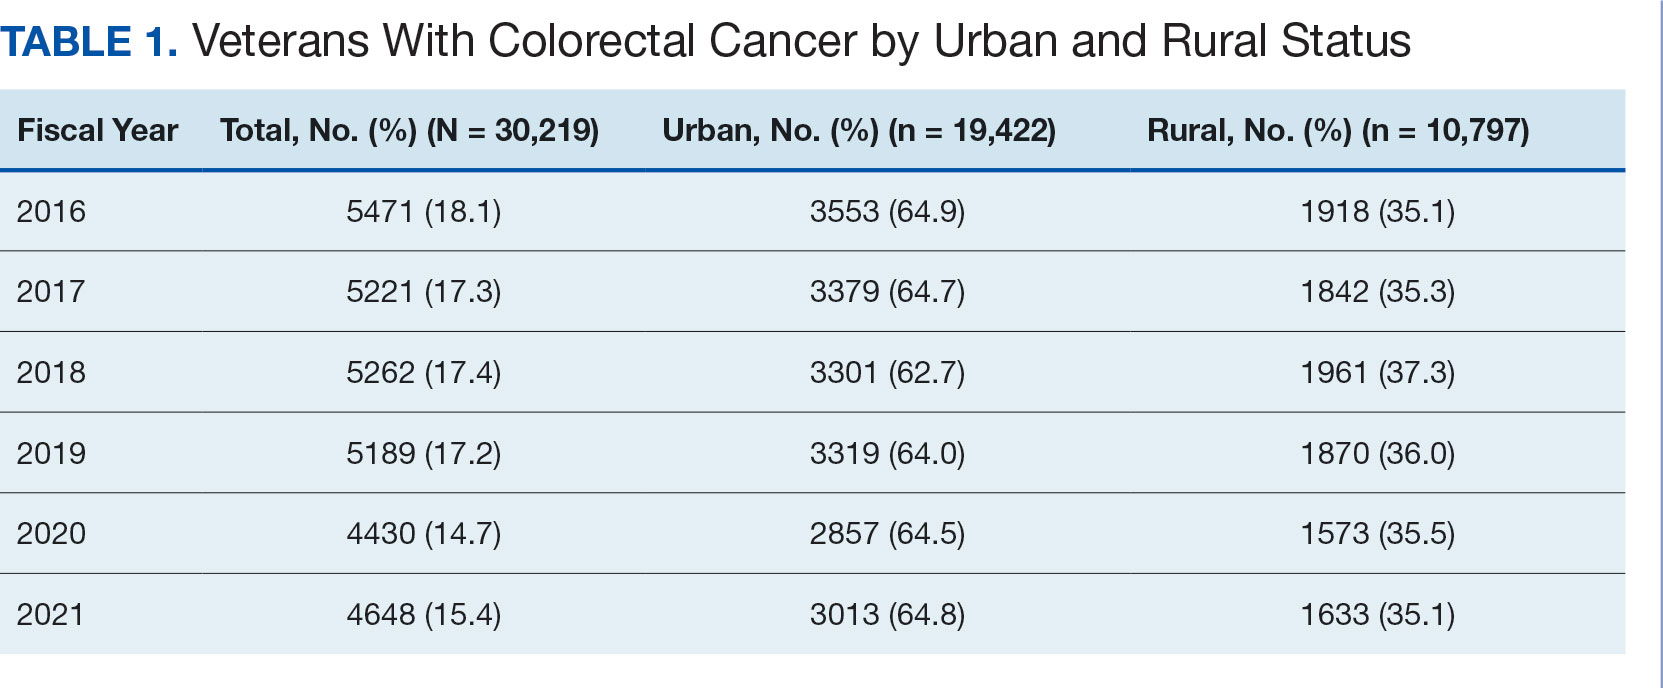
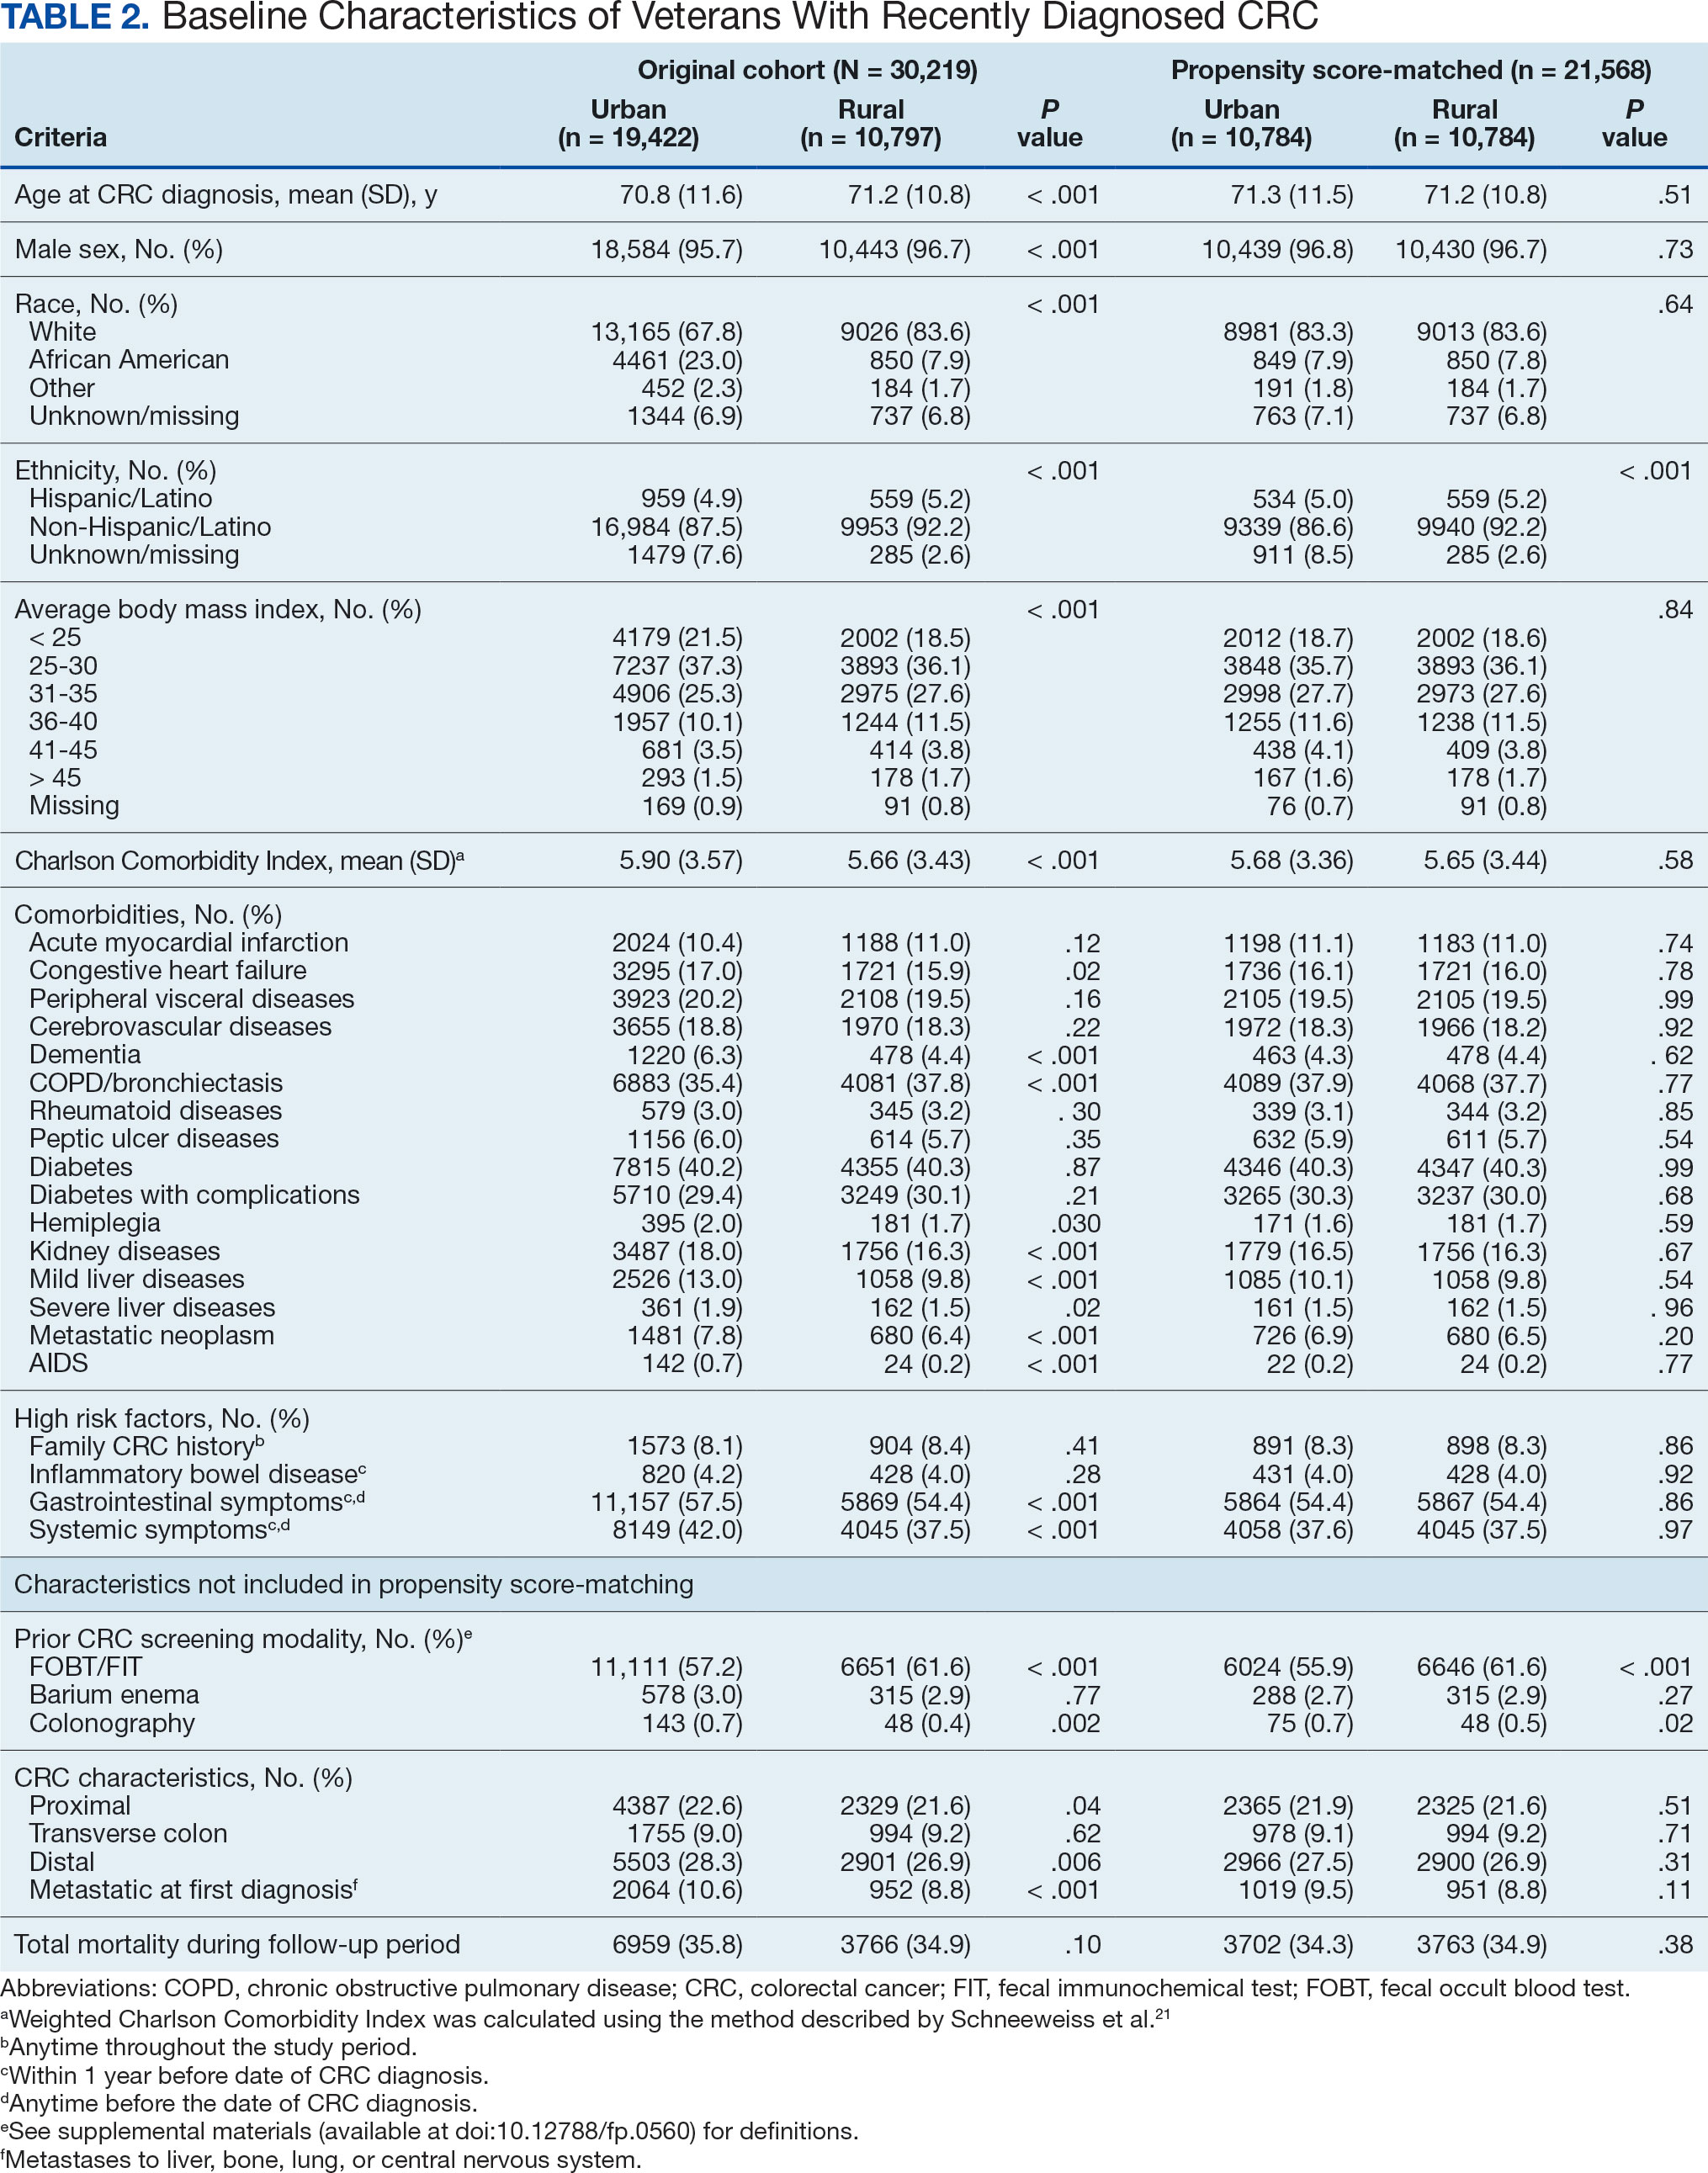
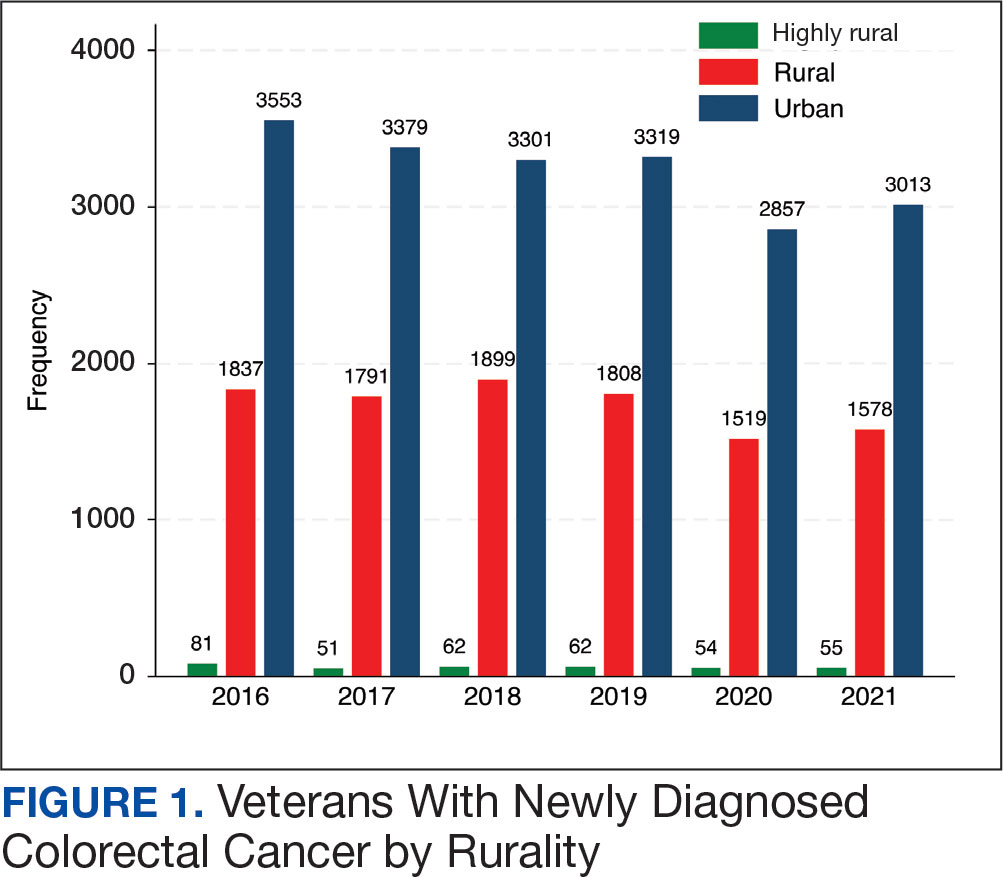
There were 21,568 PS-matched veterans: 10,784 in each group. In the PS-matched cohort, baseline characteristics were similar between veterans in urban and rural communities, including age, sex, race/ethnicity, body mass index, and comorbidities. Among rural patients with CRC, 3763 deaths (34.9%) were observed compared with 3702 (34.3%) among urban veterans. There was no significant difference in the HR of mortality between rural and urban CRC residents (HR, 1.01; 95% CI, 0.97-1.06; P = .53) (Figure 2).
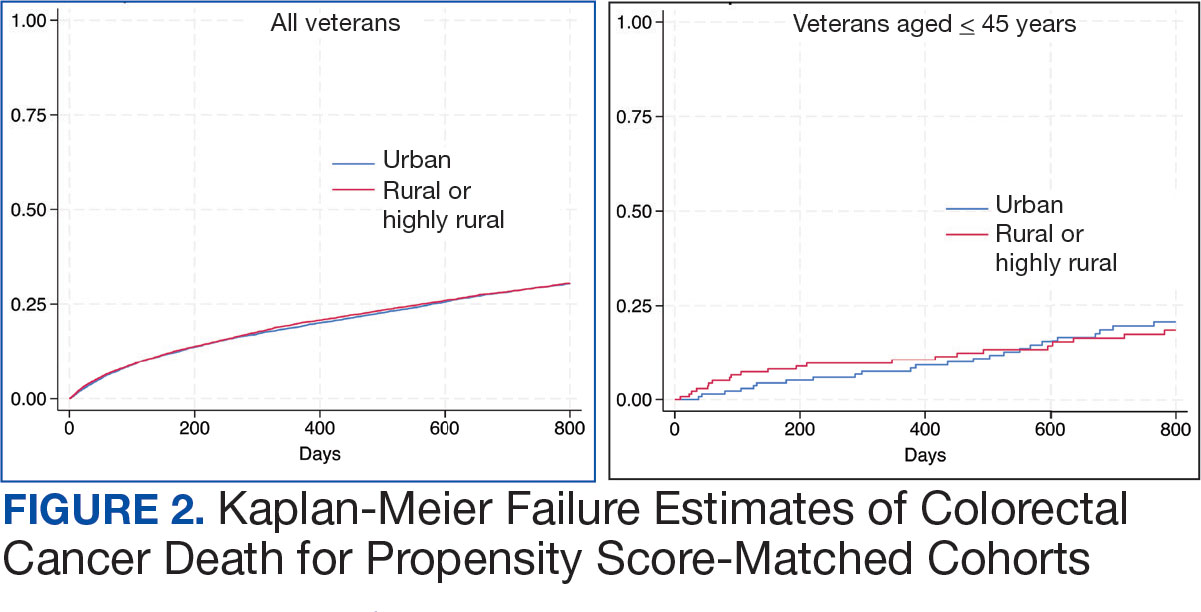
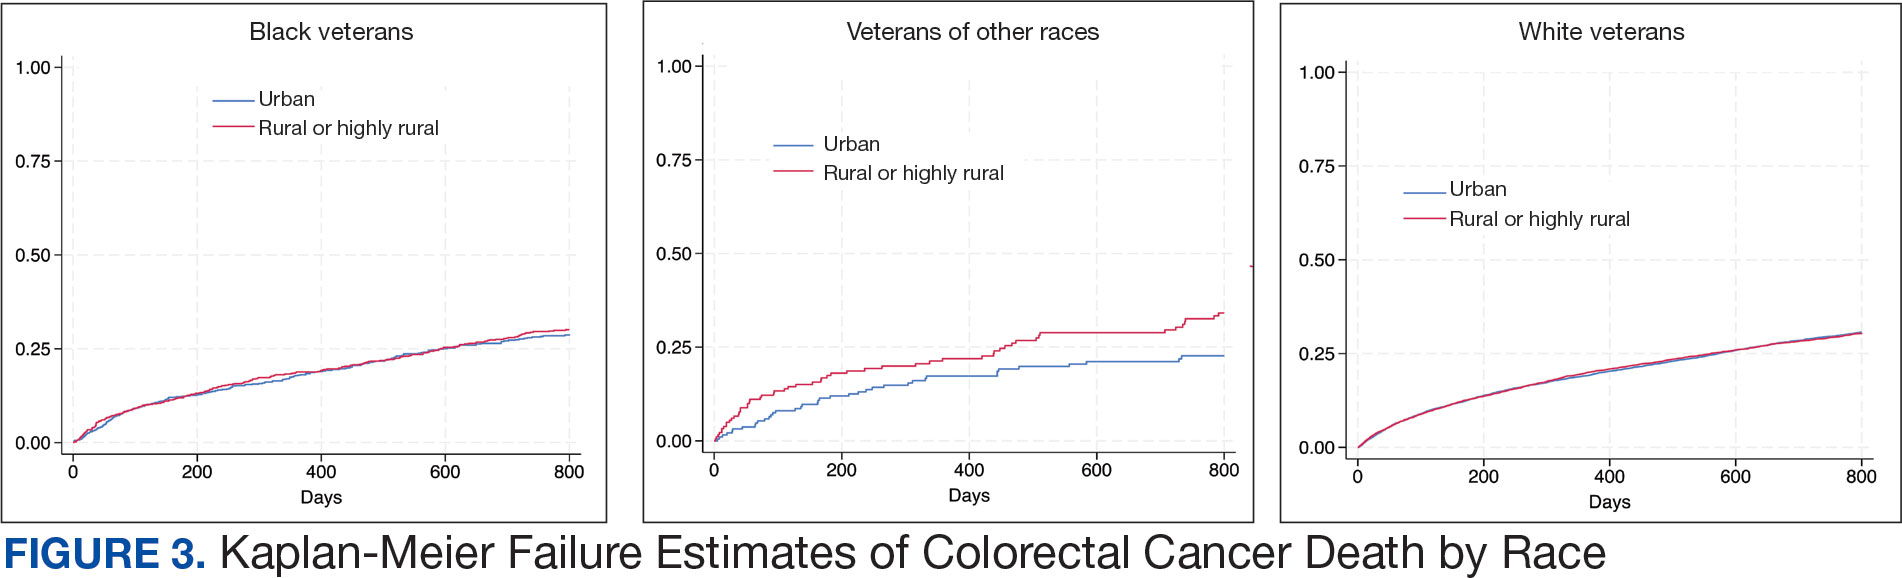
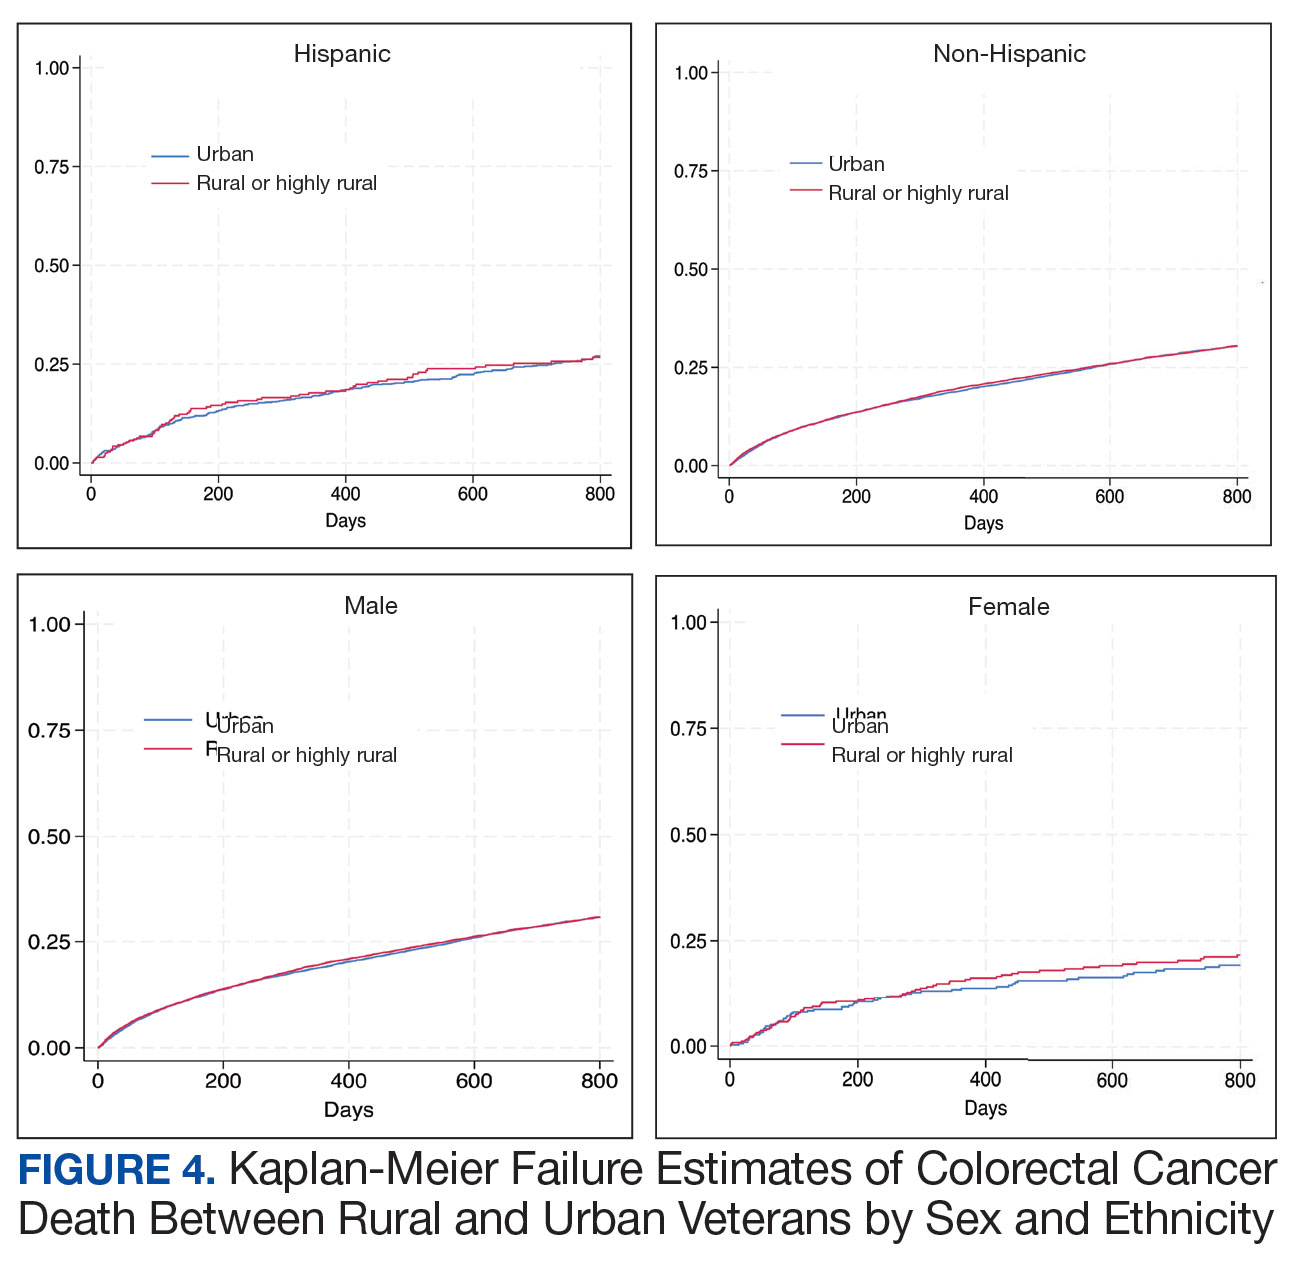
Among veterans aged ≤ 45 years, 551 were diagnosed with CRC (391 urban and 160 rural). We PS-matched 142 pairs of urban and rural veterans without residual differences in baseline characteristics (eAppendix 1). There was no significant difference in the HR of mortality between rural and urban veterans aged ≤ 45 years (HR, 0.97; 95% CI, 0.57-1.63; P = .90) (Figure 2). Similarly, no difference in mortality was observed adjusting for PS between all rural and urban veterans aged ≤ 45 years (HR, 1.03; 95% CI, 0.67-1.59; P = .88).
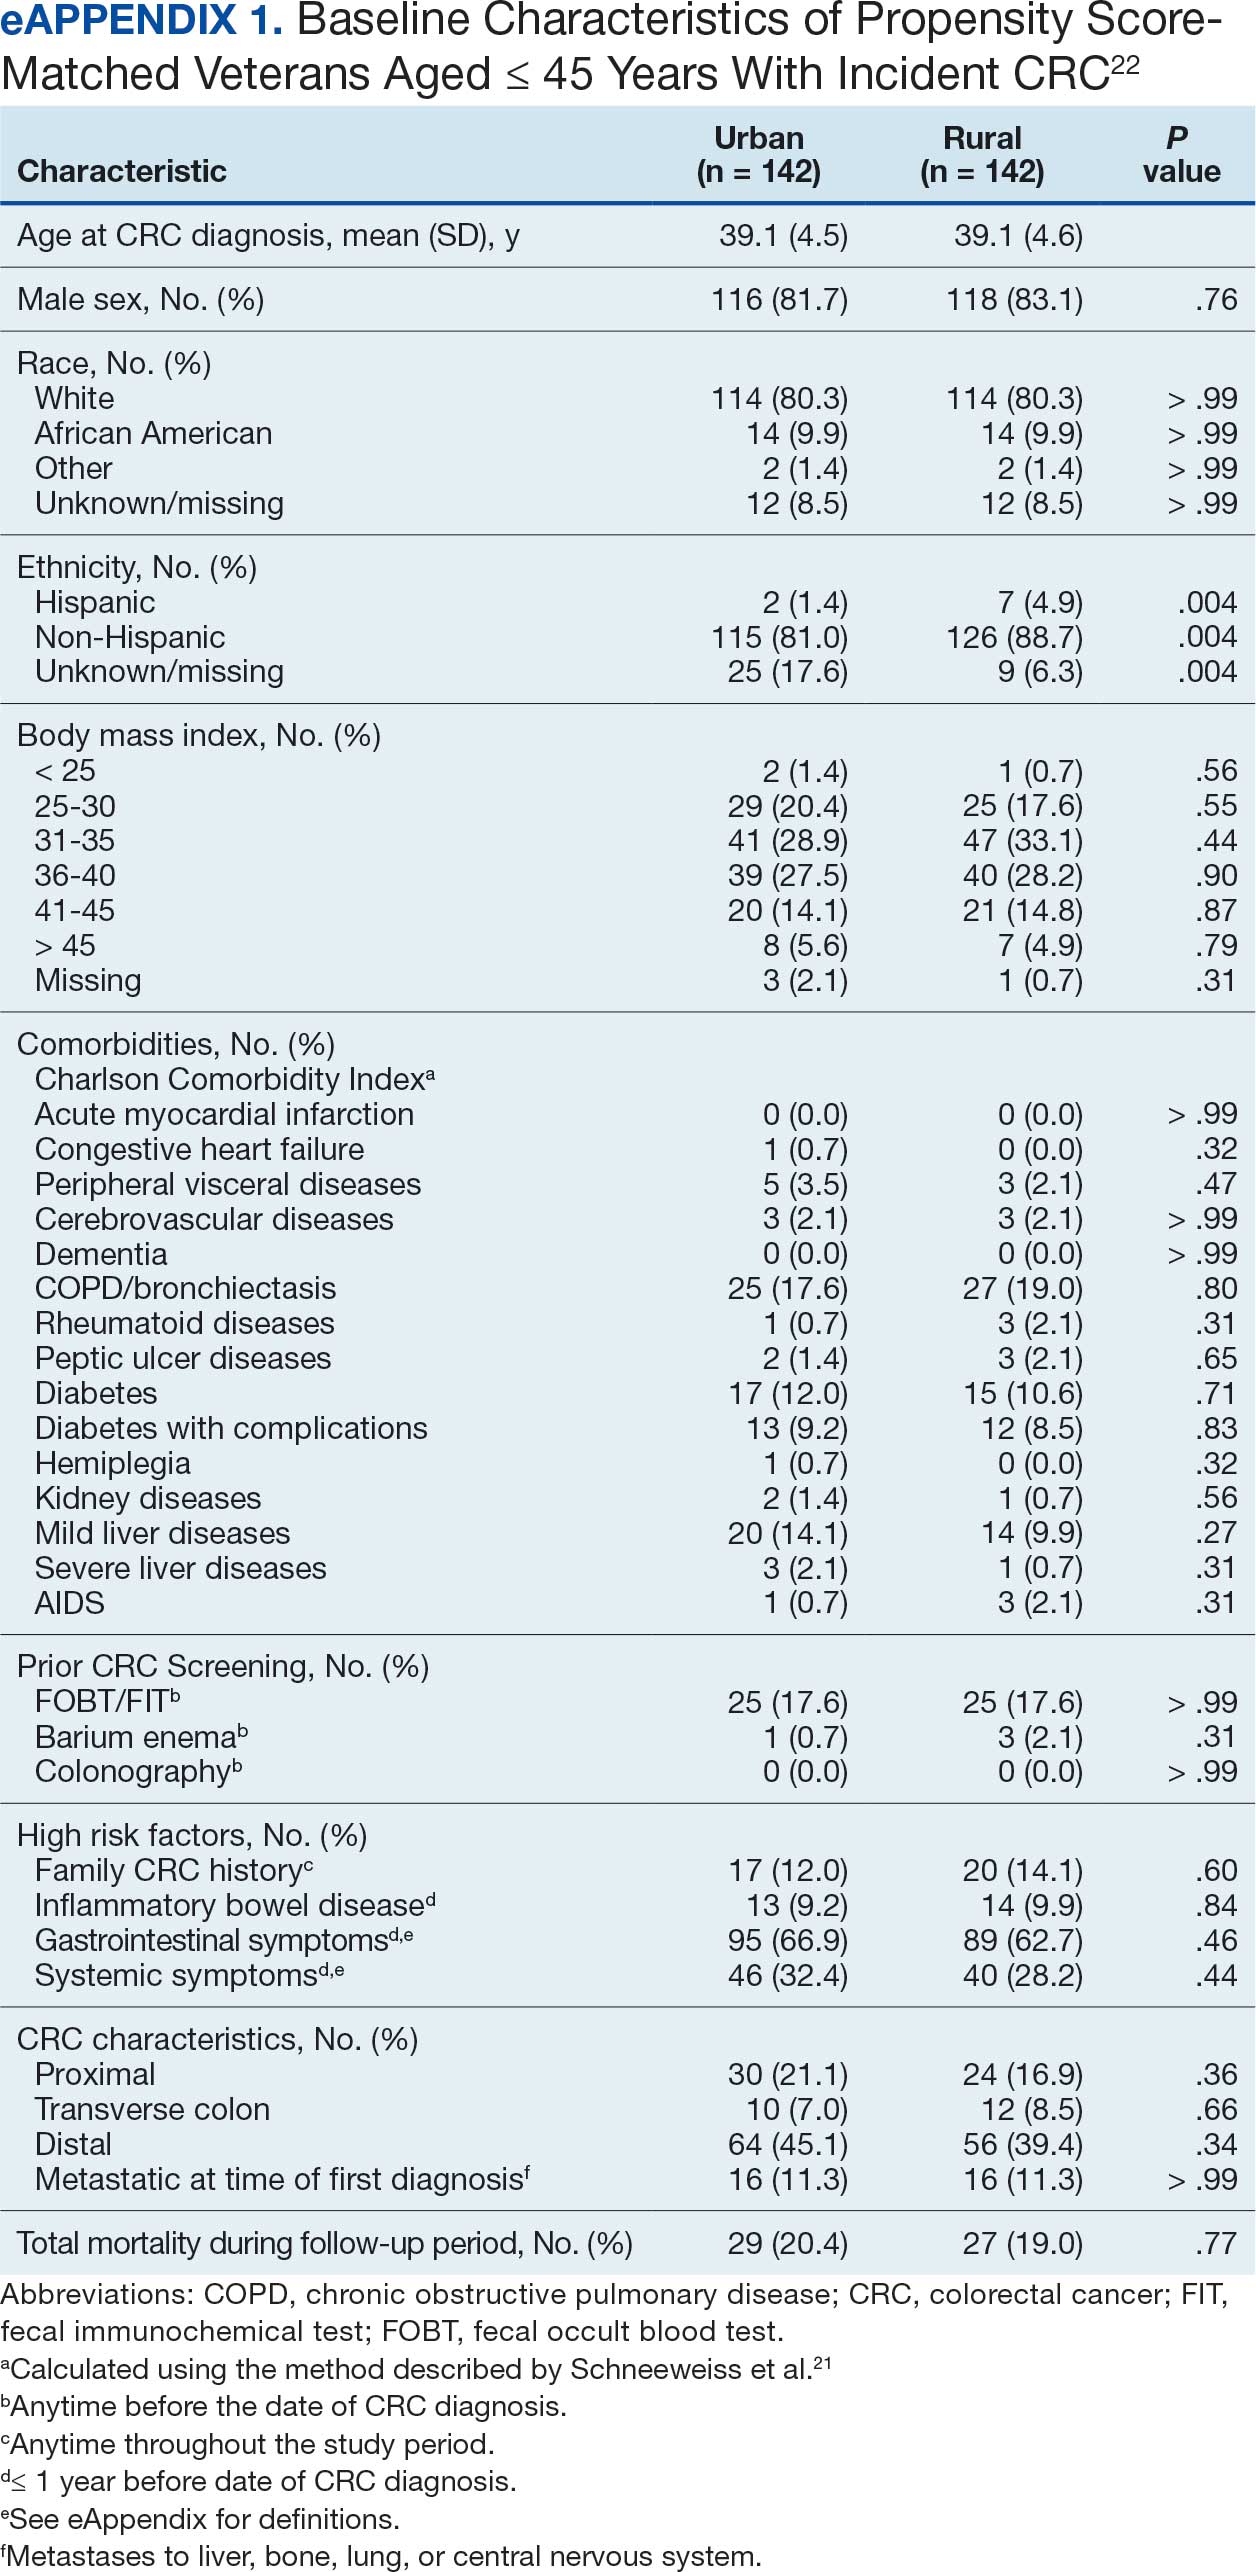
There was no difference in total mortality between rural and urban veterans in any subgroup except for American Indian or Alaska Native veterans (HR, 2.41; 95% CI, 1.29-4.50; P = .006) (eAppendix 2).
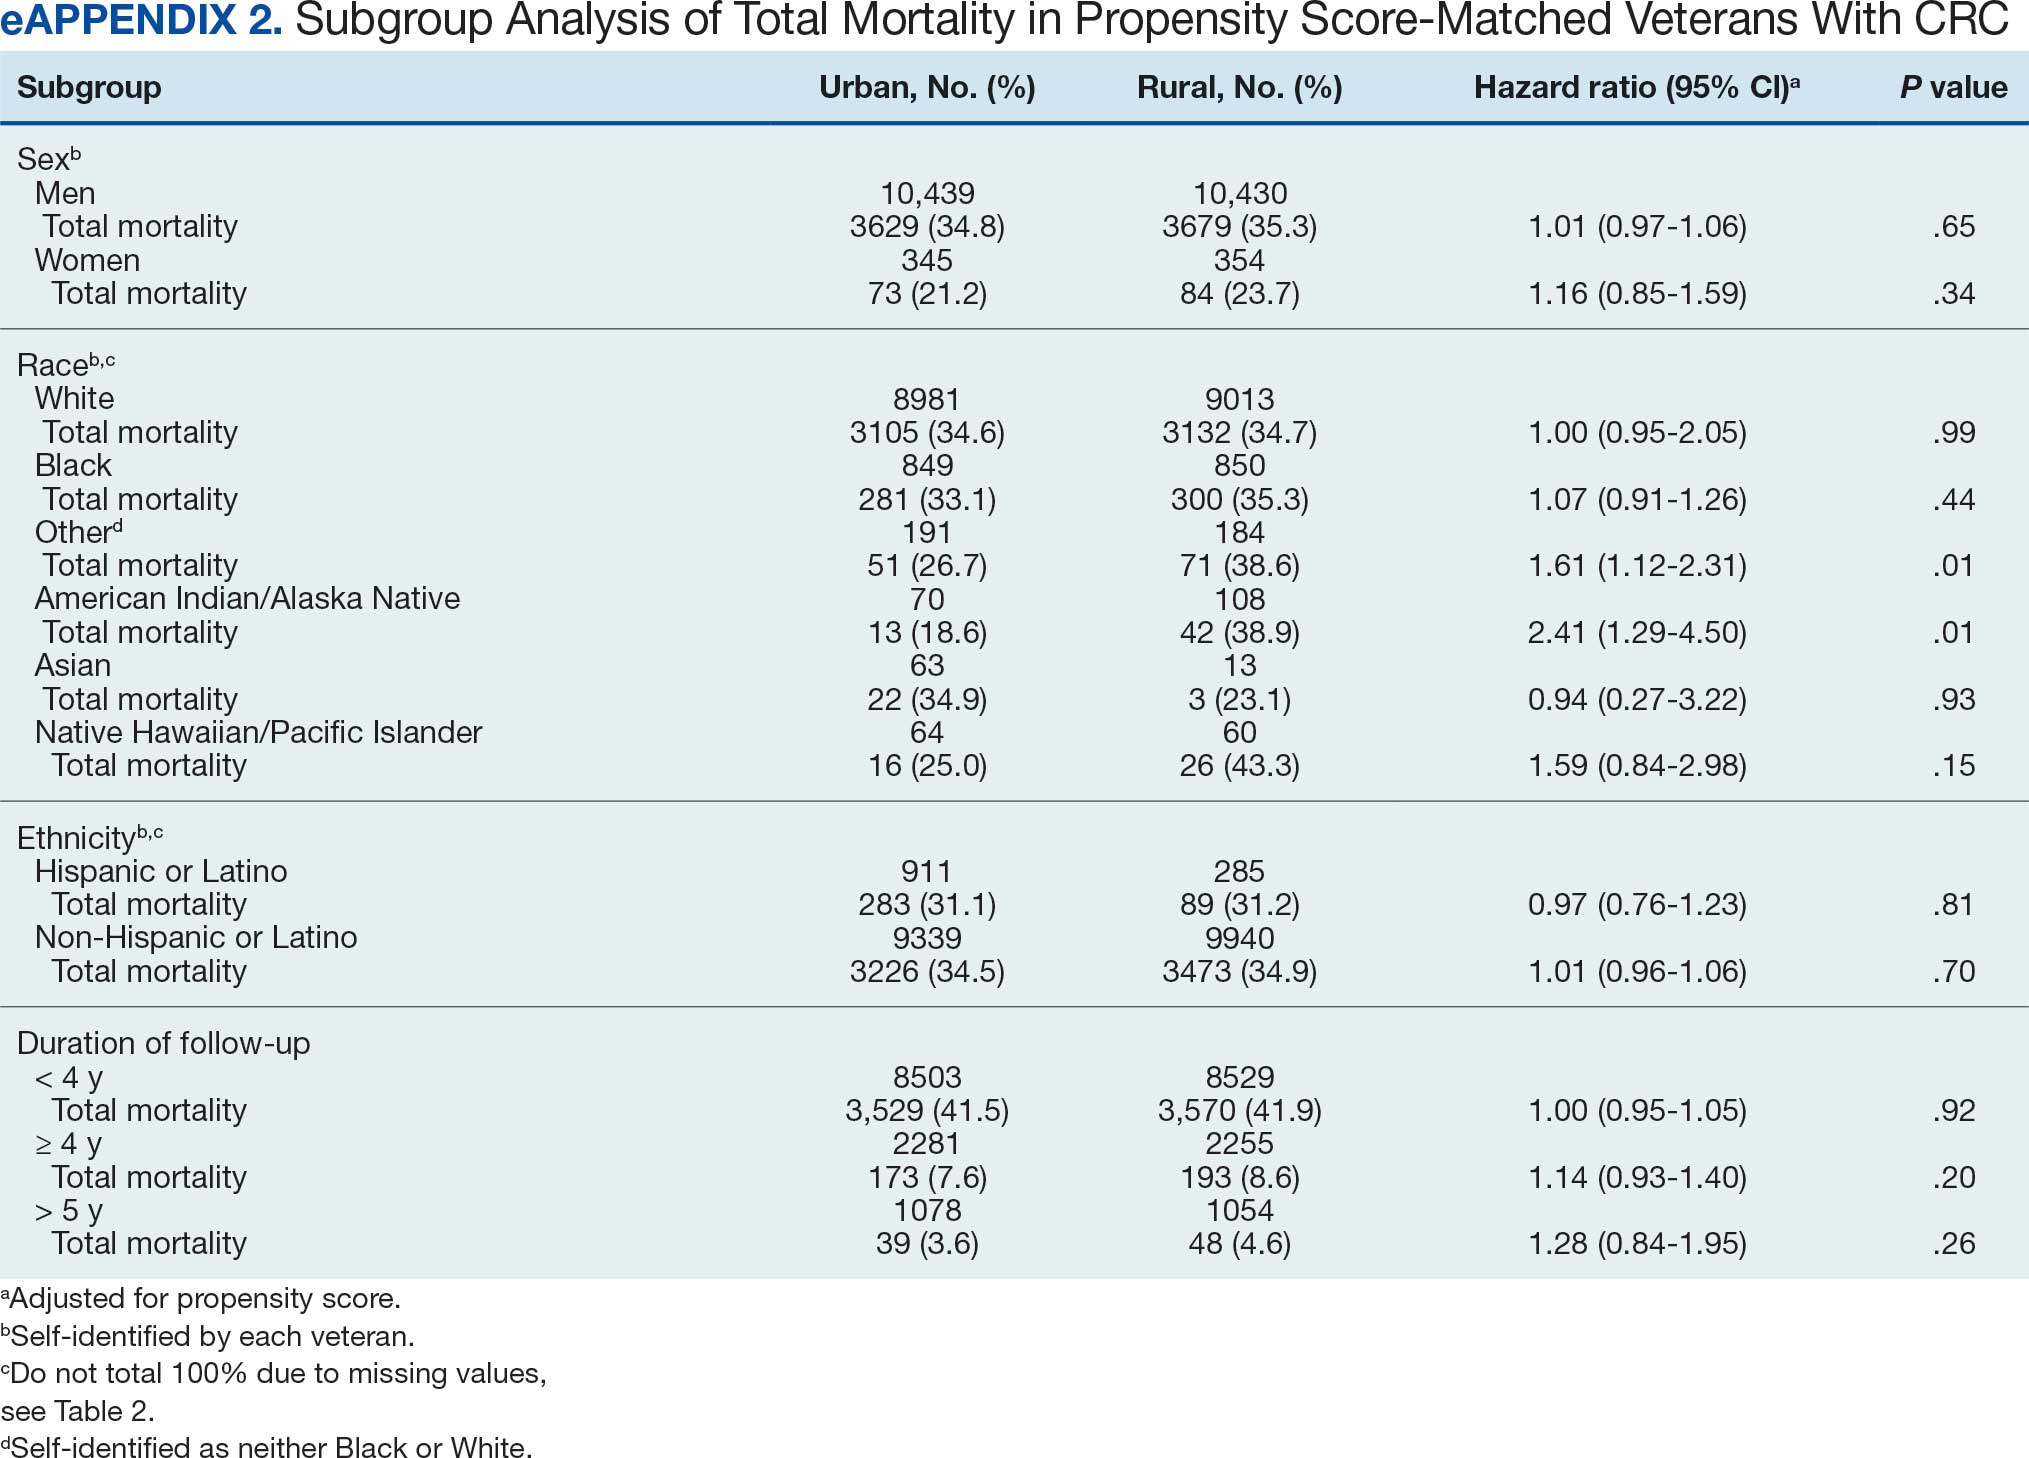
Discussion
This study examined characteristics of patients with CRC between urban and rural areas among veterans who were VHA patients. Similar to other studies, rural veterans with CRC were older, more likely to be White, and were obese, but exhibited fewer comorbidities (lower CCI and lower incidence of congestive heart failure, dementia, hemiplegia, kidney diseases, liver diseases and AIDS, but higher incidence of chronic obstructive lung disease).8,16 The incidence of CRC in this study population was lowest in FY 2020, which was reported by the Centers for Disease Control and Prevention and is attributed to COVID-19 pandemic disruption of health services.24 The overall mortality in this study was similar to rates reported in other studies from the VA Central Cancer Registry.4 In the PS-matched cohort, where baseline characteristics were similar between urban and rural patients with CRC, we found no disparities in CRC-specific mortality between veterans in rural and urban areas. Additionally, when analysis was restricted to veterans aged ≤ 45 years, the results remained consistent.
Subgroup analyses showed no significant difference in mortality between rural and urban areas by sex, race or ethnicity, except rural American Indian or Alaska Native veterans who had double the mortality of their urban counterparts (HR, 2.41; 95% CI, 1.29-4.50; P = .006). This finding is difficult to interpret due to the small number of events and the wide CI. While with a Bonferroni correction the adjusted P value was .08, which is not statistically significant, a previous study found that although CRC incidence was lower overall in American Indian or Alaska Native populations compared to non-Hispanic White populations, CRC incidence was higher among American Indian or Alaska Native individuals in some areas such as Alaska and the Northern Plains.25,26 Studies have noted that rural American Indian/Alaska Native populations experience greater poverty, less access to broadband internet, and limited access to care, contributing to poorer cancer outcomes and lower survival.27 Thus, the finding of disparity in mortality between rural and urban American Indian or Alaska Native veterans warrants further study.
Other studies have raised concerns that CRC disproportionately affects adults in rural areas with higher mortality rates.14-16 These disparities arise from sociodemographic factors and modifiable risk factors, including physical activity, dietary patterns, access to cancer screening, and gaps in quality treatment resources.16,28 These factors operate at multiple levels: from individual, local health system, to community and policy.2,27 For example, a South Carolina study (1996–2016) found that residents in rural areas were more likely to be diagnosed with advanced CRC, possibly indicating lower rates of CRC screening in rural areas. They also had higher likelihood of death from CRC.15 However, the study did not include any clinical parameters, such as comorbidities or obesity. A statewide, population-based study in Utah showed that rural men experienced a lower CRC survival in their unadjusted analysis.16 However, the study was small, with only 3948 urban and 712 rural residents. Additionally, there was no difference in total mortality in the whole cohort (HR, 0.96; 95% CI, 0.86-1.07) or in CRC-specific death (HR, 0.93; 95% CI, 0.81-1.08). A nationwide study also showed that CRC mortality rates were 8% higher in nonmetropolitan or rural areas than in the most urbanized areas containing large metropolitan counties.29 However, this study did not include descriptions of clinical confounders, such as comorbidities, making it difficult to ascertain whether the difference in CRC mortality was due to rurality or differences in baseline risk characteristics.
In this study, the lack of CRC-specific mortality disparities may be attributed to the structures and practices of VHA health care. Recent studies have noted that mortality of several chronic medical conditions treated at the VHA was lower than at non-VHA hospitals.30,31 One study that measured the quality of nonmetastatic CRC care based on National Comprehensive Cancer Network guidelines showed that > 72% of VHA patients received guideline-concordant care for each diagnostic and therapeutic measure, except for follow-up colonoscopy timing, which appear to be similar or superior to that of the private sector.30,32,33 Some of the VA initiative for CRC screening may bypass the urban-rurality divide such as the mailed fecal immunochemical test program for CRC. This program was implemented at the onset of the COVID-19 pandemic to avoid disruptions of medical care.34 Rural patients are more likely to undergo fecal immunochemical testing when compared to urban patients in this data. Beyond clinical care, the VHA uses processes to tackle social determinants of health such as housing, food security, and transportation, promoting equal access to health care, and promoting cultural competency among HCPs.35-37
The results suggest that solutions to CRC disparities between rural and urban areas need to consider known barriers to rural health care, including transportation, diminished rural health care workforce, and other social determinants of health.9,10,27,38 VHA makes considerable efforts to provide equitable care to all enrolled veterans, including specific programs for rural veterans, including ongoing outreach.39 This study demonstrated lack of disparity in CRC-specific mortality in veterans receiving VHA care, highlighting the importance of these efforts.
Strengths and Limitations
This study used the VHA cohort to compare patient characteristics and mortality between patients with CRC residing in rural and urban areas. The study provides nationwide perspectives on CRC across the geographical spectrum and used a longitudinal cohort with prolonged follow-up to account for comorbidities.
However, the study compared a cohort of rural and urban veterans enrolled in the VHA; hence, the results may not reflect CRC outcomes in veterans without access to VHA care. Rurality has been independently associated with decreased likelihood of meeting CRC screening guidelines among veterans and military service members.38 This study lacked sufficient information to compare CRC staging or treatment modalities among veterans. Although the data cannot identify CRC stage, the proportions of patients with metastatic CRC at diagnosis and CRC location were similar between groups. The study did not have information on their care outside of VHA setting.
This study could not ascertain whether disparities existed in CRC treatment modality since rural residence may result in referral to community-based CRC care, which did not appear in the data. To address these limitations, we used death from any cause as the primary outcome, since death is a hard outcome and is not subject to ascertainment bias. The relatively short follow-up time is another limitation, though subgroup analysis by follow-up did not show significant differences. Despite PS matching, residual unmeasured confounding may exist between urban and rural groups. The predominantly White, male VHA population with high CCI may limit the generalizability of the results.
Conclusions
Rural VHA enrollees had similar survival rates after CRC diagnosis compared to their urban counterparts in a PS-matched analysis. The VHA models of care—including mailed CRC screening tools, several socioeconomic determinants of health (housing, food security, and transportation), and promoting equal access to health care, as well as cultural competency among HCPs—HCPs—may help alleviate disparities across the rural-urban spectrum. The VHA should continue efforts to enroll veterans and provide comprehensive coordinated care in community partnerships.
- Siegel RL, Wagle NS, Cercek A, Smith RA, Jemal A. Colorectal cancer statistics, 2023. CA Cancer J Clin. 2023;73(3):233-254. doi:10.3322/caac.21772
- Carethers JM, Doubeni CA. Causes of socioeconomic disparities in colorectal cancer and intervention framework and strategies. Gastroenterology. 2020;158(2):354-367. doi:10.1053/j.gastro.2019.10.029
- Murphy G, Devesa SS, Cross AJ, Inskip PD, McGlynn KA, Cook MB. Sex disparities in colorectal cancer incidence by anatomic subsite, race and age. Int J Cancer. 2011;128(7):1668-75. doi:10.1002/ijc.25481
- Zullig LL, Smith VA, Jackson GL, et al. Colorectal cancer statistics from the Veterans Affairs central cancer registry. Clin Colorectal Cancer. 2016;15(4):e199-e204. doi:10.1016/j.clcc.2016.04.005
- Lin JS, Perdue LA, Henrikson NB, Bean SI, Blasi PR. Screening for Colorectal Cancer: An Evidence Update for the US Preventive Services Task Force. 2021. U.S. Preventive Services Task Force Evidence Syntheses, formerly Systematic Evidence Reviews:Chapter 1. Agency for Healthcare Research and Quality (US); 2021. Accessed February 18, 2025. https://www.ncbi.nlm.nih.gov/books/NBK570917/
- Siegel RL, Fedewa SA, Anderson WF, et al. Colorectal cancer incidence patterns in the United States, 1974-2013. J Natl Cancer Inst. 2017;109(8). doi:10.1093/jnci/djw322
- Davidson KW, Barry MJ, Mangione CM, et al. Screening for colorectal cancer: US Preventive Services Task Force recommendation statement. JAMA. 2021;325(19):1965-1977. doi:10.1001/jama.2021.6238
- Hines R, Markossian T, Johnson A, Dong F, Bayakly R. Geographic residency status and census tract socioeconomic status as determinants of colorectal cancer outcomes. Am J Public Health. 2014;104(3):e63-e71. doi:10.2105/AJPH.2013.301572
- Cauwels J. The many barriers to high-quality rural health care. 2022;(9):1-32. NEJM Catal Innov Care Deliv. Accessed April 24, 2025. https://catalyst.nejm.org/doi/pdf/10.1056/CAT.22.0254
- Gong G, Phillips SG, Hudson C, Curti D, Philips BU. Higher US rural mortality rates linked to socioeconomic status, physician shortages, and lack of health insurance. Health Aff (Millwood);38(12):2003-2010. doi:10.1377/hlthaff.2019.00722
- Aboagye JK, Kaiser HE, Hayanga AJ. Rural-urban differences in access to specialist providers of colorectal cancer care in the United States: a physician workforce issue. JAMA Surg. 2014;149(6):537-543. doi:10.1001/jamasurg.2013.5062
- Lyckholm LJ, Hackney MH, Smith TJ. Ethics of rural health care. Crit Rev Oncol Hematol. 2001;40(2):131-138. doi:10.1016/s1040-8428(01)00139-1
- Krieger N, Williams DR, Moss NE. Measuring social class in US public health research: concepts, methodologies, and guidelines. Annu Rev Public Health. 1997;18:341-378. doi:10.1146/annurev.publhealth.18.1.341
- Singh GK, Jemal A. Socioeconomic and racial/ethnic disparities in cancer mortality, incidence, and survival in the United States, 1950-2014: over six decades of changing patterns and widening inequalities. J Environ Public Health. 2017;2017:2819372. doi:10.1155/2017/2819372
- Adams SA, Zahnd WE, Ranganathan R, et al. Rural and racial disparities in colorectal cancer incidence and mortality in South Carolina, 1996 - 2016. J Rural Health. 2022;38(1):34-39. doi:10.1111/jrh.12580
- Rogers CR, Blackburn BE, Huntington M, et al. Rural- urban disparities in colorectal cancer survival and risk among men in Utah: a statewide population-based study. Cancer Causes Control. 2020;31(3):241-253. doi:10.1007/s10552-020-01268-2
- US Department of Veterans Affairs. VA Informatics and Computing Infrastructure (VINCI), VA HSR RES 13-457. https://vincicentral.vinci.med.va.gov [Source not verified]
- US Department of Veterans Affairs Information Resource Center. VIReC Research User Guide: PSSG Geocoded Enrollee Files, 2015 Edition. US Department of Veterans Affairs, Health Services Research & Development Service, Information Resource Center; May. 2016. [source not verified]
- Goldsmith HF, Puskin DS, Stiles DJ. Improving the operational definition of “rural areas” for federal programs. US Department of Health and Human Services; 1993. Accessed February 27, 2025. https://www.ruralhealthinfo.org/pdf/improving-the-operational-definition-of-rural-areas.pdf
- Adams MA, Kerr EA, Dominitz JA, et al. Development and validation of a new ICD-10-based screening colonoscopy overuse measure in a large integrated healthcare system: a retrospective observational study. BMJ Qual Saf. 2023;32(7):414-424. doi:10.1136/bmjqs-2021-014236
- Schneeweiss S, Wang PS, Avorn J, Glynn RJ. Improved comorbidity adjustment for predicting mortality in Medicare populations. Health Serv Res. 2003;38(4):1103-1120. doi:10.1111/1475-6773.00165
- Becker S, Ichino A. Estimation of average treatment effects based on propensity scores. The Stata Journal. 2002;2(4):358-377.
- Leuven E, Sianesi B. PSMATCH2: Stata module to perform full Mahalanobis and propensity score matching, common support graphing, and covariate imbalance testing. Statistical software components. Revised February 1, 2018. Accessed February 27, 2025. https://ideas.repec.org/c/boc/bocode/s432001.html.
- US Cancer Statistics Working Group. US cancer statistics data visualizations tool. Centers for Disease Control and Prevention. June 2024. Accessed February 27, 2025. https://www.cdc.gov/cancer/dataviz
- Cao J, Zhang S. Multiple Comparison Procedures. JAMA. 2014;312(5):543-544. doi:10.1001/jama.2014.9440
- Gopalani SV, Janitz AE, Martinez SA, et al. Trends in cancer incidence among American Indians and Alaska Natives and Non-Hispanic Whites in the United States, 1999-2015. Epidemiology. 2020;31(2):205-213. doi:10.1097/EDE.0000000000001140
- Zahnd WE, Murphy C, Knoll M, et al. The intersection of rural residence and minority race/ethnicity in cancer disparities in the United States. Int J Environ Res Public Health. 2021;18(4). doi:10.3390/ijerph18041384
- Blake KD, Moss JL, Gaysynsky A, Srinivasan S, Croyle RT. Making the case for investment in rural cancer control: an analysis of rural cancer incidence, mortality, and funding trends. Cancer Epidemiol Biomarkers Prev. 2017;26(7):992-997. doi:10.1158/1055-9965.EPI-17-0092
- Singh GK, Williams SD, Siahpush M, Mulhollen A. Socioeconomic, rural-urban, and racial inequalities in US cancer mortality: part i-all cancers and lung cancer and part iicolorectal, prostate, breast, and cervical cancers. J Cancer Epidemiol. 2011;2011:107497. doi:10.1155/2011/107497
- Jackson GL, Melton LD, Abbott DH, et al. Quality of nonmetastatic colorectal cancer care in the Department of Veterans Affairs. J Clin Oncol. 2010;28(19):3176-3181. doi:10.1200/JCO.2009.26.7948
- Yoon J, Phibbs CS, Ong MK, et al. Outcomes of veterans treated in Veterans Affairs hospitals vs non-Veterans Affairs hospitals. JAMA Netw Open. 2023;6(12):e2345898. doi:10.1001/jamanetworkopen.2023.45898
- Malin JL, Schneider EC, Epstein AM, Adams J, Emanuel EJ, Kahn KL. Results of the National Initiative for Cancer Care Quality: how can we improve the quality of cancer care in the United States? J Clin Oncol. 2006;24(4):626-634. doi:10.1200/JCO.2005.03.3365
- Levin B, Lieberman DA, McFarland B, et al. Screening and surveillance for the early detection of colorectal cancer and adenomatous polyps, 2008: a joint guideline from the American Cancer Society, the US Multi-Society Task Force on Colorectal Cancer, and the American College of Radiology. Gastroenterology. 2008;134(5):1570-1595. doi:10.1053/j.gastro.2008.02.002
- Deeds SA, Moore CB, Gunnink EJ, et al. Implementation of a mailed faecal immunochemical test programme for colorectal cancer screening among Veterans. BMJ Open Qual. 2022;11(4). doi:10.1136/bmjoq-2022-001927
- Yehia BR, Greenstone CL, Hosenfeld CB, Matthews KL, Zephyrin LC. The role of VA community care in addressing health and health care disparities. Med Care. 2017;55(Suppl 9 suppl 2):S4-S5. doi:10.1097/MLR.0000000000000768
- Wright BN, MacDermid Wadsworth S, Wellnitz A, Eicher- Miller HA. Reaching rural veterans: a new mechanism to connect rural, low-income US Veterans with resources and improve food security. J Public Health (Oxf). 2019;41(4):714-723. doi:10.1093/pubmed/fdy203
- Nelson RE, Byrne TH, Suo Y, et al. Association of temporary financial assistance with housing stability among US veterans in the supportive services for veteran families program. JAMA Netw Open. 2021;4(2):e2037047. doi:10.1001/jamanetworkopen.2020.37047
- McDaniel JT, Albright D, Lee HY, et al. Rural–urban disparities in colorectal cancer screening among military service members and Veterans. J Mil Veteran Fam Health. 2019;5(1):40-48. doi:10.3138/jmvfh.2018-0013
- US Department of Veterans Affairs, Office of Rural Health. The rural veteran outreach toolkit. Updated February 12, 2025. Accessed February 18, 2025. https://www.ruralhealth.va.gov/partners/toolkit.asp
Colorectal cancer (CRC) is the second-leading cause of cancer-related deaths in the United States, with an estimated 52,550 deaths in 2023.1 However, the disease burden varies among different segments of the population.2 While both CRC incidence and mortality have been decreasing due to screening and advances in treatment, there are disparities in incidence and mortality across the sociodemographic spectrum including race, ethnicity, education, and income.1-4 While CRC incidence is decreasing for older adults, it is increasing among those aged < 55 years.5 The incidence of CRC in adults aged 40 to 54 years has increased by 0.5% to 1.3% annually since the mid-1990s.6 The US Preventive Services Task Force now recommends starting CRC screening at age 45 years for asymptomatic adults with average risk.7
Disparities also exist across geographical boundaries and living environment. Rural Americans faces additional challenges in health and lifestyle that can affect CRC outcomes. Compared to their urban counterparts, rural residents are more likely to be older, have lower levels of education, higher levels of poverty, lack health insurance, and less access to health care practitioners (HCPs).8-10 Geographic proximity, defined as travel time or physical distance to a health facility, has been recognized as a predictor of inferior outcomes.11 These aspects of rural living may pose challenges for accessing care for CRC screening and treatment.11-13 National and local studies have shown disparities in CRC screening rates, incidence, and mortality between rural and urban populations.14-16
It is unclear whether rural/urban disparities persist under the Veterans Health Administration (VHA) health care delivery model. This study examined differences in baseline characteristics and mortality between rural and urban veterans newly diagnosed with CRC. We also focused on a subpopulation aged ≤ 45 years.
Methods
This study extracted national data from the US Department of Veterans Affairs (VA) Corporate Data Warehouse (CDW) hosted in the VA Informatics and Computing Infrastructure (VINCI) environment. VINCI is an initiative to improve access to VA data and facilitate the analysis of these data while ensuring veterans’ privacy and data security.17 CDW is the VHA business intelligence information repository, which extracts data from clinical and nonclinical sources following prescribed and validated protocols. Data extracted included demographics, diagnosis, and procedure codes for both inpatient and outpatient encounters, vital signs, and vital status. This study used data previously extracted from a national cohort of veterans that encompassed all patients who received a group of commonly prescribed medications, such as statins, proton pump inhibitors, histamine-2 blockers, acetaminophen-containing products, and hydrocortisone-containing skin applications. This cohort encompassed 8,648,754 veterans, from whom 2,460,727 had encounters during fiscal years (FY) 2016 to 2021 (study period). The cohort was used to ensure that subjects were VHA patients, allowing them to adequately capture their clinical profiles.
Patients were identified as rural or urban based on their residence address at the date of their first diagnosis of CRC. The Geospatial Service Support Center (GSSC) aggregates and updates veterans’ residence address records for all enrolled veterans from the National Change of Address database. The data contain 1 record per enrollee. GSSC Geocoded Enrollee File contains enrollee addresses and their rurality indicators, categorized as urban, rural, or highly rural.18 Rurality is defined by the Rural Urban Commuting Area (RUCA) categories developed by the Department of Agriculture and the Health Resources and Services Administration of the US Department of Health and Human Services.19 Urban areas had RUCA codes of 1.0 to 1.1, and highly rural areas had RUCA scores of 10.0. All other areas were classified as rural. Since the proportion of veterans from highly rural areas was small, we included residents from highly rural areas in the rural residents’ group.
Inclusion and Exclusion Criteria
All veterans newly diagnosed with CRC from FY 2016 to 2021 were included. We used the ninth and tenth clinical modification revisions of the International Classification of Diseases (ICD-9-CM and ICD-10-CM) to define CRC diagnosis (Supplemental materials).4,20 To ensure that patients were newly diagnosed with CRC, this study excluded patients with a previous ICD-9-CM code for CRC diagnosis since FY 2003.
Comorbidities were identified using diagnosis and procedure codes from inpatient and outpatient encounters, which were used to calculate the Charlson Comorbidity Index (CCI) at the time of CRC diagnosis using the weighted method described by Schneeweiss et al.21 We defined CRC high-risk conditions and CRC screening tests, including flexible sigmoidoscopy and stool tests, as described in previous studies (Supplemental materials).20
The main outcome was total mortality. The date of death was extracted from the VHA Death Ascertainment File, which contains mortality data from the Master Person Index file in CDW and the Social Security Administration Death Master File. We used the date of death from any cause, as cause of death was not available.
A propensity score (PS) was created to match rural (including highly rural) and urban residents at a ratio of 1:1. Using a standard procedure described in prior publications, multivariable logistic regression used all baseline characteristics to estimate the PS and perform nearest-number matching without replacement.22,23 A caliper of 0.01 maximized the matched cohort size and achieved balance (Supplemental materials). We then examined the balance of baseline characteristics between PS-matched groups.
Analyses
Cox proportional hazards regression analysis estimated the hazard ratio (HR) of death in rural residents compared to urban residents in the PS-matched cohort. The outcome event was the date of death during the study’s follow-up period (defined as period from first CRC diagnosis to death or study end), with censoring at the study’s end date (September 30, 2021). The proportional hazards assumption was assessed by inspecting the Kaplan-Meier curves. Multiple analyses examined the HR of total mortality in the PS-matched cohort, stratified by sex, race, and ethnicity. We also examined the HR of total mortality stratified by duration of follow-up.
Another PS-matching analysis among veterans aged ≤ 45 years was performed using the same techniques described earlier in this article. We performed a Cox proportional hazards regression analysis to compare mortality in PS-matched urban and rural veterans aged ≤ 45 years. The HR of death in all veterans aged ≤ 45 years (before PS-matching) was estimated using Cox proportional hazard regression analysis, adjusting for PS.
Dichotomous variables were compared using X2 tests and continuous variables were compared using t tests. Baseline characteristics with missing values were converted into categorical variables and the proportion of subjects with missing values was equalized between treatment groups after PS-matching. For subgroup analysis, we examined the HR of total mortality in each subgroup using separate Cox proportional hazards regression models similar to the primary analysis but adjusted for PS. Due to multiple comparisons in the subgroup analysis, the findings should be considered exploratory. Statistical tests were 2-tailed, and significance was defined as P < .05. Data management and statistical analyses were conducted from June 2022 to January 2023 using STATA, Version 17. The VA Orlando Healthcare System Institutional Review Board approved the study and waived requirements for informed consent because only deidentified data were used.
Results
After excluding 49 patients (Supplemental materials, available at doi:10.12788/fp.0560), we identified 30,219 veterans with newly diagnosed CRC between FY 2016 to 2021 (Table 1). Of these, 19,422 (64.3%) resided in urban areas and 10,797 (35.7%) resided in rural areas (Table 2). The mean (SD) duration from the first CRC diagnosis to death or study end was 832 (640) days, and the median (IQR) was 723 (246–1330) days. Overall, incident CRC diagnoses were numerically highest in FY 2016 and lowest in FY 2020 (Figure 1). Patients with CRC in rural areas vs urban areas were significantly older (mean, 71.2 years vs 70.8 years, respectively; P < .001), more likely to be male (96.7% vs 95.7%, respectively; P < .001), more likely to be White (83.6% vs 67.8%, respectively; P < .001) and more likely to be non-Hispanic (92.2% vs 87.5%, respectively; P < .001). In terms of general health, rural veterans with CRC were more likely to be overweight or obese (81.5% rural vs 78.5% urban; P < .001) but had fewer mean comorbidities as measured by CCI (5.66 rural vs 5.90 urban; P < .001). A higher proportion of rural veterans with CRC had received stool-based (fecal occult blood test or fecal immunochemical test) CRC screening tests (61.6% rural vs 57.2% urban; P < .001). Fewer rural patients presented with systemic symptoms or signs within 1 year of CRC diagnosis (54.4% rural vs 57.5% urban, P < .001). Among urban patients with CRC, 6959 (35.8%) deaths were observed, compared with 3766 (34.9%) among rural patients (P = .10).
There were 21,568 PS-matched veterans: 10,784 in each group. In the PS-matched cohort, baseline characteristics were similar between veterans in urban and rural communities, including age, sex, race/ethnicity, body mass index, and comorbidities. Among rural patients with CRC, 3763 deaths (34.9%) were observed compared with 3702 (34.3%) among urban veterans. There was no significant difference in the HR of mortality between rural and urban CRC residents (HR, 1.01; 95% CI, 0.97-1.06; P = .53) (Figure 2).
Among veterans aged ≤ 45 years, 551 were diagnosed with CRC (391 urban and 160 rural). We PS-matched 142 pairs of urban and rural veterans without residual differences in baseline characteristics (eAppendix 1). There was no significant difference in the HR of mortality between rural and urban veterans aged ≤ 45 years (HR, 0.97; 95% CI, 0.57-1.63; P = .90) (Figure 2). Similarly, no difference in mortality was observed adjusting for PS between all rural and urban veterans aged ≤ 45 years (HR, 1.03; 95% CI, 0.67-1.59; P = .88).
There was no difference in total mortality between rural and urban veterans in any subgroup except for American Indian or Alaska Native veterans (HR, 2.41; 95% CI, 1.29-4.50; P = .006) (eAppendix 2).
Discussion
This study examined characteristics of patients with CRC between urban and rural areas among veterans who were VHA patients. Similar to other studies, rural veterans with CRC were older, more likely to be White, and were obese, but exhibited fewer comorbidities (lower CCI and lower incidence of congestive heart failure, dementia, hemiplegia, kidney diseases, liver diseases and AIDS, but higher incidence of chronic obstructive lung disease).8,16 The incidence of CRC in this study population was lowest in FY 2020, which was reported by the Centers for Disease Control and Prevention and is attributed to COVID-19 pandemic disruption of health services.24 The overall mortality in this study was similar to rates reported in other studies from the VA Central Cancer Registry.4 In the PS-matched cohort, where baseline characteristics were similar between urban and rural patients with CRC, we found no disparities in CRC-specific mortality between veterans in rural and urban areas. Additionally, when analysis was restricted to veterans aged ≤ 45 years, the results remained consistent.
Subgroup analyses showed no significant difference in mortality between rural and urban areas by sex, race or ethnicity, except rural American Indian or Alaska Native veterans who had double the mortality of their urban counterparts (HR, 2.41; 95% CI, 1.29-4.50; P = .006). This finding is difficult to interpret due to the small number of events and the wide CI. While with a Bonferroni correction the adjusted P value was .08, which is not statistically significant, a previous study found that although CRC incidence was lower overall in American Indian or Alaska Native populations compared to non-Hispanic White populations, CRC incidence was higher among American Indian or Alaska Native individuals in some areas such as Alaska and the Northern Plains.25,26 Studies have noted that rural American Indian/Alaska Native populations experience greater poverty, less access to broadband internet, and limited access to care, contributing to poorer cancer outcomes and lower survival.27 Thus, the finding of disparity in mortality between rural and urban American Indian or Alaska Native veterans warrants further study.
Other studies have raised concerns that CRC disproportionately affects adults in rural areas with higher mortality rates.14-16 These disparities arise from sociodemographic factors and modifiable risk factors, including physical activity, dietary patterns, access to cancer screening, and gaps in quality treatment resources.16,28 These factors operate at multiple levels: from individual, local health system, to community and policy.2,27 For example, a South Carolina study (1996–2016) found that residents in rural areas were more likely to be diagnosed with advanced CRC, possibly indicating lower rates of CRC screening in rural areas. They also had higher likelihood of death from CRC.15 However, the study did not include any clinical parameters, such as comorbidities or obesity. A statewide, population-based study in Utah showed that rural men experienced a lower CRC survival in their unadjusted analysis.16 However, the study was small, with only 3948 urban and 712 rural residents. Additionally, there was no difference in total mortality in the whole cohort (HR, 0.96; 95% CI, 0.86-1.07) or in CRC-specific death (HR, 0.93; 95% CI, 0.81-1.08). A nationwide study also showed that CRC mortality rates were 8% higher in nonmetropolitan or rural areas than in the most urbanized areas containing large metropolitan counties.29 However, this study did not include descriptions of clinical confounders, such as comorbidities, making it difficult to ascertain whether the difference in CRC mortality was due to rurality or differences in baseline risk characteristics.
In this study, the lack of CRC-specific mortality disparities may be attributed to the structures and practices of VHA health care. Recent studies have noted that mortality of several chronic medical conditions treated at the VHA was lower than at non-VHA hospitals.30,31 One study that measured the quality of nonmetastatic CRC care based on National Comprehensive Cancer Network guidelines showed that > 72% of VHA patients received guideline-concordant care for each diagnostic and therapeutic measure, except for follow-up colonoscopy timing, which appear to be similar or superior to that of the private sector.30,32,33 Some of the VA initiative for CRC screening may bypass the urban-rurality divide such as the mailed fecal immunochemical test program for CRC. This program was implemented at the onset of the COVID-19 pandemic to avoid disruptions of medical care.34 Rural patients are more likely to undergo fecal immunochemical testing when compared to urban patients in this data. Beyond clinical care, the VHA uses processes to tackle social determinants of health such as housing, food security, and transportation, promoting equal access to health care, and promoting cultural competency among HCPs.35-37
The results suggest that solutions to CRC disparities between rural and urban areas need to consider known barriers to rural health care, including transportation, diminished rural health care workforce, and other social determinants of health.9,10,27,38 VHA makes considerable efforts to provide equitable care to all enrolled veterans, including specific programs for rural veterans, including ongoing outreach.39 This study demonstrated lack of disparity in CRC-specific mortality in veterans receiving VHA care, highlighting the importance of these efforts.
Strengths and Limitations
This study used the VHA cohort to compare patient characteristics and mortality between patients with CRC residing in rural and urban areas. The study provides nationwide perspectives on CRC across the geographical spectrum and used a longitudinal cohort with prolonged follow-up to account for comorbidities.
However, the study compared a cohort of rural and urban veterans enrolled in the VHA; hence, the results may not reflect CRC outcomes in veterans without access to VHA care. Rurality has been independently associated with decreased likelihood of meeting CRC screening guidelines among veterans and military service members.38 This study lacked sufficient information to compare CRC staging or treatment modalities among veterans. Although the data cannot identify CRC stage, the proportions of patients with metastatic CRC at diagnosis and CRC location were similar between groups. The study did not have information on their care outside of VHA setting.
This study could not ascertain whether disparities existed in CRC treatment modality since rural residence may result in referral to community-based CRC care, which did not appear in the data. To address these limitations, we used death from any cause as the primary outcome, since death is a hard outcome and is not subject to ascertainment bias. The relatively short follow-up time is another limitation, though subgroup analysis by follow-up did not show significant differences. Despite PS matching, residual unmeasured confounding may exist between urban and rural groups. The predominantly White, male VHA population with high CCI may limit the generalizability of the results.
Conclusions
Rural VHA enrollees had similar survival rates after CRC diagnosis compared to their urban counterparts in a PS-matched analysis. The VHA models of care—including mailed CRC screening tools, several socioeconomic determinants of health (housing, food security, and transportation), and promoting equal access to health care, as well as cultural competency among HCPs—HCPs—may help alleviate disparities across the rural-urban spectrum. The VHA should continue efforts to enroll veterans and provide comprehensive coordinated care in community partnerships.
- Siegel RL, Wagle NS, Cercek A, Smith RA, Jemal A. Colorectal cancer statistics, 2023. CA Cancer J Clin. 2023;73(3):233-254. doi:10.3322/caac.21772
- Carethers JM, Doubeni CA. Causes of socioeconomic disparities in colorectal cancer and intervention framework and strategies. Gastroenterology. 2020;158(2):354-367. doi:10.1053/j.gastro.2019.10.029
- Murphy G, Devesa SS, Cross AJ, Inskip PD, McGlynn KA, Cook MB. Sex disparities in colorectal cancer incidence by anatomic subsite, race and age. Int J Cancer. 2011;128(7):1668-75. doi:10.1002/ijc.25481
- Zullig LL, Smith VA, Jackson GL, et al. Colorectal cancer statistics from the Veterans Affairs central cancer registry. Clin Colorectal Cancer. 2016;15(4):e199-e204. doi:10.1016/j.clcc.2016.04.005
- Lin JS, Perdue LA, Henrikson NB, Bean SI, Blasi PR. Screening for Colorectal Cancer: An Evidence Update for the US Preventive Services Task Force. 2021. U.S. Preventive Services Task Force Evidence Syntheses, formerly Systematic Evidence Reviews:Chapter 1. Agency for Healthcare Research and Quality (US); 2021. Accessed February 18, 2025. https://www.ncbi.nlm.nih.gov/books/NBK570917/
- Siegel RL, Fedewa SA, Anderson WF, et al. Colorectal cancer incidence patterns in the United States, 1974-2013. J Natl Cancer Inst. 2017;109(8). doi:10.1093/jnci/djw322
- Davidson KW, Barry MJ, Mangione CM, et al. Screening for colorectal cancer: US Preventive Services Task Force recommendation statement. JAMA. 2021;325(19):1965-1977. doi:10.1001/jama.2021.6238
- Hines R, Markossian T, Johnson A, Dong F, Bayakly R. Geographic residency status and census tract socioeconomic status as determinants of colorectal cancer outcomes. Am J Public Health. 2014;104(3):e63-e71. doi:10.2105/AJPH.2013.301572
- Cauwels J. The many barriers to high-quality rural health care. 2022;(9):1-32. NEJM Catal Innov Care Deliv. Accessed April 24, 2025. https://catalyst.nejm.org/doi/pdf/10.1056/CAT.22.0254
- Gong G, Phillips SG, Hudson C, Curti D, Philips BU. Higher US rural mortality rates linked to socioeconomic status, physician shortages, and lack of health insurance. Health Aff (Millwood);38(12):2003-2010. doi:10.1377/hlthaff.2019.00722
- Aboagye JK, Kaiser HE, Hayanga AJ. Rural-urban differences in access to specialist providers of colorectal cancer care in the United States: a physician workforce issue. JAMA Surg. 2014;149(6):537-543. doi:10.1001/jamasurg.2013.5062
- Lyckholm LJ, Hackney MH, Smith TJ. Ethics of rural health care. Crit Rev Oncol Hematol. 2001;40(2):131-138. doi:10.1016/s1040-8428(01)00139-1
- Krieger N, Williams DR, Moss NE. Measuring social class in US public health research: concepts, methodologies, and guidelines. Annu Rev Public Health. 1997;18:341-378. doi:10.1146/annurev.publhealth.18.1.341
- Singh GK, Jemal A. Socioeconomic and racial/ethnic disparities in cancer mortality, incidence, and survival in the United States, 1950-2014: over six decades of changing patterns and widening inequalities. J Environ Public Health. 2017;2017:2819372. doi:10.1155/2017/2819372
- Adams SA, Zahnd WE, Ranganathan R, et al. Rural and racial disparities in colorectal cancer incidence and mortality in South Carolina, 1996 - 2016. J Rural Health. 2022;38(1):34-39. doi:10.1111/jrh.12580
- Rogers CR, Blackburn BE, Huntington M, et al. Rural- urban disparities in colorectal cancer survival and risk among men in Utah: a statewide population-based study. Cancer Causes Control. 2020;31(3):241-253. doi:10.1007/s10552-020-01268-2
- US Department of Veterans Affairs. VA Informatics and Computing Infrastructure (VINCI), VA HSR RES 13-457. https://vincicentral.vinci.med.va.gov [Source not verified]
- US Department of Veterans Affairs Information Resource Center. VIReC Research User Guide: PSSG Geocoded Enrollee Files, 2015 Edition. US Department of Veterans Affairs, Health Services Research & Development Service, Information Resource Center; May. 2016. [source not verified]
- Goldsmith HF, Puskin DS, Stiles DJ. Improving the operational definition of “rural areas” for federal programs. US Department of Health and Human Services; 1993. Accessed February 27, 2025. https://www.ruralhealthinfo.org/pdf/improving-the-operational-definition-of-rural-areas.pdf
- Adams MA, Kerr EA, Dominitz JA, et al. Development and validation of a new ICD-10-based screening colonoscopy overuse measure in a large integrated healthcare system: a retrospective observational study. BMJ Qual Saf. 2023;32(7):414-424. doi:10.1136/bmjqs-2021-014236
- Schneeweiss S, Wang PS, Avorn J, Glynn RJ. Improved comorbidity adjustment for predicting mortality in Medicare populations. Health Serv Res. 2003;38(4):1103-1120. doi:10.1111/1475-6773.00165
- Becker S, Ichino A. Estimation of average treatment effects based on propensity scores. The Stata Journal. 2002;2(4):358-377.
- Leuven E, Sianesi B. PSMATCH2: Stata module to perform full Mahalanobis and propensity score matching, common support graphing, and covariate imbalance testing. Statistical software components. Revised February 1, 2018. Accessed February 27, 2025. https://ideas.repec.org/c/boc/bocode/s432001.html.
- US Cancer Statistics Working Group. US cancer statistics data visualizations tool. Centers for Disease Control and Prevention. June 2024. Accessed February 27, 2025. https://www.cdc.gov/cancer/dataviz
- Cao J, Zhang S. Multiple Comparison Procedures. JAMA. 2014;312(5):543-544. doi:10.1001/jama.2014.9440
- Gopalani SV, Janitz AE, Martinez SA, et al. Trends in cancer incidence among American Indians and Alaska Natives and Non-Hispanic Whites in the United States, 1999-2015. Epidemiology. 2020;31(2):205-213. doi:10.1097/EDE.0000000000001140
- Zahnd WE, Murphy C, Knoll M, et al. The intersection of rural residence and minority race/ethnicity in cancer disparities in the United States. Int J Environ Res Public Health. 2021;18(4). doi:10.3390/ijerph18041384
- Blake KD, Moss JL, Gaysynsky A, Srinivasan S, Croyle RT. Making the case for investment in rural cancer control: an analysis of rural cancer incidence, mortality, and funding trends. Cancer Epidemiol Biomarkers Prev. 2017;26(7):992-997. doi:10.1158/1055-9965.EPI-17-0092
- Singh GK, Williams SD, Siahpush M, Mulhollen A. Socioeconomic, rural-urban, and racial inequalities in US cancer mortality: part i-all cancers and lung cancer and part iicolorectal, prostate, breast, and cervical cancers. J Cancer Epidemiol. 2011;2011:107497. doi:10.1155/2011/107497
- Jackson GL, Melton LD, Abbott DH, et al. Quality of nonmetastatic colorectal cancer care in the Department of Veterans Affairs. J Clin Oncol. 2010;28(19):3176-3181. doi:10.1200/JCO.2009.26.7948
- Yoon J, Phibbs CS, Ong MK, et al. Outcomes of veterans treated in Veterans Affairs hospitals vs non-Veterans Affairs hospitals. JAMA Netw Open. 2023;6(12):e2345898. doi:10.1001/jamanetworkopen.2023.45898
- Malin JL, Schneider EC, Epstein AM, Adams J, Emanuel EJ, Kahn KL. Results of the National Initiative for Cancer Care Quality: how can we improve the quality of cancer care in the United States? J Clin Oncol. 2006;24(4):626-634. doi:10.1200/JCO.2005.03.3365
- Levin B, Lieberman DA, McFarland B, et al. Screening and surveillance for the early detection of colorectal cancer and adenomatous polyps, 2008: a joint guideline from the American Cancer Society, the US Multi-Society Task Force on Colorectal Cancer, and the American College of Radiology. Gastroenterology. 2008;134(5):1570-1595. doi:10.1053/j.gastro.2008.02.002
- Deeds SA, Moore CB, Gunnink EJ, et al. Implementation of a mailed faecal immunochemical test programme for colorectal cancer screening among Veterans. BMJ Open Qual. 2022;11(4). doi:10.1136/bmjoq-2022-001927
- Yehia BR, Greenstone CL, Hosenfeld CB, Matthews KL, Zephyrin LC. The role of VA community care in addressing health and health care disparities. Med Care. 2017;55(Suppl 9 suppl 2):S4-S5. doi:10.1097/MLR.0000000000000768
- Wright BN, MacDermid Wadsworth S, Wellnitz A, Eicher- Miller HA. Reaching rural veterans: a new mechanism to connect rural, low-income US Veterans with resources and improve food security. J Public Health (Oxf). 2019;41(4):714-723. doi:10.1093/pubmed/fdy203
- Nelson RE, Byrne TH, Suo Y, et al. Association of temporary financial assistance with housing stability among US veterans in the supportive services for veteran families program. JAMA Netw Open. 2021;4(2):e2037047. doi:10.1001/jamanetworkopen.2020.37047
- McDaniel JT, Albright D, Lee HY, et al. Rural–urban disparities in colorectal cancer screening among military service members and Veterans. J Mil Veteran Fam Health. 2019;5(1):40-48. doi:10.3138/jmvfh.2018-0013
- US Department of Veterans Affairs, Office of Rural Health. The rural veteran outreach toolkit. Updated February 12, 2025. Accessed February 18, 2025. https://www.ruralhealth.va.gov/partners/toolkit.asp
Colorectal Cancer Characteristics and Mortality From Propensity Score-Matched Cohorts of Urban and Rural Veterans
Colorectal Cancer Characteristics and Mortality From Propensity Score-Matched Cohorts of Urban and Rural Veterans

Continuous Glucose Monitoring vs Fingerstick Monitoring for Hemoglobin A1c Control in Veterans
In the United States, 1 in 4 veterans lives with type 2 diabetes mellitus (T2DM), double the rate of the general population.1 Medications are important for the treatment of T2DM and preventing complications that may develop if not properly managed. Common classes of medications for diabetes include biguanides, sodiumglucose cotransporter-2 (SGLT-2) inhibitors, glucagon-like peptide-1 (GLP-1) receptor agonists, dipeptidyl peptidase-4 inhibitors, thiazolidinediones, sulfonylureas, and insulin. The selection of treatment depends on patient-specific factors including hemoglobin A1c (HbA1c) goal, potential effects on weight, risk of hypoglycemia, and comorbidities such as atherosclerotic cardiovascular disease, heart failure, or chronic kidney disease.2
HbA1c level reflects the mean blood glucose over the previous 3 months and serves as an indication of diabetes control. In patients with diabetes, it is recommended that HbA1c is checked ≥ 2 times annually for those meeting treatment goals, or more often if the patient needs to adjust medications to reach their HbA1c goal. The goal HbA1c level for most adults with diabetes is < 7%.3 This target can be adjusted based on age, comorbidities, or other patient factors. It is generally recommended that frequent glucose monitoring is not needed for patients with T2DM who are only taking oral agents and/or noninsulin injectables. However, for those on insulin regimens, it is advised to monitor glucose closely, with even more frequent testing for those with an intensive insulin regimen.3
Most patients with diabetes use fingerstick testing to self-monitor their blood glucose. However, continuous glucose monitors (CGMs) are becoming widely available and offer a solution to those who do not have the ability to check their glucose multiple times a day and throughout the night. The American Diabetes Association recommends that the frequency and timing of blood glucose monitoring, or the consideration of CGM use, should be based on the specific needs and goals of each patient.3 Guidelines also encourage those on intensive insulin regimens to check glucose levels when fasting, before and after meals, prior to exercise, and when hypoglycemia or hyperglycemia is suspected. Frequent testing can become a burden for patients, whereas once a CGM sensor is placed, it can be worn for 10 to 14 days. CGMs are also capable of transmitting glucose readings every 1 to 15 minutes to a receiver or mobile phone, allowing for further adaptability to a patient’s lifestyle.3
CGMs work by measuring the interstitial glucose with a small filament sensor and have demonstrated accuracy when compared to blood glucose readings. The ability of a CGM to accurately reflect HbA1c levels is a potential benefit, reducing the need for frequent testing to determine whether patients have achieved glycemic control.4 Another benefit of a CGM is the ease of sharing data; patient accounts can be linked with a health care site, allowing clinicians to access glucose data even if the patient is not able to be seen in clinic. This allows health care practitioners (HCPs) to more efficiently tailor medications and optimize regimens based on patient-specific data that was not available by fingerstick testing alone.
Vigersky and colleagues provided one of the few studies on the long-term effects of CGM in patients managing T2DM through diet and exercise alone, oral medications, or basal insulin and found significant improvement in HbA1c after only 3 months of CGM use.5
An important aspect of CGM use is the ability to alert the patient to low blood glucose readings, which can be dangerous for those unaware of hypoglycemia. Many studies have investigated the association between CGM use and acute metabolic events, demonstrating the potential for CGMs to prevent these emergencies. Karter and colleagues found a reduction in emergency department visits and hospitalizations for hypoglycemia associated with the use of CGMs in patients with type 1 DM (T1DM) and T2DM.6
There have been few studies on the use of CGM in veterans. Langford and colleagues found a reduction of HbA1c among veterans with T2DM using CGMs. However, > 50% of the patients in the study were not receiving insulin therapy, which currently is a US Department of Veterans Affairs (VA) CGM criteria for use.7 While current studies provide evidence that supports improvement in HbA1c levels with the use of CGMs, data are lacking for veterans with T2DM taking insulin. There is also minimal research that indicates which patients should be offered a CGM. The objective of this study was to evaluate glycemic control in veterans with T2DM on insulin using a CGM who were previously monitoring blood glucose with fingerstick testing. Secondary endpoints were explored to identify subgroups that may benefit from a CGM and other potential advantages of CGMs.
Methods
This was a retrospective study of veterans who transitioned from fingerstick testing to CGM for glucose monitoring. Each veteran served as their own control to limit confounding variables when comparing HbA1c levels. Veterans with an active or suspended CGM order were identified by reviewing outpatient prescription data. All data collection and analysis were done within the Veterans Affairs Sioux Falls Health Care System.
The primary objective of this study was to assess glycemic control from the use of a CGM by evaluating the change in HbA1c after transitioning to a CGM compared to the change in HbA1c with standard fingerstick monitoring. Three HbA1c values were collected for each veteran: before starting CGM, at initiation, and following CGM initiation (Figure 1). CGM start date was the date the CGM prescription order was placed. The pre-CGM HbA1c level was ≥ 1 year prior to the CGM start date or the HbA1c closest to 1 year. The start CGM HbA1c level was within 3 months before or 1 month after the CGM start date. The post-CGM HbA1c level was the most recent time of data collection and at least 6 months after CGM initiation. The change in HbA1c from fingerstick glucose monitoring was the difference between the pre-CGM and start CGM values. The change in HbA1c from use of a CGM was the difference between start CGM and post-CGM values, which were compared to determine HbA1c reduction from CGM use.
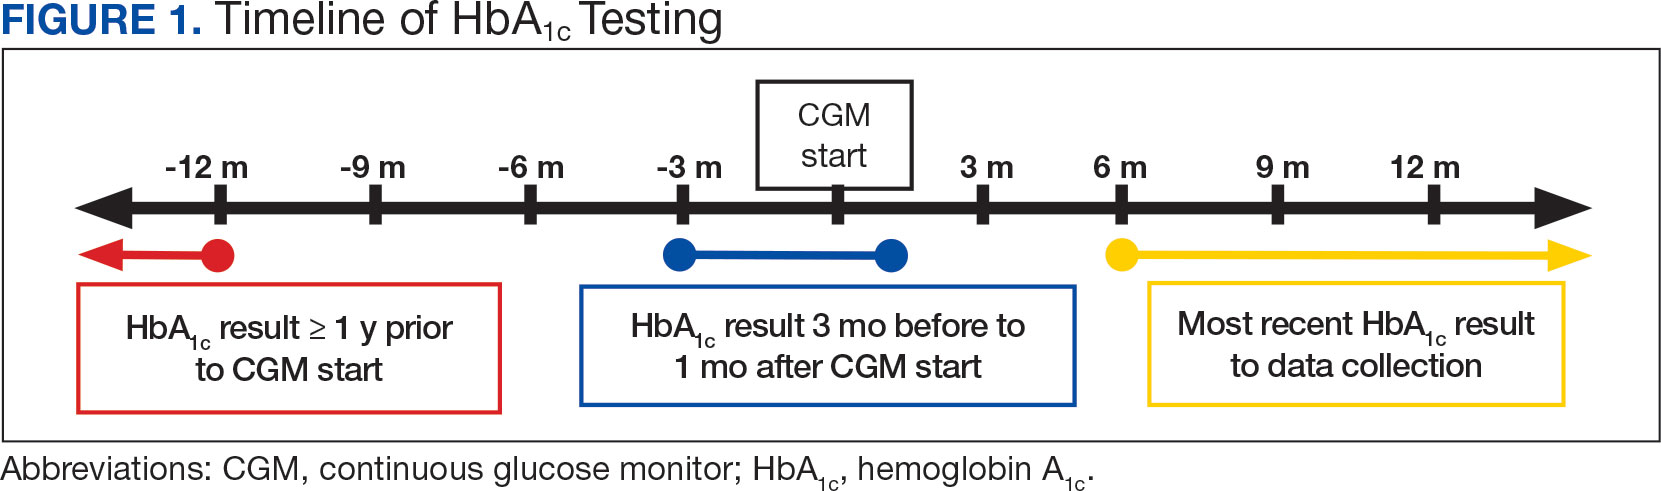
This study also explored secondary outcomes including changes in HbA1c by prescriber type, differences in HbA1c reduction based on age, and changes in diabetes medications, including total daily insulin doses. For secondary outcomes, diabetes medication information and the total daily dose of insulin were gathered at the start of CGM use and at the time of data collection. The most recent CGM order prescribed was also collected.
Veterans were included if they were aged ≥ 18 years, had an active order for a CGM, T2DM diagnosis, an insulin prescription, and previously used test strips for glucose monitoring. Patients with T1DM, those who accessed CGMs or care in the community, and patients without HbA1c values pre-CGM, were excluded.
Statistical Analysis
The primary endpoint of change in HbA1c level before and after CGM use was compared using a paired t test. A 0.5% change in HbA1c was considered clinically significant, as suggested in other studies.8,9 P < .05 was considered statistically significant. Analysis for continuous baseline characteristics, including age and total daily insulin, were reported as mean values. Nominal characteristics including sex, race, diabetes medications, and prescriber type are reported as percentages.
Results
A total of 402 veterans were identified with an active CGM at the time of initial data collection in January 2024 and 175 met inclusion criteria. Sixty patients were excluded due to diabetes managed through a community HCP, 38 had T1DM, and 129 lacked HbA1c within all specified time periods. The 175 veterans were randomized, and 150 were selected to perform a chart review for data collection. The mean age was 70 years, most were male and identified as White (Table 1). The majority of patients were managed by endocrinology (53.3%), followed by primary care (24.0%), and pharmacy (22.7%) (Table 2). The mean baseline HbA1c was 8.6%.
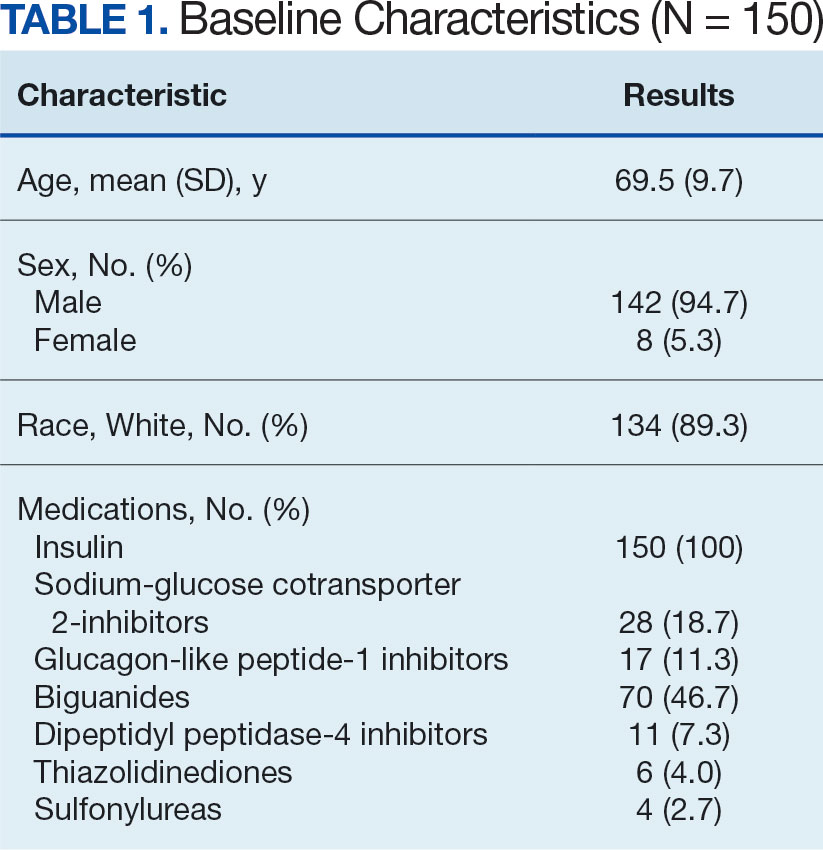
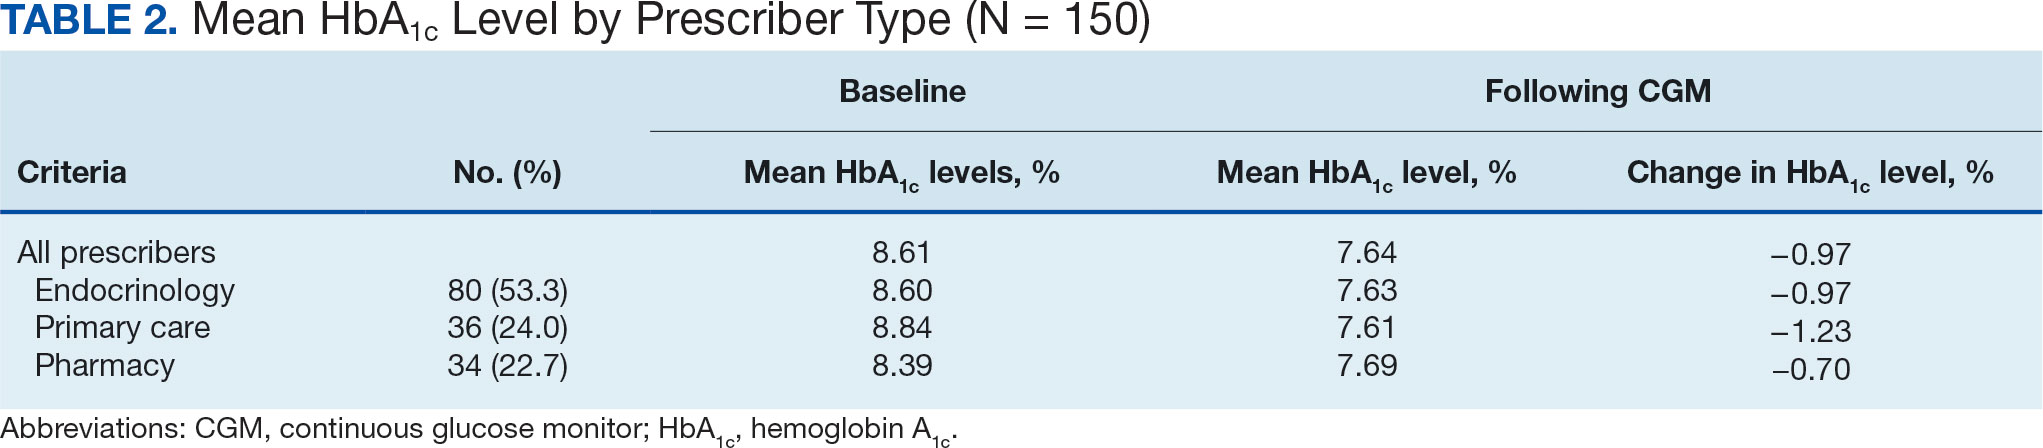
The difference in HbA1c before and after use of CGM was -0.97% (P = .0001). Prior to use of a CGM the change in HbA1c was minimal, with an increase of 0.003% with the use of selfmonitoring glucose. After use of a CGM, HbA1c decreased by 0.971%. This reduction in HbA1c would also be considered clinically significant as the change was > 0.5%. The mean pre-, at start, and post-CGM HbA1c levels were 8.6%, 8.6%, and 7.6%, respectively (Figure 2). Pharmacy prescribers had a 0.7% reduction in HbA1c post-CGM, the least of all prescribers. While most age groups saw a reduction in HbA1c, those aged ≥ 80 years had an increase of 0.18% (Table 3). There was an overall mean reduction in insulin of 22 units, which was similar between all prescribers.
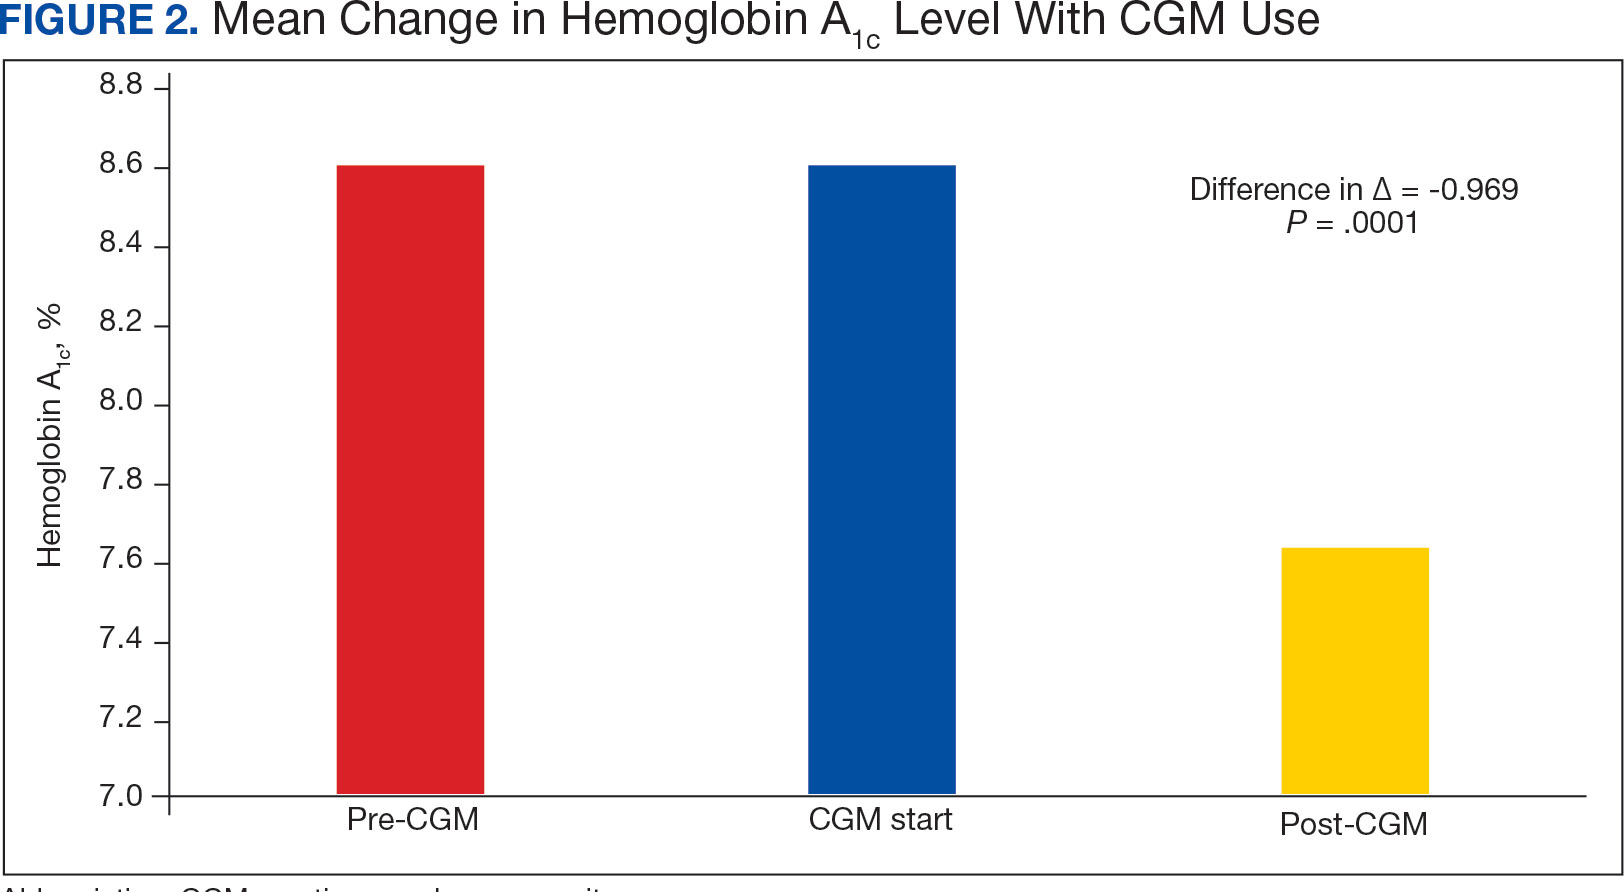
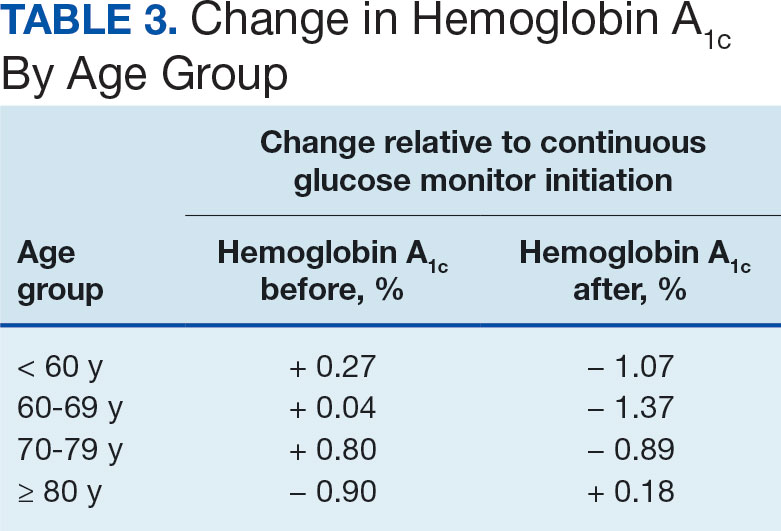
Discussion
The primary endpoint of difference in change of HbA1c before and after CGM use was found to be statistically and clinically significant, with a nearly 1% reduction in HbA1c, which was similar to the reduction found by Vigersky and colleagues. 5 Across all prescribers, post-CGM HbA1c levels were similar; however, patients with CGM prescribed by pharmacists had the smallest change in HbA1c. VA pharmacists primarily assess veterans taking insulin who have HbA1c levels that are below the goal with the aim of decreasing insulin to reduce the risk of hypoglycemia, which could result in increased HbA1c levels. This may also explain the observed increase in post-CGM HbA1c levels in patients aged ≥ 80 years. Patients under the care of pharmacists also had baseline mean HbA1c levels that were lower than primary care and endocrinology prescribers and were closer to their HbA1c goal at baseline, which likely was reflected in the smaller reduction in post-CGM HbA1c level.
While there was a decrease in HbA1c levels with CGM use, there were also changes to medications during this timeframe that also may have impacted HbA1c levels. The most common diabetes medications started during CGM use were GLP-1 agonists and SGLT2-inhibitors. Additionally, there was a reduction in the total daily dose of insulin in the study population. These results demonstrate the potential benefits of CGMs for prescribers who take advantage of the CGM glucose data available to assist with medication adjustments. Another consideration for differences in changes of HbA1c among prescriber types is the opportunity for more frequent follow- up visits with pharmacy or endocrinology compared with primary care. If veterans are followed more closely, it may be associated with improved HbA1c control. Further research investigating changes in HbA1c levels based on followup frequency may be useful.
Strengths and Limitations
The crossover design was a strength of this study. This design reduced confounding variables by having veterans serve as their own controls. In addition, the collection of multiple secondary outcomes adds to the knowledge base for future studies. This study focused on a unique population of veterans with T2DM who were taking insulin, an area that previously had very little data available to determine the benefits of CGM use.
Although the use of a CGM showed statistical significance in lowering HbA1c, many veterans were started on new diabetes medication during the period of CGM use, which also likely contributed to the reduction in HbA1c and may have confounded the results. The study was limited by its small population size due to time constraints of chart reviews and the limited generalizability of results outside of the VA system. The majority of patients were from a single site, male and identified as White, which may not be reflective of other VA and community health care systems. It was also noted that the time from the initiation of CGM use to the most recent HbA1c level varied from 6 months to several years. Additionally, veterans managed by community-based HCPs with complex diabetes cases were excluded.
Conclusions
This study demonstrated a clinically and statistically significant reduction in HbA1c with the use of a CGM compared to fingerstick monitoring in veterans with T2DM who were being treated with insulin. The change in post-CGM HbA1c levels across prescribers was similar. In the subgroup analysis of change in HbA1c among age groups, there was a lower HbA1c reduction in individuals aged ≥ 80 years. The results from this study support the idea that CGM use may be beneficial for patients who require a reduction in HbA1c by allowing more precise adjustments to medications and optimization of therapy, as well as the potential to reduce insulin requirements, which is especially valuable in the older adult veteran population.
- US Department of Veterans Affairs. VA supports veterans who have type 2 diabetes. VA News. Accessed September 30, 2024. https://news.va.gov/107579/va-supports-veterans-who-have-type-2-diabetes/
- ElSayed NA, Aleppo G, Aroda VR, et al. 9. Pharmacologic approaches to glycemic treatment: standards of care in diabetes-2023. Diabetes Care. 2023;46(Suppl 1):S140- S157. doi:10.2337/dc23-S009
- ElSayed NA, Aleppo G, Aroda VR, et al. 6. Glycemic targets: standards of care in diabetes-2023. Diabetes Care. 2023;46(Suppl 1):S97-S110. doi:10.2337/dc23-S006
- Miller E, Gavin JR, Kruger DF, Brunton SA. Continuous glucose monitoring: optimizing diabetes care: executive summary. Clin Diabetes. 2022;40(4):394-398. doi:10.2337/cd22-0043
- Vigersky RA, Fonda SJ, Chellappa M, Walker MS, Ehrhardt NM. Short- and long-term effects of real-time continuous glucose monitoring in patients with type 2 diabetes. Diabetes Care. 2012;35(1):32-38. doi:10.2337/dc11-1438
- Karter AJ, Parker MM, Moffet HH, Gilliam LK, Dlott R. Association of real-time continuous glucose monitoring with glycemic control and acute metabolic events among patients with insulin-treated diabetes. JAMA. 2021;325(22):2273-2284. doi:10.1001/JAMA.2021.6530
- Langford SN, Lane M, Karounos D. Continuous blood glucose monitoring outcomes in veterans with type 2 diabetes. Fed Pract. 2021;38(Suppl 4):S14-S17. doi:10.12788/fp.0189
- Radin MS. Pitfalls in hemoglobin A1c measurement: when results may be misleading. J Gen Intern Med. 2014;29(2):388-394. doi:10.1007/s11606-013-2595-x.
- Little RR, Rohlfing CL, Sacks DB; National Glycohemoglobin Standardization Program (NGSP) steering committee. Status of hemoglobin A1c measurement and goals for improvement: from chaos to order for improving diabetes care. Clin Chem. 2011;57(2):205-214. doi:10.1373/clinchem.2010.148841
In the United States, 1 in 4 veterans lives with type 2 diabetes mellitus (T2DM), double the rate of the general population.1 Medications are important for the treatment of T2DM and preventing complications that may develop if not properly managed. Common classes of medications for diabetes include biguanides, sodiumglucose cotransporter-2 (SGLT-2) inhibitors, glucagon-like peptide-1 (GLP-1) receptor agonists, dipeptidyl peptidase-4 inhibitors, thiazolidinediones, sulfonylureas, and insulin. The selection of treatment depends on patient-specific factors including hemoglobin A1c (HbA1c) goal, potential effects on weight, risk of hypoglycemia, and comorbidities such as atherosclerotic cardiovascular disease, heart failure, or chronic kidney disease.2
HbA1c level reflects the mean blood glucose over the previous 3 months and serves as an indication of diabetes control. In patients with diabetes, it is recommended that HbA1c is checked ≥ 2 times annually for those meeting treatment goals, or more often if the patient needs to adjust medications to reach their HbA1c goal. The goal HbA1c level for most adults with diabetes is < 7%.3 This target can be adjusted based on age, comorbidities, or other patient factors. It is generally recommended that frequent glucose monitoring is not needed for patients with T2DM who are only taking oral agents and/or noninsulin injectables. However, for those on insulin regimens, it is advised to monitor glucose closely, with even more frequent testing for those with an intensive insulin regimen.3
Most patients with diabetes use fingerstick testing to self-monitor their blood glucose. However, continuous glucose monitors (CGMs) are becoming widely available and offer a solution to those who do not have the ability to check their glucose multiple times a day and throughout the night. The American Diabetes Association recommends that the frequency and timing of blood glucose monitoring, or the consideration of CGM use, should be based on the specific needs and goals of each patient.3 Guidelines also encourage those on intensive insulin regimens to check glucose levels when fasting, before and after meals, prior to exercise, and when hypoglycemia or hyperglycemia is suspected. Frequent testing can become a burden for patients, whereas once a CGM sensor is placed, it can be worn for 10 to 14 days. CGMs are also capable of transmitting glucose readings every 1 to 15 minutes to a receiver or mobile phone, allowing for further adaptability to a patient’s lifestyle.3
CGMs work by measuring the interstitial glucose with a small filament sensor and have demonstrated accuracy when compared to blood glucose readings. The ability of a CGM to accurately reflect HbA1c levels is a potential benefit, reducing the need for frequent testing to determine whether patients have achieved glycemic control.4 Another benefit of a CGM is the ease of sharing data; patient accounts can be linked with a health care site, allowing clinicians to access glucose data even if the patient is not able to be seen in clinic. This allows health care practitioners (HCPs) to more efficiently tailor medications and optimize regimens based on patient-specific data that was not available by fingerstick testing alone.
Vigersky and colleagues provided one of the few studies on the long-term effects of CGM in patients managing T2DM through diet and exercise alone, oral medications, or basal insulin and found significant improvement in HbA1c after only 3 months of CGM use.5
An important aspect of CGM use is the ability to alert the patient to low blood glucose readings, which can be dangerous for those unaware of hypoglycemia. Many studies have investigated the association between CGM use and acute metabolic events, demonstrating the potential for CGMs to prevent these emergencies. Karter and colleagues found a reduction in emergency department visits and hospitalizations for hypoglycemia associated with the use of CGMs in patients with type 1 DM (T1DM) and T2DM.6
There have been few studies on the use of CGM in veterans. Langford and colleagues found a reduction of HbA1c among veterans with T2DM using CGMs. However, > 50% of the patients in the study were not receiving insulin therapy, which currently is a US Department of Veterans Affairs (VA) CGM criteria for use.7 While current studies provide evidence that supports improvement in HbA1c levels with the use of CGMs, data are lacking for veterans with T2DM taking insulin. There is also minimal research that indicates which patients should be offered a CGM. The objective of this study was to evaluate glycemic control in veterans with T2DM on insulin using a CGM who were previously monitoring blood glucose with fingerstick testing. Secondary endpoints were explored to identify subgroups that may benefit from a CGM and other potential advantages of CGMs.
Methods
This was a retrospective study of veterans who transitioned from fingerstick testing to CGM for glucose monitoring. Each veteran served as their own control to limit confounding variables when comparing HbA1c levels. Veterans with an active or suspended CGM order were identified by reviewing outpatient prescription data. All data collection and analysis were done within the Veterans Affairs Sioux Falls Health Care System.
The primary objective of this study was to assess glycemic control from the use of a CGM by evaluating the change in HbA1c after transitioning to a CGM compared to the change in HbA1c with standard fingerstick monitoring. Three HbA1c values were collected for each veteran: before starting CGM, at initiation, and following CGM initiation (Figure 1). CGM start date was the date the CGM prescription order was placed. The pre-CGM HbA1c level was ≥ 1 year prior to the CGM start date or the HbA1c closest to 1 year. The start CGM HbA1c level was within 3 months before or 1 month after the CGM start date. The post-CGM HbA1c level was the most recent time of data collection and at least 6 months after CGM initiation. The change in HbA1c from fingerstick glucose monitoring was the difference between the pre-CGM and start CGM values. The change in HbA1c from use of a CGM was the difference between start CGM and post-CGM values, which were compared to determine HbA1c reduction from CGM use.
This study also explored secondary outcomes including changes in HbA1c by prescriber type, differences in HbA1c reduction based on age, and changes in diabetes medications, including total daily insulin doses. For secondary outcomes, diabetes medication information and the total daily dose of insulin were gathered at the start of CGM use and at the time of data collection. The most recent CGM order prescribed was also collected.
Veterans were included if they were aged ≥ 18 years, had an active order for a CGM, T2DM diagnosis, an insulin prescription, and previously used test strips for glucose monitoring. Patients with T1DM, those who accessed CGMs or care in the community, and patients without HbA1c values pre-CGM, were excluded.
Statistical Analysis
The primary endpoint of change in HbA1c level before and after CGM use was compared using a paired t test. A 0.5% change in HbA1c was considered clinically significant, as suggested in other studies.8,9 P < .05 was considered statistically significant. Analysis for continuous baseline characteristics, including age and total daily insulin, were reported as mean values. Nominal characteristics including sex, race, diabetes medications, and prescriber type are reported as percentages.
Results
A total of 402 veterans were identified with an active CGM at the time of initial data collection in January 2024 and 175 met inclusion criteria. Sixty patients were excluded due to diabetes managed through a community HCP, 38 had T1DM, and 129 lacked HbA1c within all specified time periods. The 175 veterans were randomized, and 150 were selected to perform a chart review for data collection. The mean age was 70 years, most were male and identified as White (Table 1). The majority of patients were managed by endocrinology (53.3%), followed by primary care (24.0%), and pharmacy (22.7%) (Table 2). The mean baseline HbA1c was 8.6%.
The difference in HbA1c before and after use of CGM was -0.97% (P = .0001). Prior to use of a CGM the change in HbA1c was minimal, with an increase of 0.003% with the use of selfmonitoring glucose. After use of a CGM, HbA1c decreased by 0.971%. This reduction in HbA1c would also be considered clinically significant as the change was > 0.5%. The mean pre-, at start, and post-CGM HbA1c levels were 8.6%, 8.6%, and 7.6%, respectively (Figure 2). Pharmacy prescribers had a 0.7% reduction in HbA1c post-CGM, the least of all prescribers. While most age groups saw a reduction in HbA1c, those aged ≥ 80 years had an increase of 0.18% (Table 3). There was an overall mean reduction in insulin of 22 units, which was similar between all prescribers.
Discussion
The primary endpoint of difference in change of HbA1c before and after CGM use was found to be statistically and clinically significant, with a nearly 1% reduction in HbA1c, which was similar to the reduction found by Vigersky and colleagues. 5 Across all prescribers, post-CGM HbA1c levels were similar; however, patients with CGM prescribed by pharmacists had the smallest change in HbA1c. VA pharmacists primarily assess veterans taking insulin who have HbA1c levels that are below the goal with the aim of decreasing insulin to reduce the risk of hypoglycemia, which could result in increased HbA1c levels. This may also explain the observed increase in post-CGM HbA1c levels in patients aged ≥ 80 years. Patients under the care of pharmacists also had baseline mean HbA1c levels that were lower than primary care and endocrinology prescribers and were closer to their HbA1c goal at baseline, which likely was reflected in the smaller reduction in post-CGM HbA1c level.
While there was a decrease in HbA1c levels with CGM use, there were also changes to medications during this timeframe that also may have impacted HbA1c levels. The most common diabetes medications started during CGM use were GLP-1 agonists and SGLT2-inhibitors. Additionally, there was a reduction in the total daily dose of insulin in the study population. These results demonstrate the potential benefits of CGMs for prescribers who take advantage of the CGM glucose data available to assist with medication adjustments. Another consideration for differences in changes of HbA1c among prescriber types is the opportunity for more frequent follow- up visits with pharmacy or endocrinology compared with primary care. If veterans are followed more closely, it may be associated with improved HbA1c control. Further research investigating changes in HbA1c levels based on followup frequency may be useful.
Strengths and Limitations
The crossover design was a strength of this study. This design reduced confounding variables by having veterans serve as their own controls. In addition, the collection of multiple secondary outcomes adds to the knowledge base for future studies. This study focused on a unique population of veterans with T2DM who were taking insulin, an area that previously had very little data available to determine the benefits of CGM use.
Although the use of a CGM showed statistical significance in lowering HbA1c, many veterans were started on new diabetes medication during the period of CGM use, which also likely contributed to the reduction in HbA1c and may have confounded the results. The study was limited by its small population size due to time constraints of chart reviews and the limited generalizability of results outside of the VA system. The majority of patients were from a single site, male and identified as White, which may not be reflective of other VA and community health care systems. It was also noted that the time from the initiation of CGM use to the most recent HbA1c level varied from 6 months to several years. Additionally, veterans managed by community-based HCPs with complex diabetes cases were excluded.
Conclusions
This study demonstrated a clinically and statistically significant reduction in HbA1c with the use of a CGM compared to fingerstick monitoring in veterans with T2DM who were being treated with insulin. The change in post-CGM HbA1c levels across prescribers was similar. In the subgroup analysis of change in HbA1c among age groups, there was a lower HbA1c reduction in individuals aged ≥ 80 years. The results from this study support the idea that CGM use may be beneficial for patients who require a reduction in HbA1c by allowing more precise adjustments to medications and optimization of therapy, as well as the potential to reduce insulin requirements, which is especially valuable in the older adult veteran population.
- US Department of Veterans Affairs. VA supports veterans who have type 2 diabetes. VA News. Accessed September 30, 2024. https://news.va.gov/107579/va-supports-veterans-who-have-type-2-diabetes/
- ElSayed NA, Aleppo G, Aroda VR, et al. 9. Pharmacologic approaches to glycemic treatment: standards of care in diabetes-2023. Diabetes Care. 2023;46(Suppl 1):S140- S157. doi:10.2337/dc23-S009
- ElSayed NA, Aleppo G, Aroda VR, et al. 6. Glycemic targets: standards of care in diabetes-2023. Diabetes Care. 2023;46(Suppl 1):S97-S110. doi:10.2337/dc23-S006
- Miller E, Gavin JR, Kruger DF, Brunton SA. Continuous glucose monitoring: optimizing diabetes care: executive summary. Clin Diabetes. 2022;40(4):394-398. doi:10.2337/cd22-0043
- Vigersky RA, Fonda SJ, Chellappa M, Walker MS, Ehrhardt NM. Short- and long-term effects of real-time continuous glucose monitoring in patients with type 2 diabetes. Diabetes Care. 2012;35(1):32-38. doi:10.2337/dc11-1438
- Karter AJ, Parker MM, Moffet HH, Gilliam LK, Dlott R. Association of real-time continuous glucose monitoring with glycemic control and acute metabolic events among patients with insulin-treated diabetes. JAMA. 2021;325(22):2273-2284. doi:10.1001/JAMA.2021.6530
- Langford SN, Lane M, Karounos D. Continuous blood glucose monitoring outcomes in veterans with type 2 diabetes. Fed Pract. 2021;38(Suppl 4):S14-S17. doi:10.12788/fp.0189
- Radin MS. Pitfalls in hemoglobin A1c measurement: when results may be misleading. J Gen Intern Med. 2014;29(2):388-394. doi:10.1007/s11606-013-2595-x.
- Little RR, Rohlfing CL, Sacks DB; National Glycohemoglobin Standardization Program (NGSP) steering committee. Status of hemoglobin A1c measurement and goals for improvement: from chaos to order for improving diabetes care. Clin Chem. 2011;57(2):205-214. doi:10.1373/clinchem.2010.148841

VA Cancer Clinical Trials as a Strategy for Increasing Accrual of Racial and Ethnic Underrepresented Groups
Background
Cancer clinical trials (CCTs) are central to improving cancer care. However, generalizability of findings from CCTs is difficult due to the lack of diversity in most United States CCTs. Clinical trial accrual of underrepresented groups, is low throughout the United States and is approximately 4-5% in most CCTs. Reasons for low accrual in this population are multifactorial. Despite numerous factors related to accruing racial and ethnic underrepresented groups, many institutions have sought to address these barriers. We conducted a scoping review to identify evidence-based approaches to increase participation in cancer treatment clinical trials.
Methods
We reviewed the Salisbury VA Medical Center Oncology clinical trial database from October 2019 to June 2024. The participants in these clinical trials required consent. These clinical trials included treatment interventional as well as non-treatment interventional. Fifteen studies were included and over 260 Veterans participated.
Results
Key themes emerged that included a focus on patient education, cultural competency, and building capacity in the clinics to care for the Veteran population at three separate sites in the Salisbury VA system. The Black Veteran accrual rate of 29% was achieved. This accrual rate is representative of our VA catchment population of 33% for Black Veterans, and is five times the national average.
Conclusions
The research team’s success in enrolling Black Veterans in clinical trials is attributed to several factors. The demographic composition of Veterans served by the Salisbury, Charlotte, and Kernersville VA provided a diverse population that included a 33% Black group. The type of clinical trials focused on patients who were most impacted by the disease. The VA did afford less barriers to access to health care.

Cannabis Use by Veterans and Potential Interactions With Antineoplastic Agents: Analysis and Literature Review
Cannabis Use by Veterans and Potential Interactions With Antineoplastic Agents: Analysis and Literature Review
Cannabis has a long history of use for medicinal and recreational purposes. Research illustrates the potential benefits and increased prevalence of cannabis use in patients with cancer.1 Cannabis products have been shown to possess antineoplastic and palliative activity, improving nociceptive and neuropathic pain in addition to chemotherapy-related nausea and vomiting.2-5 Despite these developments and changing social attitudes toward cannabis, there remains a lack of comprehensive data on patient perspectives regarding its use, especially in regions where cannabis remains illegal. This knowledge gap is notable among veterans undergoing cancer treatment in states where cannabis is prohibited. Up to 57% of veterans report lifetime marijuana use, making it crucial to understand this population’s cannabis use patterns and potential interactions with cancer treatments.6
This observational study sought to determine the prevalence of cannabis use among patients undergoing cancer treatment at the US Department of Veterans Affairs (VA) Memphis Healthcare System and evaluate the potential risks associated with combining cannabis products with anticancer therapies.
METHODS
This prospective observational study identified cannabis use among veterans receiving antineoplastic therapy at the Lt. Col. Luke Weathers Jr. VA Medical Center (WJVAMC) and analyzed potential interactions between cannabis products and their cancer treatments. Participants included adults aged > 18 years undergoing antineoplastic therapy at WJVAMC who consented to the study. Data collection involved a written survey approved by the WJVAMC Institutional Review Board and verbal consent from participants. The survey asked participants about their cannabis use in the previous 90 days, including details on quantity, frequency, and method of consumption (eg, inhalation, oral, topical). No incentives were offered for participation.
Surveys from 50 patients who used cannabis were analyzed and their electronic health records were reviewed for sex, age, diagnosis, and antineoplastic regimen. This information was securely stored. A literature review was conducted using PubMed and the Cochrane Library to explore potential interactions between cannabis and the antineoplastic agents that were prescribed to patients in the study, focusing on toxicity, efficacy, or synergistic effects.
Patients were categorized into 4 groups based on treatment: cytotoxic chemotherapy, immunotherapy, endocrine therapy, and targeted therapy. Patients undergoing multiple types of therapies were included in each applicable category.
RESULTS
A total of 132 patients agreed to participate. Fifty patients (38%) acknowledged using cannabis products within 90 days. The patients that used cannabis products within 90 days of the survey reported the following malignancies: 8 patients (16%) had prostate cancer, 3 patients (6%) had hepatocellular carcinoma, 7 patients (14%) had pancreatic carcinoma, 5 patients (10%) had multiple myeloma, 3 patients (6%) had chronic lymphocytic leukemia, 9 patients (18%) had non-small cell lung cancer, 3 patients (6%) had breast cancer, 3 (6%) patients had bladder cancer, 2 patients (4%) had renal cell carcinoma, 1 (2%) patient had chronic myeloid leukemia, 1 (2%) patient had renal amyloid, 1 patient (2%) had supraglottic squamous cell carcinoma, 1 patient (2%) had esophageal carcinoma, 1 (2%) patient had small cell lung cancer, 1 (2%) patient had gastric cancer, and 1 patient (2%) had follicular lymphoma.
Five (10%) of the cannabis users were female, and 45 (90%) were male. Twenty-nine patients (58%) were aged 66 to 75 years, 16 (32%) were aged 56 to 65 years, 3 (6%) were aged 46 to 55 years, and 2 (4%) were aged 76 to 85 years.
Thirty-five patients (70%) inhaled cannabis as opposed to using it via other formulations or a combination (eg, inhalation and topical). Thirty-eight percent of patients used cannabis once daily, 24% used < 1 daily, and 28% used it ≥ 2 times daily. Five patients (10%) did not report the frequency of their cannabis use. Among the patients who reported cannabis use, 21 (42%) were undergoing cytotoxic chemotherapy, 19 (38%) were undergoing immunotherapy, 12 (24%) were undergoing targeted therapy, and 10 (20%) were undergoing endocrine therapy. Some patients were treated with multiple types of antineoplastic agents and were counted in multiple categories (Table 1).
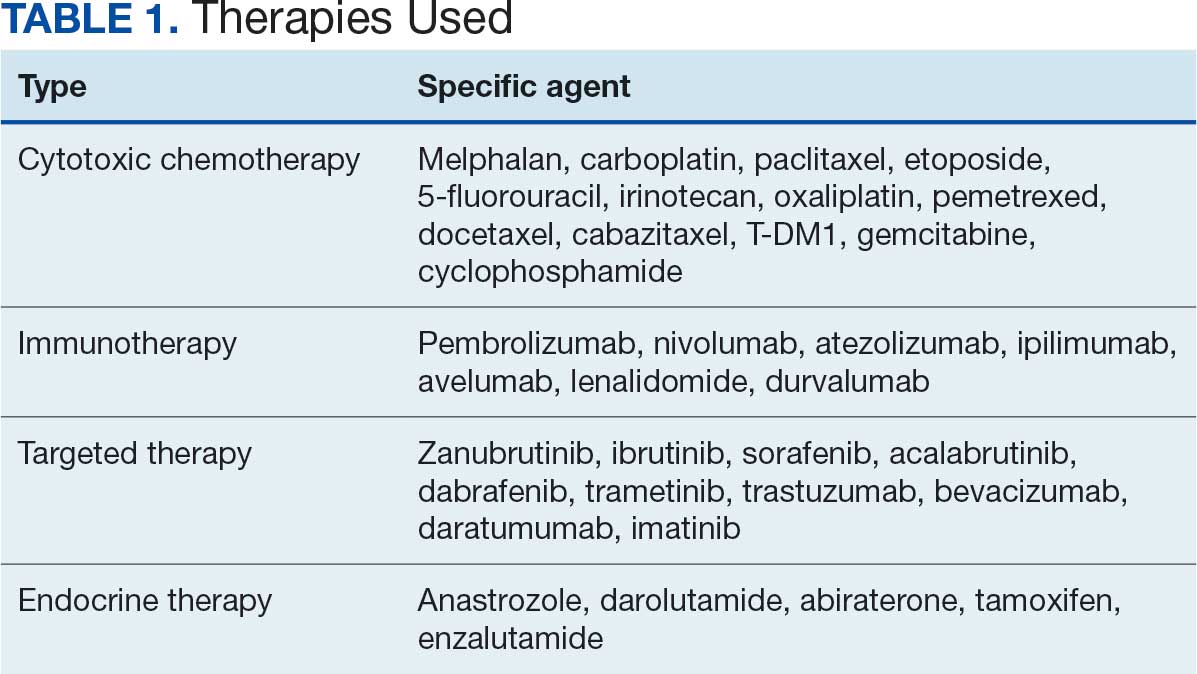
Following a literature review of cannabis and antineoplastic agents, patients were evaluated for the potential effects of cannabis on their treatment. The literature review revealed that 31% of cytotoxic chemotherapy agents received by patients in this study might have increased toxicity, and 19% could have reduced efficacy when combined with cannabis. Among immunotherapy agents received by patients in this study, 70% might have decreased efficacy when combined with cannabis use. For targeted therapies, 35% could have increased toxicity, and 70% of endocrine agents could potentially have decreased efficacy (Table 2).
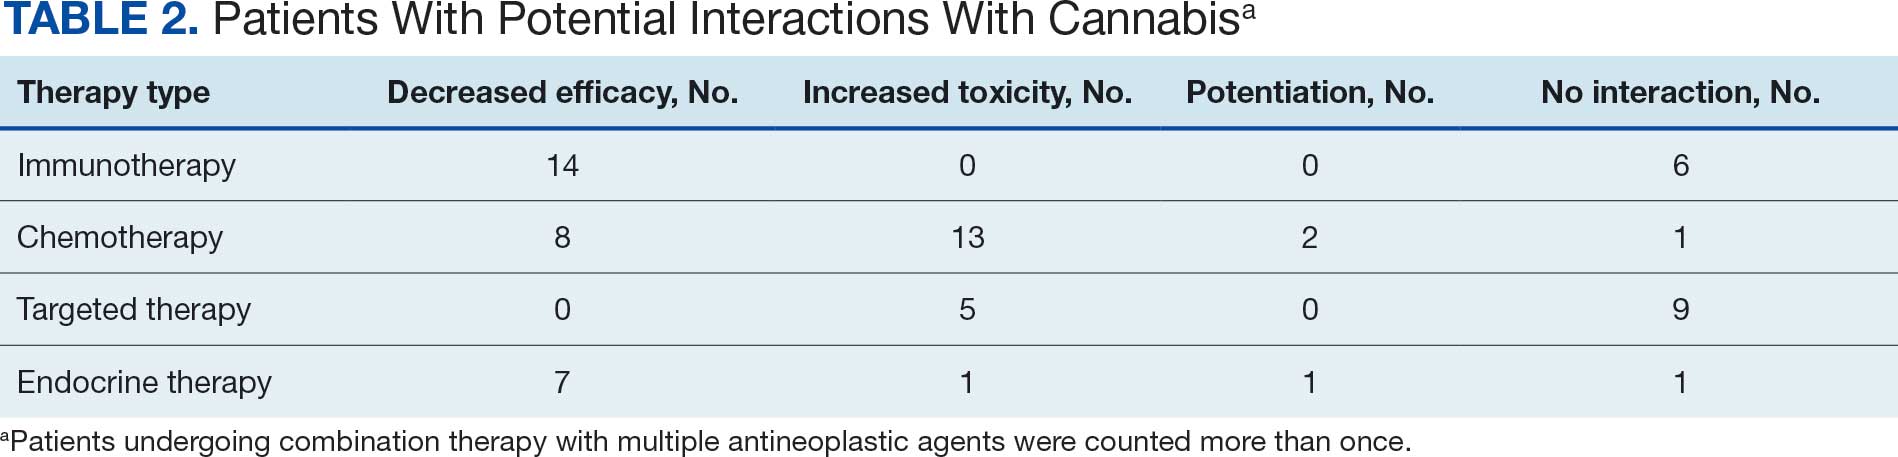
DISCUSSION
This prospective study corroborates previous research by demonstrating that more than one-third of patients receiving oncology care at WJVAMC use cannabis, most often inhaled. Cannabis use was observed among patients undergoing various cancer therapies, including cytotoxic chemotherapy, immunotherapy, targeted therapy, and endocrine therapy. The most common malignancies among cannabis users at WJVAMC include patients with lung cancer, prostate cancer, pancreatic cancer, and multiple myeloma. Cannabis use in patients with pancreatic cancer and multiple myeloma was significantly out of proportion to their prevalence at WJVAMC. This could potentially be due to their drastic effect on quality of life.
Cannabis use increased the risk of toxicity in patients treated with cytotoxic chemotherapy and targeted therapy. Cannabis use potentially decreased efficacy for patients treated with cytotoxic chemotherapy and/or immunotherapy. Cannabis use did not increase the risk of toxicity or efficacy in patients treated with endocrine therapy.
Antineoplastics/Cannabis Interactions
The potential interactions between cannabis and antineoplastic therapies administered at WJVAMC are worth exploring. While this review aims to shed light on possible interactions, it is important to acknowledge that much of the data is preliminary and derived from in vitro studies. The interactions should be interpreted as potential risks rather than established facts. Additional research is needed to confirm these interactions and effectively guide clinical practices. Understanding these dynamics is essential to optimize patient care and manage the complex interplay between cannabis use and cancer treatment.
Originating from Central Asia, the cannabis plant contains > 400 medicinally relevant compounds, of which about 100 are cannabinoids (CBs). Key CBs are cannabidiol (CBD), a nonpsychoactive compound, and ?-9-tetrahydrocannabinol (THC), a psychoactive compound. THC can make up 20% to 30% of the dry weight of female cannabis flowers.7
CBs act through the endocannabinoid system, involving CB1 and CB2 receptors, endogenous CBs like anandamide (AEA) and 2-arachidonoylglycerol, and various enzymes. These endogenous CBs, derived from arachidonic acid, play roles in cell growth and proliferation.8 In some studies, AEA has induced apoptosis in neuroblastoma cells and inhibited proliferation in breast cancer cells. However, other research suggests AEA may block apoptosis under certain conditions.9
CB receptors are transmembrane proteins that interact with CBs differently depending on tissue type and CB structure. Synthetic CBs are designed to target specific receptors, while natural CBs may act as both agonists and antagonists.10
Cytochrome P450 Metabolism
The human cytochrome P450 (CYP) 3A subfamily affects the metabolism of many therapeutic drugs, including cancer therapeutics.11 The various compositions of cannabis are primarily metabolized by the CYP450 pathway, the same as many cancer-directed pharmacologic treatments. CBs act as both CYP inducers and inhibitors. THC, for example, is a CYP inducer whereas CBD is a CYP inhibitor; both are found in the various compounds available for consumption.12,13 Pharmacology research has suggested potential interactions and effects on established adverse symptoms, but clinical data are lacking, and current research revealing interactions are only recognized in vitro.14
The Antineoplastic Activity of Cannabis
CBs can affect various cancer-related pathways such as PKB, AMPK, CAMKK-ß, mTOR, PDHK, HIF-1 a, and PPAR-γ. Δ-9-THC can selectively induce apoptosis in tumor cells without harming normal cells, though the exact mechanism remains unclear. Promising results from early mouse studies led to a 2006 human study where intracranial Δ-9-THC in patients with recurrent glioma yielded a median survival of 24 weeks, with 2 patients surviving > 1 year.15
In a 2022 review article, Cherkasova et al highlighted potential clinical benefits of cannabis across various cancers. They found that upregulated CB1 receptors in colon cancer might enhance the effect of 5-fluorouracil. However, many studies are preliminary and therefore not definitive.10
Additional research is needed to refine these findings. Challenges include variability in cannabis formulations, the complex tumor microenvironment, and the legal and psychoactive issues surrounding cannabis use. These factors complicate the design of multicenter randomized studies and may deter patients from disclosing cannabis use, thereby hindering efforts to fully understand its therapeutic potential.
Cannabis/Cytotoxic Chemotherapy Interactions
The chemotherapy agents used in this study included carboplatin, paclitaxel, 5-fluorouracil, etoposide, irinotecan, oxaliplatin, pemetrexed, docetaxel, cabazitaxel, T-DM1, gemcitabine, and cyclophosphamide. There is a paucity of research regarding the interactions between cytotoxic chemotherapy and cannabis. Most studies focused on CBD due to its inhibition of the CYP450 pathway, which is used for metabolizing cytotoxic chemotherapies. Through this mechanism, CBD could potentially increase the concentrations of chemotherapeutic agents, enhancing their toxicity.
When combined with irinotecan, cannabis can pose risks. Δ-9-THC undergoes first-pass metabolism in the liver, mediated by the CYP450 system and CYP3A4. The glucuronidation of irinotecan is mediated by uridine diphosphate glycosyltransferase, leading to its recirculation within the hepatic system and potentially increased toxicity due to prolonged drug presence. Cannabis may also compete with drug binding to albumin, altering the plasma concentrations of irinotecan and its conversion to the metabolite SN38.16
Cannabis products can affect chemotherapy levels by interacting with cellular transporters. The MRP1 transporter family, encoded by the ABCC gene family, is expressed mainly in the lung, kidney, skeletal muscle, and hematopoietic stem cells. A 2018 study investigating the effects of THC, CBD, and CBN on MRP1 transporters found that the presence of a cannabis component increased the concentration of vincristine 3-fold. Additional studies suggest the interaction with the CB1 receptor may lead to changes in the expression of MRP1 transporters.17
CBD inhibits the BCRP transporter, which functions as an efflux pump for methotrexate. Consequently, CBD can increase methotrexate levels, potentially enhancing efficacy but also worsening adverse effects.18
In pancreatic cancer, CBD specifically interacts with gemcitabine. CB1 and CB2 receptors are upregulated, and CBD inhibits the GPR55 receptor. These interactions may enhance the antineoplastic effect of gemcitabine, reducing cell cycle progression and growth.19
CBD also interacts with temozolomide (TMZ) by affecting extracellular vesicles used by cells for pro-oncogenic signaling and immune system evasion. Experiments on patient-derived glioblastoma cells, both chemotherapy-resistant and chemotherapy-sensitive, found that CBD increases the formation of extracellular vesicles with reduced levels of miR21 (pro-oncogenic) and elevated levels of miR126 (antioncogenic).20 CBD has also been found to decrease prohibitin levels, a protein associated with TMZ resistance.
In patients with glioblastoma, CBD combined with chemotherapeutic agents like TMZ, carmustine, doxorubicin, and cisplatin has shown increased sensitivity and improved tumor response. CBD is also known to inhibit NF-kB, a pathway that sustains tumor viability despite chemotherapy.21 Additionally, CBD inhibits the P-glycoprotein system, affecting chemotherapy efflux from neoplastic cells.14 In vitro studies have found that CBD is synergistic with bortezomib in inhibiting cancer cell viability. In another glioblastoma model, CBD enhanced the antiproliferative effects of both TMZ and carmustine.14
Different cannabis formulations may vary in how they interact with various cytotoxic chemotherapeutic agents. Some may potentiate the effects of chemotherapy and act synergistically to inhibit tumor growth, while others may lead to increased toxicity.10 More research is needed to determine which formulations, in combination with specific agents and doses, may have significant interactions that warrant adjustments in chemotherapy dosing.
Cannabis/Immunotherapy Interactions
Cannabis is an immunosuppressant. Data suggest the use of cannabis during immunotherapy worsens treatment outcomes in patients with cancer.22 Exogenous (THC) and endogenous (AEA) CBs negatively affect antitumor immunity by impairing the function of tumor-specific T cells via CB2 and by inhibiting the Jak1-STATs signaling in T cells through CNR2. Xiong et al found that THC reduces the therapeutic effect of anti-PD-1 therapy.22
In a prospective observational clinical study, Bar-Sela et al analyzed 102 patients with advanced cancer—of which 68 were cannabis users—that were started on immune checkpoint inhibitor therapy. The study found that cannabis users on anti-PD-1 (nivolumab, pembrolizumab), anti-CTLA-4 (ipilimumab), and anti-PD-L1 (durvalumab, atezolizumab) had a significant decrease in time to treatment progression and overall survival vs cannabis non-users.23 However, a 2023 study by Waissengrin et al found that concomitant use of medical cannabis with pembrolizumab had no harmful effect in advanced non-small cell lung cancer.24 Time to treatment progression of cannabis users did not differ from cannabis nonusers.25
Cannabis/Endocrine Therapy Interactions
In addition to having direct antineoplastic activity on tumor cells, data exist that show how cannabis affects the endocrine system. In animal models, cannabis has been found to suppress the whole hypothalamic-pituitary-adrenal axis as well as other hormones like thyroid, prolactin, and growth hormone. In breast cancer, cannabis competes with estrogen for the estrogen receptor and suppresses growth.26
The endocrine agents used by patients with cancer in this study were antiandrogens like abiraterone, enzalutamide, tamoxifen and anastrozole. Abiraterone is metabolized by CYP450 isoenzymes and uridine diphosphate glycosyltransferases. Cannabis inhibits both processes and therefore may lead to increased toxicities.27 Conversely, enzalutamide is a strong CYP3A inducer, and cannabis use during enzalutamide therapy may significantly increase the toxic effects of cannabis.
There is evidence that molecular pathways involving CB receptors and estrogens overlap, which may lead to interactions when antiestrogens are used in cannabis users with hormone receptor-positive breast cancer.26 In preclinical studies, tamoxifen has been shown to act as an inverse agonist on CB1 and CB2 receptors, though the significance of this finding is unclear. There is no research evaluating the effects of CBs on tamoxifen treatment. However, CBD has been found to potentiate the effectiveness of anastrozole or exemestane in breast cancer cell lines.28 Dobovišek et al demonstrated no inhibitory effect of CBD on the activity of tamoxifen, fulvestrant, or palbociclib in breast cancer cell lines.29 The interactions between hormone receptor-positive breast cancer and cannabinoids are complex, and the clinical significance of these interactions remains difficult to identify.
Cannabis/Targeted Therapy Interactions
The targeted therapies used by patients in this study included zanubrutinib, ibrutinib, sorafenib, acalabrutinib, dabrafenib, trametinib, trastuzumab, bevacizumab, daratumumab, and imatinib. Compared to other classes of cancer treatments, most studies have not demonstrated decreased efficacy or increased toxicity of targeted anticancer drugs when used concomitantly with CBD.29
Trastuzumab is a recombinant humanized monoclonal antibody that targets the proto-oncogene HER2/neu. It is used to treat select patients with metastatic breast cancer. Studies have shown that cannabis use does not attenuate the effectiveness of trastuzumab in HER2-positive and triple-negative breast cancer subtypes.29 One study found that CBD, in combination with chemotherapeutics and Bruton tyrosine kinase inhibitors, such as ibrutinib and zanubrutinib, has synergistic potential for treating diffuse large B-cell lymphoma and mantle cell lymphoma cell lines. This synergy is attributed to the CB1 antagonist activity of cannabis against diffuse large B-cell lymphoma and mantle cell lymphoma cell lines.30,31
Moreover, combining cannabinoids with bevacizumab (a monoclonal anti-VEGF antibody) has been shown to decrease tumor growth and intratumoral hypoxia in clinically relevant human glioblastoma models. This effect is mediated through the downregulation of HIF-1α.32 Long-term studies evaluating the potential harmful or synergistic potential of CBD on targeted anticancer therapy are needed.
CONCLUSIONS
This exploratory study of patients receiving cancer therapy at WJVAMC found a significant prevalence of concurrent cannabis use among patients undergoing antineoplastic treatments. Given that many antineoplastic agents are metabolized by the CYP450 enzyme system, the findings of this study suggest that concurrent cannabis use may pose risks of suboptimal therapeutic outcomes due to potential interactions affecting drug metabolism. These interactions could impact the efficacy and toxicity of the antineoplastic therapies, potentially leading to diminished therapeutic effects or exacerbated adverse reactions.
Patients should be informed regarding the potential decreased efficacy of immunotherapy with concurrent use of cannabis products. They should also be aware of the possibility of increased toxicity with other treatment modalities, though the exact impact on efficacy remains unclear. This highlights the necessity of caution when combining cannabis with prescribed cancer treatments.
While this study identified possible interactions, its data are preliminary and highlight the need for more rigorous research. Future studies should include larger, well-designed cohorts to compare outcomes between cannabis users and nonusers. Such research is essential to fully elucidate the clinical implications of cannabis use during cancer treatment, address the high prevalence of cannabis use among patients with cancer, and mitigate potential risks associated with combining cannabis products with antineoplastic therapies. This will ensure that treatment strategies are optimized for safety and efficacy in this complex patient population.
- Steele G, Arneson T, Zylla D. A comprehensive review of cannabis in patients with cancer: availability in the USA, general efficacy, and safety. Curr Oncol Rep. 2019;21:1-10. doi:10.1007/s11912-019-0757-7
- Brown D, Watson M, Schloss J. Pharmacological evidence of medicinal cannabis in oncology: a systematic review. Support Care Cancer. 2019;27:3195-320. doi:10.1007/s00520-019-04774-5
- Abrams DI. Integrating cannabis into clinical cancer care. Curr Oncol. 2016;23:S8-S14. doi:10.37.47/co.23.3099
- Serafimovska T, Darkovska-Serafimovska M, Stefkov G, Arsova-Sarafinovska Z, Balkanov T. Pharmacotherapeutic considerations for use of cannabinoids to relieve symptoms of nausea and vomiting induced by chemotherapy. Folia Medica (Plovdiv). 2020;62:668-678. doi:10.3897/folmed.62e51478
- Bar-Sela G, Zalman D, Semenysty V, Ballan E. The effects of dosage-controlled cannabis capsules on cancer-related cachexia and anorexia syndrome in advanced cancer patients: pilot study. Integr Cancer Ther. 2019;18:1534735419881498. doi:10.1177/1534735419881498
- Pederson ER, Villarosa-Hurlocker MC, Prince MA. Use of protective behavioral strategies among young adult veteran marijuana users. Cannabis. 2018;1:14-27.
- Schilling S, Melzer R, McCabe PF. Cannabis sativa. Curr Biol. 2020;30:R8-R9. doi:10.1016/j.cub.2019.10.039
- McDougle DR, Kambalyal A, Meling DD, Das A. Endocannabinoids anandamide and 2-arachidonoylglycerol are substrates for human CYP2J2 epoxygenase. J Pharmacol Exp Ther. 2014;351:616-627. doi:10.1124/jpet.114216598
- Movsesyan VA, Stoica BA, Yakovlev AG, et al. Anandamide-induced cell death in primary neuronal cultures: role of calpain and caspase pathways. Cell Death Differ. 2004;11:1121-1132. doi:10.1038/sj.cdd.4401442
- Cherkasova V, Wang B, Gerasymchuk M, Fiselier A, Kovalchuk O, Kovalchuk I. Use of cannabis and cannabinoids for treatment of cancer. Cancers (Basel). 2022;14:5142. doi:10.3390/cancers14205142
- Engels FK, Ten Tije AJ, Baker SD, et al. Effect of cytochrome P450 3A4 inhibition on the pharmacokinetics of docetaxel. Clin Pharmacol Ther. 2004;75:448-454. doi:10.1016/j.clpt.2004.01.001
- Alsherbiny MA, Li CG. Medicinal cannabis-potential drug interactions. Medicines (Basel). 2018;6:3. doi:10.3390/medicines6010003
- Stout SM, Cimino NM. Exogenous cannabinoids as substrates, inhibitors, and inducers of human drug metabolizing enzymes: a systematic review. Drug Metab Rev. 2014;46:86-95. doi:10.3109/03602532.2013.849268
- Opitz BJ, Ostroff ML, Whitman AC. The potential clinical implications and importance of drug interactions between anticancer agents and cannabidiol in patients with cancer. J Pharm Pract. 2020;33:506-512. doi:10.1177/0897190019828920
- Guzmán M, Duarte MJ, Blázquez C, et al. A pilot clinical study of D9-tetrahydrocannabinol in patients with recurrent glioblastoma multiforme. Br J Cancer. 2006;95:197-203. doi:10.1038/sj.bjc.6603236
- Kopjar N, Fuchs N, Brcic Karaconji I, et al. High doses of ?9-tetrahydrocannabinol might impair irinotecan chemotherapy: a review of potentially harmful interactions. Clin Drug Investig. 2020;40:775-787. doi:10.1007/s40261-020-00954-y
- Bouquié R, Deslandes G, Mazaré H, et al. Cannabis and anticancer drugs: societal usage and expected pharmacological interactions - a review. Fundam Clin Pharmacol. 2018;32:462-484. doi:10.1111/fcp.12373
- Buchtova T, Lukac D, Skrott Z, Chroma K, Bartek J, Mistrik M. Drug-drug interactions of cannabidiol with standard-of-care chemotherapeutics. Int J Mol Sci. 2023;24:2885. doi:10.3390/ijms24032885
- Sharafi G, He H, Nikfarjam M. Potential use of cannabinoids for the treatment of pancreatic cancer. J Pancreat Cancer. 2019;5:1-7. doi:10.1089/pancan.2018.0019
- Kosgodage US, Uysal-Onganer P, MacLatchy A, et al. Cannabidiol affects extracellular vesicle release, miR21 and miR126, and reduces prohibitin protein in glioblastoma multiforme cells. Transl Oncol. 2019;12:513-522. doi:10.1016/j.tranon.2018.12.004
- Elbaz M, Nasser MW, Ravi J, et al. Modulation of the tumor microenvironment and inhibition of EGF/EGFR pathway: novel anti-tumor mechanisms of cannabidiol in breast cancer. Mol Oncol. 2015;9:906-919. doi:10.1016/j.molonc.2014.12.010
- Xiong X, Chen S, Shen J, et al. Cannabis suppresses anti-tumor immunity by inhibiting JAK/STAT signaling in T cells through CNR2. Signal Transduct Target Ther. 2022;7:99. doi:10.1038/s41392-022-00918-y
- Bar-Sela G, Cohen I, Campisi-Pinto S, et al. Cannabis consumption used by cancer patients during immunotherapy correlates with poor clinical outcome. Cancers (Basel). 2020;12:2447. doi:10.3390/cancers12092447
- Waissengrin B, Leshem Y, Taya M, et al. The use of medical cannabis concomitantly with immune checkpoint inhibitors in non-small cell lung cancer: a sigh of relief? Eur J Cancer. 2023;180:52-61. doi:10.1016/j.ejca.2022.11.022
- Sarsembayeva A, Schicho R. Cannabinoids and the endocannabinoid system in immunotherapy: helpful or harmful? Front Oncol. 2023;13:1296906. doi:10.3389/fonc.2023.1296906
- Kisková T, Mungenast F, Suváková M, Jäger W, Thalhammer T. Future aspects for cannabinoids in breast cancer therapy. Int J Mol Sci. 2019;20:1673. doi:10.3390/ijms20071673
- Woerdenbag HJ, Olinga P, Kok EA, et al. Potential, limitations and risks of cannabis-derived products in cancer treatment. Cancers (Basel). 2023;15:2119. doi:10.3390/cancers15072119
- Almeida CF, Teixeira N, Valente MJ, Vinggaard AM, Correia-da-Silva G, Amaral C. Cannabidiol as a promising adjuvant therapy for estrogen receptor-positive breast tumors: unveiling its benefits with aromatase inhibitors. Cancers (Basel). 2023;15:2517. doi:10.3390/cancers15092517
- Dobovišek L, Novak M, Krstanovic F, Borštnar S, Turnšek TL, Debeljak N. Effect of combining CBD with standard breast cancer therapeutics. Adv Cancer Biol Metastasis. 2022;4:100038. doi:10.1016/j.adcanc.2022.100038
- Strong T, Rauvolfova J, Jackson E, Pham LV, Bryant J. Synergistic effect of cannabidiol with conventional chemotherapy treatment. Blood. 2018;132:5382. doi:10.1182/blood-2018-99-116749
- Maggi F, Morelli MB, Tomassoni D, et al. The effects of cannabidiol via TRPV2 channel in chronic myeloid leukemia cells and its combination with imatinib. Cancer Sci. 2022;113:1235-1249. doi:10.1111/cas.15257
- Obad N, Janji B, Prestegarden L, et al. ATPS-59 improving efficacy of bevacizumab treatment in glioblastoma by targeting hif1 alpha. Neuro Oncol. 2015;17:v31. doi:10.1093/neuonc/nov204.59
Cannabis has a long history of use for medicinal and recreational purposes. Research illustrates the potential benefits and increased prevalence of cannabis use in patients with cancer.1 Cannabis products have been shown to possess antineoplastic and palliative activity, improving nociceptive and neuropathic pain in addition to chemotherapy-related nausea and vomiting.2-5 Despite these developments and changing social attitudes toward cannabis, there remains a lack of comprehensive data on patient perspectives regarding its use, especially in regions where cannabis remains illegal. This knowledge gap is notable among veterans undergoing cancer treatment in states where cannabis is prohibited. Up to 57% of veterans report lifetime marijuana use, making it crucial to understand this population’s cannabis use patterns and potential interactions with cancer treatments.6
This observational study sought to determine the prevalence of cannabis use among patients undergoing cancer treatment at the US Department of Veterans Affairs (VA) Memphis Healthcare System and evaluate the potential risks associated with combining cannabis products with anticancer therapies.
METHODS
This prospective observational study identified cannabis use among veterans receiving antineoplastic therapy at the Lt. Col. Luke Weathers Jr. VA Medical Center (WJVAMC) and analyzed potential interactions between cannabis products and their cancer treatments. Participants included adults aged > 18 years undergoing antineoplastic therapy at WJVAMC who consented to the study. Data collection involved a written survey approved by the WJVAMC Institutional Review Board and verbal consent from participants. The survey asked participants about their cannabis use in the previous 90 days, including details on quantity, frequency, and method of consumption (eg, inhalation, oral, topical). No incentives were offered for participation.
Surveys from 50 patients who used cannabis were analyzed and their electronic health records were reviewed for sex, age, diagnosis, and antineoplastic regimen. This information was securely stored. A literature review was conducted using PubMed and the Cochrane Library to explore potential interactions between cannabis and the antineoplastic agents that were prescribed to patients in the study, focusing on toxicity, efficacy, or synergistic effects.
Patients were categorized into 4 groups based on treatment: cytotoxic chemotherapy, immunotherapy, endocrine therapy, and targeted therapy. Patients undergoing multiple types of therapies were included in each applicable category.
RESULTS
A total of 132 patients agreed to participate. Fifty patients (38%) acknowledged using cannabis products within 90 days. The patients that used cannabis products within 90 days of the survey reported the following malignancies: 8 patients (16%) had prostate cancer, 3 patients (6%) had hepatocellular carcinoma, 7 patients (14%) had pancreatic carcinoma, 5 patients (10%) had multiple myeloma, 3 patients (6%) had chronic lymphocytic leukemia, 9 patients (18%) had non-small cell lung cancer, 3 patients (6%) had breast cancer, 3 (6%) patients had bladder cancer, 2 patients (4%) had renal cell carcinoma, 1 (2%) patient had chronic myeloid leukemia, 1 (2%) patient had renal amyloid, 1 patient (2%) had supraglottic squamous cell carcinoma, 1 patient (2%) had esophageal carcinoma, 1 (2%) patient had small cell lung cancer, 1 (2%) patient had gastric cancer, and 1 patient (2%) had follicular lymphoma.
Five (10%) of the cannabis users were female, and 45 (90%) were male. Twenty-nine patients (58%) were aged 66 to 75 years, 16 (32%) were aged 56 to 65 years, 3 (6%) were aged 46 to 55 years, and 2 (4%) were aged 76 to 85 years.
Thirty-five patients (70%) inhaled cannabis as opposed to using it via other formulations or a combination (eg, inhalation and topical). Thirty-eight percent of patients used cannabis once daily, 24% used < 1 daily, and 28% used it ≥ 2 times daily. Five patients (10%) did not report the frequency of their cannabis use. Among the patients who reported cannabis use, 21 (42%) were undergoing cytotoxic chemotherapy, 19 (38%) were undergoing immunotherapy, 12 (24%) were undergoing targeted therapy, and 10 (20%) were undergoing endocrine therapy. Some patients were treated with multiple types of antineoplastic agents and were counted in multiple categories (Table 1).
Following a literature review of cannabis and antineoplastic agents, patients were evaluated for the potential effects of cannabis on their treatment. The literature review revealed that 31% of cytotoxic chemotherapy agents received by patients in this study might have increased toxicity, and 19% could have reduced efficacy when combined with cannabis. Among immunotherapy agents received by patients in this study, 70% might have decreased efficacy when combined with cannabis use. For targeted therapies, 35% could have increased toxicity, and 70% of endocrine agents could potentially have decreased efficacy (Table 2).
DISCUSSION
This prospective study corroborates previous research by demonstrating that more than one-third of patients receiving oncology care at WJVAMC use cannabis, most often inhaled. Cannabis use was observed among patients undergoing various cancer therapies, including cytotoxic chemotherapy, immunotherapy, targeted therapy, and endocrine therapy. The most common malignancies among cannabis users at WJVAMC include patients with lung cancer, prostate cancer, pancreatic cancer, and multiple myeloma. Cannabis use in patients with pancreatic cancer and multiple myeloma was significantly out of proportion to their prevalence at WJVAMC. This could potentially be due to their drastic effect on quality of life.
Cannabis use increased the risk of toxicity in patients treated with cytotoxic chemotherapy and targeted therapy. Cannabis use potentially decreased efficacy for patients treated with cytotoxic chemotherapy and/or immunotherapy. Cannabis use did not increase the risk of toxicity or efficacy in patients treated with endocrine therapy.
Antineoplastics/Cannabis Interactions
The potential interactions between cannabis and antineoplastic therapies administered at WJVAMC are worth exploring. While this review aims to shed light on possible interactions, it is important to acknowledge that much of the data is preliminary and derived from in vitro studies. The interactions should be interpreted as potential risks rather than established facts. Additional research is needed to confirm these interactions and effectively guide clinical practices. Understanding these dynamics is essential to optimize patient care and manage the complex interplay between cannabis use and cancer treatment.
Originating from Central Asia, the cannabis plant contains > 400 medicinally relevant compounds, of which about 100 are cannabinoids (CBs). Key CBs are cannabidiol (CBD), a nonpsychoactive compound, and ?-9-tetrahydrocannabinol (THC), a psychoactive compound. THC can make up 20% to 30% of the dry weight of female cannabis flowers.7
CBs act through the endocannabinoid system, involving CB1 and CB2 receptors, endogenous CBs like anandamide (AEA) and 2-arachidonoylglycerol, and various enzymes. These endogenous CBs, derived from arachidonic acid, play roles in cell growth and proliferation.8 In some studies, AEA has induced apoptosis in neuroblastoma cells and inhibited proliferation in breast cancer cells. However, other research suggests AEA may block apoptosis under certain conditions.9
CB receptors are transmembrane proteins that interact with CBs differently depending on tissue type and CB structure. Synthetic CBs are designed to target specific receptors, while natural CBs may act as both agonists and antagonists.10
Cytochrome P450 Metabolism
The human cytochrome P450 (CYP) 3A subfamily affects the metabolism of many therapeutic drugs, including cancer therapeutics.11 The various compositions of cannabis are primarily metabolized by the CYP450 pathway, the same as many cancer-directed pharmacologic treatments. CBs act as both CYP inducers and inhibitors. THC, for example, is a CYP inducer whereas CBD is a CYP inhibitor; both are found in the various compounds available for consumption.12,13 Pharmacology research has suggested potential interactions and effects on established adverse symptoms, but clinical data are lacking, and current research revealing interactions are only recognized in vitro.14
The Antineoplastic Activity of Cannabis
CBs can affect various cancer-related pathways such as PKB, AMPK, CAMKK-ß, mTOR, PDHK, HIF-1 a, and PPAR-γ. Δ-9-THC can selectively induce apoptosis in tumor cells without harming normal cells, though the exact mechanism remains unclear. Promising results from early mouse studies led to a 2006 human study where intracranial Δ-9-THC in patients with recurrent glioma yielded a median survival of 24 weeks, with 2 patients surviving > 1 year.15
In a 2022 review article, Cherkasova et al highlighted potential clinical benefits of cannabis across various cancers. They found that upregulated CB1 receptors in colon cancer might enhance the effect of 5-fluorouracil. However, many studies are preliminary and therefore not definitive.10
Additional research is needed to refine these findings. Challenges include variability in cannabis formulations, the complex tumor microenvironment, and the legal and psychoactive issues surrounding cannabis use. These factors complicate the design of multicenter randomized studies and may deter patients from disclosing cannabis use, thereby hindering efforts to fully understand its therapeutic potential.
Cannabis/Cytotoxic Chemotherapy Interactions
The chemotherapy agents used in this study included carboplatin, paclitaxel, 5-fluorouracil, etoposide, irinotecan, oxaliplatin, pemetrexed, docetaxel, cabazitaxel, T-DM1, gemcitabine, and cyclophosphamide. There is a paucity of research regarding the interactions between cytotoxic chemotherapy and cannabis. Most studies focused on CBD due to its inhibition of the CYP450 pathway, which is used for metabolizing cytotoxic chemotherapies. Through this mechanism, CBD could potentially increase the concentrations of chemotherapeutic agents, enhancing their toxicity.
When combined with irinotecan, cannabis can pose risks. Δ-9-THC undergoes first-pass metabolism in the liver, mediated by the CYP450 system and CYP3A4. The glucuronidation of irinotecan is mediated by uridine diphosphate glycosyltransferase, leading to its recirculation within the hepatic system and potentially increased toxicity due to prolonged drug presence. Cannabis may also compete with drug binding to albumin, altering the plasma concentrations of irinotecan and its conversion to the metabolite SN38.16
Cannabis products can affect chemotherapy levels by interacting with cellular transporters. The MRP1 transporter family, encoded by the ABCC gene family, is expressed mainly in the lung, kidney, skeletal muscle, and hematopoietic stem cells. A 2018 study investigating the effects of THC, CBD, and CBN on MRP1 transporters found that the presence of a cannabis component increased the concentration of vincristine 3-fold. Additional studies suggest the interaction with the CB1 receptor may lead to changes in the expression of MRP1 transporters.17
CBD inhibits the BCRP transporter, which functions as an efflux pump for methotrexate. Consequently, CBD can increase methotrexate levels, potentially enhancing efficacy but also worsening adverse effects.18
In pancreatic cancer, CBD specifically interacts with gemcitabine. CB1 and CB2 receptors are upregulated, and CBD inhibits the GPR55 receptor. These interactions may enhance the antineoplastic effect of gemcitabine, reducing cell cycle progression and growth.19
CBD also interacts with temozolomide (TMZ) by affecting extracellular vesicles used by cells for pro-oncogenic signaling and immune system evasion. Experiments on patient-derived glioblastoma cells, both chemotherapy-resistant and chemotherapy-sensitive, found that CBD increases the formation of extracellular vesicles with reduced levels of miR21 (pro-oncogenic) and elevated levels of miR126 (antioncogenic).20 CBD has also been found to decrease prohibitin levels, a protein associated with TMZ resistance.
In patients with glioblastoma, CBD combined with chemotherapeutic agents like TMZ, carmustine, doxorubicin, and cisplatin has shown increased sensitivity and improved tumor response. CBD is also known to inhibit NF-kB, a pathway that sustains tumor viability despite chemotherapy.21 Additionally, CBD inhibits the P-glycoprotein system, affecting chemotherapy efflux from neoplastic cells.14 In vitro studies have found that CBD is synergistic with bortezomib in inhibiting cancer cell viability. In another glioblastoma model, CBD enhanced the antiproliferative effects of both TMZ and carmustine.14
Different cannabis formulations may vary in how they interact with various cytotoxic chemotherapeutic agents. Some may potentiate the effects of chemotherapy and act synergistically to inhibit tumor growth, while others may lead to increased toxicity.10 More research is needed to determine which formulations, in combination with specific agents and doses, may have significant interactions that warrant adjustments in chemotherapy dosing.
Cannabis/Immunotherapy Interactions
Cannabis is an immunosuppressant. Data suggest the use of cannabis during immunotherapy worsens treatment outcomes in patients with cancer.22 Exogenous (THC) and endogenous (AEA) CBs negatively affect antitumor immunity by impairing the function of tumor-specific T cells via CB2 and by inhibiting the Jak1-STATs signaling in T cells through CNR2. Xiong et al found that THC reduces the therapeutic effect of anti-PD-1 therapy.22
In a prospective observational clinical study, Bar-Sela et al analyzed 102 patients with advanced cancer—of which 68 were cannabis users—that were started on immune checkpoint inhibitor therapy. The study found that cannabis users on anti-PD-1 (nivolumab, pembrolizumab), anti-CTLA-4 (ipilimumab), and anti-PD-L1 (durvalumab, atezolizumab) had a significant decrease in time to treatment progression and overall survival vs cannabis non-users.23 However, a 2023 study by Waissengrin et al found that concomitant use of medical cannabis with pembrolizumab had no harmful effect in advanced non-small cell lung cancer.24 Time to treatment progression of cannabis users did not differ from cannabis nonusers.25
Cannabis/Endocrine Therapy Interactions
In addition to having direct antineoplastic activity on tumor cells, data exist that show how cannabis affects the endocrine system. In animal models, cannabis has been found to suppress the whole hypothalamic-pituitary-adrenal axis as well as other hormones like thyroid, prolactin, and growth hormone. In breast cancer, cannabis competes with estrogen for the estrogen receptor and suppresses growth.26
The endocrine agents used by patients with cancer in this study were antiandrogens like abiraterone, enzalutamide, tamoxifen and anastrozole. Abiraterone is metabolized by CYP450 isoenzymes and uridine diphosphate glycosyltransferases. Cannabis inhibits both processes and therefore may lead to increased toxicities.27 Conversely, enzalutamide is a strong CYP3A inducer, and cannabis use during enzalutamide therapy may significantly increase the toxic effects of cannabis.
There is evidence that molecular pathways involving CB receptors and estrogens overlap, which may lead to interactions when antiestrogens are used in cannabis users with hormone receptor-positive breast cancer.26 In preclinical studies, tamoxifen has been shown to act as an inverse agonist on CB1 and CB2 receptors, though the significance of this finding is unclear. There is no research evaluating the effects of CBs on tamoxifen treatment. However, CBD has been found to potentiate the effectiveness of anastrozole or exemestane in breast cancer cell lines.28 Dobovišek et al demonstrated no inhibitory effect of CBD on the activity of tamoxifen, fulvestrant, or palbociclib in breast cancer cell lines.29 The interactions between hormone receptor-positive breast cancer and cannabinoids are complex, and the clinical significance of these interactions remains difficult to identify.
Cannabis/Targeted Therapy Interactions
The targeted therapies used by patients in this study included zanubrutinib, ibrutinib, sorafenib, acalabrutinib, dabrafenib, trametinib, trastuzumab, bevacizumab, daratumumab, and imatinib. Compared to other classes of cancer treatments, most studies have not demonstrated decreased efficacy or increased toxicity of targeted anticancer drugs when used concomitantly with CBD.29
Trastuzumab is a recombinant humanized monoclonal antibody that targets the proto-oncogene HER2/neu. It is used to treat select patients with metastatic breast cancer. Studies have shown that cannabis use does not attenuate the effectiveness of trastuzumab in HER2-positive and triple-negative breast cancer subtypes.29 One study found that CBD, in combination with chemotherapeutics and Bruton tyrosine kinase inhibitors, such as ibrutinib and zanubrutinib, has synergistic potential for treating diffuse large B-cell lymphoma and mantle cell lymphoma cell lines. This synergy is attributed to the CB1 antagonist activity of cannabis against diffuse large B-cell lymphoma and mantle cell lymphoma cell lines.30,31
Moreover, combining cannabinoids with bevacizumab (a monoclonal anti-VEGF antibody) has been shown to decrease tumor growth and intratumoral hypoxia in clinically relevant human glioblastoma models. This effect is mediated through the downregulation of HIF-1α.32 Long-term studies evaluating the potential harmful or synergistic potential of CBD on targeted anticancer therapy are needed.
CONCLUSIONS
This exploratory study of patients receiving cancer therapy at WJVAMC found a significant prevalence of concurrent cannabis use among patients undergoing antineoplastic treatments. Given that many antineoplastic agents are metabolized by the CYP450 enzyme system, the findings of this study suggest that concurrent cannabis use may pose risks of suboptimal therapeutic outcomes due to potential interactions affecting drug metabolism. These interactions could impact the efficacy and toxicity of the antineoplastic therapies, potentially leading to diminished therapeutic effects or exacerbated adverse reactions.
Patients should be informed regarding the potential decreased efficacy of immunotherapy with concurrent use of cannabis products. They should also be aware of the possibility of increased toxicity with other treatment modalities, though the exact impact on efficacy remains unclear. This highlights the necessity of caution when combining cannabis with prescribed cancer treatments.
While this study identified possible interactions, its data are preliminary and highlight the need for more rigorous research. Future studies should include larger, well-designed cohorts to compare outcomes between cannabis users and nonusers. Such research is essential to fully elucidate the clinical implications of cannabis use during cancer treatment, address the high prevalence of cannabis use among patients with cancer, and mitigate potential risks associated with combining cannabis products with antineoplastic therapies. This will ensure that treatment strategies are optimized for safety and efficacy in this complex patient population.
- Steele G, Arneson T, Zylla D. A comprehensive review of cannabis in patients with cancer: availability in the USA, general efficacy, and safety. Curr Oncol Rep. 2019;21:1-10. doi:10.1007/s11912-019-0757-7
- Brown D, Watson M, Schloss J. Pharmacological evidence of medicinal cannabis in oncology: a systematic review. Support Care Cancer. 2019;27:3195-320. doi:10.1007/s00520-019-04774-5
- Abrams DI. Integrating cannabis into clinical cancer care. Curr Oncol. 2016;23:S8-S14. doi:10.37.47/co.23.3099
- Serafimovska T, Darkovska-Serafimovska M, Stefkov G, Arsova-Sarafinovska Z, Balkanov T. Pharmacotherapeutic considerations for use of cannabinoids to relieve symptoms of nausea and vomiting induced by chemotherapy. Folia Medica (Plovdiv). 2020;62:668-678. doi:10.3897/folmed.62e51478
- Bar-Sela G, Zalman D, Semenysty V, Ballan E. The effects of dosage-controlled cannabis capsules on cancer-related cachexia and anorexia syndrome in advanced cancer patients: pilot study. Integr Cancer Ther. 2019;18:1534735419881498. doi:10.1177/1534735419881498
- Pederson ER, Villarosa-Hurlocker MC, Prince MA. Use of protective behavioral strategies among young adult veteran marijuana users. Cannabis. 2018;1:14-27.
- Schilling S, Melzer R, McCabe PF. Cannabis sativa. Curr Biol. 2020;30:R8-R9. doi:10.1016/j.cub.2019.10.039
- McDougle DR, Kambalyal A, Meling DD, Das A. Endocannabinoids anandamide and 2-arachidonoylglycerol are substrates for human CYP2J2 epoxygenase. J Pharmacol Exp Ther. 2014;351:616-627. doi:10.1124/jpet.114216598
- Movsesyan VA, Stoica BA, Yakovlev AG, et al. Anandamide-induced cell death in primary neuronal cultures: role of calpain and caspase pathways. Cell Death Differ. 2004;11:1121-1132. doi:10.1038/sj.cdd.4401442
- Cherkasova V, Wang B, Gerasymchuk M, Fiselier A, Kovalchuk O, Kovalchuk I. Use of cannabis and cannabinoids for treatment of cancer. Cancers (Basel). 2022;14:5142. doi:10.3390/cancers14205142
- Engels FK, Ten Tije AJ, Baker SD, et al. Effect of cytochrome P450 3A4 inhibition on the pharmacokinetics of docetaxel. Clin Pharmacol Ther. 2004;75:448-454. doi:10.1016/j.clpt.2004.01.001
- Alsherbiny MA, Li CG. Medicinal cannabis-potential drug interactions. Medicines (Basel). 2018;6:3. doi:10.3390/medicines6010003
- Stout SM, Cimino NM. Exogenous cannabinoids as substrates, inhibitors, and inducers of human drug metabolizing enzymes: a systematic review. Drug Metab Rev. 2014;46:86-95. doi:10.3109/03602532.2013.849268
- Opitz BJ, Ostroff ML, Whitman AC. The potential clinical implications and importance of drug interactions between anticancer agents and cannabidiol in patients with cancer. J Pharm Pract. 2020;33:506-512. doi:10.1177/0897190019828920
- Guzmán M, Duarte MJ, Blázquez C, et al. A pilot clinical study of D9-tetrahydrocannabinol in patients with recurrent glioblastoma multiforme. Br J Cancer. 2006;95:197-203. doi:10.1038/sj.bjc.6603236
- Kopjar N, Fuchs N, Brcic Karaconji I, et al. High doses of ?9-tetrahydrocannabinol might impair irinotecan chemotherapy: a review of potentially harmful interactions. Clin Drug Investig. 2020;40:775-787. doi:10.1007/s40261-020-00954-y
- Bouquié R, Deslandes G, Mazaré H, et al. Cannabis and anticancer drugs: societal usage and expected pharmacological interactions - a review. Fundam Clin Pharmacol. 2018;32:462-484. doi:10.1111/fcp.12373
- Buchtova T, Lukac D, Skrott Z, Chroma K, Bartek J, Mistrik M. Drug-drug interactions of cannabidiol with standard-of-care chemotherapeutics. Int J Mol Sci. 2023;24:2885. doi:10.3390/ijms24032885
- Sharafi G, He H, Nikfarjam M. Potential use of cannabinoids for the treatment of pancreatic cancer. J Pancreat Cancer. 2019;5:1-7. doi:10.1089/pancan.2018.0019
- Kosgodage US, Uysal-Onganer P, MacLatchy A, et al. Cannabidiol affects extracellular vesicle release, miR21 and miR126, and reduces prohibitin protein in glioblastoma multiforme cells. Transl Oncol. 2019;12:513-522. doi:10.1016/j.tranon.2018.12.004
- Elbaz M, Nasser MW, Ravi J, et al. Modulation of the tumor microenvironment and inhibition of EGF/EGFR pathway: novel anti-tumor mechanisms of cannabidiol in breast cancer. Mol Oncol. 2015;9:906-919. doi:10.1016/j.molonc.2014.12.010
- Xiong X, Chen S, Shen J, et al. Cannabis suppresses anti-tumor immunity by inhibiting JAK/STAT signaling in T cells through CNR2. Signal Transduct Target Ther. 2022;7:99. doi:10.1038/s41392-022-00918-y
- Bar-Sela G, Cohen I, Campisi-Pinto S, et al. Cannabis consumption used by cancer patients during immunotherapy correlates with poor clinical outcome. Cancers (Basel). 2020;12:2447. doi:10.3390/cancers12092447
- Waissengrin B, Leshem Y, Taya M, et al. The use of medical cannabis concomitantly with immune checkpoint inhibitors in non-small cell lung cancer: a sigh of relief? Eur J Cancer. 2023;180:52-61. doi:10.1016/j.ejca.2022.11.022
- Sarsembayeva A, Schicho R. Cannabinoids and the endocannabinoid system in immunotherapy: helpful or harmful? Front Oncol. 2023;13:1296906. doi:10.3389/fonc.2023.1296906
- Kisková T, Mungenast F, Suváková M, Jäger W, Thalhammer T. Future aspects for cannabinoids in breast cancer therapy. Int J Mol Sci. 2019;20:1673. doi:10.3390/ijms20071673
- Woerdenbag HJ, Olinga P, Kok EA, et al. Potential, limitations and risks of cannabis-derived products in cancer treatment. Cancers (Basel). 2023;15:2119. doi:10.3390/cancers15072119
- Almeida CF, Teixeira N, Valente MJ, Vinggaard AM, Correia-da-Silva G, Amaral C. Cannabidiol as a promising adjuvant therapy for estrogen receptor-positive breast tumors: unveiling its benefits with aromatase inhibitors. Cancers (Basel). 2023;15:2517. doi:10.3390/cancers15092517
- Dobovišek L, Novak M, Krstanovic F, Borštnar S, Turnšek TL, Debeljak N. Effect of combining CBD with standard breast cancer therapeutics. Adv Cancer Biol Metastasis. 2022;4:100038. doi:10.1016/j.adcanc.2022.100038
- Strong T, Rauvolfova J, Jackson E, Pham LV, Bryant J. Synergistic effect of cannabidiol with conventional chemotherapy treatment. Blood. 2018;132:5382. doi:10.1182/blood-2018-99-116749
- Maggi F, Morelli MB, Tomassoni D, et al. The effects of cannabidiol via TRPV2 channel in chronic myeloid leukemia cells and its combination with imatinib. Cancer Sci. 2022;113:1235-1249. doi:10.1111/cas.15257
- Obad N, Janji B, Prestegarden L, et al. ATPS-59 improving efficacy of bevacizumab treatment in glioblastoma by targeting hif1 alpha. Neuro Oncol. 2015;17:v31. doi:10.1093/neuonc/nov204.59
Cannabis Use by Veterans and Potential Interactions With Antineoplastic Agents: Analysis and Literature Review
Cannabis Use by Veterans and Potential Interactions With Antineoplastic Agents: Analysis and Literature Review
Early Outcomes of Stereotactic Body Radiotherapy for Localized Prostate Cancer: A Retrospective Analysis
Early Outcomes of Stereotactic Body Radiotherapy for Localized Prostate Cancer: A Retrospective Analysis
Prostate cancer is the most common cancer in US males, with an estimated 313,780 new cases and 35,770 deaths in 2025.1 Several treatment options are available for localized prostate cancer that have similar outcomes, including active surveillance for low-risk cancers, surgery, or radiotherapy.2,3 Conventional fractionation radiotherapy (CFRT) with 40 to 45 fractions over 8 to 9 weeks has been used for decades. Over the past 2 decades, moderate hypofractionation schedules with 2.4 to 3.4 Gy per fraction over 20 to 28 fractions have become standard, as many noninferiority randomized clinical trials (RCTs) such as CHHiP (UK),4 PROFIT (Canada and Europe),5 NRG Oncology RTOG 0415 (US),6 HYPRO (Netherlands),7,8 and HYPO-RT-PC (Sweden and Denmark),9 have shown the noninferiority of moderately hypofractionated radiotherapy compared with CFRT. Notably, most of these noninferiority studies primarily included patients with low- or intermediate-risk prostate cancer, except for the HYPO-RT-PC trial,9 which also included patients with intermediate- and high-risk prostate cancer.
These noninferiority studies, along with technological advances in radiotherapy, such as intensity-modulated radiotherapy (IMRT), volumetric modulated arc therapy (VMAT), and image-guided radiotherapy (IGRT), paved the path to ultrahypofractionated stereotactic body radiotherapy (SBRT) that is delivered in 5 fractions of ≥ 6 Gy. This high dose per fraction may have a radiobiologic advantage over conventional fractionation. The relatively low a/ß ratio of prostate cancer, estimated to be between 1 and 2, suggests that tumor cells may be particularly sensitive to the high doses per fraction delivered in SBRT.10-13 Compared with CFRT, SBRT-induced tumor cell death may also be mediated through different pathways; this pathway appears to be generated in a dose-dependent manner, particularly with doses > 8 Gy per fraction.14,15 Additionally, the higher a/ß ratio for the surrounding organs at risk, such as the bladder and rectum, theoretically allows for an improved therapeutic ratio window that maximizes tumor control while minimizing damage to healthy tissues.
A substantial body of evidence from prospective studies and meta-analyses supports the use of SBRT for localized prostate cancer. HYPO-RT-PC, a significant phase 3 noninferiority study, enrolled 1200 patients with intermediate (89%) and high-risk (11%) prostate cancer randomized between 2 arms, including CFRT to 78 Gy in 39 fractions and SBRT to 42.7 Gy in 7 fractions, treated 3 days weekly. After a median follow-up of 60 months, the estimated 5-year biochemical relapse-free survival rate was 84% in both groups.9 This trial was notable because it was the first randomized study to demonstrate that SBRT was noninferior to CFRT in intermediate- and high-risk prostate cancer patients. Another pivotal phase 3 trial, the PACE-B study, enrolled 874 patients to compare SBRT (36.25 Gy to the prostate gland, with a secondary dose of 40 Gy to the gross tumor volume where applicable, in 5 fractions) with CFRT (78 Gy in 39 fractions) and moderately hypofractionated radiotherapy (HFRT) (62 Gy in 20 fractions) in patients with low- or intermediate-risk prostate cancer. With a 74-month median follow-up, the study reported 5-year biochemical free rates of 94.6% for CFRT and 95.8% for SBRT, confirming the noninferiority of SBRT to CFRT.15
SBRT offers short, effective, and convenient treatment to many patients with localized prostate cancer. While previous guidelines were more restrictive, the March 2026 National Comprehensive Cancer Network (NCCN) guidelines now list SBRT as a preferred treatment modality for high-risk prostate cancer.16
Given the growing body of evidence supporting the efficacy and safety of SBRT, we implemented an SBRT program in 2014 at a tertiary care center for veterans. This retrospective study was undertaken to evaluate the early efficacy and toxicity of SBRT in patients with localized prostate cancer treated at our institution, including patients across all risk stratifications.
METHODS
We identified 242 patients diagnosed with prostate cancer who underwent SBRT treatment between November 2014 and October 2024 at Overland Park Veterans Affairs Radiation Oncology Clinic. For the final analysis, 46 patients with < 2 years of follow-up and 22 patients who died from causes other than prostate cancer were excluded, resulting in a cohort of 174 patients with ≥ 24-month follow-up.
Treatment
Patients eligible for staging underwent imaging according to NCCN guidelines, including computed tomography (CT) of the abdomen and pelvis, bone scintigraphy, or, in recent years, prostate-specific membrane antigen positron emission tomography, primarily used for unfavorable intermediate-risk (UIR) and high-risk (HR) cancers. Patients with a negative staging work-up for nodal or skeletal disease were included. Prior to planning the CT simulation, patients were given bowel preparation instructions, including a low-fiber and low-gas-producing diet, simethicone, and enemas, the night before and morning of the simulation. Patients were instructed to arrive with a comfortably full bladder, having not voided for 2 to 3 hours prior to the procedure. At Kansas City Veterans Affairs Medical Center (KCVAMC), SBRT treatment was generally restricted to patients with a baseline American Urological Association symptom score of 15 to 20 out of 35 and a prostate gland size < 80 mL to minimize the risk of acute urinary toxicity. We did not use intraprostatic fiducials, hydrogel rectal spacers, or intravenous contrast agents for planning CT simulation.
Patients were placed in a supine position, and a vacuum bag was used for immobilization. Following the CT simulation, the images were transferred to the Eclipse treatment planning system. The clinical target volume (CTV) encompassed the prostate and the proximal 1.0 cm of the seminal vesicles for Gleason score (GS) 1 to 2, and the entire seminal vesicle was included for GS 3 to 5, which is consistent with KCVAMC practice and established safety protocols. The planning target volume (PTV) was created by uniformly expanding the CTV by 5 to 7 mm, except for the posterior margin, which was limited to 3 to 5 mm. When elective nodal radiotherapy was planned for HR prostate cancer, the pelvic field for CT simulation started at the L-2 upper border, with the lower border extending to the lesser trochanter. The pelvic nodes were delineated per Radiation Therapy Oncology Group (RTOG) guidelines.17 The CTV nodes (CTVn), including common iliac, external and internal iliac nodes, obturator, and presacral nodes, were created by uniformly expanding the CTVn by 2 to 3 mm. Slice-by-slice corrections were made to avoid bowel overlap in these patients.
The use of androgen deprivation therapy (ADT) for a duration of 6 to 24 months was prescribed for patients with UIR or HR prostate cancer per NCCN guidelines.16 The prescribed dose to the PTV was 36.25 to 40 Gy (40 Gy was mostly used as a boost to the dominant lesion) in 5 fractions, with each fraction ranging from 7.25 to 8 Gy. For elective nodal radiotherapy in patients at HR, the prescribed dose was 25 Gy in 5 fractions. All patients were planned for VMAT, which aims to deliver ≥ 95% of the prescription dose to 95% of the PTV. Once the physician approved the treatment plan and physics quality assessment was completed, treatments commenced on an every-other-day schedule. Patients received the same bowel preparation instructions for each treatment as for the planning CT simulation. Daily treatment accuracy was confirmed via daily 3-dimensional cone-beam CT (CBCT) for IGRT. No fiducials or hydrogel rectal spacers were used.
Follow-up Schedule and Toxicity Assessment
Follow-up assessments were conducted 4 to 6 weeks after radiation therapy and then repeated every 6 months for 2 to 5 years, and annually thereafter. At each follow-up visit, patients were evaluated for genitourinary (GU) and gastrointestinal (GI) toxicity, according to RTOG toxicity criteria. Prostate-specific antigen (PSA) levels were monitored; in patients receiving ADT, testosterone levels were also checked.
Statistical Analysis
Biochemical failure was defined using the Phoenix definition (nadir PSA + 2 ng/mL). Differences between dose cohorts were assessed using the log-rank test for survival outcomes and X2 testing for categorical variables. GU and GI toxicities were summarized as cumulative incidences of RTOG grade ≥ II events. Statistical significance was set at P < .05.
RESULTS
One hundred seventy-four patients were included in the retrospective review. Patients had a median follow-up of 45 months (range, 24-111) (Figure). The median age at treatment was 74 years (range, 51-88), and the median pretreatment PSA level was 11.9 ng/mL (range, 0.6-69.5). Twenty-six patients (14.9%) had a GS 1, 77 (44.3%) had GS 2, 41 (23.6%) had GS 3, 18 (10.3%) had GS 4, and 12 (6.9%) had GS 5. Fifty-one patients (29.3%) received elective pelvic nodal radiotherapy, and 93 patients (53.4%) received ADT (Table 1).
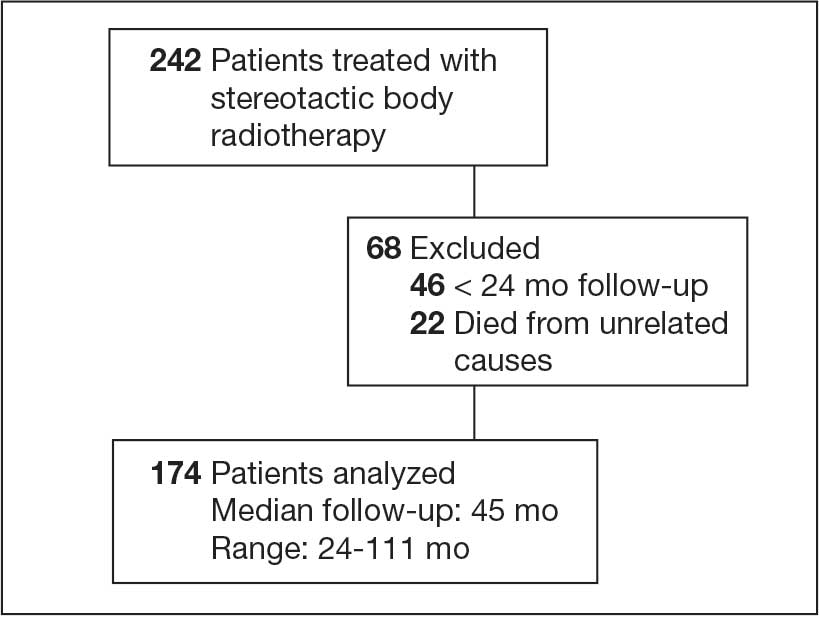
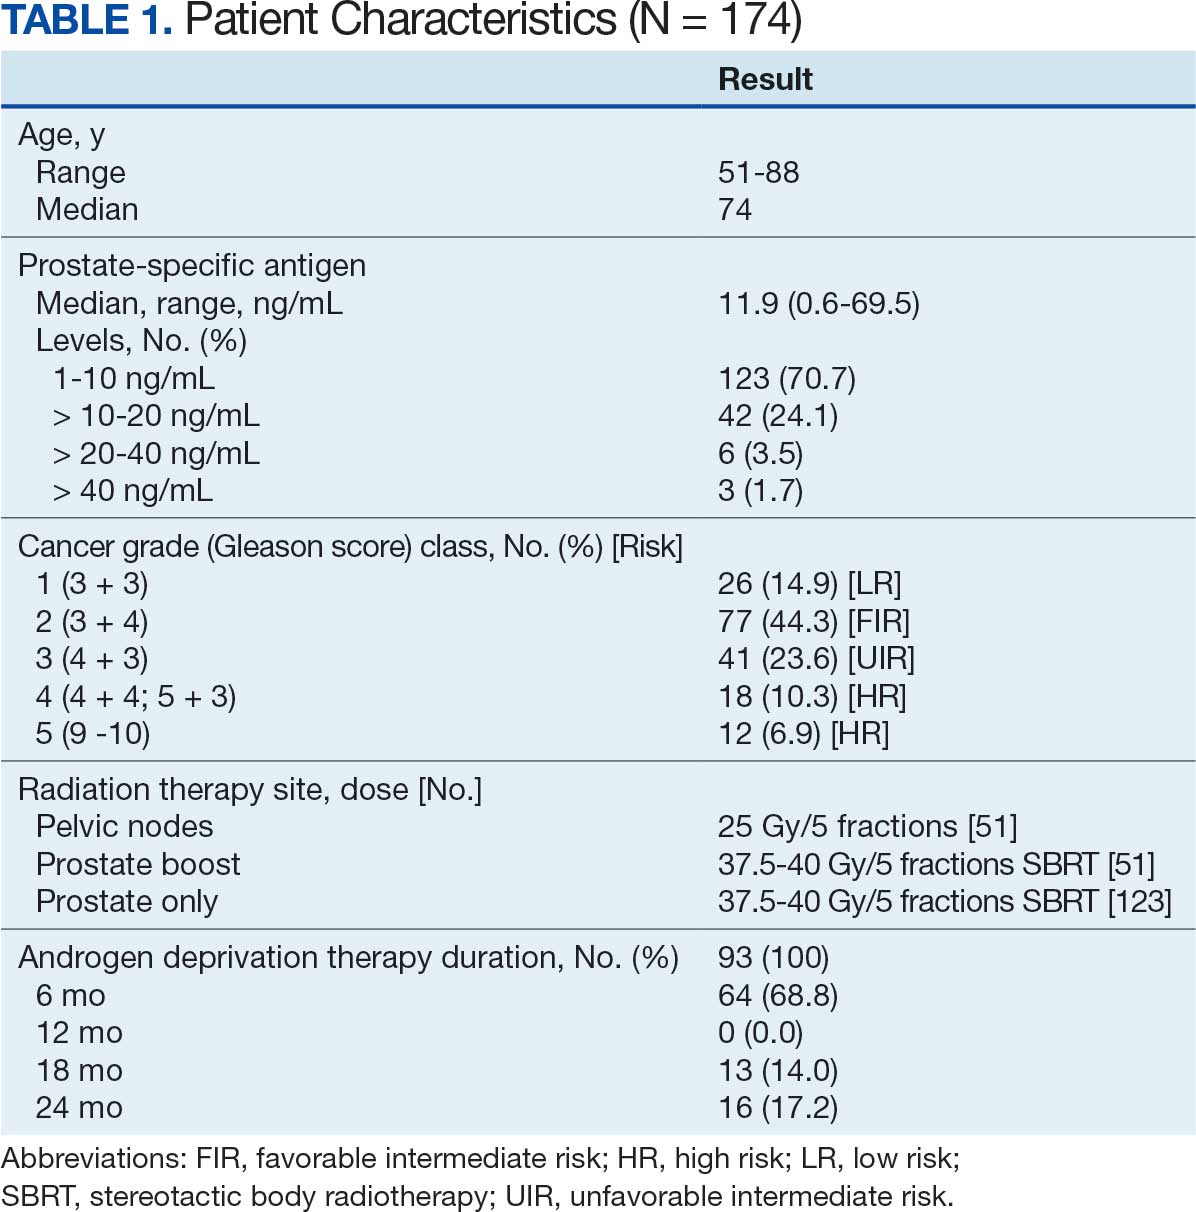
At 24 months follow-up, 6 patients (3.4%) had biochemical failures. One patient died from metastatic prostate cancer, and 5 patients are living with biochemical failure (Table 2). The actuarial 5-year overall survival (OS) rate was 99.4%, and the 5-year disease-free survival (DFS) rate was 96.6%. We performed a subanalysis comparing outcomes of the 36.25 Gy vs 40 Gy SBRT cohorts. There was no statistically significant difference in DFS, OS, or the cumulative incidence of grade II/III toxicity between patients treated with 40 Gy vs 36.25 Gy. Outcomes stratified by NCCN risk groups (low, intermediate, high/very high) are detailed in Table 3. As expected, DFS was slightly lower in the high-risk group, but overall disease control remained high across all stratifications.
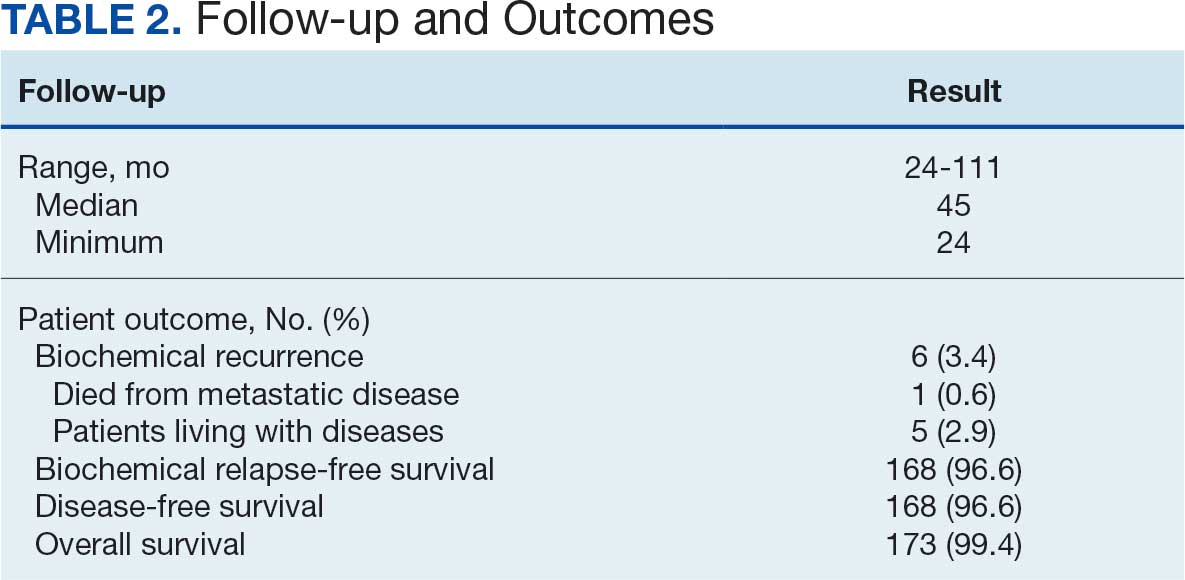
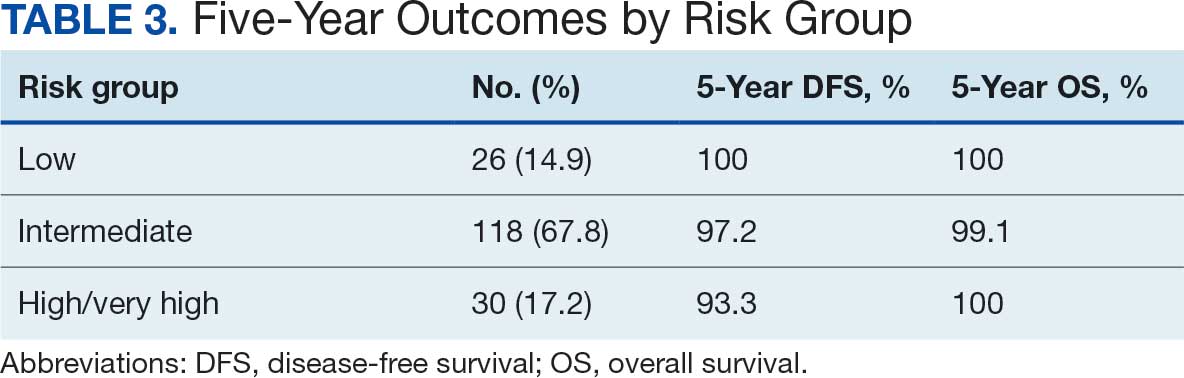
The cumulative incidence of RTOG grade II and higher GU toxicity was 28.2% (Table 4). This included 46 patients (26.4%) with grade II GU toxicity and 2 patients (1.2%) who developed grade III GU complications (1 requiring self-catheterization and another a suprapubic catheter for urinary retention). One patient (0.6%) treated with a 40 Gy dose regimen experienced a grade IV GU complication in the form of a rectovesical fistula necessitating surgical intervention.
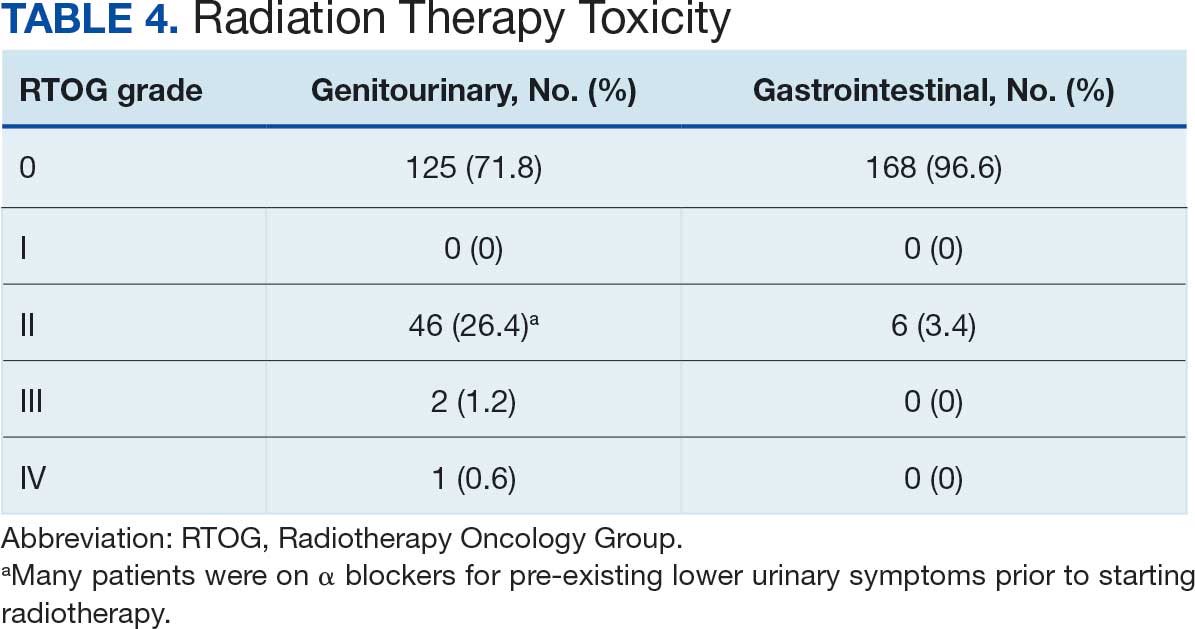
The cumulative incidence of RTOG grade II or higher GI toxicity was 3.4%, and no grade III or IV gastrointestinal toxicities were observed during the follow-up period. Importantly, intraprostatic fiducials, hydrogel rectal spacers, or intravenous contrast were not routinely used in this cohort of patients.
The high rates of actuarial 5-year DFS and OS observed suggest a favorable initial response to the SBRT regimen employed at KCVAMC. However, given the potential for late recurrence in patients with prostate cancer, longer follow-up is essential to determine the durability of these outcomes. The observed GU toxicity rate of 28.2% for grade II and higher events warrants careful consideration and compares with other published data on SBRT for prostate cancer.15 The occurrence of a grade IV rectovesical fistula, although rare, is a notable adverse event that warrants discussion in the context of the treatment approach. The low incidence of grade II or higher GI toxicity is an encouraging finding, particularly given that hydrogel rectal spacers are not routinely used to minimize rectal exposure.
DISCUSSION
The primary objective of this retrospective study was to evaluate the outcomes of SBRT for patients with localized prostate cancer treated at KCVAMC and to compare these results with those reported in the literature. Our findings demonstrate promising intermediate-term efficacy, with an estimated 5-year DFS of 96.6% and OS of 99.4% at a median follow-up of 45 months. Furthermore, the observed toxicity profile appears acceptable, with a cumulative grade II and higher GU toxicity rate of 28.2% and a grade II or higher GI toxicity rate of 3.4%. Notably, these outcomes were achieved without the routine use of intraprostatic fiducials or hydrogel rectal spacers.
Two pivotal randomized phase 3 trials have established the noninferiority of ultrahypofractionated radiotherapy (UHRT) with SBRT over conventional fractionation. The HYPO-RT-PC trial compared SBRT (42.7 Gy in 7 fractions) with conventional fractionation (78 Gy in 39 fractions) in intermediate- and high-risk patients with prostate cancer and reported a 5-year biochemical relapse-free survival of 84% in both arms.9 The PACE-B trial, which included patients at low- and intermediate-risk, compared SBRT (36.25 Gy in 5 fractions) with conventional or moderate HFRT and reported a 5-year biochemical control rate of 95.8% in the SBRT arm and 94.6% in the control arm.15
A comprehensive review and meta-analysis of 7 phase 3 studies involving 6795 patients compared different radiotherapy regimens, namely, UHRT, HFRT, and CFRT, and reported that after 5 years, the DFS rates were 85.1% for CFRT, 86% for HFRT, and 85% for UHRT, with no significant difference in toxicity among the 3 different treatment approaches.18 This suggests that shorter, more intense radiotherapy schedules (UHRT and HFRT) may be as effective and safe as traditional, longer courses of radiation.
There are multiple published nonrandomized prospective trials in which thousands of patients with extreme hypofractionation have been treated with different doses, fractions, and techniques. While heterogeneity and limited long-term follow-up in the existing evidence are acknowledged, these data suggest that prostate SBRT provides appropriate biochemical control with few high-grade toxicities, supporting its ongoing global use and justifying further prospective investigations. Comparative data are shown in Table 5. Several ongoing studies are evaluating noninferiority, superiority, and cost-effectiveness using different methodologies (Table 6).9,15,19-24
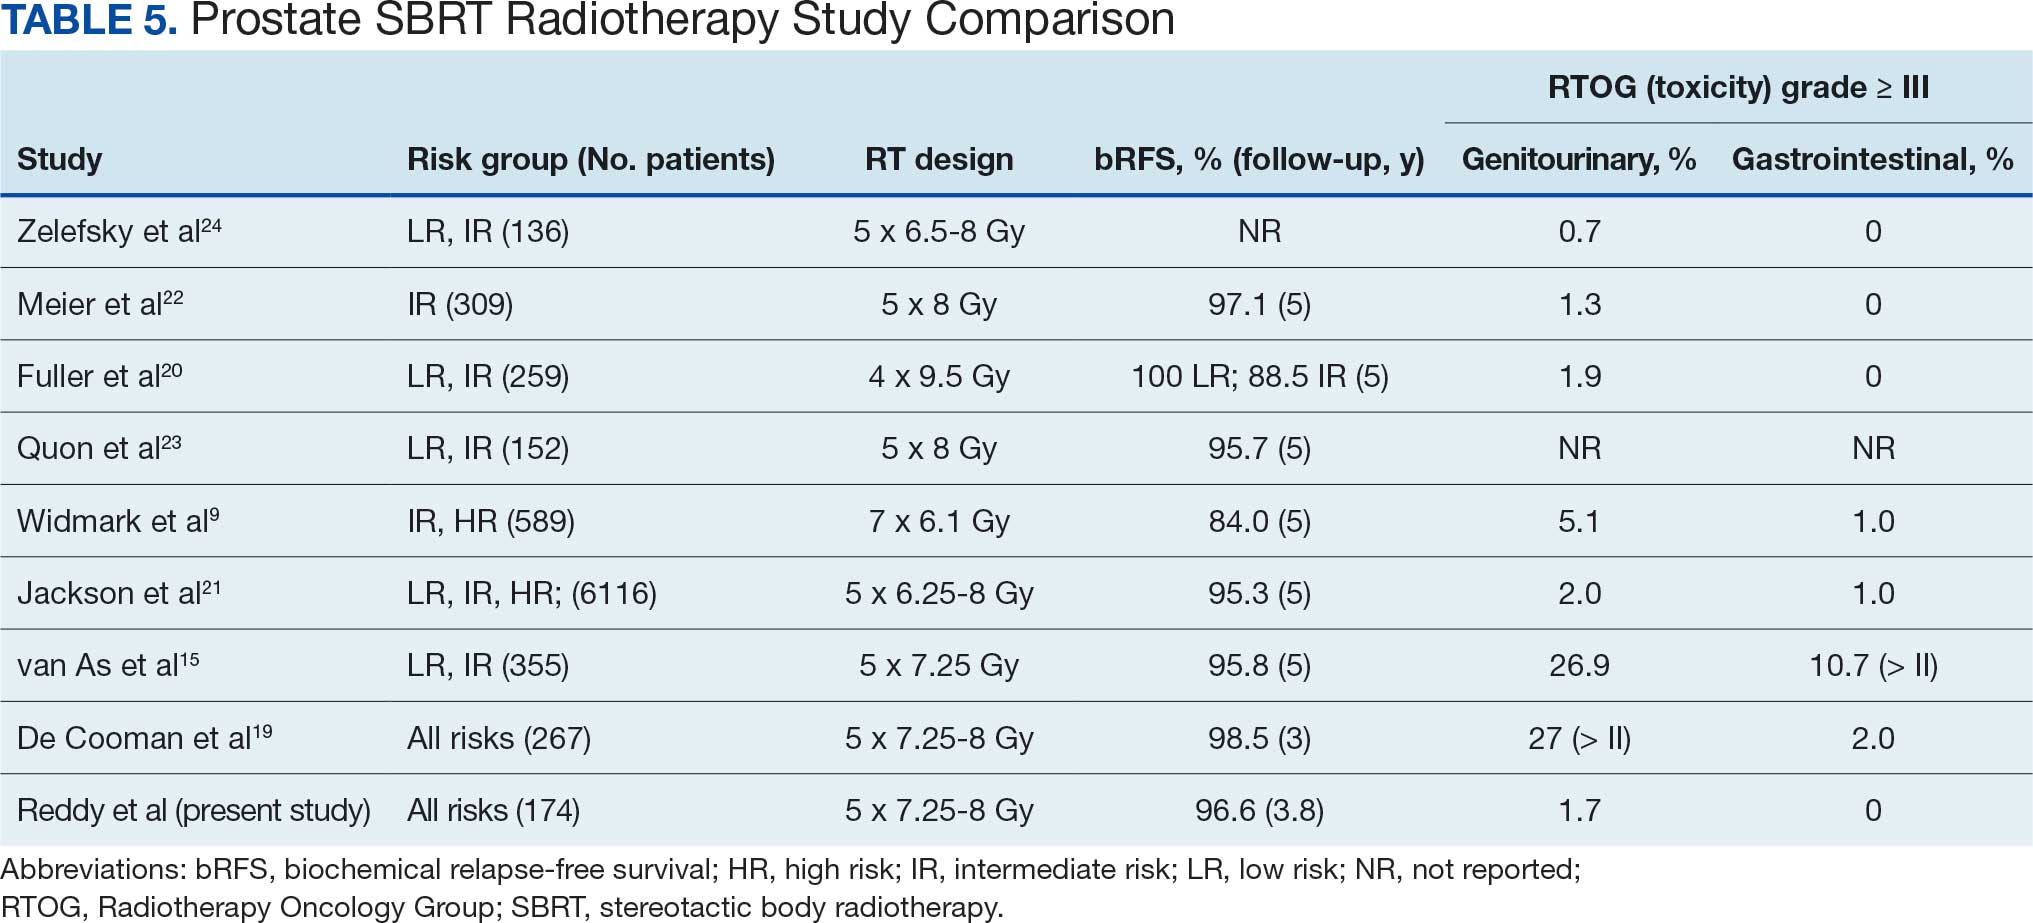
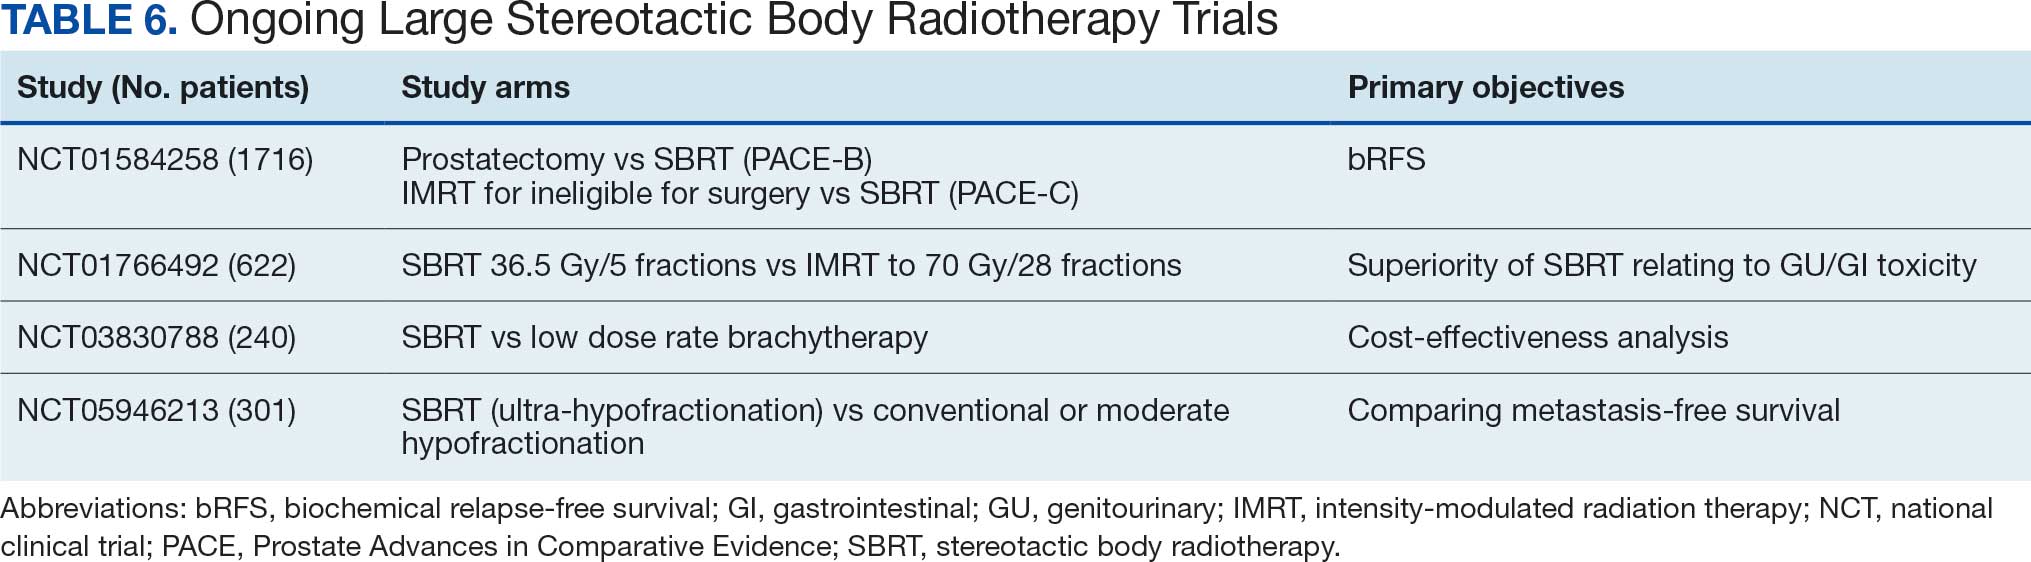
This study’s efficacy outcomes, particularly the high DFS rate, are consistent with the findings from these landmark trials, suggesting that the SBRT regimen used at KCVAMC is effective in achieving early disease control despite 17.2% of patients having high-risk disease. The GU toxicity observed in this study, with a 28.2% rate of grade II or higher events, is also comparable with the 26.9% reported in the 5-fraction SBRT arm of the PACE-B trial, which had a longer median follow-up of 74 months.15 It is important to note that a portion of these grade II events occurred in patients who were already on a blockers for pre-existing lower urinary tract symptoms before starting radiotherapy, which may inflate the observed cumulative acute toxicity score.
A critical comparison is how SBRT toxicity aligns with moderate hypofractionation (eg, 60 Gy in 20 fractions or 70 Gy in 28 fractions as reported by others).4,6 Our observed grade III and higher GU toxicity rate (1.7%) and grade III and higher GI toxicity rate (0%) are highly favorable when compared with historical moderate hypofractionation data, which typically report grade III GU toxicity in the range of 2% to 3% and grade III GI toxicity around 1% to 2%. This suggests that despite the higher dose per fraction, SBRT does not necessarily lead to increased severe acute toxicity, potentially offering a superior therapeutic ratio for GI and GU sparing.
However, the occurrence of a grade IV rectovesical fistula in 1 patient (0.6%)—who received the 40 Gy dose—was a serious complication that warrants careful consideration. This rare, but severe, complication in the higher dose cohort underscores the potential for increased organ-at-risk toxicity, particularly in the absence of a hydrogel rectal spacer, which is designed to mitigate high-dose rectal exposure. While the overall rate of significant GU toxicity remains low, this event highlights the potential risks associated with SBRT. Hydrogel rectal spacers are designed to increase the distance between the prostate and the rectum, which can reduce the rectal radiation dose and potentially mitigate the risk of such fistulas. The low rate of grade II or worse GI toxicity (3.4%) in our study is noteworthy, especially considering that hydrogel spacers were not routinely used. This finding aligns with the 2.5% GI toxicity rate reported in the SBRT arm of the PACE-B trial, suggesting that careful treatment planning and delivery techniques, such as VMAT-IMRT and daily CBCT for IGRT, may contribute to minimizing GI toxicity even without the use of rectal spacers.15 The exclusive use of 3-dimensional CBCT for IGRT in our study, without the use of fiducial markers, suggests that accurate target localization can be achieved with this approach, contributing to the observed efficacy and reduced toxicity.
Strengths and Limitations
This study’s retrospective, single-center design may have introduced selection bias. The median follow-up of 45 months, while substantial, is still relatively short for assessing very late toxicities and long-term oncologic outcomes in prostate cancer, which is known for late recurrences. Additionally, the lack of a direct comparison group within KCVAMC limits the ability to definitively attribute the observed outcomes solely to SBRT treatment. However, the strengths of this study include the inclusion of a consecutive series of veteran patients with localized prostate cancer across all risk categories, providing a real-world perspective on SBRT outcomes in a diverse patient population. Furthermore, the detailed assessment of efficacy and toxicity via standardized RTOG criteria enhances the comparability of our findings with those of other published prospective studies, despite the retrospective nature of the data.
CONCLUSIONS
This single-institution retrospective analysis revealed that short-term SBRT (36.25 to 40 Gy in 5 fractions), with a minimum follow-up of 24 months and a median follow-up of 45 months, for localized prostate cancer, including patients at HR, is associated with promising early efficacy and acceptable toxicity, even in the absence of routine fiducial or hydrogel spacer use. The favorable actuarial 5-year DFS and OS rates, coupled with a manageable toxicity profile, suggest that SBRT is a safe and convenient treatment option for many patients with localized prostate cancer. However, a longer follow-up is necessary to confirm these findings and fully characterize the long-term efficacy and toxicity of this SBRT regimen. Nevertheless, the results contribute to the growing body of evidence suggesting that SBRT is a safe and convenient treatment option for many patients with localized prostate cancer.
- Siegel RL, Kratzer TB, Giaquinto AN, et al. Cancer statistics, 2025. CA Cancer J Clin. 2025;75:10-45. doi:10.3322/caac.21871
- Donovan JL, Hamdy FC, Lane JA, et al. Patient-reported outcomes after monitoring, surgery, or radiotherapy for prostate cancer. N Engl J Med. 2016;375:1425-1437. doi:10.1056/NEJMoa1606221
- Hamdy FC, Donovan JL, Lane JA, et al. 10-year outcomes after monitoring, surgery, or radiotherapy for localized prostate cancer. N Engl J Med. 2016;375:1415-1424. doi:10.1056/NEJMoa1606220
- Dearnaley D, Syndikus I, Mossop H, et al. Conventional versus hypofractionated high-dose intensity-modulated radiotherapy for prostate cancer: 5-year outcomes of the randomised, non-inferiority, phase 3 CHHiP trial. Lancet Oncol. 2016;17:1047-1060. doi:10.1016/S1470-2045(16)30102-4
- Catton CN, Lukka H, Gu CS, et al. Randomized trial of a hypofractionated radiation regimen for the treatment of localized prostate cancer. J Clin Oncol. 2017;35:1884-1890. doi:10.1200/JCO.2016.71.7397
- Lee WR, Dignam JJ, Amin MB, et al. Long-term analysis of NRG Oncology RTOG 0415: a randomized phase III noninferiority study comparing two fractionation schedules in patients with low-risk prostate cancer. J Clin Oncol. 2024;42:2377-2381. doi:10.1200/JCO.23.02445
- de Vries KC, Wortel RC, Oomen-de Hoop E, et al. Hypofractionated versus conventionally fractionated radiation therapy for patients with intermediate- or high-risk, localized, prostate cancer: 7-year outcomes from the randomized, multicenter, open-label, phase 3 HYPRO trial. Int J Radiat Oncol Biol Phys. 2020;106:108-115. doi:10.1016/j.ijrobp.2019.09.007
- Incrocci L, Wortel RC, Alemayehu WG, et al. Hypofractionated versus conventionally fractionated radiotherapy for patients with localised prostate cancer (HYPRO): final efficacy results from a randomised, multicentre, open-label, phase 3 trial. Lancet Oncol. 2016;17:1061-1069. doi:10.1016/S1470-2045(16)30070-5
- Widmark A, Gunnlaugsson A, Beckman L, et al. Ultra-hypofractionated versus conventionally fractionated radiotherapy for prostate cancer: 5-year outcomes of the HYPO-RT-PC randomised, non-inferiority, phase 3 trial. Lancet. 2019;394:385-395. doi:10.1016/S0140-6736(19)31131-6
- Brenner DJ, Hall EJ. Fractionation and protraction for radiotherapy of prostate carcinoma. Int J Radiat Oncol Biol Phys. 1999;43:1095-101. doi:10.1016/s0360-3016(98)00438-6
- Dasu A. Is the alpha/beta value for prostate tumours low enough to be safely used in clinical trials? Clin Oncol (R Coll Radiol). 2007;19:289-301. doi:10.1016/j.clon.2007.02.007
- Garcia-Barros M, Paris F, Cordon-Cardo C, et al. Tumor response to radiotherapy regulated by endothelial cell apoptosis. Science. 2003;300:1155-1159. doi:10.1126/science.1082504
- Gulliford S, Hall E, Dearnaley D. Hypofractionation trials and radiobiology of prostate cancer. Oncoscience. 2017;4:27-28. doi:10.18632/oncoscience.347
- Fuks Z, Kolesnick R. Engaging the vascular component of the tumor response. Cancer Cell. 2005;8:89-91. doi:10.1016/j.ccr.2005.07.014
- van As N, Griffin C, Tree A, et al. Phase 3 Trial of stereotactic body radiotherapy in localized prostate cancer. N Engl J Med. Oct 17 2024;391:1413-1425. doi:10.1056/NEJMoa2403365
- National Comprehensive Cancer Network. NCCN Guidelines Version 5. 2026 Prostate Cancer. Accessed March 24, 2026. https://www.nccn.org/professionals/physician_gls/pdf/prostate.pdf
- Lawton CA, Michalski J, El-Naqa I, et al. RTOG GU radiation oncology specialists reach consensus on pelvic lymph node volumes for high-risk prostate cancer. Int J Radiat Oncol Biol Phys. 2009;74:383-387. doi:10.1016/j.ijrobp.2008.08.002
- Lehrer EJ, Kishan AU, Yu JB, et al. Ultrahypofractionated versus hypofractionated and conventionally fractionated radiation therapy for localized prostate cancer: a systematic review and meta-analysis of phase III randomized trials. Radiother Oncol. 2020;148:235-242. doi:10.1016/j.radonc.2020.04.037
- De Cooman B, Debacker T, Adams T, et al. Stereotactic body radiotherapy (SBRT) as a treatment for localized prostate cancer: a retrospective analysis. Radiat Oncol. 2025;20:25. doi:10.1186/s13014-025-02598-8
- Fuller DB, Falchook AD, Crabtree T, et al. Phase 2 multicenter trial of heterogeneous-dosing stereotactic body radiotherapy for low- and intermediate-risk prostate cancer: 5-year outcomes. Eur Urol Oncol. 2018;1:540-547. doi:10.1016/j.euo.2018.06.013
- Jackson WC, Silva J, Hartman HE, et al. Stereotactic body radiation therapy for localized prostate cancer: a systematic review and meta-analysis of over 6,000 patients treated on prospective studies. Int J Radiat Oncol Biol Phys. 2019;104:778-789. doi:10.1016/j.ijrobp.2019.03.051
- Meier RM, Bloch DA, Cotrutz C, et al. Multicenter trial of stereotactic body radiation therapy for low- and intermediate-risk prostate cancer: survival and toxicity endpoints. nt J Radiat Oncol Biol Phys. 2018;102:296-303. doi:10.1016/j.ijrobp.2018.05.040
- Quon HC, Ong A, Cheung P, et al. Once-weekly versus every-other-day stereotactic body radiotherapy in patients with prostate cancer (PATRIOT): a phase 2 randomized trial. Radiother Oncol. 2018;127:206-212. doi:10.1016/j.radonc.2018.02.029
- Zelefsky MJ, Kollmeier M, McBride S, et al. Five-year outcomes of a phase 1 dose-escalation study using stereotactic body radiosurgery for patients with low-risk and intermediate-risk prostate cancer. Int J Radiat Oncol Biol Phys. 2019;104:42-49. doi:10.1016/j.ijrobp.2018.12.045
Prostate cancer is the most common cancer in US males, with an estimated 313,780 new cases and 35,770 deaths in 2025.1 Several treatment options are available for localized prostate cancer that have similar outcomes, including active surveillance for low-risk cancers, surgery, or radiotherapy.2,3 Conventional fractionation radiotherapy (CFRT) with 40 to 45 fractions over 8 to 9 weeks has been used for decades. Over the past 2 decades, moderate hypofractionation schedules with 2.4 to 3.4 Gy per fraction over 20 to 28 fractions have become standard, as many noninferiority randomized clinical trials (RCTs) such as CHHiP (UK),4 PROFIT (Canada and Europe),5 NRG Oncology RTOG 0415 (US),6 HYPRO (Netherlands),7,8 and HYPO-RT-PC (Sweden and Denmark),9 have shown the noninferiority of moderately hypofractionated radiotherapy compared with CFRT. Notably, most of these noninferiority studies primarily included patients with low- or intermediate-risk prostate cancer, except for the HYPO-RT-PC trial,9 which also included patients with intermediate- and high-risk prostate cancer.
These noninferiority studies, along with technological advances in radiotherapy, such as intensity-modulated radiotherapy (IMRT), volumetric modulated arc therapy (VMAT), and image-guided radiotherapy (IGRT), paved the path to ultrahypofractionated stereotactic body radiotherapy (SBRT) that is delivered in 5 fractions of ≥ 6 Gy. This high dose per fraction may have a radiobiologic advantage over conventional fractionation. The relatively low a/ß ratio of prostate cancer, estimated to be between 1 and 2, suggests that tumor cells may be particularly sensitive to the high doses per fraction delivered in SBRT.10-13 Compared with CFRT, SBRT-induced tumor cell death may also be mediated through different pathways; this pathway appears to be generated in a dose-dependent manner, particularly with doses > 8 Gy per fraction.14,15 Additionally, the higher a/ß ratio for the surrounding organs at risk, such as the bladder and rectum, theoretically allows for an improved therapeutic ratio window that maximizes tumor control while minimizing damage to healthy tissues.
A substantial body of evidence from prospective studies and meta-analyses supports the use of SBRT for localized prostate cancer. HYPO-RT-PC, a significant phase 3 noninferiority study, enrolled 1200 patients with intermediate (89%) and high-risk (11%) prostate cancer randomized between 2 arms, including CFRT to 78 Gy in 39 fractions and SBRT to 42.7 Gy in 7 fractions, treated 3 days weekly. After a median follow-up of 60 months, the estimated 5-year biochemical relapse-free survival rate was 84% in both groups.9 This trial was notable because it was the first randomized study to demonstrate that SBRT was noninferior to CFRT in intermediate- and high-risk prostate cancer patients. Another pivotal phase 3 trial, the PACE-B study, enrolled 874 patients to compare SBRT (36.25 Gy to the prostate gland, with a secondary dose of 40 Gy to the gross tumor volume where applicable, in 5 fractions) with CFRT (78 Gy in 39 fractions) and moderately hypofractionated radiotherapy (HFRT) (62 Gy in 20 fractions) in patients with low- or intermediate-risk prostate cancer. With a 74-month median follow-up, the study reported 5-year biochemical free rates of 94.6% for CFRT and 95.8% for SBRT, confirming the noninferiority of SBRT to CFRT.15
SBRT offers short, effective, and convenient treatment to many patients with localized prostate cancer. While previous guidelines were more restrictive, the March 2026 National Comprehensive Cancer Network (NCCN) guidelines now list SBRT as a preferred treatment modality for high-risk prostate cancer.16
Given the growing body of evidence supporting the efficacy and safety of SBRT, we implemented an SBRT program in 2014 at a tertiary care center for veterans. This retrospective study was undertaken to evaluate the early efficacy and toxicity of SBRT in patients with localized prostate cancer treated at our institution, including patients across all risk stratifications.
METHODS
We identified 242 patients diagnosed with prostate cancer who underwent SBRT treatment between November 2014 and October 2024 at Overland Park Veterans Affairs Radiation Oncology Clinic. For the final analysis, 46 patients with < 2 years of follow-up and 22 patients who died from causes other than prostate cancer were excluded, resulting in a cohort of 174 patients with ≥ 24-month follow-up.
Treatment
Patients eligible for staging underwent imaging according to NCCN guidelines, including computed tomography (CT) of the abdomen and pelvis, bone scintigraphy, or, in recent years, prostate-specific membrane antigen positron emission tomography, primarily used for unfavorable intermediate-risk (UIR) and high-risk (HR) cancers. Patients with a negative staging work-up for nodal or skeletal disease were included. Prior to planning the CT simulation, patients were given bowel preparation instructions, including a low-fiber and low-gas-producing diet, simethicone, and enemas, the night before and morning of the simulation. Patients were instructed to arrive with a comfortably full bladder, having not voided for 2 to 3 hours prior to the procedure. At Kansas City Veterans Affairs Medical Center (KCVAMC), SBRT treatment was generally restricted to patients with a baseline American Urological Association symptom score of 15 to 20 out of 35 and a prostate gland size < 80 mL to minimize the risk of acute urinary toxicity. We did not use intraprostatic fiducials, hydrogel rectal spacers, or intravenous contrast agents for planning CT simulation.
Patients were placed in a supine position, and a vacuum bag was used for immobilization. Following the CT simulation, the images were transferred to the Eclipse treatment planning system. The clinical target volume (CTV) encompassed the prostate and the proximal 1.0 cm of the seminal vesicles for Gleason score (GS) 1 to 2, and the entire seminal vesicle was included for GS 3 to 5, which is consistent with KCVAMC practice and established safety protocols. The planning target volume (PTV) was created by uniformly expanding the CTV by 5 to 7 mm, except for the posterior margin, which was limited to 3 to 5 mm. When elective nodal radiotherapy was planned for HR prostate cancer, the pelvic field for CT simulation started at the L-2 upper border, with the lower border extending to the lesser trochanter. The pelvic nodes were delineated per Radiation Therapy Oncology Group (RTOG) guidelines.17 The CTV nodes (CTVn), including common iliac, external and internal iliac nodes, obturator, and presacral nodes, were created by uniformly expanding the CTVn by 2 to 3 mm. Slice-by-slice corrections were made to avoid bowel overlap in these patients.
The use of androgen deprivation therapy (ADT) for a duration of 6 to 24 months was prescribed for patients with UIR or HR prostate cancer per NCCN guidelines.16 The prescribed dose to the PTV was 36.25 to 40 Gy (40 Gy was mostly used as a boost to the dominant lesion) in 5 fractions, with each fraction ranging from 7.25 to 8 Gy. For elective nodal radiotherapy in patients at HR, the prescribed dose was 25 Gy in 5 fractions. All patients were planned for VMAT, which aims to deliver ≥ 95% of the prescription dose to 95% of the PTV. Once the physician approved the treatment plan and physics quality assessment was completed, treatments commenced on an every-other-day schedule. Patients received the same bowel preparation instructions for each treatment as for the planning CT simulation. Daily treatment accuracy was confirmed via daily 3-dimensional cone-beam CT (CBCT) for IGRT. No fiducials or hydrogel rectal spacers were used.
Follow-up Schedule and Toxicity Assessment
Follow-up assessments were conducted 4 to 6 weeks after radiation therapy and then repeated every 6 months for 2 to 5 years, and annually thereafter. At each follow-up visit, patients were evaluated for genitourinary (GU) and gastrointestinal (GI) toxicity, according to RTOG toxicity criteria. Prostate-specific antigen (PSA) levels were monitored; in patients receiving ADT, testosterone levels were also checked.
Statistical Analysis
Biochemical failure was defined using the Phoenix definition (nadir PSA + 2 ng/mL). Differences between dose cohorts were assessed using the log-rank test for survival outcomes and X2 testing for categorical variables. GU and GI toxicities were summarized as cumulative incidences of RTOG grade ≥ II events. Statistical significance was set at P < .05.
RESULTS
One hundred seventy-four patients were included in the retrospective review. Patients had a median follow-up of 45 months (range, 24-111) (Figure). The median age at treatment was 74 years (range, 51-88), and the median pretreatment PSA level was 11.9 ng/mL (range, 0.6-69.5). Twenty-six patients (14.9%) had a GS 1, 77 (44.3%) had GS 2, 41 (23.6%) had GS 3, 18 (10.3%) had GS 4, and 12 (6.9%) had GS 5. Fifty-one patients (29.3%) received elective pelvic nodal radiotherapy, and 93 patients (53.4%) received ADT (Table 1).
At 24 months follow-up, 6 patients (3.4%) had biochemical failures. One patient died from metastatic prostate cancer, and 5 patients are living with biochemical failure (Table 2). The actuarial 5-year overall survival (OS) rate was 99.4%, and the 5-year disease-free survival (DFS) rate was 96.6%. We performed a subanalysis comparing outcomes of the 36.25 Gy vs 40 Gy SBRT cohorts. There was no statistically significant difference in DFS, OS, or the cumulative incidence of grade II/III toxicity between patients treated with 40 Gy vs 36.25 Gy. Outcomes stratified by NCCN risk groups (low, intermediate, high/very high) are detailed in Table 3. As expected, DFS was slightly lower in the high-risk group, but overall disease control remained high across all stratifications.
The cumulative incidence of RTOG grade II and higher GU toxicity was 28.2% (Table 4). This included 46 patients (26.4%) with grade II GU toxicity and 2 patients (1.2%) who developed grade III GU complications (1 requiring self-catheterization and another a suprapubic catheter for urinary retention). One patient (0.6%) treated with a 40 Gy dose regimen experienced a grade IV GU complication in the form of a rectovesical fistula necessitating surgical intervention.
The cumulative incidence of RTOG grade II or higher GI toxicity was 3.4%, and no grade III or IV gastrointestinal toxicities were observed during the follow-up period. Importantly, intraprostatic fiducials, hydrogel rectal spacers, or intravenous contrast were not routinely used in this cohort of patients.
The high rates of actuarial 5-year DFS and OS observed suggest a favorable initial response to the SBRT regimen employed at KCVAMC. However, given the potential for late recurrence in patients with prostate cancer, longer follow-up is essential to determine the durability of these outcomes. The observed GU toxicity rate of 28.2% for grade II and higher events warrants careful consideration and compares with other published data on SBRT for prostate cancer.15 The occurrence of a grade IV rectovesical fistula, although rare, is a notable adverse event that warrants discussion in the context of the treatment approach. The low incidence of grade II or higher GI toxicity is an encouraging finding, particularly given that hydrogel rectal spacers are not routinely used to minimize rectal exposure.
DISCUSSION
The primary objective of this retrospective study was to evaluate the outcomes of SBRT for patients with localized prostate cancer treated at KCVAMC and to compare these results with those reported in the literature. Our findings demonstrate promising intermediate-term efficacy, with an estimated 5-year DFS of 96.6% and OS of 99.4% at a median follow-up of 45 months. Furthermore, the observed toxicity profile appears acceptable, with a cumulative grade II and higher GU toxicity rate of 28.2% and a grade II or higher GI toxicity rate of 3.4%. Notably, these outcomes were achieved without the routine use of intraprostatic fiducials or hydrogel rectal spacers.
Two pivotal randomized phase 3 trials have established the noninferiority of ultrahypofractionated radiotherapy (UHRT) with SBRT over conventional fractionation. The HYPO-RT-PC trial compared SBRT (42.7 Gy in 7 fractions) with conventional fractionation (78 Gy in 39 fractions) in intermediate- and high-risk patients with prostate cancer and reported a 5-year biochemical relapse-free survival of 84% in both arms.9 The PACE-B trial, which included patients at low- and intermediate-risk, compared SBRT (36.25 Gy in 5 fractions) with conventional or moderate HFRT and reported a 5-year biochemical control rate of 95.8% in the SBRT arm and 94.6% in the control arm.15
A comprehensive review and meta-analysis of 7 phase 3 studies involving 6795 patients compared different radiotherapy regimens, namely, UHRT, HFRT, and CFRT, and reported that after 5 years, the DFS rates were 85.1% for CFRT, 86% for HFRT, and 85% for UHRT, with no significant difference in toxicity among the 3 different treatment approaches.18 This suggests that shorter, more intense radiotherapy schedules (UHRT and HFRT) may be as effective and safe as traditional, longer courses of radiation.
There are multiple published nonrandomized prospective trials in which thousands of patients with extreme hypofractionation have been treated with different doses, fractions, and techniques. While heterogeneity and limited long-term follow-up in the existing evidence are acknowledged, these data suggest that prostate SBRT provides appropriate biochemical control with few high-grade toxicities, supporting its ongoing global use and justifying further prospective investigations. Comparative data are shown in Table 5. Several ongoing studies are evaluating noninferiority, superiority, and cost-effectiveness using different methodologies (Table 6).9,15,19-24
This study’s efficacy outcomes, particularly the high DFS rate, are consistent with the findings from these landmark trials, suggesting that the SBRT regimen used at KCVAMC is effective in achieving early disease control despite 17.2% of patients having high-risk disease. The GU toxicity observed in this study, with a 28.2% rate of grade II or higher events, is also comparable with the 26.9% reported in the 5-fraction SBRT arm of the PACE-B trial, which had a longer median follow-up of 74 months.15 It is important to note that a portion of these grade II events occurred in patients who were already on a blockers for pre-existing lower urinary tract symptoms before starting radiotherapy, which may inflate the observed cumulative acute toxicity score.
A critical comparison is how SBRT toxicity aligns with moderate hypofractionation (eg, 60 Gy in 20 fractions or 70 Gy in 28 fractions as reported by others).4,6 Our observed grade III and higher GU toxicity rate (1.7%) and grade III and higher GI toxicity rate (0%) are highly favorable when compared with historical moderate hypofractionation data, which typically report grade III GU toxicity in the range of 2% to 3% and grade III GI toxicity around 1% to 2%. This suggests that despite the higher dose per fraction, SBRT does not necessarily lead to increased severe acute toxicity, potentially offering a superior therapeutic ratio for GI and GU sparing.
However, the occurrence of a grade IV rectovesical fistula in 1 patient (0.6%)—who received the 40 Gy dose—was a serious complication that warrants careful consideration. This rare, but severe, complication in the higher dose cohort underscores the potential for increased organ-at-risk toxicity, particularly in the absence of a hydrogel rectal spacer, which is designed to mitigate high-dose rectal exposure. While the overall rate of significant GU toxicity remains low, this event highlights the potential risks associated with SBRT. Hydrogel rectal spacers are designed to increase the distance between the prostate and the rectum, which can reduce the rectal radiation dose and potentially mitigate the risk of such fistulas. The low rate of grade II or worse GI toxicity (3.4%) in our study is noteworthy, especially considering that hydrogel spacers were not routinely used. This finding aligns with the 2.5% GI toxicity rate reported in the SBRT arm of the PACE-B trial, suggesting that careful treatment planning and delivery techniques, such as VMAT-IMRT and daily CBCT for IGRT, may contribute to minimizing GI toxicity even without the use of rectal spacers.15 The exclusive use of 3-dimensional CBCT for IGRT in our study, without the use of fiducial markers, suggests that accurate target localization can be achieved with this approach, contributing to the observed efficacy and reduced toxicity.
Strengths and Limitations
This study’s retrospective, single-center design may have introduced selection bias. The median follow-up of 45 months, while substantial, is still relatively short for assessing very late toxicities and long-term oncologic outcomes in prostate cancer, which is known for late recurrences. Additionally, the lack of a direct comparison group within KCVAMC limits the ability to definitively attribute the observed outcomes solely to SBRT treatment. However, the strengths of this study include the inclusion of a consecutive series of veteran patients with localized prostate cancer across all risk categories, providing a real-world perspective on SBRT outcomes in a diverse patient population. Furthermore, the detailed assessment of efficacy and toxicity via standardized RTOG criteria enhances the comparability of our findings with those of other published prospective studies, despite the retrospective nature of the data.
CONCLUSIONS
This single-institution retrospective analysis revealed that short-term SBRT (36.25 to 40 Gy in 5 fractions), with a minimum follow-up of 24 months and a median follow-up of 45 months, for localized prostate cancer, including patients at HR, is associated with promising early efficacy and acceptable toxicity, even in the absence of routine fiducial or hydrogel spacer use. The favorable actuarial 5-year DFS and OS rates, coupled with a manageable toxicity profile, suggest that SBRT is a safe and convenient treatment option for many patients with localized prostate cancer. However, a longer follow-up is necessary to confirm these findings and fully characterize the long-term efficacy and toxicity of this SBRT regimen. Nevertheless, the results contribute to the growing body of evidence suggesting that SBRT is a safe and convenient treatment option for many patients with localized prostate cancer.
- Siegel RL, Kratzer TB, Giaquinto AN, et al. Cancer statistics, 2025. CA Cancer J Clin. 2025;75:10-45. doi:10.3322/caac.21871
- Donovan JL, Hamdy FC, Lane JA, et al. Patient-reported outcomes after monitoring, surgery, or radiotherapy for prostate cancer. N Engl J Med. 2016;375:1425-1437. doi:10.1056/NEJMoa1606221
- Hamdy FC, Donovan JL, Lane JA, et al. 10-year outcomes after monitoring, surgery, or radiotherapy for localized prostate cancer. N Engl J Med. 2016;375:1415-1424. doi:10.1056/NEJMoa1606220
- Dearnaley D, Syndikus I, Mossop H, et al. Conventional versus hypofractionated high-dose intensity-modulated radiotherapy for prostate cancer: 5-year outcomes of the randomised, non-inferiority, phase 3 CHHiP trial. Lancet Oncol. 2016;17:1047-1060. doi:10.1016/S1470-2045(16)30102-4
- Catton CN, Lukka H, Gu CS, et al. Randomized trial of a hypofractionated radiation regimen for the treatment of localized prostate cancer. J Clin Oncol. 2017;35:1884-1890. doi:10.1200/JCO.2016.71.7397
- Lee WR, Dignam JJ, Amin MB, et al. Long-term analysis of NRG Oncology RTOG 0415: a randomized phase III noninferiority study comparing two fractionation schedules in patients with low-risk prostate cancer. J Clin Oncol. 2024;42:2377-2381. doi:10.1200/JCO.23.02445
- de Vries KC, Wortel RC, Oomen-de Hoop E, et al. Hypofractionated versus conventionally fractionated radiation therapy for patients with intermediate- or high-risk, localized, prostate cancer: 7-year outcomes from the randomized, multicenter, open-label, phase 3 HYPRO trial. Int J Radiat Oncol Biol Phys. 2020;106:108-115. doi:10.1016/j.ijrobp.2019.09.007
- Incrocci L, Wortel RC, Alemayehu WG, et al. Hypofractionated versus conventionally fractionated radiotherapy for patients with localised prostate cancer (HYPRO): final efficacy results from a randomised, multicentre, open-label, phase 3 trial. Lancet Oncol. 2016;17:1061-1069. doi:10.1016/S1470-2045(16)30070-5
- Widmark A, Gunnlaugsson A, Beckman L, et al. Ultra-hypofractionated versus conventionally fractionated radiotherapy for prostate cancer: 5-year outcomes of the HYPO-RT-PC randomised, non-inferiority, phase 3 trial. Lancet. 2019;394:385-395. doi:10.1016/S0140-6736(19)31131-6
- Brenner DJ, Hall EJ. Fractionation and protraction for radiotherapy of prostate carcinoma. Int J Radiat Oncol Biol Phys. 1999;43:1095-101. doi:10.1016/s0360-3016(98)00438-6
- Dasu A. Is the alpha/beta value for prostate tumours low enough to be safely used in clinical trials? Clin Oncol (R Coll Radiol). 2007;19:289-301. doi:10.1016/j.clon.2007.02.007
- Garcia-Barros M, Paris F, Cordon-Cardo C, et al. Tumor response to radiotherapy regulated by endothelial cell apoptosis. Science. 2003;300:1155-1159. doi:10.1126/science.1082504
- Gulliford S, Hall E, Dearnaley D. Hypofractionation trials and radiobiology of prostate cancer. Oncoscience. 2017;4:27-28. doi:10.18632/oncoscience.347
- Fuks Z, Kolesnick R. Engaging the vascular component of the tumor response. Cancer Cell. 2005;8:89-91. doi:10.1016/j.ccr.2005.07.014
- van As N, Griffin C, Tree A, et al. Phase 3 Trial of stereotactic body radiotherapy in localized prostate cancer. N Engl J Med. Oct 17 2024;391:1413-1425. doi:10.1056/NEJMoa2403365
- National Comprehensive Cancer Network. NCCN Guidelines Version 5. 2026 Prostate Cancer. Accessed March 24, 2026. https://www.nccn.org/professionals/physician_gls/pdf/prostate.pdf
- Lawton CA, Michalski J, El-Naqa I, et al. RTOG GU radiation oncology specialists reach consensus on pelvic lymph node volumes for high-risk prostate cancer. Int J Radiat Oncol Biol Phys. 2009;74:383-387. doi:10.1016/j.ijrobp.2008.08.002
- Lehrer EJ, Kishan AU, Yu JB, et al. Ultrahypofractionated versus hypofractionated and conventionally fractionated radiation therapy for localized prostate cancer: a systematic review and meta-analysis of phase III randomized trials. Radiother Oncol. 2020;148:235-242. doi:10.1016/j.radonc.2020.04.037
- De Cooman B, Debacker T, Adams T, et al. Stereotactic body radiotherapy (SBRT) as a treatment for localized prostate cancer: a retrospective analysis. Radiat Oncol. 2025;20:25. doi:10.1186/s13014-025-02598-8
- Fuller DB, Falchook AD, Crabtree T, et al. Phase 2 multicenter trial of heterogeneous-dosing stereotactic body radiotherapy for low- and intermediate-risk prostate cancer: 5-year outcomes. Eur Urol Oncol. 2018;1:540-547. doi:10.1016/j.euo.2018.06.013
- Jackson WC, Silva J, Hartman HE, et al. Stereotactic body radiation therapy for localized prostate cancer: a systematic review and meta-analysis of over 6,000 patients treated on prospective studies. Int J Radiat Oncol Biol Phys. 2019;104:778-789. doi:10.1016/j.ijrobp.2019.03.051
- Meier RM, Bloch DA, Cotrutz C, et al. Multicenter trial of stereotactic body radiation therapy for low- and intermediate-risk prostate cancer: survival and toxicity endpoints. nt J Radiat Oncol Biol Phys. 2018;102:296-303. doi:10.1016/j.ijrobp.2018.05.040
- Quon HC, Ong A, Cheung P, et al. Once-weekly versus every-other-day stereotactic body radiotherapy in patients with prostate cancer (PATRIOT): a phase 2 randomized trial. Radiother Oncol. 2018;127:206-212. doi:10.1016/j.radonc.2018.02.029
- Zelefsky MJ, Kollmeier M, McBride S, et al. Five-year outcomes of a phase 1 dose-escalation study using stereotactic body radiosurgery for patients with low-risk and intermediate-risk prostate cancer. Int J Radiat Oncol Biol Phys. 2019;104:42-49. doi:10.1016/j.ijrobp.2018.12.045
Early Outcomes of Stereotactic Body Radiotherapy for Localized Prostate Cancer: A Retrospective Analysis
Early Outcomes of Stereotactic Body Radiotherapy for Localized Prostate Cancer: A Retrospective Analysis