User login
Recurrent DKA episodes found to trigger cognitive changes
NEW ORLEANS – Recurrent episodes of diabetic ketoacidosis (DKA) resulted in altered brain metabolite concentration, as well as differences in mental processing speed, compared with healthy controls, judging from the results from a small pilot study.
While previous work examining the relationship of DKA to cognition and neural structure has focused upon children and adolescents, researchers at Emory University and the Georgia Institute of Technology, both in Atlanta, set out of evaluate for the first time acute neuroanatomical and cognitive changes in adult patients with first and recurrent episodes of DKA. In an interview in advance of the annual scientific sessions of the American Diabetes Association, one of the researchers, Gilda E. Ennis, Ph.D., said that DKA is the most serious diabetic emergency in patients with type 1 and 2 diabetes and results in an estimated health care cost of $2.4 billion annually. “While we know that one of the major precipitating causes of DKA in adult patients is poor adherence to insulin therapy, we do not understand why patients are noncompliant,” said Dr. Ennis, who is a postdoctoral fellow in the Georgia Institute of Technology’s school of psychology.

She and her associates conducted a pilot study examining advanced MRI metrics and cognitive measures 72 hours after resolution of DKA in 10 patients with a first episode of DKA and 11 patients with three or more episodes of DKA. The same MRI and cognitive measures were collected from 10 healthy controls and 10 patients with type 1 diabetes and no history of DKA.
MRI spectroscopy revealed reduced N-acetylaspartate concentrations in diabetes patients with multiple episodes of DKA, compared with healthy controls, but no significant differences were seen between diabetes patients with and without DKA. Cognitive testing revealed that patients with recurrent DKA had significantly worse processing speed, compared with healthy controls (P = .02), while processing speed deficits in patients with a single DKA and those with diabetes and no DKA was intermediate between healthy controls and those with recurrent DKA.
“We were surprised to find significant cognitive and neural deficits in the recurrent DKA group relative to healthy controls in such a small sample,” Dr. Ennis said. “This suggests that statistical differences in cognition and neural structure between patients with recurrent DKA and healthy controls may be large. We found that recurrent DKA was associated with significant deficits in processing speed and memory, decreases in right putamen volume, regionally decreased white matter integrity, and altered brain metabolite concentrations, suggestive of CNS inflammatory changes and neuronal injury.”
The findings may explain the high rates of medication noncompliance commonly seen in this patient population. “If this proposition is true, conventional education and standard care approaches to the treatment of type 1 diabetes, especially in patients with a history of DKA, may need to change,” she said. “Strategies to improve insulin adherence may require a special insulin compliance intervention that includes persistent medication adherence reminders, such as text messaging and nurse-telephone follow-up.”
Dr. Ennis acknowledged that the findings require replication in a prospective longitudinal study with a larger sample size. “It will be important to determine if acute neuroanatomical and cognitive deficits in patients with recurrent DKA persist over time,” she said. “Duration of type 1 diabetes could produce similar findings and would need to be controlled in future research.” She reported having no financial disclosures.
NEW ORLEANS – Recurrent episodes of diabetic ketoacidosis (DKA) resulted in altered brain metabolite concentration, as well as differences in mental processing speed, compared with healthy controls, judging from the results from a small pilot study.
While previous work examining the relationship of DKA to cognition and neural structure has focused upon children and adolescents, researchers at Emory University and the Georgia Institute of Technology, both in Atlanta, set out of evaluate for the first time acute neuroanatomical and cognitive changes in adult patients with first and recurrent episodes of DKA. In an interview in advance of the annual scientific sessions of the American Diabetes Association, one of the researchers, Gilda E. Ennis, Ph.D., said that DKA is the most serious diabetic emergency in patients with type 1 and 2 diabetes and results in an estimated health care cost of $2.4 billion annually. “While we know that one of the major precipitating causes of DKA in adult patients is poor adherence to insulin therapy, we do not understand why patients are noncompliant,” said Dr. Ennis, who is a postdoctoral fellow in the Georgia Institute of Technology’s school of psychology.
She and her associates conducted a pilot study examining advanced MRI metrics and cognitive measures 72 hours after resolution of DKA in 10 patients with a first episode of DKA and 11 patients with three or more episodes of DKA. The same MRI and cognitive measures were collected from 10 healthy controls and 10 patients with type 1 diabetes and no history of DKA.
MRI spectroscopy revealed reduced N-acetylaspartate concentrations in diabetes patients with multiple episodes of DKA, compared with healthy controls, but no significant differences were seen between diabetes patients with and without DKA. Cognitive testing revealed that patients with recurrent DKA had significantly worse processing speed, compared with healthy controls (P = .02), while processing speed deficits in patients with a single DKA and those with diabetes and no DKA was intermediate between healthy controls and those with recurrent DKA.
“We were surprised to find significant cognitive and neural deficits in the recurrent DKA group relative to healthy controls in such a small sample,” Dr. Ennis said. “This suggests that statistical differences in cognition and neural structure between patients with recurrent DKA and healthy controls may be large. We found that recurrent DKA was associated with significant deficits in processing speed and memory, decreases in right putamen volume, regionally decreased white matter integrity, and altered brain metabolite concentrations, suggestive of CNS inflammatory changes and neuronal injury.”
The findings may explain the high rates of medication noncompliance commonly seen in this patient population. “If this proposition is true, conventional education and standard care approaches to the treatment of type 1 diabetes, especially in patients with a history of DKA, may need to change,” she said. “Strategies to improve insulin adherence may require a special insulin compliance intervention that includes persistent medication adherence reminders, such as text messaging and nurse-telephone follow-up.”
Dr. Ennis acknowledged that the findings require replication in a prospective longitudinal study with a larger sample size. “It will be important to determine if acute neuroanatomical and cognitive deficits in patients with recurrent DKA persist over time,” she said. “Duration of type 1 diabetes could produce similar findings and would need to be controlled in future research.” She reported having no financial disclosures.
AT THE ADA SCIENTIFIC SESSIONS
Key clinical point: Recurrent episodes of diabetic ketoacidosis were found to cause certain cognitive changes in adults with type 1 diabetes.
Major finding: Cognitive testing revealed that patients with recurrent DKA had significantly worse processing speed, compared with healthy controls (P = .02), while processing speed deficits in patients with a single DKA and those with diabetes and no DKA was intermediate between healthy controls and those with recurrent DKA.
Data source: A pilot study examining advanced MRI metrics and cognitive measures 72 hours after resolution of DKA in 10 patients with a first episode of DKA and 11 patients with three or more episodes of DKA. The same measures were collected from 10 healthy controls and 10 patients with type 1 diabetes and no history of DKA.
Disclosures: Dr. Ennis reported having no financial disclosures.

Oral contraceptive efficacy unaffected by dimethyl fumarate
NATIONAL HARBOR, MD. – Delayed-release dimethyl fumarate (DMF) coadministered with norgestimate/ethinyl estradiol, a commonly used progesterone-estrogen combination oral contraceptive, did not alter the OC’s pharmacokinetics or pharmacodynamics, according to the results of a small study.
The safety profile of the coadministered preparation is similar to the profile of DMF (Tecfidera, Biogen) alone, Dr. Bing Zhu said in a poster session at the annual meeting of the Consortium of Multiple Sclerosis Centers.

The findings indicate that women with relapsing-remitting multiple sclerosis (RRMS) who are of childbearing age and who are being treated with DMF can use OCs without having to modify the contraceptive dose, said Dr. Zhu, who is an employee of Biogen, Cambridge, Mass.
The study involved healthy women aged 18-45 years (mean age about 31 years) who were able to conceive. All received a daily OC (Ortho-Cyclen; 250 mcg norgestimate, 35 mcg ethinyl estradiol). After 28 days, those with progesterone levels less than 3 ng/mL were randomized to a 28-day regimen of either the daily dose of OC (n = 39) or OC along with DMF (240 mg twice daily), designated period 1, with crossover to the other treatment for a further 28 days (period 2). Blood samples were collected during the first 24 hours for pharmacokinetic measurements and at 2, 3, and 4 weeks for pharmacodynamic determinations.
The primary objective was the pharmacokinetics of norgestimate, as determined by measuring the levels of its main metabolite, norelgestromin. Secondary objectives included pharmacodynamics, as determined by the levels of serum progesterone and the safety/tolerability of DMF.

Plasma concentrations of norelgestromin and ethinyl estradiol were identical over time in the OC and OC + DMF groups in period 1, as was serum progesterone.
Treatment-emergent adverse events were similar in type and severity in both groups. Most were mild. The prevalent adverse events included flushing and gastrointestinal disorders accompanied by nausea and vomiting. Adverse events occurred in 10 of the 39 (26%) subjects who received the OC and in 26 of the 39 (67%) subjects who received the OC + DMF. Discontinuation because of adverse events occurred in 8% and 15% of subjects who received the OC and the OC + DMF, respectively. There were no deaths.
“The results suggest that women of childbearing potential treated with DMF are able to use a combined OC for contraception without dose modification,” said Dr. Zhu.
The study findings were recently published (Neurology. 2016 Apr 5;86:Suppl P2.097).
The study was funded by Biogen. Dr. Zhu is a Biogen employee.
NATIONAL HARBOR, MD. – Delayed-release dimethyl fumarate (DMF) coadministered with norgestimate/ethinyl estradiol, a commonly used progesterone-estrogen combination oral contraceptive, did not alter the OC’s pharmacokinetics or pharmacodynamics, according to the results of a small study.
The safety profile of the coadministered preparation is similar to the profile of DMF (Tecfidera, Biogen) alone, Dr. Bing Zhu said in a poster session at the annual meeting of the Consortium of Multiple Sclerosis Centers.
The findings indicate that women with relapsing-remitting multiple sclerosis (RRMS) who are of childbearing age and who are being treated with DMF can use OCs without having to modify the contraceptive dose, said Dr. Zhu, who is an employee of Biogen, Cambridge, Mass.
The study involved healthy women aged 18-45 years (mean age about 31 years) who were able to conceive. All received a daily OC (Ortho-Cyclen; 250 mcg norgestimate, 35 mcg ethinyl estradiol). After 28 days, those with progesterone levels less than 3 ng/mL were randomized to a 28-day regimen of either the daily dose of OC (n = 39) or OC along with DMF (240 mg twice daily), designated period 1, with crossover to the other treatment for a further 28 days (period 2). Blood samples were collected during the first 24 hours for pharmacokinetic measurements and at 2, 3, and 4 weeks for pharmacodynamic determinations.
The primary objective was the pharmacokinetics of norgestimate, as determined by measuring the levels of its main metabolite, norelgestromin. Secondary objectives included pharmacodynamics, as determined by the levels of serum progesterone and the safety/tolerability of DMF.
Plasma concentrations of norelgestromin and ethinyl estradiol were identical over time in the OC and OC + DMF groups in period 1, as was serum progesterone.
Treatment-emergent adverse events were similar in type and severity in both groups. Most were mild. The prevalent adverse events included flushing and gastrointestinal disorders accompanied by nausea and vomiting. Adverse events occurred in 10 of the 39 (26%) subjects who received the OC and in 26 of the 39 (67%) subjects who received the OC + DMF. Discontinuation because of adverse events occurred in 8% and 15% of subjects who received the OC and the OC + DMF, respectively. There were no deaths.
“The results suggest that women of childbearing potential treated with DMF are able to use a combined OC for contraception without dose modification,” said Dr. Zhu.
The study findings were recently published (Neurology. 2016 Apr 5;86:Suppl P2.097).
The study was funded by Biogen. Dr. Zhu is a Biogen employee.
AT THE CMSC ANNUAL MEETING
Key clinical point: Delayed-release dimethyl fumarate can be used in childbearing women with RRMS without fear of compromising the effect of a common oral contraceptive.
Major finding: DMF coadministered with a common oral contraceptive does not affect the pharmacokinetics and pharmacodynamics of the contraceptive.
Data source: Open-label, randomized, two-way crossover study involving 46 healthy women.
Disclosures: The study was funded by Biogen. Dr. Zhu is an employee of and stockholder in Biogen.

VIDEO: Using dogs to detect hypoglycemia remains an imperfect science
NEW ORLEANS – In the first known controlled study of its kind, researchers demonstrated the reliability of trained dogs to alert hypoglycemia in human companions with type 1 diabetes, but at the cost of a high false-positive rate, compared with continuous glucose monitoring.
“The use of trained dogs to alert to changes in blood glucose in human companions with diabetes is increasing yet we don’t know how effective they are,” lead author Dr. Evan Los said in an interview in advance of the annual scientific sessions of the American Diabetes Association. “Enthusiastic anecdotal reports and limited in vitro studies are promising but rigorous studies have not been done. Clinicians are unable to provide informed advice when patients ask, ‘What do you think about diabetes alert dogs?’”
Dr. Los, a pediatric endocrinology fellow at Oregon Health and Science University, Portland, and his associates set out to conduct a controlled study of the reliability of diabetes alert dogs to detect hypoglycemia in their human companions with type 1 diabetes under real-life conditions. Capillary blood glucose (CBG) and continuous glucose monitoring (CGM) were used as comparators, and the study participants consisted of eight dog-human pairs. The human subjects ranged in age from 4 to 48 years old. Hypoglycemia was defined as CBG and/or CGM below 70 mg/dL and the human subjects answered survey questions regarding their impressions of the dog’s reliability and reasons for obtaining a diabetes alert dog. A timely alert was defined as occurring within 10 minutes before to 30 minutes after onset of hypoglycemia.
On a 10-point Likert scale, the dog users reported being “very satisfied” and “largely confident” in their dog’s ability to detect hypoglycemia (scores of 8.9 and 7.9, respectively), and they universally cited detection of hypoglycemia as the chief reason for obtaining a trained service dog. The researchers found that spontaneous dog alerts occurred 3.2 times more often than the rate of alerts during euglycemia, which was defined as 70-180 mg/dL, but the positive predictive value of dog alerts for hypoglycemia was only 12%. When Dr. Los and his associates reviewed event diaries and blinded CGM data, they observed that trained dogs provided a timely alert in 36% of all 45 hypoglycemia events. In the 30 events when both the dog-alerted and the blinded-CGM reached the hypoglycemia threshold, CGM would have alerted prior to the dog in 73% of events, which translated into a median difference of 22 minutes sooner.
“Trained dogs often alert a human companion to otherwise unknown hypoglycemia,” Dr. Los said. “However, due to high false-positive rates, a dog alert alone is unlikely to be helpful in differentiating hypo-/hyper-/euglycemia. CGM often detects hypoglycemia before a trained dog by a clinically significant margin.”
He acknowledged the study’s small sample size as a limitation. “Dog breeds and training methods were not universal, so there are likely to be variation in the reliability between dogs,” Dr. Los added. “This is not the final word on whether trained dogs might be helpful for patients with diabetes and there may be other benefits not assessed by this study such as having a positive partner in the daily management of a chronic disease.” He reported having no financial disclosures.
The video associated with this article is no longer available on this site. Please view all of our videos on the MDedge YouTube channel
FROM THE ADA SCIENTIFIC SESSIONS
Key clinical point: Trained dogs often alert a human companion to otherwise unknown hypoglycemia.
Major finding: During hypoglycemia, spontaneous dog alerts occurred 3.2 times more often than the rate of alerts during euglycemia, but the positive predictive value of dog alerts for hypoglycemia was only 12%.
Data source: An exploratory study to evaluate the reliability of eight trained service dogs in alerting to hypoglycemia in their eight human companions with type 1 diabetes, with capillary blood glucose and continuous glucose monitoring as comparators.
Disclosures: Dr. Los reported having no financial disclosures.

New fibromyalgia recommendations have firmer evidence base
LONDON – The new EULAR recommendations for fibromyalgia incorporate a decade’s worth of new evidence collected since the last edition appeared in 2008.
Although the 2016 recommendations do not reflect a novel understanding of the pathophysiology of fibromyalgia or a radically different approach to managing the disease, compared with those published in 2008, they differ vastly in the level and quality of supporting evidence behind them, said Dr. Gary J. Macfarlane, convener of the fibromyalgia recommendations panel and clinical professor of epidemiology at the University of Aberdeen, Scotland.

Dr. Macfarlane said that the past decade has seen “an explosion of evidence from randomized trials” around the management of fibromyalgia. “I think this will be one of the first EULAR guidelines in which all the recommendations are going to be based on systematic reviews or meta-analysis” – 107 altogether, he said in an interview.
Fibromyalgia – a heterogeneous pain condition that involves abnormal pain processing and can affect sleep, function, and quality of life – can be complex to diagnose and treat. Pain is a signature feature of fibromyalgia, but it is not the only treatment target: sleep, ability to function, and quality of life all are important, Dr. Macfarlane said.
The guidelines emphasize that optimal management of fibromyalgia requires not just a prompt diagnosis but “a comprehensive assessment of the patient’s ability to function and about the psychosocial context in which symptoms occur,” he said.
Patient education, including written information, is key and is the first step in management. Initial management should focus on nonpharmacologic interventions, specifically exercise. In patients for whom educational materials alone are insufficient to provide benefit, the next step is enrollment of the patient into a physical therapy program that involves an individualized program of graded physical exercise. Other nonpharmacologic interventions that can be introduced at this stage include hydrotherapy and acupuncture.
If there is insufficient response to these first two intervention steps, the next phase should start with a second round of patient assessment to develop an individualized intervention program. This involves characterizing the dominant features of the patient’s complaints into one of the three main categories: pain-related depression and anxiety, or behavior indicating abnormal coping strategies; severe pain, sleep disturbance, or both; or severe disability or sick leave, Dr. Macfarlane said at the European Congress of Rheumatology.
For patients in the first subgroup – pain-related depression and anxiety, or behavior indicating abnormal coping strategies – the intervention should consist of psychological therapies, primarily cognitive-behavioral therapy (CBT). For patients with more severe depression or anxiety, psychopharmacologic treatment is also an option.
For patients in the second subgroup – those with severe pain, sleep disturbance, or both – the main intervention is pharmacotherapy. For severe pain, this can involve duloxetine, pregabalin, or tramadol either alone or in combination with paracetamol (acetaminophen). For sleep disturbance, recommended drug interventions are low-dose amitriptyline, cyclobenzaprine, or pregabalin administered at bedtime.
For patients in the third subgroup – with severe disability or sick leave – the recommended intervention is a multimodal rehabilitation program.
“We made the decision to consider all therapies whether they were licensed in Europe or not because we felt that helps to contribute to the debate,” Dr. Macfarlane said. He also highlighted several interventions that have been proposed in the past, but which his working group refrained from recommending because of either lack of demonstrated effectiveness or the poor quality of the studies that appeared to document efficacy. These nonrecommended interventions are biofeedback, capsaicin, hypnotherapy, massage, S-adenosyl methinone or SAMe, and other complementary and alternative therapies.
Dr. Macfarlane noted that, despite a decade’s worth of findings, many questions still hover over the ideal management of fibromyalgia. Although the guidelines strongly promote exercise, “we still don’t have enough information about what specific type of exercise would be most beneficial.”
And while studies show overwhelmingly that CBT is effective, the size of the benefit is modest. Dr. Macfarlane said that it will be important to learn whether combined pharmacologic and nonpharmacologic approaches might be more effective from the get-go for certain patients – in contrast to the stepped approach outlined in the guidelines – and whether there is a way to identify patients for whom such interventions as CBT are most likely to be effective.
Another question still unanswered is whether fibromyalgia should remain primarily the domain of rheumatologists. While this was not a question addressed in the guidelines, the writing committee involved not only rheumatologists but also specialists in pain, internal medicine, occupational health, and nursing – underscoring the multidisciplinary direction that fibromyalgia treatment is taking.
“I think rheumatologists have an important role to play because pain is a dominant feature and because fibromyalgia is often comorbid with inflammatory rheumatic conditions,” Dr. Macfarlane said. “But I think we should be looking at other models of care for these patients as well.”
Because patients are referred in and out of various specialties, “there is no one really looking at the overall management, thinking about them holistically,” he said. “There’s a need for us to organize health care services better, so when we have a patient with fibromyalgia-like symptoms, we manage their journey through the system effectively instead of ping-ponging them around.”
Dr. Macfarlane has given lectures on behalf of Janssen and has received research support from Pfizer.
On Twitter @mitchelzoler
LONDON – The new EULAR recommendations for fibromyalgia incorporate a decade’s worth of new evidence collected since the last edition appeared in 2008.
Although the 2016 recommendations do not reflect a novel understanding of the pathophysiology of fibromyalgia or a radically different approach to managing the disease, compared with those published in 2008, they differ vastly in the level and quality of supporting evidence behind them, said Dr. Gary J. Macfarlane, convener of the fibromyalgia recommendations panel and clinical professor of epidemiology at the University of Aberdeen, Scotland.
Dr. Macfarlane said that the past decade has seen “an explosion of evidence from randomized trials” around the management of fibromyalgia. “I think this will be one of the first EULAR guidelines in which all the recommendations are going to be based on systematic reviews or meta-analysis” – 107 altogether, he said in an interview.
Fibromyalgia – a heterogeneous pain condition that involves abnormal pain processing and can affect sleep, function, and quality of life – can be complex to diagnose and treat. Pain is a signature feature of fibromyalgia, but it is not the only treatment target: sleep, ability to function, and quality of life all are important, Dr. Macfarlane said.
The guidelines emphasize that optimal management of fibromyalgia requires not just a prompt diagnosis but “a comprehensive assessment of the patient’s ability to function and about the psychosocial context in which symptoms occur,” he said.
Patient education, including written information, is key and is the first step in management. Initial management should focus on nonpharmacologic interventions, specifically exercise. In patients for whom educational materials alone are insufficient to provide benefit, the next step is enrollment of the patient into a physical therapy program that involves an individualized program of graded physical exercise. Other nonpharmacologic interventions that can be introduced at this stage include hydrotherapy and acupuncture.
If there is insufficient response to these first two intervention steps, the next phase should start with a second round of patient assessment to develop an individualized intervention program. This involves characterizing the dominant features of the patient’s complaints into one of the three main categories: pain-related depression and anxiety, or behavior indicating abnormal coping strategies; severe pain, sleep disturbance, or both; or severe disability or sick leave, Dr. Macfarlane said at the European Congress of Rheumatology.
For patients in the first subgroup – pain-related depression and anxiety, or behavior indicating abnormal coping strategies – the intervention should consist of psychological therapies, primarily cognitive-behavioral therapy (CBT). For patients with more severe depression or anxiety, psychopharmacologic treatment is also an option.
For patients in the second subgroup – those with severe pain, sleep disturbance, or both – the main intervention is pharmacotherapy. For severe pain, this can involve duloxetine, pregabalin, or tramadol either alone or in combination with paracetamol (acetaminophen). For sleep disturbance, recommended drug interventions are low-dose amitriptyline, cyclobenzaprine, or pregabalin administered at bedtime.
For patients in the third subgroup – with severe disability or sick leave – the recommended intervention is a multimodal rehabilitation program.
“We made the decision to consider all therapies whether they were licensed in Europe or not because we felt that helps to contribute to the debate,” Dr. Macfarlane said. He also highlighted several interventions that have been proposed in the past, but which his working group refrained from recommending because of either lack of demonstrated effectiveness or the poor quality of the studies that appeared to document efficacy. These nonrecommended interventions are biofeedback, capsaicin, hypnotherapy, massage, S-adenosyl methinone or SAMe, and other complementary and alternative therapies.
Dr. Macfarlane noted that, despite a decade’s worth of findings, many questions still hover over the ideal management of fibromyalgia. Although the guidelines strongly promote exercise, “we still don’t have enough information about what specific type of exercise would be most beneficial.”
And while studies show overwhelmingly that CBT is effective, the size of the benefit is modest. Dr. Macfarlane said that it will be important to learn whether combined pharmacologic and nonpharmacologic approaches might be more effective from the get-go for certain patients – in contrast to the stepped approach outlined in the guidelines – and whether there is a way to identify patients for whom such interventions as CBT are most likely to be effective.
Another question still unanswered is whether fibromyalgia should remain primarily the domain of rheumatologists. While this was not a question addressed in the guidelines, the writing committee involved not only rheumatologists but also specialists in pain, internal medicine, occupational health, and nursing – underscoring the multidisciplinary direction that fibromyalgia treatment is taking.
“I think rheumatologists have an important role to play because pain is a dominant feature and because fibromyalgia is often comorbid with inflammatory rheumatic conditions,” Dr. Macfarlane said. “But I think we should be looking at other models of care for these patients as well.”
Because patients are referred in and out of various specialties, “there is no one really looking at the overall management, thinking about them holistically,” he said. “There’s a need for us to organize health care services better, so when we have a patient with fibromyalgia-like symptoms, we manage their journey through the system effectively instead of ping-ponging them around.”
Dr. Macfarlane has given lectures on behalf of Janssen and has received research support from Pfizer.
On Twitter @mitchelzoler
AT THE EULAR 2016 CONGRESS

VIDEO: Telehealth program provides weight management support to rural clinics
MINNEAPOLIS – Can telehealth help obese patients lose weight?
Weight management experts at the Medical University of South Carolina, Charleston, sought to find out through a unique program to provide practice support to rural health care providers.
The telehealth program gives health clinics in rural South Carolina access to teams of weight management experts and support through mHealth applications linking providers and clinical faculty.
The project includes biweekly group patient sessions led by a psychologist, registered dietitian, and exercise physiologist. The program uses videoconferencing systems and a provider-focused mobile app that captures weight and blood pressure data from wireless peripherals, while allowing for manual input of data.
In a video interview at the American Telemedicine Association annual conference, Ragan Aleise DuBose-Morris, Ph.D., director of telehealth education for the Medical University of South Carolina, and Joshua Brown, Ph.D., director of clinical services at the university’s Weight Management Center, discussed the weight management initiative and its effectiveness. Dr. DuBose-Morris and Dr. Brown also explained how the initiative was designed, and how the effort has impacted the weight of obese patients in the state.
[email protected] On Twitter @legal_med
The video associated with this article is no longer available on this site. Please view all of our videos on the MDedge YouTube channel
EXPERT ANALYSIS FROM ATA 2016

Web app boosts lung cancer survival
CHICAGO – A simple Web-based mobile application (web-app) improved survival time and quality of life of patients with advanced lung cancer, according to a randomized study presented at the annual meeting of the American Society of Clinical Oncology.
The study was stopped at the planned interim survival analysis that occurred after 121 evaluable patients because of survival benefit favoring the web-app arm. The application, called Moovcare, allowed patients to report symptoms over time and stay in close touch with their care providers after their initial surgery, chemotherapy, or radiation therapy.

“The 1-year survival was 75% in the Moovcare vs. 49% in the control arm,” said lead author Dr. Fabrice Denis of the Institut Inter-régional de Cancérologie Jean Bernard in LeMans, France, in a press conference.
Dr. Denis identified several reasons why a web-app could be useful in treating patients with lung cancer. Even with more than 1 million lung cancer deaths a year worldwide, there is no standard follow-up, and relapses do not occur on a 3 or 6-month schedule of planned visits. So patients often wait several weeks until their next visit to report symptoms indicative of a relapse. They may also be reluctant to report symptoms because of shame over how they contracted the disease, for example, from smoking. And patients are often hesitant to “bother” the doctor with symptoms between visits. All these reasons can contribute to suboptimal therapy and worse outcomes.
Investigators designed Moovcare to allow patients to report symptoms weekly, facilitating early detection of relapse or dangerous medical conditions and triggering early supportive care. They compared the web-app to a control of usual, nonpersonalized follow-up in a French multicenter prospective, randomized trial.
Patients (n = 121) with stage II/node-positive to stage IV (90% stage III/IV) nonprogressive small cell or non–small cell lung cancer were randomly assigned 1:1 to the two arms of the trial. They had to have Internet access, prior experience with email, performance status of 0-2, and an initial symptom score less than 7. Patients could be taking tyrosine kinase inhibitors or on maintenance therapy. Monitoring visits were the same for both groups every 3 months or more frequently. Patients in the control arm received more frequent computed tomographic (CT) imaging than did ones in the web-app arm, and CT scans could be performed at any time in either group based on the investigator’s clinical judgment, or in the case of the web-app, as suggested by patient report in the algorithm.
The median follow up was 9 months. Relapse rates were close to 50% for both groups. The 1-year survival of 75% in the Moovcare to 49% in the control arm gave a 1-year absolute survival increase of 26%. Median survival was 19 months vs. 12 months, a 7-month improvement in median survival for the Moovcare arm. The hazard ratio for death in the web-app arm, compared with the control arm was 0.325 (95% confidence interval, 0.157-0.672; P = .0025).
When they relapsed, 77% of patients in the web-app arm had a good performance status, compared with 33% in the control arm. “This led to 74% of patients receiving optimal therapy in the Moovcare arm vs. 33% in the control arm,” Dr. Denis said. “And the number of imaging [procedures] was reduced by 50% per patient per year.”
Overall quality of life was better in the web-app arm, as assessed using standard quality of life questionnaires.
Moovcare works by having patients or their relatives report 12 symptoms weekly (for example, asthenia, cough, dyspnea, anorexia, etc.) using a smartphone, tablet, or computer. An algorithm analyzes an association of symptoms and triggers email alerts to health care providers if relapse or dangerous medical conditions may be occurring. Providers follow up alerts by phone and schedule visits and imaging. “The sensitivity of the algorithm was high and was validated in two prospective studies,” Dr. Denis said. Sensitivity was 86%-100%.
Moovcare allowed earlier detection of relapse and improved overall survival for three reasons. “It allowed higher performance status at relapse, leading to more optimal therapy for relapsing patients. Dangerous medical conditions were detected earlier and treated earlier. It favored earlier supportive care, which improved quality of life. Less imaging was needed and performed at the right time,” Dr. Denis said.
Patients were monitored on a weekly basis, allowing more personalized care. The Moovcare web-app has been evaluated prospectively in about 300 patients, providing a high level of evidence of its utility in improving outcomes for patients with advanced lung cancer.
Press conference moderator Dr. Patricia Ganz commented that Moovcare is an example of a new way to improve the delivery of high-quality care to patients. “If we had a drug or some new intervention that caused this level of survival benefit, wouldn’t we want to go out and use it?” she asked. “This is a tremendous advance. This is personalized medicine. This is really tailoring it to the patient, and you can see how simple it is to collect this kind of data from the patient and then bring them in in between what would have been a scheduled visit.” She said the app overcomes the barrier of patients putting off reporting symptoms until their next visit or their reluctance to “bother the doctor.”
She said the app alerts the health care team to potential problems and prompts them to “use tests when appropriate, not on a schedule, [which] leads to avoidance of waste in the follow-up of care of our patients.”
CHICAGO – A simple Web-based mobile application (web-app) improved survival time and quality of life of patients with advanced lung cancer, according to a randomized study presented at the annual meeting of the American Society of Clinical Oncology.
The study was stopped at the planned interim survival analysis that occurred after 121 evaluable patients because of survival benefit favoring the web-app arm. The application, called Moovcare, allowed patients to report symptoms over time and stay in close touch with their care providers after their initial surgery, chemotherapy, or radiation therapy.
“The 1-year survival was 75% in the Moovcare vs. 49% in the control arm,” said lead author Dr. Fabrice Denis of the Institut Inter-régional de Cancérologie Jean Bernard in LeMans, France, in a press conference.
Dr. Denis identified several reasons why a web-app could be useful in treating patients with lung cancer. Even with more than 1 million lung cancer deaths a year worldwide, there is no standard follow-up, and relapses do not occur on a 3 or 6-month schedule of planned visits. So patients often wait several weeks until their next visit to report symptoms indicative of a relapse. They may also be reluctant to report symptoms because of shame over how they contracted the disease, for example, from smoking. And patients are often hesitant to “bother” the doctor with symptoms between visits. All these reasons can contribute to suboptimal therapy and worse outcomes.
Investigators designed Moovcare to allow patients to report symptoms weekly, facilitating early detection of relapse or dangerous medical conditions and triggering early supportive care. They compared the web-app to a control of usual, nonpersonalized follow-up in a French multicenter prospective, randomized trial.
Patients (n = 121) with stage II/node-positive to stage IV (90% stage III/IV) nonprogressive small cell or non–small cell lung cancer were randomly assigned 1:1 to the two arms of the trial. They had to have Internet access, prior experience with email, performance status of 0-2, and an initial symptom score less than 7. Patients could be taking tyrosine kinase inhibitors or on maintenance therapy. Monitoring visits were the same for both groups every 3 months or more frequently. Patients in the control arm received more frequent computed tomographic (CT) imaging than did ones in the web-app arm, and CT scans could be performed at any time in either group based on the investigator’s clinical judgment, or in the case of the web-app, as suggested by patient report in the algorithm.
The median follow up was 9 months. Relapse rates were close to 50% for both groups. The 1-year survival of 75% in the Moovcare to 49% in the control arm gave a 1-year absolute survival increase of 26%. Median survival was 19 months vs. 12 months, a 7-month improvement in median survival for the Moovcare arm. The hazard ratio for death in the web-app arm, compared with the control arm was 0.325 (95% confidence interval, 0.157-0.672; P = .0025).
When they relapsed, 77% of patients in the web-app arm had a good performance status, compared with 33% in the control arm. “This led to 74% of patients receiving optimal therapy in the Moovcare arm vs. 33% in the control arm,” Dr. Denis said. “And the number of imaging [procedures] was reduced by 50% per patient per year.”
Overall quality of life was better in the web-app arm, as assessed using standard quality of life questionnaires.
Moovcare works by having patients or their relatives report 12 symptoms weekly (for example, asthenia, cough, dyspnea, anorexia, etc.) using a smartphone, tablet, or computer. An algorithm analyzes an association of symptoms and triggers email alerts to health care providers if relapse or dangerous medical conditions may be occurring. Providers follow up alerts by phone and schedule visits and imaging. “The sensitivity of the algorithm was high and was validated in two prospective studies,” Dr. Denis said. Sensitivity was 86%-100%.
Moovcare allowed earlier detection of relapse and improved overall survival for three reasons. “It allowed higher performance status at relapse, leading to more optimal therapy for relapsing patients. Dangerous medical conditions were detected earlier and treated earlier. It favored earlier supportive care, which improved quality of life. Less imaging was needed and performed at the right time,” Dr. Denis said.
Patients were monitored on a weekly basis, allowing more personalized care. The Moovcare web-app has been evaluated prospectively in about 300 patients, providing a high level of evidence of its utility in improving outcomes for patients with advanced lung cancer.
Press conference moderator Dr. Patricia Ganz commented that Moovcare is an example of a new way to improve the delivery of high-quality care to patients. “If we had a drug or some new intervention that caused this level of survival benefit, wouldn’t we want to go out and use it?” she asked. “This is a tremendous advance. This is personalized medicine. This is really tailoring it to the patient, and you can see how simple it is to collect this kind of data from the patient and then bring them in in between what would have been a scheduled visit.” She said the app overcomes the barrier of patients putting off reporting symptoms until their next visit or their reluctance to “bother the doctor.”
She said the app alerts the health care team to potential problems and prompts them to “use tests when appropriate, not on a schedule, [which] leads to avoidance of waste in the follow-up of care of our patients.”
AT THE 2016 ASCO ANNUAL MEETING
Key clinical point: A Web-based app improves survival for advanced lung cancer patients.
Major finding: Survival improved by 26% for web-app patients vs. controls.
Data source: Multicenter, prospective, phase III, randomized trial of 121 patients.
Disclosures: Dr. Denis has received honoraria and expenses from several pharmaceutical companies and has received institutional research funding from Sivan. Dr. Patricia Ganz reported stock and other ownership interest in Abbott Laboratories, GlaxoSmithKline, Johnson & Johnson, Merck, Novartis, Pfizer, and Teva.

Presidential Address: ‘We Care!’
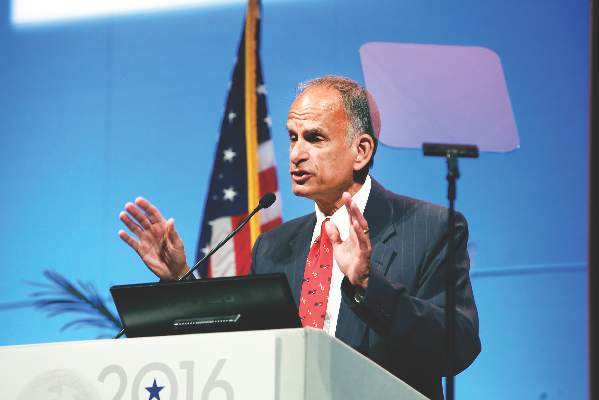
“Vascular surgeons are unique in the management of patients with circulatory disease. We are unique because we are exclusively devoted, 100% of our specialty, to the management of patients with vascular disease,” said Dr. Bruce A. Perler in his Presidential Address.
“We are unique in the field of circulatory disease because we’re the only vascular specialists who offer the entire spectrum of treatment options, medical, endovascular and open surgery.... But also, we don’t (just) treat lesions. We take care of patients, and we follow our patients long-term, and we get to know our patients, as people, and we dedicate ourselves to optimizing our patients’ vascular health. This is our brand!”
He described how SVS membership is at more than 5,400, including podiatry partners, cardiologists, radiologists, and other allied health specialists such as PAs and nurses, and more than 700 international members and 10 international chapters.
Dr. Perler stressed how the majority of vascular surgical care in this country today is delivered in the community by private practice vascular surgeons. To support this constituency, SVS established a Community Practice Committee, and this year, despite a tight budget, SVS appropriated $100,000 to fund a strategic plan for the committee.
In addition, SVS’s full-time Washington office is working with CMS and key Congressional leadership to represent the interests of community practitioners and to allow them to succeed in this new world order.
He discussed a number of other highlights of the year as well.
“Our VQI is now certified as a Qualified Clinical Data Registry for meaningful use. In fact ... SVS is the first medical Society to have a government-certified Patient Safety Organization.
“Our PSO and VQI leadership is now collaborating with the FDA and several device manufacturers to capture post-market surveillance data, and we’re tracking the outcomes of vena cava filters and novel endovascular devices ... and our influence is only going to grow!”
The shortage of vascular practitioners is a major concern, and may be made worse by the graying of the surgeon workforce, and accelerated retirement, both voluntary and involuntary, said Dr. Perler, adding that 27% of SVS members are over the age of 60.
Adding to the physician shortage is an inadequate number of training positions. “And while some have suggested that we can utilize nurses and other allied health professionals to compensate for these physician shortages, in fact we’re facing an even greater shortage of nurses and PAs in the near future.” He emphasized that “we need to train more vascular surgeons.”
Among the major surgical specialties, vascular surgery is second only to ophthalmology in annual Medicare spending, Dr. Perler pointed out. This makes vascular surgery a key player in health care system economics.
In fact, “Vascular surgical care specifically will be one of the most significant contributors to hospital margins,” he said.
Dr. Perler pointed out that “this year as President I made it my highest priority to devote the financial and human resources necessary to develop a comprehensive SVS public relations infrastructure to communicate our brand to the key stakeholders: hospital and health care system administrators, payors, the media, and the public.
“We’ve begun with a complete remake of our website, with voluminous new patient-oriented educational material.
“Seventy percent of our website traffic comes from the public seeking medical information. . .And we’re recruiting an SVS member rapid– response team of experts at the national and local levels to be available in real time for news interviews as stories break.
“But we’ll also be proactive in distributing press releases on a regular basis to the media, and we’re going to partner with major national newswires to distribute content to more than 200,000 media points and 10,000 websites.”
Dr. Perler went on to discuss the economics and ethics of many unnecessary procedures being performed today. He stated how this year adherence to the Society’s Code of Ethics is being included in the requirements for membership.
“If approved at our business meeting,” he said, “it will not be enough to do a sufficient number of vascular surgical cases, and do them well, to qualify for membership. If there is credible evidence that comes forward that an applicant for membership has engaged in the performance of inappropriate procedures, or unethical practices, that applicant will be disqualified for membership in our Society.”
On the other hand, he stressed the importance of a strong relationship with industry as exemplified by Dr. Juan Parodi, “who dreamed, and he cared, and believed you could actually repair an aortic aneurysm through incisions in the groin — an idea so preposterous at the time, that the Journal of Vascular Surgery rejected his first case report. Our industry partners believed in this technology, and believed in our specialty, and invested heavily in this technology, and worked with us to continually improve this revolutionary approach to aneurysm repair, as they continue to do today.”
Dr. Perler stressed that appropriate partnership and collaboration with industry is proper and ethical, and critical to improving and saving the lives of patients.
He returned again and again to his theme of caring, that he and fellow vascular surgeons care for and treat the person, not simply a vascular health issue.
“We all belong to a truly exceptional and vibrant specialty, and while our numbers are small, we are unique in the care of patients with circulatory disease, not just because of the totality of care we deliver, not because we’re necessarily better, but much more importantly, because we care; we care deeply about what we do, our patients, and each other,” Dr. Perler said.

Prepare early for peer review hearings to avoid negative outcomes
CHICAGO – Being targeted for a peer review can be unnerving for physicians, but proper preparation can help doctors smoothly navigate the process and increase their chances for a favorable outcome.
The first step is taking the situation seriously and remaining calm, said Janet L. Pulliam, a Little Rock, Ark.–based attorney who specializes in health law and employment and labor. Next, hire an experienced attorney and refrain from signing anything without consulting counsel, Ms. Pulliam said at a conference held by the American Bar Association. She also suggested that physicians request an individual meeting with each reviewer before the hearing.

“That’s not to be a lobbying meeting; that’s to be a meeting where you simply, one on one, ask someone who is going to be in judgment of you [to] please keep an open mind until they have heard all of the evidence,” Ms. Pulliam said at the meeting. “Trust me, they’ve already had plenty of information provided to them from the [hospital] administration, so that’s not asking any favors.”
If the peer review stems from a patient interaction or treatment decision, review the patient record in question, but don’t change any documentation, she noted. You can always argue during the hearing that the patient record does not adequately illustrate the encounter or that the charting was inaccurate.
Speak up during peer review meetings and ensure that your case is heard, added Elizabeth A. Snelson, a St. Paul, Minn.–based health law attorney who represents medical staffs, medical societies, and other health professionals.
“Not that it’s easy to put a lawyer in a room and tell her to not talk, but the fact of the matter is that the case will be more successful if it’s the doctor who is addressing the panel, which is usually comprised completely of doctors,” Ms. Snelson said.
Educate the committee, Ms. Pulliam advised. Use the opportunity to explain the protocols specific to your specialty and how they may differ from other specialties.
“It’s your time to educate them,” she said. “The physicians on the committee generally, genuinely want to know what they don’t know, and this is the only shot that you’re going to have to tell them.”

Attend every meeting and be on time. This may sound obvious, but Ms. Pulliam has seen the negative effects a tardy appearance can have on a committee’s perceptions. Making the peer review process a priority and scheduling accordingly is paramount. In addition, ask the hospital for a court reporter to transcribe the hearing. If the hospital refuses, offer to pay for half of the cost, Ms. Pulliam suggested. Accurate documentation is critical and can later be challenged if no record exists. If the hospital declines to share the cost, Ms. Pulliam recommended that doctors foot the entire bill. Make every effort to have a complete transcript, she said.
Be an advocate for a solution when possible, Ms. Pulliam added. Discuss with your attorney potential resolutions, but also know your litigation options. Be prepared to go to court if necessary.
“This is when you need to litigate because procedures and fairness have not been followed in the process,” she said during her presentation. “Courts do allow for equity, declaratory judgments, and injunctions when rights guaranteed to a physician are not followed.”
Knowing those rights and regulations beforehand is key, Ms. Snelson said. States’ peer review laws widely differ. Arkansas law for example, enables physicians to request a hearing officer who is independent and not employed by the hospital and also protects communications by physicians during peer review proceedings. Other states have different features, and some states have nothing regarding peer review on the books, Ms. Snelson said.
“In some states it’s real clear where the peer review requirements are,” she said. “In other states, you really have to go hunting. It could be in the evidence code. It could be all over the place.”
Be aware of appeal rights. Usually, medical staff bylaws allow for an appeal to the governing body of the hospital if a doctor disagrees with a panel’s recommendation. However, sometimes bylaws are silent on appeals, Ms. Snelson said. She noted that the Joint Commission standards refer to peer review hearings and appeals. Thus, if a hospital is accredited by the Joint Commission, and its bylaws do not address appeals, physicians and their attorneys can argue that an appeals process should be in place.
Remember that peer review is not limited to “bad doctors,” and that the process can arise from minor issues, Ms. Snelson said at the meeting.
“Usually when doctors hear ‘peer review,’ they hear ‘discipline,’ ” she said. “[However], It’s not always the ‘bad doctors’; it can be something that is quite minimal that can be escalated. It can be entirely appropriate. What peer review should be is educational ... but sometimes it can be used as a weapon.”
On Twitter @legal_med
CHICAGO – Being targeted for a peer review can be unnerving for physicians, but proper preparation can help doctors smoothly navigate the process and increase their chances for a favorable outcome.
The first step is taking the situation seriously and remaining calm, said Janet L. Pulliam, a Little Rock, Ark.–based attorney who specializes in health law and employment and labor. Next, hire an experienced attorney and refrain from signing anything without consulting counsel, Ms. Pulliam said at a conference held by the American Bar Association. She also suggested that physicians request an individual meeting with each reviewer before the hearing.
“That’s not to be a lobbying meeting; that’s to be a meeting where you simply, one on one, ask someone who is going to be in judgment of you [to] please keep an open mind until they have heard all of the evidence,” Ms. Pulliam said at the meeting. “Trust me, they’ve already had plenty of information provided to them from the [hospital] administration, so that’s not asking any favors.”
If the peer review stems from a patient interaction or treatment decision, review the patient record in question, but don’t change any documentation, she noted. You can always argue during the hearing that the patient record does not adequately illustrate the encounter or that the charting was inaccurate.
Speak up during peer review meetings and ensure that your case is heard, added Elizabeth A. Snelson, a St. Paul, Minn.–based health law attorney who represents medical staffs, medical societies, and other health professionals.
“Not that it’s easy to put a lawyer in a room and tell her to not talk, but the fact of the matter is that the case will be more successful if it’s the doctor who is addressing the panel, which is usually comprised completely of doctors,” Ms. Snelson said.
Educate the committee, Ms. Pulliam advised. Use the opportunity to explain the protocols specific to your specialty and how they may differ from other specialties.
“It’s your time to educate them,” she said. “The physicians on the committee generally, genuinely want to know what they don’t know, and this is the only shot that you’re going to have to tell them.”
Attend every meeting and be on time. This may sound obvious, but Ms. Pulliam has seen the negative effects a tardy appearance can have on a committee’s perceptions. Making the peer review process a priority and scheduling accordingly is paramount. In addition, ask the hospital for a court reporter to transcribe the hearing. If the hospital refuses, offer to pay for half of the cost, Ms. Pulliam suggested. Accurate documentation is critical and can later be challenged if no record exists. If the hospital declines to share the cost, Ms. Pulliam recommended that doctors foot the entire bill. Make every effort to have a complete transcript, she said.
Be an advocate for a solution when possible, Ms. Pulliam added. Discuss with your attorney potential resolutions, but also know your litigation options. Be prepared to go to court if necessary.
“This is when you need to litigate because procedures and fairness have not been followed in the process,” she said during her presentation. “Courts do allow for equity, declaratory judgments, and injunctions when rights guaranteed to a physician are not followed.”
Knowing those rights and regulations beforehand is key, Ms. Snelson said. States’ peer review laws widely differ. Arkansas law for example, enables physicians to request a hearing officer who is independent and not employed by the hospital and also protects communications by physicians during peer review proceedings. Other states have different features, and some states have nothing regarding peer review on the books, Ms. Snelson said.
“In some states it’s real clear where the peer review requirements are,” she said. “In other states, you really have to go hunting. It could be in the evidence code. It could be all over the place.”
Be aware of appeal rights. Usually, medical staff bylaws allow for an appeal to the governing body of the hospital if a doctor disagrees with a panel’s recommendation. However, sometimes bylaws are silent on appeals, Ms. Snelson said. She noted that the Joint Commission standards refer to peer review hearings and appeals. Thus, if a hospital is accredited by the Joint Commission, and its bylaws do not address appeals, physicians and their attorneys can argue that an appeals process should be in place.
Remember that peer review is not limited to “bad doctors,” and that the process can arise from minor issues, Ms. Snelson said at the meeting.
“Usually when doctors hear ‘peer review,’ they hear ‘discipline,’ ” she said. “[However], It’s not always the ‘bad doctors’; it can be something that is quite minimal that can be escalated. It can be entirely appropriate. What peer review should be is educational ... but sometimes it can be used as a weapon.”
On Twitter @legal_med
AT THE PHYSICIANS LEGAL ISSUES CONFERENCE

Three AATS Graham Foundation Programs are Now Open for Application
Advanced Valve Disease Educational Fellowship
Sponsored by Medtronic
Offers surgeons the opportunity to interactively observe valvular heart disease specialists and connect with them about treatment, technical skills, and management of perioperative patients for a minimum of one month and three months.
Deadline: July 1, 2016
Evarts A. Graham Memorial Traveling Fellowship
Enhances the training of international academic CT surgeons and increases their international contacts by underwriting one-year of study at North American institutions. Includes a $75,000 stipend and round-trip airfare. Since 1951, fellows have included 64 individuals from 32 countries.
Deadline: July 1, 2016
Third John Alexander Research Scholarship
Supports North American surgeons with a two-year $160,000 grant to pursue research, training and clinical experience. Scholarships are named after past presidents of the Association. To date, 34 awardees have received over $4 million in grants.
Deadline: July 1, 2016

Hepatitis outlook: May 2016
If you work on the front lines of medical care treating patients with hepatitis, you may not have time to review all the hepatitis research that enters the medical literature every month. Here’s a quick look at some notable news items and journal articles published over the past month, covering a variety of the major hepatitis viruses.
A Taiwanese study published in Hepatology demonstrated the importance of identifying and tracking viral mutations for monitoring hepatitis B progression and early detection of hepatocellular carcinoma. The authors found that the mutation score for predicting short-term hepatocellular carcinoma risk outperformed other factors, including hepatitis B virus (HBV) DNA levels, viral genotype, and various combinations of risk factors.

Early combination antiretroviral therapy and wider hepatitis C virus (HCV) treatment have the potential to markedly reduce hepatitis C–related mortality, as well as increase survival overall for HIV-infected populations, according to a recent analysis. However, the authors said HCV treatment will need to be greatly scaled up.
Treating all chronic hepatitis C–screened patients for more than 5 years in France with new direct-acting antivirals, regardless of fibrosis stage, would be cost effective, a report revealed. However, the authors warned this would add a cost of 3.5-7.2 billion euros to an already overburdened medical care system.
Most German adolescents who received a full course of hepatitis B virus booster vaccine during infancy were still protected against hepatitis B infection almost 14 years later, according to a study in Human Vaccines & Immunotherapeutics.
Chronic HCV infection is associated with both former and excessive current alcohol consumption, according to an analysis of data from the 2003-2010 National Health and Nutrition Examination Survey. Researchers said public health HCV strategies should implement interventions with emphasis on alcohol abuse, which negatively impacts disease progression for HCV-infected individuals.
Treating patients with hepatitis delta virus genotype 3 with pegylated interferon alpha-2a was correlated with a possible cure rate higher than expected, according to a study in the International Journal of Infectious Diseases.
Widespread media reports in China of infant deaths following hepatitis B vaccine administration was associated with a decline in parental confidence in a vaccine that had been proved safe, and an increased refusal of vaccination, according to a report in the International Journal of Epidemiology. The authors recommended proactive outreach to stakeholders and the media to help mitigate any negative impact of future coincidental adverse events following immunization.
The platelet-to-lymphocyte ratio (PLR) is closely related to disease severity in patients with HCV-related liver disease and to the virologic response in patients with chronic hepatitis C, a recent study revealed. Investigators said dynamic continuous monitoring of the PLR, rather than a single high or low PLR value at a certain time point, will contribute to disease surveillance, with an increasing tendency predicting a good virologic response.
Ledipasvir/sofosbuvir (LDV/SOF) and sofosbuvir plus ribavirin (SOF+RBV) demonstrate a high barrier to resistance in Japanese patients with HCV genotype 1 and 2 infection, according to a study in the Journal of Viral Hepatitis. The authors said the presence of baseline NS5A resistance–associated variants did not impact treatment outcome in genotype 1 Japanese patients treated with LDV/SOF for 12 weeks.
Multilateral cooperation among Chinese vaccine manufacturers, the Chinese National Regulatory Authorization, and the World Health Organization is expediting the entrance of the hepatitis E vaccine Hecolin into the international market, according to a review in Human Vaccines & Immunotherapeutics.
A study in HIV Medicine found that psychiatric disorders were frequent in HIV/HCV-coinfected patients and their rates comparable between groups, even for patients achieving a sustained virologic response.
A review essay in Current Opinion in Infectious Diseases concluded that patients with recurrent HCV following liver transplant will significantly benefit from all oral new direct-acting antivirals, but that ongoing studies would determine the optimal timing and combination in this unique population.
Health care utilization and costs were higher among patients with diabetes and HBV than in those with diabetes alone, according to a recent study. The authors said the results support the need for HBV vaccination among unvaccinated diabetes patients.
A study in the Journal of Acquried Immune deficiency Syndromes provides additional support for the use of the CD4/CD8 ratio for routine monitoring of immune activation and inflammation in HIV-positive patients, including those coinfected with the hepatitis C virus. However, the authors said an unexpected association between cleared HCV and a lower CD4/CD8 ratio requires additional study.
A study of hepatitis B vaccination found that dosages of both 5-mcg HBV vaccine and 10-mcg HBV vaccine could be used to immunize children safely, while the 10-mcg vaccine could be used for adults aged 15-24 years, and a higher dosage of the HBV vaccine might be required for adults aged 25 years and older.
Levels of the let-7 family of microRNAs circulating in plasma and extracellular vesicles correlate with hepatic fibrosis progression in chronic HCV infection, according to a study in Hepatology.
On Twitter @richpizzi
If you work on the front lines of medical care treating patients with hepatitis, you may not have time to review all the hepatitis research that enters the medical literature every month. Here’s a quick look at some notable news items and journal articles published over the past month, covering a variety of the major hepatitis viruses.
A Taiwanese study published in Hepatology demonstrated the importance of identifying and tracking viral mutations for monitoring hepatitis B progression and early detection of hepatocellular carcinoma. The authors found that the mutation score for predicting short-term hepatocellular carcinoma risk outperformed other factors, including hepatitis B virus (HBV) DNA levels, viral genotype, and various combinations of risk factors.
Early combination antiretroviral therapy and wider hepatitis C virus (HCV) treatment have the potential to markedly reduce hepatitis C–related mortality, as well as increase survival overall for HIV-infected populations, according to a recent analysis. However, the authors said HCV treatment will need to be greatly scaled up.
Treating all chronic hepatitis C–screened patients for more than 5 years in France with new direct-acting antivirals, regardless of fibrosis stage, would be cost effective, a report revealed. However, the authors warned this would add a cost of 3.5-7.2 billion euros to an already overburdened medical care system.
Most German adolescents who received a full course of hepatitis B virus booster vaccine during infancy were still protected against hepatitis B infection almost 14 years later, according to a study in Human Vaccines & Immunotherapeutics.
Chronic HCV infection is associated with both former and excessive current alcohol consumption, according to an analysis of data from the 2003-2010 National Health and Nutrition Examination Survey. Researchers said public health HCV strategies should implement interventions with emphasis on alcohol abuse, which negatively impacts disease progression for HCV-infected individuals.
Treating patients with hepatitis delta virus genotype 3 with pegylated interferon alpha-2a was correlated with a possible cure rate higher than expected, according to a study in the International Journal of Infectious Diseases.
Widespread media reports in China of infant deaths following hepatitis B vaccine administration was associated with a decline in parental confidence in a vaccine that had been proved safe, and an increased refusal of vaccination, according to a report in the International Journal of Epidemiology. The authors recommended proactive outreach to stakeholders and the media to help mitigate any negative impact of future coincidental adverse events following immunization.
The platelet-to-lymphocyte ratio (PLR) is closely related to disease severity in patients with HCV-related liver disease and to the virologic response in patients with chronic hepatitis C, a recent study revealed. Investigators said dynamic continuous monitoring of the PLR, rather than a single high or low PLR value at a certain time point, will contribute to disease surveillance, with an increasing tendency predicting a good virologic response.
Ledipasvir/sofosbuvir (LDV/SOF) and sofosbuvir plus ribavirin (SOF+RBV) demonstrate a high barrier to resistance in Japanese patients with HCV genotype 1 and 2 infection, according to a study in the Journal of Viral Hepatitis. The authors said the presence of baseline NS5A resistance–associated variants did not impact treatment outcome in genotype 1 Japanese patients treated with LDV/SOF for 12 weeks.
Multilateral cooperation among Chinese vaccine manufacturers, the Chinese National Regulatory Authorization, and the World Health Organization is expediting the entrance of the hepatitis E vaccine Hecolin into the international market, according to a review in Human Vaccines & Immunotherapeutics.
A study in HIV Medicine found that psychiatric disorders were frequent in HIV/HCV-coinfected patients and their rates comparable between groups, even for patients achieving a sustained virologic response.
A review essay in Current Opinion in Infectious Diseases concluded that patients with recurrent HCV following liver transplant will significantly benefit from all oral new direct-acting antivirals, but that ongoing studies would determine the optimal timing and combination in this unique population.
Health care utilization and costs were higher among patients with diabetes and HBV than in those with diabetes alone, according to a recent study. The authors said the results support the need for HBV vaccination among unvaccinated diabetes patients.
A study in the Journal of Acquried Immune deficiency Syndromes provides additional support for the use of the CD4/CD8 ratio for routine monitoring of immune activation and inflammation in HIV-positive patients, including those coinfected with the hepatitis C virus. However, the authors said an unexpected association between cleared HCV and a lower CD4/CD8 ratio requires additional study.
A study of hepatitis B vaccination found that dosages of both 5-mcg HBV vaccine and 10-mcg HBV vaccine could be used to immunize children safely, while the 10-mcg vaccine could be used for adults aged 15-24 years, and a higher dosage of the HBV vaccine might be required for adults aged 25 years and older.
Levels of the let-7 family of microRNAs circulating in plasma and extracellular vesicles correlate with hepatic fibrosis progression in chronic HCV infection, according to a study in Hepatology.
On Twitter @richpizzi