User login
Atypical Antipsychotics Tied to Adrenal Issues
NEW ORLEANS — It is important to recognize the potential for atypical antipsychotics to cause adrenal insufficiency to ensure that the condition is managed appropriately, according to Dr. Violeta Tan and Dr. Natalie Rasgon.
They described the case of a 54-year-old man with a history of depression and posttraumatic stress disorder who was admitted to the hospital after complaining of malaise 9 days after a previous admission for a urinary tract infection that had been treated with ciprofloxacin.
At the first admission, the patient was restarted on 225 mg/day of bupropion and 300 mg/day of quetiapine (Seroquel), both of which he had discontinued 6–8 months prior, said Dr. Tan and Dr. Rasgon, who presented the case in a poster session at the American Psychiatric Association's Institute of Psychiatric Services.
Symptoms at the time of the second admission included fatigue, warmth, chills, loose stools, mild headache, and reproducible chest wall pain. Laboratory findings showed that previously normal eosinophil levels were elevated (6.5%–8.3%), reported Dr. Tan and Dr. Rasgon, both of Stanford (Calif.) University.
A work-up for infection, malignancy, and rheumatologic conditions was negative, and primary adrenal insufficiency was ruled out based on the findings of a cosyntropin stimulation test. However, adrenocorticotropic hormone (ACTH) levels (less than 5 pg/mL) indicated secondary or tertiary adrenal insufficiency, and a review of the patient's medications alerted the authors to the possibility of quetiapine-associated ACTH and cortisol reductions.
Atypical antipsychotics such as quetiapine can reduce cortisol levels—often in association with improved psychopathology. Thus, although the cortisol-lowering effects of such drugs may ameliorate negative symptomatology, the reduction could be detrimental, they wrote.
However, adrenal insufficiency caused by such agents has not been specifically studied, and although it might seem appropriate to discontinue the “offending agent,” the risks of discontinuing antipsychotics should be weighed against the benefits of preventing adrenal insufficiency sequelae, they added.
In the current case, which also demonstrated that quetiapine administration, particularly under precipitating circumstances such as an infection or stress, can contribute to reductions in ACTH and cortisol secretion, the patient's condition improved after quetiapine, a standard treatment for adrenal insufficiency, was administered at 20 mg every morning and at 10 mg at bedtime.
Atypical antipsychotics can cause adrenal insufficiency, which presents ambiguously, and awareness of this can be key in preventing false diagnoses, they said.
Adrenal insufficiency can present ambiguously, which can lead to false diagnoses. DR. RASGON
Spotting Adrenal Insufficiency
Dr. Tan and Dr. Rasgon say determining whether a patient has developed adrenal insufficiency requires an investigation into four areas:
▸ Symptoms. Look for weakness and fatigue, abdominal distress, anorexia, nausea, vomiting, myalgia or arthralgia, postural dizziness, salt craving, headache, impaired memory, and depression.
▸ Physical findings. Some factors to look out for are increased pigmentation, postural hypotension, tachycardia, fever, decreased body hair, vitiligo, amenorrhea, and cold intolerance.
▸ Laboratory findings. Red flags include hyponatremia, hyperkalemia, hypoglycemia, eosinophilia, and elevated thyroid stimulating hormone.
▸ Clinical problems. Watch for hemodynamic instability, ongoing inflammation, multiple-organ dysfunction, and hypoglycemia.

Seventy-Five Percent of Total Energy Intake Comes From Ultra-Processed Foods Among a Sample of Veterans With Overweight and Obesity: An Exploratory Analysis of Three-Day Food Records
Seventy-Five Percent of Total Energy Intake Comes From Ultra-Processed Foods Among a Sample of Veterans With Overweight and Obesity: An Exploratory Analysis of Three-Day Food Records
Roughly 8.6% of the 17.4 million US veterans live in poverty. About 11.1% are considered food insecure (ie, unable to acquire adequate food for ≥1 household members), with another 5.3% considered very food insecure (ie, eating patterns of ≥1 household members were disrupted and their food intake was reduced at least some time during the year). Compared with nonveterans, veterans are 7.4% more likely to be food insecure.1 This high prevalence of food insecurity and poverty has a negative impact on veteran diets.
Veterans’ diets contained more added sugars and solid fats and scored lower compared with nonveterans when assessed for diet quality with the Healthy Eating Index.2 Veterans have a higher prevalence of diet-related chronic disease, including diabetes, hypertension, and obesity compared with the nonveterans.3-5 Given the critical role of diet in health and disease risk, enhancing diet quality among veterans has garnered significant attention and calls to action.2,6,7 While there are many factors that contribute to diet, any veteran can receive a consultation or self-refer to receive nutrition counseling effective for improving diet quality, within the US Department of Veterans Affairs (VA).
The NOVA food classification system describes diet quality by categorizing food items by processing methods and ingredients into 4 food groups.8 The first is unprocessed and minimally processed items (MPFs) such as fresh fruits, vegetables, and meats. MPFs consist of whole foods which can also be minimally processed (eg, chopping, drying, grinding, heating, chilling). Culinary processed foods (CPFs) are processed foods for cooking (eg, salt, butter, and vinegar) and are typically eaten in small quantities along with MPFs. Processed foods (PRFs) include canned and smoked foods, while ultra-processed foods (UPFs) are distinguished by industrial ingredients, requiring specialized tools and processing techniques, and hyper-palatability related to color, flavor, and packaging.8 Examples of UPFs include mass-produced breads found at grocery stores, prepackaged snacks and meals, and hydrogenated oils. UPF consumption is associated with higher risk for negative cardiometabolic outcomes, common mental disorders, and all-cause mortality.9 To date, only a study by Powell et al has used the NOVA classification system in a veteran population, and it was limited to a comparison of the price of UPFs and veteran body mass index (BMI).10 Therefore, it remains unknown what percentage of total energy intake (TEI) comes from UPFs in the diets of veterans.
This study sought to quantify the proportion of TEI from UPFs among a sample of patients from the VA Phoenix Health Care System (VAPHCS). Results from a 2021 global meta-analysis reveal that the US and United Kingdom have the highest intakes of UPFs in the world.11 Specifically, within the US, 15 studies with 234,890 participants reveal that the majority of TEI (about 55%) comes from UPFs.11 We hypothesized that this veteran sample would have a higher proportion of TEI from UPFs, possibly due to a higher prevalence of poverty and food insecurity among veterans compared with nonveterans.1 If the percentage of TEI coming from UPF is higher or even similar to nonveterans, further efforts to increase veterans’ use of the available nutritional services would be warranted to minimize nutrition-related disease among veterans.
Methods
This is a cross-sectional, secondary data analysis of baseline 3-day food records collected from 2017 to 2020 from 92 patients recruited at VAPHCS to participate in a whole-food plant-based diet study.12 The original study was reviewed and approved by the VAPHCS Institutional Review Board (1593830). Recruitment methods included clinician recommendation, a recorded advertisement played while phone calls were on hold, and flyers distributed throughout VAPHCS. Patients were included if they were aged 18 to 90 years, had a BMI 25.1 to 39.9, had a diagnosis of nutrition-related chronic disease (hypertension, diabetes, or hyperlipidemia), an interest and desire to make a lifestyle change, active telephone contact information (either landline or cell phone), no contraindication to be on a whole-food plant-based diet, access to transportation and a functioning kitchen, ability to prepare meals independently, access to a computer or tablet with internet access, and a digital camera or smartphone. Exclusion criteria included significant unplanned weight loss within 6 months, uncontrolled insulin-dependent diabetes with a current hemoglobin A1c > 9%, pregnancy/lactation, taking prescribed weight loss medication, currently following a diet (eg, plant-based diet, vegan, or medical weight loss program diet), celiac disease diagnosed within 6 months, end-stage hepatic disease or renal disease requiring dialysis, active cancer or receiving chemotherapy or radiation therapy, active alcohol or substance use disorder, history of eating disorders, fasting triglyceride level > 350 mg/dL, any psychological issues that prevent adherence, inability to speak English, limited mobility, and homeless or in housing with limited kitchen access. A baseline 3-day food record was collected from the participants and used in this secondary analysis.
Diet Analysis
Food records were analyzed using Esha Research Food Processor 4.0 to identify calorie and macronutrient information. To limit bias, food items were coded independently by 2 researchers into 4 food processing groups determined by the NOVA classification: MPF, CPF, PRF, and UPF.8 When possible, specific ingredient information was collected using internet searches for brand product websites. Initial coding had an 89% agreement rate for food item coding between the 2 researchers. As coding was done in duplicate, a third researcher resolved disagreements. The number of food items for each processing group was determined and the mean (SD) percentage of TEI for each NOVA group was provided across participants. A 1-way analysis of variance and Tukey Multiple Comparisons Test were used to determine significance between groups with an α = .05 using Prism V9.
Results
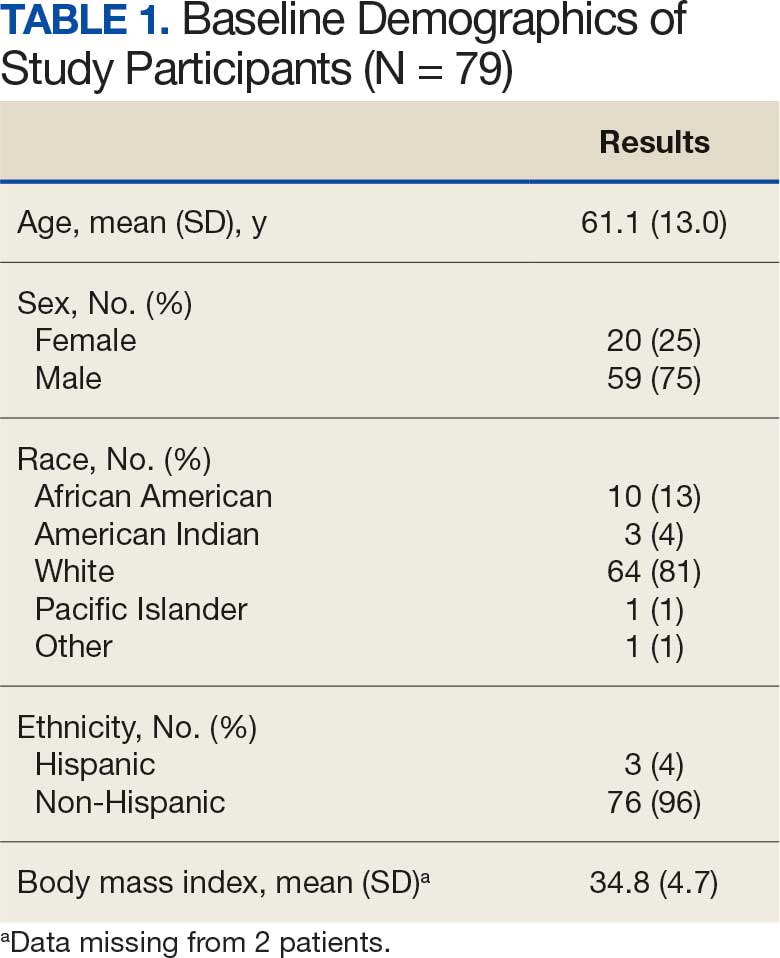
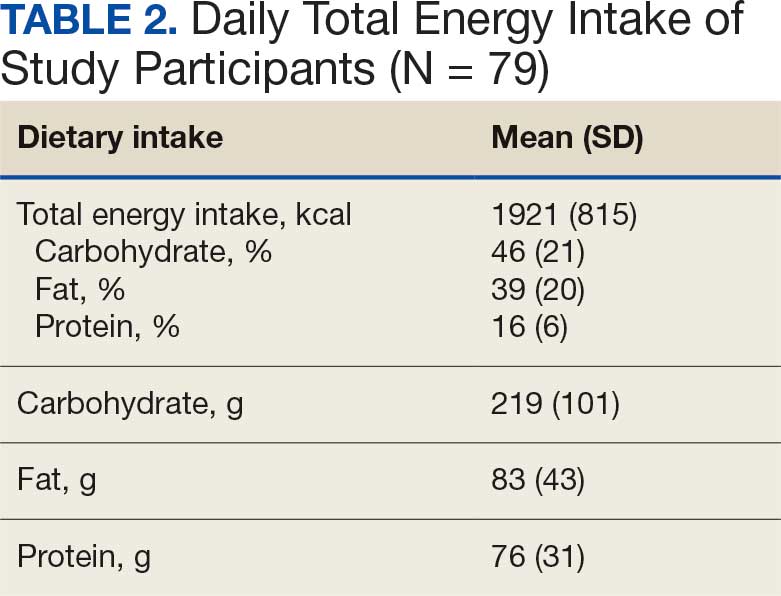
Of the 92 participants in the original study, only 79 met inclusion criteria and had baseline diet data. The 79 veterans had a mean (SD) age of 61 (13) years and 59 (75%) were male (Table 1). Mean (SD) TEI was 1921 (815) kcal. The mean (SD) percentage of calories from carbohydrate, fat, and protein were 46% (21%), 39% (20%), and 16% (6%), respectively (Table 2).
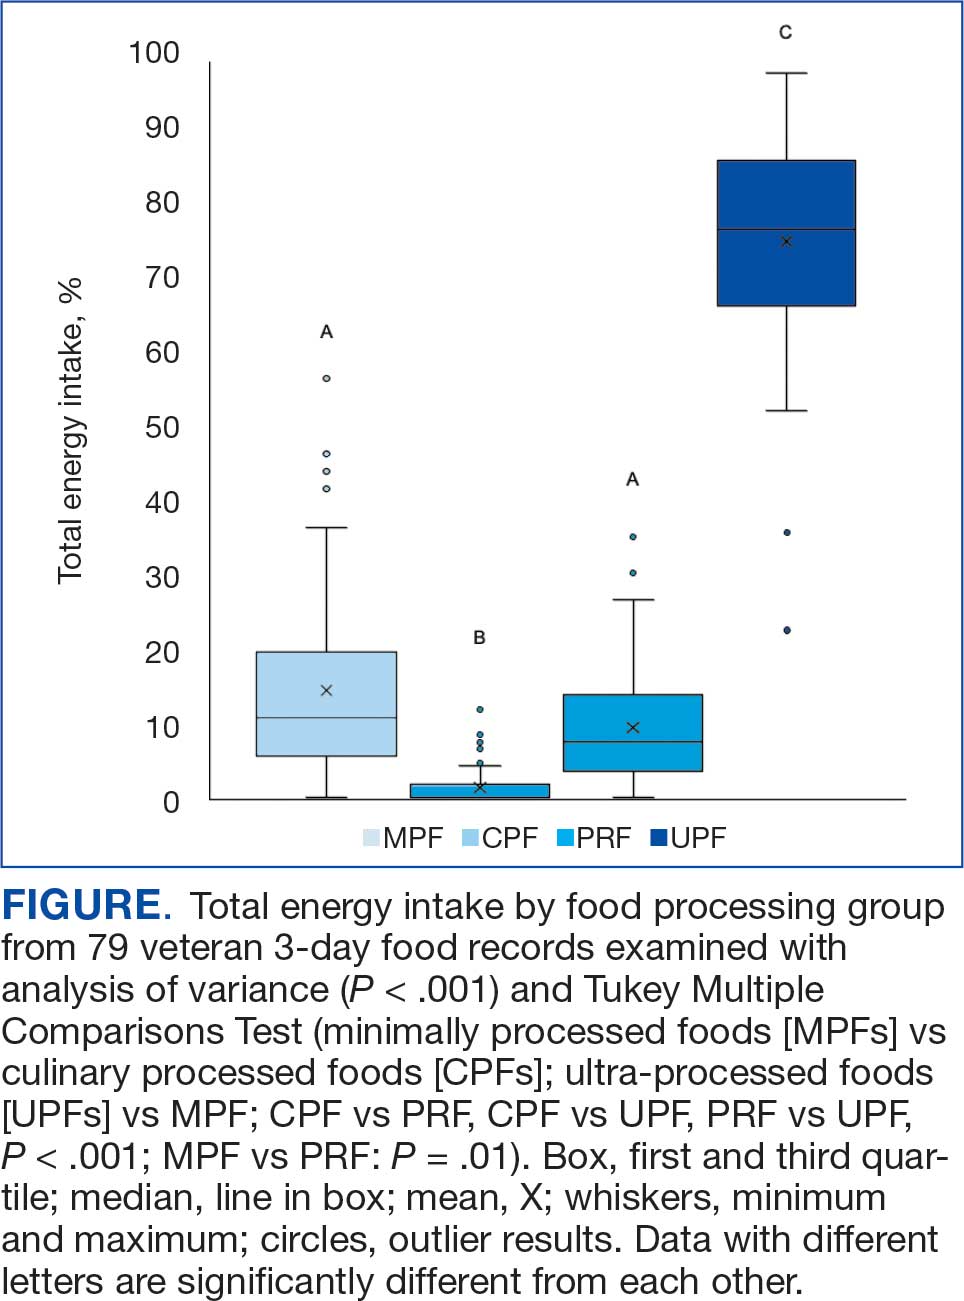
A mean (SD) of 36 (12) food items were analyzed from the 3-day food records. The majority of food items were UPFs (56%), 33% were MPFs, 8% were PRFs, and 3% were CPFs. In total, 75% of TEI came from UPFs (P < .001); only 14% of TEI came from minimally processed foods (Figure).
Discussion
To our knowledge, this is the first analysis of UPF consumption among US veterans. TEIs coming from UPFs appear to be about 20% higher among veterans compared to nonveterans: 75% vs 55%.11 Coupled with high UPF consumption, MPFs (14%) and PRFs (9%) represent smaller sources of TEI among surveyed veterans. Top caloric sources of UPFs in the US include sandwiches (including burgers), sweet bakery products, savory snacks, pizza, sweetened beverages, and breads, rolls, and tortillas, and likely reflect the major sources of UPFs in the veteran diet.13 As the statistical comparison between the veteran data and nonveteran data is not feasible in the present study, a future study with a much larger sample size would be needed for a direct comparison.
While the exact cause of higher UPF consumption among sampled veterans remains unknown and likely multifactorial (eg, cost, food insecurity, access, cooking skills, nutrition knowledge), veterans can receive a consult or self-refer to a registered dietitian nutritionist (RDN) for nutrition education. Counseling has been shown to be an effective way to improve diet quality and increase daily fruit and vegetable intake.14 High consumption of UPFs, which are generally energy-dense and nutrient-poor, contributes to the low diet quality observed in veterans, and future research examining the relationship between UPF intake and overall diet quality among veterans is warranted.2,15 As nutrition knowledge is associated with higher diet quality among veterans, increased use of nutrition services (ie, nutrition education or food supplement programs) has the potential to influence consumption of MPFs and decrease consumption of UPFs.16 Subsequently, UPF-targeted interventions developed by VA RDNs hold the promise to decrease consumption of UPFs and increase intake of MPFs and PRFs.
Veterans have a high prevalence of diabetes, hypertension, and obesity.9 The high UPF intake observed in this sample of veterans may increase the risk for these chronic diseases and overall mortality. The high percentage of TEI from UPFs among veterans is also of concern not only due to potential negative health outcomes, but also associated costs of treating veterans with multimorbidities.17 Targeting UPF intake via nutritional education may promote health and decrease the financial burden needed to support the health of veterans.
Improving veteran health and well-being, including enhancing health care accessibility in underserved areas, are pivotal objectives of the VA strategic plan for 2026 to 2030. Public policy aims to tackle food insecurity within the veteran population during the first 5 years of civilian life.18 In alignment with the White House Strategy on Hunger, Nutrition, and Health, VA established a Food Security Office (FSO) in 2023. The FSO mission is to use an interdisciplinary approach to provide resources to ensure veteran food security and create an environment where all veterans are food and nutrition secure.
Limitations
This study has several limitations. As the Food Processor software database does not include all brand items, similar brands were used to mirror the nutrient profile. While food records are common among veteran diet studies, accuracy may be reduced due to self-reporting bias.19 Different interpretation of the NOVA classification designation for various food items is possible, however, 89% of foods were coded the same by the research team which suggests high accuracy in food coding. Specific ingredient information was not collected from the 3-day food records; thus, these records were not produced in such a way to improve the accuracy of the NOVA classification designation. This study was limited by its small sample size (N = 79); although, this analysis is larger than other studies of UPF consumption in the US.20,21 In addition, the generalizability of this study is limited as this population sample was from a single VA hospital and may not reflect the overall veteran population. Participants in this study were recruited only from those receiving VA care, thus their diet quality may not represent the quality consumed by veterans not participating in VA services. Further research on UPF consumption among veterans is warranted with a larger, more representative study sample size.
Conclusions
As this is the highest observed UPF intake documented in the US, these results should be of concern for the VA and its RDNs. More research is needed to better understand why UPF consumption is so high among veterans, what barriers veterans face to decreasing UPF consumption, and what intervention(s) veterans would welcome to improve their diet quality. Presently, veterans are provided with access to a variety of effective nutrition education and counseling options and should be encouraged to use these services. VA RDNs should be aware of the high intake of UPFs in the veteran population and familiarize themselves with education and counseling strategies that promote behavior change to replace UPFs with more nutrient-dense foods choices.
- Rabbitt MP, Smith MD. Food insecurity among workingage veterans. US Dept of Agriculture, Economic Research Service; 2021. Accessed January 26, 2026. https://www.ers.usda.gov/publications/pub-details/?pubid=101268
- Dong D, Stewart H, Carlson AC. An examination of veterans’ diet quality. US Dept of Agriculture, Economic Research Service; 2019. Accessed January 26, 2026. https:// www.ers.usda.gov/publications/pub-details/?pubid=95608
- US Department of Veterans Affairs; US Department of Defense. VA/DoD clinical practice guideline for the management of adult overweight and obesity. 2020. Accessed January 26, 2026. https://www.healthquality.va.gov/guidelines/cd/obesity/
- US Department of Veterans Affairs; US Department of Defense. VA/DoD clinical practice guideline for the management of type 2 diabetes mellitus in primary care. 2023. Accessed January 26, 2026. https://www.healthquality.va.gov/guidelines/cd/diabetes/
- Boersma P, Cohen R, Zelaya C, et al. Multiple chronic conditions among veterans and nonveterans: United States, 2015–2018. Natl Health Stat Rep. 2021. doi:10.15620/cdc:101659
- Hoerster KD, Wilson S, Nelson KM, et al. Diet quality is associated with mental health, social support, and neighborhood factors among veterans. Eat Behav. 2016;23:168- 173. doi:10.1016/j.eatbeh.2016.10.003
- Becerra MB, Hassija CM, Becerra BJ. Food insecurity is associated with unhealthy dietary practices among US veterans in California. Public Health Nutr. 2017;20:2569-2576. doi:10.1017/S1368980016002147
- Monteiro CA, Cannon G, Levy RB, et al. Ultra-processed foods: what they are and how to identify them. Public Health Nutr. 2019;22:936-941. doi:10.1017/S1368980018003762
- Lane MM, Gamage E, Du S, et al. Ultra-processed food exposure and adverse health outcomes: umbrella review of epidemiological meta-analyses. BMJ. February 2024:e077310. doi:10.1136/bmj-2023-077310
- Powell LM, Jones K, Duran AC, et al. The price of ultra-processed foods and beverages and adult body weight: Evidence from U.S. veterans. Econ Hum Biol. 2019;34:39- 48. doi:10.1016/j.ehb.2019.05.006
- Marino M, Puppo F, Del Bo’ C, et al. A systematic review of worldwide consumption of ultra-processed foods: findings and criticisms. Nutrients. 2021;13. doi:10.3390/nu13082778
- Parrington D, Kurtz J, Fawcett J, et al. Pilot study on the effects of a whole-food, plant-strong diet on cardiovascular risk factors in veterans: part 3. Curr Dev Nutr. 2022;6:385. doi:10.1093/cdn/nzac054.040
- Williams AM, Couch CA, Emmerich SD, et al. Ultra-processed Food Consumption in Youth and Adults: United States, August 2021-August 2023. NCHS Data Brief. 2025. doi:10.15620/cdc/174612
- Serra MC, Addison O, Giffuni J, et al. Changes in self-reported fruit and vegetable intake following nutritional modification in high risk older veterans. J Nutr Gerontol Geriatr. 2021;40:1-8. doi:10.1080/21551197.2020.1863892
- Gupta S, Hawk T, Aggarwal A, et al. Characterizing ultra-processed foods by energy density, nutrient density, and cost. Front Nutr. 2019;6:1-9. doi:10.3389/fnut.2019.00070
- Robinson LA, Colin CR, Smith KS, et al. Diet quality is associated with nutrition knowledge and physical activity in the US military veterans enrolled in university programmes. BMJ Mil Heal. 2023:e002525. doi:10.1136/military-2023-002525
- Yoon J, Zulman D, Scott JY, et al. Costs associated with multimorbidity among VA patients. Med Care. 2014;52:S31-6. doi:10.1097/MLR.0000000000000061
- End Veteran Hunger Act of 2022, H.R. 8852, 117th Cong. (2022). Accessed January 26, 2026. https://www.congress.gov/bill/117th-congress/house-bill/8852.
- Collins RA, Baker B, Coyle DH, et al. Dietary assessment methods in military and veteran populations: a scoping review. Nutrients. 2020;12:1-21. doi:10.3390/nu12030769
- Smiljanec K, Mbakwe AU, Ramos-Gonzalez M, et al. Associations of ultra-processed and unprocessed/minimally processed food consumption with peripheral and central hemodynamics, and arterial stiffness in young healthy adults. Nutrients. 2020;12. doi:10.3390/nu12113229
- Rohatgi KW, Tinius RA, Cade WT, et al. Relationships between consumption of ultra-processed foods, gestational weight gain and neonatal outcomes in a sample of US pregnant women. PeerJ. 2017;5:e4091. doi:10.7717/peerj.4091
Roughly 8.6% of the 17.4 million US veterans live in poverty. About 11.1% are considered food insecure (ie, unable to acquire adequate food for ≥1 household members), with another 5.3% considered very food insecure (ie, eating patterns of ≥1 household members were disrupted and their food intake was reduced at least some time during the year). Compared with nonveterans, veterans are 7.4% more likely to be food insecure.1 This high prevalence of food insecurity and poverty has a negative impact on veteran diets.
Veterans’ diets contained more added sugars and solid fats and scored lower compared with nonveterans when assessed for diet quality with the Healthy Eating Index.2 Veterans have a higher prevalence of diet-related chronic disease, including diabetes, hypertension, and obesity compared with the nonveterans.3-5 Given the critical role of diet in health and disease risk, enhancing diet quality among veterans has garnered significant attention and calls to action.2,6,7 While there are many factors that contribute to diet, any veteran can receive a consultation or self-refer to receive nutrition counseling effective for improving diet quality, within the US Department of Veterans Affairs (VA).
The NOVA food classification system describes diet quality by categorizing food items by processing methods and ingredients into 4 food groups.8 The first is unprocessed and minimally processed items (MPFs) such as fresh fruits, vegetables, and meats. MPFs consist of whole foods which can also be minimally processed (eg, chopping, drying, grinding, heating, chilling). Culinary processed foods (CPFs) are processed foods for cooking (eg, salt, butter, and vinegar) and are typically eaten in small quantities along with MPFs. Processed foods (PRFs) include canned and smoked foods, while ultra-processed foods (UPFs) are distinguished by industrial ingredients, requiring specialized tools and processing techniques, and hyper-palatability related to color, flavor, and packaging.8 Examples of UPFs include mass-produced breads found at grocery stores, prepackaged snacks and meals, and hydrogenated oils. UPF consumption is associated with higher risk for negative cardiometabolic outcomes, common mental disorders, and all-cause mortality.9 To date, only a study by Powell et al has used the NOVA classification system in a veteran population, and it was limited to a comparison of the price of UPFs and veteran body mass index (BMI).10 Therefore, it remains unknown what percentage of total energy intake (TEI) comes from UPFs in the diets of veterans.
This study sought to quantify the proportion of TEI from UPFs among a sample of patients from the VA Phoenix Health Care System (VAPHCS). Results from a 2021 global meta-analysis reveal that the US and United Kingdom have the highest intakes of UPFs in the world.11 Specifically, within the US, 15 studies with 234,890 participants reveal that the majority of TEI (about 55%) comes from UPFs.11 We hypothesized that this veteran sample would have a higher proportion of TEI from UPFs, possibly due to a higher prevalence of poverty and food insecurity among veterans compared with nonveterans.1 If the percentage of TEI coming from UPF is higher or even similar to nonveterans, further efforts to increase veterans’ use of the available nutritional services would be warranted to minimize nutrition-related disease among veterans.
Methods
This is a cross-sectional, secondary data analysis of baseline 3-day food records collected from 2017 to 2020 from 92 patients recruited at VAPHCS to participate in a whole-food plant-based diet study.12 The original study was reviewed and approved by the VAPHCS Institutional Review Board (1593830). Recruitment methods included clinician recommendation, a recorded advertisement played while phone calls were on hold, and flyers distributed throughout VAPHCS. Patients were included if they were aged 18 to 90 years, had a BMI 25.1 to 39.9, had a diagnosis of nutrition-related chronic disease (hypertension, diabetes, or hyperlipidemia), an interest and desire to make a lifestyle change, active telephone contact information (either landline or cell phone), no contraindication to be on a whole-food plant-based diet, access to transportation and a functioning kitchen, ability to prepare meals independently, access to a computer or tablet with internet access, and a digital camera or smartphone. Exclusion criteria included significant unplanned weight loss within 6 months, uncontrolled insulin-dependent diabetes with a current hemoglobin A1c > 9%, pregnancy/lactation, taking prescribed weight loss medication, currently following a diet (eg, plant-based diet, vegan, or medical weight loss program diet), celiac disease diagnosed within 6 months, end-stage hepatic disease or renal disease requiring dialysis, active cancer or receiving chemotherapy or radiation therapy, active alcohol or substance use disorder, history of eating disorders, fasting triglyceride level > 350 mg/dL, any psychological issues that prevent adherence, inability to speak English, limited mobility, and homeless or in housing with limited kitchen access. A baseline 3-day food record was collected from the participants and used in this secondary analysis.
Diet Analysis
Food records were analyzed using Esha Research Food Processor 4.0 to identify calorie and macronutrient information. To limit bias, food items were coded independently by 2 researchers into 4 food processing groups determined by the NOVA classification: MPF, CPF, PRF, and UPF.8 When possible, specific ingredient information was collected using internet searches for brand product websites. Initial coding had an 89% agreement rate for food item coding between the 2 researchers. As coding was done in duplicate, a third researcher resolved disagreements. The number of food items for each processing group was determined and the mean (SD) percentage of TEI for each NOVA group was provided across participants. A 1-way analysis of variance and Tukey Multiple Comparisons Test were used to determine significance between groups with an α = .05 using Prism V9.
Results
Of the 92 participants in the original study, only 79 met inclusion criteria and had baseline diet data. The 79 veterans had a mean (SD) age of 61 (13) years and 59 (75%) were male (Table 1). Mean (SD) TEI was 1921 (815) kcal. The mean (SD) percentage of calories from carbohydrate, fat, and protein were 46% (21%), 39% (20%), and 16% (6%), respectively (Table 2).
A mean (SD) of 36 (12) food items were analyzed from the 3-day food records. The majority of food items were UPFs (56%), 33% were MPFs, 8% were PRFs, and 3% were CPFs. In total, 75% of TEI came from UPFs (P < .001); only 14% of TEI came from minimally processed foods (Figure).
Discussion
To our knowledge, this is the first analysis of UPF consumption among US veterans. TEIs coming from UPFs appear to be about 20% higher among veterans compared to nonveterans: 75% vs 55%.11 Coupled with high UPF consumption, MPFs (14%) and PRFs (9%) represent smaller sources of TEI among surveyed veterans. Top caloric sources of UPFs in the US include sandwiches (including burgers), sweet bakery products, savory snacks, pizza, sweetened beverages, and breads, rolls, and tortillas, and likely reflect the major sources of UPFs in the veteran diet.13 As the statistical comparison between the veteran data and nonveteran data is not feasible in the present study, a future study with a much larger sample size would be needed for a direct comparison.
While the exact cause of higher UPF consumption among sampled veterans remains unknown and likely multifactorial (eg, cost, food insecurity, access, cooking skills, nutrition knowledge), veterans can receive a consult or self-refer to a registered dietitian nutritionist (RDN) for nutrition education. Counseling has been shown to be an effective way to improve diet quality and increase daily fruit and vegetable intake.14 High consumption of UPFs, which are generally energy-dense and nutrient-poor, contributes to the low diet quality observed in veterans, and future research examining the relationship between UPF intake and overall diet quality among veterans is warranted.2,15 As nutrition knowledge is associated with higher diet quality among veterans, increased use of nutrition services (ie, nutrition education or food supplement programs) has the potential to influence consumption of MPFs and decrease consumption of UPFs.16 Subsequently, UPF-targeted interventions developed by VA RDNs hold the promise to decrease consumption of UPFs and increase intake of MPFs and PRFs.
Veterans have a high prevalence of diabetes, hypertension, and obesity.9 The high UPF intake observed in this sample of veterans may increase the risk for these chronic diseases and overall mortality. The high percentage of TEI from UPFs among veterans is also of concern not only due to potential negative health outcomes, but also associated costs of treating veterans with multimorbidities.17 Targeting UPF intake via nutritional education may promote health and decrease the financial burden needed to support the health of veterans.
Improving veteran health and well-being, including enhancing health care accessibility in underserved areas, are pivotal objectives of the VA strategic plan for 2026 to 2030. Public policy aims to tackle food insecurity within the veteran population during the first 5 years of civilian life.18 In alignment with the White House Strategy on Hunger, Nutrition, and Health, VA established a Food Security Office (FSO) in 2023. The FSO mission is to use an interdisciplinary approach to provide resources to ensure veteran food security and create an environment where all veterans are food and nutrition secure.
Limitations
This study has several limitations. As the Food Processor software database does not include all brand items, similar brands were used to mirror the nutrient profile. While food records are common among veteran diet studies, accuracy may be reduced due to self-reporting bias.19 Different interpretation of the NOVA classification designation for various food items is possible, however, 89% of foods were coded the same by the research team which suggests high accuracy in food coding. Specific ingredient information was not collected from the 3-day food records; thus, these records were not produced in such a way to improve the accuracy of the NOVA classification designation. This study was limited by its small sample size (N = 79); although, this analysis is larger than other studies of UPF consumption in the US.20,21 In addition, the generalizability of this study is limited as this population sample was from a single VA hospital and may not reflect the overall veteran population. Participants in this study were recruited only from those receiving VA care, thus their diet quality may not represent the quality consumed by veterans not participating in VA services. Further research on UPF consumption among veterans is warranted with a larger, more representative study sample size.
Conclusions
As this is the highest observed UPF intake documented in the US, these results should be of concern for the VA and its RDNs. More research is needed to better understand why UPF consumption is so high among veterans, what barriers veterans face to decreasing UPF consumption, and what intervention(s) veterans would welcome to improve their diet quality. Presently, veterans are provided with access to a variety of effective nutrition education and counseling options and should be encouraged to use these services. VA RDNs should be aware of the high intake of UPFs in the veteran population and familiarize themselves with education and counseling strategies that promote behavior change to replace UPFs with more nutrient-dense foods choices.
- Rabbitt MP, Smith MD. Food insecurity among workingage veterans. US Dept of Agriculture, Economic Research Service; 2021. Accessed January 26, 2026. https://www.ers.usda.gov/publications/pub-details/?pubid=101268
- Dong D, Stewart H, Carlson AC. An examination of veterans’ diet quality. US Dept of Agriculture, Economic Research Service; 2019. Accessed January 26, 2026. https:// www.ers.usda.gov/publications/pub-details/?pubid=95608
- US Department of Veterans Affairs; US Department of Defense. VA/DoD clinical practice guideline for the management of adult overweight and obesity. 2020. Accessed January 26, 2026. https://www.healthquality.va.gov/guidelines/cd/obesity/
- US Department of Veterans Affairs; US Department of Defense. VA/DoD clinical practice guideline for the management of type 2 diabetes mellitus in primary care. 2023. Accessed January 26, 2026. https://www.healthquality.va.gov/guidelines/cd/diabetes/
- Boersma P, Cohen R, Zelaya C, et al. Multiple chronic conditions among veterans and nonveterans: United States, 2015–2018. Natl Health Stat Rep. 2021. doi:10.15620/cdc:101659
- Hoerster KD, Wilson S, Nelson KM, et al. Diet quality is associated with mental health, social support, and neighborhood factors among veterans. Eat Behav. 2016;23:168- 173. doi:10.1016/j.eatbeh.2016.10.003
- Becerra MB, Hassija CM, Becerra BJ. Food insecurity is associated with unhealthy dietary practices among US veterans in California. Public Health Nutr. 2017;20:2569-2576. doi:10.1017/S1368980016002147
- Monteiro CA, Cannon G, Levy RB, et al. Ultra-processed foods: what they are and how to identify them. Public Health Nutr. 2019;22:936-941. doi:10.1017/S1368980018003762
- Lane MM, Gamage E, Du S, et al. Ultra-processed food exposure and adverse health outcomes: umbrella review of epidemiological meta-analyses. BMJ. February 2024:e077310. doi:10.1136/bmj-2023-077310
- Powell LM, Jones K, Duran AC, et al. The price of ultra-processed foods and beverages and adult body weight: Evidence from U.S. veterans. Econ Hum Biol. 2019;34:39- 48. doi:10.1016/j.ehb.2019.05.006
- Marino M, Puppo F, Del Bo’ C, et al. A systematic review of worldwide consumption of ultra-processed foods: findings and criticisms. Nutrients. 2021;13. doi:10.3390/nu13082778
- Parrington D, Kurtz J, Fawcett J, et al. Pilot study on the effects of a whole-food, plant-strong diet on cardiovascular risk factors in veterans: part 3. Curr Dev Nutr. 2022;6:385. doi:10.1093/cdn/nzac054.040
- Williams AM, Couch CA, Emmerich SD, et al. Ultra-processed Food Consumption in Youth and Adults: United States, August 2021-August 2023. NCHS Data Brief. 2025. doi:10.15620/cdc/174612
- Serra MC, Addison O, Giffuni J, et al. Changes in self-reported fruit and vegetable intake following nutritional modification in high risk older veterans. J Nutr Gerontol Geriatr. 2021;40:1-8. doi:10.1080/21551197.2020.1863892
- Gupta S, Hawk T, Aggarwal A, et al. Characterizing ultra-processed foods by energy density, nutrient density, and cost. Front Nutr. 2019;6:1-9. doi:10.3389/fnut.2019.00070
- Robinson LA, Colin CR, Smith KS, et al. Diet quality is associated with nutrition knowledge and physical activity in the US military veterans enrolled in university programmes. BMJ Mil Heal. 2023:e002525. doi:10.1136/military-2023-002525
- Yoon J, Zulman D, Scott JY, et al. Costs associated with multimorbidity among VA patients. Med Care. 2014;52:S31-6. doi:10.1097/MLR.0000000000000061
- End Veteran Hunger Act of 2022, H.R. 8852, 117th Cong. (2022). Accessed January 26, 2026. https://www.congress.gov/bill/117th-congress/house-bill/8852.
- Collins RA, Baker B, Coyle DH, et al. Dietary assessment methods in military and veteran populations: a scoping review. Nutrients. 2020;12:1-21. doi:10.3390/nu12030769
- Smiljanec K, Mbakwe AU, Ramos-Gonzalez M, et al. Associations of ultra-processed and unprocessed/minimally processed food consumption with peripheral and central hemodynamics, and arterial stiffness in young healthy adults. Nutrients. 2020;12. doi:10.3390/nu12113229
- Rohatgi KW, Tinius RA, Cade WT, et al. Relationships between consumption of ultra-processed foods, gestational weight gain and neonatal outcomes in a sample of US pregnant women. PeerJ. 2017;5:e4091. doi:10.7717/peerj.4091
Seventy-Five Percent of Total Energy Intake Comes From Ultra-Processed Foods Among a Sample of Veterans With Overweight and Obesity: An Exploratory Analysis of Three-Day Food Records
Seventy-Five Percent of Total Energy Intake Comes From Ultra-Processed Foods Among a Sample of Veterans With Overweight and Obesity: An Exploratory Analysis of Three-Day Food Records
Streamlined Testosterone Order Template to Improve the Diagnosis and Evaluation of Hypogonadism in Veterans
Streamlined Testosterone Order Template to Improve the Diagnosis and Evaluation of Hypogonadism in Veterans
Testosterone therapy is administered following pragmatic diagnostic evaluation and workup to assess whether an adult male is hypogonadal, based on symptoms consistent with androgen deficiency and low morning serum testosterone concentrations on ≥ 2 occasions. Effects of testosterone administration include the development or maintenance of secondary sexual characteristics and increases in libido, muscle strength, fat-free mass, and bone density.
Testosterone prescriptions have markedly increased in the past 20 years, including within the US Department of Veterans Affairs (VA) health care system.1-3 This trend may be influenced by various factors, including patient perceptions of benefit, an increase in marketing, and the availability of more user-friendly formulations.
Since 2006, evidence-based clinical practice guidelines have recommended specific clinical and laboratory evaluation and counseling prior to starting testosterone replacement therapy (TRT).4-8 However, research has shown poor adherence to these recommendations, including at the VA, which raises concerns about inappropriate TRT initiation without proper diagnostic evaluation.9,10 Observational research has suggested a possible link between testosterone therapy and increased risk of cardiovascular (CV) events. The US Food and Drug Administration prescribing information includes boxed warnings about potential risks of high blood pressure, myocardial infarction, stroke, and CV-related mortality with testosterone treatment, contact transfer of transdermal testosterone, and pulmonary oil microembolism with testosterone undecanoate injections.11-15
A VA Office of Inspector General (OIG) review of VA clinician adherence to clinical and laboratory evaluation guidelines for testosterone deficiency found poor adherence among VA practitioners and made recommendations for improvement.4,15 These focused on establishing clinical signs and symptoms consistent with testosterone deficiency, confirming hypogonadism by repeated testosterone testing, determining the etiology of hypogonadism by measuring gonadotropins, initiating a discussion of risks and benefits of TRT, and assessing clinical improvement and obtaining an updated hematocrit test within 3 to 6 months of initiation.
The VA Puget Sound Health Care System (VAPSHCS) developed a local prior authorization template to assist health care practitioners (HCPs) to address the OIG recommendations. This testosterone order template (TOT) aimed to improve the diagnosis, evaluation, and monitoring of TRT in males with hypogonadism, combined with existing VA pharmacy criteria for the use of testosterone based on Endocrine Society guidelines. A version of the VAPSHCS TOT was approved as the national VA Computerized Patient Record System (CPRS) template.
Preliminary evaluation of the TOT suggested improved short-term adherence to guideline recommendations following implementation.16 This quality improvement study sought to assess the long-term effectiveness of the TOT with respect to clinical practice guideline adherence. The OIG did not address prostate-specific antigen (PSA) monitoring because understanding of the relationship between TRT and the risks of elevated PSA levels remains incomplete.6,17 This project hypothesized that implementation of a pharmacy-managed TOT incorporated into CPRS would result in higher adherence rates to guideline-recommended clinical and laboratory evaluation, in addition to counseling of men with hypogonadism prior to initiation of TRT.
Methods
Eligible participants were cisgender males who received a new testosterone prescription, had ≥ 2 clinic visits at VAPSHCS, and no previous testosterone prescription in the previous 2 years. Individuals were excluded if they had testosterone administered at VAPSHCS; were prescribed testosterone at another facility (VA or community-based); pilot tested an initial version of the TOT prior to November 30, 2019; or had an International Classification of Diseases, Tenth Revision codes for hypopituitarism, gender identity disorder, history of sexual assignment, or Klinefelter syndrome for which testosterone therapy was already approved. Patients who met the inclusion criteria were identified by an algorithm developed by the VAPSHCS pharmacoeconomist.
This quality improvement project used a retrospective, pre-post experimental design. Electronic chart review and systematic manual review of all eligible patient charts were performed for the pretemplate period (December 1, 2018, to November 30, 2019) and after the template implementation, (December 1, 2021, to November 30, 2022).
An initial version of the TOT was implemented on July 1, 2019, but was not fully integrated into CPRS until early 2020; individuals in whom the TOT was used prior to November 30, 2019, were excluded. Data from the initial period of the COVID-19 pandemic were avoided because of alterations in clinic and prescribing practices. As a quality improvement project, the TOT evaluation was exempt from formal review by the VAPSHCS Institutional Review Board, as determined by the Director of the Office of Transformation/Quality/Safety/Value.
Interventions
Testosterone is a Schedule III controlled substance with potential risks and a propensity for varied prescribing practices. It was designated as a restricted drug requiring a prior authorization drug request (PADR) for which a specific TOT was developed, approved by the VAPSHCS Pharmacy and Therapeutics Committee, and incorporated into CPRS. A team of pharmacists, primary care physicians, geriatricians, endocrinologists, and health informatics experts created and developed the TOT. Pharmacists managed and monitored its completion.
The process for prescribing testosterone via the TOT is outlined in the eAppendix. When an HCP orders testosterone in CPRS, reminders prompt them to use the TOT and indicate required laboratory measurements (an order set is provided). Completion of TOT is not necessary to order testosterone for patients with an existing diagnosis of an organic cause of hypogonadism (eg, Klinefelter syndrome or hypopituitarism) or transgender women (assigned male at birth). In the TOT, the prescriber must also indicate signs and symptoms of testosterone deficiency; required laboratory tests; and counseling regarding potential risks and benefits of TRT. A pharmacist reviews the TOT and either approves or rejects the testosterone prescription and provides follow-up guidance to the prescriber. The completed TOT serves as documentation of guideline adherence in CPRS. The TOT also includes sections for first renewal testosterone prescriptions, addressing guideline recommendations for follow-up laboratory evaluation and clinical response to TRT. Due to limited completion of this section in the posttemplate period, evaluating adherence to follow-up recommendations was not feasible.
Measures
This project assessed the percentage of patients in the posttemplate period vs pretemplate period with an approved PADR. Documentation of specific guideline-recommended measures was assessed: signs and symptoms of testosterone deficiency; ≥ 2 serum testosterone measurements (≥ 2 total, free and total, or 2 free testosterone levels, and ≥ 1 testosterone level before 10
The project also assessed the proportion of patients in the posttemplate period vs pretemplate period who had all hormone tests (≥ 2 serum testosterone and LH and FSH concentrations), all laboratory tests (hormone tests and hematocrit), and all 5 guideline-recommended measures.
Analysis
Statistical comparisons between the proportions of patients in the pretemplate and posttemplate periods for each measure were performed using a χ2 test, without correction for multiple comparisons. All analyses were conducted using Stata version 10.0. A P value < .05 was considered significant for all comparisons.
Results
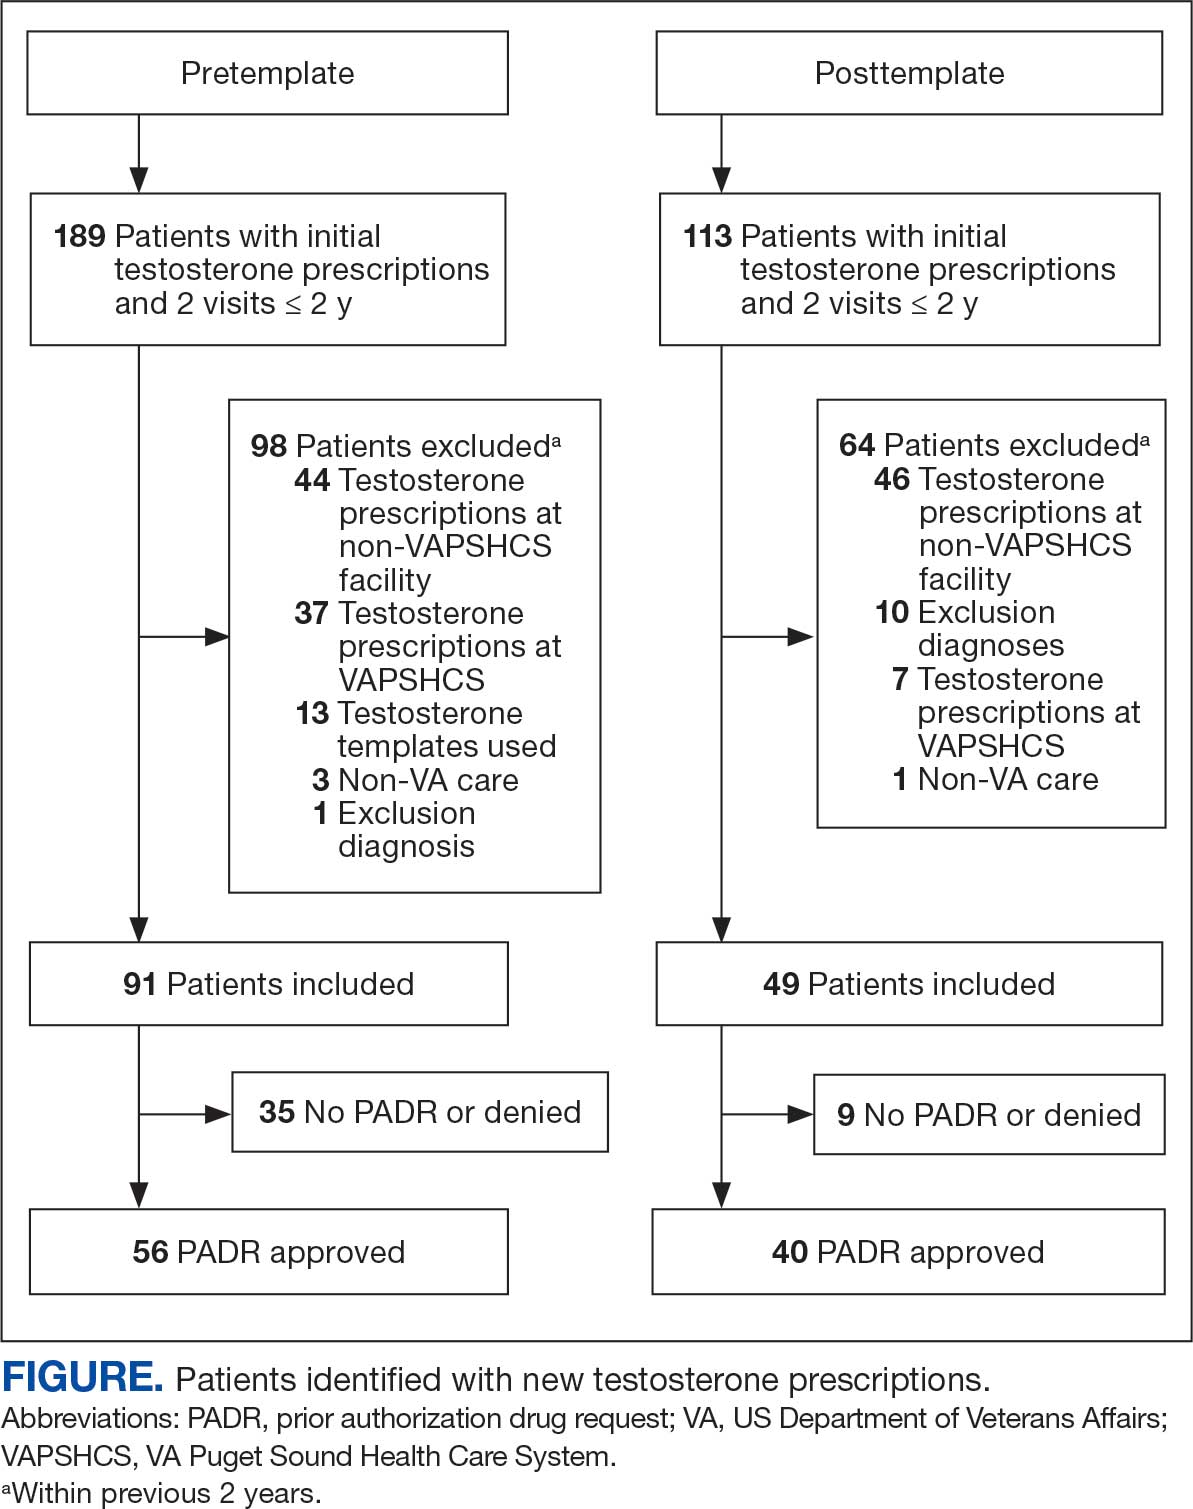
Chart review identified 189 patients in the pretemplate period and 113 patients in the posttemplate period with a new testosterone prescription (Figure). After exclusions, 91 and 49 patients, respectively, met eligibility criteria (Table 1). Fifty-six patients (62%) pretemplate and 40 patients (82%) posttemplate (P = .015) had approved PADRs and comprised the groups that were analyzed (Table 2).
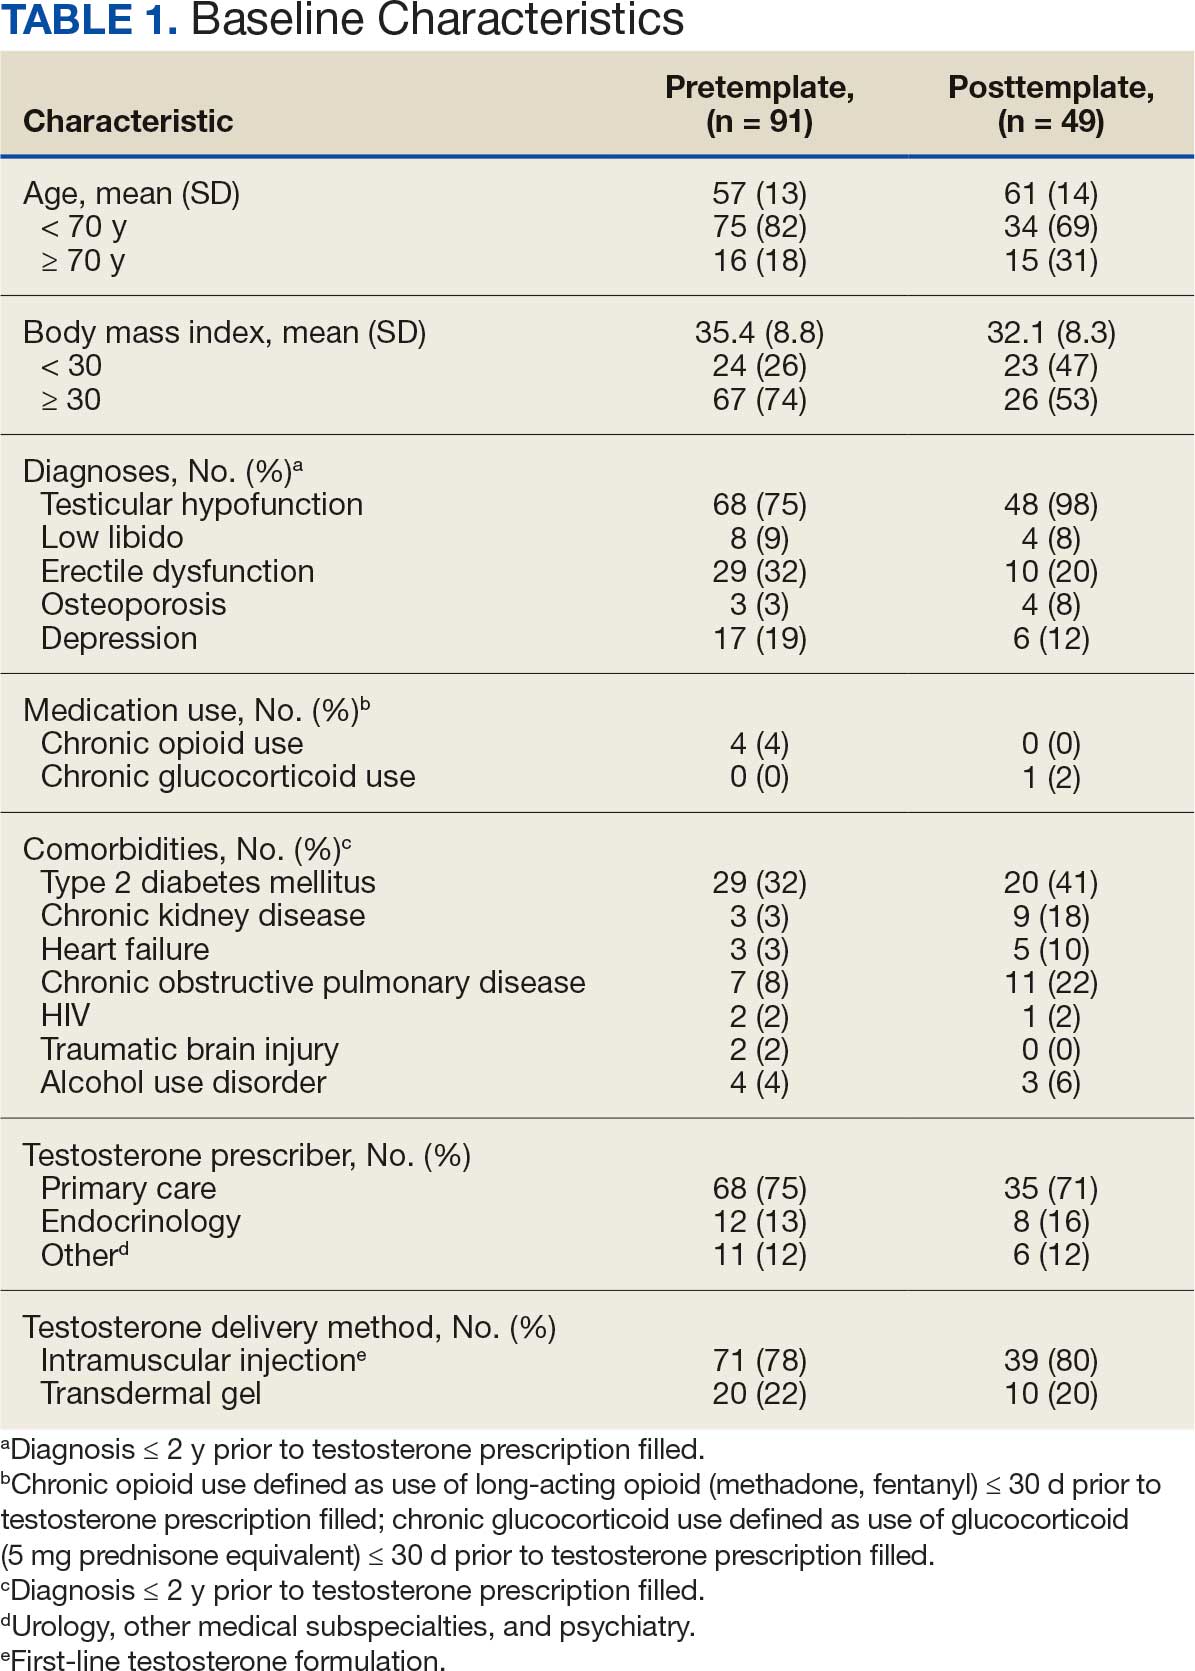

The mean age and body mass index were similar in the pretemplate and posttemplate periods, but there was variation in the proportions of patients aged < 70 years and those with a body mass index < 30 between the groups. The most common diagnosis in both groups was testicular hypofunction, and the most common comorbidity was type 2 diabetes mellitus. Concomitant use of opioids or glucocorticoids that can lower testosterone levels was rare. Most testosterone prescriptions originated from primary care clinics in both periods: 68 (75%) in the pretemplate period and 35 (71%) in the posttemplate period. Most testosterone treatment was delivered by intramuscular injection.
In the posttemplate period vs pretemplate period, the proportion of patients with an approved PADR (82% vs 62%, P = .02), and documentation of signs and symptoms of hypogonadism (93% vs 71%, P = .002) prior to starting TRT were higher, while the percentage of patients having ≥ 2 testosterone measurements (85% vs 89%, P = .53), ≥ 1 testosterone level before 10 AM (78% vs 75%, P = .70), and hematocrit measured (95% vs 91%, P = .47) were similar. Rates of LH and FSH testing were higher in the posttemplate period (80%) vs the pretemplate period (63%) but did not achieve statistical significance (P = .07), and discussion of the risks and benefits of TRT was higher in the posttemplate period (58%) vs the pretemplate period (34%) (P = .02). The percentage of patients who had all hormone measurements (total and/or free testosterone, LH, and FSH) was higher in the posttemplate period (78%) vs the pretemplate period (59%) but did not achieve statistical significance (P = .06). The rates of all guideline-recommended laboratory test orders were higher in the posttemplate period (78%) vs the pretemplate period (55%) (P = .03), and all 5 guideline-recommended clinical and laboratory measures were higher in the posttemplate period (45%) vs the pretemplate period (18%) (P = .004).
Discussion
The implementation of a pharmacy-managed TOT in CPRS demonstrated higher adherence to evidence-based guidelines for diagnosing and evaluating hypogonadism before TRT. After TOT implementation, a higher proportion of patients had documented signs and symptoms of testosterone deficiency, underwent all recommended laboratory tests, and had discussions about the risks and benefits of TRT. Adherence to 5 clinical and laboratory measures recommended by Endocrine Society guidelines was higher after TOT implementation, indicating improved prescribing practices.4
The requirement for TOT completion before testosterone prescription and its management by trained pharmacists likely contributed to higher adherence to guideline recommendations than previously reported. Integration of the TOT into CPRS with pharmacy oversight may have enhanced adherence by summarizing and codifying evidence-based guideline recommendations for clinical and biochemical evaluation prior to TRT initiation, offering relevant education to clinicians and pharmacists, automatically importing pertinent clinical information and laboratory results, and generating CPRS documentation to reduce clinician burden during patient care.
The proportion of patients with documented signs and symptoms of testosterone deficiency before TRT increased from the pretemplate period (71%) to the posttemplate period (93%), indicating that most patients receiving TRT had clinical manifestations of hypogonadism. This aligns with Endocrine Society guidelines, which define hypogonadism as a clinical disorder characterized by clinical manifestations of testosterone deficiency and persistently low serum testosterone levels on ≥ 2 separate occasions.4,6 However, recent trends in direct-to-consumer advertising for testosterone and the rise of “low T” clinics may contribute to increased testing, varied practices, and inappropriate testosterone therapy initiation (eg, in men with low testosterone levels who lack symptoms of hypogonadism).18 Improved adherence in documenting clinical hypogonadism with implementation of the TOT reinforces the value of incorporating educational material, as previously reported.11
Adherence to guideline recommendations following implementation of the TOT in this project was higher than those previously reported. In a study of 111,631 outpatient veterans prescribed testosterone from 2009 to 2012, only 18.3% had ≥ 2 testosterone prescriptions, and 3.5% had ≥ 2 testosterone, LH, and FSH levels measured prior to the initiation of a TRT.9 In a report of 63,534 insured patients who received TRT from 2010 to 2012, 40.3% had ≥ 2 testosterone prescriptions, and 12% had LH and/or FSH measured prior to the initiation.8
Low rates of guideline-recommended laboratory tests prior to initiation of testosterone treatment were reported in prior non-VA studies.19,20 Poor guideline adherence reinforces the need for clinician education or other methods to improve TRT and ensure appropriate prescribing practices across health care systems. The TOT described in this project is a sustainable clinical tool with the potential to improve testosterone prescribing practices.
The high rates of adherence to guideline recommendations at VAPSHCS likely stem from local endocrine expertise and ongoing educational initiatives, as well as the requirement for template completion before testosterone prescription. However, most testosterone prescriptions were initiated by primary care and monitored by pharmacists with varying degrees of training and clinical experience in hypogonadism and TRT.
However, adherence to guideline recommendations was modest, suggesting there is still an opportunity for improvement. The decision to initiate therapy should be made only after appropriate counseling with patients regarding its potential benefits and risks. Reports on the CV risk of TRT have been mixed. The 2023 TRAVERSE study found no increase in major adverse CV events among older men with hypogonadism and pre-existing CV risks undergoing TRT, but noted higher instances of pulmonary embolism, atrial fibrillation, and acute kidney injury.21 This highlights the need for clinicians to continue to engage in informed decision-making with patients. Effective pretreatment counseling is important but time-consuming; future TOT monitoring and modifications could consider mandatory checkboxes to document counseling on TRT risks and benefits.
The TOT described in this study could be adapted and incorporated into the prescribing process and electronic health record of larger health care systems. Use of an electronic template allows for automatic real-time dashboard monitoring of organization performance. The TOT described could be modified or simplified for specialty or primary care clinics or individual practitioners to improve adherence to evidence-based guideline recommendations and quality of care.
Strengths
A strength of this study is the multidisciplinary team (composed of stakeholders with experience in VA health care system and subject matter experts in hypogonadism) that developed and incorporated a user-friendly template for testosterone prescriptions; the use of evidence-based guideline recommendations; and the use of a structured chart review permitted accurate assessment of adherence to recommendations to document signs and symptoms of testosterone deficiency and a discussion of potential risks and benefits prior to TRT. To our knowledge, these recommendations have not been assessed in previous reports.
Limitations
The retrospective pre-post design of this study precludes a conclusion that implementation of the TOT caused the increase in adherence to guideline recommendations. Improved adherence could have resulted from the ongoing development of the preauthorization process for testosterone prescriptions or other changes over time. However, the preauthorization process had already been established for many years prior to template implementation. Forty-nine patients had new prescriptions for testosterone in the posttemplate period compared to 91 in the pretemplate period, but TRT was initiated in accordance with guideline recommendations more appropriately in the posttemplate period. The study’s sample size was small, and many eligible patients were excluded; however, exclusions were necessary to evaluate men who had new testosterone prescriptions for which the template was designed. Most men excluded were already taking testosterone.
Conclusions
The implementation of a CPRS-based TOT improved adherence to evidence-based guidelines for the diagnosis, evaluation, and counseling of patients with hypogonadism before starting TRT. While there were improvements in adherence with the TOT, the relatively low proportion of patients with documentation of TRT risks and benefits and all guideline recommendations highlights the need for additional efforts to further strengthen adherence to guideline recommendations and ensure appropriate evaluation, counseling, and prescribing practices before initiating TRT.
- Layton JB, Li D, Meier CR, et al. Testosterone lab testing and initiation in the United Kingdom and the United States, 2000 to 2011. J Clin Endocrinol Metab. 2014;99:835-842. doi:10.1210/jc.2013-3570
- Baillargeon J, Kuo YF, Westra JR, et al. Testosterone prescribing in the United States, 2002-2016. JAMA. 2018;320:200-202. doi:10.1001/jama.2018.7999
- Jasuja GK, Bhasin S, Rose AJ. Patterns of testosterone prescription overuse. Curr Opin Endocrinol Diabetes Obes. 2017;24:240-245. doi:10.1097/MED.0000000000000336
- Bhasin S, Cunningham GR, Hayes FJ, et al. Testosterone therapy in adult men with androgen deficiency syndromes: an Endocrine Society clinical practice guideline. J Clin Endocrinol Metab. 2006;91:1995-2010. doi:10.1210/jc.2005-2847
- Bhasin S, Cunningham GR, Hayes FJ, et al. Testosterone therapy in men with androgen deficiency syndromes: an Endocrine Society clinical practice guideline. J Clin Endocrinol Metab. 2010;95:2536-2559. doi:10.1210/jc.2009-2354
- Bhasin S, Brito JP, Cunningham GR, et al. Testosterone therapy in men with hypogonadism: an Endocrine Society clinical practice guideline. J Clin Endocrinol Metab. 2018;103:1715-1744. doi:10.1210/jc.2018-00229
- Mulhall JP, Trost LW, Brannigan RE, et al. Evaluation and management of testosterone deficiency: AUA guideline. J Urol. 2018;200:423-432. doi:10.1016/j.juro.2018.03.115
- Muram D, Zhang X, Cui Z, et al. Use of hormone testing for the diagnosis and evaluation of male hypogonadism and monitoring of testosterone therapy: application of hormone testing guideline recommendations in clinical practice. J Sex Med. 2015;12:1886-1894. doi:10.1111/jsm.12968
- Jasuja GK, Bhasin S, Reisman JI, et al. Ascertainment of testosterone prescribing practices in the VA. Med Care. 2015;53:746-752. doi:10.1097/MLR.0000000000000398?
- Jasuja GK, Bhasin S, Reisman JI, et al. Who gets testosterone? Patient characteristics associated with testosterone prescribing in the Veteran Affairs system: a cross-sectional study. J Gen Intern Med. 2017;32:304-311. doi:10.1007/s11606-016-3940-7
- Basaria S, Coviello AD, Travison TG, et al. Adverse events associated with testosterone administration. N Engl J Med. 2010;363:109-122. doi:10.1056/NEJMoa1000485
- Vigen R, O’Donnell CI, Barón AE, et al. Association of testosterone therapy with mortality, myocardial infarction, and stroke in men with low testosterone levels. JAMA. 2013;310:1829-1836. doi:10.1001/jama.2013.280386
- Finkle WD, Greenland S, Ridgeway GK, et al. Increased risk of non-fatal myocardial infarction following testosterone therapy prescription in men. PLoS One. 2014;9:e85805. doi:10.1371/journal.pone.0085805
- US Food and Drug Administration. FDA Drug Safety Communication: FDA cautions about using testosterone products for low testosterone due to aging; requires labeling change to inform of possible increased risk of heart attack and stroke with use. FDA.gov. March 3, 2015. Updated February 28, 2025. Accessed July 8, 2025. http://www.fda.gov/Drugs/DrugSafety/ucm436259.htm
- US Dept of Veterans Affairs, Office of Inspector General. Healthcare inspection – testosterone replacement therapy initiation and follow-up evaluation in VA male patients. April 11, 2018. Accessed July 8, 2025. https://www.vaoig.gov/reports/national-healthcare-review/healthcare-inspection-testosterone-replacement-therapy
- Narla R, Mobley D, Nguyen EHK, et al. Preliminary evaluation of an order template to improve diagnosis and testosterone therapy of hypogonadism in veterans. Fed Pract. 2021;38:121-127. doi:10.12788/fp.0103
- Bhasin S, Travison TG, Pencina KM, et al. Prostate safety events during testosterone replacement therapy in men with hypogonadism: a randomized clinical trial. JAMA Netw Open. 2023;6:e2348692. doi:10.1001/jamanetworkopen.2023.48692
- Dubin JM, Jesse E, Fantus RJ, et al. Guideline-discordant care among direct-to-consumer testosterone therapy platforms. JAMA Intern Med. 2022;182:1321-1323. doi:10.1001/jamainternmed.2022.4928
- Baillargeon J, Urban RJ, Ottenbacher KJ, et al. Trends in androgen prescribing in the United States, 2001 to 2011. JAMA Intern Med. 2013;173:1465-1466. doi:10.1001/jamainternmed.2013.6895
- Locke JA, Flannigan R, Günther OP, et al. Testosterone therapy: prescribing and monitoring patterns of practice in British Columbia. Can Urol Assoc J. 2021;15:e110-e117. doi:10.5489/cuaj.6586
- Lincoff AM, Bhasin S, Flevaris P, et al. Cardiovascular safety of testosterone-replacement therapy. N Engl J Med. 2023;389:107-117. doi:10.1056/NEJMoa2215025
Testosterone therapy is administered following pragmatic diagnostic evaluation and workup to assess whether an adult male is hypogonadal, based on symptoms consistent with androgen deficiency and low morning serum testosterone concentrations on ≥ 2 occasions. Effects of testosterone administration include the development or maintenance of secondary sexual characteristics and increases in libido, muscle strength, fat-free mass, and bone density.
Testosterone prescriptions have markedly increased in the past 20 years, including within the US Department of Veterans Affairs (VA) health care system.1-3 This trend may be influenced by various factors, including patient perceptions of benefit, an increase in marketing, and the availability of more user-friendly formulations.
Since 2006, evidence-based clinical practice guidelines have recommended specific clinical and laboratory evaluation and counseling prior to starting testosterone replacement therapy (TRT).4-8 However, research has shown poor adherence to these recommendations, including at the VA, which raises concerns about inappropriate TRT initiation without proper diagnostic evaluation.9,10 Observational research has suggested a possible link between testosterone therapy and increased risk of cardiovascular (CV) events. The US Food and Drug Administration prescribing information includes boxed warnings about potential risks of high blood pressure, myocardial infarction, stroke, and CV-related mortality with testosterone treatment, contact transfer of transdermal testosterone, and pulmonary oil microembolism with testosterone undecanoate injections.11-15
A VA Office of Inspector General (OIG) review of VA clinician adherence to clinical and laboratory evaluation guidelines for testosterone deficiency found poor adherence among VA practitioners and made recommendations for improvement.4,15 These focused on establishing clinical signs and symptoms consistent with testosterone deficiency, confirming hypogonadism by repeated testosterone testing, determining the etiology of hypogonadism by measuring gonadotropins, initiating a discussion of risks and benefits of TRT, and assessing clinical improvement and obtaining an updated hematocrit test within 3 to 6 months of initiation.
The VA Puget Sound Health Care System (VAPSHCS) developed a local prior authorization template to assist health care practitioners (HCPs) to address the OIG recommendations. This testosterone order template (TOT) aimed to improve the diagnosis, evaluation, and monitoring of TRT in males with hypogonadism, combined with existing VA pharmacy criteria for the use of testosterone based on Endocrine Society guidelines. A version of the VAPSHCS TOT was approved as the national VA Computerized Patient Record System (CPRS) template.
Preliminary evaluation of the TOT suggested improved short-term adherence to guideline recommendations following implementation.16 This quality improvement study sought to assess the long-term effectiveness of the TOT with respect to clinical practice guideline adherence. The OIG did not address prostate-specific antigen (PSA) monitoring because understanding of the relationship between TRT and the risks of elevated PSA levels remains incomplete.6,17 This project hypothesized that implementation of a pharmacy-managed TOT incorporated into CPRS would result in higher adherence rates to guideline-recommended clinical and laboratory evaluation, in addition to counseling of men with hypogonadism prior to initiation of TRT.
Methods
Eligible participants were cisgender males who received a new testosterone prescription, had ≥ 2 clinic visits at VAPSHCS, and no previous testosterone prescription in the previous 2 years. Individuals were excluded if they had testosterone administered at VAPSHCS; were prescribed testosterone at another facility (VA or community-based); pilot tested an initial version of the TOT prior to November 30, 2019; or had an International Classification of Diseases, Tenth Revision codes for hypopituitarism, gender identity disorder, history of sexual assignment, or Klinefelter syndrome for which testosterone therapy was already approved. Patients who met the inclusion criteria were identified by an algorithm developed by the VAPSHCS pharmacoeconomist.
This quality improvement project used a retrospective, pre-post experimental design. Electronic chart review and systematic manual review of all eligible patient charts were performed for the pretemplate period (December 1, 2018, to November 30, 2019) and after the template implementation, (December 1, 2021, to November 30, 2022).
An initial version of the TOT was implemented on July 1, 2019, but was not fully integrated into CPRS until early 2020; individuals in whom the TOT was used prior to November 30, 2019, were excluded. Data from the initial period of the COVID-19 pandemic were avoided because of alterations in clinic and prescribing practices. As a quality improvement project, the TOT evaluation was exempt from formal review by the VAPSHCS Institutional Review Board, as determined by the Director of the Office of Transformation/Quality/Safety/Value.
Interventions
Testosterone is a Schedule III controlled substance with potential risks and a propensity for varied prescribing practices. It was designated as a restricted drug requiring a prior authorization drug request (PADR) for which a specific TOT was developed, approved by the VAPSHCS Pharmacy and Therapeutics Committee, and incorporated into CPRS. A team of pharmacists, primary care physicians, geriatricians, endocrinologists, and health informatics experts created and developed the TOT. Pharmacists managed and monitored its completion.
The process for prescribing testosterone via the TOT is outlined in the eAppendix. When an HCP orders testosterone in CPRS, reminders prompt them to use the TOT and indicate required laboratory measurements (an order set is provided). Completion of TOT is not necessary to order testosterone for patients with an existing diagnosis of an organic cause of hypogonadism (eg, Klinefelter syndrome or hypopituitarism) or transgender women (assigned male at birth). In the TOT, the prescriber must also indicate signs and symptoms of testosterone deficiency; required laboratory tests; and counseling regarding potential risks and benefits of TRT. A pharmacist reviews the TOT and either approves or rejects the testosterone prescription and provides follow-up guidance to the prescriber. The completed TOT serves as documentation of guideline adherence in CPRS. The TOT also includes sections for first renewal testosterone prescriptions, addressing guideline recommendations for follow-up laboratory evaluation and clinical response to TRT. Due to limited completion of this section in the posttemplate period, evaluating adherence to follow-up recommendations was not feasible.
Measures
This project assessed the percentage of patients in the posttemplate period vs pretemplate period with an approved PADR. Documentation of specific guideline-recommended measures was assessed: signs and symptoms of testosterone deficiency; ≥ 2 serum testosterone measurements (≥ 2 total, free and total, or 2 free testosterone levels, and ≥ 1 testosterone level before 10
The project also assessed the proportion of patients in the posttemplate period vs pretemplate period who had all hormone tests (≥ 2 serum testosterone and LH and FSH concentrations), all laboratory tests (hormone tests and hematocrit), and all 5 guideline-recommended measures.
Analysis
Statistical comparisons between the proportions of patients in the pretemplate and posttemplate periods for each measure were performed using a χ2 test, without correction for multiple comparisons. All analyses were conducted using Stata version 10.0. A P value < .05 was considered significant for all comparisons.
Results
Chart review identified 189 patients in the pretemplate period and 113 patients in the posttemplate period with a new testosterone prescription (Figure). After exclusions, 91 and 49 patients, respectively, met eligibility criteria (Table 1). Fifty-six patients (62%) pretemplate and 40 patients (82%) posttemplate (P = .015) had approved PADRs and comprised the groups that were analyzed (Table 2).
The mean age and body mass index were similar in the pretemplate and posttemplate periods, but there was variation in the proportions of patients aged < 70 years and those with a body mass index < 30 between the groups. The most common diagnosis in both groups was testicular hypofunction, and the most common comorbidity was type 2 diabetes mellitus. Concomitant use of opioids or glucocorticoids that can lower testosterone levels was rare. Most testosterone prescriptions originated from primary care clinics in both periods: 68 (75%) in the pretemplate period and 35 (71%) in the posttemplate period. Most testosterone treatment was delivered by intramuscular injection.
In the posttemplate period vs pretemplate period, the proportion of patients with an approved PADR (82% vs 62%, P = .02), and documentation of signs and symptoms of hypogonadism (93% vs 71%, P = .002) prior to starting TRT were higher, while the percentage of patients having ≥ 2 testosterone measurements (85% vs 89%, P = .53), ≥ 1 testosterone level before 10 AM (78% vs 75%, P = .70), and hematocrit measured (95% vs 91%, P = .47) were similar. Rates of LH and FSH testing were higher in the posttemplate period (80%) vs the pretemplate period (63%) but did not achieve statistical significance (P = .07), and discussion of the risks and benefits of TRT was higher in the posttemplate period (58%) vs the pretemplate period (34%) (P = .02). The percentage of patients who had all hormone measurements (total and/or free testosterone, LH, and FSH) was higher in the posttemplate period (78%) vs the pretemplate period (59%) but did not achieve statistical significance (P = .06). The rates of all guideline-recommended laboratory test orders were higher in the posttemplate period (78%) vs the pretemplate period (55%) (P = .03), and all 5 guideline-recommended clinical and laboratory measures were higher in the posttemplate period (45%) vs the pretemplate period (18%) (P = .004).
Discussion
The implementation of a pharmacy-managed TOT in CPRS demonstrated higher adherence to evidence-based guidelines for diagnosing and evaluating hypogonadism before TRT. After TOT implementation, a higher proportion of patients had documented signs and symptoms of testosterone deficiency, underwent all recommended laboratory tests, and had discussions about the risks and benefits of TRT. Adherence to 5 clinical and laboratory measures recommended by Endocrine Society guidelines was higher after TOT implementation, indicating improved prescribing practices.4
The requirement for TOT completion before testosterone prescription and its management by trained pharmacists likely contributed to higher adherence to guideline recommendations than previously reported. Integration of the TOT into CPRS with pharmacy oversight may have enhanced adherence by summarizing and codifying evidence-based guideline recommendations for clinical and biochemical evaluation prior to TRT initiation, offering relevant education to clinicians and pharmacists, automatically importing pertinent clinical information and laboratory results, and generating CPRS documentation to reduce clinician burden during patient care.
The proportion of patients with documented signs and symptoms of testosterone deficiency before TRT increased from the pretemplate period (71%) to the posttemplate period (93%), indicating that most patients receiving TRT had clinical manifestations of hypogonadism. This aligns with Endocrine Society guidelines, which define hypogonadism as a clinical disorder characterized by clinical manifestations of testosterone deficiency and persistently low serum testosterone levels on ≥ 2 separate occasions.4,6 However, recent trends in direct-to-consumer advertising for testosterone and the rise of “low T” clinics may contribute to increased testing, varied practices, and inappropriate testosterone therapy initiation (eg, in men with low testosterone levels who lack symptoms of hypogonadism).18 Improved adherence in documenting clinical hypogonadism with implementation of the TOT reinforces the value of incorporating educational material, as previously reported.11
Adherence to guideline recommendations following implementation of the TOT in this project was higher than those previously reported. In a study of 111,631 outpatient veterans prescribed testosterone from 2009 to 2012, only 18.3% had ≥ 2 testosterone prescriptions, and 3.5% had ≥ 2 testosterone, LH, and FSH levels measured prior to the initiation of a TRT.9 In a report of 63,534 insured patients who received TRT from 2010 to 2012, 40.3% had ≥ 2 testosterone prescriptions, and 12% had LH and/or FSH measured prior to the initiation.8
Low rates of guideline-recommended laboratory tests prior to initiation of testosterone treatment were reported in prior non-VA studies.19,20 Poor guideline adherence reinforces the need for clinician education or other methods to improve TRT and ensure appropriate prescribing practices across health care systems. The TOT described in this project is a sustainable clinical tool with the potential to improve testosterone prescribing practices.
The high rates of adherence to guideline recommendations at VAPSHCS likely stem from local endocrine expertise and ongoing educational initiatives, as well as the requirement for template completion before testosterone prescription. However, most testosterone prescriptions were initiated by primary care and monitored by pharmacists with varying degrees of training and clinical experience in hypogonadism and TRT.
However, adherence to guideline recommendations was modest, suggesting there is still an opportunity for improvement. The decision to initiate therapy should be made only after appropriate counseling with patients regarding its potential benefits and risks. Reports on the CV risk of TRT have been mixed. The 2023 TRAVERSE study found no increase in major adverse CV events among older men with hypogonadism and pre-existing CV risks undergoing TRT, but noted higher instances of pulmonary embolism, atrial fibrillation, and acute kidney injury.21 This highlights the need for clinicians to continue to engage in informed decision-making with patients. Effective pretreatment counseling is important but time-consuming; future TOT monitoring and modifications could consider mandatory checkboxes to document counseling on TRT risks and benefits.
The TOT described in this study could be adapted and incorporated into the prescribing process and electronic health record of larger health care systems. Use of an electronic template allows for automatic real-time dashboard monitoring of organization performance. The TOT described could be modified or simplified for specialty or primary care clinics or individual practitioners to improve adherence to evidence-based guideline recommendations and quality of care.
Strengths
A strength of this study is the multidisciplinary team (composed of stakeholders with experience in VA health care system and subject matter experts in hypogonadism) that developed and incorporated a user-friendly template for testosterone prescriptions; the use of evidence-based guideline recommendations; and the use of a structured chart review permitted accurate assessment of adherence to recommendations to document signs and symptoms of testosterone deficiency and a discussion of potential risks and benefits prior to TRT. To our knowledge, these recommendations have not been assessed in previous reports.
Limitations
The retrospective pre-post design of this study precludes a conclusion that implementation of the TOT caused the increase in adherence to guideline recommendations. Improved adherence could have resulted from the ongoing development of the preauthorization process for testosterone prescriptions or other changes over time. However, the preauthorization process had already been established for many years prior to template implementation. Forty-nine patients had new prescriptions for testosterone in the posttemplate period compared to 91 in the pretemplate period, but TRT was initiated in accordance with guideline recommendations more appropriately in the posttemplate period. The study’s sample size was small, and many eligible patients were excluded; however, exclusions were necessary to evaluate men who had new testosterone prescriptions for which the template was designed. Most men excluded were already taking testosterone.
Conclusions
The implementation of a CPRS-based TOT improved adherence to evidence-based guidelines for the diagnosis, evaluation, and counseling of patients with hypogonadism before starting TRT. While there were improvements in adherence with the TOT, the relatively low proportion of patients with documentation of TRT risks and benefits and all guideline recommendations highlights the need for additional efforts to further strengthen adherence to guideline recommendations and ensure appropriate evaluation, counseling, and prescribing practices before initiating TRT.
- Layton JB, Li D, Meier CR, et al. Testosterone lab testing and initiation in the United Kingdom and the United States, 2000 to 2011. J Clin Endocrinol Metab. 2014;99:835-842. doi:10.1210/jc.2013-3570
- Baillargeon J, Kuo YF, Westra JR, et al. Testosterone prescribing in the United States, 2002-2016. JAMA. 2018;320:200-202. doi:10.1001/jama.2018.7999
- Jasuja GK, Bhasin S, Rose AJ. Patterns of testosterone prescription overuse. Curr Opin Endocrinol Diabetes Obes. 2017;24:240-245. doi:10.1097/MED.0000000000000336
- Bhasin S, Cunningham GR, Hayes FJ, et al. Testosterone therapy in adult men with androgen deficiency syndromes: an Endocrine Society clinical practice guideline. J Clin Endocrinol Metab. 2006;91:1995-2010. doi:10.1210/jc.2005-2847
- Bhasin S, Cunningham GR, Hayes FJ, et al. Testosterone therapy in men with androgen deficiency syndromes: an Endocrine Society clinical practice guideline. J Clin Endocrinol Metab. 2010;95:2536-2559. doi:10.1210/jc.2009-2354
- Bhasin S, Brito JP, Cunningham GR, et al. Testosterone therapy in men with hypogonadism: an Endocrine Society clinical practice guideline. J Clin Endocrinol Metab. 2018;103:1715-1744. doi:10.1210/jc.2018-00229
- Mulhall JP, Trost LW, Brannigan RE, et al. Evaluation and management of testosterone deficiency: AUA guideline. J Urol. 2018;200:423-432. doi:10.1016/j.juro.2018.03.115
- Muram D, Zhang X, Cui Z, et al. Use of hormone testing for the diagnosis and evaluation of male hypogonadism and monitoring of testosterone therapy: application of hormone testing guideline recommendations in clinical practice. J Sex Med. 2015;12:1886-1894. doi:10.1111/jsm.12968
- Jasuja GK, Bhasin S, Reisman JI, et al. Ascertainment of testosterone prescribing practices in the VA. Med Care. 2015;53:746-752. doi:10.1097/MLR.0000000000000398?
- Jasuja GK, Bhasin S, Reisman JI, et al. Who gets testosterone? Patient characteristics associated with testosterone prescribing in the Veteran Affairs system: a cross-sectional study. J Gen Intern Med. 2017;32:304-311. doi:10.1007/s11606-016-3940-7
- Basaria S, Coviello AD, Travison TG, et al. Adverse events associated with testosterone administration. N Engl J Med. 2010;363:109-122. doi:10.1056/NEJMoa1000485
- Vigen R, O’Donnell CI, Barón AE, et al. Association of testosterone therapy with mortality, myocardial infarction, and stroke in men with low testosterone levels. JAMA. 2013;310:1829-1836. doi:10.1001/jama.2013.280386
- Finkle WD, Greenland S, Ridgeway GK, et al. Increased risk of non-fatal myocardial infarction following testosterone therapy prescription in men. PLoS One. 2014;9:e85805. doi:10.1371/journal.pone.0085805
- US Food and Drug Administration. FDA Drug Safety Communication: FDA cautions about using testosterone products for low testosterone due to aging; requires labeling change to inform of possible increased risk of heart attack and stroke with use. FDA.gov. March 3, 2015. Updated February 28, 2025. Accessed July 8, 2025. http://www.fda.gov/Drugs/DrugSafety/ucm436259.htm
- US Dept of Veterans Affairs, Office of Inspector General. Healthcare inspection – testosterone replacement therapy initiation and follow-up evaluation in VA male patients. April 11, 2018. Accessed July 8, 2025. https://www.vaoig.gov/reports/national-healthcare-review/healthcare-inspection-testosterone-replacement-therapy
- Narla R, Mobley D, Nguyen EHK, et al. Preliminary evaluation of an order template to improve diagnosis and testosterone therapy of hypogonadism in veterans. Fed Pract. 2021;38:121-127. doi:10.12788/fp.0103
- Bhasin S, Travison TG, Pencina KM, et al. Prostate safety events during testosterone replacement therapy in men with hypogonadism: a randomized clinical trial. JAMA Netw Open. 2023;6:e2348692. doi:10.1001/jamanetworkopen.2023.48692
- Dubin JM, Jesse E, Fantus RJ, et al. Guideline-discordant care among direct-to-consumer testosterone therapy platforms. JAMA Intern Med. 2022;182:1321-1323. doi:10.1001/jamainternmed.2022.4928
- Baillargeon J, Urban RJ, Ottenbacher KJ, et al. Trends in androgen prescribing in the United States, 2001 to 2011. JAMA Intern Med. 2013;173:1465-1466. doi:10.1001/jamainternmed.2013.6895
- Locke JA, Flannigan R, Günther OP, et al. Testosterone therapy: prescribing and monitoring patterns of practice in British Columbia. Can Urol Assoc J. 2021;15:e110-e117. doi:10.5489/cuaj.6586
- Lincoff AM, Bhasin S, Flevaris P, et al. Cardiovascular safety of testosterone-replacement therapy. N Engl J Med. 2023;389:107-117. doi:10.1056/NEJMoa2215025
Streamlined Testosterone Order Template to Improve the Diagnosis and Evaluation of Hypogonadism in Veterans
Streamlined Testosterone Order Template to Improve the Diagnosis and Evaluation of Hypogonadism in Veterans

Around 5% of US Population Diagnosed With Autoimmune Disease
TOPLINE:
In 2022, autoimmune diseases affected over 15 million individuals in the United States, with women nearly twice as likely to be affected as men and more than one third of affected individuals having more than one autoimmune condition.
METHODOLOGY:
- Researchers used electronic health record (EHR) data from six healthcare systems in the United States between 2011 and 2022 to estimate the prevalence of autoimmune diseases according to sex and age.
- They selected 105 autoimmune diseases from the textbook The Autoimmune Diseases and estimated their prevalence in more than 10 million individuals from these healthcare systems; these statistics were subsequently extrapolated to an estimated US population of 333.3 million.
- An individual was considered to have a diagnosis of an autoimmune disease if they had at least two diagnosis codes for the condition, with the codes being at least 30 days apart.
- A software program was developed to compute the prevalence of autoimmune diseases alone and in aggregate, enabling other researchers to replicate or modify the analysis over time.
TAKEAWAY:
- More than 15 million people, accounting for 4.6% of the US population, were diagnosed with at least one autoimmune disease from January 2011 to June 2022; 34% were diagnosed with more than one autoimmune disease.
- Sex-stratified analysis revealed that 63% of patients diagnosed with autoimmune disease were women, and only 37% were men, establishing a female-to-male ratio of 1.7:1; age-stratified analysis revealed increasing prevalence of autoimmune conditions with age, peaking in individuals aged ≥ 65 years.
- Among individuals with autoimmune diseases, 65% of patients had one condition, whereas 24% had two, 8% had three, and 2% had four or more autoimmune diseases (does not add to 100% due to rounding).
- Rheumatoid arthritis emerged as the most prevalent autoimmune disease, followed by psoriasis, type 1 diabetes, Grave’s disease, and autoimmune thyroiditis; 19 of the top 20 most prevalent autoimmune diseases occurred more frequently in women.
IN PRACTICE:
“Accurate data on the prevalence of autoimmune diseases as a category of disease and for individual autoimmune diseases are needed to further clinical and basic research to improve diagnosis, biomarkers, and therapies for these diseases, which significantly impact the US population,” the authors wrote.
SOURCE:
The study was led by Aaron H. Abend, Autoimmune Registry, Guilford, Connecticut, and was published online in The Journal of Clinical Investigation.
LIMITATIONS:
The use of EHR data presented several challenges, including potential inaccuracies in diagnosis codes and the possibility of missing patients with single diagnosis codes because of the two-code requirement. Certain autoimmune diseases evolve over time and involve nonspecific clinical signs and symptoms that can mimic other diseases, potentially resulting in underdiagnosis. Moreover, rare diseases lacking specific diagnosis codes may have been underrepresented.
DISCLOSURES:
The study received support from Autoimmune Registry; the National Institutes of Health National Center for Advancing Translational Sciences; the National Heart, Lung, and Blood Institute; and other sources. Information on potential conflicts of interest was not disclosed.
This article was created using several editorial tools, including artificial intelligence, as part of the process. Human editors reviewed this content before publication. A version of this article first appeared on Medscape.com.
Nutrition, Drugs, or Bariatric Surgery: What’s the Best Approach for Sustained Weight Loss?
Given that more than 100 million US adults have obesity, including 22 million with severe obesity, physicians regularly see patients with the condition in their practices.
Fortunately, doctors have more tools than ever to help their patients. But the question remains: Which method is the safest and most effective? Is it diet and lifestyle changes, one of the recently approved anti-obesity medications (AOMs), bariatric surgery, or a combination approach?
There are no head-to-head trials comparing these three approaches, said Vanita Rahman, MD, clinic director of the Barnard Medical Center, Washington, DC, at the International Conference on Nutrition in Medicine, sponsored by the Physicians Committee for Responsible Medicine.
Instead, doctors must evaluate the merits and drawbacks of each intervention and decide with their patients which treatment is best for them, she told Medscape Medical News. When she sees patients, Rahman shares the pertinent research with them, so they are able to make an informed choice.
Looking at the Options
In her presentation at the conference, Rahman summarized the guidelines issued by the American Heart Association/American College of Cardiology/The Obesity Society for Management of Overweight and Obesity in Adults and the American Association of Clinical Endocrinologists and American College of Endocrinology Comprehensive Clinical Practice Guidelines For Medical Care of Patients with Obesity, including lifestyle changes, AOMs, and bariatric surgery (Table 1).
As shown, the current clinical guidelines offer recommendations that consider such factors as the patient’s BMI and presence of one or more comorbidities. Generally, they begin with lifestyle changes for people with overweight, the possibility of an AOM for those with obesity, and bariatric surgery as an option for those with severe obesity-related complications.
“In obesity, we traditionally thought the process was ‘either-or’ — either lifestyle or surgery or medication — and somehow lifestyle is better,” Sheethal Reddy, PhD, a psychologist at the Bariatric Center at Emory University Hospital Midtown, Atlanta, told Medscape Medical News.
Now physicians often use a combination of methods, but lifestyle is foundational to all of them, she said.
“If you don’t make lifestyle changes, none of the approaches will ultimately be effective,” said Reddy, who also is an assistant professor in the Division of General and GI Surgery at Emory School of Medicine, Atlanta.
Lifestyle changes don’t just involve diet and nutrition but include physical exercise.
“Being sedentary affects everything — sleep quality, appetite regulation, and metabolism. Without sufficient exercise, the body isn’t functioning well enough to have a healthy metabolism,” Reddy said.
How Durable Are the Interventions?
Although bariatric surgery has demonstrated effectiveness in helping patients lose weight, many of them regain some or most of it, Rahman said.
A systematic review and meta-analysis found weight regain in 49% of patients who underwent bariatric surgery patients, with the highest prevalence after Roux-en-Y gastric bypass.
Another study of approximately 45,000 patients who underwent bariatric surgery found differences not only in the percentage of total weight loss among Roux-en-Y gastric bypass, sleeve gastrectomy, and adjustable gastric band procedures but also in how much of that weight stayed off between 1 and 5 years following the procedure (Table 2).
Weight regain also is a risk with AOMs, if they’re discontinued.
The STEP 1 trial tested the effectiveness of semaglutide — a glucagon-like peptide 1 (GLP-1) receptor agonist — as an adjunct to lifestyle intervention for weight loss in patients with obesity or with overweight and at least one comorbidity but not diabetes. Mean weight loss with semaglutide was 17.3% but that figure dropped 11.6 percentage points after treatment was discontinued.
Other studies also have found that patients regain weight after GLP-1 discontinuation.
Tirzepatide, a GLP-1 and glucose-dependent insulinotropic polypeptide (GIP) combination, has shown efficacy with weight reduction, but patients experienced some weight regain upon discontinuation. In one study, patients experienced a mean weight loss of 20.9% after 36 weeks of tirzepatide. In the study’s subsequent 52-week double-blind, placebo-controlled period, patients who stopped taking the medication experienced a weight regain of 14%, whereas those who remained on the medication lost an additional 5.5% of weight.
GLP-1 and GLP-1/GIP medications do not address the factors that contribute to overweight and obesity, Rahman said. “They simply suppress the appetite; therefore, weight gain occurs after stopping them.”
Patients may stop taking anti-obesity drugs for a variety of reasons, including side effects. Rahman noted that the common side effects include nausea, vomiting, and constipation, whereas rare side effects include gastroparesis, gallbladder and biliary disease, thyroid cancer, and suicidal thoughts. GLP-1 and GLP-1/GIP medications also carry a risk for non-arteritic anterior ischemic optic neuropathy, she said.
Moreover, health insurance does not always cover these medications, which likely affects patient access to the drugs and compliance rates.
“Given the side effects and frequent lack of insurance coverage, significant questions remain about long-term safety and feasibility of these agents,” Rahman said.
What About Nutritional Approaches?
The lifestyle interventions in the semaglutide and tirzepatide studies included 500 kcal/d deficit diets, which is difficult for people to maintain, noted Rahman, who is the author of the book Simply Plant Based: Fabulous Food for a Healthy Life.
Additionally, bariatric surgery has been associated with long-term micronutrient deficiencies, including deficiencies in vitamins A, D, E, K, B1, and B12, as well as folate, iron, zinc, copper, selenium, and calcium, she said.
The best approach to food from a patient compliance standpoint and to avoid nutrient deficiencies is a whole-food, plant-based diet, Rahman said. She advocates this nutritional approach, along with physical activity, for patients regardless of whether they’ve selected lifestyle intervention alone or combined with an AOM or bariatric surgery to address obesity.
Rahman cited a 5-year heart disease study comparing an intensive lifestyle program involving a vegetarian diet, aerobic exercise, stress management training, smoking cessation, and group psychosocial support to treatment as usual. Patients in the lifestyle group lost 10.9 kg at 1 year and sustained weight loss of 5.8 kg at 5 years, whereas weight in the control group remained relatively unchanged from baseline.
She also pointed to the findings of a study of patients with obesity or with overweight and at least one comorbidity that compared standard care with a low-fat, whole-food, plant-based diet with vitamin B12 supplementation. At 6 months, mean BMI reduction was greater in the intervention group than the standard care group (−4.4 vs −0.4).
In her practice, Rahman has seen the benefits of a whole-food, plant-based diet for patients with obesity.
If people are committed to this type of dietary approach and are given the tools and resources to do it effectively, “their thinking changes, their taste buds change, and they grow to enjoy this new way of eating,” she said. “They see results, and it’s a lifestyle that can be sustained long-term.”
Addressing Drivers of Weight Gain
Patients also need help addressing the various factors that may contribute to overweight and obesity, including overconsumption of ultra-processed foods, substandard nutritional quality of restaurant foods, increasing portion sizes, distraction during eating, emotional eating, late-night eating, and cultural/traditional values surrounding food, Rahman noted.
Supatra Tovar, PsyD, RD, a clinical psychologist with a practice in Pasadena, California, agreed that identifying the reasons for weight gain is critical for treatment.
“If you’re not addressing underlying issues, such as a person’s relationship with food, behaviors around food, the tendency to mindlessly eat or emotionally eat or eat to seek comfort, the person’s weight problems won’t ultimately be fully solved by any of the three approaches — dieting, medications, or bariatric surgery,” she said.
Some of her patients “engage in extreme dieting and deprivation, and many who use medications or have had bariatric surgery hardly eat and often develop nutritional deficiencies,” said Tovar, author of the book Deprogram Diet Culture: Rethink Your Relationship with Food, Heal Your Mind, and Live a Diet-Free Life.
The key to healthy and sustained weight loss is to “become attuned to the body’s signals, learn how to honor hunger, stop eating when satisfied, and eat more healthful foods, such as fruits and vegetables, whole grains, lean proteins — especially plant-based proteins — and the body gives signals that this is what it wants,” she said.
Tovar doesn’t give her clients a specific diet or set of portions.
“I teach them to listen to their bodies,” she said. “They’ve lost significant amounts of weight and continued to keep it off because they’ve done this kind of work.”
When Lifestyle Changes Aren’t Enough
For many patients, lifestyle interventions are insufficient to address the degree of overweight and obesity and common comorbidities, said W. Timothy Garvey, MD, associate director and professor, Department of Nutrition Sciences, School of Health Professions, University of Alabama at Birmingham.
“Of course, nutritional approaches are very important, not only for weight but also for general health-related reasons,” said Garvey, lead author of the 2016 American Association of Clinical Endocrinologists obesity guidelines. “We’ve seen that the Mediterranean and some plant-based diets can prevent progression from prediabetes to diabetes and improve other parameters that reflect metabolic health.”
However, it’s “not common that patients can follow these diets, lose weight, and keep it off,” Garvey cautioned. Up to 50% of weight that’s lost through lifestyle changes is typically regained by 1-year follow-up, with almost all remaining lost weight subsequently regained in the majority of individuals because the person “has to fight against pathophysiological process that drive weight regain,” he noted.
Weight-loss medications can address these pathophysiologic processes by “addressing interactions of satiety hormones with feeding centers in the brain, suppressing the appetite, and making it easier for patients to adhere to a reduced-calorie diet.”
Garvey views the weight-loss medications in the same light as drugs for diabetes and hypertension, in that people need to keep taking them to sustain the benefit.
There’s still a role for bariatric surgery because not everyone can tolerate the AOMs or achieve sufficient weight loss.
“Patients with very high BMI who have trouble ambulating might benefit from a combination of bariatric surgery and medication,” Garvey said.
While some side effects are associated with AOMs, being an “alarmist” about them can be detrimental to patients, he warned.
Rahman and Tovar are authors of books about weight loss. Reddy reported no relevant financial relationships. Garvey is a consultant on advisory boards for Boehringer Ingelheim, Eli Lilly, Novo Nordisk, Pfizer, Fractyl Health, Alnylam Pharmaceuticals, Inogen, Zealand, Allurion, Carmot/Roche, Terns Pharmaceuticals, Neurocrine, Keros Therapeutics, and Regeneron. He is the site principal investigator for multi-centered clinical trials sponsored by his university and funded by Novo Nordisk, Eli Lilly, Epitomee, Neurovalens, and Pfizer. He serves as a consultant on the advisory board for the nonprofit Milken Foundation and is a member of the Data Monitoring Committee for phase 3 clinical trials conducted by Boehringer-Ingelheim and Eli Lilly.
A version of this article first appeared on Medscape.com.
Parenting in Later Life: How Old Is Too Old?
This transcript has been edited for clarity.
I want to talk about something that’s extremely controversial, but something that needs public discussion, in my view, as sometimes it doesn’t get the attention it deserves. That is: Are you ever too old to become a parent?
In my experience, this topic comes up when women — often, single women — decide that they haven’t had a child and they consider pursuing fertility services using in vitro fertilization, donor sperm, a younger woman’s egg, or an egg they’ve preserved, and they say they’d like to have a child.
I don’t have any huge objection to a younger woman with good health and energy trying to pursue parenting, but we’ve seen women try to do this in their 60s. It does seem to me, biologically, that is a high risk for anyone to undertake a pregnancy at that age. I think there’s agreement from obstetricians that they’re high risk.
I think it’s dangerous, if you’re going to be the single parent at that age, that you may wind up entering a nursing home by the time your child enters, say, high school. In thinking about parenting, sure, we want to think about our own values and what we want, and normally, people don’t tell us what to do. I’m not calling for any legislation here. I’m calling for an ethical discussion about the rights and wrongs of parenting at older age.
In response to the case I made against single women over age 60 trying to have children, it’s often brought up to me that men do it. Recently, there was a story about Al Pacino, who had a kid — I think he’s now 84, so he must have had the child at 83.
In an interview with Newsweek, he said he had this child with his ex, who was 30, a woman named Noor Alfallah. He also said he doesn’t see the child very much. He communicates mainly with that child as a co-parent through digital texting and internet contact. He said he uses video basically as a parent.
Why that is, I’m not sure. Did he have a falling out with his ex and has he been excluded? Is he in poor health such that he can’t really do parenting anymore?
I cite his case, and there are many other celebrities that we’ve heard about over the years who’ve had kids in their 80s, such as the former talk show host Larry King and, I believe, Clint Eastwood. There are cases that hit the news all the time about older men.
I think the same question should apply ethically. Again, I’m not saying we’re going to ban it or outlaw it, but it’s something we have to discuss and think through. I think doctors involved in helping a very old parent should raise the questions so that people can at least discuss them.
If you’re going to have a kid at 84, it means you’re not going to be around in any competent way by the time the kid hits high school. I’m not sure that’s in the child’s best interest. Certainly, there is the case that a younger woman could adequately raise the kid, but if something happens to her, you’re not going to be around in that age category to parent at all.
It’s also the case that older parents, if you’re using your sperm, may have the same issues as women, whose eggs age in their late 30s into their 40s; you’re more likely to transmit a genetic disease. We don’t talk about it often, but it is a fact that someone who’s thinking about parenting either naturally or using infertility techniques really should be responsible and think about it.
Bottom line: Am I going to say we should let Congress or a state legislature step in and say, you’re going to go to jail if you have a kid at age X? No. Ethics is there for a reason; it’s trying to make sure that you don’t do things that harm or hurt the interests of a kid.
If two older people have a child and they’re not likely to be there for a crucial period — say, the teenage years — and they haven’t made provisions for the care of the child, if both die, that’s a problem.
Am I doing this because I’m just going to do what I want to do, or am I going to really look out for the best interests of any child I might create?
This is food for thought about the question of when anyone is too old to parent. I know that’s partly determined by partner, resources, and many other variables, but I don’t believe that we should ignore the discussion of the ethics of the decision just out of respect for the idea that we’re not going to legislate.
Dr. Caplan is with the Division of Medical Ethics at New York University’s Grossman School of Medicine. He has disclosed relevant financial relationships with Johnson & Johnson’s Panel for Compassionate Drug Use (unpaid position) and Medscape.
A version of this article appeared on Medscape.com.
Exposure to Dioxins May Increase Obesity Risk
TOPLINE:
Combined exposure to dioxins and dioxin-like polychlorinated biphenyls (DL-PCBs) is significantly associated with an increased risk for obesity in adults, with 1,2,3,4,6,7,8-heptachlorodibenzo-p-dioxin (HpCDD) showing the greatest contribution.
METHODOLOGY:
- Researchers evaluated the relationship between mixed exposure to nine types of dioxins and DL-PCBs and obesity or obesity indices in 852 adults using data from the National Health and Nutrition Examination Survey from 2003 to 2004.
- They chose nine chemicals for analysis: 1,2,3,4,6,7,8-HpCDD; 1,2,3,4,6,7,8,9-octachlorodibenzo-p-dioxin (OCDD); 3,3’,4,4’,5-pentachlorodibenzofuran (PnCB); PCB28; PCB66; PCB74; PCB105; PCB118; and PCB156.
- General and abdominal obesity were present in 34% and 53.9% of participants, respectively.
- Multiple statistical approaches were employed to evaluate the association of exposures to dioxins and DL-PCBs with obesity. Mediation analysis was performed to assess the potential role of A1c in this association.
TAKEAWAY:
- Multivariable logistic regression analysis found that a single exposure to higher concentrations of 1,2,3,4,6,7,8-HpCDD; 1,2,3,4,6,7,8,9-OCDD; 3,3’,4,4’,5-PnCB; PCB74; PCB105; and PCB118 was associated with an increased risk for general and abdominal obesity (P for trend < .001 for all). A stratified analysis by sex found that except for PCB28, PCB66, PCB74, and PCB156, all chemicals were linked to increased general and abdominal obesity risk in both men and women.
- Combined exposure to dioxins and DL-PCBs was positively associated with the risk for obesity, with 1,2,3,4,6,7,8-HpCDD showing the greatest contribution.
- When considering obesity indices, 1,2,3,4,6,7,8,9-OCDD; 1,2,3,4,6,7,8-HpCDD; 3,3’,4,4’,5-PnCB; PCB74; PCB105; and PCB118 were significantly associated with body mass index and waist circumference.
- A1c levels significantly mediated the association between mixed exposure to dioxins and DL-PCBs and obesity (P < .05), with mediation proportions of 6.94% for general obesity and 5.21% for abdominal obesity.
IN PRACTICE:
“Our findings suggested that dioxins and DL-PCBs may be independent risk factors for obesity,” the authors wrote. “The hazards of dioxins on obesity should be emphasized, and additional studies are desirable to elucidate the potential mechanisms for dioxins on obesity in adults.”
SOURCE:
This study, led by Zhao-Xing Gao, Department of Epidemiology and Biostatistics, School of Public Health, Anhui Medical University and Center for Big Data and Population Health of IHM, both in Hefei, China, was published online in The Journal of Clinical Endocrinology & Metabolism.
LIMITATIONS:
The cross-sectional nature of this study prevented the establishment of causal relationships between dioxins or DL-PCBs and obesity. This study relied on a small sample. Replacing chemical concentrations below the limit of detection with fixed values may have introduced bias.
DISCLOSURES:
This study was funded by grants from the National Natural Science Foundation of China, Research Fund of Anhui Institute of Translational Medicine, and Research Fund of Center for Big Data and Population Health of IHM. The authors declared no conflicts of interest.
This article was created using several editorial tools, including AI, as part of the process. Human editors reviewed this content before publication. A version of this article appeared on Medscape.com.
70% of US Counties Have No Endocrinologist, New Study Finds
according to a new analysis by GoodRx, a company that provides discount coupons for medications.
A total of 50 million people who live in the 2168 counties without a practicing endocrinologist are at a higher risk for poor health outcomes, according to the analysis.
The author reported that individuals who live in endocrinology “deserts” are 12% more likely to die from endocrine-related conditions and have higher rates of diabetes, obesity, and stroke than those who live in counties where there are endocrinologists.
GoodRx’s finely detailed maps show that endocrinologists are clustered on the coasts and around major cities. Many counties have just a single endocrinologist and no pediatric endocrinologists.
Endocrinologists are not flocking to areas with a high type 2 diabetes prevalence — such as southern states, many parts of Texas, and counties with high concentrations of Native Americans or Alaskan Natives.
The maps speak volumes about disparities. In Sabine Parish, Louisiana, which shares a border with east Texas, the adult diabetes prevalence is 14%. The age-adjusted diabetes death rate is 52.6 per 100,000, in a population of 16,936 adults. There are no endocrinologists in that parish and one in a bordering parish.
In the entire state of Alaska, there are a total of two adult endocrinologists — one in Anchorage County and one in Fairbanks County — and two pediatric endocrinologists, both in Anchorage.
Buffalo County, South Dakota, which has no endocrinologists and is dominated by the Crow Creek Reservation, has a diabetes prevalence of 16.6% and a diabetes death rate of 143.3 per 100,000.
Connecticut’s Hartford County, however, has 69 adult endocrinologists and 9 pediatric endocrinologists. The adult diabetes prevalence is 0%, and the death rate is 26.3 per 100,000, in a population of 896,854.
To come up with its maps, GoodRx used population estimates from the 2024 Centers for Disease Control and Prevention (CDC) Places dataset and calculated adult diabetes rates and age-adjusted diabetes-related death rates per 100,000 using the 2024 CDC Places and CDC Wonder datasets. Data on the number of practicing endocrinologists came from HealthLink Dimensions, a company that provides databases for marketing purposes.
Robert Lash, MD, chief medical officer for The Endocrine Society, said that the GoodRx data are not especially new. Endocrinology “deserts” have existed for a decade or more, Lash said.
The GoodRx analysis concluded that a lack of endocrinologists in the “desert” counties directly led to higher death rates in those areas. “This is much more an association that it is causation,” countered Lash, noting that the deserts tend to align with healthcare professional shortage areas.
GoodRx also acknowledged the overlap and said that it could mean less access to primary care. In turn, “many patients may not even receive a diagnosis for endocrine-related conditions, let alone the specialized care they need,” wrote the analyst. “Preventable conditions like diabetes spiral into severe complications.”
Lash said seeking out a primary care doctor is one option for those without access to an endocrinologist. Telemedicine has also helped expand access, said Lash, adding that endocrinologists have been among the more frequent users.
Even so, the shortage of endocrinologists is an ongoing problem, he said. Only about 5000-6000 endocrinologists are actively practicing, estimates The Endocrine Society.
Fewer medical school graduates are choosing endocrinology, in part because of the lack of compensation, said Lash.
The society has begun a push to interest more students. Starting in 2024, The Society awarded grants to 10 medical schools to start endocrinology interest groups. The Medical School Engagement Program also sponsors two students for a VIP-type experience at the annual scientific meeting.
The hope is to boost interest in fellowships, which come after 3 years of internal medicine residency. Currently, there are only about 11 applicants for every 10 fellowship spots, said Lash.
It may be a while before the society’s experiment bears fruit. Those entering medical school in 2024 would not be eligible for fellowship until 2031, noted Lash.
“We’re in this for the long haul,” he said. “We know that this problem is not going to get solved overnight.”
A version of this article appeared on Medscape.com.
Plant-Based Food Prioritized Over Meat in Dietary Guidelines Report
The scientific report that offers evidence-based guidance for the next iteration of the Dietary Guidelines for Americans has been submitted to federal agencies, and the document — which already has generated controversy because of its emphasis on plant-based foods — is now open for public comment.
“We saw something over and over again — when you look at a population level, diets for which the predominant composition was plants performed better when it came to health outcomes,” advisory committee member Cheryl Anderson, PhD, MPH, who is a professor and dean of the Herbert Wertheim School of Public Health and Human Longevity Science at the University of California, San Diego, said in an interview. “There’s a pretty consistent body of literature showing benefits of fruits, vegetables, and legumes and reductions in salt, added sugars, and saturated fats.”
Clinicians should read and comment on the report, said Anderson.
“Commenting sends the right signal that they are interested in what’s needed for nutrition education,” she said. “It will also activate a conversation with the people who are writing the guidelines.”
Instructions for submitting comments online through February 10, 2025, and for participating in the oral comment meeting on January 16, 2025, are posted online.
The Department of Agriculture (USDA) and the Department of Health & Human Services will use the report as a key resource, alongside the public comments and agency input, as they jointly develop the Dietary Guidelines for Americans, 2025-2030.
Meat Given a Back Seat
Overall, the advisory committee defined a “healthy dietary pattern” as one that is “higher in vegetables, fruits, legumes (ie, beans, peas, lentils), nuts, whole grains, fish/seafood, and vegetable oils higher in unsaturated fat — and lower in red and processed meats, sugar-sweetened foods and beverages, refined grains, and saturated fat.”
The report emphasizes “plain drinking water” as the primary beverage for people to consume and states that sugar-sweetened beverage consumption should be limited.
It recommends limiting total saturated fat intake to less than 10% of daily calories and replacing it with unsaturated fat, particularly polyunsaturated fats.
Notably, the report advocates increasing the consumption of beans, peas, and lentils and decreasing starchy vegetables (such as potatoes), as well as reducing total protein foods by reducing meat, poultry, and eggs. This recommendation and the report’s broad emphasis on plant-based foods have drawn criticism, mainly from the food industry.
Also likely to be controversial are the recommendations to move beans, peas, and lentils from the vegetable group to the protein group and the proposed reorganization of the order of the protein foods group to list beans, peas, and lentils first, followed by nuts, seeds, and soy products; then seafood; and finally meats, poultry, and eggs.
Gastroenterologists and dietitians should support the emphasis on plant-based protein sources, water for hydration, and the importance of personalized nutrition plans, including culturally diverse and ethnic food options, said Stephanie Gold, MD, assistant professor of medicine at the Icahn School of Medicine at Mount Sinai and a gastroenterologist at Mount Sinai Hospital, both in New York City.
“The newly proposed 2025 Dietary Guidelines are approaching a Mediterranean-style diet by focusing on plant-based protein sources while limiting red meat and saturated fats, as well as added sugar. By including these legumes in the protein category (not only as a starchy vegetable), the proposed guideline recognizes both the health benefits and sustainability of plant-based proteins,” Gold said in an interview.
Although the report recognizes “the potential negative impact and the varying definitions of ultra-processed foods, it does not provide concrete recommendations regarding intake, and perhaps, this could be an area of focus going forward,” she added.
Anderson noted that the science around ultra-processed food is “underdeveloped.” However, the definition of a healthy diet “has never suggested that we have foods that are extremely processed in it.”
“Right now, there’s a lot of interest in ultra-processed foods and what they mean for health, but the science is going to need to catch up with that interest,” Anderson said.
What’s Next
The release of the scientific report is part of a five-step process to develop the new guidelines that included input from the public during the report’s development. According to the USDA, the advisory committee received approximately 9900 public comments, more than any other previous committee.
Once the new dietary guidelines are complete, Anderson said, “clinicians have an opportunity to really lean into a science-based framework to talk about overall health concerns and reducing the burden of diet-related illnesses with their patients.”
Meanwhile, they can voice their approval or concerns about the scientific report.
Anderson and Gold reported no relevant conflicts of interest.
A version of this article first appeared on Medscape.com.
Fitness Watch Bands Laden With PFHxA May Pose Health Risks
TOPLINE:
Perfluorohexanoic acid (PFHxA) is found in fluoroelastomer watch bands at concentrations of up to 16,662 ng/g, highlighting the need for further research on dermal absorption and exposure risks.
METHODOLOGY:
- Fluoroelastomers are a subclass of polymeric per- and polyfluoroalkyl substances (PFAS), which are used to help wearable device materials maintain their appearance and structure after contact with the skin, sweat, and personal care products (eg, sunscreen).
- Researchers investigated the presence of PFAS in 22 new and used US fitness and smart watch bands from a range of brands and price points, of which 13 were advertised as containing fluoroelastomers.
- Total fluorine concentrations were measured using particle-induced gamma-ray emission spectroscopy with cut pieces of the watch bands.
- Solvent extraction was performed, and targeted analysis for 20 PFAS compounds was conducted using liquid chromatography-tandem mass spectrometry.
- A subset of six watch bands, with the highest and lowest detectable PFAS concentrations (three each), was subjected to a direct total oxidative precursor assay to determine the presence of PFAS precursors.
TAKEAWAY:
- Watch bands advertised as containing fluoroelastomers had total fluorine concentrations ranging from 28.5% to 90.7%; only two of the nine bands not advertised to contain fluoroelastomers had concentrations of this PFAS, which ranged from 28.1% to 49.7%.
- Expensive watch bands showed high fluorine levels, with concentrations ranging from 49.7% to 90.7%, whereas inexpensive bands contained less than 1% fluorine on their surface.
- PFHxA was the most common PFAS, detected in 41% of the watch bands.
- PFXxA had a median concentration of 773 ng/g, much higher than the concentrations found in other consumer products, with one sample showing a concentration of 16,662 ng/g.
IN PRACTICE:
“The thousands of ng/g of PFHxA available, paired with watch band users often wearing these items for more than 12 h per day, poses an opportunity for significant transfer to the dermis and subsequent human exposure,” the authors wrote.
“If the consumer wishes to purchase a higher-priced band, we suggest that they read the product descriptions and avoid any that are listed as containing fluoroelastomers,” said the study’s lead author in a press release.
SOURCE:
The study was led by Alyssa Wicks, University of Notre Dame in Indiana, and published online in Environmental Science & Technology Letters.
LIMITATIONS:
No limitations were reported in the study.
DISCLOSURES:
The study received funding from the University of Notre Dame. The authors declared no competing financial interests.
This article was created using several editorial tools, including AI, as part of the process. Human editors reviewed this content before publication. A version of this article appeared on Medscape.com.