User login
IBD fertility has improved
AUSTIN, TEX. – Patients with inflammatory bowel disease (IBD) who want to have children can benefit from better education about recent findings that disease control, laparoscopic surgery, and in vitro fertilization (IVF) have improved their chances of conceiving, according to a review of published reports presented here at the Crohn’s & Colitis Congress, a partnership of the Crohn’s & Colitis Congress Foundation and the American Gastroenterological Association.
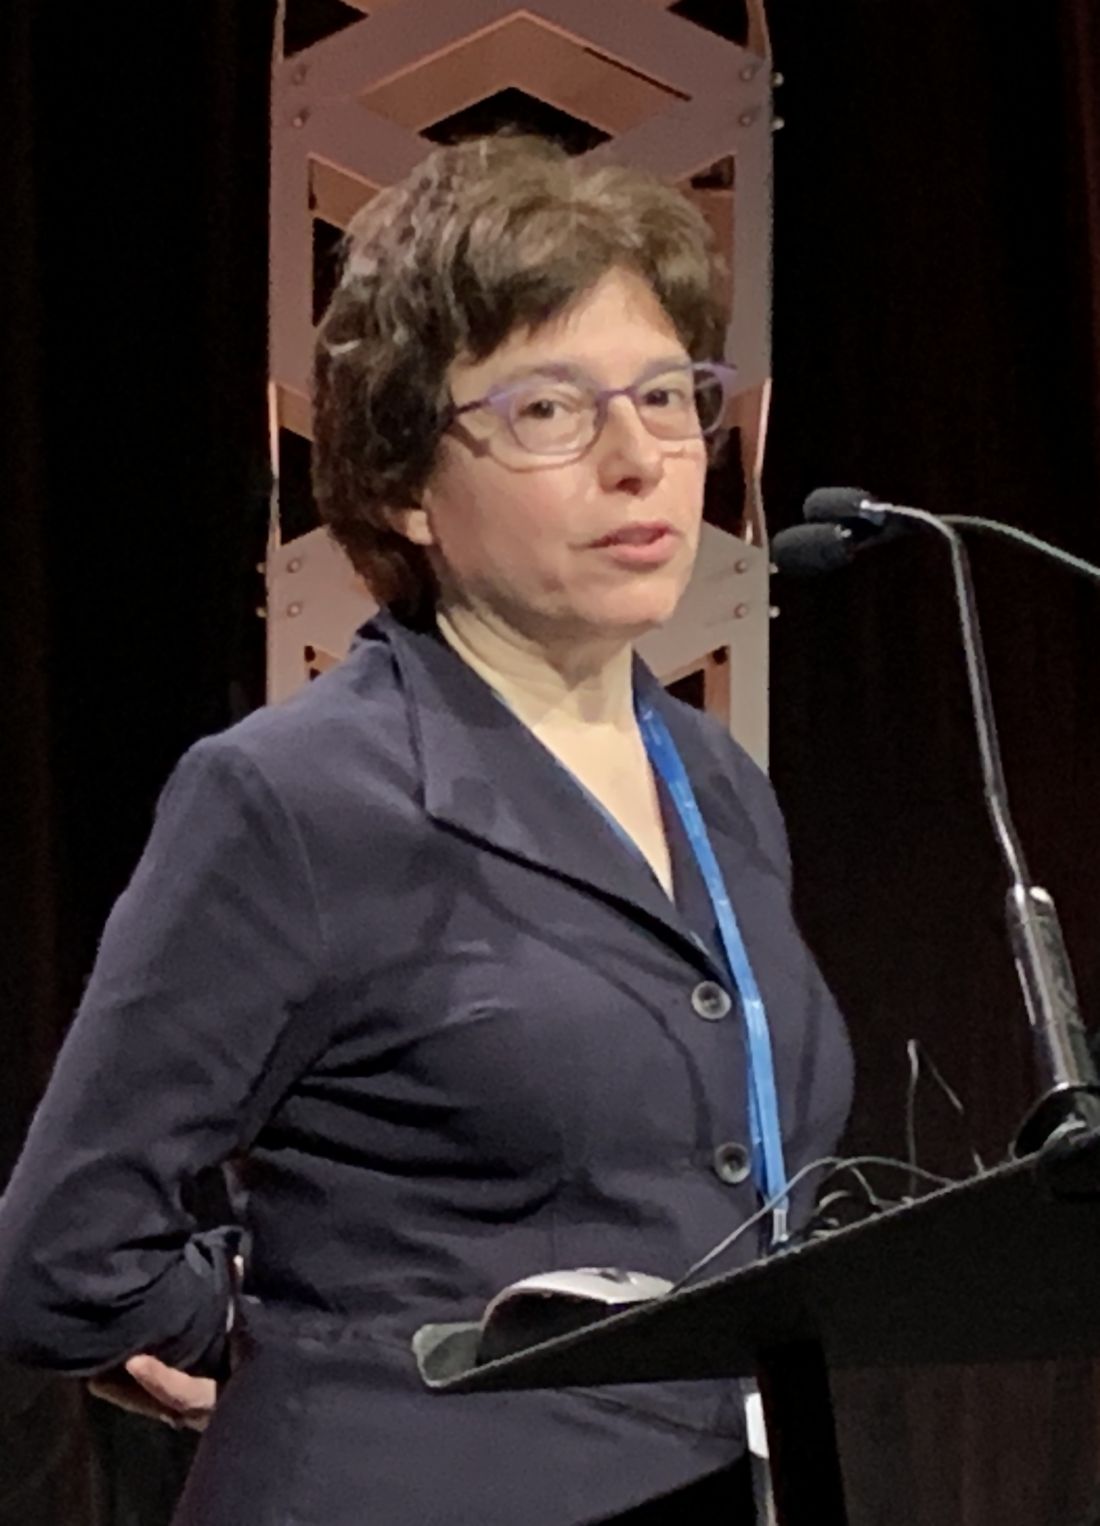
“Decreased fertility in IBD is due to voluntary childlessness, which we can change with education; surgery for IBD, which we can improve with laparoscopic surgery; and increased disease activity, which we can also make a difference in,” Sonia Friedman, MD, of Harvard Medical School, Boston, said in an interview.
Dr. Friedman and coauthors last year published an analysis of the Danish National Birth Cohort, which showed women with IBD had an 28% greater relative risk of taking a year or more to get pregnant than controls without IBD, and that the relative risk was even higher in women with Crohn’s disease — 54% (Clin Gastroenterol Hepatol. 2019. doi: 10.1016/j.cgh.2019.08.031). “We found that women with Crohn’s surgery had decreased fertility by 2.54 times greater relative risk,” she said.
“Fertility, pregnancy is the most important thing to patients,” Dr. Friedman said in an interview. “That’s what people ask me about the most. In the population of IBD patients, the onset is age 15-35, and these people are in the prime of their reproductive years.” Sexual function, known to be decreased in men and women with IBD, is also an overriding concern in these patients, she said. “There needs to be a lot more information out there about it.”
She said gastroenterologists should keep in mind that much of the evidence documenting reduced fertility after ileo-pouch anal anastomosis is dated and focused on open surgery, which caused profound scarring of the pelvis and fallopian tubes, thus hindering conception. Laparoscopic ileoanal J-pouch surgery (IPAA) has yielded much improved outcomes in women of child-bearing age, she said, citing a study late last year that reported women who had laparoscopic IPAA had a median time to pregnancy of 3.5 months versus 9 months for women who had open IPAA (Surgery. 2019;166:670-7).
“It’s really important to discuss the issues of fertility, especially for patients contemplating surgery,” Dr. Friedman said. “Emphasize that there are good outcomes with laparoscopic surgery, and they can have assisted reproductive technology [ART], or in vitro fertilization, if needed. Never withhold surgery based on fear of infertility.”
Her practice is to refer women with IBD in remission for IVF if they’ve tried to get pregnant every month for a year or more and to refer women with IBD surgery for IVF after trying to get pregnant for 6 months. Dr. Friedman coauthored two studies of the Danish National Birth Cohort of ART in women with Crohn’s disease and ulcerative colitis (UC) along with controls (Gut. 2016;65:767-76; Gut. 2017;66:556-58). “We found that women with Crohn’s and UC had a decreased chance of having a clinical pregnancy, but they had no problem carrying the pregnancy to term,” she said.
Those findings raised questions about the etiology of decreased fertility in IBD patients, which could include factors such as IVF technique, reproductive hormone and microbiome changes, or IBD medications. “How can we carry that forward to all women with IBD?” she said. Women with IBD have less chance of conceiving with each IVF treatment cycle than do women without IBD, she said. “The most interesting thing is that the reduced chance of live birth after IVF treatment in Crohn’s and UC is related to the stages of implantation and not to the ability to maintain the fetus throughout pregnancy,” she said.
Dr. Friedman has no financial relationships to disclose.
SOURCE: Friedman S. Crohn’s & Colitis Congress, Session Sp86.
AUSTIN, TEX. – Patients with inflammatory bowel disease (IBD) who want to have children can benefit from better education about recent findings that disease control, laparoscopic surgery, and in vitro fertilization (IVF) have improved their chances of conceiving, according to a review of published reports presented here at the Crohn’s & Colitis Congress, a partnership of the Crohn’s & Colitis Congress Foundation and the American Gastroenterological Association.
“Decreased fertility in IBD is due to voluntary childlessness, which we can change with education; surgery for IBD, which we can improve with laparoscopic surgery; and increased disease activity, which we can also make a difference in,” Sonia Friedman, MD, of Harvard Medical School, Boston, said in an interview.
Dr. Friedman and coauthors last year published an analysis of the Danish National Birth Cohort, which showed women with IBD had an 28% greater relative risk of taking a year or more to get pregnant than controls without IBD, and that the relative risk was even higher in women with Crohn’s disease — 54% (Clin Gastroenterol Hepatol. 2019. doi: 10.1016/j.cgh.2019.08.031). “We found that women with Crohn’s surgery had decreased fertility by 2.54 times greater relative risk,” she said.
“Fertility, pregnancy is the most important thing to patients,” Dr. Friedman said in an interview. “That’s what people ask me about the most. In the population of IBD patients, the onset is age 15-35, and these people are in the prime of their reproductive years.” Sexual function, known to be decreased in men and women with IBD, is also an overriding concern in these patients, she said. “There needs to be a lot more information out there about it.”
She said gastroenterologists should keep in mind that much of the evidence documenting reduced fertility after ileo-pouch anal anastomosis is dated and focused on open surgery, which caused profound scarring of the pelvis and fallopian tubes, thus hindering conception. Laparoscopic ileoanal J-pouch surgery (IPAA) has yielded much improved outcomes in women of child-bearing age, she said, citing a study late last year that reported women who had laparoscopic IPAA had a median time to pregnancy of 3.5 months versus 9 months for women who had open IPAA (Surgery. 2019;166:670-7).
“It’s really important to discuss the issues of fertility, especially for patients contemplating surgery,” Dr. Friedman said. “Emphasize that there are good outcomes with laparoscopic surgery, and they can have assisted reproductive technology [ART], or in vitro fertilization, if needed. Never withhold surgery based on fear of infertility.”
Her practice is to refer women with IBD in remission for IVF if they’ve tried to get pregnant every month for a year or more and to refer women with IBD surgery for IVF after trying to get pregnant for 6 months. Dr. Friedman coauthored two studies of the Danish National Birth Cohort of ART in women with Crohn’s disease and ulcerative colitis (UC) along with controls (Gut. 2016;65:767-76; Gut. 2017;66:556-58). “We found that women with Crohn’s and UC had a decreased chance of having a clinical pregnancy, but they had no problem carrying the pregnancy to term,” she said.
Those findings raised questions about the etiology of decreased fertility in IBD patients, which could include factors such as IVF technique, reproductive hormone and microbiome changes, or IBD medications. “How can we carry that forward to all women with IBD?” she said. Women with IBD have less chance of conceiving with each IVF treatment cycle than do women without IBD, she said. “The most interesting thing is that the reduced chance of live birth after IVF treatment in Crohn’s and UC is related to the stages of implantation and not to the ability to maintain the fetus throughout pregnancy,” she said.
Dr. Friedman has no financial relationships to disclose.
SOURCE: Friedman S. Crohn’s & Colitis Congress, Session Sp86.
REPORTING FROM CROHN’S & COLITIS CONGRESS
Tildrakizumab signals safe for pregnant psoriasis patients
A post hoc analysis of .
“Although contraception in female patients of childbearing age was mandatory before initiation of and during tildrakizumab therapy, some pregnancies occurred during the tildrakizumab clinical development program as protocol violations,” wrote Kathleen Haycraft, MD, of Riverside Dermatology & Spa, Hannibal, Mo., and colleagues.
Tildrakizumab (Ilumya), an interleukin-23 antagonist, was approved in 2018 by the Food and Drug Administration for treatment of adults with moderate to severe plaque psoriasis who are candidates for systemic therapy or phototherapy. Effects on birth outcomes or on neonates exposed during pregnancy have not been studied, the researchers said.
“Tildrakizumab plasma half-life after subcutaneous administration is approximately 25 days; therefore, tildrakizumab administered even in the first trimester may cross the placental barrier,” they noted.
In a research letter published in the British Journal of Dermatology, the investigators reviewed data from nine phase 1, 2, and 3 clinical trials and identified 528 women of childbearing age who received tildrakizumab. Fourteen pregnancies were reported among these women: six from a contraceptive failure, and eight for lack of contraception use. (One of the phase 1 trials was in patients with Crohn’s disease, which included one of the pregnancies; the rest were in patients with psoriasis.)
The 14 pregnancy outcomes included 2 spontaneous abortions (14.3%), 4 elective abortions (28.6%), and 8 live births (57.1%), which included 1 premature birth, with “no identifiable congenital anomalies,” the authors wrote. The longest duration of exposure to tildrakizumab in a pregnant woman was 1,196 days; this pregnancy resulted in a premature live birth at 36 weeks with no anomalies. The spontaneous abortion rate was similar to the rate in the general population, which is 12%-15%, the authors noted.
While the study “adds to the existing evidence on the outcomes of biologic treatment of psoriasis,” the findings were limited by several factors including the small number of pregnancies, short duration of exposure to tildrakizumab, variations in dosing, and lack of controls, the researchers noted. “Additional data from a larger population following tildrakizumab exposure are required to fully evaluate the safety and tolerability of tildrakizumab treatment during pregnancy,” they said. In the meantime, they advised women of childbearing age with psoriasis to continue to avoid pregnancy and follow practice guidelines for contraceptive use while taking the biologic therapy.
The studies were supported by Merck Sharp & Dohme, a Merck & Co. subsidiary; analyses were supported by Sun Pharmaceutical Industries. Lead author Dr. Haycraft disclosed relationships with companies including Sun, Celgene, Lilly, Novartis, Ortho-Derm, and Pfizer. Other authors disclosed relationships with Novartis, Celgene, Ortho Dermatologics, Janssen, and Merck; two authors are Sun employees.
SOURCE: Haycraft K et al. Br J Dermatol. 2020 Jan 29. doi: 10.1111/bjd.18897.
FROM THE BRITISH JOURNAL OF DERMATOLOGY
Helping patients at the end of their lives
My wife thinks I am a little morbid, because I still read the local Sunday newspaper not to catch up on the news, and certainly not for the ads, but mostly to read the obituaries.

All of us have elderly patients, and I am growing old with many of my older patients. Now after treating many thousands of patients whom I have grown to know well, it is not unusual to see an obituary of someone my office staff and I know in the newspaper on a weekly basis.
We send sympathy cards, sometimes I write a personal note to the spouse or family, and several times a year, some of my staff and I will go to the funeral or memorial ceremony.
I usually ask if they died well, comfortably with family, or better yet, suddenly, dropping dead like a stone. This is the unspoken, though usually unrealized, goal of many of us from the world of medicine.
All physicians who have been surrounded by death, some horrible deaths, want to die well. I think it is difficult to do, although my mother came close.
One day when dropping off her best little friend (my 10-year-old daughter), she said “look here, I’ve got a knot in my belly button.” I felt the blood rushing to my head and before I could stop her, she showed me her Sister Mary Joseph nodule, a sign of metastatic internal malignancy. I sat stunned as she looked at me; her eyes showed she already knew my answer.
She lasted at home for 6 weeks, went into hospice, and died 36 hours later.
The last morning before she died, I took my daughter to see her before school. She woke up and called her “sugar” and had her climb into bed with her and snuggle. I got choked up and tearful and started telling her how much I loved her and how sorry I was and how much we would miss her. She looked over at me, and with anger in her voice, told me to be quiet, and explained that death comes to everyone eventually and just to get over it. In retrospect, I understand now that I was not helping her die well.
I am telling this story to bring up a point about professionalism. , this becomes important as the life cycle ends. Aged patients sometimes start blossoming with skin cancers. You must carefully gauge how much “treatment” a patient really needs.
You have a conflict. You get paid to diagnose and treat skin cancers. You must shift roles and become the patient’s protector, and treat the patient as if he or she was your parent. Less, sometimes much less, is often more. Perhaps you only biopsy and treat rapidly growing cancers that endanger crucial structures. You ignore the noninvasive tumors on the trunk and extremities. It is a fine and difficult line to walk.
Patients know they are dying, and at certain stages of grieving will want everything possible done, especially if it is visible. Skin wounds, even from curetting, salves, and cryotherapy, can be painful and sometimes disabling. You must resist unnecessary treatments, temporize if possible, discuss quality time with the patient and the family, and reach a consensus on how aggressive not to be. You must help them die well.
You are not only a healer, but as a master physician you – yes, even you the dermatologist – must also be a helpful guide at the end of life. I am sad to see patients, my old friends, in the newspaper, but feel secretly satisfied if I have spared them unnecessary suffering.
Dr. Coldiron is in private practice but maintains a clinical assistant professorship at the University of Cincinnati. He cares for patients, teaches medical students and residents, and has several active clinical research projects. Dr. Coldiron is the author of more than 80 scientific letters, papers, and several book chapters, and he speaks frequently on a variety of topics. He is a past president of the American Academy of Dermatology. Write to him at [email protected].
My wife thinks I am a little morbid, because I still read the local Sunday newspaper not to catch up on the news, and certainly not for the ads, but mostly to read the obituaries.
All of us have elderly patients, and I am growing old with many of my older patients. Now after treating many thousands of patients whom I have grown to know well, it is not unusual to see an obituary of someone my office staff and I know in the newspaper on a weekly basis.
We send sympathy cards, sometimes I write a personal note to the spouse or family, and several times a year, some of my staff and I will go to the funeral or memorial ceremony.
I usually ask if they died well, comfortably with family, or better yet, suddenly, dropping dead like a stone. This is the unspoken, though usually unrealized, goal of many of us from the world of medicine.
All physicians who have been surrounded by death, some horrible deaths, want to die well. I think it is difficult to do, although my mother came close.
One day when dropping off her best little friend (my 10-year-old daughter), she said “look here, I’ve got a knot in my belly button.” I felt the blood rushing to my head and before I could stop her, she showed me her Sister Mary Joseph nodule, a sign of metastatic internal malignancy. I sat stunned as she looked at me; her eyes showed she already knew my answer.
She lasted at home for 6 weeks, went into hospice, and died 36 hours later.
The last morning before she died, I took my daughter to see her before school. She woke up and called her “sugar” and had her climb into bed with her and snuggle. I got choked up and tearful and started telling her how much I loved her and how sorry I was and how much we would miss her. She looked over at me, and with anger in her voice, told me to be quiet, and explained that death comes to everyone eventually and just to get over it. In retrospect, I understand now that I was not helping her die well.
I am telling this story to bring up a point about professionalism. , this becomes important as the life cycle ends. Aged patients sometimes start blossoming with skin cancers. You must carefully gauge how much “treatment” a patient really needs.
You have a conflict. You get paid to diagnose and treat skin cancers. You must shift roles and become the patient’s protector, and treat the patient as if he or she was your parent. Less, sometimes much less, is often more. Perhaps you only biopsy and treat rapidly growing cancers that endanger crucial structures. You ignore the noninvasive tumors on the trunk and extremities. It is a fine and difficult line to walk.
Patients know they are dying, and at certain stages of grieving will want everything possible done, especially if it is visible. Skin wounds, even from curetting, salves, and cryotherapy, can be painful and sometimes disabling. You must resist unnecessary treatments, temporize if possible, discuss quality time with the patient and the family, and reach a consensus on how aggressive not to be. You must help them die well.
You are not only a healer, but as a master physician you – yes, even you the dermatologist – must also be a helpful guide at the end of life. I am sad to see patients, my old friends, in the newspaper, but feel secretly satisfied if I have spared them unnecessary suffering.
Dr. Coldiron is in private practice but maintains a clinical assistant professorship at the University of Cincinnati. He cares for patients, teaches medical students and residents, and has several active clinical research projects. Dr. Coldiron is the author of more than 80 scientific letters, papers, and several book chapters, and he speaks frequently on a variety of topics. He is a past president of the American Academy of Dermatology. Write to him at [email protected].
Flow-mediated dilation of brachial artery predicts renal dysfunction in sickle cell disease
Sonographic flow-mediated dilation (FMD) of the brachial artery predicts renal dysfunction in patients with sickle cell disease (SCD), according to investigators.

This is the first study to show that FMD – a surrogate biomarker for endothelial dysfunction – inversely correlates with renal artery resistivity index (RARI) and serum cystatin C, reported lead author Oluwagbemiga Oluwole Ayoola, MBChB, of Obafemi Awolowo University in Ile-Ife, Nigeria, and colleagues.
“[B]rachial artery FMD is an essential test in the management of SCD patients for noninvasive assessment of the vascular endothelium,” the investigators wrote in Kidney360. They went on to suggest that FMD could be used to detect early renal impairment in sickle cell disease.
The study involved 44 patients with steady-state, homozygous SCD (HbSS) and 33 age- and sex-matched controls (HbAA). Eligibility criteria excluded individuals with risk factors for endothelial dysfunction, such as obesity, diabetes, and hypertension, as well as those with thalassemia carrier traits.
For each participant, various data were gathered, including demographic and clinical characteristics, serum assays, FMD measurement of the brachial artery, and RARI.
Results showed that patients with sickle cell disease had a significantly lower median FMD value than that of healthy controls (3.44 vs. 5.35; P = .043).
Among patients with SCD, FMD was negatively and independently correlated with RARI (r = -.307; P = .042) and serum cystatin C (r = -.372; P = .013), correlations that the investigators described as “modest.” FMD was not associated with any other biomarkers of SCD severity, such as homocysteine, fetal hemoglobin, or soluble platelet selectin.
Patients in the SCD cohort were further subdivided into two groups based on an FMD cut-off value of 5.35, which was the median measurement among healthy controls. This revealed that median cystatin C level was significantly higher in patients with an FMD value less than 5.35, compared with those who had an FMD value of 5.35 or more.
“[The study] findings suggest that SCD patients with impaired FMD are more likely to have impaired renal function,” the investigators wrote. The results support previous research, they added.
“Even though our findings show relationships rather than causation, we believe it is still a step forward in the ongoing quest to unravel the mysteries of this genetic disease,” they concluded. “Determining the exact age at which FMD impairment [begins] in children with sickle cell disease could be the subject of a future study.”
The study was funded by the Obafemi Awolowo University Teaching Hospital. The investigators reported no conflicts of interest.
SOURCE: Ayoola et al. Kidney360. 2020 Jan 30. doi: 10.34067/KID.0000142019.
Sonographic flow-mediated dilation (FMD) of the brachial artery predicts renal dysfunction in patients with sickle cell disease (SCD), according to investigators.
This is the first study to show that FMD – a surrogate biomarker for endothelial dysfunction – inversely correlates with renal artery resistivity index (RARI) and serum cystatin C, reported lead author Oluwagbemiga Oluwole Ayoola, MBChB, of Obafemi Awolowo University in Ile-Ife, Nigeria, and colleagues.
“[B]rachial artery FMD is an essential test in the management of SCD patients for noninvasive assessment of the vascular endothelium,” the investigators wrote in Kidney360. They went on to suggest that FMD could be used to detect early renal impairment in sickle cell disease.
The study involved 44 patients with steady-state, homozygous SCD (HbSS) and 33 age- and sex-matched controls (HbAA). Eligibility criteria excluded individuals with risk factors for endothelial dysfunction, such as obesity, diabetes, and hypertension, as well as those with thalassemia carrier traits.
For each participant, various data were gathered, including demographic and clinical characteristics, serum assays, FMD measurement of the brachial artery, and RARI.
Results showed that patients with sickle cell disease had a significantly lower median FMD value than that of healthy controls (3.44 vs. 5.35; P = .043).
Among patients with SCD, FMD was negatively and independently correlated with RARI (r = -.307; P = .042) and serum cystatin C (r = -.372; P = .013), correlations that the investigators described as “modest.” FMD was not associated with any other biomarkers of SCD severity, such as homocysteine, fetal hemoglobin, or soluble platelet selectin.
Patients in the SCD cohort were further subdivided into two groups based on an FMD cut-off value of 5.35, which was the median measurement among healthy controls. This revealed that median cystatin C level was significantly higher in patients with an FMD value less than 5.35, compared with those who had an FMD value of 5.35 or more.
“[The study] findings suggest that SCD patients with impaired FMD are more likely to have impaired renal function,” the investigators wrote. The results support previous research, they added.
“Even though our findings show relationships rather than causation, we believe it is still a step forward in the ongoing quest to unravel the mysteries of this genetic disease,” they concluded. “Determining the exact age at which FMD impairment [begins] in children with sickle cell disease could be the subject of a future study.”
The study was funded by the Obafemi Awolowo University Teaching Hospital. The investigators reported no conflicts of interest.
SOURCE: Ayoola et al. Kidney360. 2020 Jan 30. doi: 10.34067/KID.0000142019.
FROM KIDNEY360
Funding failures: Tobacco prevention and cessation
When it comes to state funding for tobacco prevention and cessation, the American Lung Association grades on a curve. It did not help.

Each state’s annual funding for tobacco prevention and cessation was calculated and then compared with the Centers for Disease Control and Prevention’s recommended spending level. That percentage became the grade, with any level of funding at 80% or more of the CDC’s recommendation getting an A and anything below 50% getting an F, the ALA explained.
The three A’s went to Alaska – which spent $10.14 million, or 99.4% of the CDC-recommended $10.2 million – California (96.0%), and Maine (83.5%). The lowest levels of spending came from Georgia, which spend just 2.8% of the CDC’s recommendation of $106 million, and Missouri, which spent 3.0%, the ALA reported.
States’ grades were generally better in the four other areas of tobacco-control policy: There were 24 A’s and 9 F’s for smoke-free air laws, 1 A and 35 F’s for tobacco excise taxes, 3 A’s and 17 F’s for access to cessation treatment, and 10 A’s and 30 F’s for laws to raise the tobacco sales age to 21 years, the ALA said in the report.
Despite an overall grade of F, the federal government managed to earn some praise in that last area: “In what could only be described as unimaginable even 2 years ago, in December 2019, Congress passed bipartisan legislation to raise the minimum age of sale for tobacco products to 21,” the ALA said.
The federal government was strongly criticized on the subject of e-cigarettes. “The Trump Administration failed to prioritize public health over the tobacco industry with its Jan. 2, 2020, announcement that will leave thousands of flavored e-cigarettes on the market,” the ALA said, while concluding that the rising use of e-cigarettes in recent years “is a real-world demonstration of the failure of the U.S. Food and Drug Administration to properly oversee all tobacco products. … This failure places the lung health and lives of Americans at risk.”
When it comes to state funding for tobacco prevention and cessation, the American Lung Association grades on a curve. It did not help.
Each state’s annual funding for tobacco prevention and cessation was calculated and then compared with the Centers for Disease Control and Prevention’s recommended spending level. That percentage became the grade, with any level of funding at 80% or more of the CDC’s recommendation getting an A and anything below 50% getting an F, the ALA explained.
The three A’s went to Alaska – which spent $10.14 million, or 99.4% of the CDC-recommended $10.2 million – California (96.0%), and Maine (83.5%). The lowest levels of spending came from Georgia, which spend just 2.8% of the CDC’s recommendation of $106 million, and Missouri, which spent 3.0%, the ALA reported.
States’ grades were generally better in the four other areas of tobacco-control policy: There were 24 A’s and 9 F’s for smoke-free air laws, 1 A and 35 F’s for tobacco excise taxes, 3 A’s and 17 F’s for access to cessation treatment, and 10 A’s and 30 F’s for laws to raise the tobacco sales age to 21 years, the ALA said in the report.
Despite an overall grade of F, the federal government managed to earn some praise in that last area: “In what could only be described as unimaginable even 2 years ago, in December 2019, Congress passed bipartisan legislation to raise the minimum age of sale for tobacco products to 21,” the ALA said.
The federal government was strongly criticized on the subject of e-cigarettes. “The Trump Administration failed to prioritize public health over the tobacco industry with its Jan. 2, 2020, announcement that will leave thousands of flavored e-cigarettes on the market,” the ALA said, while concluding that the rising use of e-cigarettes in recent years “is a real-world demonstration of the failure of the U.S. Food and Drug Administration to properly oversee all tobacco products. … This failure places the lung health and lives of Americans at risk.”
Biopsy not required to diagnose most cases of pediatric celiac disease
(ESPGHAN). The authors recommend that the diagnosis be established with a two-stage blood test instead of an endoscopy, which children often find distressing.
The guidance was published in the Journal of Pediatric Gastroenterology and Nutrition. The document is an update of ESPGHAN’s 2012 guidance.
About half of children with suspected celiac disease undergo a biopsy to confirm the diagnosis. By reducing the number of biopsies, and the anesthesia required to perform them, the new guidelines could reduce European health care costs.
Steffen Husby, MD, of Odense (Denmark) University Hospital, and colleagues recommend testing for total IgA and anti-intestinal transglutaminase 2 (TGA-IgA) antibodies as initial screening in children with suspected celiac disease. An IgG-based test is indicated only when total IgA is low or undetectable, according to the authors. Physicians should refer children with positive results to a pediatric gastroenterologist. If the level of TGA-IgA is 10 or more times the upper limit of normal, and the family agrees, the physician may diagnose celiac disease without a biopsy, provided that endomysial antibodies test positive in a second blood sample, according to the guidance. For children with a positive TGA-IgA level of less than 10 times the upper limit of normal, however, at least four biopsies from the distal duodenum and at least one from the bulb are required to establish the diagnosis.
Physicians can diagnose celiac disease in children with no symptoms without the need for a biopsy using the same criteria as they use for symptomatic children, wrote Dr. Husby and colleagues. Clinicians, parents, and, when appropriate, children should participate in the decision about whether to perform a biopsy.
Celiac disease is the most prevalent food-related chronic disease in European children, but as much as 80% of children with celiac disease are undiagnosed. The prevalence of celiac disease is increasing, and undiagnosed children with this disease are at risk of nutritional and developmental problems, as well as long-term health complications. Although celiac disease is easy to detect and treat, 10-13 years may elapse between symptom onset and the time of diagnosis. The new guidelines are intended to facilitate diagnosis and increase its accuracy, thus enabling earlier diagnosis and improved detection, according to ESPGHAN.
“These new guidelines mean that more than half of all children being investigated for celiac disease will no longer need to have an invasive biopsy,” said Luisa Mearin Manrique, MD, PhD, professor of pediatrics at Leiden (the Netherlands) University and senior author of the guidelines, in a press release. “This is a big step forward in our mission to ensure that children can be diagnosed and effectively treated for celiac disease. It is scandalous that so many children go so long, often up to 10 years, without diagnosis. Removing the need for biopsy in order to achieve diagnosis will reduce the stresses associated with such an invasive procedure and mean that diagnoses are quicker and cheaper for health care systems.”
No conflicts of interest were reported.
SOURCE: Husby S et al. J Pediatr Gastroenterol Nutr. 2020;70(1):141-56.
FROM THE JOURNAL OF PEDIATRIC GASTROENTEROLOGY AND NUTRITION
Social determinants of health and the hospitalist
Are access to housing and food as important as therapeutics?
While physicians acknowledge that the social determinants of health can impact outcomes from medical care, some may feel that trying to address factors such as homelessness, food insecurity, or lack of ready access to transportation or pharmacy services is just not part of the doctor’s job. A majority of 621 physicians surveyed in the summer of 2017 by Salt Lake City–based health care intelligence firm Leavitt Partners say they are neither capable of nor responsible for addressing such issues.1

But that view may become unsustainable as the U.S. health care system continues to advance toward value- and population-based models of health care and as evidence mounts that social factors are important contributors to costly outcomes, such as avoidable hospital readmissions or emergency room visits. A recent report from the Robert Wood Johnson Foundation estimates that at least 40% of health outcomes are the result of social and economic factors, while only 20% can be attributed to medical care.2
“This is a hot topic – getting a lot of attention these days,” said hospitalist and care transitions expert Ramon Jacobs-Shaw, MD, MPA, regional medical officer for CareMore Health, a California-based physician-led health delivery organization and subsidiary of Anthem. “If you go around the country, some doctors still see social factors as the realm of the social worker. But large health care organizations are coming to recognize that social determinants are huge contributors to the health of their members and to the outcomes of their care.”
Hospitalists could be the natural providers to delve into the specific psychosocial aspects of their patients’ lives, or try to figure out how those factors contribute to health care needs, Dr. Jacobs-Shaw said. They typically confront such issues while the patient is in the hospital bed, but what are the steps that led to the hospitalization in the first place? What will happen after the patient is discharged?
“For example, if patients lack transportation, how can they get to their follow-up medical appointment in the primary care office in order to manage their diabetes? If you can’t follow up with them, their diabetes could get out of control, with complications as a result, such as an infected wound,” he said. Another big issue is access to affordable medications. “CareMore has pharmacists embedded on our care teams. They try to figure out the best medicine for the patient but at the lowest cost. They meet individually with patients and do medication counseling, particularly for those with polypharmacy issues.”
Making health care more equitable
Dr. Jacobs-Shaw has long held a personal interest in issues of inclusiveness, diversity, and how to make health care more equitable for historically underserved groups. Asking how to have a bigger impact on these issues is what brought him, after 13 years as a hospitalist on the East Coast, to CareMore, a company that has made addressing social needs central to its care model. “In California, where I am based, we are a wrap-around for patients who are covered by Medicare Advantage plans. We are whatever the patient needs us to be.”
He oversees a group of hospitalists, dubbed extensivists, who provide advanced patient care and chronic disease management. In the extensivist model, physicians and advanced practice nurses provide comprehensive and coordinated care to patients with complex medical issues, taking their scope of practice beyond the hospital into homes, post-acute care facilities, and other settings, with a focus on keeping patients healthier and reducing readmission.3
“Our patients get access to extra services and resources, some of which are available at our care centers – which are one-stop outpatient facilities. We also focus on a lot of things physicians didn’t historically think were within their wheelhouse. Hospitalists deal with these kinds of issues every day, but may not label them as social determinants of health,” Dr. Jacobs-Shaw said. He emphasized that hospitalists should realize that they are not powerless to address these issues, working in partnership with other groups in and out of the hospital. They should also know that health care payers increasingly are dedicating resources to these issues.
“We just started trying to address homelessness through a pilot in Orange County, working with nonprofit organizations and philanthropy to offer a transitional site of care for our patients who are being discharged from the hospital and have housing insecurity issues, to get them transitioned into more secure housing,” Dr. Jacobs-Shaw said. CareMore also has a transportation collaborative that offers no-cost, nonemergency transportation to medical appointments. “That’s meeting them where they are at, based on an assessment of their needs and resources.”
What are social determinants?
The social determinants of health – social, environmental, and other nonmedical factors that contribute to overall health status and medical need – have been defined by the World Health Organization as: “conditions in which people are born, grow, live, work, and age.” That is a broad complex of overlapping social and systems issues, but it provides a context for a broader understanding of the patient’s health and response to medical interventions.
Socioeconomic status is a huge determinant. Level of education may be more important than income if the person lacks the health literacy to navigate the system and access needed care. Housing instability may include poor sanitation, substandard dwellings, or unsafe neighborhoods – all of which can affect a person’s well-being. Environmental health may include compromised air quality – which can impact pulmonary health. Other issues include access to employment and child care, utility needs, and interpersonal violence.
A 2014 paper in Annals of Internal Medicine found that residence within a disadvantaged neighborhood was a factor in hospital readmission rates as often as was chronic pulmonary disease.4 A recent report on social determinants of health by the National Institute for Health Care Management notes that patients with food insecurity are 2.4 times more likely to go to the emergency room, while those with transportation needs are 2.6 times more likely.5
What can health care leaders do to better equip their clinicians and teams to help patients deal with this array of complex needs? Intermountain Healthcare, based in Salt Lake City, spearheaded in 2018 the development of the Alliance for the Determinants of Health, starting in the communities of Ogden and St. George, Utah. The Alliance seeks to promote health, improve access to care, and decrease health care costs through a charitable contribution of $12 million over 3 years to seed collaborative demonstration projects.
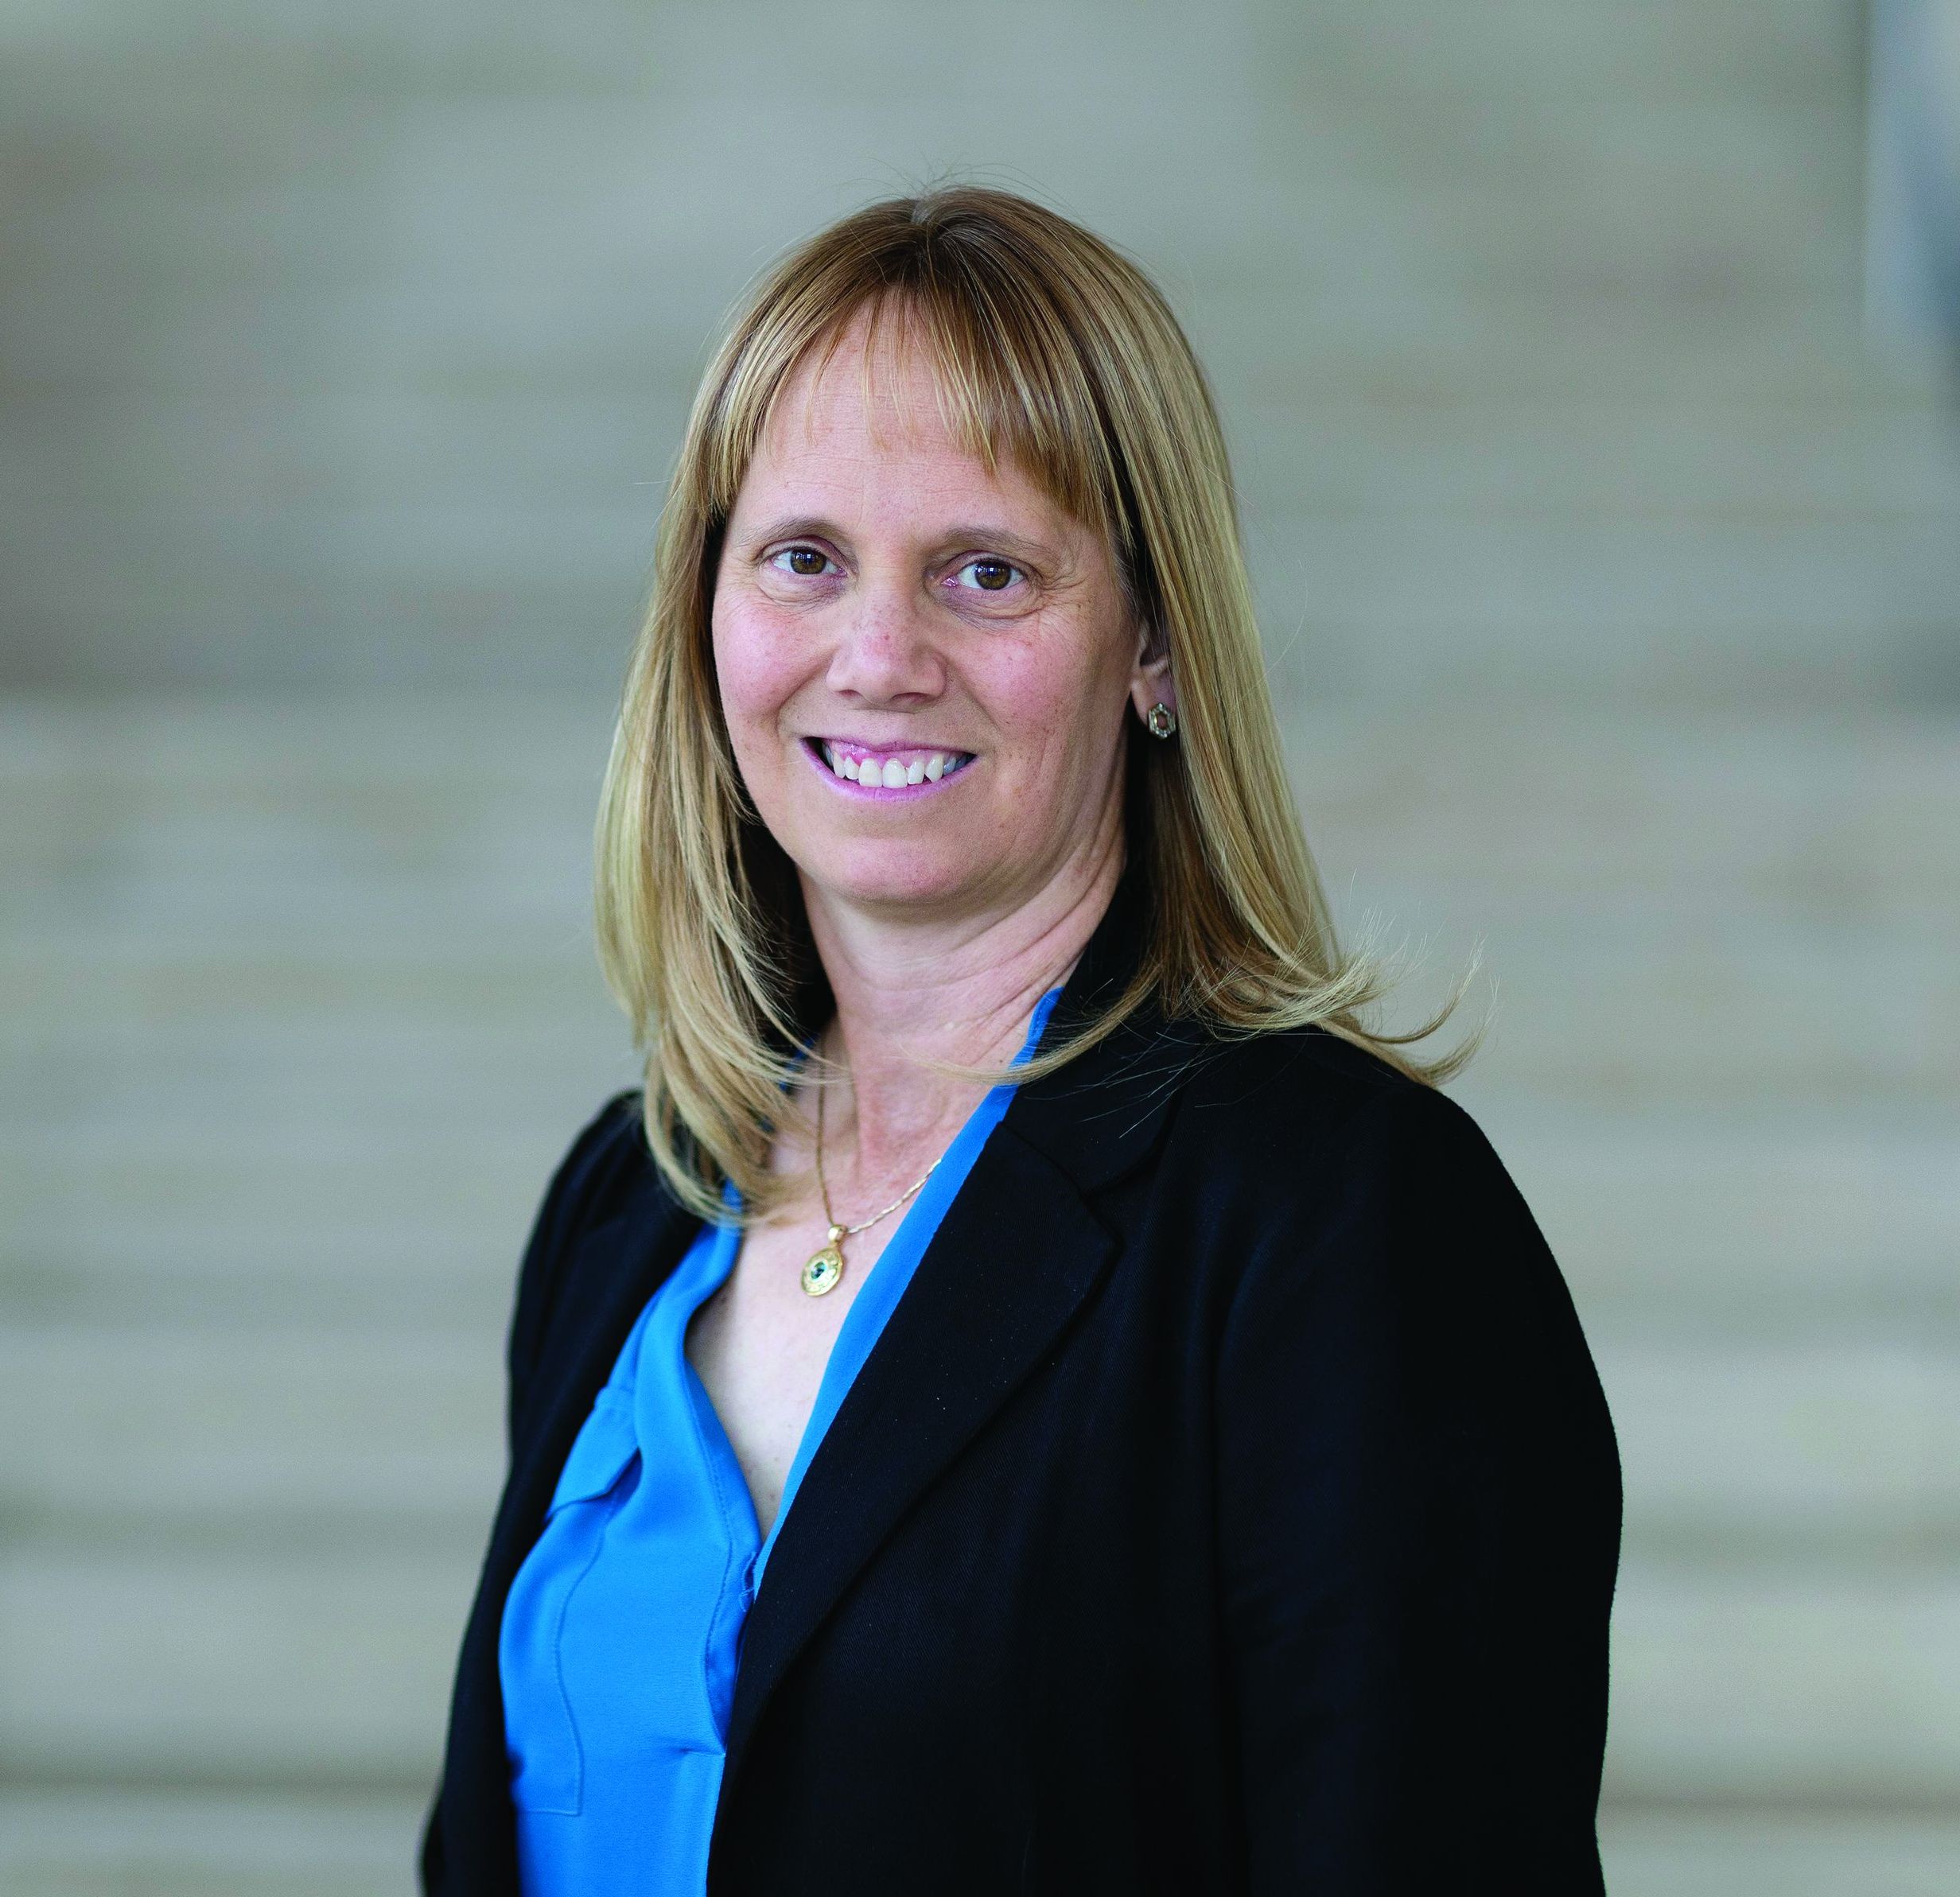
Lisa Nichols, assistant vice president for community health at Intermountain, said that, while hospitalists were not directly involved in planning the Alliance, hospitalists and ED physicians have become essential to the patient-screening process for health and social needs.
“We met with hospitalists, emergency departments, and hospital administrators, because we wanted their feedback on how to raise awareness of the social needs of patients,” she said. “They have good ideas. They see the patients who come in from the homeless shelters.”
Other hospitals are subsidizing apartments for homeless patients being discharged from the hospital. CommonSpirit Health, the new national Catholic health care organization formed by the 2019 merger of Dignity Health and Catholic Health Initiatives, has explored how to help create and sustain affordable housing in the communities it serves. Investments like this have inspired others, such as Kaiser Permanente, to get involved in supporting housing initiatives.6
Comprehensive community care
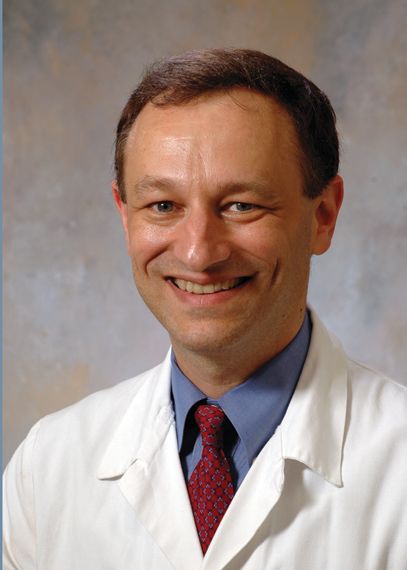
David Meltzer, MD, PhD, a hospitalist and professor of medicine at the University of Chicago, said most hospitalists these days believe social determinants of health are part of their job responsibilities.
“That’s not to say we all do it well. We may fail at addressing some of the barriers our patients face. But I don’t know anyone who still says it’s not their job,” he said.
Since 2012, Dr. Meltzer has led a pilot called Comprehensive Care Physicians (CCP), in which the same physician cares for patients with chronic health problems in the clinic and in the hospital, working with a team of nurse practitioners, social workers, care coordinators, and other specialists. A total of 2,000 patients with chronic health problems were enrolled in the study from 2012 to 2016, half assigned to standard care and half assigned to five CCP doctors. The result: The CCP model has shown large improvements in outcomes – particularly among the more vulnerable, less activated patients, is preferred by patients, and has significantly reduced health care utilization.
The next step for the research team is another randomized controlled trial called Comprehensive Care, Community, and Culture, designed to address unmet social needs. Study group patients will also be screened for unmet social needs and have access to a community health worker and to the initiative’s Artful Living Program, which includes community and cultural activities like yoga and dance classes, cooking classes, art classes, and music concerts. To address the complex dimensions and determinants of health, Dr. Meltzer explained, efforts to improve health must extend to sectors far beyond traditional health care.
“I think trying to understand your patients’ social and nonmedical needs starts with getting to know them, and asking about their needs,” he said. “The better you know them, the better you are able to make medical decisions that will promote positive outcomes.”
Sound Physicians, a national hospitalist company based in Tacoma, Wash., and working in 350 hospitals in 41 states, recently published a blog post on its website about the importance of social determinants of health.7 Sound Physicians participates in value-based care through bundled Medicare/Medicaid contracts based on episodes of care for hospitalized patients with certain diagnoses or DRGs, explained John Dickey, MD, the company’s chief medical officer for population health.
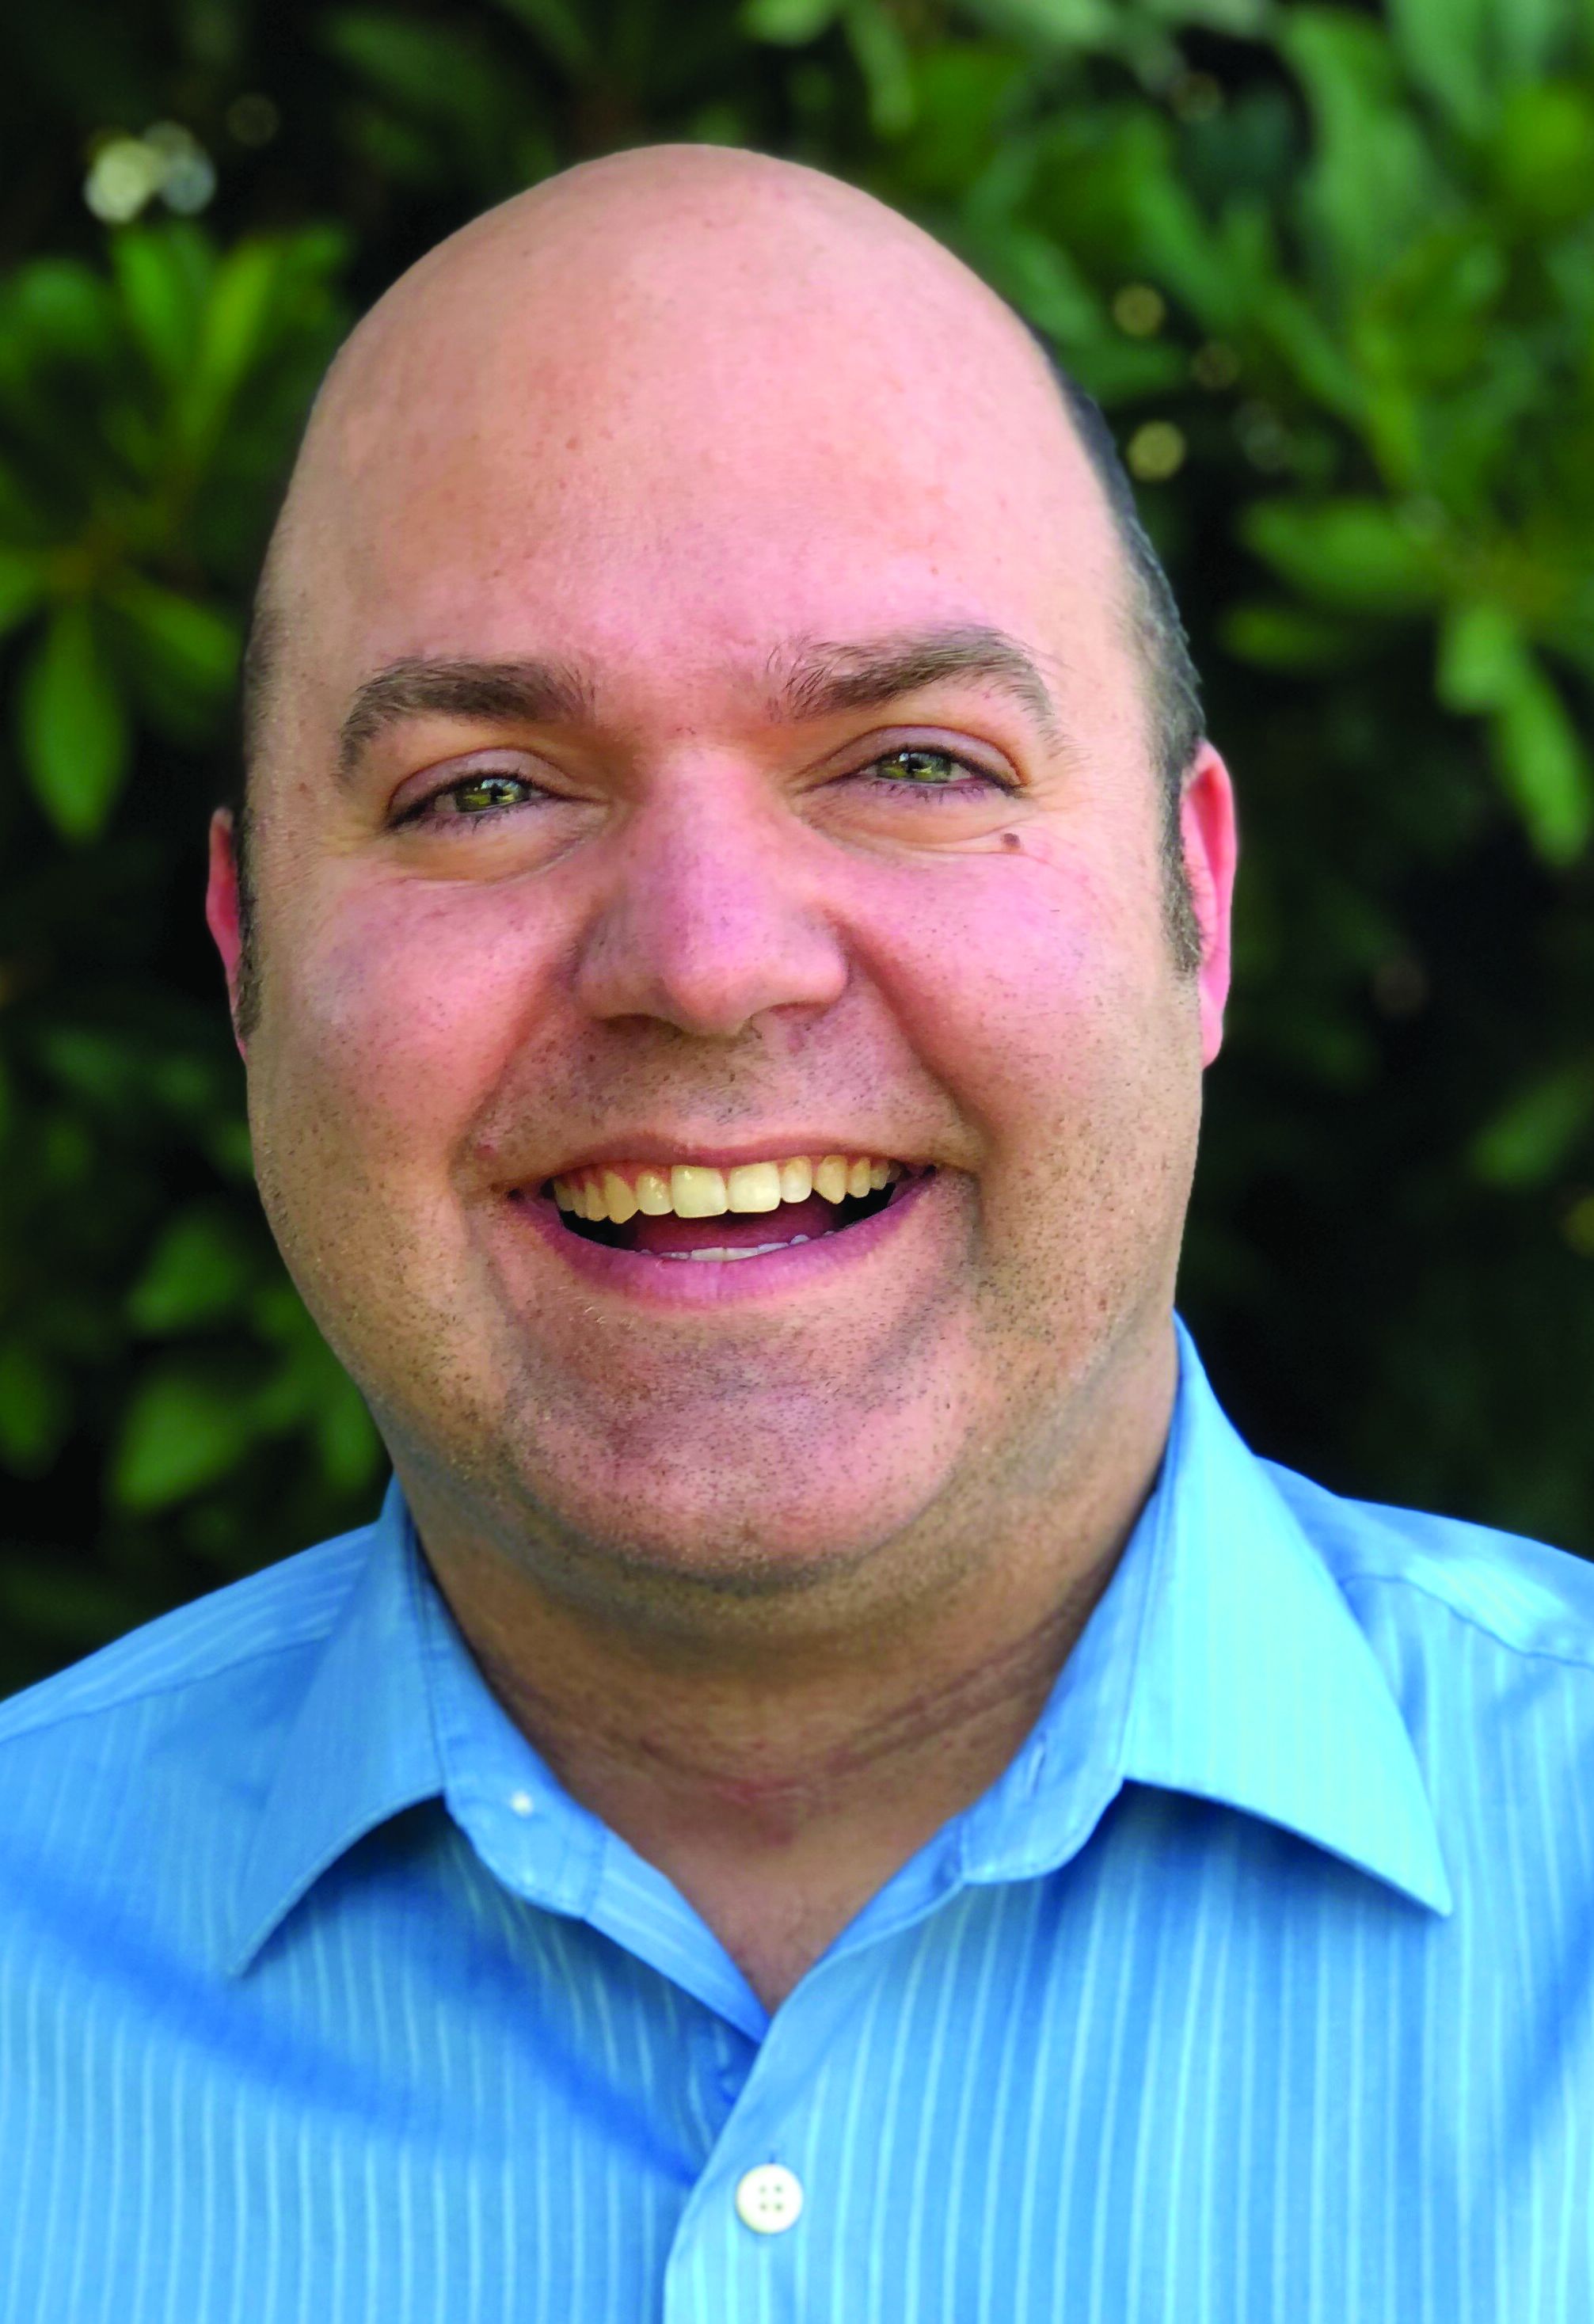
“We’ve been heavily involved in trying to improve cost and outcomes of care since 2015. Social determinants absolutely play into trying to lower costs of care and reduce rates of readmissions, which are often multifactorial in cause,” he said. Hospitalists are uniquely equipped to impact post-acute outcomes, Dr. Dickey said, working in partnership with a position Sound Physicians calls the clinical performance nurse.
“We can also partner with primary care providers, provide education for our hospitalist staff, and work with in-home care supports for patients such as these, who otherwise might end up in a skilled nursing facility – even though they’d rather be at home,” he said.
Innovations at Northwell Health
Northwell Health, a multihospital comprehensive health system serving the New York City metro area and Long Island, has shown innovative leadership in addressing social factors. The 23-hospital system initiated in early 2019 a 15-item Self-Reported Social Determinants Screening Tool, which is now used with hospitalized patients to connect them with the support they need to fully recover and avoid readmissions.
Northwell is also providing professional education on social determinants for different constituencies across its system, said Johanna Martinez, MD, MS, a hospitalist and GME Director of Diversity and Health Equity at the Zucker School of Medicine at Hofstra/Northwell. A day-long training retreat was offered to GME faculty, and learning platforms have been developed for physicians, social workers, nurses, and others.
“One of the questions that comes up is that if you find social needs, what do you do about them?” Dr. Martinez explained. That’s more a difficult challenge, she said, so at Northwell, orthopedic surgeons are now asking patients questions like: “What’s going to happen when you go home? What are your social supports? Can you get to the physical therapist’s office?”
Another example of Northwell’s innovations is its Food as Health Program, initially piloted at Long Island Jewish Hospital in Valley Stream, N.Y. Hospitalized patients are asked two questions using a validated screening tool called the Hunger Vital Sign to identify their food insecurities.8 Those who answer yes are referred to a dietitian, and if they have a nutrition-related diagnosis, they enter the multidisciplinary wraparound program.
A key element is the food and health center, located on the hospital campus, where they can get food to take home and referrals to other services, with culturally tailored, disease-specific food education incorporated into the discharge plan. One of the partnering organizations is Island Harvest Food Bank, which helps about 1 in every 10 residents of Long Island with their food insecurity issues.
“When I talk to clinicians, most of us went into medicine to save lives and cure people. Yet the research shows that no matter who we are, we can’t do the best work that our patients need unless we consider their social determinants,” Dr. Martinez said. Ultimately, she noted, there is a need to change the culture of health care. “We have to create system change, reimbursement change, policy change.”

Omolara Uwemedimo, MD, MPH, associate professor of pediatrics and occupational medicine at Northwell and a former nocturnist, said the treatment of illness and health improvement don’t begin in the hospital, they begin in the community. Identifying where people are struggling and what communities they come from requires a broader view of the provider’s role. “Are patients who are readmitted to the hospital generally coming from certain demographics or from certain zip codes?” she asked. “Start there. How can we better connect with those communities?”
Education is key
In 2020 and beyond, hospitalists will hear more about the social determinants of health, Dr. Jacobs-Shaw concluded. “Without addressing those social determinants, we aren’t going to be able to meaningfully impact outcomes or be effective stewards of health care costs – addressing the psychosocial factors and root causes of patients coming in and out of the hospital.”
He added that self-education is key for hospitalists and the teams they work with – to be more aware of the link between health outcomes and social determinants. Guidelines and other resources on social determinants of health are available from the American College of Physicians and the American Association of Family Physicians. ACP issued a position paper on addressing social determinants of health to improve patient care,while AAFP has a research page on its website dedicated to social determinants of health, highlighting a number of initiatives and resources for physicians and others.9
The American Hospital Association has produced fact sheets on ICD-10CM code categories for social determinants of health, including 11 ICD-10 “Z” codes, numbered Z55-Z65, which can be used for coding interventions to address social determinants of health. Other experts are looking at how to adapt the electronic health record to capture sociodemographic and behavioral factors, and then trigger referrals to resources in the hospital and the broader community, and how to mobilize artificial intelligence and machine learning to better identify social needs.
“Our doctors really want to be able to take care of the whole patient, while being stewards of health care resources. But sometimes we feel powerless and wonder how we can have a bigger impact on people, on populations” Dr. Jacobs-Shaw said. “Remember it only takes one voice within an organization to start to elevate this topic.”
References
1. Rappleye E. Physicians say social determinants of health are not their responsibility. Becker’s Hospital Review. 2018 May 15.
2. Robert Wood Johnson Foundation, University of Wisconsin Population Health Institute. County Health Rankings, 2014.
3. Freeman, GA. The extensivist model. Health Leaders Magazine, 2016 Sep 15.
4. Kind AJ et al. Neighborhood socioeconomic disadvantage and 30-day rehospitalization: A retrospective cohort study. Ann Intern Med. 2014 Dec 2;161(11):765-74.
5. National Institute for Health Care Management. Addressing social determinants of health can improve community health & reduce costs.
6. Vial PB. Boundless collaboration: A philosophy for sustainable and stabilizing housing investment strategies. Health Progress: Journal of the Catholic Health Association of the United States. September-October 2019.
7. Social determinants of health: New solutions for growing complexities. Op-Med, a blog by Sound Physicians. 2019 Aug 1.
8. The hunger vital sign: A new standard of care for preventive health.
9. Daniel H et al. Addressing social determinants to improve patient care and promote health equity: An American College of Physicians position paper. Ann Intern Med. 2018;168:557-578.
Are access to housing and food as important as therapeutics?
Are access to housing and food as important as therapeutics?
While physicians acknowledge that the social determinants of health can impact outcomes from medical care, some may feel that trying to address factors such as homelessness, food insecurity, or lack of ready access to transportation or pharmacy services is just not part of the doctor’s job. A majority of 621 physicians surveyed in the summer of 2017 by Salt Lake City–based health care intelligence firm Leavitt Partners say they are neither capable of nor responsible for addressing such issues.1
But that view may become unsustainable as the U.S. health care system continues to advance toward value- and population-based models of health care and as evidence mounts that social factors are important contributors to costly outcomes, such as avoidable hospital readmissions or emergency room visits. A recent report from the Robert Wood Johnson Foundation estimates that at least 40% of health outcomes are the result of social and economic factors, while only 20% can be attributed to medical care.2
“This is a hot topic – getting a lot of attention these days,” said hospitalist and care transitions expert Ramon Jacobs-Shaw, MD, MPA, regional medical officer for CareMore Health, a California-based physician-led health delivery organization and subsidiary of Anthem. “If you go around the country, some doctors still see social factors as the realm of the social worker. But large health care organizations are coming to recognize that social determinants are huge contributors to the health of their members and to the outcomes of their care.”
Hospitalists could be the natural providers to delve into the specific psychosocial aspects of their patients’ lives, or try to figure out how those factors contribute to health care needs, Dr. Jacobs-Shaw said. They typically confront such issues while the patient is in the hospital bed, but what are the steps that led to the hospitalization in the first place? What will happen after the patient is discharged?
“For example, if patients lack transportation, how can they get to their follow-up medical appointment in the primary care office in order to manage their diabetes? If you can’t follow up with them, their diabetes could get out of control, with complications as a result, such as an infected wound,” he said. Another big issue is access to affordable medications. “CareMore has pharmacists embedded on our care teams. They try to figure out the best medicine for the patient but at the lowest cost. They meet individually with patients and do medication counseling, particularly for those with polypharmacy issues.”
Making health care more equitable
Dr. Jacobs-Shaw has long held a personal interest in issues of inclusiveness, diversity, and how to make health care more equitable for historically underserved groups. Asking how to have a bigger impact on these issues is what brought him, after 13 years as a hospitalist on the East Coast, to CareMore, a company that has made addressing social needs central to its care model. “In California, where I am based, we are a wrap-around for patients who are covered by Medicare Advantage plans. We are whatever the patient needs us to be.”
He oversees a group of hospitalists, dubbed extensivists, who provide advanced patient care and chronic disease management. In the extensivist model, physicians and advanced practice nurses provide comprehensive and coordinated care to patients with complex medical issues, taking their scope of practice beyond the hospital into homes, post-acute care facilities, and other settings, with a focus on keeping patients healthier and reducing readmission.3
“Our patients get access to extra services and resources, some of which are available at our care centers – which are one-stop outpatient facilities. We also focus on a lot of things physicians didn’t historically think were within their wheelhouse. Hospitalists deal with these kinds of issues every day, but may not label them as social determinants of health,” Dr. Jacobs-Shaw said. He emphasized that hospitalists should realize that they are not powerless to address these issues, working in partnership with other groups in and out of the hospital. They should also know that health care payers increasingly are dedicating resources to these issues.
“We just started trying to address homelessness through a pilot in Orange County, working with nonprofit organizations and philanthropy to offer a transitional site of care for our patients who are being discharged from the hospital and have housing insecurity issues, to get them transitioned into more secure housing,” Dr. Jacobs-Shaw said. CareMore also has a transportation collaborative that offers no-cost, nonemergency transportation to medical appointments. “That’s meeting them where they are at, based on an assessment of their needs and resources.”
What are social determinants?
The social determinants of health – social, environmental, and other nonmedical factors that contribute to overall health status and medical need – have been defined by the World Health Organization as: “conditions in which people are born, grow, live, work, and age.” That is a broad complex of overlapping social and systems issues, but it provides a context for a broader understanding of the patient’s health and response to medical interventions.
Socioeconomic status is a huge determinant. Level of education may be more important than income if the person lacks the health literacy to navigate the system and access needed care. Housing instability may include poor sanitation, substandard dwellings, or unsafe neighborhoods – all of which can affect a person’s well-being. Environmental health may include compromised air quality – which can impact pulmonary health. Other issues include access to employment and child care, utility needs, and interpersonal violence.
A 2014 paper in Annals of Internal Medicine found that residence within a disadvantaged neighborhood was a factor in hospital readmission rates as often as was chronic pulmonary disease.4 A recent report on social determinants of health by the National Institute for Health Care Management notes that patients with food insecurity are 2.4 times more likely to go to the emergency room, while those with transportation needs are 2.6 times more likely.5
What can health care leaders do to better equip their clinicians and teams to help patients deal with this array of complex needs? Intermountain Healthcare, based in Salt Lake City, spearheaded in 2018 the development of the Alliance for the Determinants of Health, starting in the communities of Ogden and St. George, Utah. The Alliance seeks to promote health, improve access to care, and decrease health care costs through a charitable contribution of $12 million over 3 years to seed collaborative demonstration projects.
Lisa Nichols, assistant vice president for community health at Intermountain, said that, while hospitalists were not directly involved in planning the Alliance, hospitalists and ED physicians have become essential to the patient-screening process for health and social needs.
“We met with hospitalists, emergency departments, and hospital administrators, because we wanted their feedback on how to raise awareness of the social needs of patients,” she said. “They have good ideas. They see the patients who come in from the homeless shelters.”
Other hospitals are subsidizing apartments for homeless patients being discharged from the hospital. CommonSpirit Health, the new national Catholic health care organization formed by the 2019 merger of Dignity Health and Catholic Health Initiatives, has explored how to help create and sustain affordable housing in the communities it serves. Investments like this have inspired others, such as Kaiser Permanente, to get involved in supporting housing initiatives.6
Comprehensive community care
David Meltzer, MD, PhD, a hospitalist and professor of medicine at the University of Chicago, said most hospitalists these days believe social determinants of health are part of their job responsibilities.
“That’s not to say we all do it well. We may fail at addressing some of the barriers our patients face. But I don’t know anyone who still says it’s not their job,” he said.
Since 2012, Dr. Meltzer has led a pilot called Comprehensive Care Physicians (CCP), in which the same physician cares for patients with chronic health problems in the clinic and in the hospital, working with a team of nurse practitioners, social workers, care coordinators, and other specialists. A total of 2,000 patients with chronic health problems were enrolled in the study from 2012 to 2016, half assigned to standard care and half assigned to five CCP doctors. The result: The CCP model has shown large improvements in outcomes – particularly among the more vulnerable, less activated patients, is preferred by patients, and has significantly reduced health care utilization.
The next step for the research team is another randomized controlled trial called Comprehensive Care, Community, and Culture, designed to address unmet social needs. Study group patients will also be screened for unmet social needs and have access to a community health worker and to the initiative’s Artful Living Program, which includes community and cultural activities like yoga and dance classes, cooking classes, art classes, and music concerts. To address the complex dimensions and determinants of health, Dr. Meltzer explained, efforts to improve health must extend to sectors far beyond traditional health care.
“I think trying to understand your patients’ social and nonmedical needs starts with getting to know them, and asking about their needs,” he said. “The better you know them, the better you are able to make medical decisions that will promote positive outcomes.”
Sound Physicians, a national hospitalist company based in Tacoma, Wash., and working in 350 hospitals in 41 states, recently published a blog post on its website about the importance of social determinants of health.7 Sound Physicians participates in value-based care through bundled Medicare/Medicaid contracts based on episodes of care for hospitalized patients with certain diagnoses or DRGs, explained John Dickey, MD, the company’s chief medical officer for population health.
“We’ve been heavily involved in trying to improve cost and outcomes of care since 2015. Social determinants absolutely play into trying to lower costs of care and reduce rates of readmissions, which are often multifactorial in cause,” he said. Hospitalists are uniquely equipped to impact post-acute outcomes, Dr. Dickey said, working in partnership with a position Sound Physicians calls the clinical performance nurse.
“We can also partner with primary care providers, provide education for our hospitalist staff, and work with in-home care supports for patients such as these, who otherwise might end up in a skilled nursing facility – even though they’d rather be at home,” he said.
Innovations at Northwell Health
Northwell Health, a multihospital comprehensive health system serving the New York City metro area and Long Island, has shown innovative leadership in addressing social factors. The 23-hospital system initiated in early 2019 a 15-item Self-Reported Social Determinants Screening Tool, which is now used with hospitalized patients to connect them with the support they need to fully recover and avoid readmissions.
Northwell is also providing professional education on social determinants for different constituencies across its system, said Johanna Martinez, MD, MS, a hospitalist and GME Director of Diversity and Health Equity at the Zucker School of Medicine at Hofstra/Northwell. A day-long training retreat was offered to GME faculty, and learning platforms have been developed for physicians, social workers, nurses, and others.
“One of the questions that comes up is that if you find social needs, what do you do about them?” Dr. Martinez explained. That’s more a difficult challenge, she said, so at Northwell, orthopedic surgeons are now asking patients questions like: “What’s going to happen when you go home? What are your social supports? Can you get to the physical therapist’s office?”
Another example of Northwell’s innovations is its Food as Health Program, initially piloted at Long Island Jewish Hospital in Valley Stream, N.Y. Hospitalized patients are asked two questions using a validated screening tool called the Hunger Vital Sign to identify their food insecurities.8 Those who answer yes are referred to a dietitian, and if they have a nutrition-related diagnosis, they enter the multidisciplinary wraparound program.
A key element is the food and health center, located on the hospital campus, where they can get food to take home and referrals to other services, with culturally tailored, disease-specific food education incorporated into the discharge plan. One of the partnering organizations is Island Harvest Food Bank, which helps about 1 in every 10 residents of Long Island with their food insecurity issues.
“When I talk to clinicians, most of us went into medicine to save lives and cure people. Yet the research shows that no matter who we are, we can’t do the best work that our patients need unless we consider their social determinants,” Dr. Martinez said. Ultimately, she noted, there is a need to change the culture of health care. “We have to create system change, reimbursement change, policy change.”
Omolara Uwemedimo, MD, MPH, associate professor of pediatrics and occupational medicine at Northwell and a former nocturnist, said the treatment of illness and health improvement don’t begin in the hospital, they begin in the community. Identifying where people are struggling and what communities they come from requires a broader view of the provider’s role. “Are patients who are readmitted to the hospital generally coming from certain demographics or from certain zip codes?” she asked. “Start there. How can we better connect with those communities?”
Education is key
In 2020 and beyond, hospitalists will hear more about the social determinants of health, Dr. Jacobs-Shaw concluded. “Without addressing those social determinants, we aren’t going to be able to meaningfully impact outcomes or be effective stewards of health care costs – addressing the psychosocial factors and root causes of patients coming in and out of the hospital.”
He added that self-education is key for hospitalists and the teams they work with – to be more aware of the link between health outcomes and social determinants. Guidelines and other resources on social determinants of health are available from the American College of Physicians and the American Association of Family Physicians. ACP issued a position paper on addressing social determinants of health to improve patient care,while AAFP has a research page on its website dedicated to social determinants of health, highlighting a number of initiatives and resources for physicians and others.9
The American Hospital Association has produced fact sheets on ICD-10CM code categories for social determinants of health, including 11 ICD-10 “Z” codes, numbered Z55-Z65, which can be used for coding interventions to address social determinants of health. Other experts are looking at how to adapt the electronic health record to capture sociodemographic and behavioral factors, and then trigger referrals to resources in the hospital and the broader community, and how to mobilize artificial intelligence and machine learning to better identify social needs.
“Our doctors really want to be able to take care of the whole patient, while being stewards of health care resources. But sometimes we feel powerless and wonder how we can have a bigger impact on people, on populations” Dr. Jacobs-Shaw said. “Remember it only takes one voice within an organization to start to elevate this topic.”
References
1. Rappleye E. Physicians say social determinants of health are not their responsibility. Becker’s Hospital Review. 2018 May 15.
2. Robert Wood Johnson Foundation, University of Wisconsin Population Health Institute. County Health Rankings, 2014.
3. Freeman, GA. The extensivist model. Health Leaders Magazine, 2016 Sep 15.
4. Kind AJ et al. Neighborhood socioeconomic disadvantage and 30-day rehospitalization: A retrospective cohort study. Ann Intern Med. 2014 Dec 2;161(11):765-74.
5. National Institute for Health Care Management. Addressing social determinants of health can improve community health & reduce costs.
6. Vial PB. Boundless collaboration: A philosophy for sustainable and stabilizing housing investment strategies. Health Progress: Journal of the Catholic Health Association of the United States. September-October 2019.
7. Social determinants of health: New solutions for growing complexities. Op-Med, a blog by Sound Physicians. 2019 Aug 1.
8. The hunger vital sign: A new standard of care for preventive health.
9. Daniel H et al. Addressing social determinants to improve patient care and promote health equity: An American College of Physicians position paper. Ann Intern Med. 2018;168:557-578.
Large study probes colonoscopy surveillance intervals
In contrast, patients with high-risk adenomas at baseline had significantly elevated rates of both CRC and CRC-related death, reported lead author Jeffrey K. Lee, MD, of Kaiser Permanente San Francisco and colleagues.
With additional research, these findings may influence colonoscopy surveillance intervals, the investigators wrote in Gastroenterology.
“Current guidelines recommend that patients with a low-risk adenoma finding ... receive surveillance colonoscopy in 5-10 years, although in practice, clinicians often use even more frequent surveillance ... in this low-risk group,” they wrote. “The rationale for continued support of shorter-than-recommended surveillance intervals for patients with low-risk adenomas is unclear, but could stem from a lack of long-term population-based studies assessing colorectal cancer incidence and related deaths following low-risk adenoma removal or randomized trials evaluating optimal postpolypectomy surveillance intervals.”
To alleviate this knowledge gap, the investigators began by screening data from 186,046 patients who underwent baseline colonoscopy between 2004 and 2010 at 21 medical centers in California. Following exclusions based on family history, confounding gastrointestinal diseases, and incomplete data, 64,422 patients remained. Among these patients, the mean age was 61.6 years, with a slight female majority (54.3%). Almost three out of four patients (71.2%) had normal colonoscopy findings, followed by smaller proportions who were diagnosed with low-risk adenoma (17.0%) or high-risk adenoma (11.7%), based on United States Multi-Society Task Force guidelines.
After a median follow-up of 8.1 years, 117 patients who had normal colonoscopy findings developed CRC, 22 of whom died from the disease. In comparison, the low-risk adenoma group had 37 cases of CRC and 3 instances of CRC-related death, whereas the high-risk adenoma group had 60 cases of CRC and 13 instances of CRC-related death.
In the no-adenoma and low-risk groups, trends in age-adjusted CRC incidence rates were similar; in both cohorts, CRC incidence increased gradually over the decade following colonoscopy, with each group reaching approximately 50 cases per 100,000 person-years by year 10. In contrast, CRC incidence climbed rapidly in the high-risk adenoma group, ultimately peaking a decade later at almost 220 cases per 100,000 person-years. Average incidence rates per 100,000 person-years were similar among patients with no adenoma (31.1) and low-risk adenoma (38.8), but markedly higher among those with high-risk adenoma (90.8). At the end of the 14-year follow-up period, absolute risks of CRC among patients with no adenoma, low-risk adenoma, and high-risk adenoma were 0.51%, 0.57%, and 2.03%, respectively.
Based on covariate-adjusted Cox regression models, patients with low-risk adenoma did not have a significantly higher risk of CRC or CRC-related death than did patients with no adenoma. In contrast, patients with high-risk adenoma had significantly higher risks of CRC (hazard ratio, 2.61) and CRC-related death (HR, 3.94).
“These findings support guideline recommendations for intensive colonoscopy surveillance in [patients with high-risk adenomas at baseline],” the investigators wrote.
Considering similar risks between patients with low-risk adenomas and those with normal findings, the investigators suggested that longer surveillance intervals may be acceptable for both of these patient populations.
“Guidelines recommending comparable follow-up for low-risk adenomas and normal examinations, such as lengthening the surveillance interval to more than 5 years and possibly 10 years, may provide comparable cancer incidence and mortality benefits for these two groups,” they wrote.
Still, the investigators noted that study limitations – such as disparate rates of subsequent colonoscopy between groups – make it difficult to draw definitive, practice-changing conclusions.
“Additional studies, potentially including randomized trials, on the natural history of low-risk adenoma and normal findings without intervening surveillance exams before 10 years are needed to help guide future surveillance practices,” they concluded.
The study was supported by the National Cancer Institute and the American Gastroenterological Association. The investigators disclosed no conflicts of interest.
SOURCE: Lee JK et al. Gastroenterology. 2019 Oct 4. doi: 10.1053/j.gastro.2019.09.039.
Study strengths include a large sample and inclusion of quality measures such as adenoma detection rates. However, to examine conventional adenoma risk, individuals with serrated polyps were excluded and thus the impact of these lesions is unclear. Since New Hampshire Colonoscopy Registry data demonstrate a higher risk of metachronous advanced adenomas for those with both sessile serrated polyps and high-risk adenomas, long-term CRC data for serrated polyps is crucial. In addition, data from short-term studies suggest that there may be heterogeneity in risk for LRAs, a higher risk for an 8-mm lesion than a 3-mm one. Thus, we await more long-term studies to address these and other issues.
Joseph C. Anderson, MD, MHCDS, is an associate professor of medicine at White River Junction VAMC, Dartmouth College, Hanover, N.H., and the University of Connecticut Health Center, Farmington, Conn. The contents of this work do not represent the views of the Department of Veterans Affairs or the United States Government. He has no relevant conflicts of interest.
In contrast, patients with high-risk adenomas at baseline had significantly elevated rates of both CRC and CRC-related death, reported lead author Jeffrey K. Lee, MD, of Kaiser Permanente San Francisco and colleagues.
With additional research, these findings may influence colonoscopy surveillance intervals, the investigators wrote in Gastroenterology.
“Current guidelines recommend that patients with a low-risk adenoma finding ... receive surveillance colonoscopy in 5-10 years, although in practice, clinicians often use even more frequent surveillance ... in this low-risk group,” they wrote. “The rationale for continued support of shorter-than-recommended surveillance intervals for patients with low-risk adenomas is unclear, but could stem from a lack of long-term population-based studies assessing colorectal cancer incidence and related deaths following low-risk adenoma removal or randomized trials evaluating optimal postpolypectomy surveillance intervals.”
To alleviate this knowledge gap, the investigators began by screening data from 186,046 patients who underwent baseline colonoscopy between 2004 and 2010 at 21 medical centers in California. Following exclusions based on family history, confounding gastrointestinal diseases, and incomplete data, 64,422 patients remained. Among these patients, the mean age was 61.6 years, with a slight female majority (54.3%). Almost three out of four patients (71.2%) had normal colonoscopy findings, followed by smaller proportions who were diagnosed with low-risk adenoma (17.0%) or high-risk adenoma (11.7%), based on United States Multi-Society Task Force guidelines.
After a median follow-up of 8.1 years, 117 patients who had normal colonoscopy findings developed CRC, 22 of whom died from the disease. In comparison, the low-risk adenoma group had 37 cases of CRC and 3 instances of CRC-related death, whereas the high-risk adenoma group had 60 cases of CRC and 13 instances of CRC-related death.
In the no-adenoma and low-risk groups, trends in age-adjusted CRC incidence rates were similar; in both cohorts, CRC incidence increased gradually over the decade following colonoscopy, with each group reaching approximately 50 cases per 100,000 person-years by year 10. In contrast, CRC incidence climbed rapidly in the high-risk adenoma group, ultimately peaking a decade later at almost 220 cases per 100,000 person-years. Average incidence rates per 100,000 person-years were similar among patients with no adenoma (31.1) and low-risk adenoma (38.8), but markedly higher among those with high-risk adenoma (90.8). At the end of the 14-year follow-up period, absolute risks of CRC among patients with no adenoma, low-risk adenoma, and high-risk adenoma were 0.51%, 0.57%, and 2.03%, respectively.
Based on covariate-adjusted Cox regression models, patients with low-risk adenoma did not have a significantly higher risk of CRC or CRC-related death than did patients with no adenoma. In contrast, patients with high-risk adenoma had significantly higher risks of CRC (hazard ratio, 2.61) and CRC-related death (HR, 3.94).
“These findings support guideline recommendations for intensive colonoscopy surveillance in [patients with high-risk adenomas at baseline],” the investigators wrote.
Considering similar risks between patients with low-risk adenomas and those with normal findings, the investigators suggested that longer surveillance intervals may be acceptable for both of these patient populations.
“Guidelines recommending comparable follow-up for low-risk adenomas and normal examinations, such as lengthening the surveillance interval to more than 5 years and possibly 10 years, may provide comparable cancer incidence and mortality benefits for these two groups,” they wrote.
Still, the investigators noted that study limitations – such as disparate rates of subsequent colonoscopy between groups – make it difficult to draw definitive, practice-changing conclusions.
“Additional studies, potentially including randomized trials, on the natural history of low-risk adenoma and normal findings without intervening surveillance exams before 10 years are needed to help guide future surveillance practices,” they concluded.
The study was supported by the National Cancer Institute and the American Gastroenterological Association. The investigators disclosed no conflicts of interest.
SOURCE: Lee JK et al. Gastroenterology. 2019 Oct 4. doi: 10.1053/j.gastro.2019.09.039.
FROM GASTROENTEROLOGY
Key clinical point: High-risk adenomas, but not low-risk adenomas, are associated with increased long-term risks of colorectal cancer (CRC) and CRC-related death.
Major finding: Compared with patients without adenomas, patients diagnosed with high-risk adenoma had a significantly increased risk of colorectal cancer (hazard ratio, 2.61).
Study details: A retrospective cohort study involving 64,422 patients who underwent colonoscopy between 2004 and 2010.
Disclosures: The study was supported by the National Cancer Institute and the American Gastroenterological Association. The investigators disclosed no conflicts of interest.
Source: Lee JK et al. Gastroenterology. 2019 Oct 4. doi: 10.1053/j.gastro.2019.09.039.
Radioactive iodine can be first-line for hyperthyroidism, says UK
New UK guidelines for the treatment of hyperthyroidism, including Graves’ disease, place heavier emphasis on the use of radioactive iodine as the frontline treatment for patients unlikely to remain remission-free on the medications, as opposed to the alternative of antithyroid medications as a first choice.
senior author Kristien Boelaert, MD, PhD, who led the guideline committee, said in an interview.
“Recommending the use of radioactive iodine as first-line treatment for adults with Graves’ disease is a change to current practice and should reduce the variation between centers as to when radioactive iodine is considered appropriate,” the guidelines further state.
The new recommendations on hyperthyroidism are part of broader guidelines on thyroid disease by the UK National Institute for Health and Care Excellence (NICE), which concludes that radioactive iodine results in cure in as many as 90% of hyperthyroidism cases.
The recommendations were published in a guideline summary in BMJ by research fellow Melina Vasileiou of the National Guideline Centre, Royal College of Physicians, London, and colleagues.
Current guidelines in the United Kingdom and Europe typically call for radioactive iodine to be reserved for use as a definitive treatment only after relapse following antithyroid medication treatment. The latest European Thyroid Association guidelines were published in 2018.
Elsewhere guidelines vary, with many, including those by the American Thyroid Association (ATA) – the most recent published in 2016 – generally calling for treatment with either antithyroid medications, radioactive iodine, or total thyroidectomy, in the absence of any contraindications to each treatment option.
“The U.S. tends to use more radioactive iodine, while Europe, Latin America, and Japan lean more toward (perhaps longer) use of antithyroid medications,” Angela Leung, MD, associate clinical professor of medicine in the division of endocrinology, diabetes, and metabolism, department of medicine, University of California, Los Angeles, said in an interview.
“Preferences of deciding which treatment option, which may involve more than one option if antithyroid medications are used initially, depend on a variety of factors related to patient desire, comorbidities, and availability of the therapy,” she explained.
Concerns including worsening thyroid eye disease, cardiovascular disease, and development of secondary cancers have caused some hesitation in the use of frontline radioiodine therapy.
And one notably controversial article, published last year, suggested a link between radioactive iodine therapy and an increased risk of cancer mortality. However, as reported by Medscape Medical News, the article spurred debate, with the Society for Endocrinology and British Thyroid Association issuing a joint statement urging caution in interpretation of the findings.
Evidence supporting first-line radioactive iodine
Patients treated with radioactive iodine take a single tablet that contains iodine and a low dose of radiation, which is absorbed by the thyroid. After taking the treatment patients are advised to avoid prolonged close contact with children and pregnant women for a few days or weeks and to avoid getting pregnant or fathering a child for several months. The treatment is likely to lead to an underactive thyroid gland that will require ongoing treatment with thyroid hormone replacement.
In providing evidence in favor of the benefits of radioactive iodine over the risks, the new NICE guidelines cite five randomized controlled trials of people with hyperthyroid disease, which, though defined as “low quality” evidence, collectively indicate that long-term outcomes were improved with radioactive iodine treatment compared with antithyroid drugs – despite the former having a higher risk of thyroid eye disease (also known as Graves’ ophthalmopathy).
In addition, eight nonrandomized studies show no evidence of a clinically important increase in cancer diagnoses or deaths between people treated with radioactive iodine or surgery, or between people treated with radioactive iodine and healthy controls, the guideline committee notes.
“The strongest arguments (in favor of radioactive iodine as a first-line therapy) were the likelihood of inducing remission of Graves’ disease with radioactive iodine, the finding that radioiodine is a safe treatment (confirmed in the safety review undertaken by NICE), and the reduction in the need for patients to remain on antithyroid drugs, which may have significant side effects and treatment which usually requires repeated hospital visits or follow-up under a hospital service,” said Dr. Boelaert.
The new guideline does recommend that antithyroid medication is acceptable as the first-line treatment among patients considered likely to achieve remission.
Dr. Leung explains that the percentage of patients with Graves’ disease who can achieve remission with antithyroid drugs ranges from 30% to 50%. She noted some evidence does suggest the long-term use of the drugs may be acceptable.
“There are some data that ... report the relative safety of long-term use of antithyroid drugs (beyond 24 months) for both Graves’ disease and autonomous thyroid nodules,” Dr. Leung elaborated.
Pregnancy concerns and cost-effectiveness of radioactive iodine
Radioactive iodine therapy is meanwhile not suitable if malignancy is suspected, if the patient is pregnant or trying to become pregnant, or if the patient has active thyroid eye disease, the experts agree.
Dr. Leung noted that although “it is generally advised to not treat Graves’ disease with radioiodine if there is concurrent thyroid eye disease, steroids are a proven effective therapy to decrease this risk in select patients.”
And among pregnant patients, “antithyroid medications should be minimally used in the lowest possible doses,” Dr. Leung said, although she added that, despite their potential risks, the drugs “represent a viable option” for this patient population.
“Also, many would actually advocate for total thyroidectomy in women who are thinking of pregnancy in the near future,” she noted.
Another factor of relevance in the guideline recommendations – cost – also favors radioactive iodine, the committee noted.
“Economic evidence showed that radioactive iodine was the most cost-effective intervention,” the committee pointed out.
Trabs advised for determination of hyperthyroidism cause
The new U.K. guidelines further underscore the importance of establishing the underlying cause of hyperthyroidism to ensure appropriate treatment, and the preferred method for doing so is the measurement of thyroid-stimulating hormone receptor antibodies (TRAbs).
“It is important to identify the underlying cause of thyrotoxicosis through measurement of TRAbs, or radioisotope scanning, in order to distinguish hyperthyroidism from transient causes of thyrotoxicosis such as transient thyroiditis, which only requires supportive treatment,” explained Dr. Boelaert, consultant endocrinologist and director of the National Institute for Health Research Integrated Academic Training Program at the Institute of Applied Health Research, University of Birmingham (England).
“In addition, this will help distinguish Graves’ disease from toxic nodular hyperthyroidism, which is important as antithyroid drugs are not effective in inducing a cure in the latter,” she explained.
Meanwhile, the new guidelines further note that although use of diagnostic ultrasound is informative when palpation suggests thyroid nodules, it is of limited diagnostic value for Graves’ disease.
“The recommendation (suggests that) thyroid ultrasonography should only be offered if there is a palpable thyroid nodule,” Dr. Boelaert noted.
She concluded: “There has been uncertainty in the U.K. about the best treatment for hyperthyroidism despite radioactive iodine being the most common first-line treatment for this condition in the United States. We are very pleased to have been able to work with NICE to provide clear new guidance which we hope will improve outcomes for patients with this condition.”
The National Guideline Centre was commissioned and funded by NICE to develop the guideline. No authors received specific funding to write the summary. Dr. Boelaert has reported no relevant financial relationships. Disclosures for the other authors are listed in the article.
This article first appeared on Medscape.com.
Consider allergic contact dermatitis in children with AD with disease flares, new rash
ORLANDO – Do you have ? Consider patch testing to assess whether they have allergic contact dermatitis.

“Of the patients who are sent to me by local pediatric dermatologists, 50% of them are positive” for allergens, said Jonathan H. Zippin, MD, PhD, director of the contact, occupational, and photodermatitis service at Cornell University, New York.
Speaking at the ODAC Dermatology, Aesthetic, and Surgical Conference, Dr. Zippin noted the prevalence of allergen sensitization is between 13% and 25% among children who are asymptomatic, while the prevalence of sensitization to at least one allergen among children with suspected allergic contact dermatitis (ACD) is between 25% and 96%. In 2014, a study from the National American Contact Dermatitis Group (NACDG) showed that of 883 children who were patch tested, 56.7% had at least one relevant positive patch test (RPPT) result.
“The take-home message here is that pediatric contact dermatitis is common, much more common than a lot of people realize,” Dr. Zippin said.
He described three common scenarios to keep in mind: a worsening rash, a new rash, and failure of a rash to improve after the patient avoids all of his or her positive allergens.
When a rash worsens, patch testing is likely to offer answers. In an analysis of 1,142 patients with suspected ACD aged 18 years or younger (mean age, 10.5 years; 64% female) in the Pediatric Contact Dermatitis Registry study database, 65% had at least one positive patch test, and 48% had at least 1 RPPT (Dermatitis 2016; 27[5] 293-302).
But not all patch testing is the same: The study also found that 24% of the RPPT cases would have been missed if assessed with the T.R.U.E. TEST compared with extended patch testing. If a T.R.U.E. TEST fails to explain generalized atopic dermatitis, the patient should be sent for more comprehensive testing where available, Dr. Zippin advised.
Pediatric patients also have unique allergens clinicians should consider. In the same study, children had a number of allergens similar to those of adults as reported in previous studies, such as nickel, cobalt, and neomycin. However, propylene glycol and cocamidopropyl betaine were allergens identified as unique to the pediatric population.
Another study looking at the same group of patients found that compared with children who did not have AD, children with AD had 7.4 times higher odds of having an RPPT to cocamidopropyl betaine, 7.6 times higher odds of having an RPPT to parthenolide, 5.3 times higher odds of having an RPPT to tixocortol pivalate, 4.2 times higher odds of having an RPPT to wool alcohols, and 4 times higher odds of having an RPPT to lanolin (JAMA Dermatology 2017;153[8]:765-70).
All of these are components of topical medicaments used to treat AD, “either components of emollients that we recommend, or components of steroids that we recommend,” Dr. Zippin pointed out.
One of these allergens could be the culprit when a child develops a new rash but there are no new apparent changes in products, exposures, and activities. Lanolin, also called wool grease, is used in many skin care products, for example. Dr. Zippin described the case of a 6-year-old girl with a history of AD, who presented with a new rash on her scalp and behind her ears, not explained by any obvious changes to products, exposures, or activities. Subsequent patch testing determined that the rash was caused by baby shampoo, which contained cocamidopropyl betaine, which is used in hypoallergenic products. The rash resolved after a different shampoo was used.
“Sometimes, we really have to be thinking when the rash is getting worse, is there something they’re being exposed to that might be an allergen?” Dr. Zippin said.
In patients who have avoided all their positive allergens but a rash has not improved, clinicians should consider systemic contact dermatitis (SCD). Patients can develop SCD through different types of exposures, including transepidermal, transmucosal, oral, intravenous, subcutaneous, intramuscular, inhalation, and implantation routes.
SCD also has a variety of presentations, including pompholyx/dyshidrosis/vesicular dermatitis, maculopapular eruption, chronic pruritus, exfoliative erythroderma/toxiderma, chronic urticaria, erythema multiforme and vasculitis, hyperkeratotic papules of the elbows, acute generalized exanthematous pustulosis, and pruritus ani, according to Dr. Zippin.
SCD should be considered when a patient has a positive patch test to an allergen that is known to cause SCD, and does not clear after avoiding cutaneous exposure to the allergen, Dr. Zippin advised.
Patients will most often develop SCD from plants and herbs, Dr. Zippin noted. Chrysanthemums and chamomile tea are common culprits for compositae allergy and can trigger SCD; other causes are Anacardiaceae, Balsam of Peru, and propolis. Metals (nickel, cobalt, gold, and chromium), medications (aminoglycosides, corticosteroids, and ethylenediamine), and other sources (formaldehyde, propylene glycol in frozen foods, gallates, and methylisothiazolinone) can cause SCD as well.
Methylisothiazolinone in particular is a very common sensitizer, Dr. Zippin said. “If you have a patient who is positive to this, it’s almost always the cause of their problem.”
Balsam of Peru is in a number of different foods, and patients who need to follow a diet free of Balsam of Peru should avoid a long list of foods including citrus; bakery goods; Danish pastry; candy; gum; spices such as cinnamon, cloves, vanilla, curry, allspice, anise, and ginger; spicy condiments such as ketchup, chili sauce, barbecue sauce; chili, pizza, and foods with red sauces; tomatoes; pickles; alcohol (wine, beer, gin, vermouth); tea (perfumed or flavored); tobacco; chocolate and ice cream; and soft drinks (cola or spiced soft drinks).
Patients starting a nickel-free diet should avoid soy, peanuts and other nuts, legumes, chocolate, cocoa, oats, fish, and whole wheat flours. Any elimination diet should last for 3 months but should at least be tried for 3-4 weeks, with gradual reintroduction of foods suspected as triggers once per week. Any type I allergies that are discovered or suspected can be referred to an allergist for allergen challenge and desensitization therapy.
For more information, Dr. Zippin recommended the American Contact Dermatitis Society website for more information.
Dr. Zippin reported that he is the founder and holds stock options at CEP Biotech; is on the medical advisory board and receives stock options from YouV Labs., is a paid consultant and performs industry-sponsored research for Pfizer, receives stock options from Regeneron, and is on the medical advisory board for Hoth Therapeutics Inc. He is on the board of directors for the American Contact Dermatitis Society.
ORLANDO – Do you have ? Consider patch testing to assess whether they have allergic contact dermatitis.
“Of the patients who are sent to me by local pediatric dermatologists, 50% of them are positive” for allergens, said Jonathan H. Zippin, MD, PhD, director of the contact, occupational, and photodermatitis service at Cornell University, New York.
Speaking at the ODAC Dermatology, Aesthetic, and Surgical Conference, Dr. Zippin noted the prevalence of allergen sensitization is between 13% and 25% among children who are asymptomatic, while the prevalence of sensitization to at least one allergen among children with suspected allergic contact dermatitis (ACD) is between 25% and 96%. In 2014, a study from the National American Contact Dermatitis Group (NACDG) showed that of 883 children who were patch tested, 56.7% had at least one relevant positive patch test (RPPT) result.
“The take-home message here is that pediatric contact dermatitis is common, much more common than a lot of people realize,” Dr. Zippin said.
He described three common scenarios to keep in mind: a worsening rash, a new rash, and failure of a rash to improve after the patient avoids all of his or her positive allergens.
When a rash worsens, patch testing is likely to offer answers. In an analysis of 1,142 patients with suspected ACD aged 18 years or younger (mean age, 10.5 years; 64% female) in the Pediatric Contact Dermatitis Registry study database, 65% had at least one positive patch test, and 48% had at least 1 RPPT (Dermatitis 2016; 27[5] 293-302).
But not all patch testing is the same: The study also found that 24% of the RPPT cases would have been missed if assessed with the T.R.U.E. TEST compared with extended patch testing. If a T.R.U.E. TEST fails to explain generalized atopic dermatitis, the patient should be sent for more comprehensive testing where available, Dr. Zippin advised.
Pediatric patients also have unique allergens clinicians should consider. In the same study, children had a number of allergens similar to those of adults as reported in previous studies, such as nickel, cobalt, and neomycin. However, propylene glycol and cocamidopropyl betaine were allergens identified as unique to the pediatric population.
Another study looking at the same group of patients found that compared with children who did not have AD, children with AD had 7.4 times higher odds of having an RPPT to cocamidopropyl betaine, 7.6 times higher odds of having an RPPT to parthenolide, 5.3 times higher odds of having an RPPT to tixocortol pivalate, 4.2 times higher odds of having an RPPT to wool alcohols, and 4 times higher odds of having an RPPT to lanolin (JAMA Dermatology 2017;153[8]:765-70).
All of these are components of topical medicaments used to treat AD, “either components of emollients that we recommend, or components of steroids that we recommend,” Dr. Zippin pointed out.
One of these allergens could be the culprit when a child develops a new rash but there are no new apparent changes in products, exposures, and activities. Lanolin, also called wool grease, is used in many skin care products, for example. Dr. Zippin described the case of a 6-year-old girl with a history of AD, who presented with a new rash on her scalp and behind her ears, not explained by any obvious changes to products, exposures, or activities. Subsequent patch testing determined that the rash was caused by baby shampoo, which contained cocamidopropyl betaine, which is used in hypoallergenic products. The rash resolved after a different shampoo was used.
“Sometimes, we really have to be thinking when the rash is getting worse, is there something they’re being exposed to that might be an allergen?” Dr. Zippin said.
In patients who have avoided all their positive allergens but a rash has not improved, clinicians should consider systemic contact dermatitis (SCD). Patients can develop SCD through different types of exposures, including transepidermal, transmucosal, oral, intravenous, subcutaneous, intramuscular, inhalation, and implantation routes.
SCD also has a variety of presentations, including pompholyx/dyshidrosis/vesicular dermatitis, maculopapular eruption, chronic pruritus, exfoliative erythroderma/toxiderma, chronic urticaria, erythema multiforme and vasculitis, hyperkeratotic papules of the elbows, acute generalized exanthematous pustulosis, and pruritus ani, according to Dr. Zippin.
SCD should be considered when a patient has a positive patch test to an allergen that is known to cause SCD, and does not clear after avoiding cutaneous exposure to the allergen, Dr. Zippin advised.
Patients will most often develop SCD from plants and herbs, Dr. Zippin noted. Chrysanthemums and chamomile tea are common culprits for compositae allergy and can trigger SCD; other causes are Anacardiaceae, Balsam of Peru, and propolis. Metals (nickel, cobalt, gold, and chromium), medications (aminoglycosides, corticosteroids, and ethylenediamine), and other sources (formaldehyde, propylene glycol in frozen foods, gallates, and methylisothiazolinone) can cause SCD as well.
Methylisothiazolinone in particular is a very common sensitizer, Dr. Zippin said. “If you have a patient who is positive to this, it’s almost always the cause of their problem.”
Balsam of Peru is in a number of different foods, and patients who need to follow a diet free of Balsam of Peru should avoid a long list of foods including citrus; bakery goods; Danish pastry; candy; gum; spices such as cinnamon, cloves, vanilla, curry, allspice, anise, and ginger; spicy condiments such as ketchup, chili sauce, barbecue sauce; chili, pizza, and foods with red sauces; tomatoes; pickles; alcohol (wine, beer, gin, vermouth); tea (perfumed or flavored); tobacco; chocolate and ice cream; and soft drinks (cola or spiced soft drinks).
Patients starting a nickel-free diet should avoid soy, peanuts and other nuts, legumes, chocolate, cocoa, oats, fish, and whole wheat flours. Any elimination diet should last for 3 months but should at least be tried for 3-4 weeks, with gradual reintroduction of foods suspected as triggers once per week. Any type I allergies that are discovered or suspected can be referred to an allergist for allergen challenge and desensitization therapy.
For more information, Dr. Zippin recommended the American Contact Dermatitis Society website for more information.
Dr. Zippin reported that he is the founder and holds stock options at CEP Biotech; is on the medical advisory board and receives stock options from YouV Labs., is a paid consultant and performs industry-sponsored research for Pfizer, receives stock options from Regeneron, and is on the medical advisory board for Hoth Therapeutics Inc. He is on the board of directors for the American Contact Dermatitis Society.
EXPERT ANALYSIS FROM ODAC 2020