User login
CMS proposes second specialty tier for Medicare drugs
The Centers for Medicare & Medicaid Services’ latest maneuver to combat rising drug prices is the proposed addition of a second specialty drug tier for the Medicare Part D prescription drug benefit.
The proposal is part of a broader proposed update to Medicare Parts C and D for contract years 2021 and 2022.

In a fact sheet highlighting various elements of the overall proposal, CMS noted that Part D plan sponsors and pharmacy benefit managers have been requesting the option to add a second “preferred” specialty tier that would “encourage the use of more preferred, less expensive agents, reduce enrollee cost sharing, and reduce costs to CMS.”
Currently, all pharmaceuticals with a cost greater than $670 are placed in a single specialty tier.
During a Feb. 5 press briefing, CMS Administrator Seema Verma described this change as “giving plans more negotiating power so they can lower prices for beneficiaries even further.”
Ms. Verma used a hypothetical example of two rheumatoid arthritis drugs to illustrate how the change will work. Currently, if both are over the $670 threshold, they would both be on the specialty tier with the same cost sharing. “Creating a second preferred specialty tier would allow for a different copay and fosters a more competitive environment that places Part D plans in a better position to negotiate the price of similar drugs and pass those savings onto the patient through lower cost sharing,” she said.
CMS is proposing to allow plans to implement a preferred specialty tier for the 2021 plan year.
The agency is also seeking to drive more generic drug use as a means of lowering costs.
Ms. Verma noted that, typically, even after a generic drug is launched, health plan sponsors prefer to drive patients to the brand name product, if they can secure a greater rebate from the manufacturer.
In a separate Feb. 5 blog post, Ms. Verma noted that when a brand was included on a formulary, the generic was also on the formulary 91.8% of the time. For the times in which the generic was not, it was typically because the wholesale cost of the generic was only 5%-15% lower than the brand wholesale cost.
In an effort to encourage use of generics, CMS is seeking comment on the development of measures of generic and biosimilar use in Medicare Part D that could be incorporated in health plan star ratings.
Some of the measures proposed in the blog post include the generic substitution rate, the generic therapeutic alternative opportunity rate (which measures the number of brand fills divided by the sum of the brand and generic fills when both are available), and the biosimilar utilization rate.
[email protected]
The Centers for Medicare & Medicaid Services’ latest maneuver to combat rising drug prices is the proposed addition of a second specialty drug tier for the Medicare Part D prescription drug benefit.
The proposal is part of a broader proposed update to Medicare Parts C and D for contract years 2021 and 2022.
In a fact sheet highlighting various elements of the overall proposal, CMS noted that Part D plan sponsors and pharmacy benefit managers have been requesting the option to add a second “preferred” specialty tier that would “encourage the use of more preferred, less expensive agents, reduce enrollee cost sharing, and reduce costs to CMS.”
Currently, all pharmaceuticals with a cost greater than $670 are placed in a single specialty tier.
During a Feb. 5 press briefing, CMS Administrator Seema Verma described this change as “giving plans more negotiating power so they can lower prices for beneficiaries even further.”
Ms. Verma used a hypothetical example of two rheumatoid arthritis drugs to illustrate how the change will work. Currently, if both are over the $670 threshold, they would both be on the specialty tier with the same cost sharing. “Creating a second preferred specialty tier would allow for a different copay and fosters a more competitive environment that places Part D plans in a better position to negotiate the price of similar drugs and pass those savings onto the patient through lower cost sharing,” she said.
CMS is proposing to allow plans to implement a preferred specialty tier for the 2021 plan year.
The agency is also seeking to drive more generic drug use as a means of lowering costs.
Ms. Verma noted that, typically, even after a generic drug is launched, health plan sponsors prefer to drive patients to the brand name product, if they can secure a greater rebate from the manufacturer.
In a separate Feb. 5 blog post, Ms. Verma noted that when a brand was included on a formulary, the generic was also on the formulary 91.8% of the time. For the times in which the generic was not, it was typically because the wholesale cost of the generic was only 5%-15% lower than the brand wholesale cost.
In an effort to encourage use of generics, CMS is seeking comment on the development of measures of generic and biosimilar use in Medicare Part D that could be incorporated in health plan star ratings.
Some of the measures proposed in the blog post include the generic substitution rate, the generic therapeutic alternative opportunity rate (which measures the number of brand fills divided by the sum of the brand and generic fills when both are available), and the biosimilar utilization rate.
[email protected]
Remdesivir under study as treatment for novel coronavirus

“What they’re looking at is the effect of this drug -- either the drug plus standard of care versus standard of care alone,” Anthony S. Fauci, MD, reported Feb. 7 during a press briefing held by members of President Trump’s Coronavirus Task Force. “I think pretty soon we are going to get a definitive answer, whether one of these among several drugs works.”
Dr. Fauci, director of the National Institute of Allergy and Infectious Diseases, added that several organizations and individual investigators are developing vaccines for 2019-nCoV. In one such effort, the National Institutes of Health is working with Moderna Inc. to develop a vaccine built on a messenger RNA platform. “One of the first steps is to successfully get that [novel coronavirus] gene and insert it into the messenger RNA platform successfully and allow it to express proteins,” Dr. Fauci explained. “We’ve succeeded in that. The next [step] is to put it in a mouse animal model to induce immunogenicity, and to get the company to make [gold nanoparticle] products. All of those have been successfully implemented. There have been no glitches so far. If that continues, we will be in Phase 1 trials in people within the next two-and-a-half months.”
In another development on the same day, Robert R. Redfield, MD, director of the Centers for Disease Control and Prevention, announced that Heath & Human Services issued an interim final rule to amend foreign quarantine regulations in the wake of the public health threat posed by the 2019-nCoV. “This will enable CDC to collect certain contact information data regarding airline passengers and crew when they arrive from other countries. . .and may be exposed to communicable disease,” Dr. Redfield said. “This action is part of our multi-layered approach to the U.S. response and demonstrates our commitment to take all necessary actions to protect the American people.”
According to Alex Azar, secretary of Health and Human Services, and chair of President Trump’s Coronavirus Task Force, there are 12 confirmed cases of the novel coronavirus in the United States, including two cases of transmission to people who had not recently been in China. “Although the virus represents a potentially very serious public health threat, and we expect to continue seeing more cases here, the immediate risk to the American public is low at this time,” Mr. Azar said. “We are working as quickly as possible on the many unanswered questions about this virus. That includes exactly how it spreads, how deadly it is, whether it’s commonly transmitted by patients who are not yet displaying symptoms, and other issues.”
Progestin-only systemic hormone therapy for menopausal hot flashes
The field of menopause medicine is dominated by studies documenting the effectiveness of systemic estrogen or estrogen-progestin hormone therapy for the treatment of hot flashes caused by hypoestrogenism. The effectiveness of progestin-only systemic hormone therapy for the treatment of hot flashes is much less studied and seldom is utilized in clinical practice. A small number of studies have reported that progestins, including micronized progesterone, medroxyprogesterone acetate, and norethindrone acetate, are effective treatment for hot flashes. Progestin-only systemic hormone therapy might be especially helpful for postmenopausal women with moderate to severe hot flashes who have a contraindication to estrogen treatment.
Micronized progesterone
Micronized progesterone (Prometrium) 300 mg daily taken at bedtime has been reported to effectively treat hot flashes in postmenopausal women. In one study, 133 postmenopausal women with an average age of 55 years and approximately 3 years from their last menstrual period were randomly assigned to 12 weeks of treatment with placebo or micronized progesterone 300 mg daily taken at bedtime.1 Mean serum progesterone levels were 0.28 ng/mL (0.89 nM) and 27 ng/mL (86 nM) in the women taking placebo and micronized progesterone, respectively. Compared with placebo, micronized progesterone reduced daytime and nighttime hot flash frequency and severity. In addition, compared with placebo, micronized progesterone improved the quality of sleep.1
Most reviews conclude that micronized progesterone has minimal cardiovascular risk.2 Micronized progesterone therapy might be especially helpful for postmenopausal women with moderate to severe hot flashes who have a contraindication to estrogen treatment such as those at increased risk for cardiovascular disease or women with a thrombophilia. Many experts believe that systemic estrogen therapy is contraindicated in postmenopausal women with an American Heart Association risk score greater than 10% over 10 years.3 Additional contraindications to systemic estrogen include women with cardiac disease who have a thrombophilia, such as the Factor V Leiden mutation.4
For women who are at high risk for estrogen-induced cardiovascular events, micronized progesterone may be a better option than systemic estrogen for treating hot flashes. Alternatively, in these women at risk of cardiovascular disease a selective serotonin reuptake inhibitor, such as escitalopram, 10 mg to 20 mg daily, may be a good option for treating postmenopausal hot flashes.5
Medroxyprogesterone acetate
Medroxyprogesterone acetate, at a dosage of 20 mg daily, is an effective treatment for hot flashes. In a randomized clinical trial 27 postmenopausal women with hot flashes were randomly assigned to treatment with placebo or medroxyprogesterone acetate 20 mg daily for 4 weeks. Vasomotor flushes were decreased by 26% and 74% in the placebo and medroxyprogesterone groups, respectively.6
Depot medroxyprogesterone acetate injections at dosages from 150 mg to 400 mg also have been reported to effectively treat hot flashes.7,8 In a trial comparing the effectiveness of estrogen monotherapy (conjugated equine estrogen 0.6 mg daily) with progestin monotherapy (medroxyprogesterone acetate 10 mg daily), both treatments were equally effective in reducing hot flashes.9
Continue to: Micronized progesterone vs medroxyprogesterone acetate...
Micronized progesterone vs medroxyprogesterone acetate
Experts in menopause medicine have suggested that in postmenopausal women micronized progesterone has a better pattern of benefits and fewer risks than medroxyprogesterone acetate.10,11 For example, in the E3N observational study of hormones and breast cancer risk, among 80,377 French postmenopausal women followed for a mean of 8 years, the combination of transdermal estradiol plus oral micronized progesterone was associated with no significantly increased risk of breast cancer (relative risk [RR], 1.08, 95% confidence interval [CI], 0.89–1.31) compared with never users of postmenopausal hormone therapy.12 By contrast, the combination of oral estrogen plus medroxyprogesterone acetate was associated with an increased risk of breast cancer (RR, 1.48; 95% CI, 1.02–2.16) compared with never users of postmenopausal hormone therapy. The E3N study indicates that micronized progesterone may have a more favorable breast health profile than medroxyprogesterone acetate.12

Norethindrone acetate
Norethindrone acetate monotherapy is not commonly prescribed for the treatment of menopausal hot flashes. However, a large clinical trial has demonstrated that norethindrone acetate effectively suppresses hot flashes in women with endometriosis treated with depot leuprolide acetate (LA). In one trial 201 women with endometriosis were randomly assigned to 12 months of treatment with13:
- LA plus placebo pills
- LA plus norethindrone acetate (NEA) 5 mg daily
- LA plus NEA 5 mg daily plus conjugated equine estrogen (CEE) 0.625 mg daily, or
- LA plus NEA 5 mg daily plus CEE 1.25 mg daily.
The median number of hot flashes in 24 hours was 6 in the LA plus placebo group and 0 in both the LA plus NEA 5 mg daily group and the LA plus NEA 5 mg plus CEE 1.25 mg daily group. This study demonstrates that NEA 5 mg daily is an effective treatment for hot flashes.
In the same study, LA plus placebo was associated with a significant decrease in lumbar spine bone mineral density. No significant decrease in bone mineral density was observed in the women who received LA plus NEA 5 mg daily. This finding indicates that NEA 5 mg reduces bone absorption caused by hypoestrogenism. In humans, norethindrone is a substrate for the aromatase enzyme system.14 Small quantities of ethinyl estradiol may be formed by aromatization of norethindrone in vivo,15,16 contributing to the effectiveness of NEA in suppressing hot flashes and preserving bone density.
Progestin: The estrogen alternative to hot flashes
For postmenopausal women with moderate to severe hot flashes, estrogen treatment reliably suppresses hot flashes and often improves sleep quality and mood. For postmenopausal women with a contraindication to estrogen treatment, progestin-only treatment with micronized progesterone or norethindrone acetate may be an effective option.
- Hitchcock CL, Prior JC. Oral micronized progesterone for vasomotor symptoms—a placebo-controlled randomized trial in healthy postmenopausal women. Menopause. 2012;19:886-893.
- Spark MJ, Willis J. Systematic review of progesterone use by midlife menopausal women. Maturitas 2012; 72: 192-202.
- Manson JE, Ames JM, Shapiro M, et al. Algorithm and mobile app for menopausal symptom management and hormonal/nonhormonal therapy decision making: a clinical decision-suport tool from The North American Menopause Society. Menopause. 2015;22:247-253.
- Herrington DM, Vittinghoff E, Howard TD, et al. Factor V Leiden, hormone replacement therapy, and risk of venous thromboembolic events in women with coronary disease. Arterioscler Thromb Vasc Biol. 2002;22:1012-1017.
- Ensrud KE, Joffe H, Guthrie KA, et al. Effect of escitalopram on insomnia symptoms and subjective sleep quality in healthy perimenopausal and postmenopausal women with hot flashes: a randomized controlled trial. Menopause. 2012;19:848-855.
- Schiff I, Tulchinsky D, Cramer D, et al. Oral medroxyprogesterone in the treatment of postmenopausal symptoms. JAMA. 1980;244:1443-1445.
- Bullock JL, Massey FM, Gambrell RD Jr. Use of medroxyprogesterone acetate to prevent menopausal symptoms. Obstet Gynecol. 1975;46:165-168.
- Loprinzi CL, Levitt R, Barton D, et al. Phase III comparison of depot medroxyprogesterone acetate to venlafaxine for managing hot flashes: North Central Cancer Treatment Group Trial N99C7. J Clin Oncol. 2006;24:1409-1414.
- Prior JC, Nielsen JD, Hitchcock CL, et al. Medroxyprogesterone and conjugated oestrogen are equivalent for hot flushes: 1-year randomized double-blind trial following premenopausal ovariectomy. Clin Sci (Lond). 2007;112:517-525.
- L’hermite M, Simoncini T, Fuller S, et al. Could transdermal estradiol + progesterone be a safer postmenopausal HRT? A review. Maturitas. 2008;60:185-201.
- Simon JA. What if the Women’s Health Initiative had used transdermal estradiol and oral progesterone instead? Menopause. 2014;21:769-783.
- Fournier A, Berrino F, Clavel-Chapelon F. Unequal risks for breast cancer associated with different hormone replacement therapies: results from the E3N cohort study. Breast Cancer Res Treat. 2008;107:103-111.
- Hornstein MD, Surrey ES, Weisberg GW, et al. Leuprolide acetate depot and hormonal add-back in endometriosis: a 12-month study. Lupron Add-Back Study Group. Obstet Gynecol. 1998;91:16-24.
- Barbieri RL, Canick JA, Ryan KJ. High-affinity steroid binding to rat testis 17 alpha-hydroxylase and human placental aromatase. J Steroid Biochem. 1981;14:387-393.
- Chu MC, Zhang X, Gentzschein E, et al. Formation of ethinyl estradiol in women during treatment with norethindrone acetate. J Clin Endocrinol Metab. 2007;92:2205-2207.
- Chwalisz K, Surrey E, Stanczyk FZ. The hormonal profile of norethindrone acetate: rationale for add-back therapy with gonadotropin-releasing hormone agonists in women with endometriosis. Reprod Sci. 2012;19:563-571.

Robert L. Barbieri, MD
Editor in Chief, OBG MANAGEMENT
Chair, Obstetrics and Gynecology
Brigham and Women’s Hospital
Boston, Massachusetts
Kate Macy Ladd Professor of Obstetrics,
Gynecology and Reproductive Biology
Harvard Medical School
Dr. Barbieri reports no financial relationships relevant to this article.
The field of menopause medicine is dominated by studies documenting the effectiveness of systemic estrogen or estrogen-progestin hormone therapy for the treatment of hot flashes caused by hypoestrogenism. The effectiveness of progestin-only systemic hormone therapy for the treatment of hot flashes is much less studied and seldom is utilized in clinical practice. A small number of studies have reported that progestins, including micronized progesterone, medroxyprogesterone acetate, and norethindrone acetate, are effective treatment for hot flashes. Progestin-only systemic hormone therapy might be especially helpful for postmenopausal women with moderate to severe hot flashes who have a contraindication to estrogen treatment.
Micronized progesterone
Micronized progesterone (Prometrium) 300 mg daily taken at bedtime has been reported to effectively treat hot flashes in postmenopausal women. In one study, 133 postmenopausal women with an average age of 55 years and approximately 3 years from their last menstrual period were randomly assigned to 12 weeks of treatment with placebo or micronized progesterone 300 mg daily taken at bedtime.1 Mean serum progesterone levels were 0.28 ng/mL (0.89 nM) and 27 ng/mL (86 nM) in the women taking placebo and micronized progesterone, respectively. Compared with placebo, micronized progesterone reduced daytime and nighttime hot flash frequency and severity. In addition, compared with placebo, micronized progesterone improved the quality of sleep.1
Most reviews conclude that micronized progesterone has minimal cardiovascular risk.2 Micronized progesterone therapy might be especially helpful for postmenopausal women with moderate to severe hot flashes who have a contraindication to estrogen treatment such as those at increased risk for cardiovascular disease or women with a thrombophilia. Many experts believe that systemic estrogen therapy is contraindicated in postmenopausal women with an American Heart Association risk score greater than 10% over 10 years.3 Additional contraindications to systemic estrogen include women with cardiac disease who have a thrombophilia, such as the Factor V Leiden mutation.4
For women who are at high risk for estrogen-induced cardiovascular events, micronized progesterone may be a better option than systemic estrogen for treating hot flashes. Alternatively, in these women at risk of cardiovascular disease a selective serotonin reuptake inhibitor, such as escitalopram, 10 mg to 20 mg daily, may be a good option for treating postmenopausal hot flashes.5
Medroxyprogesterone acetate
Medroxyprogesterone acetate, at a dosage of 20 mg daily, is an effective treatment for hot flashes. In a randomized clinical trial 27 postmenopausal women with hot flashes were randomly assigned to treatment with placebo or medroxyprogesterone acetate 20 mg daily for 4 weeks. Vasomotor flushes were decreased by 26% and 74% in the placebo and medroxyprogesterone groups, respectively.6
Depot medroxyprogesterone acetate injections at dosages from 150 mg to 400 mg also have been reported to effectively treat hot flashes.7,8 In a trial comparing the effectiveness of estrogen monotherapy (conjugated equine estrogen 0.6 mg daily) with progestin monotherapy (medroxyprogesterone acetate 10 mg daily), both treatments were equally effective in reducing hot flashes.9
Continue to: Micronized progesterone vs medroxyprogesterone acetate...
Micronized progesterone vs medroxyprogesterone acetate
Experts in menopause medicine have suggested that in postmenopausal women micronized progesterone has a better pattern of benefits and fewer risks than medroxyprogesterone acetate.10,11 For example, in the E3N observational study of hormones and breast cancer risk, among 80,377 French postmenopausal women followed for a mean of 8 years, the combination of transdermal estradiol plus oral micronized progesterone was associated with no significantly increased risk of breast cancer (relative risk [RR], 1.08, 95% confidence interval [CI], 0.89–1.31) compared with never users of postmenopausal hormone therapy.12 By contrast, the combination of oral estrogen plus medroxyprogesterone acetate was associated with an increased risk of breast cancer (RR, 1.48; 95% CI, 1.02–2.16) compared with never users of postmenopausal hormone therapy. The E3N study indicates that micronized progesterone may have a more favorable breast health profile than medroxyprogesterone acetate.12
Norethindrone acetate
Norethindrone acetate monotherapy is not commonly prescribed for the treatment of menopausal hot flashes. However, a large clinical trial has demonstrated that norethindrone acetate effectively suppresses hot flashes in women with endometriosis treated with depot leuprolide acetate (LA). In one trial 201 women with endometriosis were randomly assigned to 12 months of treatment with13:
- LA plus placebo pills
- LA plus norethindrone acetate (NEA) 5 mg daily
- LA plus NEA 5 mg daily plus conjugated equine estrogen (CEE) 0.625 mg daily, or
- LA plus NEA 5 mg daily plus CEE 1.25 mg daily.
The median number of hot flashes in 24 hours was 6 in the LA plus placebo group and 0 in both the LA plus NEA 5 mg daily group and the LA plus NEA 5 mg plus CEE 1.25 mg daily group. This study demonstrates that NEA 5 mg daily is an effective treatment for hot flashes.
In the same study, LA plus placebo was associated with a significant decrease in lumbar spine bone mineral density. No significant decrease in bone mineral density was observed in the women who received LA plus NEA 5 mg daily. This finding indicates that NEA 5 mg reduces bone absorption caused by hypoestrogenism. In humans, norethindrone is a substrate for the aromatase enzyme system.14 Small quantities of ethinyl estradiol may be formed by aromatization of norethindrone in vivo,15,16 contributing to the effectiveness of NEA in suppressing hot flashes and preserving bone density.
Progestin: The estrogen alternative to hot flashes
For postmenopausal women with moderate to severe hot flashes, estrogen treatment reliably suppresses hot flashes and often improves sleep quality and mood. For postmenopausal women with a contraindication to estrogen treatment, progestin-only treatment with micronized progesterone or norethindrone acetate may be an effective option.
- Hitchcock CL, Prior JC. Oral micronized progesterone for vasomotor symptoms—a placebo-controlled randomized trial in healthy postmenopausal women. Menopause. 2012;19:886-893.
- Spark MJ, Willis J. Systematic review of progesterone use by midlife menopausal women. Maturitas 2012; 72: 192-202.
- Manson JE, Ames JM, Shapiro M, et al. Algorithm and mobile app for menopausal symptom management and hormonal/nonhormonal therapy decision making: a clinical decision-suport tool from The North American Menopause Society. Menopause. 2015;22:247-253.
- Herrington DM, Vittinghoff E, Howard TD, et al. Factor V Leiden, hormone replacement therapy, and risk of venous thromboembolic events in women with coronary disease. Arterioscler Thromb Vasc Biol. 2002;22:1012-1017.
- Ensrud KE, Joffe H, Guthrie KA, et al. Effect of escitalopram on insomnia symptoms and subjective sleep quality in healthy perimenopausal and postmenopausal women with hot flashes: a randomized controlled trial. Menopause. 2012;19:848-855.
- Schiff I, Tulchinsky D, Cramer D, et al. Oral medroxyprogesterone in the treatment of postmenopausal symptoms. JAMA. 1980;244:1443-1445.
- Bullock JL, Massey FM, Gambrell RD Jr. Use of medroxyprogesterone acetate to prevent menopausal symptoms. Obstet Gynecol. 1975;46:165-168.
- Loprinzi CL, Levitt R, Barton D, et al. Phase III comparison of depot medroxyprogesterone acetate to venlafaxine for managing hot flashes: North Central Cancer Treatment Group Trial N99C7. J Clin Oncol. 2006;24:1409-1414.
- Prior JC, Nielsen JD, Hitchcock CL, et al. Medroxyprogesterone and conjugated oestrogen are equivalent for hot flushes: 1-year randomized double-blind trial following premenopausal ovariectomy. Clin Sci (Lond). 2007;112:517-525.
- L’hermite M, Simoncini T, Fuller S, et al. Could transdermal estradiol + progesterone be a safer postmenopausal HRT? A review. Maturitas. 2008;60:185-201.
- Simon JA. What if the Women’s Health Initiative had used transdermal estradiol and oral progesterone instead? Menopause. 2014;21:769-783.
- Fournier A, Berrino F, Clavel-Chapelon F. Unequal risks for breast cancer associated with different hormone replacement therapies: results from the E3N cohort study. Breast Cancer Res Treat. 2008;107:103-111.
- Hornstein MD, Surrey ES, Weisberg GW, et al. Leuprolide acetate depot and hormonal add-back in endometriosis: a 12-month study. Lupron Add-Back Study Group. Obstet Gynecol. 1998;91:16-24.
- Barbieri RL, Canick JA, Ryan KJ. High-affinity steroid binding to rat testis 17 alpha-hydroxylase and human placental aromatase. J Steroid Biochem. 1981;14:387-393.
- Chu MC, Zhang X, Gentzschein E, et al. Formation of ethinyl estradiol in women during treatment with norethindrone acetate. J Clin Endocrinol Metab. 2007;92:2205-2207.
- Chwalisz K, Surrey E, Stanczyk FZ. The hormonal profile of norethindrone acetate: rationale for add-back therapy with gonadotropin-releasing hormone agonists in women with endometriosis. Reprod Sci. 2012;19:563-571.

IBD quality initiative slashes ED utilization
AUSTIN, TEX. – A quality improvement initiative aimed at patients with inflammatory bowel disease (IBD) has reduced emergency department visits and hospitalizations by 20% or more and slashed opioid use by half, according to study results presented at the Crohn’s & Colitis Congress®, a partnership of the Crohn’s & Colitis Foundation and the American Gastroenterological Association.

After 15 months, the quality improvement program saw emergency department visit rates decline from 18% to 14%, a 22% relative decrease, Gil Y. Melmed, MD, of Cedars-Sinai Medical Center, Los Angeles, said. Additionally, the study documented a similar decrease in the rate of hospitalization, declining from 14% to 11%, while opioid utilization rates declined from 8% to 4%. “We also found decreases in special-cause variation in other measures of interest, including CT scan utilization as well as corticosteroid use, which was reduced 29% during the course of the program,” he said.
The quality initiative was conducted through the Crohn’s & Colitis Foundation as an outgrowth of its IBD Qorus quality improvement program. The 15-month study involved 20,392 patient visits at 15 academic and 11 private/community practices from January 2018 to April 2019. “This specific project within Qorus is focused specifically around the concept of improving access during times of urgent care need,” Dr. Melmed told this news organization. The goal was to identify practice changes that can drive improvement.
The intervention consisted of 19 different strategies, called a “Change Package,” and participating sites could choose to test and implement one or more of them, Dr. Melmed said. Some examples included designating urgent care slots in the clinic schedule, installing a nurse hotline, a weekly “huddle” to review high-risk patients, and patient education on using urgent care.
One of the drivers of the program was to provide immediate care improvement to patients, Dr. Melmed said in the interview. “As opposed to investments into the cure of IBD that we need, but which can take years to develop, this research has immediate, practical applicability for patients today,” he said.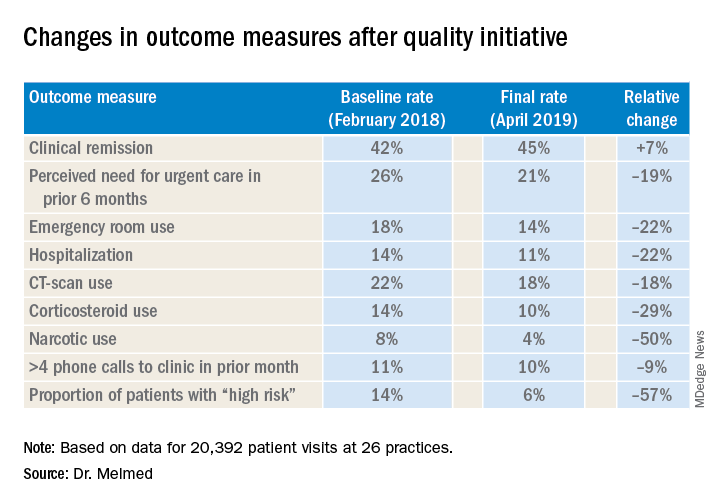
“The fact that we were able to demonstrate reduction in emergency room utilization and hospitalization, steroid use, and narcotic use has really energized the work that we were doing. We can now show that very-low-cost process changes at a site level lead to robust improvement in patient outcomes. These changes are potentially implementable in any practice setting,” Dr. Melmed said in the interview.
After Dr. Melmed’s presentation, Maria T. Abreu, MD, director of the Crohn’s and Colitis Center at the University of Miami, asked about the cost of the interventions. Dr. Melmed said the costs were nominal, such as paying for a new phone line for a patient hotline. “But overall the cost really involved in the program was the time that it took to review the high-risk list on a weekly basis with the team, and that is essentially a 15-minute huddle,” he said.
Later, Dr. Abreu said in an interview that the program was “a terrific example of how measuring outcomes and sharing ideas can make huge impacts in the lives of patients.” She added, “An enormous amount of money is spent on clinical trials of expensive biologics which have revolutionized treatment, yet the humanistic aspects of our care have just as great of an impact. In this study, each center focused on ways they could lower ER visits and hospitalizations. One size did not fit all, yet they could learn from each other. The very platform they used to conduct the study is a model for all of us.”
Corey A. Siegel, MD, of the Dartmouth-Hitchcock Medical Center, Lebanon, N.H., and Dr. Melmed's coprincipal investigator on Qorus, said the quality initiative now includes 49 GI practices across the country with plans to grow to 60 by the end of the year. "We have created this 'collaboratory' for providers from actross the country to work togetherr to learn how to best deliver high-qulaity care for patients with IBD," he said.
Another feature of the quality initiative allowed participating sites to see how they compared with others anonymously, Dr. Melmed said. “Using the data, we called out high-performing sites to teach the rest of us what they were doing that enabled them to improve, so that all of us could learn from their successes,” he said.
The researchers are aiming to evaluate costs and identify the most successful interventions, with the plan to present the latter at Digestive Disease Week® 2020 and use them to develop a toolkit practices can use. “Ultimately,” said Dr. Melmed, “this is scalable.”
Dr. Melmed disclosed financial relationships with AbbVie, Boehringer-Ingelheim, Celgene, Jannsen, GSK, Medtronic, Pfizer, Samsung Bioepis, Takeda, and Techlab; IBD Qorus receives support from Abbvie, AMAG, Helmsley Charitable Trust, Janssen, Nephoroceuticals, Pfizer, Takeda, and UCB.
SOURCE: Melmed GT et al. Crohn’s & Colitis Congress 2020, Session 28.
AUSTIN, TEX. – A quality improvement initiative aimed at patients with inflammatory bowel disease (IBD) has reduced emergency department visits and hospitalizations by 20% or more and slashed opioid use by half, according to study results presented at the Crohn’s & Colitis Congress®, a partnership of the Crohn’s & Colitis Foundation and the American Gastroenterological Association.
After 15 months, the quality improvement program saw emergency department visit rates decline from 18% to 14%, a 22% relative decrease, Gil Y. Melmed, MD, of Cedars-Sinai Medical Center, Los Angeles, said. Additionally, the study documented a similar decrease in the rate of hospitalization, declining from 14% to 11%, while opioid utilization rates declined from 8% to 4%. “We also found decreases in special-cause variation in other measures of interest, including CT scan utilization as well as corticosteroid use, which was reduced 29% during the course of the program,” he said.
The quality initiative was conducted through the Crohn’s & Colitis Foundation as an outgrowth of its IBD Qorus quality improvement program. The 15-month study involved 20,392 patient visits at 15 academic and 11 private/community practices from January 2018 to April 2019. “This specific project within Qorus is focused specifically around the concept of improving access during times of urgent care need,” Dr. Melmed told this news organization. The goal was to identify practice changes that can drive improvement.
The intervention consisted of 19 different strategies, called a “Change Package,” and participating sites could choose to test and implement one or more of them, Dr. Melmed said. Some examples included designating urgent care slots in the clinic schedule, installing a nurse hotline, a weekly “huddle” to review high-risk patients, and patient education on using urgent care.
One of the drivers of the program was to provide immediate care improvement to patients, Dr. Melmed said in the interview. “As opposed to investments into the cure of IBD that we need, but which can take years to develop, this research has immediate, practical applicability for patients today,” he said.
“The fact that we were able to demonstrate reduction in emergency room utilization and hospitalization, steroid use, and narcotic use has really energized the work that we were doing. We can now show that very-low-cost process changes at a site level lead to robust improvement in patient outcomes. These changes are potentially implementable in any practice setting,” Dr. Melmed said in the interview.
After Dr. Melmed’s presentation, Maria T. Abreu, MD, director of the Crohn’s and Colitis Center at the University of Miami, asked about the cost of the interventions. Dr. Melmed said the costs were nominal, such as paying for a new phone line for a patient hotline. “But overall the cost really involved in the program was the time that it took to review the high-risk list on a weekly basis with the team, and that is essentially a 15-minute huddle,” he said.
Later, Dr. Abreu said in an interview that the program was “a terrific example of how measuring outcomes and sharing ideas can make huge impacts in the lives of patients.” She added, “An enormous amount of money is spent on clinical trials of expensive biologics which have revolutionized treatment, yet the humanistic aspects of our care have just as great of an impact. In this study, each center focused on ways they could lower ER visits and hospitalizations. One size did not fit all, yet they could learn from each other. The very platform they used to conduct the study is a model for all of us.”
Corey A. Siegel, MD, of the Dartmouth-Hitchcock Medical Center, Lebanon, N.H., and Dr. Melmed's coprincipal investigator on Qorus, said the quality initiative now includes 49 GI practices across the country with plans to grow to 60 by the end of the year. "We have created this 'collaboratory' for providers from actross the country to work togetherr to learn how to best deliver high-qulaity care for patients with IBD," he said.
Another feature of the quality initiative allowed participating sites to see how they compared with others anonymously, Dr. Melmed said. “Using the data, we called out high-performing sites to teach the rest of us what they were doing that enabled them to improve, so that all of us could learn from their successes,” he said.
The researchers are aiming to evaluate costs and identify the most successful interventions, with the plan to present the latter at Digestive Disease Week® 2020 and use them to develop a toolkit practices can use. “Ultimately,” said Dr. Melmed, “this is scalable.”
Dr. Melmed disclosed financial relationships with AbbVie, Boehringer-Ingelheim, Celgene, Jannsen, GSK, Medtronic, Pfizer, Samsung Bioepis, Takeda, and Techlab; IBD Qorus receives support from Abbvie, AMAG, Helmsley Charitable Trust, Janssen, Nephoroceuticals, Pfizer, Takeda, and UCB.
SOURCE: Melmed GT et al. Crohn’s & Colitis Congress 2020, Session 28.
REPORTING FROM CROHN’S & COLITIS CONGRESS
Treating those who taught us
I was surprised when the name came up on my hospital census as a new consult.

Many years ago he’d been one of my attendings in residency. Someone I’d trained under. He’d been patient, almost grandfatherly, in the way he taught residents on his service. Never angry or impatient. I’d genuinely liked him as a person and respected him as a teacher.
And here he was now, a new consult on my daily hospital patient list.
A quick look at his chart brought the irony that I’m the same age now that he was when I worked under him. Time flies.
He didn’t remember me, nor did I expect him to. In my training from 1993 to 1997, I’d only dealt with him directly for a few months here and there. He’d seen a lot of residents come and go over his career.
He was, like me, older now. I wouldn’t have recognized him if I didn’t know the name in advance. He was frail now, seemingly smaller than I remembered, his mind and health damaged by his own neurologic issues.
Like all of us, I’ve taken care of other physicians, but this was the first time I’d encountered one of my former teachers in that role, and felt bad that he was in a situation I really couldn’t do much about.
I wrote some orders and moved on to the next consult, but haven’t stopped thinking about him.
Time comes for all of us sooner or later, though it’s never easy to reflect on. I’d certainly do what I could to help him, but was well aware (as I’m sure he was) that there was only so much I could.

When I came back the next day he’d left. At his own insistence, he wanted us to stop what we were doing and opted to be kept comfortable. It was certainly not an easy choice to make for any of us, but in character with the person and physician I still liked and respected.
Dr. Block has a solo neurology practice in Scottsdale, Ariz.
I was surprised when the name came up on my hospital census as a new consult.
Many years ago he’d been one of my attendings in residency. Someone I’d trained under. He’d been patient, almost grandfatherly, in the way he taught residents on his service. Never angry or impatient. I’d genuinely liked him as a person and respected him as a teacher.
And here he was now, a new consult on my daily hospital patient list.
A quick look at his chart brought the irony that I’m the same age now that he was when I worked under him. Time flies.
He didn’t remember me, nor did I expect him to. In my training from 1993 to 1997, I’d only dealt with him directly for a few months here and there. He’d seen a lot of residents come and go over his career.
He was, like me, older now. I wouldn’t have recognized him if I didn’t know the name in advance. He was frail now, seemingly smaller than I remembered, his mind and health damaged by his own neurologic issues.
Like all of us, I’ve taken care of other physicians, but this was the first time I’d encountered one of my former teachers in that role, and felt bad that he was in a situation I really couldn’t do much about.
I wrote some orders and moved on to the next consult, but haven’t stopped thinking about him.
Time comes for all of us sooner or later, though it’s never easy to reflect on. I’d certainly do what I could to help him, but was well aware (as I’m sure he was) that there was only so much I could.
When I came back the next day he’d left. At his own insistence, he wanted us to stop what we were doing and opted to be kept comfortable. It was certainly not an easy choice to make for any of us, but in character with the person and physician I still liked and respected.
Dr. Block has a solo neurology practice in Scottsdale, Ariz.
EEG abnormalities may indicate increased risk for epilepsy in patients with autism
BALTIMORE – , according to research presented at the annual meeting of the American Epilepsy Society. In addition, a positive family history of febrile seizures also is associated with an increased risk of epilepsy in this population.

The literature suggests that the prevalence of epilepsy in patients with ASD ranges from 5% to 40%. This broad range may result from the heterogeneity of epilepsy risk factors among patients with ASD. These risk factors include intellectual disability, age, and syndromic forms of ASD such as tuberous sclerosis complex. Regardless of whether they have epilepsy, approximately 60% of patients with ASD have EEG abnormalities. The prognostic implications of these abnormalities are uncertain.
Investigators reviewed patients’ charts retrospectively
Divya Nadkarni, MD, a neurologist at Ronald Reagan UCLA Medical Center in Los Angeles, and colleagues sought to clarify the relationship between risk factors such as EEG abnormalities and subsequent epilepsy in patients with ASD. They retrospectively identified patients who were followed jointly at UCLA and at Pediatric Minds, a neurodevelopmental clinic in Torrance, Calif. Eligible patients had a diagnosis of ASD, based on criteria from DSM-IV, DSM-5, or the Autism Diagnostic Observation Schedule. In addition, patients had overnight, continuous video EEG evaluation and a minimum follow-up of 1 week after EEG. Patients with a history of epilepsy before the initial EEG evaluation were excluded. Dr. Nadkarni and colleagues collected clinical and electrographic data by chart review.
The study’s primary outcome was time to onset of epilepsy. Among the variables that the investigators analyzed were EEG abnormalities, which they defined as focal slowing or generalized or focal epileptiform discharges. The other variables were history of febrile seizures, family history of epilepsy, family history of febrile seizures, and family history of ASD. Dr. Nadkarni and colleagues analyzed the data using the Kaplan–Meier method and Cox proportional hazards models.
In all, 164 patients met the study’s inclusion criteria. The population’s median age at the initial EEG evaluation was 4.5 years. The median follow-up after this evaluation was 2.4 years. The investigators found 63 patients (38.4%) with abnormal EEGs, and 18 patients (11%) subsequently developed epilepsy after a median of 1.9 years.
Family history of febrile seizures was associated with time to epilepsy onset
The time to epilepsy onset was associated with abnormalities on the initial overnight continuous EEG. The hazard ratio of epilepsy among patients with EEG abnormalities was 8.0. Approximately one-third of patients with EEG abnormalities developed subsequent epilepsy, compared with approximately 5% of patients without EEG abnormalities, said Dr. Nadkarni.
In addition, time to epilepsy onset was independently associated with a positive family history of febrile seizures. This finding was unexpected, said Dr. Nadkarni. The hazard ratio of epilepsy among patients with a positive family history of febrile seizures was 12.6.
The patient’s own history of febrile seizures was not associated with time to epilepsy onset. One potential explanation for this result is that it is difficult to distinguish between febrile seizure and seizure with fever in the general pediatric population. Making this distinction in children with ASD, who may have atypical febrile seizures, might be still more difficult, said Dr. Nadkarni.
Time for guideline updates?
“Statements from the Centers for Disease Control and Prevention, the American Academy of Pediatrics, the American Academy of Neurology, and the Child Neurology Society do not currently recommend routine EEG screening for all children with ASD,” said Dr. Nadkarni. Investigators are suggesting that the guidelines should be reevaluated, however. “Research shows that EEG abnormalities, particularly epileptiform abnormalities, are associated with worse outcome, in terms of developmental and adaptive functioning. EEG endophenotypes in ASD are starting to be elucidated ... That’s one reason to consider EEG screening.” Furthermore, preliminary connectivity research suggests that EEG screening of high-risk siblings of children with ASD may predict the development of ASD.
The small cohort and retrospective design were among the study’s limitations, said Dr. Nadkarni. Some patients were lost to follow-up, and some data were missing from patients’ charts.
“In our opinion, further study – ideally, a prospective, observational cohort study – might be warranted to determine whether overnight continuous EEG monitoring might be useful as a screening tool for epilepsy in patients with ASD,” Dr. Nadkarni concluded.
The study was conducted without external funding, and the investigators had no disclosures.
SOURCE: Nadkarni D et al. AES 2019. Abstract 1.29.
BALTIMORE – , according to research presented at the annual meeting of the American Epilepsy Society. In addition, a positive family history of febrile seizures also is associated with an increased risk of epilepsy in this population.
The literature suggests that the prevalence of epilepsy in patients with ASD ranges from 5% to 40%. This broad range may result from the heterogeneity of epilepsy risk factors among patients with ASD. These risk factors include intellectual disability, age, and syndromic forms of ASD such as tuberous sclerosis complex. Regardless of whether they have epilepsy, approximately 60% of patients with ASD have EEG abnormalities. The prognostic implications of these abnormalities are uncertain.
Investigators reviewed patients’ charts retrospectively
Divya Nadkarni, MD, a neurologist at Ronald Reagan UCLA Medical Center in Los Angeles, and colleagues sought to clarify the relationship between risk factors such as EEG abnormalities and subsequent epilepsy in patients with ASD. They retrospectively identified patients who were followed jointly at UCLA and at Pediatric Minds, a neurodevelopmental clinic in Torrance, Calif. Eligible patients had a diagnosis of ASD, based on criteria from DSM-IV, DSM-5, or the Autism Diagnostic Observation Schedule. In addition, patients had overnight, continuous video EEG evaluation and a minimum follow-up of 1 week after EEG. Patients with a history of epilepsy before the initial EEG evaluation were excluded. Dr. Nadkarni and colleagues collected clinical and electrographic data by chart review.
The study’s primary outcome was time to onset of epilepsy. Among the variables that the investigators analyzed were EEG abnormalities, which they defined as focal slowing or generalized or focal epileptiform discharges. The other variables were history of febrile seizures, family history of epilepsy, family history of febrile seizures, and family history of ASD. Dr. Nadkarni and colleagues analyzed the data using the Kaplan–Meier method and Cox proportional hazards models.
In all, 164 patients met the study’s inclusion criteria. The population’s median age at the initial EEG evaluation was 4.5 years. The median follow-up after this evaluation was 2.4 years. The investigators found 63 patients (38.4%) with abnormal EEGs, and 18 patients (11%) subsequently developed epilepsy after a median of 1.9 years.
Family history of febrile seizures was associated with time to epilepsy onset
The time to epilepsy onset was associated with abnormalities on the initial overnight continuous EEG. The hazard ratio of epilepsy among patients with EEG abnormalities was 8.0. Approximately one-third of patients with EEG abnormalities developed subsequent epilepsy, compared with approximately 5% of patients without EEG abnormalities, said Dr. Nadkarni.
In addition, time to epilepsy onset was independently associated with a positive family history of febrile seizures. This finding was unexpected, said Dr. Nadkarni. The hazard ratio of epilepsy among patients with a positive family history of febrile seizures was 12.6.
The patient’s own history of febrile seizures was not associated with time to epilepsy onset. One potential explanation for this result is that it is difficult to distinguish between febrile seizure and seizure with fever in the general pediatric population. Making this distinction in children with ASD, who may have atypical febrile seizures, might be still more difficult, said Dr. Nadkarni.
Time for guideline updates?
“Statements from the Centers for Disease Control and Prevention, the American Academy of Pediatrics, the American Academy of Neurology, and the Child Neurology Society do not currently recommend routine EEG screening for all children with ASD,” said Dr. Nadkarni. Investigators are suggesting that the guidelines should be reevaluated, however. “Research shows that EEG abnormalities, particularly epileptiform abnormalities, are associated with worse outcome, in terms of developmental and adaptive functioning. EEG endophenotypes in ASD are starting to be elucidated ... That’s one reason to consider EEG screening.” Furthermore, preliminary connectivity research suggests that EEG screening of high-risk siblings of children with ASD may predict the development of ASD.
The small cohort and retrospective design were among the study’s limitations, said Dr. Nadkarni. Some patients were lost to follow-up, and some data were missing from patients’ charts.
“In our opinion, further study – ideally, a prospective, observational cohort study – might be warranted to determine whether overnight continuous EEG monitoring might be useful as a screening tool for epilepsy in patients with ASD,” Dr. Nadkarni concluded.
The study was conducted without external funding, and the investigators had no disclosures.
SOURCE: Nadkarni D et al. AES 2019. Abstract 1.29.
REPORTING FROM AES 2019
Less gestational weight gain seen with metformin
GRAPEVINE, TEX.* – Pregnant women with type 2 diabetes or prediabetes had significantly less gestational weight gain if they had metformin exposure at any point in their pregnancies, with no differences in infant birth weight or postnatal infant hypoglycemia, according to research presented at the meeting sponsored by the Society for Maternal-Fetal Medicine.

In a retrospective single-center review of 284 women without metformin exposure and 227 with metformin exposure in pregnancy, metformin exposure at any point in pregnancy was associated with a significantly greater chance of appropriate – rather than excessive – weight gain.
The relationship held true for the 169 women who had metformin in their first trimester of pregnancy. Here, 69% of women had appropriate weight gain using Institute of Medicine and American College of Obstetricians and Gynecologists standards, compared with 54% of the 282 women who had no metformin exposure (adjusted odds ratio 1.92, P = .003). A further 22% of women receiving metformin in their first trimester of pregnancy lost weight, compared with 9% of women without metformin exposure (aOR 2.11, P = .019). There was no significant difference between the two groups in infant birth weight.
Separately, study author Jacquelyn Adams, MD, and her colleagues analyzed outcomes for the full cohort of 227 women who received metformin at any point in their pregnancy, comparing them again to the 282 women who had not received metformin. Most women (85%) were on 2 g of metformin at the time of delivery. These results again showed a greater likelihood of appropriate weight gain in the metformin group (69%; aOR 1.85; P = .002). Maternal weight loss was seen in 20% of this group (aOR 1.98, P = .018). Infant birth weights were not significantly different between these two groups.
“We found that women who had been on metformin at any point in their pregnancy had more appropriate weight gain and less excessive weight gain,” said Dr. Adams, a maternal-fetal medicine fellow at the University of Wisconsin–Madison. “Actually, some women on metformin had even had a little bit of weight loss, with no difference in their baby’s birth weight. So that’s really exciting, because our starting prepregnancy body mass index was 33-36 [kg/m2], which is considered obese,” she said in an interview.
This is an important finding, said Dr. Adams, because previous work has shown that less weight gain in pregnancy is associated with lower risk for hypertension and preeclampsia, and lower rates of fetal macrosomia.
What about infant outcomes? Dr. Adams said that there were many concerns about metformin: “Would it affect baby outcome? Were those babies more likely to be hypoglycemic? Were they more likely to be growth restricted? Were they more likely to have issues in the NICU? And the answer was really, ‘No.’ ”
“So we can both help these women have appropriate weight gain and not have any negative effects on these babies,” she added.
Specifically, Dr. Adams and her coinvestigators found no significant differences between the groups in gestational age at birth, likelihood of neonatal ICU admission, Apgar scores, neonatal hypoglycemia, respiratory distress syndrome, or fetal death. Fetal growth restriction and anomalies occurred at a low and similar rate between the groups.
Dr. Adams said that she was not surprised to see that metformin was associated with less weight gain in pregnancy, but she was surprised at how highly significant the differences were with metformin use. “Metformin is first-line for diabetes in nonpregnant individuals because it’s associated with things like weight loss, and because of ease of use and lack of hypoglycemia – so I was really hoping to see this kind of result.”
Women receiving metformin were a mean 34 years old, while those who didn’t get metformin were 32 years old, a significant difference. Prepregnancy body mass index also was higher in those receiving metformin, and they were more likely to have a type 2 diabetes diagnosis. A similar proportion of both groups – about two-thirds – were white, and about 20% were Hispanic.
The lower weight gain seen in metformin-takers also might smooth the way post partum, said Dr. Adams. “My perception is that, when these women leave us, they might not have any primary care follow-up; they might not have anybody following their diabetes; and metformin is a very viable way to help them in their life outside of pregnancy.
“Not to mention that all the weight you gain in pregnancy, you do eventually have to lose post partum,” she added, “so having less pregnancy weight gain kind of sets them up for success in their postpregnancy life as well.”
Asked whether these results inform the ongoing question of whether insulin or metformin is the most appropriate first-line treatment for gestational diabetes, Dr. Adams first noted that “there’s a lot of crossover,” pointing out that over 60% of the participants in her study eventually also required insulin.
“It’s a question I would love to address in a head-to-head trial,” she said, adding that questions about metformin’s effects on the placenta and the potential for later deleterious effects require more study.
In her practice, Dr. Adams said that patients generally are discharged with a metformin prescription, and then meet with a diabetes educator 1 week after delivery to assess blood glucose levels and adjust medical management. Following that, a warm hand-off to a primary care practice who can continue management and education is optimal, she said.
In terms of next steps, “We would really love to look at metformin in the postpartum period,” said Dr. Adams. Ideally, future work could look for outcomes that extend beyond the 6- to 8-week postpartum follow-up visit. For example, she said, there are indications that women with insulin insensitivity might benefit from metformin while breastfeeding; it’s also possible that metformin might reduce the risk of postpartum preeclampsia.
Dr. Adams reported that she had no conflicts of interest and no outside sources of funding.
SOURCE: Adams J et al. SMFM 2020, Abstract 335.
*This story was updated 2/10/2020.
GRAPEVINE, TEX.* – Pregnant women with type 2 diabetes or prediabetes had significantly less gestational weight gain if they had metformin exposure at any point in their pregnancies, with no differences in infant birth weight or postnatal infant hypoglycemia, according to research presented at the meeting sponsored by the Society for Maternal-Fetal Medicine.
In a retrospective single-center review of 284 women without metformin exposure and 227 with metformin exposure in pregnancy, metformin exposure at any point in pregnancy was associated with a significantly greater chance of appropriate – rather than excessive – weight gain.
The relationship held true for the 169 women who had metformin in their first trimester of pregnancy. Here, 69% of women had appropriate weight gain using Institute of Medicine and American College of Obstetricians and Gynecologists standards, compared with 54% of the 282 women who had no metformin exposure (adjusted odds ratio 1.92, P = .003). A further 22% of women receiving metformin in their first trimester of pregnancy lost weight, compared with 9% of women without metformin exposure (aOR 2.11, P = .019). There was no significant difference between the two groups in infant birth weight.
Separately, study author Jacquelyn Adams, MD, and her colleagues analyzed outcomes for the full cohort of 227 women who received metformin at any point in their pregnancy, comparing them again to the 282 women who had not received metformin. Most women (85%) were on 2 g of metformin at the time of delivery. These results again showed a greater likelihood of appropriate weight gain in the metformin group (69%; aOR 1.85; P = .002). Maternal weight loss was seen in 20% of this group (aOR 1.98, P = .018). Infant birth weights were not significantly different between these two groups.
“We found that women who had been on metformin at any point in their pregnancy had more appropriate weight gain and less excessive weight gain,” said Dr. Adams, a maternal-fetal medicine fellow at the University of Wisconsin–Madison. “Actually, some women on metformin had even had a little bit of weight loss, with no difference in their baby’s birth weight. So that’s really exciting, because our starting prepregnancy body mass index was 33-36 [kg/m2], which is considered obese,” she said in an interview.
This is an important finding, said Dr. Adams, because previous work has shown that less weight gain in pregnancy is associated with lower risk for hypertension and preeclampsia, and lower rates of fetal macrosomia.
What about infant outcomes? Dr. Adams said that there were many concerns about metformin: “Would it affect baby outcome? Were those babies more likely to be hypoglycemic? Were they more likely to be growth restricted? Were they more likely to have issues in the NICU? And the answer was really, ‘No.’ ”
“So we can both help these women have appropriate weight gain and not have any negative effects on these babies,” she added.
Specifically, Dr. Adams and her coinvestigators found no significant differences between the groups in gestational age at birth, likelihood of neonatal ICU admission, Apgar scores, neonatal hypoglycemia, respiratory distress syndrome, or fetal death. Fetal growth restriction and anomalies occurred at a low and similar rate between the groups.
Dr. Adams said that she was not surprised to see that metformin was associated with less weight gain in pregnancy, but she was surprised at how highly significant the differences were with metformin use. “Metformin is first-line for diabetes in nonpregnant individuals because it’s associated with things like weight loss, and because of ease of use and lack of hypoglycemia – so I was really hoping to see this kind of result.”
Women receiving metformin were a mean 34 years old, while those who didn’t get metformin were 32 years old, a significant difference. Prepregnancy body mass index also was higher in those receiving metformin, and they were more likely to have a type 2 diabetes diagnosis. A similar proportion of both groups – about two-thirds – were white, and about 20% were Hispanic.
The lower weight gain seen in metformin-takers also might smooth the way post partum, said Dr. Adams. “My perception is that, when these women leave us, they might not have any primary care follow-up; they might not have anybody following their diabetes; and metformin is a very viable way to help them in their life outside of pregnancy.
“Not to mention that all the weight you gain in pregnancy, you do eventually have to lose post partum,” she added, “so having less pregnancy weight gain kind of sets them up for success in their postpregnancy life as well.”
Asked whether these results inform the ongoing question of whether insulin or metformin is the most appropriate first-line treatment for gestational diabetes, Dr. Adams first noted that “there’s a lot of crossover,” pointing out that over 60% of the participants in her study eventually also required insulin.
“It’s a question I would love to address in a head-to-head trial,” she said, adding that questions about metformin’s effects on the placenta and the potential for later deleterious effects require more study.
In her practice, Dr. Adams said that patients generally are discharged with a metformin prescription, and then meet with a diabetes educator 1 week after delivery to assess blood glucose levels and adjust medical management. Following that, a warm hand-off to a primary care practice who can continue management and education is optimal, she said.
In terms of next steps, “We would really love to look at metformin in the postpartum period,” said Dr. Adams. Ideally, future work could look for outcomes that extend beyond the 6- to 8-week postpartum follow-up visit. For example, she said, there are indications that women with insulin insensitivity might benefit from metformin while breastfeeding; it’s also possible that metformin might reduce the risk of postpartum preeclampsia.
Dr. Adams reported that she had no conflicts of interest and no outside sources of funding.
SOURCE: Adams J et al. SMFM 2020, Abstract 335.
*This story was updated 2/10/2020.
REPORTING FROM THE PREGNANCY MEETING
Breast cancer chemoprophylaxis in high-risk women: How persistent is the impact of an aromatase inhibitor after 5 years of use?
Cuzick J, Sestak I, Forbes JF, et al; IBIS-II Investigators. Use of anastrozole for breast cancer prevention (IBIS-II): long-term results of a randomised controlled trial. Lancet. 2020;395;117-122.
EXPERT COMMENTARY
A manufacturer-sponsored trial initiated in 2003, IBIS-II (International Breast Cancer Intervention Study II) included 3,864 menopausal women (mean age at baseline, 59.4 years) at elevated risk for breast cancer. The women were randomly assigned to 5-year treatment with either placebo (N = 1,944) or the aromatase inhibitor anastrozole 1 mg daily (N = 1,920).1
Reporting on the long-term follow-up results of the trial, Cuzick and colleagues found that anastrozole use substantially reduced the incidence of all breast cancer, including invasive breast cancer and ductal carcinoma in situ. Key adverse events associated with anastrozole were fractures, arthralgias, and menopausal symptoms (vasomotor symptoms and vaginal dryness).
To determine whether anastrozole had any persistent impact, the investigators continued to follow participants for all breast cancers and other outcomes.2
Details of the study
This randomized controlled trial that included 3,864 postmenopausal women had a median overall follow-up of 131 months; the primary outcome was all breast cancer. Random assignment to anastrozole use (1,920 women) was associated with a 49% reduction in all breast cancer (85 cases vs 165 cases in the placebo group [N = 1,944]; HR, 0.51; 95% CI, 0.39–0.66; P<.0001).
In the first 5 years, risk reduction was 61% with anastrozole (P<.0001 for overall and the first 5 years of follow-up). Subsequently, the magnitude of the risk reduction attenuated to 37% (P = .014). With 12 years of follow-up, the estimated risk of being diagnosed with breast cancer was 8.8% and 5.3% in the placebo and anastrozole groups, respectively. The number needed to treat for 5 years to prevent 1 breast cancer was 29.
With anastrozole, prevention of estrogen–receptor positive tumors was substantially more robust at 54% (HR, 0.46; 95% CI, 0.33–0.65; P<.0001) than for estrogen–receptor negative tumors at 27% (HR, 0.77; 95% CI, 0.41–1.44; P = .41).
Over the course of the long-term study, the incidence of fractures and cardiovascular events was similar in the placebo and anastrozole groups. Arthralgias and menopausal symptoms were not assessed after the trial’s initial 5 years. Overall, the number of deaths (all cause as well as breast cancer related) were similar in the placebo and anastrozole groups.
Continue to: Study strengths and limitations...
Study strengths and limitations
The authors noted that this updated analysis of the IBIS-II trial data offers further support for the use of anastrozole in breast cancer prevention for high-risk postmenopausal women. The extended posttreatment follow-up showed a significant continuing reduction in breast cancer, and there was no evidence of new late adverse effects. A limitation of the analysis, however, is that very few deaths from breast cancer occurred during the study timeframe. Thus, additional follow-up would be needed to assess anastrozole’s effect on breast cancer mortality.
The breast cancer chemoprophylactic efficacy of anastrozole compares favorably with that of tamoxifen. Furthermore, in women with an intact uterus, the increased risks of gynecologic problems, including endometrial cancer, associated with tamoxifen do not occur with aromatase inhibitors. However, the lack of any obvious mortality benefit means the ultimate value of estrogen deprivation breast cancer chemoprophylaxis continues to be uncertain, especially given other risks, including bone loss. In view of these new data, it will be important for high-risk women considering aromatase inhibitor prophylaxis to understand that these medications have not been associated with a mortality benefit.
ANDREW M. KAUNITZ, MD, NCMP
- Cuzick J, Sestak I, Forbes JF, et al; IBIS-II Investigators. Anastrozole for prevention of breast cancer in high-risk postmenopausal women (IBIS-II): an international, double-blind, randomised placebo-controlled trial. Lancet. 2014;383:1041-1048.
- Cuzick J, Sestak I, Forbes JF, et al; IBIS-II Investigators. Use of anastrozole for breast cancer prevention (IBIS-II): long-term results of a randomised controlled trial. Lancet. 2020;395;117-122.
Cuzick J, Sestak I, Forbes JF, et al; IBIS-II Investigators. Use of anastrozole for breast cancer prevention (IBIS-II): long-term results of a randomised controlled trial. Lancet. 2020;395;117-122.
EXPERT COMMENTARY
A manufacturer-sponsored trial initiated in 2003, IBIS-II (International Breast Cancer Intervention Study II) included 3,864 menopausal women (mean age at baseline, 59.4 years) at elevated risk for breast cancer. The women were randomly assigned to 5-year treatment with either placebo (N = 1,944) or the aromatase inhibitor anastrozole 1 mg daily (N = 1,920).1
Reporting on the long-term follow-up results of the trial, Cuzick and colleagues found that anastrozole use substantially reduced the incidence of all breast cancer, including invasive breast cancer and ductal carcinoma in situ. Key adverse events associated with anastrozole were fractures, arthralgias, and menopausal symptoms (vasomotor symptoms and vaginal dryness).
To determine whether anastrozole had any persistent impact, the investigators continued to follow participants for all breast cancers and other outcomes.2
Details of the study
This randomized controlled trial that included 3,864 postmenopausal women had a median overall follow-up of 131 months; the primary outcome was all breast cancer. Random assignment to anastrozole use (1,920 women) was associated with a 49% reduction in all breast cancer (85 cases vs 165 cases in the placebo group [N = 1,944]; HR, 0.51; 95% CI, 0.39–0.66; P<.0001).
In the first 5 years, risk reduction was 61% with anastrozole (P<.0001 for overall and the first 5 years of follow-up). Subsequently, the magnitude of the risk reduction attenuated to 37% (P = .014). With 12 years of follow-up, the estimated risk of being diagnosed with breast cancer was 8.8% and 5.3% in the placebo and anastrozole groups, respectively. The number needed to treat for 5 years to prevent 1 breast cancer was 29.
With anastrozole, prevention of estrogen–receptor positive tumors was substantially more robust at 54% (HR, 0.46; 95% CI, 0.33–0.65; P<.0001) than for estrogen–receptor negative tumors at 27% (HR, 0.77; 95% CI, 0.41–1.44; P = .41).
Over the course of the long-term study, the incidence of fractures and cardiovascular events was similar in the placebo and anastrozole groups. Arthralgias and menopausal symptoms were not assessed after the trial’s initial 5 years. Overall, the number of deaths (all cause as well as breast cancer related) were similar in the placebo and anastrozole groups.
Continue to: Study strengths and limitations...
Study strengths and limitations
The authors noted that this updated analysis of the IBIS-II trial data offers further support for the use of anastrozole in breast cancer prevention for high-risk postmenopausal women. The extended posttreatment follow-up showed a significant continuing reduction in breast cancer, and there was no evidence of new late adverse effects. A limitation of the analysis, however, is that very few deaths from breast cancer occurred during the study timeframe. Thus, additional follow-up would be needed to assess anastrozole’s effect on breast cancer mortality.
The breast cancer chemoprophylactic efficacy of anastrozole compares favorably with that of tamoxifen. Furthermore, in women with an intact uterus, the increased risks of gynecologic problems, including endometrial cancer, associated with tamoxifen do not occur with aromatase inhibitors. However, the lack of any obvious mortality benefit means the ultimate value of estrogen deprivation breast cancer chemoprophylaxis continues to be uncertain, especially given other risks, including bone loss. In view of these new data, it will be important for high-risk women considering aromatase inhibitor prophylaxis to understand that these medications have not been associated with a mortality benefit.
ANDREW M. KAUNITZ, MD, NCMP
- Cuzick J, Sestak I, Forbes JF, et al; IBIS-II Investigators. Anastrozole for prevention of breast cancer in high-risk postmenopausal women (IBIS-II): an international, double-blind, randomised placebo-controlled trial. Lancet. 2014;383:1041-1048.
- Cuzick J, Sestak I, Forbes JF, et al; IBIS-II Investigators. Use of anastrozole for breast cancer prevention (IBIS-II): long-term results of a randomised controlled trial. Lancet. 2020;395;117-122.

ERAS takes its place in IBD surgery
AUSTIN, TEX. – Enhanced recovery after surgery (ERAS) protocols have been around for decades, but typically excluded patients having surgery for inflammatory bowel disease (IBD). However, recent studies have shown strategies to optimize these patients, including presurgery carbohydrate loading and early postsurgery feeding, can improve outcomes, according to a review of evidence presented at the annual congress of the Crohn’s & Colitis Foundation and the American Gastroenterological Association.
“It’s really important that we implement strategies to help mitigate the impact that malnutrition is going to have on our perioperative patients, and one of the ways we do that is by using an ERAS or enhanced recovery after surgery protocol,” said Kelly Issokson, MS, RD, of Cedars-Sinai Medical Center, Los Angeles. She noted that patients with IBD are five times more likely to be malnourished than non-IBD patients, and those with fistulizing Crohn’s disease and bowel resections are at greatest risk (Inflamm Bowel Dis. 2008;14:1139-46).
“I constantly see patients who are kept NPO [nothing by mouth] 12 or 24 hours before surgery, maybe even longer sometimes, unfortunately,” she said. “We should really be minimizing that NPO to help mitigate the catabolic effect that surgery has on our patients and help them recover more quickly.”
To screen surgery patients for nutrition risk, Ms. Issokson said that gastroenterologists can ask two questions from the malnutrition screening tool: Did the patient have recent unintentional weight loss, and is the patient eating less because of poor appetite? A yes to either question merits referral to a registered dietician. Malnutrition, weight loss of 5%-10% of total body weight, and sarcopenia are predictors of surgical complications for IBD patients, the latter an independent predictor in patients aged 40 years and older.
The ERAS protocol involves optimizing preoperative and postoperative nutrition, she said. It has been linked with improved outcomes in elective colorectal surgery (World J Surg. 2014;38:1531-41), although the evidence in IBD isn’t as robust. She cited a retrospective study reported at the 2019 annual Digestive Disease Week of patients with Crohn’s disease that found no difference in readmissions, complications, or reoperations between ERAS and standard-care patients.
Preoperative nutrition optimization in ERAS involves anemia and fluid management, oral nutrition supplementation, and – based on European Society for Clinical Nutrition and Metabolism (ESPEN) 2017 guidelines – delaying the operation where possible if the patient is malnourished. “Patients who receive preoperative nutrition support have been shown to have better outcomes postoperatively,” Ms. Issokson said, citing a meta-analysis of 1,111 Crohn’s disease patients that reported the complication rate was 20% in patients on nutrition support versus 60% for those on standard care; in those on enteral nutrition, the disparity was more pronounced: 21% versus 73% (Eur J Gastro Hep. 2018;30:997-1002).
Gastroenterologists should not be afraid of implementing total parenteral nutrition (TPN) perioperatively in these patients, Ms. Issokson said. “This can really help to improve outcomes and quality of life in our patients, and it’s something that we really should not shy away from,” she added in an interview. “If our patients are malnourished and meet the criteria for TPN, then we should really not be withholding it.” Patients with severe IBD who are not absorbing from their gut and can’t meet 60% of their needs by mouth are prime candidates for TPN, she said, referencing a 2019 study that reported that preoperative TPN in malnourished IBD patients resulted in a rate of overall noninfectious complications half that of no-TPN patients: 8.3% versus 16.8% (Gastroenterol Rep. 2019 Apr;7:107-14).
Carbohydrate loading before surgery is a big part of ERAS in these patients. “Surgery has a huge impact on the catabolic state of a patient,” Ms. Issokson said. “It’s similar to running a marathon; you wouldn’t go out and run a marathon without fueling up the night before with a whole bunch of carbohydrates. So we use this same strategy in our surgical patients.”
ERAS society guidelines call for 100 g of carbohydrates the night before and 50 g 2 hours before surgery in the form of a clear liquid beverage, along with permitting a light meal up to 6 hours before, with exceptions in gastroparesis, motility disorders, and emergency surgery.
Another key component of ERAS in IBD is early postoperative feeding. “Postoperatively we want to feed our patients as soon as possible,” Ms. Issokson said. ESPEN guidelines call for feeding patients with new nondiverted colorectal anastomosis within 4 hours. “Studies show that patients aren’t able to eat enough calories to help them recover postoperatively, so implementing an oral nutrition supplement might be helpful there,” she added.
Ms. Issokson is a Crohn’s & Colitis Foundation board member, and disclosed financial relationships with Orgain, RMEI, and Medscape.
SOURCE: Issokson K et al. Crohn’s & Colitis Congress 2020, Session Sp83.
REPORTING FROM THE CROHN’S & COLITIS CONGRESS
Report chastises government for allowing flavored e-cigarettes
according to a report on federal and state policies.

In its annual “State of Tobacco Control” report, the American Lung Association called out the federal government for issuing “inadequate guidance on flavored e-cigarettes that leaves thousands of flavored e-cigarettes on the market.” The organization urged Congress and the Food and Drug Administration “to eliminate all flavored tobacco products from the marketplace, including menthol cigarettes, flavored cigars, and e-cigarettes,” in 2020.
“Flavored tobacco products cause kids to become hooked, and now more than one in four teens (27.5%) are vaping, a staggering 135% increase over the past 2 years,” the association wrote in a news release. Federal guidance on Jan. 2, 2020, permits the sale of flavored e-cigarettes that do not use cartridges. This guidance represented a reversal after officials said in a prior announcement that regulators would “clear the market” of flavored e-cigarettes.
Graphic warning labels
The report also asked the FDA to reject product marketing applications that fail to meet public health standards, calls on the U.S. Department of Health & Human Services to “clarify and ensure that all tobacco users have access to a comprehensive tobacco cessation benefit,” and urges Congress to increase federal funding for the Centers for Disease Control and Prevention’s Office on Smoking and Health to help stop youth e-cigarette use.
“Raising the federal minimum age of sale to 21, which took effect immediately on Dec. 30, was an important first step forward,” the report says. “The American Lung Association successfully advocated for the legislation to be comprehensive and to close state exemptions, such as for military personnel, while also not limiting states from pursuing stronger protections. Additional rules from FDA to provide guidance on the law’s implementation are forthcoming.”
The FDA is expected to release graphic warning labels for cigarette packs in March. After legal setbacks to the Tobacco Control Act of 2009, which required the FDA to ensure all cigarette packs had graphic warning labels by 2011, a judgment “compels FDA to release final graphic warnings by March 15, 2020, with the warning labels appearing on all cigarette packs by June of 2021,” the American Lung Association report said.
“While the American Lung Association recognizes the federal government with an A grade for passage of a strong federal Tobacco 21 law [raising the minimum age of purchase], it also earns an F for its failure to comprehensively oversee tobacco products,” said Harold P. Wimmer, national president and CEO of the American Lung Association, in the news release. “Without meaningful actions by the federal government, the health and the future of our nation’s children are being compromised.”
The federal government received an F for its tobacco tax policies, a D for cessation coverage, and an A for its mass media campaigns, “Tips from Former Smokers” and “The Real Cost.”
Grading states
In addition, the report graded each state and the District of Columbia in terms of funding for tobacco prevention programs, strength of smoke-free workplace laws, level of state tobacco taxes, and coverage of and access to services to quit tobacco. None scored all A’s, but California, the District of Columbia, Maine, New York, and Vermont ranked the highest. Alabama, Mississippi, and North Carolina, on the other hand, received all F’s.
In November, Massachusetts became the first state to prohibit the sale of flavored tobacco products, including menthol cigarettes, and more states should follow suit, according to the association.
according to a report on federal and state policies.
In its annual “State of Tobacco Control” report, the American Lung Association called out the federal government for issuing “inadequate guidance on flavored e-cigarettes that leaves thousands of flavored e-cigarettes on the market.” The organization urged Congress and the Food and Drug Administration “to eliminate all flavored tobacco products from the marketplace, including menthol cigarettes, flavored cigars, and e-cigarettes,” in 2020.
“Flavored tobacco products cause kids to become hooked, and now more than one in four teens (27.5%) are vaping, a staggering 135% increase over the past 2 years,” the association wrote in a news release. Federal guidance on Jan. 2, 2020, permits the sale of flavored e-cigarettes that do not use cartridges. This guidance represented a reversal after officials said in a prior announcement that regulators would “clear the market” of flavored e-cigarettes.
Graphic warning labels
The report also asked the FDA to reject product marketing applications that fail to meet public health standards, calls on the U.S. Department of Health & Human Services to “clarify and ensure that all tobacco users have access to a comprehensive tobacco cessation benefit,” and urges Congress to increase federal funding for the Centers for Disease Control and Prevention’s Office on Smoking and Health to help stop youth e-cigarette use.
“Raising the federal minimum age of sale to 21, which took effect immediately on Dec. 30, was an important first step forward,” the report says. “The American Lung Association successfully advocated for the legislation to be comprehensive and to close state exemptions, such as for military personnel, while also not limiting states from pursuing stronger protections. Additional rules from FDA to provide guidance on the law’s implementation are forthcoming.”
The FDA is expected to release graphic warning labels for cigarette packs in March. After legal setbacks to the Tobacco Control Act of 2009, which required the FDA to ensure all cigarette packs had graphic warning labels by 2011, a judgment “compels FDA to release final graphic warnings by March 15, 2020, with the warning labels appearing on all cigarette packs by June of 2021,” the American Lung Association report said.
“While the American Lung Association recognizes the federal government with an A grade for passage of a strong federal Tobacco 21 law [raising the minimum age of purchase], it also earns an F for its failure to comprehensively oversee tobacco products,” said Harold P. Wimmer, national president and CEO of the American Lung Association, in the news release. “Without meaningful actions by the federal government, the health and the future of our nation’s children are being compromised.”
The federal government received an F for its tobacco tax policies, a D for cessation coverage, and an A for its mass media campaigns, “Tips from Former Smokers” and “The Real Cost.”
Grading states
In addition, the report graded each state and the District of Columbia in terms of funding for tobacco prevention programs, strength of smoke-free workplace laws, level of state tobacco taxes, and coverage of and access to services to quit tobacco. None scored all A’s, but California, the District of Columbia, Maine, New York, and Vermont ranked the highest. Alabama, Mississippi, and North Carolina, on the other hand, received all F’s.
In November, Massachusetts became the first state to prohibit the sale of flavored tobacco products, including menthol cigarettes, and more states should follow suit, according to the association.