User login
2020 Update on fertility
Although we are not able to cover all of the important developments in fertility medicine over the past year, there were 3 important articles published in the past 12 months that we highlight here. First, we discuss an American College of Obstetricians and Gynecologists (ACOG) committee opinion on genetic carrier screening that was reaffirmed in 2019. Second, we explore an interesting retrospective analysis of time-lapse videos and clinical outcomes of more than 10,000 embryos from 8 IVF clinics, across 4 countries. The authors assessed whether a deep learning model could predict the probability of pregnancy with fetal heart from time-lapse videos in the hopes that their research can improve prioritization of the most viable embryo for single embryo transfer. Last, we consider a review of the data on obstetric and reproductive health effects of preconception and prenatal exposure to several environmental toxicants, including heavy metals, endocrine-disrupting chemicals, pesticides, and air pollution.
Preconception genetic carrier screening: Standardize your counseling approach
American College of Obstetricians and Gynecologists Committee on Genetics. Committee Opinion No. 690: carrier screening in the age of genomic medicine. Obstet Gynecol. 2017;129:e35-e40.
With the rapid development of advanced and high throughput platforms for DNA sequencing in the past several years, the cost of genetic testing has decreased dramatically. Women's health care providers in general, and fertility specialists in particular, are uniquely positioned to take advantage of these novel and yet affordable technologies by counseling prospective parents during the preconception counseling, or early prenatal period, about the availability of genetic carrier screening and its potential to provide actionable information in a timely manner. The ultimate objective of genetic carrier screening is to enable individuals to make an informed decision regarding their reproductive choices based on their personal values. In a study by Larsen and colleagues, the uptake of genetic carrier screening was significantly higher when offered in the preconception period (68.7%), compared with during pregnancy (35.1%), which highlights the significance of early counseling.1
Based on the Centers for Disease Control and Prevention's Birth/Infant Death Data set, birth defects affect 1 in every 33 (about 3%) of all babies born in the United States each year and account for 20% of infant mortality.2 About 20% of birth defects are caused by single-gene (monogenic) disorders, and although some of these are due to dominant conditions or de novo mutations, a significant proportion are due to autosomal recessive, or X-chromosome linked conditions that are commonly assessed by genetic carrier screening.
ACOG published a committee opinion on "Carrier Screening in the Age of Genomic Medicine" in March 2017, which was reaffirmed in 2019.3
Residual risk. Several points discussed in this document are of paramount importance, including the need for pretest and posttest counseling and consent, as well as a discussion of "residual risk." Newer platforms employ sequencing techniques that potentially can detect most, if not all, of the disease-causing variants in the tested genes, such as the gene for cystic fibrosis and, therefore, have a higher detection rate compared with the older PCR-based techniques for a limited number of specific mutations included in the panel. Due to a variety of technical and biological limitations, however, such as allelic dropouts and the occurrence of de novo mutations, the detection rate is not 100%; there is always a residual risk that needs to be estimated and provided to individuals based on the existing knowledge on frequency of gene, penetrance of phenotype, and prevalence of condition in the general and specific ethnic populations.
Continue to: Expanded vs panethnic screening...
Expanded vs panethnic screening. Furthermore, although sequencing technology has made "expanded carrier screening" for several hundred conditions, simultaneous to and independent of ethnicity and family history, more easily available and affordable, ethnic-specific and panethnic screening for a more limited number of conditions are still acceptable approaches. Having said this, when the first partner screened is identified to be a carrier, his/her reproductive partners must be offered next-generation sequencing to identify less common disease-causing variants.4
A cautionary point to consider when expanded carrier screening panels are requested is the significant variability among commercial laboratories with regard to the conditions included in their panels. In addition, consider the absence of a well-defined or predictable phenotype for some of the included conditions.
Perhaps the most important matter when it comes to genetic carrier screening is to have a standard counseling approach that is persistently followed and offers the opportunity for individuals to know about their genetic testing options and available reproductive choices, including the use of donor gametes, preimplantation genetic testing for monogenic disease (PGT-M, formerly known as preimplantation genetic diagnosis, or PGD), prenatal testing, and pregnancy management options. For couples and/or individuals who decide to proceed with an affected pregnancy, earlier diagnosis can assist with postnatal management.
Medicolegal responsibility. Genetic carrier screening also is of specific relevance to the field of fertility medicine and assisted reproductive technology (ART) as a potential liability issue. Couples and individuals who are undergoing fertility treatment with in vitro fertilization (IVF) for a variety of medical or personal reasons are a specific group that certainly should be offered genetic carrier screening, as they have the option of "adding on" PGT-M (PGD) to their existing treatment plan at a fraction of the cost and treatment burden that would have otherwise been needed if they were not undergoing IVF. After counseling, some individuals and couples may ultimately opt out of genetic carrier screening. The counseling discussion needs to be clearly documented in the medical chart.
The preconception period is the perfect time to have a discussion about genetic carrier screening; it offers the opportunity for timely interventions if desired by the couples or individuals.
Continue to: Artificial intelligence and embryo selection...
Artificial intelligence and embryo selection

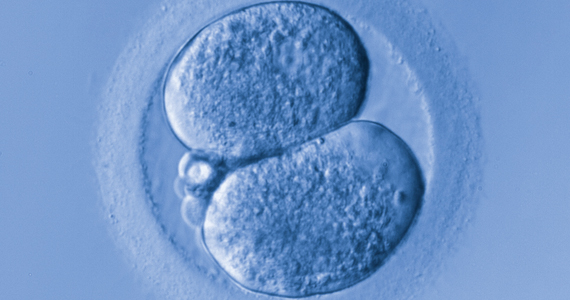
With continued improvements in embryo culture conditions and cryopreservation technology, there has been a tremendous amount of interest in developing better methods for embryo selection. These efforts are aimed at encouraging elective single embryo transfer (eSET) for women of all ages, thereby lowering the risk of multiple pregnancy and its associated adverse neonatal and obstetric outcomes—without compromising the pregnancy rates per transfer or lengthening the time to pregnancy.
One of the most extensively studied methods for this purpose is preimplantation genetic testing for aneuploidy (PGT-A, formerly known as PGS), but emerging data from large multicenter randomized clinical trials (RCTs) have again cast significant doubt on PGT-A's efficacy and utility.5 Meanwhile, alternative methods for embryo selection are currently under investigation, including noninvasive PGT-A and morphokinetic assessment of embryo development via analysis of images obtained by time-lapse imaging.
The potential of time-lapse imaging
Despite the initial promising results from time-lapse imaging, subsequent RCTs have not shown a significant clinical benefit.6 However, these early methods of morphokinetic assessment are mainly dependent on the embryologists' subjective assessment of individual static frames and "annotation" of observed spatial and temporal features of embryo development. In addition to being a very time-consuming task, this process is subject to significant interobserver and intraobserver variability.
Considering these limitations, even machine-based algorithms that incorporate these annotations along with such other clinical variables as parental age and prior obstetric history, have a low predictive power for the outcome of embryo transfer, with an area under the curve (AUC) of the ROC curve of 0.65 to 0.74. (An AUC of 0.5 represents completely random prediction and an AUC of 1.0 suggests perfect prediction.)7
A recent study by Tran and colleagues has employed a deep learning (neural network) model to analyze the entire raw time-lapse videos in an automated manner without prior annotation by embryologists. After analysis of 10,638 embryos from 8 different IVF clinics in 4 different countries, they have reported an AUC of 0.93 (95% confidence interval, 0.92-0.94) for prediction of fetal heart rate activity detected at 7 weeks of gestation or beyond. Although these data are very preliminary and have not yet been validated prospectively in larger datasets for live birth, it may herald the beginning of a new era for the automation and standardization of embryo assessment with artificial intelligence—similar to the rapidly increasing role of facial recognition technology for various applications.
Improved standardization of noninvasive embryo selection with growing use of artificial intelligence is a promising new tool to improve the safety and efficacy of ART.
Continue to: Environmental toxicants: The hidden danger...
Environmental toxicants: The hidden danger
Segal TR, Giudice LC. Before the beginning: environmental exposures and reproductive and obstetrical outcomes. Fertil Steril. 2019;112:613-621.
We receive news daily about the existential risk to humans of climate change. However, a risk that is likely as serious goes almost unseen by the public and most health care providers. That risk is environmental toxicants.8
More than 80,000 chemicals are registered in the United States, most in the last 75 years. These chemicals are ubiquitous. All of us are continuously exposed to and suffused with these toxicants and their metabolites. Air pollution adds insult to injury. Since this exposure has especially significant implications for fertility, infertility, pregnancy, perinatal health, childhood development, adult diseases, and later generational reproduction, it is imperative that reproductive health professionals take responsibility for helping mitigate this environmental crisis.
The problem is exceptionally complicated
The risks posed by environmental toxicants are much less visible than those for climate change, so the public, policymakers, and providers are largely unaware or may even seem uncaring. Few health professionals have sufficient knowledge to deliver care in this area, know which questions to ask, or have adequate information/medical record tools to assist them in care—and what are the possible interventions?
Addressing risk posed by individual toxicants
Addressing the problem clinically requires asking patients questions about exposure and recommending interventions. Toxicant chemicals include the neurotoxin mercury, which can be addressed by limiting intake of fish, especially certain types.
Lead was used before 1978 in paint, it also was used in gas and in water pipes. People living in older homes may be exposed, as well as those in occupations exposed to lead. Others with lead exposure risk include immigrants from areas without lead regulations and people using pica- or lead-glazed pottery. Lead exposure has been associated with multiple pregnancy complications and permanently impaired intellectual development in children. If lead testing reveals high levels, chelation therapy can help.
Cadmium is a heavy metal used in rechargeable batteries, paint pigment, and plastic production. Exposure results from food intake, smoking, and second-hand smoke. Cadmium accumulates in the liver, kidneys, testes, ovaries, and placenta. Exposure causes itai-itai disease, which is characterized by osteomalacia and renal tubular dysfunction as well as epigenetic changes in placental DNA and damage to the reproductive system. Eating organic food and reducing industrial exposure to cadmium are preventive strategies.
Pesticides are ubiquitous, with 90% of the US population having detectable levels. Exposure during the preconception period can lead to intrauterine growth restriction, low birth weight, subsequent cancers, and other problems. Eating organic food can reduce risk, as can frequent hand washing when exposed to pesticides, using protective gear, and removing shoes in the home.
Endocrine-disrupting chemicals (EDCs) are chemicals that can mimic or block endogenous hormones, which leads to adverse health outcomes. In addition to heavy metals, 3 important EDCs are bisphenol A (BPA), phthalates, and polybrominated diethyl ethers (PBDEs). Exposure is ubiquitous from industrial food processing, personal care products, cosmetics, and dust. Phthalates and BPA have short half-lives of hours to days, while PBDEs can persist in adipose tissue for months. Abnormal urogenital and neurologic development and thyroid disruption can result. Eating organic food, eating at home, and decreasing processed food intake can reduce exposure.
BPA is used in plastics, canned food liners, cash register receipts, and epoxy resins. Exposure is through inhalation, ingestion, and dermal absorption and affects semen quality, fertilization, placentation, and early reproduction. Limiting the use of plastic containers, not microwaving food in plastic, and avoiding thermal paper cash register receipts can reduce exposure.
Phthalates are synthetically derived and used as plasticizers in personal and medical products. The major source of phthalate exposure is food; exposure causes sperm, egg, and DNA damage. Phthalate avoidance involves replacing plastic bottles with glass or stainless steel, avoiding reheating food in plastic containers, and choosing "fragrance free" products.
PBDEs are used in flame retardants on upholstery, textiles, carpeting, and some electronics. Most PBDEs have been replaced by alternatives; however, their half-life is up to 12 years. Complications caused by PBDEs include thyroid disruption, resulting in abnormal fetal brain development. Avoiding dust and furniture that contain PBDEs, as well as hand washing, reduces exposure risk.
Air pollutants are associated with adverse obstetric outcomes and lower cognitive function in children. Avoiding areas with heavy traffic, staying indoors when air is heavily polluted, and using a HEPA filter in the home can reduce chemicals from air pollution.
Recommendations
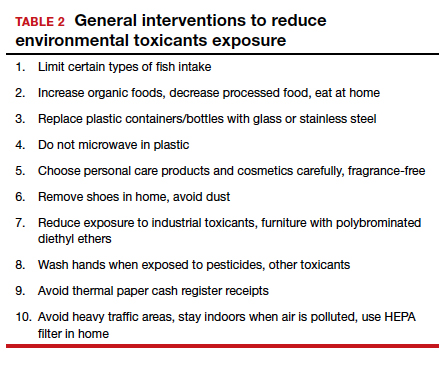
The magnitude of the problem that environmental toxicant exposure creates requires health care providers to take action. The table in the publication by Segal and Giudice can be used as a tool that patients can answer first themselves before review by their provider.2 It can be added to your electronic health record and/or patient portal. Even making general comments to raise awareness, asking questions regarding exposure, and making recommendations can be helpful (TABLES 1 and 2). When possible, we also should advocate for public awareness and policy changes that address this significant health issue.

Environmental toxicants are a significant health problem that can be effectively mitigated through patient questions and recommended interventions.
- Larsen D, Ma J, Strassberg M, et al. The uptake of pan-ethnic expanded carrier screening is higher when offered during preconception or early prenatal genetic counseling. Prenat Diagn. 2019;39:319-323.
- Matthews TJ, MacDorman MF, Thoma ME. Infant Mortality Statistics From the 2013 Period Linked Birth/Infant Death Data Set. Natl Vital Stat Rep. 2015;64:1-30.
- American College of Obstetricians and Gynecologists Committee on Genetics. Committee Opinion No. 690: carrier screening in the age of genomic medicine. Obstet Gynecol. 2017;129:e35-e40.
- Gregg AR, Edwards JG. Prenatal genetic carrier screening in the genomic age. Semin Perinatol. 2018;42:303-306.
- Munné S, Kaplan B, Frattarelli JL, et al; STAR Study Group. Preimplantation genetic testing for aneuploidy versus morphology as selection criteria for single frozen-thawed embryo transfer in good-prognosis patients: a multicenter randomized clinical trial. Fertil Steril. 2019;112:1071-1079. e7.
- Goodman LR, Goldberg J, Falcone T, et al. Does the addition of time-lapse morphokinetics in the selection of embryos for transfer improve pregnancy rates? A randomized controlled trial. Fertil Steril. 2016;105:275-285.e10.
- Blank C, Wildeboer RR, DeCroo I, et al. Prediction of implantation after blastocyst transfer in in vitro fertilization: a machine-learning perspective. Fertil Steril. 2019;111:318- 326.
- The American College of Obstetricians and Gynecologists Committee on Health Care for Underserved Women; American Society for Reproductive Medicine Practice Committee; The University of California, San Francisco Program on Reproductive Health and the Environment. ACOG Committee Opinion No. 575. Exposure to environmental toxic agents. Fertil Steril. 2013;100:931-934.

G. David Adamson, MD
Dr. Adamson is Founder and CEO of Advanced Reproductive Care, Inc (ARC Fertility); Clinical Professor, ACF, at Stanford University School of Medicine; and Associate Clinical Professor at the University of California, San Francisco. He is also Director of Equal3 Fertility, APC in Cupertino, California.

M. Max Ezzati, MD
Dr. Ezzati is a Board-certified reproductive endocrinology and infertility (REI) specialist and the Medical Director of Department of Reproductive Endocrinology and Infertility at Palo Alto Medical Foundation Fertility Physicians of Northern California.
The authors report no financial relationships relevant to this article.
G. David Adamson, MD
Dr. Adamson is Founder and CEO of Advanced Reproductive Care, Inc (ARC Fertility); Clinical Professor, ACF, at Stanford University School of Medicine; and Associate Clinical Professor at the University of California, San Francisco. He is also Director of Equal3 Fertility, APC in Cupertino, California.
M. Max Ezzati, MD
Dr. Ezzati is a Board-certified reproductive endocrinology and infertility (REI) specialist and the Medical Director of Department of Reproductive Endocrinology and Infertility at Palo Alto Medical Foundation Fertility Physicians of Northern California.
The authors report no financial relationships relevant to this article.
Although we are not able to cover all of the important developments in fertility medicine over the past year, there were 3 important articles published in the past 12 months that we highlight here. First, we discuss an American College of Obstetricians and Gynecologists (ACOG) committee opinion on genetic carrier screening that was reaffirmed in 2019. Second, we explore an interesting retrospective analysis of time-lapse videos and clinical outcomes of more than 10,000 embryos from 8 IVF clinics, across 4 countries. The authors assessed whether a deep learning model could predict the probability of pregnancy with fetal heart from time-lapse videos in the hopes that their research can improve prioritization of the most viable embryo for single embryo transfer. Last, we consider a review of the data on obstetric and reproductive health effects of preconception and prenatal exposure to several environmental toxicants, including heavy metals, endocrine-disrupting chemicals, pesticides, and air pollution.
Preconception genetic carrier screening: Standardize your counseling approach
American College of Obstetricians and Gynecologists Committee on Genetics. Committee Opinion No. 690: carrier screening in the age of genomic medicine. Obstet Gynecol. 2017;129:e35-e40.
With the rapid development of advanced and high throughput platforms for DNA sequencing in the past several years, the cost of genetic testing has decreased dramatically. Women's health care providers in general, and fertility specialists in particular, are uniquely positioned to take advantage of these novel and yet affordable technologies by counseling prospective parents during the preconception counseling, or early prenatal period, about the availability of genetic carrier screening and its potential to provide actionable information in a timely manner. The ultimate objective of genetic carrier screening is to enable individuals to make an informed decision regarding their reproductive choices based on their personal values. In a study by Larsen and colleagues, the uptake of genetic carrier screening was significantly higher when offered in the preconception period (68.7%), compared with during pregnancy (35.1%), which highlights the significance of early counseling.1
Based on the Centers for Disease Control and Prevention's Birth/Infant Death Data set, birth defects affect 1 in every 33 (about 3%) of all babies born in the United States each year and account for 20% of infant mortality.2 About 20% of birth defects are caused by single-gene (monogenic) disorders, and although some of these are due to dominant conditions or de novo mutations, a significant proportion are due to autosomal recessive, or X-chromosome linked conditions that are commonly assessed by genetic carrier screening.
ACOG published a committee opinion on "Carrier Screening in the Age of Genomic Medicine" in March 2017, which was reaffirmed in 2019.3
Residual risk. Several points discussed in this document are of paramount importance, including the need for pretest and posttest counseling and consent, as well as a discussion of "residual risk." Newer platforms employ sequencing techniques that potentially can detect most, if not all, of the disease-causing variants in the tested genes, such as the gene for cystic fibrosis and, therefore, have a higher detection rate compared with the older PCR-based techniques for a limited number of specific mutations included in the panel. Due to a variety of technical and biological limitations, however, such as allelic dropouts and the occurrence of de novo mutations, the detection rate is not 100%; there is always a residual risk that needs to be estimated and provided to individuals based on the existing knowledge on frequency of gene, penetrance of phenotype, and prevalence of condition in the general and specific ethnic populations.
Continue to: Expanded vs panethnic screening...
Expanded vs panethnic screening. Furthermore, although sequencing technology has made "expanded carrier screening" for several hundred conditions, simultaneous to and independent of ethnicity and family history, more easily available and affordable, ethnic-specific and panethnic screening for a more limited number of conditions are still acceptable approaches. Having said this, when the first partner screened is identified to be a carrier, his/her reproductive partners must be offered next-generation sequencing to identify less common disease-causing variants.4
A cautionary point to consider when expanded carrier screening panels are requested is the significant variability among commercial laboratories with regard to the conditions included in their panels. In addition, consider the absence of a well-defined or predictable phenotype for some of the included conditions.
Perhaps the most important matter when it comes to genetic carrier screening is to have a standard counseling approach that is persistently followed and offers the opportunity for individuals to know about their genetic testing options and available reproductive choices, including the use of donor gametes, preimplantation genetic testing for monogenic disease (PGT-M, formerly known as preimplantation genetic diagnosis, or PGD), prenatal testing, and pregnancy management options. For couples and/or individuals who decide to proceed with an affected pregnancy, earlier diagnosis can assist with postnatal management.
Medicolegal responsibility. Genetic carrier screening also is of specific relevance to the field of fertility medicine and assisted reproductive technology (ART) as a potential liability issue. Couples and individuals who are undergoing fertility treatment with in vitro fertilization (IVF) for a variety of medical or personal reasons are a specific group that certainly should be offered genetic carrier screening, as they have the option of "adding on" PGT-M (PGD) to their existing treatment plan at a fraction of the cost and treatment burden that would have otherwise been needed if they were not undergoing IVF. After counseling, some individuals and couples may ultimately opt out of genetic carrier screening. The counseling discussion needs to be clearly documented in the medical chart.
The preconception period is the perfect time to have a discussion about genetic carrier screening; it offers the opportunity for timely interventions if desired by the couples or individuals.
Continue to: Artificial intelligence and embryo selection...
Artificial intelligence and embryo selection
With continued improvements in embryo culture conditions and cryopreservation technology, there has been a tremendous amount of interest in developing better methods for embryo selection. These efforts are aimed at encouraging elective single embryo transfer (eSET) for women of all ages, thereby lowering the risk of multiple pregnancy and its associated adverse neonatal and obstetric outcomes—without compromising the pregnancy rates per transfer or lengthening the time to pregnancy.
One of the most extensively studied methods for this purpose is preimplantation genetic testing for aneuploidy (PGT-A, formerly known as PGS), but emerging data from large multicenter randomized clinical trials (RCTs) have again cast significant doubt on PGT-A's efficacy and utility.5 Meanwhile, alternative methods for embryo selection are currently under investigation, including noninvasive PGT-A and morphokinetic assessment of embryo development via analysis of images obtained by time-lapse imaging.
The potential of time-lapse imaging
Despite the initial promising results from time-lapse imaging, subsequent RCTs have not shown a significant clinical benefit.6 However, these early methods of morphokinetic assessment are mainly dependent on the embryologists' subjective assessment of individual static frames and "annotation" of observed spatial and temporal features of embryo development. In addition to being a very time-consuming task, this process is subject to significant interobserver and intraobserver variability.
Considering these limitations, even machine-based algorithms that incorporate these annotations along with such other clinical variables as parental age and prior obstetric history, have a low predictive power for the outcome of embryo transfer, with an area under the curve (AUC) of the ROC curve of 0.65 to 0.74. (An AUC of 0.5 represents completely random prediction and an AUC of 1.0 suggests perfect prediction.)7
A recent study by Tran and colleagues has employed a deep learning (neural network) model to analyze the entire raw time-lapse videos in an automated manner without prior annotation by embryologists. After analysis of 10,638 embryos from 8 different IVF clinics in 4 different countries, they have reported an AUC of 0.93 (95% confidence interval, 0.92-0.94) for prediction of fetal heart rate activity detected at 7 weeks of gestation or beyond. Although these data are very preliminary and have not yet been validated prospectively in larger datasets for live birth, it may herald the beginning of a new era for the automation and standardization of embryo assessment with artificial intelligence—similar to the rapidly increasing role of facial recognition technology for various applications.
Improved standardization of noninvasive embryo selection with growing use of artificial intelligence is a promising new tool to improve the safety and efficacy of ART.
Continue to: Environmental toxicants: The hidden danger...
Environmental toxicants: The hidden danger
Segal TR, Giudice LC. Before the beginning: environmental exposures and reproductive and obstetrical outcomes. Fertil Steril. 2019;112:613-621.
We receive news daily about the existential risk to humans of climate change. However, a risk that is likely as serious goes almost unseen by the public and most health care providers. That risk is environmental toxicants.8
More than 80,000 chemicals are registered in the United States, most in the last 75 years. These chemicals are ubiquitous. All of us are continuously exposed to and suffused with these toxicants and their metabolites. Air pollution adds insult to injury. Since this exposure has especially significant implications for fertility, infertility, pregnancy, perinatal health, childhood development, adult diseases, and later generational reproduction, it is imperative that reproductive health professionals take responsibility for helping mitigate this environmental crisis.
The problem is exceptionally complicated
The risks posed by environmental toxicants are much less visible than those for climate change, so the public, policymakers, and providers are largely unaware or may even seem uncaring. Few health professionals have sufficient knowledge to deliver care in this area, know which questions to ask, or have adequate information/medical record tools to assist them in care—and what are the possible interventions?
Addressing risk posed by individual toxicants
Addressing the problem clinically requires asking patients questions about exposure and recommending interventions. Toxicant chemicals include the neurotoxin mercury, which can be addressed by limiting intake of fish, especially certain types.
Lead was used before 1978 in paint, it also was used in gas and in water pipes. People living in older homes may be exposed, as well as those in occupations exposed to lead. Others with lead exposure risk include immigrants from areas without lead regulations and people using pica- or lead-glazed pottery. Lead exposure has been associated with multiple pregnancy complications and permanently impaired intellectual development in children. If lead testing reveals high levels, chelation therapy can help.
Cadmium is a heavy metal used in rechargeable batteries, paint pigment, and plastic production. Exposure results from food intake, smoking, and second-hand smoke. Cadmium accumulates in the liver, kidneys, testes, ovaries, and placenta. Exposure causes itai-itai disease, which is characterized by osteomalacia and renal tubular dysfunction as well as epigenetic changes in placental DNA and damage to the reproductive system. Eating organic food and reducing industrial exposure to cadmium are preventive strategies.
Pesticides are ubiquitous, with 90% of the US population having detectable levels. Exposure during the preconception period can lead to intrauterine growth restriction, low birth weight, subsequent cancers, and other problems. Eating organic food can reduce risk, as can frequent hand washing when exposed to pesticides, using protective gear, and removing shoes in the home.
Endocrine-disrupting chemicals (EDCs) are chemicals that can mimic or block endogenous hormones, which leads to adverse health outcomes. In addition to heavy metals, 3 important EDCs are bisphenol A (BPA), phthalates, and polybrominated diethyl ethers (PBDEs). Exposure is ubiquitous from industrial food processing, personal care products, cosmetics, and dust. Phthalates and BPA have short half-lives of hours to days, while PBDEs can persist in adipose tissue for months. Abnormal urogenital and neurologic development and thyroid disruption can result. Eating organic food, eating at home, and decreasing processed food intake can reduce exposure.
BPA is used in plastics, canned food liners, cash register receipts, and epoxy resins. Exposure is through inhalation, ingestion, and dermal absorption and affects semen quality, fertilization, placentation, and early reproduction. Limiting the use of plastic containers, not microwaving food in plastic, and avoiding thermal paper cash register receipts can reduce exposure.
Phthalates are synthetically derived and used as plasticizers in personal and medical products. The major source of phthalate exposure is food; exposure causes sperm, egg, and DNA damage. Phthalate avoidance involves replacing plastic bottles with glass or stainless steel, avoiding reheating food in plastic containers, and choosing "fragrance free" products.
PBDEs are used in flame retardants on upholstery, textiles, carpeting, and some electronics. Most PBDEs have been replaced by alternatives; however, their half-life is up to 12 years. Complications caused by PBDEs include thyroid disruption, resulting in abnormal fetal brain development. Avoiding dust and furniture that contain PBDEs, as well as hand washing, reduces exposure risk.
Air pollutants are associated with adverse obstetric outcomes and lower cognitive function in children. Avoiding areas with heavy traffic, staying indoors when air is heavily polluted, and using a HEPA filter in the home can reduce chemicals from air pollution.
Recommendations
The magnitude of the problem that environmental toxicant exposure creates requires health care providers to take action. The table in the publication by Segal and Giudice can be used as a tool that patients can answer first themselves before review by their provider.2 It can be added to your electronic health record and/or patient portal. Even making general comments to raise awareness, asking questions regarding exposure, and making recommendations can be helpful (TABLES 1 and 2). When possible, we also should advocate for public awareness and policy changes that address this significant health issue.
Environmental toxicants are a significant health problem that can be effectively mitigated through patient questions and recommended interventions.
- Larsen D, Ma J, Strassberg M, et al. The uptake of pan-ethnic expanded carrier screening is higher when offered during preconception or early prenatal genetic counseling. Prenat Diagn. 2019;39:319-323.
- Matthews TJ, MacDorman MF, Thoma ME. Infant Mortality Statistics From the 2013 Period Linked Birth/Infant Death Data Set. Natl Vital Stat Rep. 2015;64:1-30.
- American College of Obstetricians and Gynecologists Committee on Genetics. Committee Opinion No. 690: carrier screening in the age of genomic medicine. Obstet Gynecol. 2017;129:e35-e40.
- Gregg AR, Edwards JG. Prenatal genetic carrier screening in the genomic age. Semin Perinatol. 2018;42:303-306.
- Munné S, Kaplan B, Frattarelli JL, et al; STAR Study Group. Preimplantation genetic testing for aneuploidy versus morphology as selection criteria for single frozen-thawed embryo transfer in good-prognosis patients: a multicenter randomized clinical trial. Fertil Steril. 2019;112:1071-1079. e7.
- Goodman LR, Goldberg J, Falcone T, et al. Does the addition of time-lapse morphokinetics in the selection of embryos for transfer improve pregnancy rates? A randomized controlled trial. Fertil Steril. 2016;105:275-285.e10.
- Blank C, Wildeboer RR, DeCroo I, et al. Prediction of implantation after blastocyst transfer in in vitro fertilization: a machine-learning perspective. Fertil Steril. 2019;111:318- 326.
- The American College of Obstetricians and Gynecologists Committee on Health Care for Underserved Women; American Society for Reproductive Medicine Practice Committee; The University of California, San Francisco Program on Reproductive Health and the Environment. ACOG Committee Opinion No. 575. Exposure to environmental toxic agents. Fertil Steril. 2013;100:931-934.
Breast cancer treatments veer from guidelines
Women with breast cancer may be receiving treatments that are discordant with guideline recommendations for genetic subtypes of disease, based on a retrospective analysis of more than 20,000 patients.
Radiotherapy and chemotherapy practices were particularly out of alignment with guidelines, reported lead author Allison W. Kurian, MD, of Stanford (Calif.) University, and colleagues.
“Integrating genetic testing into breast cancer care has been complex and challenging,” the investigators wrote in JAMA Oncology. “There is wide variability in which clinicians order testing and disclose results, in the clinical significance of results, and in how clinicians interpret results to patients.”
According to the investigators, while germline testing is on the rise, little is known about how these test results are translating to clinical care.
To learn more, the investigators evaluated data from 20,568 women with stage 0-III breast cancer who entered the Surveillance, Epidemiology, and End Results registries of Georgia and California between 2014 and 2016.
Three treatment types were evaluated: surgery (bilateral vs. unilateral mastectomy), radiotherapy after lumpectomy, and chemotherapy. Treatment selection was compared with test results for breast cancer–associated genes, such as BRCA1/2, TP53, PTEN, and others. Associations were then compared with guideline recommendations.
Data analysis suggested that many clinicians were correctly using genetic test results to guide surgical decisions. For example, almost two-thirds (61.7%) of women with a BRCA mutation underwent bilateral mastectomy, compared with one-quarter (24.3%) who were BRCA negative (odds ratio, 5.52). For other pathogenic variants, the rate of bilateral mastectomy was still elevated, albeit to a lesser degree (OR, 2.41).
Generally, these practices align with recommendations, the investigators wrote, noting that research supports bilateral mastectomy with BRCA1/2, TP53, and PTEN variants, while data are lacking for other genetic subtypes.
Radiotherapy and chemotherapy practices were more discordant with guidelines. For example, women with a BRCA mutation were 78% less likely to receive radiotherapy after lumpectomy (OR, 0.22) and 76% more likely to receive chemotherapy for early-stage, hormone-positive disease (OR, 1.76). According to investigators, these findings suggest possible trends in undertreatment and overtreatment, respectively.
“We believe more research is needed to confirm our results and to evaluate long-term outcomes of pathogenic variant carriers to understand treatment decision making and consequences,” the investigators concluded.
The study was funded by the National Institutes of Health and the California Department of Public Health. The investigators reported relationships with Myriad Genetics, Genomic Health, Roche, and other companies.
SOURCE: Kurian AW et al. JAMA Oncol. 2020 Feb 6. doi: 10.1001/jamaoncol.2019.6400.
FROM JAMA ONCOLOGY
Screen pregnant women with suspected 2019-nCoV infection
It is too early yet to explicitly determine the effects of the Novel Coronavirus (2019-nCoV) on pregnant women and their fetuses. This is a critical concern, because members of the coronavirus family, which have been responsible for previous outbreaks of severe acute respiratory syndrome (SARS-CoV) and Middle East respiratory syndrome (MERS-CoV), have demonstrated their ability to cause severe complications during pregnancy, according to researchers.
The SARS virus outbreak and the more recent MERS virus outbreak provide the best available models with which to examine the potential impact of 2019-nCoV on pregnancy, according to a letter published online in the Lancet.
Twelve pregnant women were infected with SARS-CoV during the 2002-2003 pandemic. Three (25%) of these women died during pregnancy. Overall, four of seven women had a miscarriage in the first trimester. In the second or third trimester, two out of five women had fetal growth restriction, and four of the five had preterm birth (one case was spontaneous and three were induced because of the maternal condition), according to corresponding author David Baud, MD, PhD, of the maternal-fetal and obstetrics research unit at Lausanne (Switzerland) University Hospital, and colleagues.
A review of 11 pregnant women infected with the virus showed that 10 women (91%) presented with adverse outcomes. Six (55%) neonates were admitted to the ICU; three (27%) died. Two neonates were delivered prematurely because their mothers developed severe respiratory failure.
Because 2019-nCov has a potential for similar behavior, “we recommend systematic screening of any suspected 2019-nCoV infection during pregnancy. If 2019-nCoV infection during pregnancy is confirmed, extended follow-up should be recommended for mothers and their fetuses,” concluded Dr. Baud and colleagues.
Dr. Baud and associates are known for their previous research on the impacts of the Zika virus on pregnancy. They reported having no competing interests.
SOURCE: Baud D et al. Lancet. 2020 Feb 6. doi: 10.1016/S0140-6736(20)30311-1.
The coronavirus has been spreading rapidly in China, and recently, international cases have been identified, including within the United States. As the article by Locher et al. suggests, mechanical, physiological, and immune adaptations in pregnancy leave pregnant women at risk of severe complications from respiratory illnesses.
Obstetricians need to be prepared to screen, test, and promptly treat pregnant women with any severe respiratory illness to reduce maternal and perinatal morbidity. At this time, the Centers for Disease Control and Prevention advises that any patient with fever and signs of a lower respiratory infection, as well as an epidemiologic risk factor (such as recent travel to China), should be considered at risk for the coronavirus. Samples are collected and sent to the CDC as testing can be done only at the CDC at this time. Please refer to the CDC website for up-to-date guidance for health care professionals.
Unfortunately, there is no specific treatment for coronavirus. Clinical management includes prompt implementation of recommended infection prevention and control measures. Supportive management of complications, including fever reduction and advanced organ support, should be provided as necessary.
While coronavirus is a terrifying potential threat, it’s worth mentioning that, for most pregnant women, a much more likely threat is influenza. Pregnant women with influenza virus infection are at increased risk for progression to pneumonia, ICU admission, preterm delivery, and maternal death. The influenza vaccine can help reduce these risks, and we should continue to encourage vaccination for all pregnant women. Prompt treatment is important! Treatment within 48 hours of the onset of symptoms is ideal, but treatment should not be withheld if the ideal window is missed.
Finally, don’t forget to remind your pregnant patients to avoid close contact with sick family members and friends, wash hands frequently, and call the doctor’s office with any sign of a flu-like illness!
Angela Martin, MD, is an assistant professor of gynecology and obstetrics in the division of maternal-fetal medicine at the University of Kansas Medical Center in Kansas City. She is a member of the Ob.Gyn. News editorial advisory board.
It is too early yet to explicitly determine the effects of the Novel Coronavirus (2019-nCoV) on pregnant women and their fetuses. This is a critical concern, because members of the coronavirus family, which have been responsible for previous outbreaks of severe acute respiratory syndrome (SARS-CoV) and Middle East respiratory syndrome (MERS-CoV), have demonstrated their ability to cause severe complications during pregnancy, according to researchers.
The SARS virus outbreak and the more recent MERS virus outbreak provide the best available models with which to examine the potential impact of 2019-nCoV on pregnancy, according to a letter published online in the Lancet.
Twelve pregnant women were infected with SARS-CoV during the 2002-2003 pandemic. Three (25%) of these women died during pregnancy. Overall, four of seven women had a miscarriage in the first trimester. In the second or third trimester, two out of five women had fetal growth restriction, and four of the five had preterm birth (one case was spontaneous and three were induced because of the maternal condition), according to corresponding author David Baud, MD, PhD, of the maternal-fetal and obstetrics research unit at Lausanne (Switzerland) University Hospital, and colleagues.
A review of 11 pregnant women infected with the virus showed that 10 women (91%) presented with adverse outcomes. Six (55%) neonates were admitted to the ICU; three (27%) died. Two neonates were delivered prematurely because their mothers developed severe respiratory failure.
Because 2019-nCov has a potential for similar behavior, “we recommend systematic screening of any suspected 2019-nCoV infection during pregnancy. If 2019-nCoV infection during pregnancy is confirmed, extended follow-up should be recommended for mothers and their fetuses,” concluded Dr. Baud and colleagues.
Dr. Baud and associates are known for their previous research on the impacts of the Zika virus on pregnancy. They reported having no competing interests.
SOURCE: Baud D et al. Lancet. 2020 Feb 6. doi: 10.1016/S0140-6736(20)30311-1.
FROM THE LANCET
What you absolutely need to know about tail coverage
A 28-year-old pediatrician working in a large group practice in California found a new job in Pennsylvania. The job would allow her to live with her husband, who was a nonphysician.
On her last day of work at the California job, the practice’s office manager asked her, “Do you know about the tail coverage?”
He explained that it is malpractice insurance for any cases filed against her after leaving the job. Without it, he said, she would not be covered for those claims.
The physician (who asked not to be identified) had very little savings and suddenly had to pay a five-figure bill for tail coverage. To provide the extra malpractice coverage, she and her husband had to use savings they’d set aside to buy a house.
Getting tail coverage, known formally as an extended reporting endorsement, often comes as a complete and costly surprise for new doctors, says Dennis Hursh, Esq, a health care attorney based in Middletown, Penn., who deals with physicians’ employment contracts.
“Having to pay for a tail can disrupt lives,” Hursh said. “A tail can cost about one third of a young doctor’s salary. If you don’t feel you can afford to pay that, you may be forced to stay with a job you don’t like.”
Most medical residents don’t think about tail coverage until they apply for their first job, but last year, residents at Hahnemann University Hospital in Philadelphia got a painful early lesson.
In the summer, the hospital went out of business because of financial problems. Hundreds of medical residents and fellows not only were forced to find new programs but also had to prepare to buy tail coverage for their training years at Hahnemann.
“All the guarantees have been yanked out from under us,” said Tom Sibert, MD, a former internal medicine resident at the hospital, who is now finishing his training in California. “Residents don’t have that kind of money.”
Hahnemann trainees have asked the judge in the bankruptcy proceedings to put them ahead of other creditors and to ensure their tail coverage is paid. As of early February, the issue had not been resolved.
Meanwhile, Sibert and many other former trainees were trying to get quotes for purchasing tail coverage. They have been shocked by the amounts they would have to pay.
How tail coverage works
Medical malpractice tail coverage protects from incidents that took place when doctors were at their previous jobs but that later resulted in malpractice claims after they had left that employer.
One type of malpractice insurance, an occurrence policy, does not need tail coverage. Occurrence policies cover any incident that occurred when the policy was in force, no matter when a claim was filed – even if it is filed many years after the claims-filing period of the policy ends.
However, most malpractice policies – as many as 85%, according to one estimate – are claims-made policies. Claims-made policies are more much common because they’re significantly less expensive than occurrence policies.
Under a claims-made policy, coverage for malpractice claims completely stops when the policy ends. It does not cover incidents that occurred when the policy was in force but for which the patients later filed claims, as the occurrence policy does. So a tail is needed to cover these claims.
Physicians in all stages of their career may need tail coverage when they leave a job, change malpractice carriers, or retire.
But young physicians often have greater problems with tail coverage, for several reasons. They tend to be employed, and as such, they cannot choose the coverage they want. As a result, they most likely get claims-made coverage. In addition, the job turnover tends to be higher for these doctors. When leaving a job, the tail comes into play. More than half of new physicians leave their first job within 5 years, and of those, more than half leave after only 1 or 2 years.
Young physicians have no experience with tails and may not even know what they are. “In training, malpractice coverage is not a problem because the program handles it,” Mr. Hursh said. Accreditation standards require that teaching hospitals buy coverage, including a tail when residents leave.
So when young physicians are offered their first job and are handed an employment contract to sign, they may not even look for tail coverage, says Mr. Hursh, who wrote The Final Hurdle, a Physician’s Guide to Negotiating a Fair Employment Agreement. Instead, “young physicians tend to focus on issues like salary, benefits, and signing bonuses,” he said.
Mr. Hursh says the tail is usually the most expensive potential cost in the contract.
There’s no easy way to get out of paying the tail coverage once it is enshrined in the contract. The full tail can cost five or even six figures, depending on the physicians’ specialty, the local malpractice premium, and the physician’s own claims history.
Can you negotiate your tail coverage?
Negotiating tail coverage in the employment contract involves some familiarity with medical malpractice insurance and a close reading of the contract. First, you have to determine that the employer is providing claims-made coverage, which would require a tail if you leave. Then you have to determine whether the employer will pay for the tail coverage.
Often, the contract does not even mention tail coverage. “It could merely state that the practice will be responsible for malpractice coverage while you are working there,” Mr. Hursh said. Although it never specifies the tail, this language indicates that you will be paying for it, he says.
Therefore, it’s wise to have a conversation with your prospective employer about the tail. “Some new doctors never ask the question ‘What happens if I leave? Do I get tail coverage?’ ” said Israel Teitelbaum, an attorney who is chairman of Contemporary Insurance Services, an insurance broker in Silver Spring, Md.
Talking about the tail, however, can be a touchy subject for many young doctors applying for their first job. The tail matters only if you leave the job, and you may not want to imply that you would ever want to leave. Too much money, however, is on the line for you not to ask, Mr. Teitelbaum said.
Even if the employer verbally agrees to pay for the tail coverage, experts advise that you try to get the employer’s commitment in writing and have it put it into the contract.
Getting the employer to cover the tail in the initial contract is crucial because once you have agreed to work there, “it’s much more difficult to get it changed,” Mr. Teitelbaum said. However, even if tail coverage is not in the first contract, you shouldn’t give up, he says. You should try again in the next contract a few years later.
“It’s never too late to bring it up,” Mr. Teitelbaum said. After a few years of employment, you have a track record at the job. “A doctor who is very desirable to the employer may be able to get tail coverage on contract renewal.”
Coverage: Large employers vs. small employers
Willingness to pay for an employee’s tail coverage varies depending on the size of the employer. Large employers – systems, hospitals, and large practices – are much more likely to cover the tail than small and medium-sized practices.
Large employers tend to pay for at least part of the tail because they realize that it is in their interest to do so. Since they have the deepest pockets, they’re often the first to be named in a lawsuit. They might have to pay the whole claim if the physician did not have tail coverage.
However, many large employers want to use tail coverage as a bargaining chip to make sure doctors stay for a while at least. One typical arrangement, Mr. Hursh says, is to pay only one-fifth of the tail if the physician leaves in the first year of employment and then to pay one fifth more in each succeeding year until year five, when the employer assumes the entire cost of the tail.
Smaller practices, on the other hand, are usually close-fisted about tail coverage. “They tend to view the tail as an unnecessary expense,” Mr. Hursh said. “They don’t want to pay for a doctor who is not generating revenue for them any more.”
Traditionally, when physicians become partners, practices are more generous and agree to pay their tails if they leave, Mr. Hursh says. But he thinks this is changing, too – recent partnership contracts he has reviewed did not provide for tail coverage.
Times you don’t need to pay for tail coverage
Even if you’re responsible for the tail coverage, your insurance arrangement may be such that you don’t have to pay for it, says Michelle Perron, a malpractice insurance broker in North Hampton, N.H.
For example, if the carrier at your new job is the same as the one at your old job, your coverage would continue with no break, and you would not need a tail, she says. Even if you move to another state, your old carrier might also sell policies there, and you would then likely have seamless coverage, Ms. Perron says. This would be handy if you could choose your new carrier.
Even when you change carriers, Ms. Perron says, the new one might agree to pick up the old carrier’s coverage in return for getting your business, assuming you are an independent physician buying your own coverage. The new carrier would issue prior acts coverage, also known as nose coverage.
Older doctors going into retirement also have a potential tail coverage problem, but their tail coverage premium is often waived, Ms. Perron says. The need for a tail has to do with claims arising post retirement, after your coverage has ended. Typically, if you have been with the carrier for at least 5 years and you are age 55 years or older, your carrier will waive the tail coverage premium, she says.
However, if the retired doctor starts practicing again, even part time, the carrier may want to take back the free tail, she says. Some retired doctors get around this by buying a lower-priced tail from another company, but the former carrier may still want its money back, Ms. Perron says.
Can you just go without tail coverage?
What happens if physicians with a tail commitment choose to wing it and not pay for the tail? If a claim was never made against them, they may believe that the expense is unnecessary. The situation, however, is not so simple.
Some states require having tail coverage. Malpractice coverage is required in seven states, and at least some of those states explicitly extend this requirement to tails. They are Colorado, Connecticut, Kansas, Massachusetts, New Jersey, Rhode Island, and Wisconsin. Eleven more states tie malpractice coverage, perhaps including tails, to some benefit for the doctor, such as tort reform. These states include Indiana, Nebraska, New Mexico, New York, and Pennsylvania.
Many hospitals require tail coverage for privileges, and some insurers do as well. In addition, Ms. Perron says a missing tail reduces your prospects when looking for a job. “For the employer, having to pay coverage for a new hire will cost more than starting fresh with someone else,” she said.
Still, it’s important to remember the risk of being sued. “If you don’t buy the tail coverage, you are at risk for a lawsuit for many years to come,” Mr. Teitelbaum said.
Doctors should consider their potential lifetime risk, not just their current risk. Although only 8% of doctors younger than age 40 have been sued for malpractice, that figure climbs to almost half by the time doctors reach age 55.
The risks are higher in some specialties. About 63% of general surgeons and ob.gyns. have been sued.
Many of these claims are without merit, and doctors pay only the legal expenses of defending the case. Some doctors may think they could risk frivolous suits and cover legal expenses out of pocket. An American Medical Association survey showed that 68% of closed claims against doctors were dropped, dismissed, or withdrawn. It said these claims cost an average of more than $30,000 to defend.
However, Mr. Teitelbaum puts the defense costs for so-called frivolous suits much higher than the AMA, at $250,000 or more. “Even if you’re sure you won’t have to pay a claim, you still have to defend yourself against frivolous suits,” he said. “You won’t recover those expenses.”
How to lower your tail coverage cost
Physicians typically have 60 days to buy tail coverage after their regular coverage has ended. Specialized brokers such as Mr. Teitelbaum and Ms. Perron help physicians look for the best tails to buy.
The cost of the tail depends on how long you’ve been at your job when you leave it, Ms. Perron says. If you leave in the first 1 or 2 years of the policy, she says, the tail price will be lower because the coverage period is shorter.
Usually the most expensive tail available is from the carrier that issued the original policy. Why is this? “Carriers rarely sell a tail that undercuts their retail price,” Mr. Teitelbaum said. “They don’t want to compete with themselves, and in fact doing so could pose regulatory problems for them.”
Instead of buying from their own carrier, doctors can purchase stand-alone tails from competitors, which Mr. Teitelbaum says are 10%-30% less expensive than the policy the original carrier issues. However, stand-alone tails are not always easy to find, especially for high-cost specialties such as neurosurgery and ob.gyn., he says.
Some physicians try to bring down the cost of the tail by limiting the duration of the tail. You can buy tails that only cover claims filed 1-5 years after the incident took place, rather than indefinitely. These limits mirror the typical statute of limitations – the time limit to file a claim in each state. This limit is as little as 2 years in some states, though it can be as long as 6 years in others.
However, some states make exceptions to the statute of limitations. The 2- to 6-year clock doesn’t start ticking until the mistake is discovered or, in the case of children, when they reach adulthood. “This means that with a limited tail, you always have risk,” Perron said.
And yet some doctors insist on these time-limited tails. “If a doctor opts for 3 years’ coverage, that’s better than no years,” Mr. Teitelbaum said. “But I would advise them to take at least 5 years because that gives you coverage for the basic statute of limitations in most states. Three-year tails do yield savings, but often they’re not enough to warrant the risk.”
Another way to reduce costs is to lower the coverage limits of the tail. The standard coverage limit is $1 million per case and $3 million per year, so doctors might be able to save money on the premium by buying limits of $200,000/$600,000. But Mr. Teitelbaum says most companies would refuse to sell a policy with a limit lower than that of the expiring policy.
Further ways to reduce the cost of the tail include buying tail coverage that doesn’t give the physician the right to approve a settlement or that doesn’t include legal fees in the coverage limits. But these options, too, raise the physician’s risks. Whichever option you choose, the important thing is to protect yourself against costly lawsuits.
This article first appeared on Medscape.com.

Cancer research foundation awards ‘breakthrough scientists’
The Damon Runyon Cancer Research Foundation has awarded $100,000 each to six “breakthrough scientists.”
The Damon Runyon–Dale F. Frey Award for Breakthrough Scientists provides additional funding to scientists completing a Damon Runyon Fellowship Award who “are most likely to make paradigm-shifting breakthroughs that transform the way we prevent, diagnose, and treat cancer,” according to the foundation announcement.

Lindsay B. Case, PhD, of the University of Texas Southwestern Medical Center, Dallas, received the award for her research investigating the molecular interactions that contribute to integrin signaling and focal adhesion function. This work could reveal new strategies for disrupting integrin signaling in cancer.

Ivana Gasic, DrSc, of Harvard Medical School, Boston, was awarded for her research on tubulin autoregulation and the microtubule integrity response. Her research could provide insight into the workings of microtubule-targeting chemotherapeutic drugs and reveal new pathways to target cancer cells.

Natasha M. O’Brown, PhD, of Harvard Medical School, Boston, was awarded for her research using CRISPR technology and zebrafish to investigate the molecular mechanisms that regulate the blood-brain barrier. This work could reveal new approaches to drug delivery for patients with brain tumors.

Benjamin M. Stinson, PhD, of Harvard Medical School, Boston, was awarded for his work investigating the mechanisms of two main DNA double-strand break repair pathways. This research could shed light on the causes of cancers and have applications for cancer treatment.

Iva A. Tchasovnikarova, PhD, of Massachusetts General Hospital, Boston, was awarded for epigenetics research that may reveal targets for cancer therapy. She developed a method to identify cell-based reporters of any epigenetic process inside the nucleus and aims to use this method to better understand the biology underlying epigenetic mechanisms.

Yi Yin, PhD, of the University of California, Los Angeles, was awarded for work that may help inform the treatment of many cancers. Dr. Yin developed single-cell assays that she will combine with statistical modeling to better understand homologous recombination.
The Damon Runyon Cancer Research Foundation has awarded $100,000 each to six “breakthrough scientists.”
The Damon Runyon–Dale F. Frey Award for Breakthrough Scientists provides additional funding to scientists completing a Damon Runyon Fellowship Award who “are most likely to make paradigm-shifting breakthroughs that transform the way we prevent, diagnose, and treat cancer,” according to the foundation announcement.
Lindsay B. Case, PhD, of the University of Texas Southwestern Medical Center, Dallas, received the award for her research investigating the molecular interactions that contribute to integrin signaling and focal adhesion function. This work could reveal new strategies for disrupting integrin signaling in cancer.
Ivana Gasic, DrSc, of Harvard Medical School, Boston, was awarded for her research on tubulin autoregulation and the microtubule integrity response. Her research could provide insight into the workings of microtubule-targeting chemotherapeutic drugs and reveal new pathways to target cancer cells.
Natasha M. O’Brown, PhD, of Harvard Medical School, Boston, was awarded for her research using CRISPR technology and zebrafish to investigate the molecular mechanisms that regulate the blood-brain barrier. This work could reveal new approaches to drug delivery for patients with brain tumors.
Benjamin M. Stinson, PhD, of Harvard Medical School, Boston, was awarded for his work investigating the mechanisms of two main DNA double-strand break repair pathways. This research could shed light on the causes of cancers and have applications for cancer treatment.
Iva A. Tchasovnikarova, PhD, of Massachusetts General Hospital, Boston, was awarded for epigenetics research that may reveal targets for cancer therapy. She developed a method to identify cell-based reporters of any epigenetic process inside the nucleus and aims to use this method to better understand the biology underlying epigenetic mechanisms.
Yi Yin, PhD, of the University of California, Los Angeles, was awarded for work that may help inform the treatment of many cancers. Dr. Yin developed single-cell assays that she will combine with statistical modeling to better understand homologous recombination.
ObGyn malpractice liability risk: 2020 developments and probabilities
In this second in a series of 3 articles discussing medical malpractice and the ObGyn we look at the reasons for malpractice claims and liability, what happens to malpractice claims, and the direction and future of medical malpractice. The first article dealt with 2 sources of major malpractice damages: the “big verdict” and physicians with multiple malpractice paid claims. Next month we look at the place of apology in medicine, in cases in which error, including negligence, may have caused a patient injury.
CASE 1 Long-term brachial plexus injury
Right upper extremity injury occurs in the neonate at delivery with sequela of long-term brachial plexus injury (which is diagnosed around 6 months of age). Physical therapy and orthopedic assessment are rendered. Despite continued treatment, discrepancy in arm lengths (ie, affected side arm is noticeably shorter than opposite side) remains. The child cannot play basketball with his older brother and is the victim of ridicule, the plaintiff’s attorney emphasizes. He is unable to properly pronate or supinate the affected arm.
The defendant ObGyn maintains that there was “no shoulder dystocia [at delivery] and the shoulder did not get obstructed in the pelvis; shoulder was delivered 15 seconds after delivery of the head.” The nursing staff testifies that if shoulder dystocia had been the problem they would have launched upon a series of procedures to address such, in accord with the delivering obstetrician. The defense expert witness testifies that a brachial plexus injury can happen without shoulder dystocia.
A defense verdict is rendered by the Florida jury.1
CASE 2 Shoulder dystocia
During delivery, the obstetrician notes a shoulder dystocia (“turtle sign”). After initial attempts to release the shoulder were unsuccessful, the physician applies traction several times to the head of the child, and the baby is delivered. There is permanent injury to the right brachial plexus. The defendant ObGyn says that traction was necessary to dislodge the shoulder, and that the injury was the result of the forces of labor (not the traction). The expert witness for the plaintiff testifies that the medical standard of care did not permit traction under these circumstances, and that the traction was the likely cause of the injury.
The Virginia jury awards $2.32 million in damages.2
Note: The above vignettes are drawn from actual cases but are only outlines of those cases and are not complete descriptions of the claims in the cases. Because the information comes from informal sources, not formal court records, the facts may be inaccurate and incomplete. They should be viewed as illustrations only.

The trend in malpractice
It has been clear for many years that medical malpractice claims are not randomly or evenly distributed among physicians. Notably, the variation among specialties has, and continues to be, substantial (FIGURE 1).3 Recent data suggest that, although paid claims per “1,000 physician-years” averages 14 paid claims per 1,000 physician years, it ranges from 4 or 5 in 1,000 (psychiatry and pediatrics) to 53 and 49 claims per 1,000 (neurology and plastic surgery, respectively). Obstetrics and gynecology has the fourth highest rate at 42.5 paid claims per 1,000 physician years.4 (These data are for the years 1992–2014.)
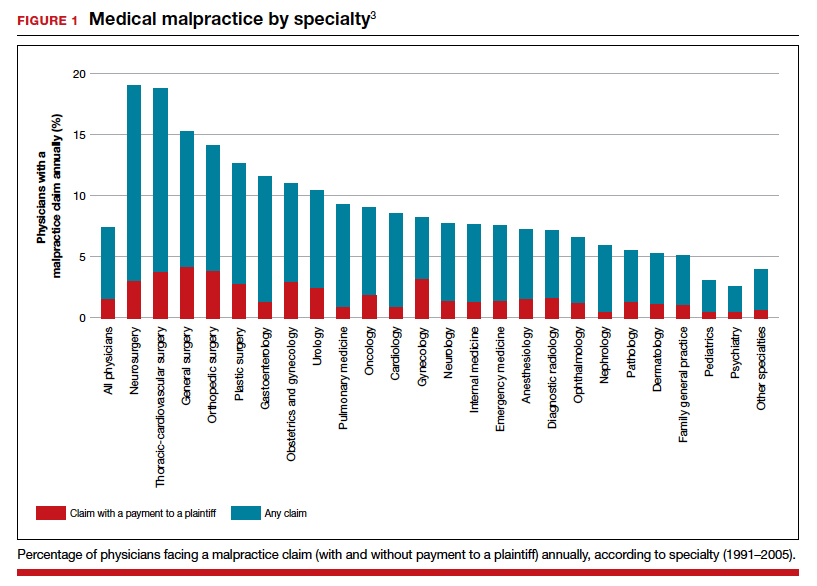
Continue to: The number of ObGyn paid malpractice claims has decreased over time...
The number of ObGyn paid malpractice claims has decreased over time. Although large verdicts and physicians with multiple paid malpractice claims receive a good deal of attention (as we noted in part 1 of our series), in fact, paid medical malpractice claims have trended downward in recent decades.5 When the data above are disaggregated by 5-year periods, for example, in obstetrics and gynecology, there has been a consistent reduction in paid malpractice claims from 1992 to 2014. Paid claims went from 58 per 1,000 physician-years in 1992–1996 to 25 per 1,000 in 2009–2014 (FIGURE 2).4,6 In short, the rate dropped by half over approximately 20 years.4
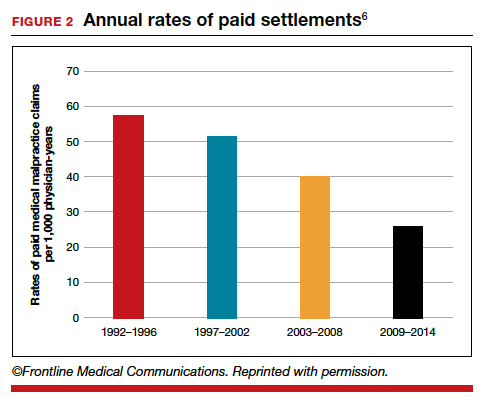
It is reasonable to expect that such a decline in the cost of malpractice insurance premiums would follow. Robert L. Barbieri, MD, who practices in Boston, Massachusetts, in his excellent recent editorial in OBG M
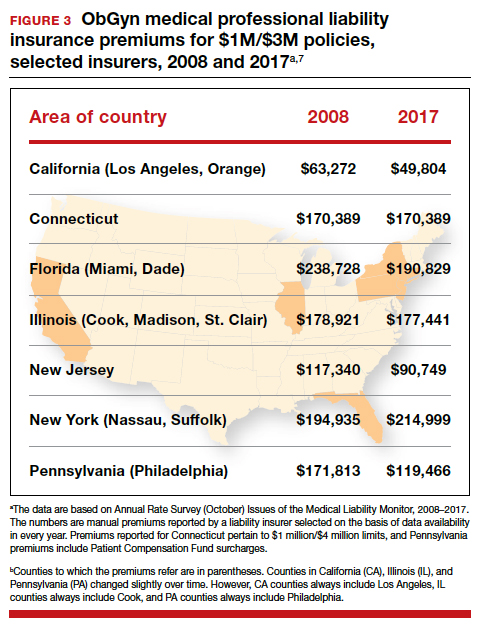
Why have malpractice payouts declined overall?
Have medical errors declined?
It would be wonderful if the reduction in malpractice claims represented a significant decrease in medical errors. Attention to medical errors was driven by the first widely noticed study of medical error deaths. The Institute of Medicine (IOM) study in 2000, put the number of deaths annually at 44,000 to 98,000.8 There have been many efforts to reduce such errors, and it is possible that those efforts have indeed reduced errors somewhat.4 Barbieri provided a helpful digest of many of the error-reduction suggestions for ObGyn practice (TABLE 1).6 But the number of medical errors remains high. More recent studies have suggested that the IOM’s reported number of injuries may have been low.9 In 2013, one study suggested that 210,000 deaths annually were “associated with preventable harm” in hospitals. Because of how the data were gathered the authors estimated that the actual number of preventable deaths was closer to 400,000 annually. Serious harm to patients was estimated at 10 to 20 times the IOM rate.9
Therefore, a dramatic reduction in preventable medical errors does not appear to explain the reduction in malpractice claims. Some portion of it may be explained by malpractice reforms—see "The medical reform factor" section below.
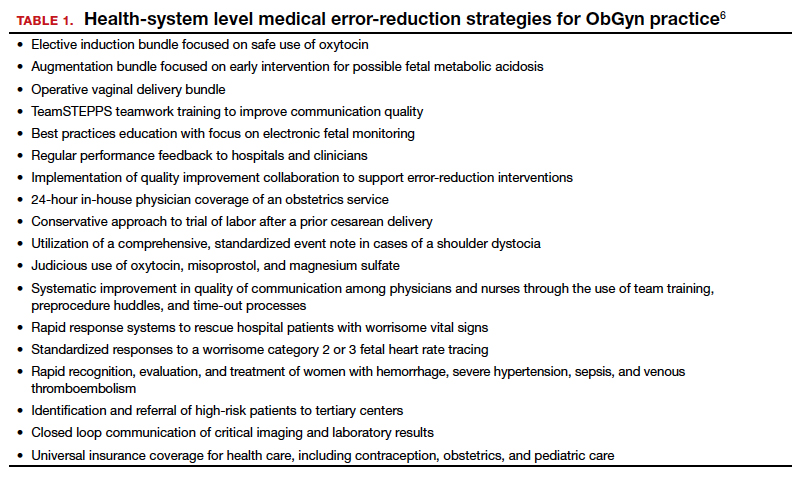
The collective accountability factor
The way malpractice claims are paid (FIGURE 4),10 reported, and handled may explain some of the apparent reduction in overall paid claims. Perhaps the advent of “collective accountability,” in which patient care is rendered by teams and responsibility accepted at a team level, can alleviate a significant amount of individual physician medical malpractice claims.11 This “enterprise liability” may shift the burden of medical error from physicians to health care organizations.12 Collective accountability may, therefore, focus on institutional responsibility rather than individual physician negligence.11,13 Institutions frequently hire multiple specialists and cover their medical malpractice costs as well as stand to be named in suits.
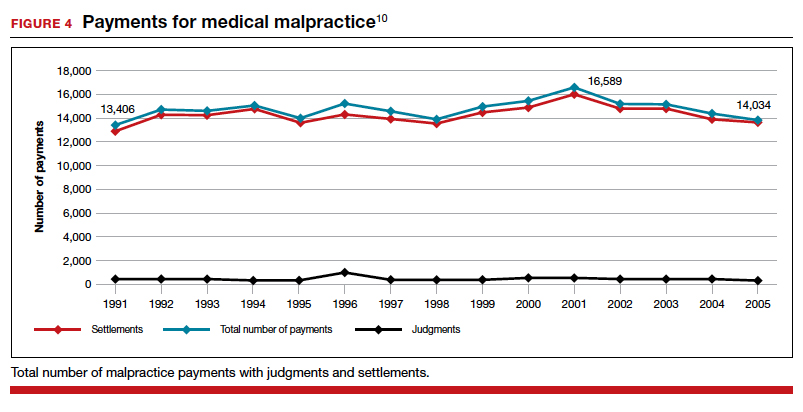
Continue to: The institutional involvement in malpractice cases also may affect...
The institutional involvement in malpractice cases also may affect apparent malpractice rates in another way. The National Practitioner Data Bank, which is the source of information for many malpractice studies, only requires reporting about individual physicians, not institutions.14 If, therefore, claims are settled on behalf of an institution, without implicating the physician, the number of physician malpractice cases may appear to decline without any real change in malpractice rates.14 In addition, institutions have taken the lead in informal resolution of injuries that occur in the institution, and these programs may reduce the direct malpractice claims against physicians. (These “disclosure, apology, and offer,” and similar programs, are discussed in the upcoming third part of this series.)
The medical reform factor
As noted, annual rates paid for medical malpractice in our specialty are trending downward. Many commentators look to malpractice reforms as the reason for the drop in malpractice rates.15-17 Because medical malpractice is essentially a matter of state law, the medical malpractice reform has occurred primarily at the state level.18 There have been many different reforms tried—limits on expert witnesses, review panels, and a variety of procedural limitations.19 Perhaps the most effective reform has been caps being placed on noneconomic damages (generally pain and suffering).20 These caps vary by state (FIGURE 5)21,22 and, of course, affect the “big verdict” cases. (As we saw in the second case scenario above, Virginia is an example of a state with a cap on malpractice awards.) They also have the secondary effect of reducing the number of malpractice cases. They make malpractice cases less attractive to some attorneys because they reduce the opportunity of large contingency fees from large verdicts. (Virtually all medical malpractice cases in the United States are tried on a contingency-fee basis, meaning that the plaintiff does not pay the attorney handling the case but rather the attorney takes a percentage of any recovery—typically in the neighborhood of 35%.) The reform process continues, although, presently, there is less pressure to act on the malpractice crisis.
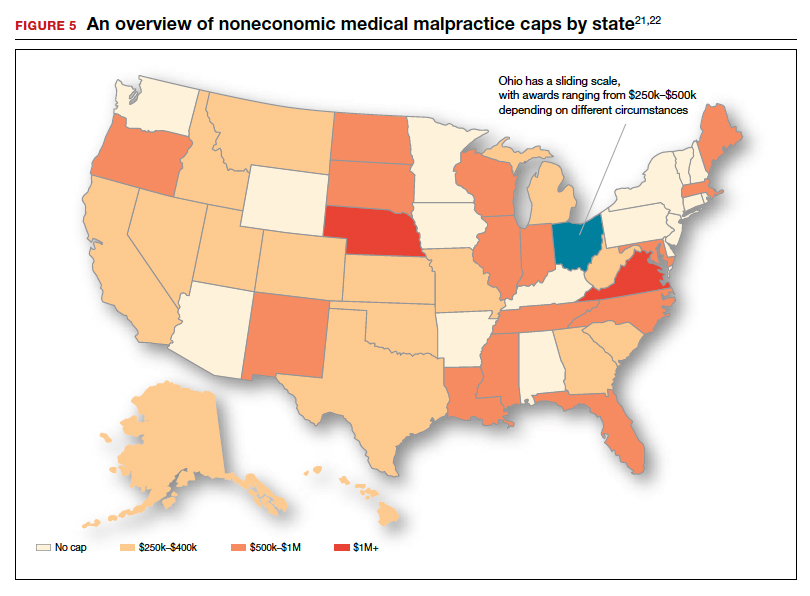
Medical malpractice cases are emotional and costly
Another reason for the relatively low rate of paid claims is that medical malpractice cases are difficult, emotionally challenging, time consuming, and expensive to pursue.23 They typically drag on for years, require extensive and expensive expert consultants as well as witnesses, and face stiff defense (compared with many other torts). The settlement of medical malpractice cases, for example, is less likely than other kinds of personal injury cases.
The contingency-fee basis does mean that injured patients do not have to pay attorney fees up front; however, plaintiffs may have to pay substantial costs along the way. The other side of this coin is that lawyers can be reluctant to take malpractice cases in which the damages are likely to be small, or where the legal uncertainty reduces the odds of achieving any damages. Thus, many potential malpractice cases are never filed.
A word of caution
The news of a reduction in malpractice paid claims may not be permanent. The numbers can conceivably be cyclical, and political reforms achieved can be changed. In addition, new technology will likely bring new kinds of malpractice claims. That appears to be the case, for example, with electronic health records (EHRs). One insurer reports that EHR malpractice claims have increased over the last 8 years.24 The most common injury in these claims was death (25%), as well as a magnitude of less serious injuries. EHR-related claims result from system failures, copy-paste inaccuracies, faulty drop-down menu use, and uncorrected “auto-populated” fields. Obstetrics is tied for fifth on the list of 14 specialties with claims related to EHRs, and gynecology is tied for eighth place.24
Continue to: A federal court ruled that a hospital that changed from...
A federal court ruled that a hospital that changed from paper records to EHRs for test results had a duty to “‘implement a reasonable procedure during the transition phase’ to ensure the timely delivery of test results” to health care providers.25 We will address this in a future “What’s the Verdict?”.
Rates of harm, malpractice cases, and the disposition of cases
There are many surprises when looking at medical malpractice claims data generally. The first surprise is how few claims are filed relative to the number of error-related injuries. Given the estimate of 210,000 to 400,000 deaths “associated with preventable harm” in hospitals, plus 10 to 20 times that number of serious injuries, it would be reasonable to expect claims of many hundreds of thousands per year. Compare the probability of a malpractice claim from an error-related injury, for example, with the probability of other personal injuries—eg, of traffic deaths associated with preventable harm.
The second key observation is how many of the claims filed are not successful—even when there was evidence in the record of errors associated with the injury. Studies slice the data in different ways but collectively suggest that only a small proportion of malpractice claims filed (a claim is generally regarded as some written demand for compensation for injuries) result in payments, either through settlement or by trial. A 2006 study by Studdert and colleagues determined that 63% of formal malpractice claims filed did involve injuries resulting from errors.26 The study found that in 16% of the claims (not injuries) there was no payment even though there was error. In 10% of the claims there was payment, even in the absence of error.
Overall, in this study, 56% of the claims received some compensation.26 That is higher than a more recent study by Jena and others, which found only 22% of claims resulted in compensation.3
How malpractice claims are decided is also interesting. Jena and colleagues found that only 55% of claims resulted in litigation.27 Presumably, the other 45% may have resulted in the plaintiff dropping the case, or in some form of settlement. Of the claims that were litigated, 54% were dismissed by the court, and another 35% were settled before a trial verdict. The cases that went to trial (about 10%), overwhelmingly (80%) resulted in verdicts for the defense.3,27 A different study found that only 9% of cases went to trial, and 87% were a defense verdict.28 The high level of defense verdicts may suggest that malpractice defense lawyers, and their client physicians, do a good job of assessing cases they are likely to lose, and settling them before trial.
ObGyns generally have larger numbers of claims and among the largest payment amounts when there is payment. Fewer of their cases are dismissed by the courts, so more go to trial. At trial, however, ObGyns prevail at a remarkably high rate.27 As for the probability of payment of a malpractice claim for ObGyns, one study suggested that there is approximately a 16% annual probability of a claim being filed, but only a 3% annual probability of a payment being made (suggesting about a 20% probability of payment per claim).3
Continue to: The purposes and effects of the medical malpractice system...
The purposes and effects of the medical malpractice system
The essential goals of tort law (including medical malpractice) include compensation for those who are injured and deterrence of future injuries (TABLE 2). What are the overall effects to the medical malpractice system? Unfortunately, the answer is that the law delivers disappointing results at best. It has a fairly high error rate. Many people who deserve some compensation for their injuries never seek compensation, and many deserving injured patients fail in efforts to receive compensation. At the same time, a few of the injured receive huge recoveries (even windfalls), and at least a small fraction receive compensation when there was no medical error. In addition to the high error rate, the system is inefficient and very expensive. Both defendants (through their insurance carriers) and plaintiffs spend a lot of money, years of time, and untold emotional pain dealing with these cases. The system also exacts high emotional and personal costs on plaintiffs and defendants.
Malpractice reform has not really addressed these issues—it has generally been focused on ways to reduce the cost of malpractice insurance. The most effective reform in reducing rates—caps—has had the effect of compensating the most seriously injured as though they were more modestly injured, and dissuading attorneys from taking the cases of those less seriously injured.
The medical and legal professions exist to help patients (the public). It does not seem that we have arrived at a system that does that very fairly or efficiently when a patient is injured because of preventable medical error.
The two vignettes described at the beginning, with similar injuries (shoulder dystocia), had disparate outcomes. In one there was a defense verdict and in the other a verdict for the plaintiffs of more than $2 million. The differences explain a number of important elements related to malpractice claims. (We have only very abbreviated and incomplete descriptions of the cases, so this discussion necessarily assumes facts and jumps to conclusions that may not be entirely consistent with the actual cases.)
These vignettes are unusual in that they went to trial. As we have noted, only a small percentage of malpractice cases are tried. And the verdict for the plaintiff-patient (in the second case) is unusual among those cases that go to trial, where plaintiffs seldom prevail.
From the facts we have, one significant difference in the 2 cases is that the plaintiff’s expert witness specifically testified in the second case that the “medical standard of care did not permit traction under these circumstances.” That is an essential element of a successful plaintiff’s malpractice case. In this case, the expert could also draw a connection between that breach of standard of care and harm to the child. In the case without liability, the nursing staff was able to testify that there was no shoulder dystocia because if there had been such an injury, they would have immediately launched into special action, which did not happen. By contrast, in the liability case, there seemed to be critical gaps in the medical record.
It is also important to remember that these cases were tried in different states, with different laws. The juries and judges in the 2 cases were different. Finally, the quality of the attorneys representing the plaintiffs and defendants were different. We mention these factors to point out that medical malpractice is not an exact science. It depends on many human elements that make the outcome of cases somewhat unpredictable. This unpredictability is one reason why parties and attorneys like to settle cases.
Watch for the third and final article in this series next month, as we are going to look at “apology in medicine and a proactive response” to communication regarding a complication.
- Shoulder dystocia—Florida defense verdict. Medical Malpractice: Verdicts, Settlements & Experts. 2019;35(1):18.
- Shoulder dystocia improperly managed--$2.320 million Virginia verdict. Medical Malpractice: Verdicts, Settlements & Experts. 2019;35(2):13.
- Jena AB, Seabury S, Lakdawalla D, et al. Malpractice risk according to physician specialty. N Engl J Med. 2011;365:629-636.
- Schaffer AC, Jena AB, Seabury SA, et al. Rates and characteristics of paid malpractice claims among US physicians by specialty, 1992-2014. JAMA Intern Med. 2017;177:710-718.
- Lowes R. Malpractice premiums trail inflation for some physicians. Medscape. December 16, 2016. https://www.medscape.com/viewarticle/873422. Accessed January 10, 2020.
- Barbieri RL. Good news for ObGyns: medical liability claims resulting in payment are decreasing! OBG Manag. 2019;31:10-13.
- Guardado JR. Medical professional liability insurance premiums: an overview of the market from 2008 to 2017. AMA Policy Research Perspectives, 2018. https://www.ama-assn.org/sites/ama-assn.org/files/corp/media-browser/public/government/advocacy/policy-research-perspective-liability-insurance-premiums.pdf. Accessed January 10, 2020.
- Institute of Medicine Committee on Quality Health Care in America; Kohn LT, Corrigan JM, Donaldson MS, eds. To Err is Human: Building a Safer Health System. Washington, DC: National Academies Press; 2000.
- James JT. A new, evidence-based estimate of patient harms associated with hospital care. J Patient Saf. 2013;9:122-128. https://journals.lww.com/journalpatientsafety/Fulltext/
2013/09000/A_New,_Evidence_based_Estimate_of_Patient_
Harms.2.aspx. Accessed January 10, 2020. - Public Citizen Congress Watch. The great medical malpractice hoax: NPDB data continue to show medical liability system produces rational outcomes. January 2007. https://www.citizen.org/wp-content/uploads/npdb_report_
final.pdf. Accessed January 23, 2020. - Bell SK, Delbanco T, Anderson-Shaw L, et al. Accountability for medical error: moving beyond blame to advocacy. Chest. 2011;140:519-526.
- Ramanathan T. Legal mechanisms supporting accountable care principles. Am J Public Health. 2014;104:2048-2051.
- Kachalia A, Kaufman SR, Boothman R, et al. Liability claims and costs before and after implementation of a medical error disclosure program. Ann Intern Med. 2010;153:213-221.
- National Practitioner Data Bank web site. What you must report to the NPDB. https://www.npdb.hrsa.gov/hcorg/whatYouMustReport
ToTheDataBank.jsp. Accessed January 10, 2020. - Bovbjerg RR. Malpractice crisis and reform. Clin Perinatol. 2005;32:203-233, viii-ix.
- Viscusi WK. Medical malpractice reform: what works and what doesn't. Denver Law Rev. 2019;96:775-791. https://static1.squarespace.com/static/5cb79f7efd6793296c0eb738 /t/5d5f4ffabd6c5400011a12f6/1566527483118/Vol96_Issue4_Viscusi_
FINAL.pdf. Accessed January 10, 2020. - National Conference of State Legislatures. Medical malpractice reform. Health Cost Containment and Efficiencies: NCSL Briefs for State Legislators. 2011;(16). http://www.ncsl.org/research/health/medical-malpractice-reform-health-cost-brief.aspx. Accessed January 10, 2020.
- Kass JS, Rose RV. Medical malpractice reform: historical approaches, alternative models, and communication and resolution programs. AMA J Ethics. 2016;18:299-310.
- Boehm G. Debunking medical malpractice myths: unraveling the false premises behind "tort reform". Yale J Health Policy Law Ethics. 2005;5:357-369.
- Hellinger FJ, Encinosa WE. The impact of state laws limiting malpractice damage awards on health care expenditures. Am J Public Health. 2006;96:1375-1381.
- Perry G. Medical malpractice caps by state [infographic]. January 3, 2013. https://www.business2community.com/infographics/medical-malpractice-caps-by-state-infographic-0368345. Accessed January 23, 2020.
- Goguen D. State-by-state medical malpractice damages caps. An in-depth look at state laws limiting compensation for medical malpractice plaintiffs. https://www.nolo.com/legal-encyclopedia/state-state-medical-malpractice-damages-caps.html. Accessed January 23, 2020.
- Berlin L. Medical errors, malpractice, and defensive medicine: an ill-fated triad. Diagnosis (Berl). 2017;4:133-139.
- Ranum D. Electronic health records continue to lead to medical malpractice suits. The Doctors Company. August 2019. https://www.thedoctors.com/articles/electronic-health-records-continue-to-lead-to-medical-malpractice-suits/. Accessed January 10, 2020.
- Mangalmurti SS, Murtagh L, Mello MM. Medical malpractice liability in the age of electronic health records. N Engl J Med. 2010;363:2060-2067.
- Studdert DM, Mello MM, Gawande AA, et al. Claims, errors, and compensation payments in medical malpractice litigation. N Engl J Med. 2006;354(19):2024-2033.
- Jena AB, Chandra A, Lakdawalla D, et al. Outcomes of medical malpractice litigation against US physicians. Arch Intern Med. 2012;172:892-894.
- Glaser LM, Alvi FA, Milad MP. Trends in malpractice claims for obstetric and gynecologic procedures, 2005 through 2014. Am J Obstet Gynecol. 2017;217:340.e1-340.e6.

Mr. Smith is Professor Emeritus and Dean Emeritus at California Western School of Law, San Diego, California.

Dr. Sanfilippo is Professor, Department of Obstetrics, Gynecology, and Reproductive Sciences, University of Pittsburgh, and Academic Division Director, Reproductive Endocrinology and Infertility, Magee-Womens Hospital, Pittsburgh, Pennsylvania. He also serves on the OBG Management Board of Editors.
The authors report no financial relationships relevant to this article.
Mr. Smith is Professor Emeritus and Dean Emeritus at California Western School of Law, San Diego, California.
Dr. Sanfilippo is Professor, Department of Obstetrics, Gynecology, and Reproductive Sciences, University of Pittsburgh, and Academic Division Director, Reproductive Endocrinology and Infertility, Magee-Womens Hospital, Pittsburgh, Pennsylvania. He also serves on the OBG Management Board of Editors.
The authors report no financial relationships relevant to this article.
In this second in a series of 3 articles discussing medical malpractice and the ObGyn we look at the reasons for malpractice claims and liability, what happens to malpractice claims, and the direction and future of medical malpractice. The first article dealt with 2 sources of major malpractice damages: the “big verdict” and physicians with multiple malpractice paid claims. Next month we look at the place of apology in medicine, in cases in which error, including negligence, may have caused a patient injury.
CASE 1 Long-term brachial plexus injury
Right upper extremity injury occurs in the neonate at delivery with sequela of long-term brachial plexus injury (which is diagnosed around 6 months of age). Physical therapy and orthopedic assessment are rendered. Despite continued treatment, discrepancy in arm lengths (ie, affected side arm is noticeably shorter than opposite side) remains. The child cannot play basketball with his older brother and is the victim of ridicule, the plaintiff’s attorney emphasizes. He is unable to properly pronate or supinate the affected arm.
The defendant ObGyn maintains that there was “no shoulder dystocia [at delivery] and the shoulder did not get obstructed in the pelvis; shoulder was delivered 15 seconds after delivery of the head.” The nursing staff testifies that if shoulder dystocia had been the problem they would have launched upon a series of procedures to address such, in accord with the delivering obstetrician. The defense expert witness testifies that a brachial plexus injury can happen without shoulder dystocia.
A defense verdict is rendered by the Florida jury.1
CASE 2 Shoulder dystocia
During delivery, the obstetrician notes a shoulder dystocia (“turtle sign”). After initial attempts to release the shoulder were unsuccessful, the physician applies traction several times to the head of the child, and the baby is delivered. There is permanent injury to the right brachial plexus. The defendant ObGyn says that traction was necessary to dislodge the shoulder, and that the injury was the result of the forces of labor (not the traction). The expert witness for the plaintiff testifies that the medical standard of care did not permit traction under these circumstances, and that the traction was the likely cause of the injury.
The Virginia jury awards $2.32 million in damages.2
Note: The above vignettes are drawn from actual cases but are only outlines of those cases and are not complete descriptions of the claims in the cases. Because the information comes from informal sources, not formal court records, the facts may be inaccurate and incomplete. They should be viewed as illustrations only.
The trend in malpractice
It has been clear for many years that medical malpractice claims are not randomly or evenly distributed among physicians. Notably, the variation among specialties has, and continues to be, substantial (FIGURE 1).3 Recent data suggest that, although paid claims per “1,000 physician-years” averages 14 paid claims per 1,000 physician years, it ranges from 4 or 5 in 1,000 (psychiatry and pediatrics) to 53 and 49 claims per 1,000 (neurology and plastic surgery, respectively). Obstetrics and gynecology has the fourth highest rate at 42.5 paid claims per 1,000 physician years.4 (These data are for the years 1992–2014.)
Continue to: The number of ObGyn paid malpractice claims has decreased over time...
The number of ObGyn paid malpractice claims has decreased over time. Although large verdicts and physicians with multiple paid malpractice claims receive a good deal of attention (as we noted in part 1 of our series), in fact, paid medical malpractice claims have trended downward in recent decades.5 When the data above are disaggregated by 5-year periods, for example, in obstetrics and gynecology, there has been a consistent reduction in paid malpractice claims from 1992 to 2014. Paid claims went from 58 per 1,000 physician-years in 1992–1996 to 25 per 1,000 in 2009–2014 (FIGURE 2).4,6 In short, the rate dropped by half over approximately 20 years.4
It is reasonable to expect that such a decline in the cost of malpractice insurance premiums would follow. Robert L. Barbieri, MD, who practices in Boston, Massachusetts, in his excellent recent editorial in OBG M
Why have malpractice payouts declined overall?
Have medical errors declined?
It would be wonderful if the reduction in malpractice claims represented a significant decrease in medical errors. Attention to medical errors was driven by the first widely noticed study of medical error deaths. The Institute of Medicine (IOM) study in 2000, put the number of deaths annually at 44,000 to 98,000.8 There have been many efforts to reduce such errors, and it is possible that those efforts have indeed reduced errors somewhat.4 Barbieri provided a helpful digest of many of the error-reduction suggestions for ObGyn practice (TABLE 1).6 But the number of medical errors remains high. More recent studies have suggested that the IOM’s reported number of injuries may have been low.9 In 2013, one study suggested that 210,000 deaths annually were “associated with preventable harm” in hospitals. Because of how the data were gathered the authors estimated that the actual number of preventable deaths was closer to 400,000 annually. Serious harm to patients was estimated at 10 to 20 times the IOM rate.9
Therefore, a dramatic reduction in preventable medical errors does not appear to explain the reduction in malpractice claims. Some portion of it may be explained by malpractice reforms—see "The medical reform factor" section below.
The collective accountability factor
The way malpractice claims are paid (FIGURE 4),10 reported, and handled may explain some of the apparent reduction in overall paid claims. Perhaps the advent of “collective accountability,” in which patient care is rendered by teams and responsibility accepted at a team level, can alleviate a significant amount of individual physician medical malpractice claims.11 This “enterprise liability” may shift the burden of medical error from physicians to health care organizations.12 Collective accountability may, therefore, focus on institutional responsibility rather than individual physician negligence.11,13 Institutions frequently hire multiple specialists and cover their medical malpractice costs as well as stand to be named in suits.
Continue to: The institutional involvement in malpractice cases also may affect...
The institutional involvement in malpractice cases also may affect apparent malpractice rates in another way. The National Practitioner Data Bank, which is the source of information for many malpractice studies, only requires reporting about individual physicians, not institutions.14 If, therefore, claims are settled on behalf of an institution, without implicating the physician, the number of physician malpractice cases may appear to decline without any real change in malpractice rates.14 In addition, institutions have taken the lead in informal resolution of injuries that occur in the institution, and these programs may reduce the direct malpractice claims against physicians. (These “disclosure, apology, and offer,” and similar programs, are discussed in the upcoming third part of this series.)
The medical reform factor
As noted, annual rates paid for medical malpractice in our specialty are trending downward. Many commentators look to malpractice reforms as the reason for the drop in malpractice rates.15-17 Because medical malpractice is essentially a matter of state law, the medical malpractice reform has occurred primarily at the state level.18 There have been many different reforms tried—limits on expert witnesses, review panels, and a variety of procedural limitations.19 Perhaps the most effective reform has been caps being placed on noneconomic damages (generally pain and suffering).20 These caps vary by state (FIGURE 5)21,22 and, of course, affect the “big verdict” cases. (As we saw in the second case scenario above, Virginia is an example of a state with a cap on malpractice awards.) They also have the secondary effect of reducing the number of malpractice cases. They make malpractice cases less attractive to some attorneys because they reduce the opportunity of large contingency fees from large verdicts. (Virtually all medical malpractice cases in the United States are tried on a contingency-fee basis, meaning that the plaintiff does not pay the attorney handling the case but rather the attorney takes a percentage of any recovery—typically in the neighborhood of 35%.) The reform process continues, although, presently, there is less pressure to act on the malpractice crisis.
Medical malpractice cases are emotional and costly
Another reason for the relatively low rate of paid claims is that medical malpractice cases are difficult, emotionally challenging, time consuming, and expensive to pursue.23 They typically drag on for years, require extensive and expensive expert consultants as well as witnesses, and face stiff defense (compared with many other torts). The settlement of medical malpractice cases, for example, is less likely than other kinds of personal injury cases.
The contingency-fee basis does mean that injured patients do not have to pay attorney fees up front; however, plaintiffs may have to pay substantial costs along the way. The other side of this coin is that lawyers can be reluctant to take malpractice cases in which the damages are likely to be small, or where the legal uncertainty reduces the odds of achieving any damages. Thus, many potential malpractice cases are never filed.
A word of caution
The news of a reduction in malpractice paid claims may not be permanent. The numbers can conceivably be cyclical, and political reforms achieved can be changed. In addition, new technology will likely bring new kinds of malpractice claims. That appears to be the case, for example, with electronic health records (EHRs). One insurer reports that EHR malpractice claims have increased over the last 8 years.24 The most common injury in these claims was death (25%), as well as a magnitude of less serious injuries. EHR-related claims result from system failures, copy-paste inaccuracies, faulty drop-down menu use, and uncorrected “auto-populated” fields. Obstetrics is tied for fifth on the list of 14 specialties with claims related to EHRs, and gynecology is tied for eighth place.24
Continue to: A federal court ruled that a hospital that changed from...
A federal court ruled that a hospital that changed from paper records to EHRs for test results had a duty to “‘implement a reasonable procedure during the transition phase’ to ensure the timely delivery of test results” to health care providers.25 We will address this in a future “What’s the Verdict?”.
Rates of harm, malpractice cases, and the disposition of cases
There are many surprises when looking at medical malpractice claims data generally. The first surprise is how few claims are filed relative to the number of error-related injuries. Given the estimate of 210,000 to 400,000 deaths “associated with preventable harm” in hospitals, plus 10 to 20 times that number of serious injuries, it would be reasonable to expect claims of many hundreds of thousands per year. Compare the probability of a malpractice claim from an error-related injury, for example, with the probability of other personal injuries—eg, of traffic deaths associated with preventable harm.
The second key observation is how many of the claims filed are not successful—even when there was evidence in the record of errors associated with the injury. Studies slice the data in different ways but collectively suggest that only a small proportion of malpractice claims filed (a claim is generally regarded as some written demand for compensation for injuries) result in payments, either through settlement or by trial. A 2006 study by Studdert and colleagues determined that 63% of formal malpractice claims filed did involve injuries resulting from errors.26 The study found that in 16% of the claims (not injuries) there was no payment even though there was error. In 10% of the claims there was payment, even in the absence of error.
Overall, in this study, 56% of the claims received some compensation.26 That is higher than a more recent study by Jena and others, which found only 22% of claims resulted in compensation.3
How malpractice claims are decided is also interesting. Jena and colleagues found that only 55% of claims resulted in litigation.27 Presumably, the other 45% may have resulted in the plaintiff dropping the case, or in some form of settlement. Of the claims that were litigated, 54% were dismissed by the court, and another 35% were settled before a trial verdict. The cases that went to trial (about 10%), overwhelmingly (80%) resulted in verdicts for the defense.3,27 A different study found that only 9% of cases went to trial, and 87% were a defense verdict.28 The high level of defense verdicts may suggest that malpractice defense lawyers, and their client physicians, do a good job of assessing cases they are likely to lose, and settling them before trial.
ObGyns generally have larger numbers of claims and among the largest payment amounts when there is payment. Fewer of their cases are dismissed by the courts, so more go to trial. At trial, however, ObGyns prevail at a remarkably high rate.27 As for the probability of payment of a malpractice claim for ObGyns, one study suggested that there is approximately a 16% annual probability of a claim being filed, but only a 3% annual probability of a payment being made (suggesting about a 20% probability of payment per claim).3
Continue to: The purposes and effects of the medical malpractice system...
The purposes and effects of the medical malpractice system
The essential goals of tort law (including medical malpractice) include compensation for those who are injured and deterrence of future injuries (TABLE 2). What are the overall effects to the medical malpractice system? Unfortunately, the answer is that the law delivers disappointing results at best. It has a fairly high error rate. Many people who deserve some compensation for their injuries never seek compensation, and many deserving injured patients fail in efforts to receive compensation. At the same time, a few of the injured receive huge recoveries (even windfalls), and at least a small fraction receive compensation when there was no medical error. In addition to the high error rate, the system is inefficient and very expensive. Both defendants (through their insurance carriers) and plaintiffs spend a lot of money, years of time, and untold emotional pain dealing with these cases. The system also exacts high emotional and personal costs on plaintiffs and defendants.
Malpractice reform has not really addressed these issues—it has generally been focused on ways to reduce the cost of malpractice insurance. The most effective reform in reducing rates—caps—has had the effect of compensating the most seriously injured as though they were more modestly injured, and dissuading attorneys from taking the cases of those less seriously injured.
The medical and legal professions exist to help patients (the public). It does not seem that we have arrived at a system that does that very fairly or efficiently when a patient is injured because of preventable medical error.
The two vignettes described at the beginning, with similar injuries (shoulder dystocia), had disparate outcomes. In one there was a defense verdict and in the other a verdict for the plaintiffs of more than $2 million. The differences explain a number of important elements related to malpractice claims. (We have only very abbreviated and incomplete descriptions of the cases, so this discussion necessarily assumes facts and jumps to conclusions that may not be entirely consistent with the actual cases.)
These vignettes are unusual in that they went to trial. As we have noted, only a small percentage of malpractice cases are tried. And the verdict for the plaintiff-patient (in the second case) is unusual among those cases that go to trial, where plaintiffs seldom prevail.
From the facts we have, one significant difference in the 2 cases is that the plaintiff’s expert witness specifically testified in the second case that the “medical standard of care did not permit traction under these circumstances.” That is an essential element of a successful plaintiff’s malpractice case. In this case, the expert could also draw a connection between that breach of standard of care and harm to the child. In the case without liability, the nursing staff was able to testify that there was no shoulder dystocia because if there had been such an injury, they would have immediately launched into special action, which did not happen. By contrast, in the liability case, there seemed to be critical gaps in the medical record.
It is also important to remember that these cases were tried in different states, with different laws. The juries and judges in the 2 cases were different. Finally, the quality of the attorneys representing the plaintiffs and defendants were different. We mention these factors to point out that medical malpractice is not an exact science. It depends on many human elements that make the outcome of cases somewhat unpredictable. This unpredictability is one reason why parties and attorneys like to settle cases.
Watch for the third and final article in this series next month, as we are going to look at “apology in medicine and a proactive response” to communication regarding a complication.
- Shoulder dystocia—Florida defense verdict. Medical Malpractice: Verdicts, Settlements & Experts. 2019;35(1):18.
- Shoulder dystocia improperly managed--$2.320 million Virginia verdict. Medical Malpractice: Verdicts, Settlements & Experts. 2019;35(2):13.
- Jena AB, Seabury S, Lakdawalla D, et al. Malpractice risk according to physician specialty. N Engl J Med. 2011;365:629-636.
- Schaffer AC, Jena AB, Seabury SA, et al. Rates and characteristics of paid malpractice claims among US physicians by specialty, 1992-2014. JAMA Intern Med. 2017;177:710-718.
- Lowes R. Malpractice premiums trail inflation for some physicians. Medscape. December 16, 2016. https://www.medscape.com/viewarticle/873422. Accessed January 10, 2020.
- Barbieri RL. Good news for ObGyns: medical liability claims resulting in payment are decreasing! OBG Manag. 2019;31:10-13.
- Guardado JR. Medical professional liability insurance premiums: an overview of the market from 2008 to 2017. AMA Policy Research Perspectives, 2018. https://www.ama-assn.org/sites/ama-assn.org/files/corp/media-browser/public/government/advocacy/policy-research-perspective-liability-insurance-premiums.pdf. Accessed January 10, 2020.
- Institute of Medicine Committee on Quality Health Care in America; Kohn LT, Corrigan JM, Donaldson MS, eds. To Err is Human: Building a Safer Health System. Washington, DC: National Academies Press; 2000.
- James JT. A new, evidence-based estimate of patient harms associated with hospital care. J Patient Saf. 2013;9:122-128. https://journals.lww.com/journalpatientsafety/Fulltext/
2013/09000/A_New,_Evidence_based_Estimate_of_Patient_
Harms.2.aspx. Accessed January 10, 2020. - Public Citizen Congress Watch. The great medical malpractice hoax: NPDB data continue to show medical liability system produces rational outcomes. January 2007. https://www.citizen.org/wp-content/uploads/npdb_report_
final.pdf. Accessed January 23, 2020. - Bell SK, Delbanco T, Anderson-Shaw L, et al. Accountability for medical error: moving beyond blame to advocacy. Chest. 2011;140:519-526.
- Ramanathan T. Legal mechanisms supporting accountable care principles. Am J Public Health. 2014;104:2048-2051.
- Kachalia A, Kaufman SR, Boothman R, et al. Liability claims and costs before and after implementation of a medical error disclosure program. Ann Intern Med. 2010;153:213-221.
- National Practitioner Data Bank web site. What you must report to the NPDB. https://www.npdb.hrsa.gov/hcorg/whatYouMustReport
ToTheDataBank.jsp. Accessed January 10, 2020. - Bovbjerg RR. Malpractice crisis and reform. Clin Perinatol. 2005;32:203-233, viii-ix.
- Viscusi WK. Medical malpractice reform: what works and what doesn't. Denver Law Rev. 2019;96:775-791. https://static1.squarespace.com/static/5cb79f7efd6793296c0eb738 /t/5d5f4ffabd6c5400011a12f6/1566527483118/Vol96_Issue4_Viscusi_
FINAL.pdf. Accessed January 10, 2020. - National Conference of State Legislatures. Medical malpractice reform. Health Cost Containment and Efficiencies: NCSL Briefs for State Legislators. 2011;(16). http://www.ncsl.org/research/health/medical-malpractice-reform-health-cost-brief.aspx. Accessed January 10, 2020.
- Kass JS, Rose RV. Medical malpractice reform: historical approaches, alternative models, and communication and resolution programs. AMA J Ethics. 2016;18:299-310.
- Boehm G. Debunking medical malpractice myths: unraveling the false premises behind "tort reform". Yale J Health Policy Law Ethics. 2005;5:357-369.
- Hellinger FJ, Encinosa WE. The impact of state laws limiting malpractice damage awards on health care expenditures. Am J Public Health. 2006;96:1375-1381.
- Perry G. Medical malpractice caps by state [infographic]. January 3, 2013. https://www.business2community.com/infographics/medical-malpractice-caps-by-state-infographic-0368345. Accessed January 23, 2020.
- Goguen D. State-by-state medical malpractice damages caps. An in-depth look at state laws limiting compensation for medical malpractice plaintiffs. https://www.nolo.com/legal-encyclopedia/state-state-medical-malpractice-damages-caps.html. Accessed January 23, 2020.
- Berlin L. Medical errors, malpractice, and defensive medicine: an ill-fated triad. Diagnosis (Berl). 2017;4:133-139.
- Ranum D. Electronic health records continue to lead to medical malpractice suits. The Doctors Company. August 2019. https://www.thedoctors.com/articles/electronic-health-records-continue-to-lead-to-medical-malpractice-suits/. Accessed January 10, 2020.
- Mangalmurti SS, Murtagh L, Mello MM. Medical malpractice liability in the age of electronic health records. N Engl J Med. 2010;363:2060-2067.
- Studdert DM, Mello MM, Gawande AA, et al. Claims, errors, and compensation payments in medical malpractice litigation. N Engl J Med. 2006;354(19):2024-2033.
- Jena AB, Chandra A, Lakdawalla D, et al. Outcomes of medical malpractice litigation against US physicians. Arch Intern Med. 2012;172:892-894.
- Glaser LM, Alvi FA, Milad MP. Trends in malpractice claims for obstetric and gynecologic procedures, 2005 through 2014. Am J Obstet Gynecol. 2017;217:340.e1-340.e6.

DLBCL tops cases of HBV-associated NHL in Europe
The majority of hepatitis B virus (HBV)–associated non-Hodgkin lymphoma (NHL) cases in Western Europe were patients with advanced-stage diffuse large B-cell lymphoma (DLBCL), according to results of a retrospective study.
The findings suggest additional research is needed to better understand the nature of HBV-related lymphomas in nonendemic regions.
“Our aim was to describe the characteristics and outcomes of patients with NHL and active hepatitis B in France and Italy, where the prevalence of HBV is low,” wrote Marine Lemaitre of the Centre Hospitalier de Versailles in Le Chesnay, France, and colleagues. The findings were published in the Journal of Infection.
The researchers retrospectively studied a cohort of 39 patients with B-cell NHL and active HBV infection. Clinical data was collected from medical records at three hematology centers in France and Italy. The team evaluated clinical characteristics, including histologic subtype of the lymphoma, type of treatment, patient demographics, and prognostic outcomes. In addition, they compared these data with a separate cohort of patients with B-cell NHL and active HCV infection. Among study patients, the median age at lymphoma diagnosis was 59 years (range, 29-88 years), and most were men. The most common subtype of lymphoma was DLBCL (62%), followed by other subtypes (38%), including marginal zone lymphomas, follicular lymphomas, and mantle cell lymphomas. With respect to treatment, 92% of patients with DLBCL were treated with R-CHOP or a similar regimen, while 90% of patients received antivirals, resulting in a complete remission for 75% of patients. At 12-month follow-up, 88% and 87% of patients with DLBCL and other B-cell lymphomas were alive, respectively.
“Patients had predominantly advanced-stage DLBCL, with frequent liver involvement, and frequent long-term hematological responses when they received a combination of immuno-chemotherapy and antiviral treatment,” the researchers explained. They also noted that extra-nodal involvement was frequently seen in both HBV- and HCV-associated NHL.
“Additional studies are needed to explore the lymphomagenesis of [these] association[s],” they concluded.
No funding sources were reported. The authors reported having no conflicts of interest.
SOURCE: Lemaitre M et al. J Infect. 2019 Dec 14. doi: 10.1016/j.jinf.2019.12.005.
FROM THE JOURNAL OF INFECTION
Nonspecific musculoskeletal symptoms might indicate early PsA
People with psoriatic arthritis can be symptomatic for years before the condition is diagnosed, according to two recent reports.

There are no reliable diagnostic biomarkers, and sometimes patients have vague symptoms with only minimal physical findings, which makes it hard for physicians to recognize the problem and refer to rheumatology.
In the meantime, the longer it takes to diagnose psoriatic arthritis (PsA) and treat it properly, the worse off patients are when it’s finally caught. They “present with a greater rate of clinical progression and worse physical function, compared with patients with an undelayed diagnosis,” and more radiographic joint damage, according to investigators led by rheumatologist Alexis Ogdie, MD, an associate professor of medicine at the University of Pennsylvania, Philadelphia.
Dr. Ogdie’s study in BMC Rheumatology, and a second one from Arthritis Care & Research, both described the early phase of psoriatic arthritis, before formal diagnosis, to help with early recognition.
Delay associated with misdiagnosis
Dr. Ogdie’s team surveyed 203 adults with PsA – average age of 52 years, mostly white, and over 80% women – about their diagnosis history. The time between seeking medical attention for PsA-related symptoms and receiving a diagnosis was less than 6 months for 69 participants, 6 months to 4 years for 68, and 5 years or more for 66.
Typical symptoms, like joint pain, swollen joints, reduced range of motion, and dactylitis, were associated with quicker diagnosis. Turning early to dermatologists and rheumatologists – instead of general practitioners, orthopedics, chiropractors, and others – sped diagnosis, as well. People diagnosed within 6 months also tended to be slightly older, were less likely to be disabled or unemployed, have more education, and were more likely to make $100,000 per year or more.
Vaguer symptoms, such as stiffness, fatigue, and enthesitis-associated foot pain, delayed diagnosis. The longer PsA went unrecognized, the more likely people were to be misdiagnosed with osteoarthritis, psychosomatic disorders, and other problems.
“Increased recognition of heterogeneous symptoms associated with PsA, as well as understanding existing diagnostic barriers, may lead to prompt diagnosis and initiation of appropriate treatment that may improve outcomes,” the investigators concluded.
A prodromal phase
In the Arthritis Care & Research study, investigators led by Lihi Eder, MD, PhD, codirector of the cardio-rheumatology program at Women’s College Hospital, Toronto, used health records and databases to compare primary care histories of 462 Canadian PsA patients in the 5 years before they were diagnosed with 2,310 age- and sex-matched controls without PsA and treated by the same family physicians. The mean age in the study was 54 years, and just over half the subjects were women. Socioeconomic status and rurality were similar between the two groups.
The mean time from the initial primary care visit for a musculoskeletal complaint to rheumatology referral was 513 days among PsA patients, “which was substantially longer than for other inflammatory arthritic conditions, such as rheumatoid arthritis,” Dr. Eder and associates noted.
PsA patients were more than twice as likely to visit primary care for nonspecific musculoskeletal issues in the year before their diagnosis, and more likely in the 5 years prior. The odds of visits to musculoskeletal specialists, joint injections, joint imaging, and ED visits, was also higher as early as 5 years before PsA recognition, and hinted at the impending diagnosis.
“Our study characterized a prediagnosis period in PsA and supports the notion that a prodromal PsA phase occurs in a significant proportion of patients. ... This pattern reveals some of the underlying causes of diagnosis delays of PsA and highlights the need for diagnostic strategies and novel reliable biomarkers to aid in early diagnosis of PsA,” the investigators concluded.
Dr. Ogdie and colleagues suggested that community case searches, public awareness programs, patient education, and referral guidelines for primary care providers might help. They also suggested greater use of validated screening tools, such as the Psoriasis Epidemiology Screening Tool, in primary care.
Dr. Eder had no disclosures, and her study was funded by the Canadian Rheumatology Association. Dr. Ogdie’s study was funded by Novartis, maker of secukinumab (Cosentyx), which is indicated for PsA. She is a consultant for Novartis and has received grant support from the company. One author is an employee.
SOURCES: Ogdie A et al. BMC Rheumatol. 2020 Jan 10. doi: 10.1186/s41927-019-0102-7; Eder L et al. Arthritis Care Res. 2020 Jan 21. doi: 10.1002/acr.24146.
People with psoriatic arthritis can be symptomatic for years before the condition is diagnosed, according to two recent reports.
There are no reliable diagnostic biomarkers, and sometimes patients have vague symptoms with only minimal physical findings, which makes it hard for physicians to recognize the problem and refer to rheumatology.
In the meantime, the longer it takes to diagnose psoriatic arthritis (PsA) and treat it properly, the worse off patients are when it’s finally caught. They “present with a greater rate of clinical progression and worse physical function, compared with patients with an undelayed diagnosis,” and more radiographic joint damage, according to investigators led by rheumatologist Alexis Ogdie, MD, an associate professor of medicine at the University of Pennsylvania, Philadelphia.
Dr. Ogdie’s study in BMC Rheumatology, and a second one from Arthritis Care & Research, both described the early phase of psoriatic arthritis, before formal diagnosis, to help with early recognition.
Delay associated with misdiagnosis
Dr. Ogdie’s team surveyed 203 adults with PsA – average age of 52 years, mostly white, and over 80% women – about their diagnosis history. The time between seeking medical attention for PsA-related symptoms and receiving a diagnosis was less than 6 months for 69 participants, 6 months to 4 years for 68, and 5 years or more for 66.
Typical symptoms, like joint pain, swollen joints, reduced range of motion, and dactylitis, were associated with quicker diagnosis. Turning early to dermatologists and rheumatologists – instead of general practitioners, orthopedics, chiropractors, and others – sped diagnosis, as well. People diagnosed within 6 months also tended to be slightly older, were less likely to be disabled or unemployed, have more education, and were more likely to make $100,000 per year or more.
Vaguer symptoms, such as stiffness, fatigue, and enthesitis-associated foot pain, delayed diagnosis. The longer PsA went unrecognized, the more likely people were to be misdiagnosed with osteoarthritis, psychosomatic disorders, and other problems.
“Increased recognition of heterogeneous symptoms associated with PsA, as well as understanding existing diagnostic barriers, may lead to prompt diagnosis and initiation of appropriate treatment that may improve outcomes,” the investigators concluded.
A prodromal phase
In the Arthritis Care & Research study, investigators led by Lihi Eder, MD, PhD, codirector of the cardio-rheumatology program at Women’s College Hospital, Toronto, used health records and databases to compare primary care histories of 462 Canadian PsA patients in the 5 years before they were diagnosed with 2,310 age- and sex-matched controls without PsA and treated by the same family physicians. The mean age in the study was 54 years, and just over half the subjects were women. Socioeconomic status and rurality were similar between the two groups.
The mean time from the initial primary care visit for a musculoskeletal complaint to rheumatology referral was 513 days among PsA patients, “which was substantially longer than for other inflammatory arthritic conditions, such as rheumatoid arthritis,” Dr. Eder and associates noted.
PsA patients were more than twice as likely to visit primary care for nonspecific musculoskeletal issues in the year before their diagnosis, and more likely in the 5 years prior. The odds of visits to musculoskeletal specialists, joint injections, joint imaging, and ED visits, was also higher as early as 5 years before PsA recognition, and hinted at the impending diagnosis.
“Our study characterized a prediagnosis period in PsA and supports the notion that a prodromal PsA phase occurs in a significant proportion of patients. ... This pattern reveals some of the underlying causes of diagnosis delays of PsA and highlights the need for diagnostic strategies and novel reliable biomarkers to aid in early diagnosis of PsA,” the investigators concluded.
Dr. Ogdie and colleagues suggested that community case searches, public awareness programs, patient education, and referral guidelines for primary care providers might help. They also suggested greater use of validated screening tools, such as the Psoriasis Epidemiology Screening Tool, in primary care.
Dr. Eder had no disclosures, and her study was funded by the Canadian Rheumatology Association. Dr. Ogdie’s study was funded by Novartis, maker of secukinumab (Cosentyx), which is indicated for PsA. She is a consultant for Novartis and has received grant support from the company. One author is an employee.
SOURCES: Ogdie A et al. BMC Rheumatol. 2020 Jan 10. doi: 10.1186/s41927-019-0102-7; Eder L et al. Arthritis Care Res. 2020 Jan 21. doi: 10.1002/acr.24146.
FROM BMC RHEUMATOLOGY AND ARTHRITIS CARE & RESEARCH

Stopping smoking allows healthy lung cells to proliferate
New research results reinforce the benefits of quitting smoking.
Not only does it stop further damage to the lungs, it appears that it also allows new, , say researchers.
The findings were published online in Nature (2020 Jan 29. doi: 10.1038/s41586-020-1961-1).
The team performed whole-genome sequencing on healthy airway cells collected (during a bronchoscopy for clinical indications) from current smokers and ex-smokers, as well as from adult never-smokers and children.
The investigators found, as expected, that the cells from current and ex-smokers had a far higher mutational burden than those of never-smokers and children, including an increased number of “driver” mutations, which increase the potential of cells to become cancerous.
However, they also found that in ex-smokers – but not in current smokers – up to 40% of the cells were near normal, with far less genetic damage and a low risk of developing cancer.
“People who have smoked heavily for 30, 40 or more years often say to me that it’s too late to stop smoking – the damage is already done,” commented senior author Peter J. Campbell, PhD, Cancer Genome Project, Wellcome Trust Sanger Institute, Hinxton, England.
“What is so exciting about our study is that it shows that it’s never too late to quit. Some of the people in our study had smoked more than 15,000 packs of cigarettes over their life, but within a few years of quitting, many of the cells lining their airways showed no evidence of damage from tobacco,” he said. The comments appear in a press release issued by Cancer Research UK, which partly funded the study.
This study has “broadened our understanding of the effects of tobacco smoke on normal epithelial cells in the human lung,” Gerd P. Pfeifer, PhD, at the Center for Epigenetics, Van Andel Institute, Grand Rapids, Michigan, writes in an accompanying comment.
“It has shed light on how the protective effect of smoking cessation plays out at the molecular level in human lung tissue and raises many interesting questions worthy of future investigation,” he added.
‘Important public health message’
Joint senior author Sam M. Janes, PhD, Lungs for Living Research Center, UCL Respiratory, University College London, added that the study has “an important public health message.
“Stopping smoking at any age does not just slow the accumulation of further damage but could reawaken cells unharmed by past lifestyle choices,” he said.
“Further research into this process could help to understand how these cells protect against cancer and could potentially lead to new avenues of research into anticancer therapeutics,” Dr. James added.
In an interview, Dr. Campbell said that the team would next like to try “to find where this reservoir of normal cells hides out while the patient is smoking. We have some ideas from mouse models and we think, by adapting the methods we used in this study, we will be able to test that hypothesis directly.”
He continued: “If we can find this stem cell niche, then we can study the biology of the cells living in there and what makes them expand when a patient stops smoking.
“Once we understand that biology, we can think about therapies to target that population of cells in beneficial ways.”
Dr. Campbell concluded that they are “a long way away yet, but the toolkit exists for getting there.”
Tobacco and mutagenesis
In their article, the team notes that the model explaining how tobacco exposure causes lung cancer centers on the notion that the 60-plus carcinogens in cigarette smoke directly cause mutagenesis, which combines with the indirect effects of inflammation, immune suppression, and infection to lead to cancer.
However, this does not explain why individuals who stop smoking in middle age or earlier “avoid most of the risk of tobacco-associated lung cancer.”
They questioned the relationship between tobacco and mutagenesis. For two people who smoke the same number of cigarettes over their lifetime, the observation that the person with longer duration of cessation has a lower risk for lung cancer is difficult to explain if carcinogenesis is induced exclusively by an increase in the mutational burden, they noted.
To investigate further, the team set out to examine the “landscape” of somatic mutations in normal bronchial epithelium. They recruited 16 individuals: three children, four never-smokers, six ex-smokers, and three current smokers.
All the participants underwent bronchoscopy for clinical indications. Samples of airway epithelium were obtained from biopsies or brushings of main or secondary bronchi.
The researchers performed whole-genome sequencing of 632 colonies derived from single bronchial epithelial cells. In addition, cells from squamous cell carcinoma or carcinoma in situ from three of the patients were sequenced.
Cells show different mutational burdens
The results showed there was “considerable heterogeneity” in mutational burden both between patients and in individual patients.
Moreover, single-base substitutions increased significantly with age, at an estimated rate of 22 per cell per year (P = 10–8). In addition, previous and current smoking substantially increased the substitution burden by an estimated 2,330 per cell in ex-smokers and 5,300 per cell in current smokers.
The team was surprised to find that smoking also increased the variability of the mutational burden from cell to cell, “even within the same individual.”
They calculated that, even between cells from a small biopsy sample of normal airway, the standard deviation in mutational burden was 2,350 per cell in ex-smokers and 2,100 per cell in current smokers, but only 140 per cell in children and 290 per cell in adult never-smokers (P less than 10–16 for within-subject heterogeneity).
Between individuals, the mean substitution burden was 1,200 per cell in ex-smokers, 1,260 per cell in current smokers, and 90 per cell for nonsmokers (P = 10–8 for heterogeneity).
Driver mutations were also more common in individuals who had a history of smoking. In those persons, they were seen in at least 25% of cells vs. 4%-14% of cells from adult never-smokers and none of the cells from children.
It was calculated that current smokers had a 2.1-fold increase in the number of driver mutations per cell in comparison with never-smokers (P = .04).
In addition, the number of driver mutations per cell increased 1.5-fold with every decade of life (P = .004) and twofold for every 5,000 extra somatic mutations per cell (P = .0003).
However, the team also found that some patients among the ex-smokers and current smokers had cells with a near-normal mutational burden, similar to that seen for never-smokers of the equivalent age.
Although these cells were rare in current smokers, their relative frequency was, the team reports, an average fourfold higher in ex-smokers and accounted for between 20% and 40% of all cells studied.
Further analysis showed that these near-normal cells had less damage from tobacco-specific mutational processes than other cells and that they had longer telomeres.
“Two points remain unclear: how these cells have avoided the high rates of mutations that are exhibited by neighbouring cells, and why this particular population of cells expands after smoking cessation,” the team writes.
They argue that the presence of longer telomeres suggests they are “recent descendants of quiescent stem cells,” which have been found in mice but “remain elusive” in human lungs.
“The apparent expansion of the near-normal cells could represent the expected physiology of a two-compartment model in which relatively short-lived proliferative progenitors are slowly replenished from a pool of quiescent stem cells, but the progenitors are more exposed to tobacco carcinogens,” they suggest.
“Only in ex-smokers would the difference in mutagenic environment be sufficient to distinguish newly produced progenitors from long-term occupants of the bronchial epithelial surface,” they add.
However, in his commentary, Dr. Pfeifer highlights that a “potential caveat” of the study is the small number of individuals (n = 16) from whom cells were taken.
In addition, Dr. Pfeifer notes that the “lack of knowledge” about the suggested “long-lived stem cells and information about the longevity of the different cell types in the human lung make it difficult to explain what occurred in the ex-smokers’ cells with few mutations.”
The study was supported by a Cancer Research UK Grand Challenge Award and the Wellcome Trust. Dr. Campbell and Dr. Janes are Wellcome Trust senior clinical fellows. The authors have disclosed no relevant financial relationships.
This article first appeared on Medscape.com.
FROM NATURE
Palliative care improves QoL for patients with Parkinson’s disease and related disorders
, according to results from a randomized clinical trial in JAMA Neurology.
The benefits of palliative care even extended to patients’ caregivers, who also appeared to benefit from outpatient palliative care at the 12-month mark, according to lead author Benzi M. Kluger, MD, of the department of neurology, University of Colorado at Denver, Aurora, and colleagues.
Between November 2015 and September 2017, Dr. Kluger and colleagues included 210 patients into the trial from three participating academic tertiary care centers who had “moderate to high palliative care needs” as assessed by the Palliative Care Needs Assessment Tool, which the researchers said are “common reasons for referral” and “reflect a desire to meet patient-centered needs rather than disease-centered markers.” Patients were primarily non-Hispanic white men with a mean age of about 70 years. The researchers also included 175 caregivers in the trial, most of whom were women, spouses to the patients, and in their caregiver role for over 5.5 years.
Patients with PDRD were randomized to receive standard care – usual care through their primary care physician and a neurologist – or “integrated outpatient palliative care,” from a team consisting of a palliative neurologist, nurse, social worker, chaplain, and board-certified palliative medicine physician. The goal of palliative care was addressing “nonmotor symptoms, goals of care, anticipatory guidance, difficult emotions, and caregiver support,” which patients received every 3 months through an in-person outpatient visit or telemedicine.
Quality of life for patients was measured through the Quality of Life in Alzheimer’s Disease (QoL-AD) scale, and caregiver burden was assessed with the Zarit Burden Interview (ZBI-12). The researchers also measured symptom burden and other QoL measures using the Edmonton Symptom Assessment Scale–Revised for Parkinson’s Disease, Parkinson’s Disease Questionnaire, Hospital Anxiety and Depression Scale, Prolonged Grief Disorder questionnaire, and Functional Assessment of Chronic Illness Therapy–Spiritual Well-Being.
Overall, 87 of 105 (82.1%) of patients in the palliative care group went to all their outpatient palliative care visits, and 19 of 106 (17.9%) patients received palliative care through telemedicine. Patients in the palliative care group also attended more neurology visits (4.66 visits) than those in the standard care (3.16 visits) group.
Quality of life significantly improved for patients in the palliative care group, compared with patients receiving standard care only at 6 months (0.66 vs. –0.84; between-group difference, 1.87; 95% confidence interval, 0.47-3.27; P = .009) and at 12 months (0.68 vs. –0.42; between-group difference, 1.36; 95% CI, −0.01 to 2.73; P = .05). These results remained significant at 6 months and 12 months after researchers used multiple imputation to fill in missing data. While there was no significant difference in caregiver burden between groups at 6 months, there was a statistically significant difference at 12 months favoring the palliative care group (between-group difference, −2.60; 95% CI, −4.58 to −0.61; P = .01).
Patients receiving palliative care also had better nonmotor symptom burden, motor symptom severity, and were more likely to complete advance directives, compared with patients receiving standard care alone. “We hypothesize that motor improvements may have reflected an unanticipated benefit of our palliative care team’s general goal of encouraging activities that promoted joy, meaning, and connection,” Dr. Kluger and colleagues said. Researchers also noted that the intervention patients with greater need for palliative care tended to benefit more than patients with patients with lower palliative care needs.
“Because the palliative care intervention is time-intensive and resource-intensive, future studies should optimize triage tools and consider alternative models of care delivery, such as telemedicine or care navigators, to provide key aspects of the intervention at lower cost,” they said.
In a related editorial, Bastiaan R. Bloem, MD, PhD, from the Center of Expertise for Parkinson & Movement Disorders, at Radboud University Medical Center, in the Netherlands, and colleagues acknowledged that the study by Kluger et al. is “timely and practical” because it introduces a system for outpatient palliative care for patients with PDRD at a time when there is “growing awareness that palliative care may also benefit persons with neurodegenerative diseases like Parkinson’s disease.”
The study is also important because it highlights that patients at varying stages of disease, including mild disease, may benefit from an integrated outpatient palliative model, which is not usually considered when determining candidates for palliative care in other scenarios, such as in patients with cancer. Future studies are warranted to assess how palliative care models can be implemented in different disease states and health care settings, they said.
“These new studies should continue to highlight the fact that palliative care is not about terminal diseases and dying,” Dr. Bloem and colleagues concluded. “As Kluger and colleagues indicate in their important clinical trial, palliative care is about how to live well.”
Six authors reported receiving a grant from the Patient-Centered Outcomes Research Institute, which was the funding source for the study. Two authors reported receiving grants from the University Hospital Foundation during the study. One author reported receiving grants from Allergan and Merz Pharma and is a consultant for GE Pharmaceuticals and Sunovion Pharmaceuticals; another reported receiving grants from the Archstone Foundation, the California Health Care Foundation, the Cambia Health Foundation, the Gordon and Betty Moore Foundation, the National Institute of Nursing Research, the Stupski Foundation, and the UniHealth Foundation. Dr. Bloem and a colleague reported their institution received a center of excellence grant from the Parkinson’s Foundation.
SOURCE: Kluger B et al. JAMA Neurol. doi: 10.1001/jamaneurol.2019.4992.
FROM JAMA NEUROLOGY