User login
Growth hormone links with worse T2D control in adolescents
SAN DIEGO – Plasma levels of three proteins involved in growth hormone activity showed significant links to the controllability of type 2 diabetes in children, a finding that suggests these proteins may serve as risk markers for incident type 2 diabetes and help identify adolescents who could benefit from aggressive preventive care.
“Plasma growth hormone mediators are associated with glycemic failure in youth with type 2 diabetes,” Chang Lu, MD, said at the at the annual scientific sessions of the American Diabetes Association. “Our hope is that these mediators could be biomarkers for predicting type 2 diabetes onset,” she added in an interview.
Another potential application is to “leverage these data to find predictive markers” that could identify adolescents with type 2 diabetes “at risk for particularly aggressive disease and target them for more intervention,” added Elvira M. Isganaitis, MD, senior author of the report and a pediatric endocrinologist at the Joslin Diabetes Center in Boston.
Does growth hormone cause incident T2D at puberty?
Changes in levels of growth hormone–associated peptides during puberty “could potentially explain why children with type 2 diabetes have a more aggressive course” of the disorder, added Dr. Lu, a pediatric endocrinologist at Joslin and at Boston’s Children’s Hospital.
Puberty-associated changes in growth hormone and related peptides “could be why type 2 diabetes starts during puberty. Type 2 diabetes is almost unheard of before children reach about age 10,” Dr. Isganaitis said in an interview.
A current hypothesis is that “high levels of growth hormone is a cause of insulin resistance during puberty, but in healthy children their beta cells overcome this by making more insulin and so they do not develop diabetes,” said Kristen J. Nadeau, MD, a pediatric endocrinologist and professor at Children’s Hospital Colorado in Denver.
“But this is a stress situation, and if someone has poor beta-cell function they may develop diabetes. The increase in growth hormone [during puberty] can unmask a physiologic and genetic predisposition” to developing type 2 diabetes, Dr. Nadeau said in an interview.
The analyses run by Dr. Lu, Dr. Isganaitis, and their coauthors used data collected in the Treatment Options for Type 2 Diabetes in Adolescents and Youth (TODAY) study, which randomized 699 children aged 10-17 years with type 2 diabetes to one of three antidiabetes treatment regimens and tallied the subsequent incidence of glycemic failure. The study defined the latter as either 6 months with a hemoglobin A1c level of at least 8% or need for insulin treatment.
The primary outcome showed a 39%-52% incidence of failure during 5 years of follow-up depending on the specific treatments the study participants received.
Growth hormone correlates of glycemic failure
The new analyses focused on 310 study participants from TODAY who had plasma specimens available from baseline and a second specimen obtained after 3 years of follow-up. The researchers compared the levels of three peptides that mediate growth hormone signaling at baseline and after 3 years, and assessed these changes relative to the endpoint of glycemic failure.
The results showed that an increase in insulin-like growth factor-1 significantly linked with a reduced incidence of glycemic failure and improved glycemia and beta-cell function.
In contrast, Also, an increase in insulin-like growth factor binding protein-1 significantly linked with glycemic failure and hyperglycemia at 36 months, and with higher insulin sensitivity at baseline. All these analyses adjusted for baseline differences in several demographic and clinical variables.
But these post hoc analyses could not determine whether these associations resulted from, or had a causal role in, treatment failure, cautioned Dr. Lu.
Future studies should examine the relationship of growth hormone signaling and the course of glycemic control in children and adolescents with prediabetes and obesity, Dr. Lu said.
Confirming that these growth hormone-related proteins are reliable predictors of future glycemic dysfunction would open the door to studies of interventions to slow or prevent progression to type 2 diabetes in children identified as high risk.
Potential interventions include early initiation of insulin treatment, which could help preserve beta-cell function, or treatment with a glucagon-like peptide-1 (GLP-1) agonist, a class of agents that may interact with the insulin-like growth factor-1 receptors on beta cells, Dr. Lu said.
The study received no commercial funding. Dr. Lu, Dr. Isganaitis, and Dr. Nadeau reported no relevant financial relationships.
A version of this article appeared on Medscape.com.
AT ADA 2023
Older women risk overdiagnosis with mammograms: Study
Women who continued breast cancer screenings when they reached age 70 had no lower chance of dying from the disease, and just getting a mammogram could instead set them on a path toward unnecessary risks, according to a new study from Yale University.
The findings, published in Annals of Internal Medicine, suggest that , meaning that the cancer found during the screening would not have caused symptoms in a person’s lifetime. (For context, the average life expectancy of a woman in the U.S. is 79 years, according to the Centers for Disease Control and Prevention.)
Overdiagnosis can be harmful because it carries the risks of complications from overtreatment, plus financial and emotional hardships and unnecessary use of limited resources.
For the study, researchers analyzed data for 54,635 women aged 70 and older and compared the rate of breast cancer diagnosis and death among women who did and did not have mammograms during a 15-year follow-up period.
The rate of breast cancer in the study among women aged 70-74 was 6% for women who were screened and 4% for women who were not screened. The researchers estimated that 31% of the cases were potentially overdiagnosed. Among women aged 75-84, breast cancer was found in 5% of women who were screened, compared to less than 3% of unscreened women. Their estimated overdiagnosis rate was 47%. Finally, 3% of women aged 85 and older who were screened had breast cancer detected, compared with 1% of women in the unscreened group. For the older group, the overdiagnosis rate was 54%.

“While our study focused on overdiagnosis, it is important to acknowledge that overdiagnosis is just one of many considerations when deciding whether to continue screening,” researcher and Yale assistant professor of medicine Ilana Richman, MD, said in a statement. “A patient’s preferences and values, personal risk factors, and the overall balance of risks and benefits from screening are also important to take into account when making screening decisions.”
A version of this article first appeared on WebMD.com.
Women who continued breast cancer screenings when they reached age 70 had no lower chance of dying from the disease, and just getting a mammogram could instead set them on a path toward unnecessary risks, according to a new study from Yale University.
The findings, published in Annals of Internal Medicine, suggest that , meaning that the cancer found during the screening would not have caused symptoms in a person’s lifetime. (For context, the average life expectancy of a woman in the U.S. is 79 years, according to the Centers for Disease Control and Prevention.)
Overdiagnosis can be harmful because it carries the risks of complications from overtreatment, plus financial and emotional hardships and unnecessary use of limited resources.
For the study, researchers analyzed data for 54,635 women aged 70 and older and compared the rate of breast cancer diagnosis and death among women who did and did not have mammograms during a 15-year follow-up period.
The rate of breast cancer in the study among women aged 70-74 was 6% for women who were screened and 4% for women who were not screened. The researchers estimated that 31% of the cases were potentially overdiagnosed. Among women aged 75-84, breast cancer was found in 5% of women who were screened, compared to less than 3% of unscreened women. Their estimated overdiagnosis rate was 47%. Finally, 3% of women aged 85 and older who were screened had breast cancer detected, compared with 1% of women in the unscreened group. For the older group, the overdiagnosis rate was 54%.
“While our study focused on overdiagnosis, it is important to acknowledge that overdiagnosis is just one of many considerations when deciding whether to continue screening,” researcher and Yale assistant professor of medicine Ilana Richman, MD, said in a statement. “A patient’s preferences and values, personal risk factors, and the overall balance of risks and benefits from screening are also important to take into account when making screening decisions.”
A version of this article first appeared on WebMD.com.
FROM ANNALS OF INTERNAL MEDICINE
‘Emerging’ biomarker may predict mild cognitive impairment years before symptoms
, new research indicates.
“Our study shows that low NPTX2 levels are predictive of MCI symptom onset more than 7 years in advance, including among individuals who are in late middle age,” said study investigator Anja Soldan, PhD, associate professor of neurology, Johns Hopkins University School of Medicine, Baltimore.
NPTX2 is still considered an “emerging biomarker” because knowledge about this protein is limited, Dr. Soldan noted.
Prior studies have shown that levels of NPTX2 are lower in people with MCI and dementia than in those with normal cognition and that low levels of this protein in people with MCI are associated with an increased risk of developing dementia.
“Our study extends these prior findings by showing that low protein levels are also associated with the onset of MCI symptoms,” Dr. Soldan said.
The study was published online in Annals of Neurology.
New therapeutic target?
The researchers measured NPTX2, as well as amyloid beta 42/40, phosphorylated (p)-tau181, and total (t)-tau in CSF collected longitudinally from 269 cognitively normal adults from the BIOCARD study.
The average age at baseline was 57.7 years. Nearly all were White, 59% were women, most were college educated, and three-quarters had a close relative with Alzheimer’s disease.
During a mean follow-up average of 16 years, 77 participants progressed to MCI or dementia within or after 7 years of baseline measurements.
In Cox regression models, lower baseline NPTX2 levels were associated with an earlier time to MCI symptom onset (hazard ratio, 0.76; P = .023). This association was significant for progression within 7 years (P = .036) and after 7 years from baseline (P = .001), the investigators reported.
Adults who progressed to MCI had, on average, about 15% lower levels of NPTX2 at baseline, compared with adults who remained cognitively normal.
Baseline NPTX2 levels improved prediction of time to MCI symptom onset after accounting for baseline Alzheimer’s disease biomarker levels (P < .01), and NPTX2 did not interact with the CSF Alzheimer’s disease biomarkers or APOE-ε4 genetic status.
Higher baseline levels of p-tau181 and t-tau were associated with higher baseline NPTX2 levels (both P < .001) and with greater declines in NPTX2 over time, suggesting that NPTX2 may decline in response to tau pathology, the investigators suggested.
Dr. Soldan said NPTX2 may be “a novel target” for developing new therapeutics for Alzheimer’s disease and other dementing and neurodegenerative disorders, as it is not an Alzheimer’s disease–specific protein.
“Efforts are underway for developing a sensitive way to measure NPTX2 brain levels in blood, which could then help clinicians identify individuals at greatest risk for cognitive decline,” she explained.
“Other next steps are to examine how changes in NPTX2 over time relate to changes in brain structure and function and to identify factors that alter levels of NPTX2, including genetic factors and potentially modifiable lifestyle factors,” Dr. Soldan said.
“If having higher levels of NPTX2 in the brain provides some resilience against developing symptoms of Alzheimer’s disease, it would be great if we could somehow increase levels of the protein,” she noted.
Caveats, cautionary notes
Commenting on this research, Christopher Weber, PhD, Alzheimer’s Association director of global science initiatives, said, “Research has shown that when NPTX2 levels are low, it may lead to weaker connections between neurons and could potentially affect cognitive functions, including memory and learning.”
“This new study found an association between lower levels of NPTX2 in CSF and earlier time to MCI symptom onset, and when combined with other established Alzheimer’s biomarkers, they found that NPTX2 improved the prediction of Alzheimer’s symptom onset,” Dr. Weber said.
“This is in line with previous research that suggests NPTX2 levels are associated with an increased risk of progression from MCI to Alzheimer’s dementia,” Dr. Weber said.
However, he noted some limitations of the study. “Participants were primarily White [and] highly educated, and therefore findings may not be generalizable to a real-world population,” he cautioned.
Dr. Weber said it’s also important to note that NPTX2 is not considered an Alzheimer’s-specific biomarker but rather a marker of synaptic activity and neurodegeneration. “The exact role of NPTX2 in predicting dementia is unknown,” Dr. Weber said.
He said that more studies with larger, more diverse cohorts are needed to fully understand its significance as a biomarker or therapeutic target for neurodegenerative diseases, as well as to develop a blood test for NPTX2.
The study was supported by the National Institutes of Health. Dr. Soldan and Dr. Weber report no relevant financial relationships.
A version of this article first appeared on Medscape.com.
FROM ANNALS OF NEUROLOGY
Scalp cooling for chemo hair loss strikes out with patients
TOPLINE:
, compared with those who opted to forgo scalp cooling.
METHODOLOGY:
- Although studies have demonstrated the effectiveness of scalp cooling to reduce hair loss during breast cancer chemotherapy, most were in the setting of single-agent regimens instead of much more commonly used combined chemotherapy, and few studies assessed patients’ subjective experience.
- To get a real-world sense of the treatment, investigators compared outcomes in 75 women who opted to use the Orbis Paxman cooling cap during taxane/anthracycline-based chemotherapy sessions with 38 women with breast cancer patients who declined to use the cooling cap.
- The women were surveyed for hair loss perception, functional health, and body image at baseline, midchemotherapy, and at their last chemotherapy cycle, as well as at 3 months and 6-9 months following chemotherapy.
- The women were treated at the Medical University of Innsbruck, Austria, for various stages of breast cancer; about half were premenopausal.
TAKEAWAY:
- There was no significant difference between the scalp-cooling and control groups in patient-reported hair loss (P = .831), overall quality of life (P = .627), emotional functioning (P = .737), social functioning (P = .635), and body image (P = .463).
- On average, women stayed on treatment with the cooling cap for about 40% of the duration of their chemotherapy.
- Overall, 53 of 75 women (70.7%) stopped scalp cooling early, with most (73.9%) citing alopecia as the primary reason; only 30% completed treatment.
IN PRACTICE:
“The efficacy and tolerability of [scalp cooling] applied in a clinical routine setting ... appeared to be limited,” the authors concluded. “The further determination and up-front definition of criteria prognostic for effectiveness of [scalp cooling] may be helpful to identify patient subgroups that may experience a treatment benefit.”
SOURCE:
The work, led by Christine Brunner, Medical University of Innsbruck, Austria, was published in Breast Cancer: Targets and Therapy.
LIMITATIONS:
- Shorter intervals between surveys might have given a more granular understanding of patients’ experiences with scalp cooling.
- There were no biomarker assessments to help identify patients more likely to benefit.
DISCLOSURES:
The work was supported by the Medical University of Innsbruck. Dr. Brunner disclosed a grant from Paxman UK, maker of the cooling cap used in the study. Another investigator disclosed personal fees from AstraZeneca, Daiichi Sankyo, Gilead, Lilly, Novartis, and Sirius.
A version of this article first appeared on Medscape.com.
BREAST CANCER: TARGETS AND THERAPY
Try a little D.I.Y.
Burnout continues to be a hot topic in medicine. It seems like either you are a victim or are concerned that you may become one. Does the solution lie in a restructuring of our health care nonsystem? Or do we need to do a better job of preparing physicians for the realities of an increasingly challenging profession?
Which side of the work/life balance needs adjusting?

Obviously, it is both and a recent article in the Journal of the American Informatics Association provides some hints and suggests where we might begin to look for workable solutions. Targeting a single large university health care system, the investigators reviewed the answers provided by more than 600 attending physicians. Nearly half of the respondents reported symptoms of burnout. Those physicians feeling a higher level of EHR (electronic health record) stress were more likely to experiencing burnout. Interestingly, there was no difference in the odds of having burnout between the physicians who were receiving patient emails (MyChart messages) that had been screened by a pool support personnel and those physicians who were receiving the emails directly from the patients.
While this finding about delegating physician-patient communications may come as a surprise to some of you, it supports a series of observations I have made over the last several decades. Whether we are talking about a physicians’ office or an insurance agency, I suspect most business consultants will suggest that things will run more smoothly and efficiently if there is well-structured system in which incoming communications from the clients/patients are dealt with first by less skilled, and therefore less costly, members of the team before they are passed on to the most senior personnel. It just makes sense.
But, it doesn’t always work that well. If the screener has neglected to ask a critical question or anticipated a question by the ultimate decision-makers, this is likely to require another interaction between the client and then screener and then the screener with the decision-maker. If the decision-maker – let’s now call her a physician – had taken the call directly from the patient, it would have saved three people some time and very possibly ended up with a higher quality response, certainly a more patient-friendly one.
I can understand why you might consider my suggestion unworkable when we are talking about phone calls. It will only work if you dedicate specific call-in times for the patients as my partner and I did back in the dark ages. However, when we are talking about a communication a bit less time critical (e.g. an email or a text), it becomes very workable and I think that’s what this recent paper is hinting at.
Too many of us have adopted a protectionist attitude toward our patients in which somehow it is unprofessional or certainly inefficient to communicate with them directly unless we are sitting down together in our offices. Please, not in the checkout at the grocery store. I hope this is not because, like lawyers, we feel we can’t bill for it. The patients love hearing from you directly even if you keep your responses short and to the point. Many will learn to follow suit and adopt your communication style.
You can argue that your staff is so well trained that your communication with the patients seldom becomes a time-gobbling ping-pong match of he-said/she-said/he-said. Then good for you. You are a better delegator than I am.
If this is your first foray into Do-It-Yourself medicine and it works, I encourage you to consider giving your own injections. It’s a clear-cut statement of the importance you attach to immunizations. And ... it will keep your staffing overhead down.
Finally, I can’t resist adding that the authors of this paper also found that physicians sleeping less than 6 hours per night had a significantly higher odds of burnout.
Dr. Wilkoff practiced primary care pediatrics in Brunswick, Maine, for nearly 40 years. He has authored several books on behavioral pediatrics, including “How to Say No to Your Toddler.” Other than a Littman stethoscope he accepted as a first-year medical student in 1966, Dr. Wilkoff reports having nothing to disclose. Email him at [email protected].
Burnout continues to be a hot topic in medicine. It seems like either you are a victim or are concerned that you may become one. Does the solution lie in a restructuring of our health care nonsystem? Or do we need to do a better job of preparing physicians for the realities of an increasingly challenging profession?
Which side of the work/life balance needs adjusting?
Obviously, it is both and a recent article in the Journal of the American Informatics Association provides some hints and suggests where we might begin to look for workable solutions. Targeting a single large university health care system, the investigators reviewed the answers provided by more than 600 attending physicians. Nearly half of the respondents reported symptoms of burnout. Those physicians feeling a higher level of EHR (electronic health record) stress were more likely to experiencing burnout. Interestingly, there was no difference in the odds of having burnout between the physicians who were receiving patient emails (MyChart messages) that had been screened by a pool support personnel and those physicians who were receiving the emails directly from the patients.
While this finding about delegating physician-patient communications may come as a surprise to some of you, it supports a series of observations I have made over the last several decades. Whether we are talking about a physicians’ office or an insurance agency, I suspect most business consultants will suggest that things will run more smoothly and efficiently if there is well-structured system in which incoming communications from the clients/patients are dealt with first by less skilled, and therefore less costly, members of the team before they are passed on to the most senior personnel. It just makes sense.
But, it doesn’t always work that well. If the screener has neglected to ask a critical question or anticipated a question by the ultimate decision-makers, this is likely to require another interaction between the client and then screener and then the screener with the decision-maker. If the decision-maker – let’s now call her a physician – had taken the call directly from the patient, it would have saved three people some time and very possibly ended up with a higher quality response, certainly a more patient-friendly one.
I can understand why you might consider my suggestion unworkable when we are talking about phone calls. It will only work if you dedicate specific call-in times for the patients as my partner and I did back in the dark ages. However, when we are talking about a communication a bit less time critical (e.g. an email or a text), it becomes very workable and I think that’s what this recent paper is hinting at.
Too many of us have adopted a protectionist attitude toward our patients in which somehow it is unprofessional or certainly inefficient to communicate with them directly unless we are sitting down together in our offices. Please, not in the checkout at the grocery store. I hope this is not because, like lawyers, we feel we can’t bill for it. The patients love hearing from you directly even if you keep your responses short and to the point. Many will learn to follow suit and adopt your communication style.
You can argue that your staff is so well trained that your communication with the patients seldom becomes a time-gobbling ping-pong match of he-said/she-said/he-said. Then good for you. You are a better delegator than I am.
If this is your first foray into Do-It-Yourself medicine and it works, I encourage you to consider giving your own injections. It’s a clear-cut statement of the importance you attach to immunizations. And ... it will keep your staffing overhead down.
Finally, I can’t resist adding that the authors of this paper also found that physicians sleeping less than 6 hours per night had a significantly higher odds of burnout.
Dr. Wilkoff practiced primary care pediatrics in Brunswick, Maine, for nearly 40 years. He has authored several books on behavioral pediatrics, including “How to Say No to Your Toddler.” Other than a Littman stethoscope he accepted as a first-year medical student in 1966, Dr. Wilkoff reports having nothing to disclose. Email him at [email protected].
For CLL, BTKi combo bests chemoimmunotherapy
The analysis of the open-label FLAIR trial, published in The Lancet Oncology, tracked 771 patients with CLL for a median follow-up of 53 months (interquartile ratio, 41-61 months) and found that median progression-free survival was not reached with ibrutinib/rituximab versus 67 months with FCR (hazard ratio, 0.44, P < .0001).
“This paper is another confirmation to say that Bruton’s tyrosine kinase inhibitors are more powerful than even our strongest chemoimmunotherapy. That’s very reassuring,” said hematologist/oncologist Jan A. Burger, MD, PhD, of the University of Texas MD Anderson Cancer Center, Houston, in an interview. He did not take part in the analysis but is familiar with its findings.
There are caveats to the study. More patients in the ibrutinib/rituximab arm died of cardiac events, possibly reflecting a known risk of those drugs. And for unclear reasons, there was no difference in overall survival – a secondary endpoint – between the groups. The study authors speculate that this may be because some patients on FCR progressed and turned to effective second-line drugs.
Still, the findings are consistent with the landmark E1912 trial, the authors wrote, and adds “to a body of evidence that suggests that the use of ibrutinib-based regimens should be considered for patients with previously untreated CLL, especially those with IGHV-unmutated CLL.”
The study, partially funded by industry, was led by Peter Hillmen, PhD, of Leeds (England) Cancer Center.
According to Dr. Burger, FCR was the standard treatment for younger, fitter patients with CLL about 10-15 years ago. Then Bruton’s tyrosine kinase inhibitors such as ibrutinib entered the picture. But, as the new report notes, initial studies focused on older patients who weren’t considered fit enough to tolerate FCR.
The new study, like the E1912 trial, aimed to compare ibrutinib-rituximab versus FCR in younger, fitter patients.
From 2014 to 2018, researchers assigned 771 patients (median age, 62 years; IQR 56-67; 73% male; 95% White; 66% with World Health Organization performance status, 0) to FCR (n = 385) or ibrutinib/rituximab (n = 386).
Nearly three-quarters (74%) in the FCR group received six cycles of therapy, and 97% of those in the ibrutinib-rituximab group received six cycles of rituximab. Those in the ibrutinib-rituximab group also received daily doses of ibrutinib. Doses could be modified. The data cutoff was May 24, 2021.
Notably, there was no improvement in overall survival in the ibrutinib/rituximab group: 92.1% of patients lived 4 years versus 93.5% in the FCR group. This contrasts with an improvement in overall survival in the earlier E1912 study in the ibrutinib/rituximab group.
However, the study authors noted that overall survival in the FCR group is higher than in earlier studies, perhaps reflecting the wider availability of targeted therapy. The final study analysis will offer more insight into overall survival.
In an interview, hematologist David A. Bond, MD, of Ohio State University, Columbus, who is familiar with the study findings, said “the lack of an improvement in overall survival could be due to differences in available treatments at relapse, as the FLAIR study was conducted more recently than the prior E1912 study.” He added that “the younger ages in the E1912 study may have led to less risk for cardiovascular events or deaths for the patients treated with ibrutinib in the E1912 study.”
The previous E1912 trial showed a larger effect for ibrutinib/rituximab versus FCR on progression-free survival (HR, 0.37, P < .001 for E1912 and HR, 0.44, P< .0001 for the FLAIR trial). However, the study authors noted that FLAIR trial had older subjects (mean age, 62 vs 56.7 in the E1912 trial.)
As for grade 3 or 4 adverse events, leukopenia was most common in the FCR group (n = 203, 54%), compared with the ibrutinib/rituximab group (n = 55, 14%). Serious adverse events were reported in 205 (53%) of patients in the ibrutinib/rituximab group versus 203 (54%) patients in the FCR group.
All-cause infections, myelodysplastic syndrome, acute myeloid leukemia, Richter’s transformation, and other diagnosed cancers were rare but more common in the FCR group. Deaths from COVID-19 were the same at 3 in each group; 2 of 29 deaths in the FCR group and 3 of 30 deaths in the ibrutinib/rituximab group were considered to be likely linked to treatment.
Sudden unexplained or cardiac deaths were more common in the ibrutinib-rituximab group (n = 8, 2%) vs. the FCR group (n = 2, less than 1%).
Dr. Bond said “one of the takeaways for practicing hematologists from the FLAIR study is that cardiovascular complications and sudden cardiac death are clearly an issue for older patients with hypertension treated with ibrutinib. Patients should be monitored for signs or symptoms of cardiovascular disease and have close management of blood pressure.”
Dr. Burger also noted that cardiac problems are a known risk of ibrutinib. “Fortunately, we have second-generation Bruton’s tyrosine kinase inhibitors that could be chosen for patients when we are worried about side effects.”
He said that chemotherapy remains the preferred – or only – treatment in some parts of the world. And patients may prefer FCR to ibrutinib because of the latter drug’s side effects or a preference for therapy that doesn’t take as long.
The study was funded by Cancer Research UK and Janssen. The study authors reported relationships with companies such as Lilly, Janssen, AbbVie, AstraZeneca, BeiGene, Gilead, and many others. Dr. Burger reports financial support for clinical trials from Pharmacyclics, AstraZeneca, Biogen, and Janssen. Dr. Bond reported no disclosures.
FROM THE LANCET ONCOLOGY
On the best way to exercise
This transcript has been edited for clarity.
I’m going to talk about something important to a lot of us, based on a new study that has just come out that promises to tell us the right way to exercise. This is a major issue as we think about the best ways to stay healthy.
There are basically two main types of exercise that exercise physiologists think about. There are aerobic exercises: the cardiovascular things like running on a treadmill or outside. Then there are muscle-strengthening exercises: lifting weights, calisthenics, and so on. And of course, plenty of exercises do both at the same time.
It seems that the era of aerobic exercise as the main way to improve health was the 1980s and early 1990s. Then we started to increasingly recognize that muscle-strengthening exercise was really important too. We’ve got a ton of data on the benefits of cardiovascular and aerobic exercise (a reduced risk for cardiovascular disease, cancer, and all-cause mortality, and even improved cognitive function) across a variety of study designs, including cohort studies, but also some randomized controlled trials where people were randomized to aerobic activity.
We’re starting to get more data on the benefits of muscle-strengthening exercises, although it hasn’t been in the zeitgeist as much. Obviously, this increases strength and may reduce visceral fat, increase anaerobic capacity and muscle mass, and therefore [increase the] basal metabolic rate. What is really interesting about muscle strengthening is that muscle just takes up more energy at rest, so building bigger muscles increases your basal energy expenditure and increases insulin sensitivity because muscle is a good insulin sensitizer.
So, do you do both? Do you do one? Do you do the other? What’s the right answer here?
it depends on who you ask. The Center for Disease Control and Prevention’s recommendation, which changes from time to time, is that you should do at least 150 minutes a week of moderate-intensity aerobic activity. Anything that gets your heart beating faster counts here. So that’s 30 minutes, 5 days a week. They also say you can do 75 minutes a week of vigorous-intensity aerobic activity – something that really gets your heart rate up and you are breaking a sweat. Now they also recommend at least 2 days a week of a muscle-strengthening activity that makes your muscles work harder than usual, whether that’s push-ups or lifting weights or something like that.
The World Health Organization is similar. They don’t target 150 minutes a week. They actually say at least 150 and up to 300 minutes of moderate-intensity physical activity or 75-150 minutes of vigorous intensity aerobic physical activity. They are setting the floor, whereas the CDC sets its target and then they go a bit higher. They also recommend 2 days of muscle strengthening per week for optimal health.
But what do the data show? Why am I talking about this? It’s because of this new study in JAMA Internal Medicine by Ruben Lopez Bueno and colleagues. I’m going to focus on all-cause mortality for brevity, but the results are broadly similar.
The data source is the U.S. National Health Interview Survey. A total of 500,705 people took part in the survey and answered a slew of questions (including self-reports on their exercise amounts), with a median follow-up of about 10 years looking for things like cardiovascular deaths, cancer deaths, and so on.
The survey classified people into different exercise categories – how much time they spent doing moderate physical activity (MPA), vigorous physical activity (VPA), or muscle-strengthening activity (MSA).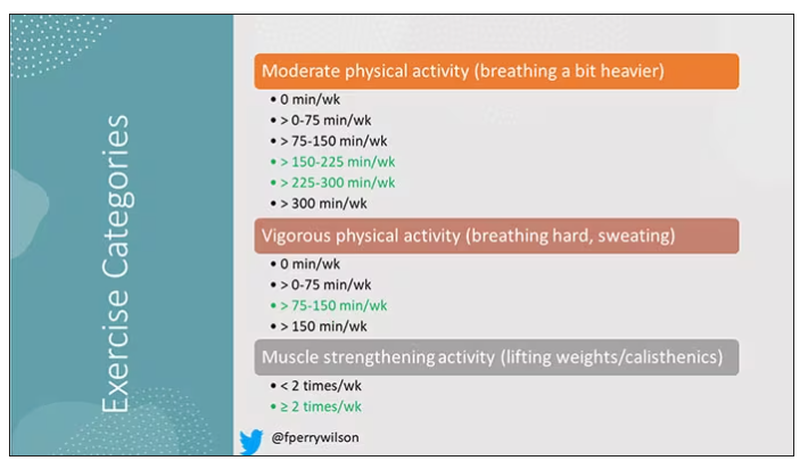
There are six categories based on duration of MPA (the WHO targets are highlighted in green), four categories based on length of time of VPA, and two categories of MSA (≥ or < two times per week). This gives a total of 48 possible combinations of exercise you could do in a typical week.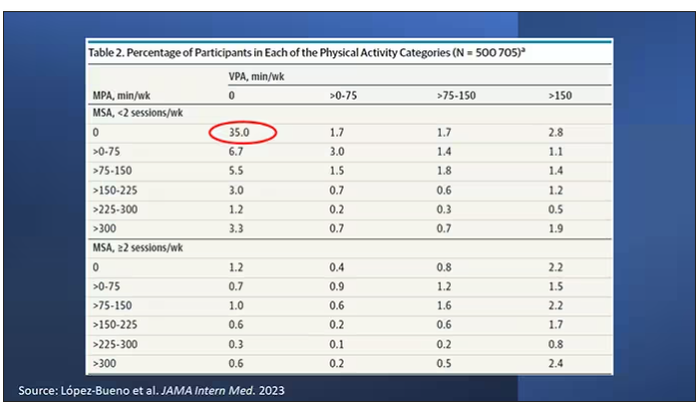
Here are the percentages of people who fell into each of these 48 potential categories. The largest is the 35% of people who fell into the “nothing” category (no MPA, no VPA, and less than two sessions per week of MSA). These “nothing” people are going to be a reference category moving forward.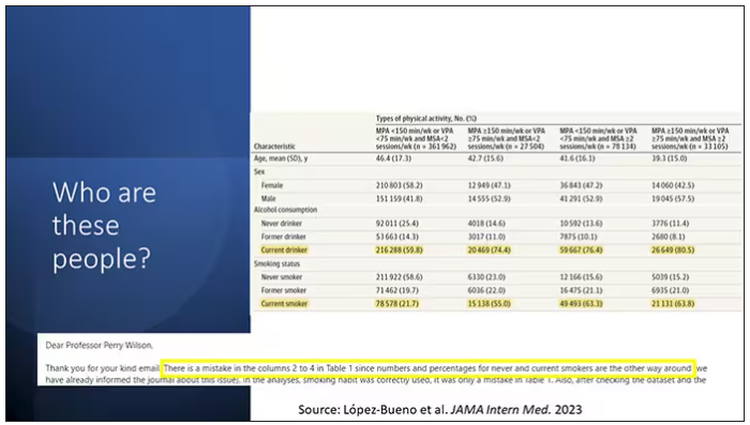
So who are these people? On the far left are the 361,000 people (the vast majority) who don’t hit that 150 minutes a week of MPA or 75 minutes a week of VPA, and they don’t do 2 days a week of MSA. The other three categories are increasing amounts of exercise. Younger people seem to be doing more exercise at the higher ends, and men are more likely to be doing exercise at the higher end. There are also some interesting findings from the alcohol drinking survey. The people who do more exercise are more likely to be current drinkers. This is interesting. I confirmed these data with the investigator. This might suggest one of the reasons why some studies have shown that drinkers have better outcomes in terms of either cardiovascular or cognitive outcomes over time. There’s a lot of conflicting data there, but in part, it might be that healthier people might drink more alcohol. It could be a socioeconomic phenomenon as well.
Now, what blew my mind were these smoker numbers, but don’t get too excited about it. What it looks like from the table in JAMA Internal Medicine is that 20% of the people who don’t do much exercise smoke, and then something like 60% of the people who do more exercise smoke. That can’t be right. So I checked with the lead study author. There is a mistake in these columns for smoking. They were supposed to flip the “never smoker” and “current smoker” numbers. You can actually see that just 15.2% of those who exercise a lot are current smokers, not 63.8%. This has been fixed online, but just in case you saw this and you were as confused as I was that these incredibly healthy smokers are out there exercising all the time, it was just a typo.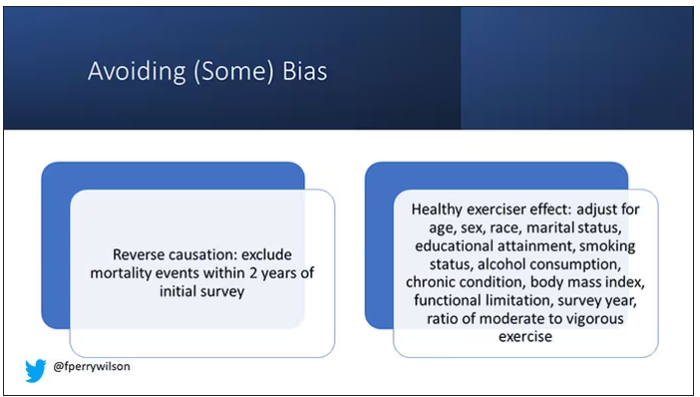
There is bias here. One of the big ones is called reverse causation bias. This is what might happen if, let’s say you’re already sick, you have cancer, you have some serious cardiovascular disease, or heart failure. You can’t exercise that much. You physically can’t do it. And then if you die, we wouldn’t find that exercise is beneficial. We would see that sicker people aren’t as able to exercise. The investigators got around this a bit by excluding mortality events within 2 years of the initial survey. Anyone who died within 2 years after saying how often they exercised was not included in this analysis.
This is known as the healthy exerciser or healthy user effect. Sometimes this means that people who exercise a lot probably do other healthy things; they might eat better or get out in the sun more. Researchers try to get around this through multivariable adjustment. They adjust for age, sex, race, marital status, etc. No adjustment is perfect. There’s always residual confounding. But this is probably the best you can do with the dataset like the one they had access to.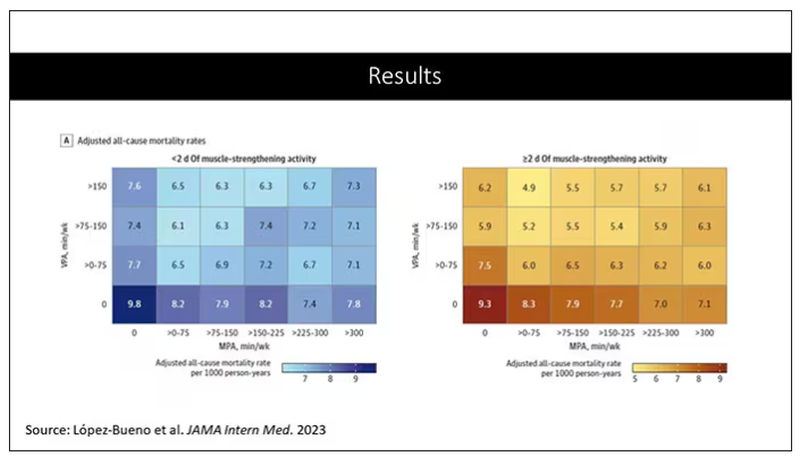
Let’s go to the results, which are nicely heat-mapped in the paper. They’re divided into people who have less or more than 2 days of MSA. Our reference groups that we want to pay attention to are the people who don’t do anything. The highest mortality of 9.8 individuals per 1,000 person-years is seen in the group that reported no moderate physical activity, no VPA, and less than 2 days a week of MSA.
As you move up and to the right (more VPA and MPA), you see lower numbers. The lowest number was 4.9 among people who reported more than 150 minutes per week of VPA and 2 days of MSA.
Looking at these data, the benefit, or the bang for your buck is higher for VPA than for MPA. Getting 2 days of MSA does have a tendency to reduce overall mortality. This is not necessarily causal, but it is rather potent and consistent across all the different groups.
So, what are we supposed to do here? I think the most clear finding from the study is that anything is better than nothing. This study suggests that if you are going to get activity, push on the vigorous activity if you’re physically able to do it. And of course, layering in the MSA as well seems to be associated with benefit.
Like everything in life, there’s no one simple solution. It’s a mix. But telling ourselves and our patients to get out there if you can and break a sweat as often as you can during the week, and take a couple of days to get those muscles a little bigger, may increase insulin sensitivity and basal metabolic rate – is it guaranteed to extend life? No. This is an observational study. We can’t say; we don’t have causal data here, but it’s unlikely to cause much harm. I’m particularly happy that people are doing a much better job now of really dissecting out the kinds of physical activity that are beneficial. It turns out that all of it is, and probably a mixture is best.
Dr. Wilson is associate professor, department of medicine, and interim director, program of applied translational research, Yale University, New Haven, Conn. He disclosed no relevant financial relationships.
A version of this article appeared on Medscape.com.
How useful are circulating tumor cells for early diagnosis?
Treatment options for patients with cancer that is detected at a late stage are severely limited, which usually leads to an unfavorable prognosis for such patients. Indeed, the options available for patients with metastatic solid cancers are scarcely curative. Therefore, early diagnosis of neoplasia remains a fundamental mainstay for improving outcomes for cancer patients.
Histopathology is the current gold standard for cancer diagnosis. Biopsy is an invasive procedure that provides physicians with further samples to test but that furnishes limited information concerning tumor heterogeneity. Biopsy specimens are usually obtained only when there is clinical evidence of neoplasia, which significantly limits their usefulness in early diagnosis.
Around 20 years ago, it was discovered that the presence of circulating tumor cells (CTC) in patients with metastatic breast cancer who were about to begin a new line of treatment was predictive of overall and progression-free survival. The prognostic value of CTC was independent of the line of treatment (first or second) and was greater than that of the site of metastasis, the type of therapy, and the time to metastasis after complete primary resection. These results support the idea that the presence of CTC could be used to modify the system for staging advanced disease.
Since then,
Liquid vs. tissue
Liquid biopsy is a minimally invasive tool that is easy to use. It is employed to detect cancer, to assess treatment response, or to monitor disease progression. Liquid biopsy produces test material from primary and metastatic (or micrometastatic) sites and provides a more heterogeneous picture of the entire tumor cell population, compared with specimens obtained with tissue biopsy.
Metastasis
The notion that metastatic lesions are formed from cancer cells that have disseminated from advanced primary tumors has been substantially revised following the identification of disseminated tumor cells (DTC) in the bone marrow of patients with early-stage disease. These results have led researchers to no longer view cancer metastasis as a linear cascade of events but rather as a series of concurrent, partially overlapping processes, as metastasizing cells assume new phenotypes while abandoning older behaviors.
The initiation of metastasis is not simply a cell-autonomous event but is heavily influenced by complex tissue microenvironments. Although colonization of distant tissues by DTC is an extremely inefficient process, at times, relatively numerous CTC can be detected in the blood of cancer patients (> 1,000 CTC/mL of blood plasma), whereas the number of clinically detectable metastases is disproportionately low, confirming that tumor cell diffusion can happen at an early stage but usually occurs later on.
Early dissemination
Little is currently known about the preference of cancer subtypes for distinct tissues or about the receptiveness of a tissue as a metastatic site. What endures as one of the most confounding clinical phenomena is that patients may undergo tumor resection and remain apparently disease free for months, years, and even decades, only to experience relapse and be diagnosed with late-stage metastatic disease. This course may be a result of cell seeding from minimal residual disease after resection of the primary tumor or of preexisting clinically undetectable micrometastases. It may also arise from early disseminated cells that remain dormant and resistant to therapy until they suddenly reawaken to initiate proliferation into clinically detectable macrometastases.
Dormant DTC could be the main reason for delayed detection of metastases. It is thought that around 40% of patients with prostate cancer who undergo radical prostatectomy present with biochemical recurrence, suggesting that it is likely that hidden DTC or micrometastases are present at the time of the procedure. The finding is consistent with the detection of DTC many years after tumor resection, suggesting they were released before surgical treatment. Nevertheless, research into tumor cell dormancy is limited, owing to the invasive and technically challenging nature of obtaining DTC samples, which are predominantly taken from the bone marrow.
CTC metastases
Cancer cells can undergo epithelial-to-mesenchymal transition to facilitate their detachment from the primary tumor and intravasation into the blood circulation (step 1). Dissemination of cancer cells from the primary tumor into circulation can involve either single cells or cell clusters containing multiple CTC as well as immune cells and platelets, known as microemboli. CTC that can survive in circulation (step 2) can exit the bloodstream (step 3) and establish metastatic tumors (step 4), or they can enter dormancy and reside in distant organs, such as the bone marrow.
Use in practice
CTC were discovered over a century ago, but only in recent years has technology been sufficiently advanced to study CTC and to assess their usefulness as biomarkers. Recent evidence suggests that not only do the number of CTC increase during sleep and rest phases but also that these CTC are better able to metastasize, compared to those generated during periods of wakefulness or activity.
CTC clusters (microemboli) are defined as groups of two or more CTC. They can consist of CTC alone (homotypic) or can include various stromal cells, such as cancer-associated fibroblasts or platelets and immune cells (heterotypic). CTC clusters (with or without leukocytes) seem to have greater metastatic capacity, compared with individual CTC.
A multitude of characteristics can be measured in CTC, including genetics and epigenetics, as well as protein levels, which might help in understanding many processes involved in the formation of metastases.
Quantitative assessment of CTC could indicate tumor burden in patients with aggressive cancers, as has been seen in patients with primary lung cancer.
Early cancer diagnosis
Early research into CTC didn’t explore their usefulness in diagnosing early-stage tumors because it was thought that CTC were characteristic of advanced-stage disease. This hypothesis was later rejected following evidence of local intravascular invasion of very early cancer cells, even over a period of several hours. This feature may allow CTC to be detected before the clinical diagnosis of cancer.
CTC have been detected in various neoplastic conditions: in breast cancer, seen in 20% of patients with stage I disease, in 26.8% with stage II disease, and 26.7% with stage III disease; in nonmetastatic colorectal cancer, including stage I and II disease; and in prostate cancer, seen in over 50% of patients with localized disease.
The presence of CTC has been proven to be an unfavorable prognostic predictor of overall survival among patients with early-stage non–small cell lung cancer. It distinguishes patients with pancreatic ductal adenocarcinoma from those with noncancerous pancreatic diseases with a sensitivity of 75% and a specificity of 96.3%.
CTC positivity scoring (appropriately defined), combined with serum prostate-specific antigen level, was predictive of a biopsy diagnosis of clinically significant prostate cancer.
All these data support the utility of CTC in early cancer diagnosis. Their link with metastases, and thus with aggressive tumors, gives them an advantage over other (noninvasive or minimally invasive) biomarkers in the early identification of invasive tumors for therapeutic intervention with better cure rates.
This article was translated from Univadis Italy. A version appeared on Medscape.com.
Serious arrhythmias playing video games ‘extremely rare’
provided their condition is properly treated, say researchers based on their large, single-center study.
Among more than 3,000 patients in the study with such a genetic vulnerability, just 6 – or less than 0.2% – experienced an electronic gaming–associated cardiac event.
A previous study had concluded that e-gaming, particularly with war games, might trigger potentially fatal arrhythmias in some vulnerable children. That study “sparked controversy in the field, with both clinicians and patients wondering whether electronic gaming is safe for patients with GHDs,” Michael J. Ackerman, MD, PhD, of Mayo Clinic in Rochester, Minn., said in an interview.
Dr. Ackerman and colleagues conducted the current study, published online in the Journal of the American College of Cardiology, to determine just how often e-gaming triggered cardiac events (CE) in these patients – and who was most at risk.
‘Extremely low’ risk
The investigators looked at records from all patients evaluated and treated at the Mayo Clinic’s genetic heart rhythm clinic from 2000 to 2022. They identified those with a history of playing electronic games at the time of their CE, defined here as such an event occurring before diagnosis, or breakthrough cardiac event (BCE), meaning an event occurring after diagnosis.
A total of 3,370 patients with a GHD (55% female) were included in the analysis. More than half (52%) were diagnosed with long-QT syndrome (LQTS). The remainder had various GHDs including, among others, catecholaminergic polymorphic ventricular tachycardia (CPVT) or hypertrophic cardiomyopathy (HCM).
The mean age at first evaluation was 27; 14% of the participants were age 6 or younger, 33% were age 7-20, and 53% were 21 or older. Most patients in each of the three age groups were diagnosed with either LQTS or CPVT.
Of the 3,370 GHD patients, 1,079 (32%) had a CE before diagnosis.
Six patients (0.5%) had a CE in the setting of e-gaming, including five for whom it was the sentinel CE. Five also had CEs in settings not involving e-gaming. Their average age at the time of the CE was 13.
Three of the six patients were diagnosed with CPVT (including two CPVT1 and one CPVT2). Of the others, one was diagnosed with LQT1, one with ventricular fibrillation triggered by premature ventricular contractions, and one with catecholamine-sensitive right ventricular outflow tract ventricular tachycardia (RVOT-VT).
After appropriate treatment, none of the six experienced a BCE during follow-ups ranging from 7 months to 4 years.
Among the full cohort of 3370 patients with GHD, 431 (13%) experienced one or more BCE during follow-up. Of those, one with catecholamine-sensitive RVOT-VT experienced an e-gaming–associated BCE.
“Although anecdotal e-gaming–associated cardiac events, including [sudden cardiac death], have been reported, the absolute risk is extremely low,” the authors wrote.
“Although there are no clear health benefits associated with e-gaming,” Dr. Ackerman said, “the risk of sudden death should not be used as an argument in an effort to curtail the amount of time patients spend e-gaming.”
Furthermore, he added, e-gaming is important to some patients’ quality of life. If patients are “properly diagnosed, risk stratified, and treated, it is okay to engage in e-gaming.”
However, “given that e-gaming may pose some risks, especially when compounded with additional factors such as dehydration, sleep deprivation, and use of performance-enhancing substances such as energy drinks, patients need to be counseled on the potential adverse health consequences,” Dr. Ackerman said.
“To this end,” he added, “we are proponents of incorporating e-gaming status into the clinical evaluation and electronic health record.”
“We would continue to urge common sense and individual risk assessment, with shared decision-making, for those where this may be an issue,” Claire M. Lawley, MBBS, PhD, Children’s Hospital at Westmead (Australia), said in an interview.
“Additionally, syncope during electronic gaming should prompt medical review,” said Dr. Lawley, lead author of the study that prompted Ackerman and colleagues to investigate the issue further.
Buddy system
Maully J. Shah, MBBS, led a study published in 2020 focusing on two case reports of syncope and potentially life-threatening ventricular arrhythmias provoked by emotional surges during play with violent video games.
Nevertheless, “we do not restrict patients from participating in e-games,” Dr. Shah, a pediatric cardiac electrophysiologist at the Cardiac Center at Children’s Hospital of Philadelphia, said in an interview. “We inform them about the available data regarding the very rare but possible occurrence of an event from e-gaming so that they can make an informed decision.”
Dr. Shah agreed that, “even in children not known to have a cardiac condition, syncope associated with emotional responses during violent video games should prompt cardiac evaluation, similar to exercise-induced syncope.”
If a patient wishes to play e-games, clinicians should ensure medication compliance and recommend a “buddy” system. “Don’t be alone while playing,” she said.
“The present study and previous reports make one pause to think whether these CEs and catecholaminergic drives can occur with sports only. If we now consider electronic gaming as a potential risk, what other activities need to be included?” wrote the authors of an accompanying editorial, led by Shankar Baskar, MD, Cincinnati Children’s Medical Center.
“A catecholaminergic drive can occur in many settings with activities of daily living or activities not considered to be competitive,” the editorialists wrote. “Ultimately these events [are] rare, but they can have life-threatening consequences, and at the same time they might not be altogether preventable and, as in electronic gaming, might be an activity that improves quality of life, especially in those who might be restricted from other sports.”
Dr. Ackerman disclosed consulting for Abbott, Boston Scientific, Bristol-Myers Squibb, Daiichi Sankyo, Invitae, Medtronic, Tenaya Therapeutics, and UpToDate. Dr. Ackerman and the Mayo Clinic have license agreements with AliveCor, Anumana, ARMGO Pharma, Pfizer, and Thryv Therapeutics. The other coauthors reported no relevant relationships. Dr. Baskar and colleagues reported no relevant relationships. Dr. Shah disclosed she is a consultant to Medtronic.
A version of this article first appeared on Medscape.com.
FROM THE JOURNAL OF THE AMERICAN COLLEGE OF CARDIOLOGY
Inhaling pleasant scents during sleep tied to a dramatic boost in cognition
In a small, randomized controlled trial researchers found that when cognitively normal individuals were exposed to the scent of an essential oil for 2 hours every night over 6 months, they experienced a 226% improvement in memory compared with a control group who received only a trace amount of the diffused scent.
In addition, functional magnetic resonance imaging (fMRI) showed that those in the enriched group had improved functioning of the left uncinate fasciculus, an area of the brain linked to memory and cognition, which typically declines with age.
“To my knowledge, that level of [memory] improvement is far greater than anything that has been reported for healthy older adults and we also found a critical memory pathway in their brains improved to a similar extent relative to unenriched older adults,” senior investigator Michael Leon, PhD, professor emeritus, University of California, Irvine, said in an interview.
The study was published online in Frontiers of Neuroscience.
The brain’s “superhighway”
Olfactory enrichment “involves the daily exposure of individuals to multiple odorants” and has been shown in mouse models to improve memory and neurogenesis, the investigators noted.
A previous study showed that exposure to individual essential oils for 30 minutes a day over 3 months induced neurogenesis in the olfactory bulb and the hippocampus.
“The olfactory system is the only sense that has a direct ‘superhighway’ input to the memory centers areas of the brain; all the other senses have to reach those brain areas through what you might call the ‘side streets’ of the brain, and so consequently, they have much less impact on maintaining the health of those memory centers.”
When olfaction is compromised, “the memory centers of the brain start to deteriorate and, conversely, when people are given olfactory enrichment, their memory areas become larger and more functional,” he added.
Olfactory dysfunction is the first symptom of Alzheimer’s disease (AD) and is also found in virtually all neurological and psychiatric disorders.
“I’ve counted 68 of them – including anorexia, anxiety, [attention-deficit/hyperactivity disorder], depression, epilepsy, and stroke. In fact, by mid-life, your all-cause mortality can be predicted by your ability to smell things,” Dr. Leon said.
Dr. Leon and colleagues previously developed an effective treatment for autism using environmental enrichment that focused on odor stimulation, along with stimulating other senses. “We then considered the possibility that olfactory enrichment alone might improve brain function.”
Rose, orange, eucalyptus …
For the study, the researchers randomly assigned 43 older adults, aged 60-85 years, to receive either nightly exposure to essential oil scents delivered via a diffuser (n = 20; mean [SD] age, 70.1 [6.6] years) or to a sham control with only trace amounts of odorants (n = 23; mean age, 69.2 [7.1] years) for a period of 6 months.
The intervention group was exposed to a single odorant, delivered through a diffuser, for 2 hours nightly, rotating through seven pleasant aromas each week. They included rose, orange, eucalyptus, lemon, peppermint, rosemary, and lavender scents.
All participants completed a battery of tests at baseline, including the Mini-Mental State Examination (MMSE), which confirmed normal cognitive functioning. At baseline and after a 6-month follow-up, participants completed the Rey Auditory Verbal Learning Test (RAVLT) as well as three subsets of the Wechsler Adult Intelligence Scale–Third Edition (WAIS-III).
Olfactory system function was assessed using “Sniffin Sticks,” allowing the researchers to determine if olfactory enrichment enhanced olfactory performance.
Participants underwent fMRI at baseline and again at 6 months.
Brain imaging results showed a “clear, statistically significant 226% difference between enriched and control older adults in performance on the RAVLT, which evaluates learning and memory (timepoint × group interaction; F = 6.63; P = .02; Cohen’s d = 1.08; a “large effect size”).
They also found a significant change in the mean diffusivity of the left uncinate fasciculus in the enriched group compared with the controls (timepoint × group interaction; F = 4.39; P = .043; h 2 p = .101; a “medium-size effect”).
The uncinate fasciculus is a “major pathway” connecting the basolateral amygdala and the entorhinal cortex to the prefrontal cortex. This pathway deteriorates in aging and in AD and “has been suggested to play a role in mediating episodic memory, language, socio-emotional processing, and selecting among competing memories during retrieval.”
No significant differences were found between the groups in olfactory ability.
Limitations of the study include its small sample size. The investigators hope the findings will “stimulate larger scale clinical trials systematically testing the therapeutic efficacy of olfactory enrichment in treating memory loss in older adults.”
Exciting but preliminary
Commenting for this article, Donald Wilson, PhD, professor of child and adolescent psychiatry and of neuroscience and physiology, the Child Study Center, NYU Langone Medical Center, New York, said that multiple studies have “demonstrated that problems with sense of smell are associated with and sometimes can precede other symptoms for many disorders, including AD, Parkinson’s disease, and depression.”
Recent work has suggested that this relationship can be “bidirectional” – for example, losing one’s sense of smell might promote depression, while depressive disorder might lead to impaired smell, according to Dr. Wilson, also director and senior research scientist, the Emotional Brain Institute, Nathan Kline Institute for Psychiatric Research. He was not involved with the study.
This “two-way interaction” may raise the possibility that “improving olfaction could impact nonolfactory disorders.”
This paper “brings together” previous research findings to show that odors during bedtime can improve some aspects of cognitive function and circuits that are known to be important for memory and cognition – which Dr. Wilson called “a very exciting, though relatively preliminary, finding.”
A caveat is that several measures of cognitive function were assessed and only one (verbal memory) showed clear improvement.
Nevertheless, there’s “very strong interest now in the olfactory and nonolfactory aspects of odor training and this training expands the training possibilities to sleep. This could be a powerful tool for cognitive improvement and/or rescue if follow-up studies support these findings,” Dr. Wilson said.
A version of this article appeared on Medscape.com.
FROM FRONTIERS IN NEUROSCIENCE