A new predictive tool known as the Psoriatic Arthritis Risk Estimation Tool (PRESTO) is now available to help clinicians estimate the risk of psoriatic arthritis (PsA) in their patients with psoriasis.
Though it requires further validation, researchers led by rheumatologist Lihi Eder, MD, PhD, of the Women’s College Research Institute at Women’s College Hospital, Toronto, characterized the development and validation of PRESTO as “an important first step in the development and testing of interventional strategies that may ultimately halt disease progression,” they wrote in their study of the tool, which published in Arthritis & Rheumatology. Dr. Eder presented a summary of progress on the effort at the 2023 annual meeting of the Canadian Rheumatology Association.
Dr. Lihi Eder
To develop and validate the tool, the researchers evaluated 635 patients from the University of Toronto Psoriasis Cohort, which was launched in 2006 as a prospective longitudinal cohort study to examine risk factors for the development of PsA among patients with psoriasis. Patients enrolled in the cohort have a dermatologist-confirmed diagnosis of psoriasis and are assessed by a rheumatologist prior to enrollment to exclude those with inflammatory arthritis in the past or at the time of assessment.
To develop prediction models for PsA, Dr. Eder and colleagues used information from the patient cohort demographics, psoriasis characteristics, comorbidities, medications, and musculoskeletal symptoms. Next, they used multivariable logistic regression models adjusting for covariates, duration of psoriasis, and the log duration at risk to estimate the probability of developing PsA within 1-year and 5-year time windows from consecutive study visits.
The mean age of the study participants was 47 years, 76% were White, and 57% were male; and they had psoriasis for a mean of 16 years. The researchers found that 51 patients developed PsA during the 1-year follow-up, and 71 developed PsA during the 5-year follow-up. The risk of developing PsA within 1 year was associated with younger age, male sex, family history of psoriasis, back stiffness, nail pitting, joint stiffness, use of biologic medications, patient global health, and pain severity (area under the curve, 72.3).
In addition, the risk of developing PsA within 5 years was associated with morning stiffness, psoriatic nail lesions, psoriasis severity, fatigue, pain, and use of systemic non-biologic medication or phototherapy (AUC, 74.9). Calibration plots showed reasonable agreement between predicted and observed probabilities.
“Interestingly, several previously reported risk factors for PsA, such as HLA-B27, family history of PsA, uveitis, and flexural psoriasis, were not included in the risk prediction model due to their scarcity in our cohort,” the researchers wrote. “This finding may be due to immortal time bias which can complicate the development of risk prediction models for PsA. Genetic factors or their surrogates (e.g., family history of PsA) are associated with the development of PsA concurrently or shortly after the onset of psoriasis.”
They acknowledged certain limitations of the study, including its relatively small sample size and questionable generalizability of the study findings, “as most of the patients were recruited from dermatology clinics leading to overrepresentation of moderate-severe psoriasis. Therefore, PRESTO will require an external validation to assess its performance in other populations of psoriasis patients with different characteristics.”
Saakshi Khattri, MD, a board-certified dermatologist, rheumatologist, and internist at the Icahn School of Medicine at Mount Sinai, New York, who was not involved in the study and was asked to comment on the results, characterized the PRESTO tool as “an interesting step in the right direction, but it’s the first step.”
courtesy Dr. Saakshi Khattri
Dr. Saakshi Khattri
Since dermatologists are usually the first point of contact for psoriasis patients, she added, “a risk calculator can be helpful, but the question remains: When do we refer them to a rheumatologist? If the risk comes to 5%, is that a low risk that doesn’t need referral to rheumatology? I don’t think those questions have been answered here. From a rheumatology perspective, does the risk calculator help me decide when to intervene? At present, I’m not sure it does. Perhaps a higher score might make us intervene sooner if our clinical exam doesn’t show swollen or tender joints.”
Clinical exam findings and history she considers as a rheumatologist before making treatment recommendations include the following: Are there swollen and tender joints? Does the patient report morning stiffness for upwards of 30 minutes? Do they have enthesitis or dactylitis? Is there axial involvement? “Imaging can help if there isn’t anything on clinical exam and the history is compelling and/or the patient has risk factors for PsA,” she said.
The study’s finding of biologic use being associated with risk of developing PsA at year 1 but not at year 5 is “confusing,” Dr. Khattri added. “My concern is, will that now dissuade our moderate to severe psoriasis patients from using biologics to clear their psoriasis? We know that biologics are indicated for moderate to severe psoriasis. We also know psoriasis is associated with increased cardiovascular risk and there’s data to suggest that treatment with biologics with its resultant decrease in systemic inflammation can decrease cardiovascular risk.”
The study was supported by a New Investigator Grant from the Physician Services Incorporated Foundation. Dr. Eder disclosed that she is supported by the Canada Research Chair in Inflammatory Rheumatic Diseases. Dr. Khattri reported that she is a member of the advisory board for UCB, Janssen, AbbVie, Regeneron, Sanofi, Lilly, Argenx, and Arcutis. She has also received research funds from Incyte, AbbVie, Leo, Galderma, Pfizer, and Acelyrin.
Exocrine pancreatic insufficiency (EPI) may be more common in both type 1 and type 2 diabetes than is currently appreciated, a new literature review suggests.
The condition – in which the pancreas fails to produce sufficient enzymes to fully digest food – can cause gastrointestinal symptoms, including steatorrhea or other stool changes, bloating, and/or abdominal pain. The preferred test for diagnosis is a 72-hour fecal fat quantification test, but fecal elastase-1 is a less invasive and reliable alternative; values of less than 200 mcg/g indicate EPI. Treatment is pancreatic enzyme replacement therapy (PERT), taken with every meal.
EPI occurs in up to 90% of people with cystic fibrosis and chronic pancreatitis and is commonly associated with acute pancreatitis, autoimmune pancreatitis, and pancreatic cancer. However, those conditions are relatively rare compared to diabetes, yet the EPI association with diabetes is less well-studied, Dana M. Lewis, BA, points out in her review article.
While the data vary across studies, owing to differences in inclusion and exclusion criteria, the overall median prevalence of EPI was 33% among patients with type 1 diabetes (range, 14%-77.5%) and 29% among patients with type 2 diabetes (range, 16.8%-49.2%), Ms. Lewis reports in the article, which was published in Diabetes Technology and Therapeutics.
“Cumulatively, this suggests there may be significant numbers of people with diabetes with EPI who are undiagnosed. People with diabetes who present with gastrointestinal symptoms – such as steatorrhea or changes in stool, bloating, and/or abdominal pain – should be screened for EPI. Diabetes specialists, gastroenterologists, and primary care providers should be aware of the high rates of prevalence of diabetes and EPI and recommend fecal elastase-1 screening for people with diabetes and GI symptoms,” Ms. Lewis writes.
Since the publication of her article, Ms. Lewis told this news organization, “I’ve gotten feedback from multiple diabetes and general providers that they will be changing their practice as a result of this paper, by screening people with diabetes who have GI symptoms for EPI, which is wonderful to hear.”
In addition, she noted that since she began blogging about EPI and diabetes last year following her own delayed diagnosis, “I have had at least half a dozen people with diabetes tell me that they’ve since sought screening for EPI after years of GI symptoms and ended up being diagnosed with EPI as well.”
Asked to comment, Romesh Khardori, MD, PhD, said in an interview, “it would be prudent to investigate EPI and treat it when confirmed. Consultation with a gastroenterologist colleague may be helpful. Treatment is quite rewarding.”
Data limitations; and don’t forget celiac disease and gastroparesis
However, as does Ms. Lewis, Dr. Khardori points to the limitations of the current literature.
“This review suffers from the lack of uniformity amongst the studies in terms of diagnosis and documentation of exocrine pancreatic insufficiency. Many studies lack a control group to draw any meaningful conclusions. Correlations with duration of diabetes, age of onset, symptoms, and glycemic control were mostly lacking,” says Dr. Khardori, now retired but formerly professor of medicine: endocrinology and metabolism at Eastern Virginia Medical School, Norfolk.
In general, the data suggest that PERT is safe and effective for people with diabetes and that it may reduce glycemic variability. However, “there are not many studies looking at glucose outcomes in detail, and only one study that has used CGM [continuous glucose monitoring] data, so this is a big area of need for future study,” Ms. Lewis told this news organization.
Ms. Lewis also reviewed the literature on the prevalence of two other diabetes-related gastrointestinal conditions, celiac disease and gastroparesis, “because anecdotally, it seems as though diabetes care providers and people with diabetes are more aware of those as causes of GI symptoms.”
In type 1 diabetes, the prevalence of both celiac disease and gastroparesis are reported at about 5%, in contrast to the 33% for EPI. Similarly, in type 2 diabetes, the reported prevalence of these two conditions are 1.3% and 1.6%, respectively, vs. 29% for EPI.
“This suggests to me that there is likely disproportionate screening for things like celiac [disease] and gastroparesis in diabetes, and that screening for EPI when people with diabetes present with GI symptoms is warranted,” Ms. Lewis said.
However, Dr. Khardori cautioned that those conditions may also be missed, noting, “Celiac disease often is undiagnosed and gastropathy or gastroparesis may be overlooked in a busy primary care clinic where most patients with diabetes mellitus get their care.”
Ms. Lewis and Dr. Khardori have disclosed no relevant financial relationships.
A version of this article first appeared on Medscape.com.
A 45-year-old women presents for evaluation of fatigue. She has been tired for the past 6 months. She has had no problems with sleep and no other new symptoms. Her physical exam is unremarkable. Her Patient Health Questionnaire–9 score is 4. Lab results are as follows: hemoglobin, 13 g/dL; hematocrit, 39%; mean corpuscular volume, 90 fL; blood urea nitrogen, 10 mg/dL; Cr, 1.0 mg/dL; AST, 20 IU/L; ALT, 15 IU/L; ferritin, 35 mcg/mL; thyroid-stimulating hormone, 3.5 mIU/L.
What would you recommend?
A. Sertraline
B. Sleep study
C. Iron supplementation
Dr. Douglas S. Paauw
I would treat this patient with iron. Verdon and colleagues conducted a randomized, double-blind placebo-controlled trial of iron treatment in nonanemic women.1 The women who received iron had a much greater reduction in fatigue score, compared with the women who did not (P < .004). Only women with ferritin levels less than 50 mcg/L benefited. Houston and colleagues performed a systematic review of the literature of iron supplementation for fatigue and concluded that iron should be considered for treatment of fatigue in nonanemic women.2 The key number for benefit was a ferritin level less than 50 mcg/L.
Hair thinning is a common concern for many women. Does iron deficiency have a possible role in this problem? A number of studies have correlated low ferritin levels with hair loss.3 There is less clear evidence of iron treatment being effective. Hard studied 140 women with diffuse hair loss, and found 19% had iron deficiency without anemia.4 All patients with iron deficiency were treated with oral iron and in all patients hair loss ceased, and hair regrowth occurred. The target ferritin goal for treatment is greater than 40 mcg/L.5
Iron deficiency is an important trigger for restless leg syndrome (RLS). All patients who present with RLS should have ferritin checked, and appropriate evaluation for the cause of iron deficiency if ferritin levels are low. Allen and colleagues published clinical practice guidelines for iron treatment of RLS.6 The guidelines conclude that ferric carboxymaltose (1,000 mg) is effective for treating moderate to severe RLS in those with serum ferritin less than 300 mcg/L and could be used as first-line therapy for RLS in adults, with oral iron (65 mg) possibly effective in patients with ferritin levels less than 75 mcg/L.
Pearl: Think of iron as therapy for fatigue in nonanemic women with a ferritin level less than 50 mcg/L, consider a trial of iron for thinning hair in women with ferritin levels less than 50 mcg/L, and a trial of iron in those with RLS with ferritin levels less than 75 mcg/L.
Dr. Paauw is professor of medicine in the division of general internal medicine at the University of Washington, Seattle, and he serves as third-year medical student clerkship director at the University of Washington. Contact Dr. Paauw at [email protected].
The patient's history of psoriasis, along with his current skin and scalp plaque flares, symmetrical joint symptomatology, laboratory studies, and x-rays, suggest a diagnosis of symmetrical psoriatic arthritis (PsA). The rheumatologist considers ordering additional imaging to assess for subclinical enthesitis and dactylitis, and discusses treatment next steps with the patient, given inadequate control with a TNF inhibitor.
Symmetrical polyarthritis is one of the most common types of PsA and involves five or more joints in the hands, wrists, ankles, and/or feet. Among patients with PsA, 60% to 80% experience plaque psoriasis before joint-symptom onset; time to joint-symptom onset in these patients typically occurs within 10 years of a plaque psoriasis diagnosis. Involvement of DIP joints differentiates PsA from rheumatoid arthritis, as does the absence of subcutaneous nodules and a negative result for rheumatoid factor. About 30% of all people with plaque psoriasis will develop PsA, which affects an estimated 1 million people in the United States annually. Symptoms typically appear between the ages of 35 and 55 years; women are more likely than men to develop symmetrical PsA.
There are no specific diagnostic tests for PsA. Rheumatologists generally use the assessment known as the Classification Criteria for Psoriatic Arthritis, (CASPAR), which can help reveal established inflammatory articular disease through a point system based on the presence/absence of various factors. On laboratory studies, the most common characteristic abnormalities of PsA are elevated ESR and CRP levels and negative rheumatoid factor in most patients. Other abnormalities that may be present in patients with PsA include elevated serum uric acid concentration and serum immunoglobulin A, and reduced levels of circulating immune complexes. Physicians also use imaging studies, such as radiography, ultrasonography, and MRI, to help differentiate PsA from other articular diseases.
While the pathogenesis of PsA remains unclear, research has shown that disease development is associated with a complex interplay of immune-mediated inflammatory responses; genetic and environmental factors may also be involved. In addition, patients with PsA are more likely to have a high risk for comorbidities, including obesity, type 2 diabetes, hypertension, hyperlipidemia, and cardiovascular events, compared with the general population.
When patients with PsA experience both skin and joint symptoms, a multidisciplinary approach to care is advised. Multidisciplinary teams play a key role in educating patients about their treatment plans and managing their PsA symptoms. The teams also help patients determine the best approaches to exercise to help maintain current joint function, as well as helpful adjustments in daily activities that will make it easier to accommodate their disease.
Nonsteroidal anti-inflammatory drugs, whether self-prescribed or prescribed by a physician, are a common initial treatment to manage joint symptoms of PsA. Current American College of Rheumatology treatment guidelines, however, encourage early treatment with disease-modifying antirheumatic drugs (DMARDs) because approximately 40% of patients with PsA develop erosive and deforming arthritis. Several DMARDs are available, including older drugs like methotrexate, as well as newer biologic agents, such as TNF inhibitors, interleukin (IL)-17 inhibitors, IL-12/23 inhibitors, and Janus kinase inhibitors. In addition, guidelines recommend early and customized physical therapy and rehabilitation approaches for patients with PsA.
Herbert S. Diamond, MD, Professor of Medicine (retired), Temple University School of Medicine, University of Pittsburgh; Chairman, Department of Medicine Emeritus, Western Pennsylvania Hospital, Pittsburgh, PA.
Herbert S. Diamond, MD, has disclosed no relevant financial relationships.
Image Quizzes are fictional or fictionalized clinical scenarios intended to provide evidence-based educational takeaways.
The patient's history of psoriasis, along with his current skin and scalp plaque flares, symmetrical joint symptomatology, laboratory studies, and x-rays, suggest a diagnosis of symmetrical psoriatic arthritis (PsA). The rheumatologist considers ordering additional imaging to assess for subclinical enthesitis and dactylitis, and discusses treatment next steps with the patient, given inadequate control with a TNF inhibitor.
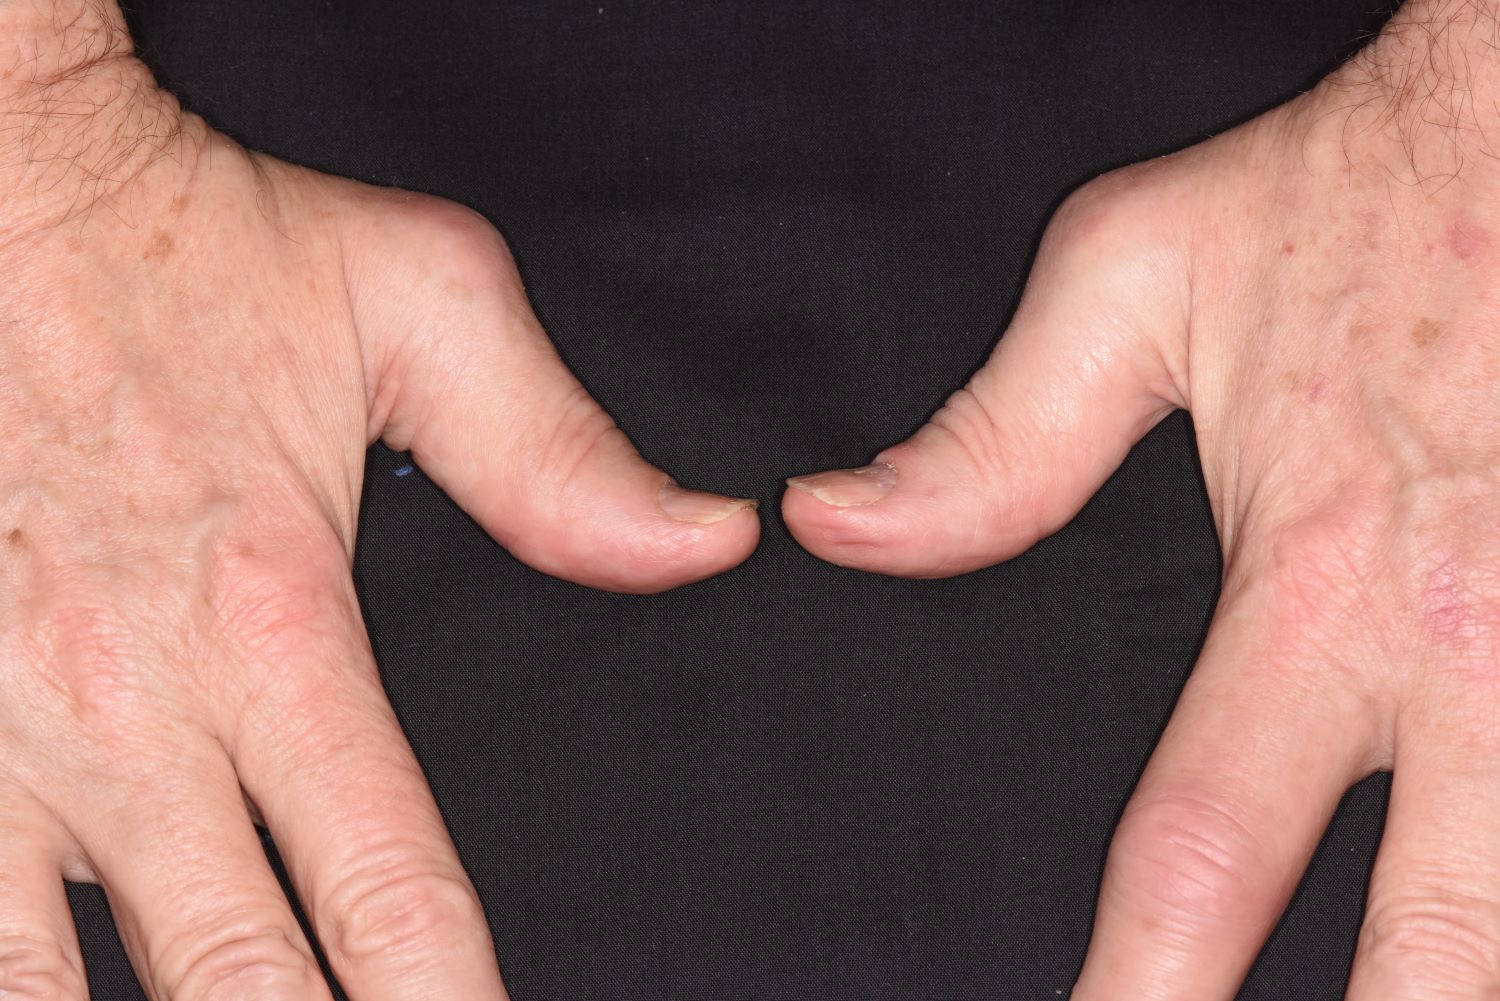
Symmetrical polyarthritis is one of the most common types of PsA and involves five or more joints in the hands, wrists, ankles, and/or feet. Among patients with PsA, 60% to 80% experience plaque psoriasis before joint-symptom onset; time to joint-symptom onset in these patients typically occurs within 10 years of a plaque psoriasis diagnosis. Involvement of DIP joints differentiates PsA from rheumatoid arthritis, as does the absence of subcutaneous nodules and a negative result for rheumatoid factor. About 30% of all people with plaque psoriasis will develop PsA, which affects an estimated 1 million people in the United States annually. Symptoms typically appear between the ages of 35 and 55 years; women are more likely than men to develop symmetrical PsA.
There are no specific diagnostic tests for PsA. Rheumatologists generally use the assessment known as the Classification Criteria for Psoriatic Arthritis, (CASPAR), which can help reveal established inflammatory articular disease through a point system based on the presence/absence of various factors. On laboratory studies, the most common characteristic abnormalities of PsA are elevated ESR and CRP levels and negative rheumatoid factor in most patients. Other abnormalities that may be present in patients with PsA include elevated serum uric acid concentration and serum immunoglobulin A, and reduced levels of circulating immune complexes. Physicians also use imaging studies, such as radiography, ultrasonography, and MRI, to help differentiate PsA from other articular diseases.
While the pathogenesis of PsA remains unclear, research has shown that disease development is associated with a complex interplay of immune-mediated inflammatory responses; genetic and environmental factors may also be involved. In addition, patients with PsA are more likely to have a high risk for comorbidities, including obesity, type 2 diabetes, hypertension, hyperlipidemia, and cardiovascular events, compared with the general population.
When patients with PsA experience both skin and joint symptoms, a multidisciplinary approach to care is advised. Multidisciplinary teams play a key role in educating patients about their treatment plans and managing their PsA symptoms. The teams also help patients determine the best approaches to exercise to help maintain current joint function, as well as helpful adjustments in daily activities that will make it easier to accommodate their disease.
Nonsteroidal anti-inflammatory drugs, whether self-prescribed or prescribed by a physician, are a common initial treatment to manage joint symptoms of PsA. Current American College of Rheumatology treatment guidelines, however, encourage early treatment with disease-modifying antirheumatic drugs (DMARDs) because approximately 40% of patients with PsA develop erosive and deforming arthritis. Several DMARDs are available, including older drugs like methotrexate, as well as newer biologic agents, such as TNF inhibitors, interleukin (IL)-17 inhibitors, IL-12/23 inhibitors, and Janus kinase inhibitors. In addition, guidelines recommend early and customized physical therapy and rehabilitation approaches for patients with PsA.
Herbert S. Diamond, MD, Professor of Medicine (retired), Temple University School of Medicine, University of Pittsburgh; Chairman, Department of Medicine Emeritus, Western Pennsylvania Hospital, Pittsburgh, PA.
Herbert S. Diamond, MD, has disclosed no relevant financial relationships.
Image Quizzes are fictional or fictionalized clinical scenarios intended to provide evidence-based educational takeaways.
A 43-year-old White man with a 5-year history of plaque psoriasis presents to a rheumatologist on referral from his dermatologist. He had been taking a tumor necrosis factor (TNF) inhibitor, which had controlled his skin and scalp plaques since diagnosis. Lately, however, some of the plaques have begun to flare up, and the patient reports new tenderness and swelling in three of the same joints on his left and right hands and extensive fatigue. Additional medical history includes type 2 diabetes, which was diagnosed 3 years ago; soon thereafter, he started taking metformin with consistent disease control. The rheumatologist conducts a physical exam and orders laboratory studies and x-rays. Results of the laboratory studies reveal elevated levels of C-reactive protein (CRP) and erythrocyte sedimentation rate (ESR). Radiographs reveal joint-space narrowing in several distal interphalangeal (DIP) joints in both hands, with mild erosive disease.
Disallow All Ads
Content Gating
No Gating (article Unlocked/Free)
Alternative CME
Disqus Comments
Default
Gate On Date
Un-Gate On Date
Consolidated Pubs: Do Not Show Source Publication Logo
Among military veterans who die by suicide, those who experience a traumatic brain injury (TBI) during service take their lives 21% sooner after deployment than those without a TBI history, a new study shows.
Investigators also found that increases in new mental health diagnoses are significantly higher in soldiers with a history of TBI – in some cases, strikingly higher. For example, cases of substance use disorder rose by 100% among veterans with TBI compared to just 14.5% in those with no brain injury.
Veterans Health Administration
Dr. Lisa Brenner
“We had had pieces of these findings for a long time but to be able to lay out this longitudinal story over time is the part that’s new and important to really switch the focus to people’s whole lives and things that happen over time, both psychological and physical,” lead author Lisa Brenner, PhD, director of the Veterans Health Administration (VHA) Rocky Mountain Mental Illness Research Education and Clinical Center, Aurora, Colo., said in an interview.
“If we take that life-course view, it’s a very different way about thinking about conceptualizing exposures and conceptualizing risk and it’s a different way of thinking about treatment and prevention,” added Dr. Brenner, professor of physical medicine and rehabilitation, psychiatry, and neurology at the University of Colorado, Aurora. “I think that definitely applies to civilian populations.”
Researchers have long suspected that TBI and a higher rate of new mental illness and a shorter time to suicide are all somehow linked. But this study examined all three components longitudinally, in what is thought to be the largest and longest study on the topic to date, including more than 860,000 people who were followed for up to a decade.
Investigators studied health data from the Substance Use and Psychological Injury Combat Study database on 860,892 U.S. Army soldiers who returned from deployment in Iraq or Afghanistan between 2008 and 2014 and were 18-24 years old at the end of that deployment. They then examined new mental health diagnoses and suicide trends over time.
Nearly 109,000 (12.6%) experienced a TBI during deployment, and 2,695 had died by suicide through the end of 2018.
New-onset diagnoses of anxiety, mood disorders, posttraumatic stress disorder, alcohol use, and substance use disorder (SUD) after deployment were all more common in soldiers who experienced PTSD while serving compared with those with no history of TBI.
There was a 67.7% increase in mood disorders in participants with TBI compared with a 37.5% increase in those without TBI. The increase in new cases of alcohol use disorder was also greater in the TBI group (a 31.9% increase vs. a 10.3% increase).
But the sharpest difference was the increase in substance use disorder among those with TBI, which rose 100% compared with a 14.5% increase in solders with no history of TBI.
Sharp differences in time to suicide
Death by suicide was only slightly more common in those with TBI compared with those without (0.4% vs. 0.3%, respectively). But those with a brain injury committed suicide 21.3% sooner than did those without a head injury, after the researchers controlled for sex, age, race, ethnicity, and fiscal year of return from deployment.
Time to suicide was faster in those with a TBI and two or more new mental health diagnoses and fastest among those with TBI and a new SUD diagnosis, who took their own lives 62.8% faster than did those without a TBI.
The findings offer an important message to medical professionals in many different specialties, Dr. Brenner said.
“Folks in mental health probably have a lot of patients who have brain injury in their practice, and they don’t know it and that’s an important thing to know,” she said, adding that “neurologists should screen for depression and other mental health conditions and make sure those people have evidence-based treatments for those mental health conditions while they’re addressing the TBI-related symptoms.”
Applicable to civilians?
“The complex interplay between TBI, its potential effects on mental health, and risk of suicide remains a vexing focus of ongoing investigations and academic inquiry,” Ross Zafonte, DO, president of Spaulding Rehabilitation Hospital Network and professor and chair of physical medicine and rehabilitation at Harvard Medical School, Boston, and colleagues, wrote in an accompanying editorial.
The study builds on earlier work, they added, and praised the study’s longitudinal design and large cohort as key to the findings. The data on increased rates of new-onset substance use disorder, which was also associated with a faster time to suicide in the TBI group, were of particular interest.
“In this work, Brenner and colleagues identified substance use disorder as a key factor in faster time to suicide for active-duty service members with a history of TBI compared with those without TBI and theorized that a multiple stress or exposure burden may enhance risk,” they wrote. “This theory is reasonable and has been postulated among individuals with medical sequelae linked to TBI.”
However, the authors caution against applying these findings in military veterans to civilians.
“While this work is critical in the military population, caution should be given to avoid direct generalization to other populations, such as athletes, for whom the linkage to suicidal ideation is less understood,” they wrote.
The study was funded by National Institute of Mental Health and Office of the Director at National Institutes of Health. Dr. Brenner has received personal fees from Wolters Kluwer, Rand, American Psychological Association, and Oxford University Press and serves as a consultant to sports leagues via her university affiliation. Dr. Zafonte reported receiving royalties from Springer/Demos; serving as a member of the editorial boards of Journal of Neurotrauma and Frontiers in Neurology and scientific advisory boards of Myomo, Nanodiagnostics, Onecare.ai, and Kisbee; and evaluating patients in the MGH Brain and Body-TRUST Program, which is funded by the National Football League Players Association.
A version of this article first appeared on Medscape.com.
Presenting obesity as a chronic medical condition, rather than as a failure to eat less and move more, may improve self-esteem among patients with obesity and enhance their relationships with their doctors, a new study suggests.
In an online study, patients with obesity reported significantly less internalized weight bias and significantly enhanced perceptions of positive communication with their medical providers after watching a video of a doctor who framed obesity as a treatable medical condition, compared with a video of a doctor who emphasized willpower.
“Recent research has identified the dominant role that biology (both genetics as well as homeostatic, hedonic, and executive brain systems) and environment, rather than willpower, play in the development of obesity and the resistance to weight loss,” wrote study authors Sara English, a medical student, and Michael Vallis, MD, associate professor of family medicine, both at Dalhousie University, Halifax, N.S. “Yet the false narrative that ideal or goal weight can be achieved by eating less and moving more using willpower continues to dominate the public narrative.”
The public discussion generally places all responsibility for the health outcomes of obesity on the patient. As a result, patients with obesity face bias and stigma from the public and the health care system, wrote the authors.
This stigmatization contributes to increased mortality and morbidity by promoting maladaptive eating behaviors and stress. It also causes mistrust of health care professionals, which, in turn, leads to worse health outcomes and increased health care costs.
The 2020 Canadian clinical practice guidelines for obesity management in adults emphasize that obesity is complex and that nonbehavioral factors strongly influence it. They recommend that treatment focus on improving patient-centered health outcomes and address the root causes of obesity, instead of focusing on weight loss alone.
In the present study, Ms. English and Dr. Vallis evaluated how presenting obesity as a treatable medical condition affected participants’ internalized weight bias and their perceived relationship with their health care provider. They asked 61 patients with obesity (average age, 49 years; average body mass index, 41 kg/m2) to watch two videos, the first showing a doctor endorsing the traditional “eat less, move more approach,” and the second showing a doctor describing obesity as a chronic, treatable medical condition.
Nearly half (49.5%) of participants reported that their health care provider rarely or never discusses weight loss, and almost two-thirds of participants (64%) reported feeling stigmatized by their health care provider because of their weight at least some of the time.
After having watched each video, participants were asked to imagine that they were being treated by the corresponding doctor and to complete two measures: the Weight Bias Internalization Scale (WBIS), which measures the degree to which a respondent believes the negative stereotypes about obese people, and the Patient-Health Care Provider Communication Scale (PHCPCS), which assesses the quality of patient–health care provider communication.
Virtually all participants preferred the care provider in the video with the revised presentation of obesity. Only one preferred the traditional video. The video with the revised presentation was associated with significant reductions in internalized weight bias. Participants’ WBIS total score decreased from 4.49 to 3.36 (P < .001). The revised narrative video also had a positive effect on patients’ perception of their health care providers. The PHCPCS total score increased from 2.65 to 4.20 (P < .001).
A chronic disease
In a comment, Yoni Freedhoff, MD, associate professor of family medicine at the University of Ottawa, said: “If you’re asking me if it is a good idea to treat obesity like a chronic disease, the answer would be yes, we absolutely should. It is a chronic disease, and it shouldn’t have a treatment paradigm different from the other chronic diseases.” Dr. Freedhoff did not participate in the study.
“We certainly don’t blame patients for having other chronic conditions,” Dr. Freedhoff added. “We don’t have a narrative that, in order for them to qualify for medication or other treatment options, they have to audition for them by failing lifestyle approaches first. And yet, I’d say at least 85% of chronic noncommunicable diseases have lifestyle factors, but obesity is the only one where we consider that there is a necessity for these lifestyle changes, as if there have been studies demonstrating durable and reproducible outcomes for lifestyle in obesity. There have not.”
Telling patients and doctors that obesity is a chronic disease driven by biology, not a failure of willpower, is going to reduce stigma, “which is what this study was able to demonstrate to some degree,” Dr. Freedhoff said.
“What is more stigmatizing? Being told that if you just try hard enough, you’ll succeed, and if you don’t succeed, the corollary, of course, is that you did not try hard enough? Versus, you’ve got a medical condition where you’ve got biological drivers beyond your locus of control, affecting behaviors that, in turn, contribute to your adiposity? I’m pretty sure the second statement will have far less impact on a person’s internalized weight bias than what we’ve unfortunately been doing up until now with the focus on willpower,” Dr. Freedhoff said.
No funding for the study was reported. Ms. English and Dr. Vallis reported no relevant financial relationships. Dr. Freedhoff reported receiving clinical grants from Novo Nordisk.
A version of this article first appeared on Medscape.com.
Yeung LK, Alschuler DM, Wall M, et al. Multivitamin supplementation improves memory in older adults: a randomized clinical trial. Am J Clin Nutrition. 2023;118:273-282. doi:10.1016/j.ajcnut.2023.05.011.
EXPERT COMMENTARY
Preservation of function, both physical and cognitive, is key to long-term health and well-being. Age-related loss of function drives millions of people to spend an enormous amount of money each year on unregulated therapies—vitamins, supplements, infusions, hormones, and “natural” products—all toward the promise of improvement or preservation of physical strength, sexual function, and maintenance of lean body mass and cognitive abilities. Yeung and colleagues set out to determine whether the daily use of a multivitamin/mineral supplement (Centrum Silver) would impact memory in older adults.1
PHOTO: KLAVDIYAV/SHUTTERSTOCK
Details of the study
The COSMOS-Web study was designed to test the authors’ primary hypothesis that daily dietary flavanols would improve memory over 1 year.1 This study was embedded within the larger COSMOS (COcoa Supplement and Multivitamin Outcomes Study) trial, in which 21,442 people were recruited to assess the impact of flavanols and multivitamin supplements on cardiovascular and cancer outcomes.
Results of another ancillary study, the COSMOS-Mind trial (n = 2,262, average age 73, 60% female), reported no improvement with flavanols compared with placebo on a battery of tests of cognitive function administered by phone. In COSMOS-Mind, however, it was concluded that a daily multivitamin/mineral supplement improved the composite score of cognitive tests compared with placebo, particularly in participants with a history of cardiovascular disease.2
The COSMOS-Web trial recruited an additional cohort within the larger COSMOS trial from 2016–2017 (n = 3,562, average age 71, 67% female) to participate in this study specifically geared to assess memory, using the web-based ModRey test (a test of memory validated for use in a nonimpaired population). To qualify for enrollment, participants had to have access to an internet-connected computer. They were randomly assigned in a 2 x 2 study design to receive a daily multivitamin supplement or placebo; each of these cohorts was further divided into a flavanol supplementation or a placebo group. Analysis of the data showed no association between flavanol use and performance on any of the measures of memory or cognitive function.3
The COSMOS-Web trial assessed episodic recall, a function of hippocampus-mediated cognition that is particularly vulnerable to the effects of aging as demonstrated previously by neuroimaging and neuropsychological studies. The authors deployed a battery of 3 tests via a web platform for patients to complete online and independently.
The prespecified primary outcome was performance on episodic recall as measured by the ModRey test after 1 year of supplementation with multivitamins versus placebo. The ModRey test presents a series of 20 words at 3-second intervals to participants. At the conclusion of the last word, participants were asked to recall as many words as they could; after completing the 2 additional tasks, participants were asked again to recall the words. A secondary outcome of this test is the ratio of delayed to immediate recall.
Two additional tests were administered to assess cognitive performance related to different brain regions, the ModBent test (assessing novel object recognition) and the Flanker task (a measure of executive function). There was a placebo run-in phase during which participants’ adherence to daily supplement intake was ascertained. Participants were excluded if they demonstrated less than 75% adherence to study pills during the run-in placebo phase. The cognitive tasks were presented at study initiation and at yearly intervals for 3 years. The authors chose to use the results at 1 year as their primary outcome to assess the impact of supplementation during the period when adherence would be highest.
Results.At baseline, the placebo cohort recalled 7.2 words of 20 compared with 7.1 in the supplement group. In both groups there was a practice effect, with improvement in scores in the placebo group to 7.65 words and in the multivitamin group to 7.81 words. The improvement from baseline was statistically significantly better (0.71 words) in the multivitamin cohort than in the placebo group (0.45 words). There was no improvement in either group in the ModRey memory retention test (ability to recall the words after 15 minutes) or in the ModBent or Flanker tests. At 3 years of treatment, the placebo group improved by 0.92 words (SD, 3.22) whereas the multivitamin group improved by 1.13 words (SD, 3.39). These changes remained statistically significant.
The group with cardiovascular disease had lower baseline performance on the ModRey test. With supplementation, however, the improvement in this cohort was significantly greater than in those without cardiovascular disease at 1 year. The authors acknowledged that the changes were small and may not have been noticeable to the individuals, but they argued that even small changes as demonstrated in this study can have large health benefits at a population level.
The results of the COSMOS-Web trial corroborate the findings of the COSMOS-Mind study with respect to the benefits of multivitamin/mineral supplementation on cognitive test performance, particularly in a population with preexisting cardiovascular disease. The tests used across the 2 studies were different, which lends greater reliability to the findings.
Study strengths and limitations
A major strength of this study is its careful, rigorous design as a double-blind, placebo-controlled trial in a large patient population. Great care was devoted to ensuring study medication adherence. Another strength is that the cognitive tests chosen for the COSMOS-Web trial have been validated in cognitively normal populations, not those already impaired.
A limitation, however, is in the demographics of the study. The patient population was overwhelmingly White (93%), 67% were female, and they were well educated (94.8% having completed some college or beyond). Their baseline health was good; only 4.7% had a history of cardiovascular disease. Although generalizability of the study results from this population may be concerning,relative benefits of supplementation in this healthy, generally well-nourished and educated group may be lower than might be expected in a more nutritionally and educationally challenged population.
Finally, the difference between the placebo and active supplementation groups was small. Whether this less-than-1-word difference in immediate memory recall is noticeable by a patient is questionable. Both groups improved in their test performance over time—a consequence of serial cognitive tests of any kind. Although the authors calculated that the difference in recall translates to a 3-year reduction in age-related memory decline, it is hard to reconcile that with the fact that both groups actually improved over the 3 years of the study. ●
Acknowledgement
The author would like to thank JoAnn Manson, MD, DrPH, NCMP, for her assistance in evaluating the study.
WHAT THIS EVIDENCE MEANS FOR PRACTICE
In this well-designed, randomized controlled trial by Yeung and colleagues, multivitamin/mineral supplementation improved performance on a test of immediate episodic memory at 1, 2, and 3 years compared with placebo. Given the simplicity and safety of this intervention, even with a small effect size, it makes sense to advise older patients that daily multivitamin use provides micronutrients and vitamins that may be absent in the diet or poorly absorbed by older adults. Whether this highly specific improvement in a test of hippocampal function translates into overall cognitive performance with aging remains a question.
BARBARA LEVY, MD
References
Yeung LK, Alschuler DM, Wall M, et al. Multivitamin supplementation improves memory in older adults: a randomized clinical trial. Am J Clin Nutrition. 2023;118:273282. doi:10.1016/j.ajcnut.2023.05.011.
Baker LD, Manson JE, Rapp SR, et al. Effects of cocoa extract and a multivitamin on cognitive function: a randomized clinical trial. Alzheimers Dement. 2023;19:1308-1319. doi:10.1002/alz.12767.
Brickman AM, Yeung LK, Alshuler DM, et al. Dietary flavanols restore hippocampal-dependent memory in older adults with lower diet quality and lower habitual flavanol consumption. Proc Natl Acad Sci USA. 2023:120:e2216932120. doi:10.1073/ pnas.2216932120.
Barbara Levy, MD, is Clinical Professor of Obstetrics and Gynecology, George Washington University School of Medicine and Health Sciences, Washington, DC, and Voluntary Clinical Professor of Obstetrics, Gynecology and Reproductive Sciences, UC San Diego School of Medicine. She serves on the OBG Management Board of Editors.
The author reports no financial relationships relevant to this article.
Author and Disclosure Information
Barbara Levy, MD, is Clinical Professor of Obstetrics and Gynecology, George Washington University School of Medicine and Health Sciences, Washington, DC, and Voluntary Clinical Professor of Obstetrics, Gynecology and Reproductive Sciences, UC San Diego School of Medicine. She serves on the OBG Management Board of Editors.
The author reports no financial relationships relevant to this article.
Yeung LK, Alschuler DM, Wall M, et al. Multivitamin supplementation improves memory in older adults: a randomized clinical trial. Am J Clin Nutrition. 2023;118:273-282. doi:10.1016/j.ajcnut.2023.05.011.
EXPERT COMMENTARY
Preservation of function, both physical and cognitive, is key to long-term health and well-being. Age-related loss of function drives millions of people to spend an enormous amount of money each year on unregulated therapies—vitamins, supplements, infusions, hormones, and “natural” products—all toward the promise of improvement or preservation of physical strength, sexual function, and maintenance of lean body mass and cognitive abilities. Yeung and colleagues set out to determine whether the daily use of a multivitamin/mineral supplement (Centrum Silver) would impact memory in older adults.1
PHOTO: KLAVDIYAV/SHUTTERSTOCK
Details of the study
The COSMOS-Web study was designed to test the authors’ primary hypothesis that daily dietary flavanols would improve memory over 1 year.1 This study was embedded within the larger COSMOS (COcoa Supplement and Multivitamin Outcomes Study) trial, in which 21,442 people were recruited to assess the impact of flavanols and multivitamin supplements on cardiovascular and cancer outcomes.
Results of another ancillary study, the COSMOS-Mind trial (n = 2,262, average age 73, 60% female), reported no improvement with flavanols compared with placebo on a battery of tests of cognitive function administered by phone. In COSMOS-Mind, however, it was concluded that a daily multivitamin/mineral supplement improved the composite score of cognitive tests compared with placebo, particularly in participants with a history of cardiovascular disease.2
The COSMOS-Web trial recruited an additional cohort within the larger COSMOS trial from 2016–2017 (n = 3,562, average age 71, 67% female) to participate in this study specifically geared to assess memory, using the web-based ModRey test (a test of memory validated for use in a nonimpaired population). To qualify for enrollment, participants had to have access to an internet-connected computer. They were randomly assigned in a 2 x 2 study design to receive a daily multivitamin supplement or placebo; each of these cohorts was further divided into a flavanol supplementation or a placebo group. Analysis of the data showed no association between flavanol use and performance on any of the measures of memory or cognitive function.3
The COSMOS-Web trial assessed episodic recall, a function of hippocampus-mediated cognition that is particularly vulnerable to the effects of aging as demonstrated previously by neuroimaging and neuropsychological studies. The authors deployed a battery of 3 tests via a web platform for patients to complete online and independently.
The prespecified primary outcome was performance on episodic recall as measured by the ModRey test after 1 year of supplementation with multivitamins versus placebo. The ModRey test presents a series of 20 words at 3-second intervals to participants. At the conclusion of the last word, participants were asked to recall as many words as they could; after completing the 2 additional tasks, participants were asked again to recall the words. A secondary outcome of this test is the ratio of delayed to immediate recall.
Two additional tests were administered to assess cognitive performance related to different brain regions, the ModBent test (assessing novel object recognition) and the Flanker task (a measure of executive function). There was a placebo run-in phase during which participants’ adherence to daily supplement intake was ascertained. Participants were excluded if they demonstrated less than 75% adherence to study pills during the run-in placebo phase. The cognitive tasks were presented at study initiation and at yearly intervals for 3 years. The authors chose to use the results at 1 year as their primary outcome to assess the impact of supplementation during the period when adherence would be highest.
Results.At baseline, the placebo cohort recalled 7.2 words of 20 compared with 7.1 in the supplement group. In both groups there was a practice effect, with improvement in scores in the placebo group to 7.65 words and in the multivitamin group to 7.81 words. The improvement from baseline was statistically significantly better (0.71 words) in the multivitamin cohort than in the placebo group (0.45 words). There was no improvement in either group in the ModRey memory retention test (ability to recall the words after 15 minutes) or in the ModBent or Flanker tests. At 3 years of treatment, the placebo group improved by 0.92 words (SD, 3.22) whereas the multivitamin group improved by 1.13 words (SD, 3.39). These changes remained statistically significant.
The group with cardiovascular disease had lower baseline performance on the ModRey test. With supplementation, however, the improvement in this cohort was significantly greater than in those without cardiovascular disease at 1 year. The authors acknowledged that the changes were small and may not have been noticeable to the individuals, but they argued that even small changes as demonstrated in this study can have large health benefits at a population level.
The results of the COSMOS-Web trial corroborate the findings of the COSMOS-Mind study with respect to the benefits of multivitamin/mineral supplementation on cognitive test performance, particularly in a population with preexisting cardiovascular disease. The tests used across the 2 studies were different, which lends greater reliability to the findings.
Study strengths and limitations
A major strength of this study is its careful, rigorous design as a double-blind, placebo-controlled trial in a large patient population. Great care was devoted to ensuring study medication adherence. Another strength is that the cognitive tests chosen for the COSMOS-Web trial have been validated in cognitively normal populations, not those already impaired.
A limitation, however, is in the demographics of the study. The patient population was overwhelmingly White (93%), 67% were female, and they were well educated (94.8% having completed some college or beyond). Their baseline health was good; only 4.7% had a history of cardiovascular disease. Although generalizability of the study results from this population may be concerning,relative benefits of supplementation in this healthy, generally well-nourished and educated group may be lower than might be expected in a more nutritionally and educationally challenged population.
Finally, the difference between the placebo and active supplementation groups was small. Whether this less-than-1-word difference in immediate memory recall is noticeable by a patient is questionable. Both groups improved in their test performance over time—a consequence of serial cognitive tests of any kind. Although the authors calculated that the difference in recall translates to a 3-year reduction in age-related memory decline, it is hard to reconcile that with the fact that both groups actually improved over the 3 years of the study. ●
Acknowledgement
The author would like to thank JoAnn Manson, MD, DrPH, NCMP, for her assistance in evaluating the study.
WHAT THIS EVIDENCE MEANS FOR PRACTICE
In this well-designed, randomized controlled trial by Yeung and colleagues, multivitamin/mineral supplementation improved performance on a test of immediate episodic memory at 1, 2, and 3 years compared with placebo. Given the simplicity and safety of this intervention, even with a small effect size, it makes sense to advise older patients that daily multivitamin use provides micronutrients and vitamins that may be absent in the diet or poorly absorbed by older adults. Whether this highly specific improvement in a test of hippocampal function translates into overall cognitive performance with aging remains a question.
BARBARA LEVY, MD
References
Yeung LK, Alschuler DM, Wall M, et al. Multivitamin supplementation improves memory in older adults: a randomized clinical trial. Am J Clin Nutrition. 2023;118:273282. doi:10.1016/j.ajcnut.2023.05.011.
Baker LD, Manson JE, Rapp SR, et al. Effects of cocoa extract and a multivitamin on cognitive function: a randomized clinical trial. Alzheimers Dement. 2023;19:1308-1319. doi:10.1002/alz.12767.
Brickman AM, Yeung LK, Alshuler DM, et al. Dietary flavanols restore hippocampal-dependent memory in older adults with lower diet quality and lower habitual flavanol consumption. Proc Natl Acad Sci USA. 2023:120:e2216932120. doi:10.1073/ pnas.2216932120.
Given the patient's diagnosis of stage IV MCL, the presentation of diffuse skin lesions, and the histopathologic and immunophenotyping results of those lesions, this patient is diagnosed with secondary cutaneous MCL. The hematologist-oncologist discusses the findings with the patient and presents potential next steps and treatment options.
MCL is a type of B-cell neoplasm that, with advancements in the understanding of non-Hodgkin lymphoma (NHL) in the past 30 years, has been defined as its own clinicopathologic entity by the Revised European-American Lymphoma and World Health Organization classifications. Up to 10% of all NHLs are MCL. Clinical presentation includes advanced disease with B symptoms (eg, night sweats, fever, weight loss), generalized lymphadenopathy, abdominal distention associated with hepatosplenomegaly, and fatigue. Skin manifestations are not as common as other extranodal manifestations. Primary cutaneous MCL occurs in up to 6% of patients with MCL; secondary cutaneous involvement is slightly more common, occurring in 17% of patients with MCL. Secondary cutaneous MCL usually presents in late-stage disease. Men are more likely to present with MCL than are women by a ratio of 3:1. Median age at presentation is 67 years.
Diagnosing MCL is a multipronged approach. Physical examination may reveal lymphadenopathy and hepatosplenomegaly. Lymph node biopsy and aspiration with immunophenotyping in MCL reveals monoclonal B cells expressing surface immunoglobulin (Ig), IgM, or IgD, that are characteristically CD5+ and pan B-cell antigen–positive (eg, CD19, CD20, CD22) but lack expression of CD10 and CD23 and overexpress cyclin D1. Bone marrow aspirate/biopsy are used more for staging than for diagnosis. Blood studies, including anemia and cytopenias secondary to bone marrow infiltration (with up to 40% of cases showing lymphocytosis > 4000/μL), abnormal liver function tests, and a negative Coombs test also help diagnose MCL. Secondary cutaneous MCL is diagnosed on the basis of an MCL diagnosis along with diffuse infiltration of the skin, with multiple erythematous papules and nodules coalescing to form plaques; skin biopsy and immunohistopathology showing monotonous proliferation of small- to medium-sized lymphoid cells with scant cytoplasm; irregular cleaved nuclei with coarse chromatin; and inconspicuous nucleoli as well as a spared papillary dermis.
Pathogenesis of MCL involves disordered lymphoproliferation in a subset of naive pregerminal center cells in primary follicles or in the mantle region of secondary follicles. Most cases are linked with translocation of chromosome 14 and 11, which induces overexpression of protein cyclin D1. Viral infection (Epstein-Barr virus, HIV, human T-lymphotropic virus type 1, human herpes virus 6), environmental factors, and primary and secondary immunodeficiency are also associated with the development of NHL.
Patient education should include detailed information about clinical trials, available treatment options, and associated adverse events as well as psychosocial and nutrition counseling.
Chemoimmunotherapy is standard initial treatment for MCL, but relapse is expected. Chemotherapy-free regimens with biologic targets, which were once used in second-line treatment, have increasingly become an important first-line treatment given their efficacy in the relapsed/refractory setting. Chimeric antigen receptor T-cell therapy is also a second-line treatment option. In patients with MCL and a TP53 mutation, clinical trial participation is encouraged because of poor prognosis.
Timothy J. Voorhees, MD, MSCR, Assistant Professor of Internal Medicine - Clinical, Division of Hematology, The Ohio State University James Comprehensive Cancer Center, Columbus, OH.
Timothy J. Voorhees, MD, MSCR, has disclosed the following relevant financial relationships: Received research grants from: AstraZeneca; Morphosys; Incyte; Recordati.
Image Quizzes are fictional or fictionalized clinical scenarios intended to provide evidence-based educational takeaways.
A 72-year-old man presents to his hematologist-oncologist with red ulcerative nodules on both legs. Six months before, the patient was diagnosed with stage IV mantle cell lymphoma (MCL) and began chemotherapy with rituximab, cyclophosphamide, doxorubicin, vincristine, and prednisone (R-CHOP). Initial patient reports at diagnosis were abdominal distention, generalized lymphadenopathy, night sweats, and fatigue; he received a referral to hematology-oncology after his complete blood count with differential revealed anemia and cytopenias. Additional blood studies showed lymphocytosis > 4000/μL, elevated lactate dehydrogenase levels, abnormal liver function tests, and a negative result on the Coombs test. Ultrasound of the abdomen revealed hepatosplenomegaly and abdominal lymphadenopathy. The hematologist-oncologist ordered a lymph node biopsy and aspiration. Immunophenotyping showed CD5 and CD20 expression but a lack of CD23 and CD10 expression; cyclin D1 was overexpressed. Bone marrow biopsy revealed hypercellular marrow spaces showing infiltration by sheets of atypical lymphoid cells.
Because the patient presents with red ulcerative nodules on both legs, the hematologist-oncologist orders a skin biopsy of the lesions. Histopathologic evaluation shows monotonous proliferation of small- to medium-sized lymphoid cells with scant cytoplasm, irregular cleaved nuclei with coarse chromatin, and inconspicuous nucleoli as well as a spared papillary dermis. Immunophenotyping shows CD5 and CD20 expression but a lack of CD23 and CD10 expression; cyclin D1 is overexpressed.
Disallow All Ads
Content Gating
No Gating (article Unlocked/Free)
Alternative CME
Disqus Comments
Default
Gate On Date
Un-Gate On Date
Consolidated Pubs: Do Not Show Source Publication Logo
Just one in five American adults with opioid use disorder (OUD) in 2021 received medication for the condition, a new study shows.
Using data from the 2021 National Survey on Drug Use and Health (NSDUH), investigators found that of the 2.5 million adults with OUD in that year, 35.6% received some kind of substance abuse treatment, but only 22.3% received recommended medications for the condition, such as methadone, buprenorphine, or extended-release naltrexone.
“More than 80,000 people are dying of a drug overdose involving an opioid every year, while safe and effective medicines to treat opioid use disorder are sitting on the shelf unused,” senior author Wilson Compton, MD, MPE, deputy director of the National Institute on Drug Abuse (NIDA), said in a statement. “This study adds to the growing evidence that telehealth services are an important strategy that could help us bridge this gap, supporting the delivery of safe, effective, and lifesaving care for people with opioid use disorder.”
The findings were published online as a research letter in JAMA Network Open.
The study included 47,291 adults aged 18 years or older in the 2021 NSDUH, which provides nationally representative data of the U.S. civilian, noninstitutionalized population based on past-year OUD.
Men, people aged 35 years or older, urban residents, and non-Hispanic Whites were the most likely to receive medication for opioid use disorder (MOUD). MOUD use was more common among those who received substance use treatment via telehealth, those with severe OUD, and people with annual incomes below $50,000.
Black people, women, unemployed individuals, those living in rural areas, and people with past-year cannabis use disorder were less likely to receive MOUD.
“It is not a matter of whether we should address health disparities and inequities that many racial/ethnic minority groups face when trying to access substance use treatment,” lead author Christopher M. Jones, PharmD, MPH, DrPH, director of the National Center for Injury Prevention and Control in the Centers for Disease Control and Prevention, said in a statement. “We must address these issues if we hope to reverse the trend of increasing drug overdose deaths.”
The study was funded by the Centers for Disease Control and Prevention and the National Institutes of Health. Dr. Compton reported long-term stock holdings in General Electric, 3M Companies, and Pfizer outside the submitted work.
A version of this article first appeared on Medscape.com.
The patient's history, symptomatology, and assessments suggest a diagnosis of nonalcoholic fatty liver disease (NAFLD). The primary care physician recommends referral to a hepatologist for evaluation and possible liver biopsy.
NAFLD involves an accumulation of triglycerides and other fats in the liver (unrelated to alcohol consumption and other liver disease), with the presence of hepatic steatosis in more than 5% of hepatocytes. NAFLD affects 25% to 35% of the general population, making it the most common cause of chronic liver disease. The rate increases among patients with obesity, 80% of whom are affected by NAFLD.
NAFLD should be considered in patients with unexplained elevations in serum aminotransferases (without positive viral markers or autoantibodies and no history of alcohol use) and a high risk for steatohepatitis, including obesity. The standard NAFLD assessment for biopsy specimens is the Brunt system, and disease stage is determined using the NAFLD activity score and the amount of fibrosis present.
A study of the natural history of NAFLD in patients who were followed for 3 years showed that without pharmacologic intervention, one third experienced disease progression, one third remained stable, and one third improved. An independent risk factor for progression of nonalcoholic steatohepatitis was abnormal glucose tolerance testing. In another natural history study, a 10% higher rate of mortality over 10 years was demonstrated among those with NAFLD vs controls, with the top three causes of death being cancer, heart disease, and liver-related disease. Prevalence of chronic liver disease and cirrhosis has been shown to be elevated in Latino and Japanese American populations.
Patients with NAFLD should be seen regularly to assess for disease progression and receive guidance on weight management interventions and exercise. A weight loss of more than 5% has been shown to reduce liver fat and provide cardiometabolic benefits; a weight reduction of more than 10% can help reverse steatohepatitis or liver fibrosis. In addition to weight loss management strategies, physicians should discuss the importance of controlling hyperlipidemia, insulin resistance, and T2D with their patients and share the importance of avoiding alcohol and other hepatotoxic substances.
According to the American Association of Clinical Endocrinology Clinical Practice Guideline: "There are no U.S. Food and Drug Administration-approved medications for the treatment of NAFLD; however, some diabetes and anti-obesity medications can be beneficial. Bariatric surgery is also effective for weight loss and reducing liver fat in persons with severe obesity."
Courtney Whittle, MD, MSW, Diplomate of ABOM, Pediatric Lead, Obesity Champion, TSPMG, Weight A Minute Clinic, Atlanta, Georgia.
Courtney Whittle, MD, MSW, Diplomate of ABOM, has disclosed no relevant financial relationships.
Image Quizzes are fictional or fictionalized clinical scenarios intended to provide evidence-based educational takeaways.
Author and Disclosure Information
Reviewed by Courtney Whittle, MD, MSW, Diplomate of ABOM
Reviewed by Courtney Whittle, MD, MSW, Diplomate of ABOM
Author and Disclosure Information
Reviewed by Courtney Whittle, MD, MSW, Diplomate of ABOM
The patient's history, symptomatology, and assessments suggest a diagnosis of nonalcoholic fatty liver disease (NAFLD). The primary care physician recommends referral to a hepatologist for evaluation and possible liver biopsy.
NAFLD involves an accumulation of triglycerides and other fats in the liver (unrelated to alcohol consumption and other liver disease), with the presence of hepatic steatosis in more than 5% of hepatocytes. NAFLD affects 25% to 35% of the general population, making it the most common cause of chronic liver disease. The rate increases among patients with obesity, 80% of whom are affected by NAFLD.
NAFLD should be considered in patients with unexplained elevations in serum aminotransferases (without positive viral markers or autoantibodies and no history of alcohol use) and a high risk for steatohepatitis, including obesity. The standard NAFLD assessment for biopsy specimens is the Brunt system, and disease stage is determined using the NAFLD activity score and the amount of fibrosis present.
A study of the natural history of NAFLD in patients who were followed for 3 years showed that without pharmacologic intervention, one third experienced disease progression, one third remained stable, and one third improved. An independent risk factor for progression of nonalcoholic steatohepatitis was abnormal glucose tolerance testing. In another natural history study, a 10% higher rate of mortality over 10 years was demonstrated among those with NAFLD vs controls, with the top three causes of death being cancer, heart disease, and liver-related disease. Prevalence of chronic liver disease and cirrhosis has been shown to be elevated in Latino and Japanese American populations.
Patients with NAFLD should be seen regularly to assess for disease progression and receive guidance on weight management interventions and exercise. A weight loss of more than 5% has been shown to reduce liver fat and provide cardiometabolic benefits; a weight reduction of more than 10% can help reverse steatohepatitis or liver fibrosis. In addition to weight loss management strategies, physicians should discuss the importance of controlling hyperlipidemia, insulin resistance, and T2D with their patients and share the importance of avoiding alcohol and other hepatotoxic substances.
According to the American Association of Clinical Endocrinology Clinical Practice Guideline: "There are no U.S. Food and Drug Administration-approved medications for the treatment of NAFLD; however, some diabetes and anti-obesity medications can be beneficial. Bariatric surgery is also effective for weight loss and reducing liver fat in persons with severe obesity."
Courtney Whittle, MD, MSW, Diplomate of ABOM, Pediatric Lead, Obesity Champion, TSPMG, Weight A Minute Clinic, Atlanta, Georgia.
Courtney Whittle, MD, MSW, Diplomate of ABOM, has disclosed no relevant financial relationships.
Image Quizzes are fictional or fictionalized clinical scenarios intended to provide evidence-based educational takeaways.
Simon Fraser/Freeman Hospital, Newcastle upon Tyne / Science Source
A 51-year-old Hispanic man presents to his primary care physician with fatigue and pain in the upper right abdomen. Physical exam reveals ascites and splenomegaly. His height is 5 ft 8 in and weight is 274 lb; his BMI is 41.7. For the past 5 years, the patient has seen his physician for routine annual exams, during which time he has consistently met the criteria for World Health Organization Class 3 overweight (BMI ≥ 40) and has taken metformin, with varying degrees of adherence, for type 2 diabetes (T2D). Now, given the patient's symptoms and the potential for uncontrolled diabetes, the physician orders laboratory studies and viral serologies for hepatitis. Results of these assessments exclude viral infection but demonstrate abnormal levels of fasting insulin and glucose, hypertriglyceridemia, and elevated transaminase levels that are sixfold above normal levels, with an aspartate aminotransferase-to-alanine transaminase ratio < 1:1.
Disallow All Ads
Content Gating
No Gating (article Unlocked/Free)
Alternative CME
Disqus Comments
Default
Gate On Date
Un-Gate On Date
Consolidated Pubs: Do Not Show Source Publication Logo