User login
4 technology tools ObGyns can apply in practice
Over the past 15 years a technological tsunami has swept through the health care industry, and few physicians were prepared for the changes wrought by this tidal wave. It now is clear, however, that we are and will have to continue to navigate a future increasingly powered and populated by technology if we are to be successful clinicians. In addition, we must learn to take advantage of all that technology has to offer without compromising the quality of care and compassion we offer our patients. We are fortunate that technology has much to offer to enhance patient care.
One big change under way: Technology is leveling the playing field between doctors—once the high priests of medicine—and ordinary people. SMART (social, mobile, aware, and real-time) technologies such as cloud computing will broaden the setting of health care interventions from hospital rooms and doctors’ offices to patients’ everyday lives. Cloud computing involves the use of a network of remote servers hosted on the Internet to store, manage, and process data, rather than a local server or a desktop computer located in the doctor’s office. It is possible that, instead of being episodic, health care will be conducted continuously—and anywhere the patient wants it.
Without a doubt, the pace at which new technology affects our lives is increasing at lightning speeds. Today, 29% of Americans say their phone is the first and the last thing they look at each day, a telling sign of how dependent we are becoming on technology.1 In this article, we look at 4 technologies that can be effective in the clinical setting, attracting new patients and enhancing productivity, communication, and patient care.
1. A mobile-friendly Web site
According to Wikipedia, there are 327,577,529 mobile phones in the United States, give or take a few thousand. As of July 4, 2014, the US population was 318,881,992. That means there are more mobile phones in this country than there are people!2
Mobile phones are becoming more like personal assistants than phones. People are not just making calls, they’re buying movie tickets, checking the weather, sending and receiving emails, texting, making reservations, checking Web sites … and the list goes on.
According to a recent report from the Pew Research Center, almost two-thirds of Americans own a smartphone, and 62% of smartphone owners have used it to look up information on a health condition.3 Moreover, 15% of smartphone owners say they have a limited number of ways to access the Internet other than their cell phone.3
All the more reason for your Web site to be mobile-friendly. With a mobile- friendly site, the content is displayed in a more streamlined fashion on mobile phones, with larger type to make it more readable. See, for example, the FIGURE, which shows Dr. Baum’s regular Web site side by side with the mobile-friendly view.

There is another reason why you should ensure that your site is mobile-friendly: Google recently changed its algorithms so that, when someone searches for information on a mobile phone, only mobile- friendly sites make it into the top search results. Google wants mobile phone users to have a positive experience online. It is so adamant about this desire that it will lower your rankings or not show your Web site at all in search results if you fail to comply.
New patient acquisition is critical for any ObGyn practice, and we already know that just about everyone goes online to search for health information and solutions to their medical problems. If you want your practice to survive and thrive, you need to attract new patients online. If a visitor to your site cannot read the text and has to keep resizing the screen and scrolling left and right, you will lose that visitor in a hurry.
We all want to find what we are looking for quickly. In our experience, when we check Google Analytics reports for our ObGyn clients, we find that visitors to a nonresponsive site spend much less time there and do not visit as many pages as they do when a site is mobile-responsive.
To check your Web site’s mobile rating, go to http://www.google.com/webmasters/tools/mobile-friendly. Google also offers tips on making your site mobile-friendly at https://support.google.com/webmasters/answer/6001177?hl=en.
Once your site is up to snuff, you should test it from multiple devices to ensure that the pages are easily readable on all types of phones and computers.
2. Voice recognition software
Speech recognition is the ability of a machine or program to identify words and phrases in spoken language and convert them to a digital format. This tool can help you generate clinical notes and charting without having to stop and type into a computer. This can enhance your interactions with patients by freeing you from the computer during examinations and counseling and allows you to look at the patient and not at the computer.
According to data from June 2000, approximately 5% of physicians used speech recognition to generate text in their offices.4 A white paper from 2008 found that approximately 20% of physicians are using more advanced, more reliable voice recognition technology and saving both time and money.5 This report cited 2007 data showing that:
- 76% of clinicians who used “desktop speech recognition” (directly controlling an electronic health record [EHR] system via speech) reported faster turnaround time, better patient care, and quicker reimbursement
- Nearly 30% reported lower costs and increased productivity as benefits. The lower costs arise from reduced transcription and overhead expenses associated with billings and collection.5
The voice recognition software used in Dr. Neil Baum’s office is Dragon Medical Practice Edition 2 (www.dragonmedicalpractice.com). Dragon requires a good processor and a minimum of 4 gigabytes of RAM and will run with VMware, Boot Camp, Parallels, and other programs for Mac users. The software contains 80 subspecialty medical vocabularies and is easy to install. After a few minutes, the program learns how you speak and will understand you well with remarkable accuracy. However, to get the greatest benefit from the technology, you will need to invest in training, implementation, and workflow services to allow you to use the program to its full potential in record time.
Dr. Baum uses The Dragon People voice recognition software (www.thedragonpeople.com).
Although voice recognition software can reduce or eliminate transcription costs, improve documentation time, and boost the quality of medical notes, it is critical that you investigate how a particular program fits with your EHR prior to purchasing it—and a salesperson may try to gloss over this issue. In addition, the more you use voice recognition instead of checking off pull-down boxes for your clinical notes, the more difficult it will be to mine your data for quality metrics and pay-for-performance information. For that reason, voice recognition technology may be strongly discouraged by your employer or governing organization.
3. Online lab result reporting
TeleVox’s automated lab results (www .televox.com/lab-test-results-delivery) allow physicians or staff to assign lab result messages quickly and easily with the click of a mouse. Patients call an 800 number or use an Internet connection to retrieve their results, using a unique PIN to ensure privacy.
Practices that implement this technology see immediate improvements in 3 areas:
- Streamlined operations. This technology allows lab result messages to be assigned to patients with a few mouse clicks, saving time spent on phone calls and mailing coordination.
- Reduced costs. Automated lab result reporting reduces staff labor and mailing costs.
- Ease of access. Patients have round-the-clock access to their information—no more waiting for mail delivery or a phone call. Patients also can choose to be notified when their results are ready, which helps alleviate anxiety.
4. Automated wait-time notification
The most common complaint patients have about their health care experience is the excessive wait times they often experience. Now there are technologies that can provide automated information to let patients know how long they will have to wait to be seen.
A program such as MedWaitTime (www.medwaittime.com) can alert patients about the estimated wait time at a cost of approximately $50 per month per physician. Patients access the service for free.
In addition, many EHRs include practice management features to notify the staff and physician whether he or she is on time. These features may include a tie-in to alert patients as well.
The bottom line
Carefully selected technological tools have much to offer busy clinicians. By ensuring that your practice Web site is mobile- friendly, you stand to attract new patients. And the time you save with voice recognition software and computerized lab test result notification can allow you to spend more time with your patients. It can also help eliminate the lag in your patient schedule, keeping the women in your waiting room happy. Remember, a happy patient means a happy doctor!
Share your thoughts! Send your Letter to the Editor to [email protected]. Please include your name and the city and state in which you practice.
- Your Wireless Life: Results of TIME’s Mobility Poll. http://content.time.com/time/interactive/0,31813,2122187,00.html. Accessed July 29, 2015.
- Wikipedia: List of Countries by Number of Mobile Phones in Use. https://en.wikipedia.org/wiki/List_of_countries_by_number_of_mobile_phones_in_use. Accessed July 29, 2015.
- Smith A. US Smartphone Use in 2015. Pew Research Center. http://www.pewinternet.org/2015/04/01/us-smartphone-use-in-2015. Published April 1, 2015. Accessed July 29, 2015.
- Maisel JM, Wisnicki HJ. Documenting the medical encounter with speech recognition. Ophthalmol Times. 2002;27(5):38.
- Nuance Communications. Speech recognition: accelerating the adoption of electronic medical records. http://www.nuance.com/healthcare/pdf/wp_healthcareMDEMRadopt.pdf. Published 2008. Accessed July 30, 2015.
Ron Romano and Neil H. Baum, MD

Mr. Romano is President of www.YourInternetDoctor.com and CEO of Instant Marketing Systems. He co-authored The Internet Survival Guide for Doctors (2014, Instant Marketing Systems) and No B.S. Direct Marketing (2006, Entrepreneur Press) and contributed to the Walking with the Wise series (2004, Mentors Publishing). He is an Internet marketing consultant, speaker, and creator of “The Implementation Blueprint System.”

Dr. Baum practices urology in New Orleans, Louisiana. He is Associate Clinical Professor of Urology at Tulane Medical School and Louisiana State University School of Medicine, both in New Orleans. He is also on the medical staff at Touro Infirmary in New Orleans, and East Jefferson General Hospital in Metairie, Louisiana. He is the author of several books, including Social Media for the Healthcare Professional (2012, Greenbranch) and Marketing Your Clinical Practice: Ethically, Effectively, Economically (4th edition, 2009; Jones & Bartlett).Dr. Baum is a Contributing Editor for OBG Management.
Mr. Romano reports that he is CEO of Instant Marketing Systems, which provides consulting advice, marketing plans, and Internet marketing services for businesses and medical practices. Dr. Baum reports no financial relationships relevant to
this article.
Ron Romano and Neil H. Baum, MD
Mr. Romano is President of www.YourInternetDoctor.com and CEO of Instant Marketing Systems. He co-authored The Internet Survival Guide for Doctors (2014, Instant Marketing Systems) and No B.S. Direct Marketing (2006, Entrepreneur Press) and contributed to the Walking with the Wise series (2004, Mentors Publishing). He is an Internet marketing consultant, speaker, and creator of “The Implementation Blueprint System.”
Dr. Baum practices urology in New Orleans, Louisiana. He is Associate Clinical Professor of Urology at Tulane Medical School and Louisiana State University School of Medicine, both in New Orleans. He is also on the medical staff at Touro Infirmary in New Orleans, and East Jefferson General Hospital in Metairie, Louisiana. He is the author of several books, including Social Media for the Healthcare Professional (2012, Greenbranch) and Marketing Your Clinical Practice: Ethically, Effectively, Economically (4th edition, 2009; Jones & Bartlett).Dr. Baum is a Contributing Editor for OBG Management.
Mr. Romano reports that he is CEO of Instant Marketing Systems, which provides consulting advice, marketing plans, and Internet marketing services for businesses and medical practices. Dr. Baum reports no financial relationships relevant to
this article.
Over the past 15 years a technological tsunami has swept through the health care industry, and few physicians were prepared for the changes wrought by this tidal wave. It now is clear, however, that we are and will have to continue to navigate a future increasingly powered and populated by technology if we are to be successful clinicians. In addition, we must learn to take advantage of all that technology has to offer without compromising the quality of care and compassion we offer our patients. We are fortunate that technology has much to offer to enhance patient care.
One big change under way: Technology is leveling the playing field between doctors—once the high priests of medicine—and ordinary people. SMART (social, mobile, aware, and real-time) technologies such as cloud computing will broaden the setting of health care interventions from hospital rooms and doctors’ offices to patients’ everyday lives. Cloud computing involves the use of a network of remote servers hosted on the Internet to store, manage, and process data, rather than a local server or a desktop computer located in the doctor’s office. It is possible that, instead of being episodic, health care will be conducted continuously—and anywhere the patient wants it.
Without a doubt, the pace at which new technology affects our lives is increasing at lightning speeds. Today, 29% of Americans say their phone is the first and the last thing they look at each day, a telling sign of how dependent we are becoming on technology.1 In this article, we look at 4 technologies that can be effective in the clinical setting, attracting new patients and enhancing productivity, communication, and patient care.
1. A mobile-friendly Web site
According to Wikipedia, there are 327,577,529 mobile phones in the United States, give or take a few thousand. As of July 4, 2014, the US population was 318,881,992. That means there are more mobile phones in this country than there are people!2
Mobile phones are becoming more like personal assistants than phones. People are not just making calls, they’re buying movie tickets, checking the weather, sending and receiving emails, texting, making reservations, checking Web sites … and the list goes on.
According to a recent report from the Pew Research Center, almost two-thirds of Americans own a smartphone, and 62% of smartphone owners have used it to look up information on a health condition.3 Moreover, 15% of smartphone owners say they have a limited number of ways to access the Internet other than their cell phone.3
All the more reason for your Web site to be mobile-friendly. With a mobile- friendly site, the content is displayed in a more streamlined fashion on mobile phones, with larger type to make it more readable. See, for example, the FIGURE, which shows Dr. Baum’s regular Web site side by side with the mobile-friendly view.
There is another reason why you should ensure that your site is mobile-friendly: Google recently changed its algorithms so that, when someone searches for information on a mobile phone, only mobile- friendly sites make it into the top search results. Google wants mobile phone users to have a positive experience online. It is so adamant about this desire that it will lower your rankings or not show your Web site at all in search results if you fail to comply.
New patient acquisition is critical for any ObGyn practice, and we already know that just about everyone goes online to search for health information and solutions to their medical problems. If you want your practice to survive and thrive, you need to attract new patients online. If a visitor to your site cannot read the text and has to keep resizing the screen and scrolling left and right, you will lose that visitor in a hurry.
We all want to find what we are looking for quickly. In our experience, when we check Google Analytics reports for our ObGyn clients, we find that visitors to a nonresponsive site spend much less time there and do not visit as many pages as they do when a site is mobile-responsive.
To check your Web site’s mobile rating, go to http://www.google.com/webmasters/tools/mobile-friendly. Google also offers tips on making your site mobile-friendly at https://support.google.com/webmasters/answer/6001177?hl=en.
Once your site is up to snuff, you should test it from multiple devices to ensure that the pages are easily readable on all types of phones and computers.
2. Voice recognition software
Speech recognition is the ability of a machine or program to identify words and phrases in spoken language and convert them to a digital format. This tool can help you generate clinical notes and charting without having to stop and type into a computer. This can enhance your interactions with patients by freeing you from the computer during examinations and counseling and allows you to look at the patient and not at the computer.
According to data from June 2000, approximately 5% of physicians used speech recognition to generate text in their offices.4 A white paper from 2008 found that approximately 20% of physicians are using more advanced, more reliable voice recognition technology and saving both time and money.5 This report cited 2007 data showing that:
- 76% of clinicians who used “desktop speech recognition” (directly controlling an electronic health record [EHR] system via speech) reported faster turnaround time, better patient care, and quicker reimbursement
- Nearly 30% reported lower costs and increased productivity as benefits. The lower costs arise from reduced transcription and overhead expenses associated with billings and collection.5
The voice recognition software used in Dr. Neil Baum’s office is Dragon Medical Practice Edition 2 (www.dragonmedicalpractice.com). Dragon requires a good processor and a minimum of 4 gigabytes of RAM and will run with VMware, Boot Camp, Parallels, and other programs for Mac users. The software contains 80 subspecialty medical vocabularies and is easy to install. After a few minutes, the program learns how you speak and will understand you well with remarkable accuracy. However, to get the greatest benefit from the technology, you will need to invest in training, implementation, and workflow services to allow you to use the program to its full potential in record time.
Dr. Baum uses The Dragon People voice recognition software (www.thedragonpeople.com).
Although voice recognition software can reduce or eliminate transcription costs, improve documentation time, and boost the quality of medical notes, it is critical that you investigate how a particular program fits with your EHR prior to purchasing it—and a salesperson may try to gloss over this issue. In addition, the more you use voice recognition instead of checking off pull-down boxes for your clinical notes, the more difficult it will be to mine your data for quality metrics and pay-for-performance information. For that reason, voice recognition technology may be strongly discouraged by your employer or governing organization.
3. Online lab result reporting
TeleVox’s automated lab results (www .televox.com/lab-test-results-delivery) allow physicians or staff to assign lab result messages quickly and easily with the click of a mouse. Patients call an 800 number or use an Internet connection to retrieve their results, using a unique PIN to ensure privacy.
Practices that implement this technology see immediate improvements in 3 areas:
- Streamlined operations. This technology allows lab result messages to be assigned to patients with a few mouse clicks, saving time spent on phone calls and mailing coordination.
- Reduced costs. Automated lab result reporting reduces staff labor and mailing costs.
- Ease of access. Patients have round-the-clock access to their information—no more waiting for mail delivery or a phone call. Patients also can choose to be notified when their results are ready, which helps alleviate anxiety.
4. Automated wait-time notification
The most common complaint patients have about their health care experience is the excessive wait times they often experience. Now there are technologies that can provide automated information to let patients know how long they will have to wait to be seen.
A program such as MedWaitTime (www.medwaittime.com) can alert patients about the estimated wait time at a cost of approximately $50 per month per physician. Patients access the service for free.
In addition, many EHRs include practice management features to notify the staff and physician whether he or she is on time. These features may include a tie-in to alert patients as well.
The bottom line
Carefully selected technological tools have much to offer busy clinicians. By ensuring that your practice Web site is mobile- friendly, you stand to attract new patients. And the time you save with voice recognition software and computerized lab test result notification can allow you to spend more time with your patients. It can also help eliminate the lag in your patient schedule, keeping the women in your waiting room happy. Remember, a happy patient means a happy doctor!
Share your thoughts! Send your Letter to the Editor to [email protected]. Please include your name and the city and state in which you practice.
- Your Wireless Life: Results of TIME’s Mobility Poll. http://content.time.com/time/interactive/0,31813,2122187,00.html. Accessed July 29, 2015.
- Wikipedia: List of Countries by Number of Mobile Phones in Use. https://en.wikipedia.org/wiki/List_of_countries_by_number_of_mobile_phones_in_use. Accessed July 29, 2015.
- Smith A. US Smartphone Use in 2015. Pew Research Center. http://www.pewinternet.org/2015/04/01/us-smartphone-use-in-2015. Published April 1, 2015. Accessed July 29, 2015.
- Maisel JM, Wisnicki HJ. Documenting the medical encounter with speech recognition. Ophthalmol Times. 2002;27(5):38.
- Nuance Communications. Speech recognition: accelerating the adoption of electronic medical records. http://www.nuance.com/healthcare/pdf/wp_healthcareMDEMRadopt.pdf. Published 2008. Accessed July 30, 2015.
In this Article
- Voice recognition software lets you look at your patient
- Patients can retrieve online lab results

Which vaginal procedure is best for uterine prolapse?
More than one-third of women aged 45 years or older experience uterine prolapse, a condition that can impair physical, psychological, and sexual function. To compare vaginal vault suspension with hysterectomy, investigators at 4 large Dutch teaching hospitals from 2009 to 2012 randomly assigned women with uterine prolapse to sacrospinous hysteropexy (SSLF) or vaginal hysterectomy with uterosacral ligament suspension (ULS). The primary outcome was recurrent stage 2 or greater prolapse (within 1 cm or more of the hymenal ring) with bothersome bulge symptoms or repeat surgery for prolapse by 12 months follow-up.
Details of the trialOne hundred two women assigned to SSLF (median age, 62.7 years) and 100 assigned to hysterectomy with ULS (median age, 61.9 years) were analyzed for the primary outcome. The patients ranged in age from 33 to 85 years.
Surgical failure rates and adverse events were similarMean hospital stay was 3 days in both groups and the occurrence of urinary retention was likewise similar (15% for SSLF and 11% for hysterectomy with ULS). At 12 months, 0 and 4 women in the SSLF and hysterectomy with ULS groups, respectively, met the primary outcome. Study participants were considered a “surgical failure” if any type of prolapse with bothersome symptoms or repeat surgery or pessary use occurred. Failures occurred in approximately one-half of the women in both groups.
Rates of serious adverse events were low, and none were related to type of surgery. Nine women experienced buttock pain following SSLF hysteropexy, a known complication of this surgery. This pain resolved within 6 weeks in 8 of these women. In the remaining woman, persistent pain led to release of the hysteropexy suture and vaginal hysterectomy 4 months after her initial procedure.
What this evidence means for practice
Advantages of hysterectomy at the time of vaginal vault suspension include prevention of endometrial and cervical cancers as well as elimination of uterine bleeding. However, data from published surveys indicate that many US women with prolapse prefer to avoid hysterectomy if effective alternate surgeries are available.1
In the previously published 2014 Barber and colleagues’ OPTIMAL trial,1,2 the efficacy of vaginal hysterectomy with either SSLF or USL was equivalent (63.1% versus 64.5%, respectively). The success rates are lower for both procedures in this trial by Detollenaere and colleagues.
Both SSLF and ULS may result in life-altering buttock or leg pain, necessitating removal of the offending sutures; however, the ULS procedure offers a more anatomically correct result. Although the short follow-up interval represents a limitation, these trial results suggest that sacrospinous fixation without hysterectomy represents a reasonable option for women with bothersome uterine prolapse who would like to avoid hysterectomy.
—Meadow M. Good, DO, and Andrew M. Kaunitz, MD
Share your thoughts on this article! Send your Letter to the Editor to [email protected]. Please include your name and the city and state in which you practice.
- Korbly N, Kassis N, Good MM, et al. Patient preference for uterine preservation in women with pelvic organ prolapse: a fellow’s pelvic network research study. Am J Obstet Gynecol. 2013;209(5):470.e1−e6.
- Barber MD, Brubaker L, Burgio KL, et al. Comparison of 2 transvaginal surgical approaches and perioperative behavioral therapy for apical vaginal prolapse. The OPTIMAL randomized trial. JAMA. 2014;311(10):1023–1034.
More than one-third of women aged 45 years or older experience uterine prolapse, a condition that can impair physical, psychological, and sexual function. To compare vaginal vault suspension with hysterectomy, investigators at 4 large Dutch teaching hospitals from 2009 to 2012 randomly assigned women with uterine prolapse to sacrospinous hysteropexy (SSLF) or vaginal hysterectomy with uterosacral ligament suspension (ULS). The primary outcome was recurrent stage 2 or greater prolapse (within 1 cm or more of the hymenal ring) with bothersome bulge symptoms or repeat surgery for prolapse by 12 months follow-up.
Details of the trialOne hundred two women assigned to SSLF (median age, 62.7 years) and 100 assigned to hysterectomy with ULS (median age, 61.9 years) were analyzed for the primary outcome. The patients ranged in age from 33 to 85 years.
Surgical failure rates and adverse events were similarMean hospital stay was 3 days in both groups and the occurrence of urinary retention was likewise similar (15% for SSLF and 11% for hysterectomy with ULS). At 12 months, 0 and 4 women in the SSLF and hysterectomy with ULS groups, respectively, met the primary outcome. Study participants were considered a “surgical failure” if any type of prolapse with bothersome symptoms or repeat surgery or pessary use occurred. Failures occurred in approximately one-half of the women in both groups.
Rates of serious adverse events were low, and none were related to type of surgery. Nine women experienced buttock pain following SSLF hysteropexy, a known complication of this surgery. This pain resolved within 6 weeks in 8 of these women. In the remaining woman, persistent pain led to release of the hysteropexy suture and vaginal hysterectomy 4 months after her initial procedure.
What this evidence means for practice
Advantages of hysterectomy at the time of vaginal vault suspension include prevention of endometrial and cervical cancers as well as elimination of uterine bleeding. However, data from published surveys indicate that many US women with prolapse prefer to avoid hysterectomy if effective alternate surgeries are available.1
In the previously published 2014 Barber and colleagues’ OPTIMAL trial,1,2 the efficacy of vaginal hysterectomy with either SSLF or USL was equivalent (63.1% versus 64.5%, respectively). The success rates are lower for both procedures in this trial by Detollenaere and colleagues.
Both SSLF and ULS may result in life-altering buttock or leg pain, necessitating removal of the offending sutures; however, the ULS procedure offers a more anatomically correct result. Although the short follow-up interval represents a limitation, these trial results suggest that sacrospinous fixation without hysterectomy represents a reasonable option for women with bothersome uterine prolapse who would like to avoid hysterectomy.
—Meadow M. Good, DO, and Andrew M. Kaunitz, MD
Share your thoughts on this article! Send your Letter to the Editor to [email protected]. Please include your name and the city and state in which you practice.
- Korbly N, Kassis N, Good MM, et al. Patient preference for uterine preservation in women with pelvic organ prolapse: a fellow’s pelvic network research study. Am J Obstet Gynecol. 2013;209(5):470.e1−e6.
- Barber MD, Brubaker L, Burgio KL, et al. Comparison of 2 transvaginal surgical approaches and perioperative behavioral therapy for apical vaginal prolapse. The OPTIMAL randomized trial. JAMA. 2014;311(10):1023–1034.

Sodium fluorescein as an alternative to indigo carmine during intraoperative cystoscopy

For more videos from the Society of Gynecologic Surgeons, click here
Visit the Society of Gynecologic Surgeons online: sgsonline.org
For more videos from the Society of Gynecologic Surgeons, click here
Visit the Society of Gynecologic Surgeons online: sgsonline.org
For more videos from the Society of Gynecologic Surgeons, click here
Visit the Society of Gynecologic Surgeons online: sgsonline.org
This video is brought to you by ![]()

ICD-10-CM documentation and coding for obstetric procedures

The countdown is on for the big coding switch. Last month I wrote about changes in International Classification of Diseases, 10th Revision, Clinical Modification (ICD-10-CM) codes that will occur in relation to gynecologic services, but now it’s time to tackle obstetric services. For obstetricians, the changes will be all about definitions. And documentation of obstetric conditions will be more complicated due to several factors, including the need to report trimester information and gestational age, use of a placeholder code, more complex guidelines for certain conditions, chorionicity for multiple gestations, and use of a 7th digit to identify the fetus with a problem.
No one is expecting clinicians to instantly be fluent in code-speak, but in order for the most specific diagnoses to be reported, the clinical documentation must be spot on. Think of it this way: ICD-10-CM is not requiring you to document more, it’s requiring you to document more precisely.
How to get started
Figuring out where you are now goes a long way toward knowing where you need to be when the calendar changes to October 1—and the best way to do it is to perform a gap analysis. This analysis can be carried out by the clinician or a qualified practice staff person.
To begin, run a report of the distinct obstetric codes you have billed in 2015 by frequency. Then sort them in numeric order so that each individual code category is captured for all of the 5th digits (and the code then will be counted as a single code). Finally, review 5 medical records for each of the top 10 reported diagnosis categories and determine whether you could have reported a more specific ICD-10-CM code.
The information you gain will go a long way toward identifying potential weaknesses in the documentation, or, if you are currently using an electronic health record (EHR) to look up a code, it will point up any weak points in searching for the right code, based on your specific documentation at the encounter. Remember, practice makes perfect…eventually.
Well-trained staff can help
Not only must you, the clinician, learn about the part your clinical documentation will play in providing the most specific information that will lead to a very specific code, but your coding and billing staff will need training as well. They are the ones who should be checking your claims for accuracy from October 1 forward, as they will know the basic rules about which codes can be billed together, code order, place codes, and so on. In other words, while you as a clinician should be responsible for picking the more specific code in ICD-10-CM, your staff is your backup when you don’t.
Feedback from your staff on how the claims are being processed and, perhaps, the overuse of unspecified codes will keep you moving toward the goal of complete and precise clinical documentation and the reporting of diagnoses at the highest level possible given the documentation.
Highlights of ICD-10-CM obstetric coding
Given the complexity of obstetric coding, this article deals only with the most important changes. It will be up to each clinician to learn the rules that surround the diagnostic codes that you report most frequently. Here again, a trained staff can help by preparing specific coding tools for the most frequently used diagnoses, including notes about what must be in the record to report the most specific code.
Trimester, gestational age, and timing definitions
The majority of obstetric complication codes (these are the codes that start with the letter “O”) and the “Z” codes for supervision of a normal pregnancy require trimester information to be valid. In the outpatient setting, the trimester will be based on the gestational age at the date of the encounter. For inpatient admissions, the trimester will be based on the age at the time of admission; if the patient is hospitalized over more than one trimester, it is the admission trimester that continues to be recorded, not the discharge trimester.
Although there are codes that indicate an unspecified trimester, they should be reported rarely if this information is, in fact, available. Trimesters are defined as:
- first: less than 14 weeks, 0 days
- second: 14 weeks, 0 days to less than 28 weeks, 0 days
- third: 28 weeks, 0 days until delivery.
Examples of trimester codes include:
- O25.11Malnutrition in pregnancy, first trimester
- O14.02 Mild to moderate preeclampsia, second trimester
- O24.013 Preexisting diabetes mellitus, type 1, in pregnancy, third trimester.
However, definitions in ICD-10-CM go beyond this, and these definitions will have to be taken into account to provide sufficient documentation to report the condition. In ICD-9-CM, a missed abortion and early hemorrhage in pregnancy occurred prior to 22 completed weeks, but in ICD-10-CM that definition changes to prior to 20 completed weeks.
Additional definitions that may impact coding:
- preterm labor or delivery: 20 completed weeks to less than 37 completed weeks
- full-term labor or delivery: 37 completed weeks to 40 completed weeks
- postterm pregnancy: more than 40 completed weeks to 42 completed weeks
- prolonged pregnancy: more than 42 completed weeks.
You also will be required to include a code for gestational age any time you report an obstetric complication. This and the trimester information will change as the pregnancy advances, so always be sure that the code selected matches the gestational age on the flow sheet at the time of the encounter. The gestational age code is Z3A.__, with the final 2 digits representing the weeks of gestation (for instance, from 27 weeks, 0 days to 27 weeks, 6 days, the final 2 digits will be “27”).
ICD-10-CM also has different conventions when it comes to timing as it relates to conditions that are present during the episode in which the patient delivers. When this is the case, an “in childbirth” code must be selected instead of assigning the diagnosis by trimester, if one is available. There also are codes that are specific to “in the puer-perium,” and these generally will be reported after the patient has been discharged after delivery but also would be reported if there is no “in childbirth” code available at the time of delivery. The code categories to which this concept will apply are:
- preexisting hypertension
- diabetes mellitus
- malnutrition
- liver and biliary tract disorders
- subluxation of symphysis (pubis)
- obstetric embolism
- maternal infectious and parasitic diseases classifiable elsewhere
- other maternal diseases classifiable elsewhere
- maternal malignant neoplasms, traumatic injuries, and abuse classifiable elsewhere.
Taking time to read a code description from a search program or drop-down menu also will be important because some codes refer to “of the puerperium” versus “complicating the puerperium” or “in the puerperium.” The first reference means that the condition develops after delivery, while the second and third terms mean that it developed prior to delivery. For example, code O90.81, Anemia of the puerperium, refers to anemia that develops following delivery, while code O99.03 Anemia complicating the puerperium, denotes preexisting anemia that is still present in the postpartum period.
Multiple gestation coding and the 7th digit
The first thing you will notice here is that several code categories require a 7th numeric character of 0 or 1 through 9. This rule will apply to the following categories:
- complications specific to multiple gestation
- maternal care for malpresentation of fetus
- maternal care for disproportion
- maternal care for known or suspected fetal abnormality and damage
- maternal care for other fetal problems
- polyhydramnios
- other disorders of amniotic fluid and membranes
- preterm labor with preterm delivery
- term delivery with preterm labor
- obstructed labor due to malposition and malpresentation of fetus
- labor and delivery with umbilical cord complications.
A 7th character of 0 will be reported if this is a singleton pregnancy, and the numbers 1 through 5 and 9 refer to which fetus of the multiple gestation has the problem. The number 9 would indicate any fetus that was not labeled as 1 to 5.
The trick in documentation will be identifying the fetus with the problem consistently while still recognizing that, in some cases, such as fetal position, twins may switch places. On the other hand, if one fetus is small for dates, chances are good that this fetus will remain so during pregnancy when twins are present.
A code will be denied as invalid without this 7th digit, so it will be good practice for the clinician to document this information at each visit.
Additional information in regard to multiple gestations will be the chorionicity of the pregnancy, if known, but there will also be an “unable to determine” and an “unspecified” code available if that better fits the documentation for the visit. Note, however, that there is no code for a trichorionic/ triamniotic pregnancy; therefore, only the unspecified code would be reported in that case. In addition, if there is a continuing pregnancy after fetal loss, the cause must be identified within the code (that is, fetal reduction, fetal demise [and retained], or spontaneous abortion).
Documentation requirements for certain conditions
If you plan on reporting any complication of pregnancy at the time of the encounter, information about that condition needs to be part of the antepartum flow sheet comments. If, at the time of the encounter, a condition the patient has is not addressed and the entire visit involves only routine care, you would report the code for routine supervision of preg- nancy rather than the complication code. If the complication is again addressed at a later visit, the complication code would be reported again for that visit. The routine supervision code and the complication code cannot be reported on the record for the same encounter under ICD-10-CM rules.
Hypertension. Documentation needs to state whether the hypertension is preexisting or gestational. If it is preexisting, it needs to be identified as essential or secondary. If the patient also has hypertensive heart disease or chronic kidney disease, this information should be included, as different codes must be selected.
Diabetes. The documentation needs to state whether it is preexisting or gestational. If preexisting, you must document whether it is type 1 or type 2. If it is type 2, you must report an additional code for long-term insulin use, if applicable. The assumption for a woman with type 1 diabetes is that she is always insulin-dependent, so long-term use is not reported separately. Note, however, that neither metformin nor glyburide is considered insulin and there is no mechanism for reporting control with these medications.
If diabetes is gestational, you must indicate whether the patient’s blood glucose level is controlled by diet or insulin. If both, report only the insulin. There is no code for the use of other medications for the control of gestational diabetes, so you would have to report an unspecified code in that case.
Also note that ICD-10-CM differentiates between an abnormal 1-hour glucose tolerance test (GTT) and gestational diabetes. Unless a 3-specimen or 4-specimen GTT has been performed and results are abnormal, a diagnosis of gestational diabetes should not be reported.
An additional code outside of the obstetric complication chapter is required to denote any manifestations of diabetes. If there are none, then a diabetes uncomplicated manifestation code must be reported.
Preterm labor and delivery. Your documentation must clearly indicate whether the patient has preterm labor with preterm delivery or whether the delivery is term in addition to the trimester. For instance, if you document that Mary presents with preterm labor at 27 weeks, 2 days and delivers a girl at 28 weeks, 6 days, your code will describe Preterm labor second trimester with preterm delivery third trimester. However, if Susan presents with preterm labor at 30 weeks, 2 days and is managed until 37 weeks, 1 day, when she delivers a baby boy, your code would describe Term delivery with preterm labor, third trimester.
New coding options
Among the new coding options under ICD-10-CM:
- Abnormal findings on antenatal screening. These would be reported when the antenatal test is abnormal but you have not yet determined a definitive diagnosis.
- Alcohol, drug, and tobacco use during pregnancy. If you report any of these codes, you must also report a manifestation code for the patient’s condition. If the use is uncomplicated, you would report that code instead.
- Abuse of the pregnant patient. You can report sexual, physical, or psychological abuse, but you also must report a code for any applicable injury to the patient and identify the abuser, if known.
- Pruritic urticarial papules and plaques of pregnancy
- Retained intrauterine contraceptive device in pregnancy
- Maternal care due to uterine scar from other previous surgery. This would mean a surgery other than a previous cesarean delivery.
- Maternal care for (suspected) damage to the fetus by other medical procedures
- Maternal care for hydrops fetalis
- Maternal care for viable fetus in abdominal pregnancy
- Malignant neoplasm complicating pregnancy
- Failed attempt at vaginal birth after previous cesarean delivery
- Supervision of high-risk pregnancy due to social problems (for instance, a homeless patient)
- Rh incompatibility status (when you lack confirmation of serum antibodies and are giving prophylactic Rho[D] immune globulin).
CMS takes steps to ease transition to ICD-10-CM
To help health care providers get “up to speed” on the International Classification of Diseases, 10th Revision, Clinical Modification (ICD-10-CM), which takes effect October 1, 2015, the Centers for Medicare and Medicaid Services (CMS) has launched a new series for specialists. A guide tailored to ObGyns is available at http://roadto10.org/example-practice-obgyn. The guide includes:
Parting words
ICD-10-CM may seem like the end of the world, but its difficulty is exaggerated. If you fail to prepare, you will fail, and money coming in the door may be affected. If you prepare with training and practice, you will have a short learning curve. I wish you all the best. If you have specific questions about your practice, don’t hesitate to let us know so they can be addressed early.
Share your thoughts! Send your Letter to the Editor to [email protected]. Please include your name and the city and state in which you practice.
In this Article
- How to do a gap analysis
- Highlights of OB coding
- Condition-specific coding notations

New and Noteworthy Information—September 2015
Emergency medical services (EMS) use for stroke differs by race, ethnicity, and sex, according to a study published in the August issue of the Journal of the American Heart Association. Data were analyzed from 398,798 stroke patients who were admitted to 1,613 Get With The Guidelines–Stroke participating hospitals between October 2011 and March 2014. Multivariable logistic regression was used to evaluate the associations between combinations of racial, ethnic, and sex groups with EMS use, adjusting for potential confounders including demographics, medical history, and stroke symptoms. White women were most likely to use EMS to get to the hospital (62%). Hispanic men were least likely to use EMS (52%). Hispanic and Asian men and women had 20% to 29% lower adjusted odds of using EMS compared with their white counterparts. Black women were less likely than white women to use EMS.
For patients who take sleeping pills to treat chronic insomnia, new study findings suggest that they may be able to get relief from as little as half of the drugs, and may even be helped by including placebos in the treatment plan. The study was published online July 7 in Sleep Medicine. In all, 74 subjects with chronic insomnia were treated with 10 mg of zolpidem for four weeks. Treatment responders were then randomized to nightly dosing with 10 mg or 5 mg, intermittent dosing (3 to 5 days weekly) with 10 mg, or partial reinforcement dosing (nightly pills with 50% active meds and 50% placebo) with 10 mg for 12 weeks. In compliant subjects, all of the treatment strategies maintained treatment response. For the subjects that remained in remission, the subjects in the intermittent dosing group exhibited poorer sleep continuity. “Our research found that changing the industry standard for maintenance therapy can maintain treatment responses and lower the incidence of side effects,” said the researchers.
Hospitals often overestimate their ability to deliver timely t-PA to treated patients, according to a study published in the July issue of the Journal of the American Heart Association. Researchers surveyed staff in 141 hospitals that treated 48,201 stroke patients in 2009 and 2010. Data included the onset of stroke symptoms, hospital arrival time, treatments, initiation of t-PA, and complications from the drug. Hospital performance was based on “door-to-needle” time. Only 29% of hospital staff accurately identified their door-to-needle performance; 42% of middle-performing hospitals and 85% of low-performing hospitals overestimated their abilities to quickly administer t-PA and nearly 20% of low-performing hospitals believed their door-to-needle time was above the national average. Hospitals that overestimated their performance had lower volumes of t-PA administration.
Incidence rates for Alzheimer’s disease and other dementias among African Americans age 70 or older have decreased over the last two decades, but the incidence rates for these conditions among Africans has remained unchanged over the same time period. According to a study published online ahead of print July 23 in Alzheimer’s & Dementia, dementia and Alzheimer’s disease incidence rates among African Americans were significantly lower in 2001 than in 1992, except for the oldest group. The cohorts consisted of 1,440 African Americans residing in Indianapolis and 1,774 Yoruba in Ibadan, Nigeria, in 1992, and 1,835 African Americans and 1,895 Yoruba in 2001. The overall dementia incidence rates among the African Americans were 3.6% in the 1992 cohort and 1.4% in the 2001 cohort. “The reason for the significant decline in new cases of Alzheimer’s disease and other dementias in the African Americans we studied is not yet entirely clear but we believe it may be possible that medications for cardiovascular conditions contributed to the decline,” the study authors said.
Lower executive function, but not memory, is associated with higher risk of coronary heart disease and stroke, according to a study published online ahead of print August 5 in Neurology. Included in this study were 3,926 participants with a mean age of 75, who were 44% male, and at risk for cardiovascular diseases. During 3.2 years of follow-up, incidence rates of coronary heart disease and stroke were 30.5 and 12.4 per 1,000 person-years, respectively. In multivariable models, participants in the lowest third of executive function, compared with participants in the highest third, had 1.85-fold higher risk of coronary heart disease and 1.51-fold higher risk of stroke. Participants in the lowest third of memory had no increased risk of coronary heart disease or stroke.
The Quick Dementia Rating System (QDRS) differentiates between individuals with and without dementia, accurately stages dementia without extensive tester training or clinician input, and is highly correlated with gold standard measures, according to a study published in the June issue of Alzheimer’s & Dementia. The QDRS was used in 267 patient-caregiver dyads compared with Clinical Dementia Ratings (CDR), neuropsychologic testing, and gold standard measures of function, mood, and behavior. The QDRS scores increased with higher CDR staging and poorer neuropsychologic performance. The QDRS demonstrated low floor and ceiling effects; excellent known-groups validity across CDR stages; construct validity against cognitive, behavioral, and functional measures; and reliability. The QDRS demonstrated differential scores across different dementia etiologies. The QDRS is copyrighted and permission is required to use it. The QDRS is available at no cost to clinicians, researchers, and not-for-profit organizations.
A drug used to treat diabetes may also reduce the risk of Parkinson’s disease, according to a study published July 21 in PLOS Medicine. Researchers conducted a retrospective cohort study in which individuals with diabetes who were prescribed glitazone antidiabetes drugs (rosiglitazone or pioglitazone) were matched by age, sex, practice, and diabetes treatment stage with up to five people who were taking other diabetes treatments. Patients were followed up from 1999 until the first recording of a Parkinson’s disease diagnosis, end of observation in the database, or the end of the study (August 1, 2013). In all, 44,597 glitazone-exposed individuals were matched to 120,373 other antidiabetic users. The incidence rate of Parkinson’s disease in the glitazone-exposed group was 6.4 per 10,000 patient years compared with 8.8 per 10,000 years in those prescribed other antidiabetic treatments.
Day-of-injury serum brain-derived neurotrophic factor (BDNF) is associated with traumatic brain injury (TBI) diagnosis and provides six-month prognostic information regarding recovery, according to a study published online ahead of print July 10 in the Journal of Neurotrauma. Researchers examined BDNF in 300 patients drawn from two independent cohorts of TBI cases presenting to two emergency departments and 150 patients without brain injuries. Among Transforming Research and Clinical Knowledge in TBI (TRACK-TBI) pilot study subjects, median BDNF concentrations were higher in mild than in moderate or severe TBI. In the TRACK-TBI cohort, the subjects with very low BDNF values had higher odds of incomplete recovery than those without very low values. According to the researchers, their results suggest that a test for BDNF levels, administered in the emergency department, could help stratify patients.
Children with multiple sclerosis (MS) are less physically active than children with monophasic acquired demyelinating syndrome, according to a study published online ahead of print August 12 in Neurology. In this cross-sectional study of consecutive patients attending a specialized pediatric MS clinic, researchers administered the PedsQL Multidimensional Fatigue Scale, Center for Epidemiological Studies Depression Scale, and Godin Leisure-Time Exercise Questionnaire. A total of 110 patients were included. Patients with MS reported less strenuous and total physical activity than those with monophasic acquired demyelinating syndrome. Patients with MS who reported greater amounts of moderate physical activity metabolic equivalents had fewer sleep/rest fatigue symptoms. Participation in strenuous physical activity was associated with smaller T2 lesion volumes and lower annualized relapse rate.
—Kimberly Williams

Osteoporosis Trends Collide for Mexican American Women
Among adults aged 65 years and over, women were 4.4 times as likely as men to have osteoporosis, and Mexican Americans were 2.4 times more likely than were blacks to have osteoporosis from 2005 to 2010, the National Center for Health Statistics reported.
So where does leave those who are both women and Mexican American?
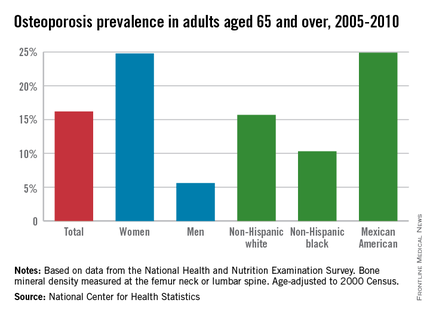
First, a little background: The age-adjusted prevalence of osteoporosis measured at either the lumbar spine or femur neck among adults aged 65 years and over was 24.8% for women and 5.6% for men, for an overall prevalence of 16.2%. Adults aged 65-79 years had an unadjusted prevalence of 12.8%, compared with 25.7% for those aged 80 years and over, according to data from the 2005-2010 National Health and Nutrition Examination Survey.
Age-adjusted prevalence over that time period for Mexican Americans aged 65 years and older was 24.9%, compared with 15.7% for non-Hispanic whites and 10.3% for non-Hispanic blacks.
Mexican American women, who find themselves at the intersection of these two trends, had an adjusted osteoporosis rate of 36.8%, the NCHS reported.
Osteoporosis was defined as a bone mineral density value that was more than 2.5 standard deviations below the mean value for young, non-Hispanic white females.
Among adults aged 65 years and over, women were 4.4 times as likely as men to have osteoporosis, and Mexican Americans were 2.4 times more likely than were blacks to have osteoporosis from 2005 to 2010, the National Center for Health Statistics reported.
So where does leave those who are both women and Mexican American?
First, a little background: The age-adjusted prevalence of osteoporosis measured at either the lumbar spine or femur neck among adults aged 65 years and over was 24.8% for women and 5.6% for men, for an overall prevalence of 16.2%. Adults aged 65-79 years had an unadjusted prevalence of 12.8%, compared with 25.7% for those aged 80 years and over, according to data from the 2005-2010 National Health and Nutrition Examination Survey.
Age-adjusted prevalence over that time period for Mexican Americans aged 65 years and older was 24.9%, compared with 15.7% for non-Hispanic whites and 10.3% for non-Hispanic blacks.
Mexican American women, who find themselves at the intersection of these two trends, had an adjusted osteoporosis rate of 36.8%, the NCHS reported.
Osteoporosis was defined as a bone mineral density value that was more than 2.5 standard deviations below the mean value for young, non-Hispanic white females.
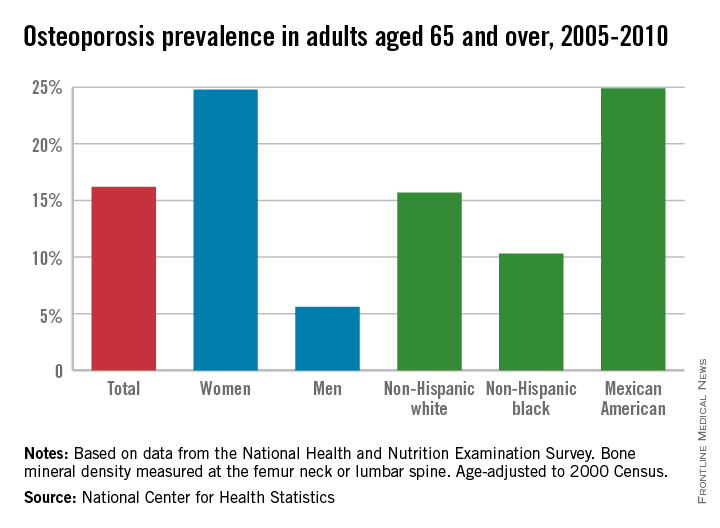
Osteoporosis trends collide for Mexican American women
Among adults aged 65 years and over, women were 4.4 times as likely as men to have osteoporosis, and Mexican Americans were 2.4 times more likely than were blacks to have osteoporosis from 2005 to 2010, the National Center for Health Statistics reported.
So where does leave those who are both women and Mexican American?

First, a little background: The age-adjusted prevalence of osteoporosis measured at either the lumbar spine or femur neck among adults aged 65 years and over was 24.8% for women and 5.6% for men, for an overall prevalence of 16.2%. Adults aged 65-79 years had an unadjusted prevalence of 12.8%, compared with 25.7% for those aged 80 years and over, according to data from the 2005-2010 National Health and Nutrition Examination Survey.
Age-adjusted prevalence over that time period for Mexican Americans aged 65 years and older was 24.9%, compared with 15.7% for non-Hispanic whites and 10.3% for non-Hispanic blacks.
Mexican American women, who find themselves at the intersection of these two trends, had an adjusted osteoporosis rate of 36.8%, the NCHS reported.
Osteoporosis was defined as a bone mineral density value that was more than 2.5 standard deviations below the mean value for young, non-Hispanic white females.
Among adults aged 65 years and over, women were 4.4 times as likely as men to have osteoporosis, and Mexican Americans were 2.4 times more likely than were blacks to have osteoporosis from 2005 to 2010, the National Center for Health Statistics reported.
So where does leave those who are both women and Mexican American?
First, a little background: The age-adjusted prevalence of osteoporosis measured at either the lumbar spine or femur neck among adults aged 65 years and over was 24.8% for women and 5.6% for men, for an overall prevalence of 16.2%. Adults aged 65-79 years had an unadjusted prevalence of 12.8%, compared with 25.7% for those aged 80 years and over, according to data from the 2005-2010 National Health and Nutrition Examination Survey.
Age-adjusted prevalence over that time period for Mexican Americans aged 65 years and older was 24.9%, compared with 15.7% for non-Hispanic whites and 10.3% for non-Hispanic blacks.
Mexican American women, who find themselves at the intersection of these two trends, had an adjusted osteoporosis rate of 36.8%, the NCHS reported.
Osteoporosis was defined as a bone mineral density value that was more than 2.5 standard deviations below the mean value for young, non-Hispanic white females.

Migraine Can Significantly Impact Family Activities and Dynamics
WASHINGTON, DC—While migraine is debilitating on an individual and societal level, its effects on the entire family can be substantial, as well. In a survey of migraineurs and their spouse/partners, migraine was found to impact family activities, inspire worries about financial security, and influence the nature of personal interactions. Lead author Dawn C. Buse, PhD, Associate Professor of Clinical Neurology at Albert Einstein College of Medicine and Montefiore Medical Center in the Bronx, New York, reported the study results at the American Headache Society’s 57th Annual Meeting. The study also assessed differences in family impact based on headache frequency. Previously, there had been little data to shed light on this topic.

Online Search for Study Participants In an attempt to represent US population demography, the Chronic Migraine Epidemiology and Outcomes (CaMEO) Study used Web-based cross-sectional modules to identify potential participants from a panel of 2.4 million people. Dr. Buse and her research colleagues sent e-mail invitations to nearly 490,000 individuals who met study criteria—namely, meeting criteria for migraine using the American Migraine Study/American Migraine Prevalence and Prevention Study Diagnostic Module and chronic migraine using modified Silberstein-Lipton criteria. In addition to the migraine respondents (probands), their spouse/partners (a spouse, partner, or significant other living in the same household for ≥ 2 months) also were invited to participate.
Categories for headache days per month were divided into low-, moderate-, and high-frequency episodic migraine: 0 to 4, 5 to 9, and 10 to 14, respectively. Chronic migraine was defined as 15 or more headache days per month. The number of headache days per month was averaged over the preceding 90 days.
Survey items assessed four domains of interest: reduced participation in family activities, missed or canceled events, financial impact, and spouse interactions. Reduced participation and missed or canceled events were assessed on a Likert-type scale ranging from 1 (disagree completely) to 4 (agree completely).
After determining usable returns, the researchers included responses for 4,022 proband-spouse dyads in the final analysis. Of the probands, 73.3% were women and 72.9% of spouses were men. The mean age of probands and spouses were 43 and 44, respectively; 14.6% of participants were nonwhite.
Disrupted Relationships
Nearly half of probands (49.4%) on average reported not participating in family activity at home because of headache in the past 30 days, and nearly a third (29.8%) of their spouses reported not participating due to the proband’s headache. A total of 53.5% and 33.6% of probands and spouses, respectively, reported reduced enjoyment in family activity more than once during the past 30 days, and 51.4% and 53.6%, respectively, reported that one-on-one time was disrupted more than once during the past month due to the proband’s headaches.
On average, one in five probands reported missing a holiday or religious event due to headache. The frequency of that response among those with chronic migraine was four times that of those with low-frequency episodic migraine (0 to 4 headache days per month)—40.8% vs 10.7%, respectively. About 38% of probands with chronic migraine and 32% of spouses reported canceling an important celebration at home in the past month. Nearly 40% of probands with chronic migraine and 29% of spouses reported missing a wedding, graduation, retirement celebration, or other important event.
Worry about covering household expenses or about being fired or laid off from a job was prevalent among probands and spouses. Such concern increased with increased headache frequency. The researchers noted that as many as a quarter of probands with low-frequency episodic migraine worried about overall long-term financial security, as did 59.5% of those with chronic migraine.
About one-third of all spouses and nearly half of spouses of those with chronic migraine reported avoiding the proband because of headache. About 24% of probands with 0 to 4 headaches per month and 44% of those with chronic migraine had the perception that their spouses do not believe them about their headaches.
“The CaMEO Study results offer a unique view into migraine impact because both the probands’ and spouses’ perspectives were gathered,” the researchers said. “Existing data and clinical experience suggest that the impact of migraine is pervasive and extends beyond the individual with migraine.”
—Adriene Marshall
Suggested Reading
Buse DC, Lipton RB. Global perspectives on the burden of episodic and chronic migraine. Cephalalgia. 2013;33(11):885-890.
Adams AM, Serrano D, Buse DC, et al. The impact of chronic migraine: The Chronic Migraine Epidemiology and Outcomes (CaMEO) Study methods and baseline results. Cephalalgia. 2015;35(7):563-578.
Lanteri-Minet M. Economic burden and costs of chronic migraine. Curr Pain Headache Rep. 2014;18(1):385.
WASHINGTON, DC—While migraine is debilitating on an individual and societal level, its effects on the entire family can be substantial, as well. In a survey of migraineurs and their spouse/partners, migraine was found to impact family activities, inspire worries about financial security, and influence the nature of personal interactions. Lead author Dawn C. Buse, PhD, Associate Professor of Clinical Neurology at Albert Einstein College of Medicine and Montefiore Medical Center in the Bronx, New York, reported the study results at the American Headache Society’s 57th Annual Meeting. The study also assessed differences in family impact based on headache frequency. Previously, there had been little data to shed light on this topic.
Online Search for Study Participants In an attempt to represent US population demography, the Chronic Migraine Epidemiology and Outcomes (CaMEO) Study used Web-based cross-sectional modules to identify potential participants from a panel of 2.4 million people. Dr. Buse and her research colleagues sent e-mail invitations to nearly 490,000 individuals who met study criteria—namely, meeting criteria for migraine using the American Migraine Study/American Migraine Prevalence and Prevention Study Diagnostic Module and chronic migraine using modified Silberstein-Lipton criteria. In addition to the migraine respondents (probands), their spouse/partners (a spouse, partner, or significant other living in the same household for ≥ 2 months) also were invited to participate.
Categories for headache days per month were divided into low-, moderate-, and high-frequency episodic migraine: 0 to 4, 5 to 9, and 10 to 14, respectively. Chronic migraine was defined as 15 or more headache days per month. The number of headache days per month was averaged over the preceding 90 days.
Survey items assessed four domains of interest: reduced participation in family activities, missed or canceled events, financial impact, and spouse interactions. Reduced participation and missed or canceled events were assessed on a Likert-type scale ranging from 1 (disagree completely) to 4 (agree completely).
After determining usable returns, the researchers included responses for 4,022 proband-spouse dyads in the final analysis. Of the probands, 73.3% were women and 72.9% of spouses were men. The mean age of probands and spouses were 43 and 44, respectively; 14.6% of participants were nonwhite.
Disrupted Relationships
Nearly half of probands (49.4%) on average reported not participating in family activity at home because of headache in the past 30 days, and nearly a third (29.8%) of their spouses reported not participating due to the proband’s headache. A total of 53.5% and 33.6% of probands and spouses, respectively, reported reduced enjoyment in family activity more than once during the past 30 days, and 51.4% and 53.6%, respectively, reported that one-on-one time was disrupted more than once during the past month due to the proband’s headaches.
On average, one in five probands reported missing a holiday or religious event due to headache. The frequency of that response among those with chronic migraine was four times that of those with low-frequency episodic migraine (0 to 4 headache days per month)—40.8% vs 10.7%, respectively. About 38% of probands with chronic migraine and 32% of spouses reported canceling an important celebration at home in the past month. Nearly 40% of probands with chronic migraine and 29% of spouses reported missing a wedding, graduation, retirement celebration, or other important event.
Worry about covering household expenses or about being fired or laid off from a job was prevalent among probands and spouses. Such concern increased with increased headache frequency. The researchers noted that as many as a quarter of probands with low-frequency episodic migraine worried about overall long-term financial security, as did 59.5% of those with chronic migraine.
About one-third of all spouses and nearly half of spouses of those with chronic migraine reported avoiding the proband because of headache. About 24% of probands with 0 to 4 headaches per month and 44% of those with chronic migraine had the perception that their spouses do not believe them about their headaches.
“The CaMEO Study results offer a unique view into migraine impact because both the probands’ and spouses’ perspectives were gathered,” the researchers said. “Existing data and clinical experience suggest that the impact of migraine is pervasive and extends beyond the individual with migraine.”
—Adriene Marshall
Suggested Reading
Buse DC, Lipton RB. Global perspectives on the burden of episodic and chronic migraine. Cephalalgia. 2013;33(11):885-890.
Adams AM, Serrano D, Buse DC, et al. The impact of chronic migraine: The Chronic Migraine Epidemiology and Outcomes (CaMEO) Study methods and baseline results. Cephalalgia. 2015;35(7):563-578.
Lanteri-Minet M. Economic burden and costs of chronic migraine. Curr Pain Headache Rep. 2014;18(1):385.

TBI Biomarker Development on the Horizon
A number of advanced efforts in traumatic brain injury (TBI) research are on the verge of reporting new data, according to a roundtable discussion that took place during the Military Health System Research Symposium on August 19. Among the most notable is in the area of biomarker development.
A 2,000-patient pivotal trial recently closed, and analysis should be completed by the end of the year. By March 2016, the research team expects to submit for FDA clearance a first-ever blood test for TBI. In addition, TBI research is currently being conducted in the areas of eye movement and balance.
Related: Brain Training for TBI Patients
A problem with assessing and treating the complexities of TBI up to this point is that although there are hundreds of measures of brain function, the evidence isn’t strong enough to provide a gold standard. “The whole area of drugs in neuroscience has been very difficult,” said Col. Dallas Hack, MD, senior medical advisor to the principal assistant for research and technology. “We have a couple of major efforts that are aimed at solving the problems of achieving results that can be measured according to the standards required to have them approved.”
Related: Stopping TBI-Related Brain Degeneration
To address the lack of a gold standard, the TBI Endpoints Development multiyear effort is making progress to give validity to the many existing measures of brain injury. Another effort is the VA/DoD Chronic Effects of Neurotrauma Consortium (CENC), a federally funded program that identifies gaps in research and provides support services for scientific, clinical, and translational research projects focused on the long-term effects of mild TBI in veterans and active-duty service members.
For information about the CENC, click here.
Persistent mutations tied to relapse, death in AML

Mutations that persist after initial chemotherapy may confer an increased risk of relapse and poor survival in patients with acute myeloid leukemia (AML), according to research published in JAMA.
Investigators found that patients who still had leukemia-specific mutations 30 days after they began chemotherapy had significantly shorter event-free and overall survival than patients whose bone marrow was free of these mutations.
These findings suggest genetic profiling of AML and other cancers may be more effective if it is focused less on the specific set of mutations present in a patient’s tumor at the time of diagnosis and more on whether those mutations are cleared by initial treatment with chemotherapy.
“If our results are confirmed in larger, prospective studies, genetic profiling after initial chemotherapy could help oncologists predict prognosis early in the course of a patient’s leukemia and determine whether that patient has responded to the chemotherapy, without having to wait for the cancer to recur,” said study author Jeffery M. Klco, MD, PhD, of St. Jude Children’s Research Hospital in Memphis, Tennessee.
“This approach to genetic profiling, which focuses on performing genome sequencing after a patient’s initial treatment, also may be useful for other cancers.”
To investigate the utility of this approach, Dr Klco and his colleagues conducted a retrospective study of AML patients. The team began with bone marrow samples from 71 AML patients treated with standard induction chemotherapy.
The investigators first sequenced these samples, which were obtained at the time of diagnosis, to see if the presence of mutations correlated with the outcome of chemotherapy. They found that mutations were no more informative than standard methods used to predict patient outcomes.
So the team sequenced samples obtained from 50 AML patients at the time of diagnosis and again 30 days after the initiation of chemotherapy, when the patients were in remission. Twenty-five of the 50 patients were from the first cohort of 71 patients, and 25 were new cases.
Analyzing these samples, the investigators found that 24 patients (48%) had persistent mutations in at least 5% of bone marrow cells after chemotherapy, even though, by standard clinical measures, they were in remission.
These patients had inferior event-free and overall survival when compared to the patients whose mutations had been cleared by initial chemotherapy.
The median event-free survival was 6 months and 17.9 months in patients with and without mutations, respectively (P<0.001). And the median overall survival was 10.5 months and 42 months, respectively (P=0.004).
The investigators noted that only a subset of the persistent mutations were in recurrently mutated AML genes (NPM1, FLT3, DNMT3A, etc.).
“These findings build on studies performed more than a decade ago that suggested the failure to clear leukemia cells bearing chromosomal abnormalities was associated with increased risk of relapse,” said study author Timothy J. Ley, MD, of the Washington University School of Medicine in St. Louis, Missouri.
“But that technology was applicable only for the subset of patients with abnormal chromosomes, while genome sequencing can detect mutations in virtually all patients and is much more sensitive and specific. This new approach gives us a way to think about how to use genomics to evaluate the risk of relapse for nearly all AML patients.” ![]()