User login
What is the difference between palliative care and hospice care?
Hospice care generally falls under the category of palliative care, despite being an older subspecialty. However, the two have different indications and goals and are often provided in different settings.
ORIGINS OF PALLIATIVE CARE
Prompted by what he perceived as neglect of dying patients in the acute care setting, Dr. Balfour Mount opened the first acute inpatient palliative care unit in Royal Victoria Hospital in Montréal, Québec, in 1976.1 His purpose was to provide a crisis-intervention service for patients who were actively dying, and this continues to be the main reason for consulting palliative care services in the hospital.
Palliative care has evolved since the 1970s and is now used in a variety of situations:
- A life-limiting illness in a patient who is not terminally ill
- A life-threatening illness in a patient who has symptoms but with the potential to recover
- A chronic illness such as heart failure or chronic obstructive pulmonary disease in a patient who is on disease-modifying therapy but has symptoms and will eventually succumb to the illness, but is expected to live longer than someone with advanced cancer.2
PALLIATIVE CARE IN CANCER PATIENTS
In patients with advanced cancer, palliative care is utilized earlier in the course of serious and life-limiting illness and is even involved in patient care when cure is the goal. Importantly, it now includes outpatient clinics to provide patients seamless care in conjunction with their oncologist’s care.3
Because palliative care focuses on the patient’s experience of the illness (sickness) rather than on disease itself (pathology), symptom management, psychosocial support, and assistance in decision-making are foremost. Initiating palliative care early in advanced cancer improves multiple outcomes and limits overly aggressive, ineffective therapies at the end of life (eg, late chemotherapy, late referral to hospice care, death in the intensive care unit), without hastening death. In fact, it may prolong life.3,4
Palliative care is indicated in a number of situations in oncology:
- Symptomatic presentations of cancer, even when curative treatments are available
- At the time of a sentinel event such as recurrence or unanticipated hospitalization
- When palliative radiation is needed
- When changes in chemotherapy are needed because of disease progression.
Also, cancer patients may develop symptoms that require a palliative procedure such as thoracentesis for pleural effusion, paracentesis for ascites, or surgery for a fracture or spinal cord compression. A palliative care consultation is also appropriate when patients change their goals of care (ie, palliation rather than cure), and when an oncologic crisis occurs and there is a need to offer support to the family and to clarify the goals of care.
PALLIATIVE CARE IN OTHER DISEASES
For patients with illnesses other than cancer, palliative care may be helpful when disease-modifying therapy becomes burdensome or ineffective, or when patients are symptomatic despite maximum therapy. Palliative care should also be considered when goals of care need to be explored, when a second opinion is needed on goals of care, or if the primary care provider and family are at odds.
WHEN A CONSULT IS INAPPROPRIATE
Palliative care consultation is inappropriate when used in lieu of an oncology consult in advanced cancer. Palliative care specialists are not experts in cancer care, whereas oncologists are familiar with rapid advancements in cancer care, including targeted agents that may offer benefit to patients with advanced cancer.
Palliative care consultation is also inappropriate if the patient does not want to see a palliative care specialist, or if the consult is used as a way to convince a patient to change advance directives or to choose not to be resuscitated. Also, cancer patients who are asymptomatic are unlikely to benefit from palliative care initially. The decision to consult palliative care should not depend on prognosis, and palliative care is more cost-effective when utilized early rather than as a crisis intervention near the end of life.3
THE PALLIATIVE CARE EVALUATION
The initial palliative care consultation usually involves an evaluation of the patient’s symptoms and concerns. Symptoms are targeted based on the patient’s priorities and on an assessment using validated questionnaires. A validated questionnaire is a better way to comprehensively gauge symptom burden than depending on patients to volunteer symptoms.5
As the relationship develops between patient, family, and palliative care specialist and as the disease takes its course, advance directives, prognosis, and end-of-life care goals can be addressed in follow-up consultations.3 Patients want to know about their prognosis, and they usually complete advance directives based on clinical circumstances rather than viewing them as an extension of patient autonomy, as originally intended.6
REIMBURSEMENT FOR PALLIATIVE CARE
Reimbursement for palliative care is similar to that for acute care and falls within the All Patient Refined Diagnosis-Related Group, or APR-DRG, system, and palliative care has its own V code for identification. Codes are used to designate disease, stage or location of metastases, disease complications, and symptoms, as well as for the discussion of goals of care.
WHAT PALLIATIVE CARE IS NOT
Palliative care has too often been tied to end-of-life care.7 The two often appear together in titles of reports in the literature. As a result, patients and physicians may be confused and, thus, reluctant to utilize palliative care services. To avoid the confusion, certain programs have included the term “supportive” oncology care in their title. This appears to facilitate palliative care referral, but may be misleading.8
WHAT IS HOSPICE CARE?
Hospice care is a service funded and capitated under Medicare part A and is largely provided as outpatient home care for those deemed terminally ill.9 An illness must be certified as terminal by two physicians. Medicare defines terminal illness as a life expectancy of 6 months or less if the illness runs its normal course.
The philosophy of hospice care is to provide comfort through intensive nurse management and home-based follow-up. In some cases, disease-modifying therapies are continued to control symptoms—eg, continuing angiotensin-converting enzyme inhibitors in heart failure patients. Hospice care is typically delivered at home, but it is also delivered in nursing homes, in hospital inpatient units, and at private or nonprofit hospice facilities.
Inpatient palliative care units are often mistaken for hospices. The purpose of hospice care is to provide quality of life and comfort and to avoid overly aggressive, expensive, and futile care at the end of life. The focus is on intensive, hands-on, personalized symptom care and family support at home. The goal is to provide a comfortable and dignified death among friends and family. The use of palliative radiation, transfusions, and antibiotics in hospice varies among hospice programs and is considered on a case-by-case basis.10
The Medicare per diem payment limits what hospices can afford, so they must be fiscally responsible. Hospice agencies are capitated and are responsible for providing medications and durable equipment necessary to treat symptoms related to the terminal illness. They also provide bereavement services for family members at no charge. Enrollment in hospice care can be revoked depending on circumstances and then reinstituted later as the goals of care change.
Care for nonterminal comorbid illnesses can be continued by a general practitioner or internist. This care is not covered under the Medicare hospice benefit, but it is covered under Medicare part B.
The patient and family can choose the hospice physician, who may be a family practitioner, internist, oncologist, or palliative care specialist, or may designate the hospice medical director as the hospice physician.
Criteria for hospice admission have been established for noncancer terminal illnesses and should be considered when practitioners decide to consult hospice.11–13
HOME-BASED PALLIATIVE CARE
Programs such as advanced illness management or home-based palliative care aim to improve the quality of care at home and prevent rehospitalization, particularly for patients with repeated hospitalizations.14 Home-based palliative care services are provided either by a clinician who makes home visits or by a certified home health care agency. Services are particularly useful for patients with serious illnesses who do not qualify for hospice services but are homebound. Consultations are obtained for ongoing supportive care at home, assessment for medication compliance, and disease monitoring at home. Consultations are scheduled at the time of hospital discharge.
Unlike hospice care, home-based palliative care does not include 24-hour on-call service. Comprehensive services (eg, home health aide, durable equipment, medications) are not provided as they are under hospice care: patients must qualify under Medicare stipulations for such services outside of hospice care. For example, home oxygen can only be supplied if the patient's oxygen saturation is less than 90%, while under the hospice benefit it is provided without regard to oxygen saturation and is based on symptom need. For home-based palliative care, patients must be largely homebound or unable to be seen regularly in the outpatient clinic. This type of care can be a bridge to hospice care for patients who feel they are not ready for hospice care at the time of discharge from acute care. Those who receive palliative care at home are less likely to be hospitalized at the end of life, are more likely to be transitioned to hospice at an appropriate time, and are more likely to have relief of symptoms.15
- Mount BM. The problem of caring for the dying in a general hospital; the palliative care unit as a possible solution. Can Med Assoc J 1976; 115:119–121.
- Higginson I. Palliative care: a review of past changes and future trends. J Public Health Med 1993; 15:3–8.
- Temel JS, Greer JA, Muzikansky A, et al. Early palliative care for patients with metastatic non-small-cell lung cancer. N Engl J Med 2010; 363:733–742.
- Zimmermann C, Riechelmann R, Krzyzanowska M, Rodin G, Tannock I. Effectiveness of specialized palliative care: a systematic review. JAMA 2008; 299:1698–1709.
- Homsi J, Walsh D, Rivera N, et al. Symptom evaluation in palliative medicine: patient report vs systematic assessment. Support Care Cancer 2006; 14:444–453.
- Tang ST, Liu TW, Lai MS, Liu LN, Chen CH, Koong SL. Congruence of knowledge, experiences, and p for disclosure of diagnosis and prognosis between terminally-ill cancer patients and their family caregivers in Taiwan. Cancer Invest 2006; 24:360–366.
- Bakitas M, Lyons KD, Hegel MT, Ahles T. Oncologists’ perspectives on concurrent palliative care in a National Cancer Institute-designated comprehensive cancer center. Palliat Support Care 2013; 11:415–423.
- Fadul N, Elsayem A, Palmer JL, et al. Supportive versus palliative care: what’s in a name: a survey of medical oncologists and midlevel providers at a comprehensive cancer center. Cancer 2009; 115:2013–2021.
- Rinaldo MJ. Medicare to cover hospice services. J Med Soc NJ 1982; 79:1015–1016.
- Enck RE. Palliative radiation therapy in hospice care. Am J Hosp Palliat Care 2002; 19:151–152.
- Luchins DJ, Hanrahan P, Murphy K. Criteria for enrolling dementia patients in hospice. J Am Geriatr Soc 1997; 45:1054–1059.
- Fox E, Landrum-McNiff K, Zhong Z, Dawson NV, Wu AW, Lynn J. Evaluation of prognostic criteria for determining hospice eligibility in patients with advanced lung, heart, or liver disease. JAMA 1999; 282:1638–1645.
- Stuart B. The NHO medical guidelines for non-cancer disease and local medical review policy: hospice access for patients with diseases other than cancer. Hosp J 1999; 14:139–154.
- McKinney M. Beyond hospice. New models of care focus on advanced illnesses. Mod Healthc 2013; 43:14–15.
- Gomes B, Calanzani N, Curiale V, McCrone P, Higginson IJ. Effectiveness and cost-effectiveness of home palliative care services for adults with advanced illness and their caregivers. Cochrane Database Syst Rev 2013; 6:CD007760.
Hospice care generally falls under the category of palliative care, despite being an older subspecialty. However, the two have different indications and goals and are often provided in different settings.
ORIGINS OF PALLIATIVE CARE
Prompted by what he perceived as neglect of dying patients in the acute care setting, Dr. Balfour Mount opened the first acute inpatient palliative care unit in Royal Victoria Hospital in Montréal, Québec, in 1976.1 His purpose was to provide a crisis-intervention service for patients who were actively dying, and this continues to be the main reason for consulting palliative care services in the hospital.
Palliative care has evolved since the 1970s and is now used in a variety of situations:
- A life-limiting illness in a patient who is not terminally ill
- A life-threatening illness in a patient who has symptoms but with the potential to recover
- A chronic illness such as heart failure or chronic obstructive pulmonary disease in a patient who is on disease-modifying therapy but has symptoms and will eventually succumb to the illness, but is expected to live longer than someone with advanced cancer.2
PALLIATIVE CARE IN CANCER PATIENTS
In patients with advanced cancer, palliative care is utilized earlier in the course of serious and life-limiting illness and is even involved in patient care when cure is the goal. Importantly, it now includes outpatient clinics to provide patients seamless care in conjunction with their oncologist’s care.3
Because palliative care focuses on the patient’s experience of the illness (sickness) rather than on disease itself (pathology), symptom management, psychosocial support, and assistance in decision-making are foremost. Initiating palliative care early in advanced cancer improves multiple outcomes and limits overly aggressive, ineffective therapies at the end of life (eg, late chemotherapy, late referral to hospice care, death in the intensive care unit), without hastening death. In fact, it may prolong life.3,4
Palliative care is indicated in a number of situations in oncology:
- Symptomatic presentations of cancer, even when curative treatments are available
- At the time of a sentinel event such as recurrence or unanticipated hospitalization
- When palliative radiation is needed
- When changes in chemotherapy are needed because of disease progression.
Also, cancer patients may develop symptoms that require a palliative procedure such as thoracentesis for pleural effusion, paracentesis for ascites, or surgery for a fracture or spinal cord compression. A palliative care consultation is also appropriate when patients change their goals of care (ie, palliation rather than cure), and when an oncologic crisis occurs and there is a need to offer support to the family and to clarify the goals of care.
PALLIATIVE CARE IN OTHER DISEASES
For patients with illnesses other than cancer, palliative care may be helpful when disease-modifying therapy becomes burdensome or ineffective, or when patients are symptomatic despite maximum therapy. Palliative care should also be considered when goals of care need to be explored, when a second opinion is needed on goals of care, or if the primary care provider and family are at odds.
WHEN A CONSULT IS INAPPROPRIATE
Palliative care consultation is inappropriate when used in lieu of an oncology consult in advanced cancer. Palliative care specialists are not experts in cancer care, whereas oncologists are familiar with rapid advancements in cancer care, including targeted agents that may offer benefit to patients with advanced cancer.
Palliative care consultation is also inappropriate if the patient does not want to see a palliative care specialist, or if the consult is used as a way to convince a patient to change advance directives or to choose not to be resuscitated. Also, cancer patients who are asymptomatic are unlikely to benefit from palliative care initially. The decision to consult palliative care should not depend on prognosis, and palliative care is more cost-effective when utilized early rather than as a crisis intervention near the end of life.3
THE PALLIATIVE CARE EVALUATION
The initial palliative care consultation usually involves an evaluation of the patient’s symptoms and concerns. Symptoms are targeted based on the patient’s priorities and on an assessment using validated questionnaires. A validated questionnaire is a better way to comprehensively gauge symptom burden than depending on patients to volunteer symptoms.5
As the relationship develops between patient, family, and palliative care specialist and as the disease takes its course, advance directives, prognosis, and end-of-life care goals can be addressed in follow-up consultations.3 Patients want to know about their prognosis, and they usually complete advance directives based on clinical circumstances rather than viewing them as an extension of patient autonomy, as originally intended.6
REIMBURSEMENT FOR PALLIATIVE CARE
Reimbursement for palliative care is similar to that for acute care and falls within the All Patient Refined Diagnosis-Related Group, or APR-DRG, system, and palliative care has its own V code for identification. Codes are used to designate disease, stage or location of metastases, disease complications, and symptoms, as well as for the discussion of goals of care.
WHAT PALLIATIVE CARE IS NOT
Palliative care has too often been tied to end-of-life care.7 The two often appear together in titles of reports in the literature. As a result, patients and physicians may be confused and, thus, reluctant to utilize palliative care services. To avoid the confusion, certain programs have included the term “supportive” oncology care in their title. This appears to facilitate palliative care referral, but may be misleading.8
WHAT IS HOSPICE CARE?
Hospice care is a service funded and capitated under Medicare part A and is largely provided as outpatient home care for those deemed terminally ill.9 An illness must be certified as terminal by two physicians. Medicare defines terminal illness as a life expectancy of 6 months or less if the illness runs its normal course.
The philosophy of hospice care is to provide comfort through intensive nurse management and home-based follow-up. In some cases, disease-modifying therapies are continued to control symptoms—eg, continuing angiotensin-converting enzyme inhibitors in heart failure patients. Hospice care is typically delivered at home, but it is also delivered in nursing homes, in hospital inpatient units, and at private or nonprofit hospice facilities.
Inpatient palliative care units are often mistaken for hospices. The purpose of hospice care is to provide quality of life and comfort and to avoid overly aggressive, expensive, and futile care at the end of life. The focus is on intensive, hands-on, personalized symptom care and family support at home. The goal is to provide a comfortable and dignified death among friends and family. The use of palliative radiation, transfusions, and antibiotics in hospice varies among hospice programs and is considered on a case-by-case basis.10
The Medicare per diem payment limits what hospices can afford, so they must be fiscally responsible. Hospice agencies are capitated and are responsible for providing medications and durable equipment necessary to treat symptoms related to the terminal illness. They also provide bereavement services for family members at no charge. Enrollment in hospice care can be revoked depending on circumstances and then reinstituted later as the goals of care change.
Care for nonterminal comorbid illnesses can be continued by a general practitioner or internist. This care is not covered under the Medicare hospice benefit, but it is covered under Medicare part B.
The patient and family can choose the hospice physician, who may be a family practitioner, internist, oncologist, or palliative care specialist, or may designate the hospice medical director as the hospice physician.
Criteria for hospice admission have been established for noncancer terminal illnesses and should be considered when practitioners decide to consult hospice.11–13
HOME-BASED PALLIATIVE CARE
Programs such as advanced illness management or home-based palliative care aim to improve the quality of care at home and prevent rehospitalization, particularly for patients with repeated hospitalizations.14 Home-based palliative care services are provided either by a clinician who makes home visits or by a certified home health care agency. Services are particularly useful for patients with serious illnesses who do not qualify for hospice services but are homebound. Consultations are obtained for ongoing supportive care at home, assessment for medication compliance, and disease monitoring at home. Consultations are scheduled at the time of hospital discharge.
Unlike hospice care, home-based palliative care does not include 24-hour on-call service. Comprehensive services (eg, home health aide, durable equipment, medications) are not provided as they are under hospice care: patients must qualify under Medicare stipulations for such services outside of hospice care. For example, home oxygen can only be supplied if the patient's oxygen saturation is less than 90%, while under the hospice benefit it is provided without regard to oxygen saturation and is based on symptom need. For home-based palliative care, patients must be largely homebound or unable to be seen regularly in the outpatient clinic. This type of care can be a bridge to hospice care for patients who feel they are not ready for hospice care at the time of discharge from acute care. Those who receive palliative care at home are less likely to be hospitalized at the end of life, are more likely to be transitioned to hospice at an appropriate time, and are more likely to have relief of symptoms.15
- Mount BM. The problem of caring for the dying in a general hospital; the palliative care unit as a possible solution. Can Med Assoc J 1976; 115:119–121.
- Higginson I. Palliative care: a review of past changes and future trends. J Public Health Med 1993; 15:3–8.
- Temel JS, Greer JA, Muzikansky A, et al. Early palliative care for patients with metastatic non-small-cell lung cancer. N Engl J Med 2010; 363:733–742.
- Zimmermann C, Riechelmann R, Krzyzanowska M, Rodin G, Tannock I. Effectiveness of specialized palliative care: a systematic review. JAMA 2008; 299:1698–1709.
- Homsi J, Walsh D, Rivera N, et al. Symptom evaluation in palliative medicine: patient report vs systematic assessment. Support Care Cancer 2006; 14:444–453.
- Tang ST, Liu TW, Lai MS, Liu LN, Chen CH, Koong SL. Congruence of knowledge, experiences, and p for disclosure of diagnosis and prognosis between terminally-ill cancer patients and their family caregivers in Taiwan. Cancer Invest 2006; 24:360–366.
- Bakitas M, Lyons KD, Hegel MT, Ahles T. Oncologists’ perspectives on concurrent palliative care in a National Cancer Institute-designated comprehensive cancer center. Palliat Support Care 2013; 11:415–423.
- Fadul N, Elsayem A, Palmer JL, et al. Supportive versus palliative care: what’s in a name: a survey of medical oncologists and midlevel providers at a comprehensive cancer center. Cancer 2009; 115:2013–2021.
- Rinaldo MJ. Medicare to cover hospice services. J Med Soc NJ 1982; 79:1015–1016.
- Enck RE. Palliative radiation therapy in hospice care. Am J Hosp Palliat Care 2002; 19:151–152.
- Luchins DJ, Hanrahan P, Murphy K. Criteria for enrolling dementia patients in hospice. J Am Geriatr Soc 1997; 45:1054–1059.
- Fox E, Landrum-McNiff K, Zhong Z, Dawson NV, Wu AW, Lynn J. Evaluation of prognostic criteria for determining hospice eligibility in patients with advanced lung, heart, or liver disease. JAMA 1999; 282:1638–1645.
- Stuart B. The NHO medical guidelines for non-cancer disease and local medical review policy: hospice access for patients with diseases other than cancer. Hosp J 1999; 14:139–154.
- McKinney M. Beyond hospice. New models of care focus on advanced illnesses. Mod Healthc 2013; 43:14–15.
- Gomes B, Calanzani N, Curiale V, McCrone P, Higginson IJ. Effectiveness and cost-effectiveness of home palliative care services for adults with advanced illness and their caregivers. Cochrane Database Syst Rev 2013; 6:CD007760.

Occult satellite metastasis of an auricular melanoma
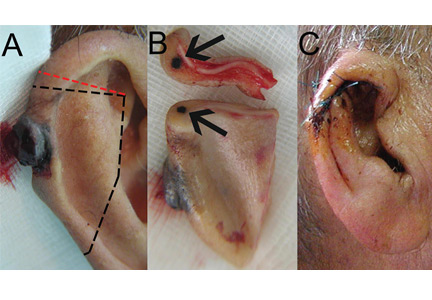
A 90-year-old man presented to our clinic with a dark, exophytic, hemorrhagic mass on the helix of his right auricle (Figure 1A). He had first noticed the lesion 6 months before.
Evaluation of the lesion with the standard ABCDE criteria (Asymmetry, Border irregularity, Color variation, Diameter > 6 mm, Evolution/elevation) raised our suspicion of melanoma.1 We performed a wide, full-thickness, auricular wedge resection, which revealed a second dark lesion in the subcutaneous tissue of the upper border of the resected specimen. The rest of the second lesion was evident on the corresponding location of the edge of the remaining auricle (Figure 1B). Thus, we excised an additional strip of auricular tissue. The aesthetic result of the auricular reconstruction was quite good (Figure 1C).

Histopathologic study confirmed cutaneous melanoma and showed the second lesion to be a satellite melanoma metastasis (Figure 2). The patient refused to undergo staging investigations for lymph node and distant metastases. He died 1 year later of ischemic stroke.
IN-TRANSIT AND SATELLITE METASTASES
Melanoma is highly metastatic. In addition to regional lymph node and distant metastases, patients may develop in-transit metastases and satellite metastases.
In-transit metastases grow more than 2 cm away from the primary tumor but not beyond the regional lymph node basin. Satellite lesions are found within 2 cm of the primary melanoma.
As seen in our patient, satellite metastases are not always cutaneous and evident. This is also true of in-transit melanoma lesions. They can also be located in subcutaneous tissue, making them difficult to detect. The presence of satellite lesions is a sign of aggressive disease and requires a thorough evaluation for metastases.2
- Thomas L, Tranchand P, Berard F, Secchi T, Colin C, Moulin G. Semiological value of ABCDE criteria in the diagnosis of cutaneous pigmented tumors. Dermatology 1998; 197:11–17.
- Homsi J, Kashani-Sabet M, Messina JL, Daud A. Cutaneous melanoma: prognostic factors. Cancer Control 2005; 12:223–229.
A 90-year-old man presented to our clinic with a dark, exophytic, hemorrhagic mass on the helix of his right auricle (Figure 1A). He had first noticed the lesion 6 months before.
Evaluation of the lesion with the standard ABCDE criteria (Asymmetry, Border irregularity, Color variation, Diameter > 6 mm, Evolution/elevation) raised our suspicion of melanoma.1 We performed a wide, full-thickness, auricular wedge resection, which revealed a second dark lesion in the subcutaneous tissue of the upper border of the resected specimen. The rest of the second lesion was evident on the corresponding location of the edge of the remaining auricle (Figure 1B). Thus, we excised an additional strip of auricular tissue. The aesthetic result of the auricular reconstruction was quite good (Figure 1C).
Histopathologic study confirmed cutaneous melanoma and showed the second lesion to be a satellite melanoma metastasis (Figure 2). The patient refused to undergo staging investigations for lymph node and distant metastases. He died 1 year later of ischemic stroke.
IN-TRANSIT AND SATELLITE METASTASES
Melanoma is highly metastatic. In addition to regional lymph node and distant metastases, patients may develop in-transit metastases and satellite metastases.
In-transit metastases grow more than 2 cm away from the primary tumor but not beyond the regional lymph node basin. Satellite lesions are found within 2 cm of the primary melanoma.
As seen in our patient, satellite metastases are not always cutaneous and evident. This is also true of in-transit melanoma lesions. They can also be located in subcutaneous tissue, making them difficult to detect. The presence of satellite lesions is a sign of aggressive disease and requires a thorough evaluation for metastases.2
- Thomas L, Tranchand P, Berard F, Secchi T, Colin C, Moulin G. Semiological value of ABCDE criteria in the diagnosis of cutaneous pigmented tumors. Dermatology 1998; 197:11–17.
- Homsi J, Kashani-Sabet M, Messina JL, Daud A. Cutaneous melanoma: prognostic factors. Cancer Control 2005; 12:223–229.
- Thomas L, Tranchand P, Berard F, Secchi T, Colin C, Moulin G. Semiological value of ABCDE criteria in the diagnosis of cutaneous pigmented tumors. Dermatology 1998; 197:11–17.
- Homsi J, Kashani-Sabet M, Messina JL, Daud A. Cutaneous melanoma: prognostic factors. Cancer Control 2005; 12:223–229.
2015 Update on Parkinson disease
This has been a boom year for Parkinson disease, with the US Food and Drug Administration (FDA) approving two new therapies, and with others in the pipeline.
This article details clinical signs of Parkinson disease, discusses functional imaging, provides an update on current thinking on disease pathogenesis, and gives an overview of managing parkinsonian symptoms and dyskinesias.
DIAGNOSIS REMAINS CLINICAL
Although a better understanding of Parkinson disease has been gained in recent years, with the recognition of several premotor features and potential biomarkers, its diagnosis is still primarily based on clinical motor findings. The four cardinal motor features have the mnemonic TRAP:
- Tremor at rest can be subtle, involving just the thumb, best observed when the patient is sitting with the hand resting on the lap; or it can be obvious, involving the entire hand, arm, feet, lips, and chin.
- Rigidity can be felt rather than seen, by slowly passively rotating the patient’s wrist or elbow and feeling resistance. The right and left sides often differ.
- Akinesia or bradykinesia (slowness or lack of movement) can be observed by having the patient walk down a hallway. One may observe reduced arm swing and hesitation in initiating movement.
- Postural instability usually develops later rather than sooner in the disease progression. The patient may need to hold onto someone to maintain balance when getting up or walking.
At least two features must be present to make the diagnosis of parkinsonism. One feature must be tremor or rigidity.
Although the criteria for parkinsonism appear simple, the diagnosis of Parkinson disease is not always clear-cut. For example, shaking can be secondary to a dopamine receptor-blocking medication, to anxiety, or to essential tremor; rigidity and slowness may be due to arthritis; and postural instability can result from a neuropathy. Moreover, other neurodegenerative parkinsonian disorders may respond to levodopa (at least initially) and may present with levodopa-induced dyskinesias. Robust response to levodopa and the occurrence of dyskinesias are two additional features that strongly suggest the diagnosis of Parkinson disease.
Supporting parkinsonian features include stooped posture, masked facies, micrographia (small handwriting), drooling, speech changes (eg, hypophonia or soft speech, stuttering, slurring, monotonic speech), and a shuffling, festinating gait (quick short steps as if falling forward).
PARKINSON MIMICS
Parkinsonism is a broader term than Parkinson disease or idiopathic Parkinson disease. It is characterized by akinetic rigidity and impaired motor activity that leads to reduced function and falls; behavioral changes also may occur.
In the United States, Parkinson disease is the most common cause of parkinsonism. Other nonneurodegenerative causes are drug-induced parkinsonism (due to dopamine receptor antagonists such as antipsychotic or antiemetic drugs), stroke (in the basal ganglia or frontal lobe), and normal-pressure hydrocephalus (causing lower-body parkinsonism). Mimics of parkinsonism include essential tremor and psychogenic parkinsonism.
Parkinsonism can also be caused by Parkinson-plus disorders, ie, neurodegenerative conditions characterized by parkinsonism along with additional signs and symptoms, as listed below. Parkinson-plus disorders include progressive supranuclear palsy, multiple system atrophy, corticobasal degeneration, and Lewy body disease.
Clinical features that suggest a diagnosis other than Parkinson disease include1:
- Poor response to adequate dosages of levodopa
- Early onset of postural instability and falls
- Axial rigidity (eg, stiff neck) more than appendicular rigidity
- Early dementia
- Supranuclear gaze palsy
- Unusual movements besides tremor, eg, limb dystonia, myoclonus, limb levitation or alien limb syndrome
- Profound autonomic dysfunction
- Psychotic symptoms before taking levodopa or dopaminergic medication.
The precise diagnosis of Parkinson-plus disorders is not critical, as the treatment is generally the same for all of them: ie, levodopa (if it shows some efficacy and is well tolerated), with additional symptomatic treatment for features such as depression, cognitive impairment, and autonomic dysfunction, and supportive therapy including physical, occupational, speech, and swallowing therapy.
IMAGING MAY ASSIST IN THE DIAGNOSIS
Dopamine transporter single-photon emission computed tomography (SPECT) is a functional imaging technique that supposedly reflects dopamine uptake by surviving presynaptic dopaminergic neurons in the striate bodies of the basal ganglia. Normal uptake shows distinct cashew-shaped enhancement bilaterally. In Parkinson disease, the enhanced areas are smaller and asymmetric, first with diminution of the tail (representing the putamen), then later involving the head (representing the caudate) along with the other striate bodies (Figure 1).
Dopamine transporter SPECT does not distinguish one neurodegenerative parkinsonian disorder from another. Therefore, it should not be used to distinguish Parkinson disease from other Parkinson-plus syndromes. But it does distinguish neurodegenerative parkinsonian disorders from nonneurodegenerative conditions and mimics, which have a normal result on dopamine transporter SPECT (Table 1).
SLOWING DISEASE PROGRESSION
Current treatments for Parkinson disease can significantly improve symptoms but, unfortunately, do not cure the disease or slow its progression. Testing whether agents modify the disease course is particularly difficult with Parkinson disease, because it affects individuals differently, has a wide spectrum of symptoms, has a long time course, and lacks definitive markers to monitor progression. Some agents have shown promise:
Caffeine. People who drink coffee are less likely to develop Parkinson disease, with the risk declining with the number of cups per day.2 For those who have the disease, drinking coffee is associated with reduced symptoms.
Exercise improves Parkinson disease and may prevent it, and some studies suggest that it can delay its progression.3 Exercise has been shown in an animal model to reduce the vulnerability of dopamine neurons to the toxic agent 6-hydroxydopamine.4 Functional magnetic resonance imaging studies have shown blood flow patterns before and after exercise that are similar to those seen in patients with and without Parkinson medication.3
Rasagiline, a monoamine oxidase B (MAO-B) inhibitor used for symptomatic treatment of Parkinson disease, had conflicting results in a neuroprotective clinical trial. Patients who received rasagiline 1 mg daily—but not those who received 2 mg daily—at the beginning of the trial had better Parkinson motor scores compared with patients who received rasagiline 9 months later.5
Inosine is a urate precursor that elevates urate levels in serum and the central nervous system. For unknown reasons, patients with Parkinson disease tend to have a low uric acid level, and higher levels are associated with milder disease. It is hoped that raising the uric acid level to a “pre-gout level” may slow the progression of Parkinson disease.
Isradipine, a calcium channel blocker, was found in an epidemiologic study of elderly patients to be associated with reduced likelihood of developing Parkinson disease.6 The drug is now undergoing clinical trials.
Smoking. Although cigarette smokers have long been recognized as having a very low risk of developing Parkinson disease, smoking is not recommended.
Agents found ineffective. Agents that have been tested and found ineffective in modifying the course of Parkinson disease include vitamin E, coenzyme Q10, riluzole, GPI-1485, pramipexole, cogane, CEP-1347, TCH-346, and creatine.
NOT JUST DOPAMINE—OR TREMORS
Dopamine deficiency is central to the current understanding of the pathogenesis of Parkinson disease and the focus of treatment efforts, but if dopamine deficiency were the only problem, replacing it should completely ameliorate all parkinsonian features. Other neurotransmitters also play roles: norepinephrine is implicated in orthostatic symptoms and apathy, acetylcholine in cognitive behaviors, glutamate in dyskinesias, and serotonin in depression, anxiety, and sleep abnormalities.
The most recognized area of involvement in the brain has traditionally been the substantia nigra in the midbrain. However, current thinking is that the disease starts lower in the caudal area of the brainstem (along with the olfactory tubercle), moves through the pons to the midbrain, then spreads across the cerebrum with extensive neocortical involvement.
Early premotor indicators are now recognized to occur 15 to 20 years before a tremor appears. The first signs are often hyposmia (diminished sense of smell, reflecting involvement of the olfactory tubercle) and constipation (reflecting involvement of the medulla and the vagus nucleus). With pons involvement, the patient can develop rapid eye movement sleep behavior disorder, depression, or anxiety. Only then does the disease spread to the midbrain and cause resting tremor, rigidity, and bradykinesia.7
Identifying the preclinical stages and starting disease-modifying treatments before the onset of motor symptoms may one day prove important, but at this point, the premotor symptoms (anosmia, constipation, depression) are too nonspecific to be useful, and such treatments have not yet been identified.
TREATMENT: LEVODOPA STILL PRIMARY
When to start drug treatment depends primarily on how much the symptoms bother the patient. Regardless of the clinician’s (or patient’s) belief in the benefits of delaying symptomatic treatment, it is universally considered necessary to start medication when gait problems develop because of the danger of a fall and resulting disability.
Carbidopa-levodopa combination therapy remains the most effective treatment; if it is not effective, another diagnosis may need to be considered. Carbidopa-levodopa improves tremor, rigidity, and bradykinesia, particularly in the early stages of Parkinson disease. It is well tolerated, has rapid onset, reduces the risk of death, and is the least expensive of the medications for Parkinson disease.
Immediate-release and continued-release formulations are available, as well as one that dissolves rapidly on the tongue and can be taken without water. An oral extended-release carbidopa-levodopa formulation (Rytary) was approved by the FDA in January 2015. Tablets are filled with drug-containing microbeads that dissolve at different rates to achieve therapeutic levodopa levels as quickly as the immediate-release formulation and maintain them for an extended time.8
The development of dyskinesias is the major psychological drawback of levodopa, occurring in 80% of patients after 5 to 10 years of treatment. Although many patients fear this side effect, most patients who develop it find it preferable to the rigidity and bradykinesia of Parkinson disease. In most cases, bothersome dyskinesias can be controlled by adjusting medications.9,10
Dopamine agonists include pramipexole, ropinirole, and rotigotine. They are available in generic form as three-times-daily dosing; once-daily dosing is also available, but not as a generic formulation. Dopamine agonists have the advantage of potentially improving depression and delaying the onset of dyskinesias.
However, dopamine agonists have a number of disadvantages compared with levodopa: they have a longer titration period, are less effective, and are less well tolerated, especially in the elderly. Side effects occur more frequently than with levodopa and include general and peripheral edema, hallucinations, nausea, lightheadedness, and sleepiness.11,12 These drugs are also associated with “sleep attacks” (sudden falling asleep while active, such as while driving or eating) and with compulsive and impulsive behaviors such as hypersexuality, buying, binge eating, and gambling. Although these behaviors occur in fewer than 10% of patients, they can be devastating, leading to marital, financial, and legal problems. A bothersome clinical state termed dopamine agonist withdrawal syndrome is characterized by anxiety, depression, jitteriness, and palpitations when dopamine agonists are tapered or discontinued because of a side effect.13
MAO-B inhibitors delay the breakdown of dopamine, allowing it to “stay” in the brain for a longer period of time. Rasagiline for early monotherapy has the advantages of once-daily dosing, no titration, and excellent tolerability, even in the elderly. Potential drug interactions should be considered when using this drug. Early warnings about interactions with tyramine-rich foods were lifted after trials showed that this was not a problem.14
Amantadine is an N-methyl-d-aspartate (NMDA) receptor antagonist often used in early Parkinson disease and for treatment of dyskinesias and fatigue. It is the only drug that is intrinsically antidyskinetic and also improves Parkinson symptoms.15 Side effects include leg swelling, livedo reticularis, and neuropsychiatric and anticholinergic effects.
Anticholinergic agents (eg, trihexyphenidyl) improve tremor but are not as useful for bradykinesia or rigidity, and often have anticholinergic effects such as mental dullness, dry mouth, dry eye, and urinary hesitancy, especially in the elderly, so they have a limited role in Parkinson treatment.
MOTOR COMPLICATIONS: FLUCTUATIONS AND DYSKINESIAS
Motor fluctuations are changes between the akinetic and mobile phases of Parkinson disease, or the off-periods and on-periods of drug treatment. A patient who is “off” is generally rigid and feels that the medication is not working. A patient who is “on” feels loose and mobile and that the medication is working. Variants of motor fluctuations include:
- End-of-dose deterioration
- Delayed onset of response (more than half an hour after taking medication)
- Drug-resistant offs—medication has become ineffective
- Random oscillation—on-off phenomenon
- Freezing—unpredictable inability to start or finish a movement.
Dyskinesias are abnormal involuntary movements such as writhing and twisting. They are associated with dopaminergic therapy at peak dose, when the drug starts to turn on or wear off (termed diphasic dyskinesias).16
The storage hypothesis provides a plausible explanation for the development of motor complications as the disease progresses. Although the half-life of levodopa is only 60 to 90 minutes, it is effective in early disease when given three times a day. It is believed that at this stage of the disease, enough dopaminergic neurons survive to “store” dopamine and release it as needed. As the disease progresses and dopaminergic neurons die, storage capacity diminishes, and the clinical effect slowly starts to approximate the pharmacokinetic profile of the drug. Upon taking the medication, the patient gets a surge of drug, causing dyskinesias, followed later by rigidity as the effect wears off since there are fewer surviving dopaminergic cells to store dopamine.
MANAGING DYSKINESIAS
Patients with dyskinesias should first be asked if they are bothered by them; not all patients are troubled by dyskinesias. If the movements only bother others (eg, family members), then education is often the only treatment needed. If the patient is uncomfortable, the following measures can be tried:
- Taking lower, more frequent doses of levodopa (however, risk of wearing off becomes a problem)
- Adding a dopamine agonist or MAO-B inhibitor while lowering the levodopa dose (however, MAO-B inhibitors pose a risk of side effects in elderly patients)
- Adding clozapine (periodic laboratory testing is required to monitor blood levels and liver and kidney function)
- Adding amantadine (however, this poses a risk of cognitive side effects).
Deep-brain-stimulation surgery is appropriate for select patients who are generally physically healthy, cognitively intact, and emotionally stable, with a strong family support system, but who are bothered by symptoms of parkinsonism (such as tremors), motor fluctuations, or dyskinesias.17
Infusion pump. In January 2015, the FDA approved a new system that continuously delivers levodopa-carbidopa in a 4:1 ratio in gel suspension for 16 hours directly into the small intestine, minimizing motor fluctuations. The patient changes the cartridge daily and turns it off at bedtime.
*Dr. Fernandez has received research support from AbbVie, Acadia, Auspex, Biotie Therapies, Civitas, Kyowa/ProStrakan, Michael J. Fox Foundation, Movement Disorders Society, NIH/NINDS, Parkinson Study Group, Rhythm, Synosia, and Teva. He also has received honoraria from Carling Communications, International Parkinson and Movement Disorders Society, The Ohio State University, and PRIME Education, Inc as a speaker in CME events. He has received honoraria from Biogen, GE Health Care, Lundbeck, Merz Pharmaceuticals, and Pfizer as a consultant. He has received royalty payments from Demos Publishing for serving as a book author/editor. Cleveland Clinic has contracts with AbbVie and Merz Pharmaceuticals for Dr. Fernandez’s role as a member of the Global Steering Committee for LCIG studies and as a consultant or speaker, and as Head Principal Investigator for the Xeomin Registry Study. Dr. Fernandez has received a stipend from International Parkinson and Movement Disorders Society for serving as medical editor of the Movement Disorders Society website.
- Wenning GK, Ben-Shlomo Y, Hughes A, Daniel SE, Lees A, Quinn NP. What clinical features are most useful to distinguish definite multiple system atrophy from Parkinson’s disease? J Neurol Neurosurg Psychiatry 2000; 68:434–440.
- Hernán MA, Takkouche B, Caamaño-Isoma F, et al. A meta-analysis of coffee drinking, cigarette smoking, and risk of Parkinson’s disease. Ann Neurol 2002; 52:276–84.
- Ridgel A, Thota A, Vitek JL, Alberts JL. Forced, not voluntary, exercise improves motor function in Parkinson’s disease patients. Neurorehabil Neural Repair 2009; 23:600–608.
- Smith AD, Zigmond MJ. Can the brain be protected through exercise? Lessons from an animal model of parkinsonism. Exp Neurol 2003; 184:31–39.
- Olanow CW, Rascol O, Hauser R, et al, for the ADAGIO Study Investigators. A double-blind, delayed-start trial of rasagiline in Parkinson’s disease. N Engl J Med 2009; 361:1268–1278.
- Pasternak B, Svanström H, Nielsen NM, Fugger L, Melbye M, Hviid A. Use of calcium channel blockers and Parkinson’s disease. Am J Epidemiol 2012; 175:627-635.
- Braak H, Del Tredici K, Rüb U, de Vos RAI, Jansen Steur ENH, Braak E. Staging of brain pathology related to sporadic Parkinson’s disease. Neurobiol Aging 2003; 24:197–211.
- Hauser RA, Ellenbogen AL, Metman LV, et al. Crossover comparison of IPX066 and a standard levodopa formulation in advanced Parkinson’s disease. Mov Disord 2011; 26:2246–2252.
- Hely MA, Morris JG, Reid WG, Trafficante R. Sydney Multicenter Study of Parkinson’s disease: non-L-dopa-responsive problems dominate at 15 years. Mov Disord 2005; 20:190–199.
- Hung SW, Adeli GM, Arenovich T, Fox SH, Lang AE. Patient perception of dyskinesia in Parkinson’s disease. J Neurol Neurosurg Psychiatry 2010; 81:1112–1115.
- Rascol O, Brooks DJ, Korczyn AD, De Deyn PP, Clarke CE, Lang AE. A five-year study of the incidence of dyskinesia in patients with early Parkinson’s disease who were treated with ropinirole or levodopa. N Engl J Med 2000; 342:1484–1491.
- Parkinson Study Group. Pramipexole vs levodopa as initial treatment for Parkinson disease: a randomized controlled trial. Parkinson Study Group. JAMA 2000; 284:1931–1938.
- Nirenberg MJ. Dopamine agonist withdrawal syndrome: implications for patient care. Drugs Aging 2013; 30:587–592.
- Teva Neuroscience, Inc. Azilect prescribing information. https://www.azilect.com/Content/pdf/azi-40850-azilect-electronic-pi.pdf. Accessed June 29, 2015.
- Snow BJ, Macdonald L, Mcauley D, Wallis W. The effect of amantadine on levodopa-induced dyskinesias in Parkinson’s disease: a double-blind, placebo-controlled study. Clin Neuropharmacol 2000; 23:82–85.
- Adler CH, Ahlskog JE, eds. Parkinson’s Disease and Movement Disorders: Diagnosis and Treatment Guidelines for the Practicing Physician. Totowa, NJ: Humana Press; 2000.
- Machado A, Fernandez HH, Deogaonkar M. Deep brain stimulation: what can patients expect from it? Cleve Clin J Med 2012; 79:113–120.
This has been a boom year for Parkinson disease, with the US Food and Drug Administration (FDA) approving two new therapies, and with others in the pipeline.
This article details clinical signs of Parkinson disease, discusses functional imaging, provides an update on current thinking on disease pathogenesis, and gives an overview of managing parkinsonian symptoms and dyskinesias.
DIAGNOSIS REMAINS CLINICAL
Although a better understanding of Parkinson disease has been gained in recent years, with the recognition of several premotor features and potential biomarkers, its diagnosis is still primarily based on clinical motor findings. The four cardinal motor features have the mnemonic TRAP:
- Tremor at rest can be subtle, involving just the thumb, best observed when the patient is sitting with the hand resting on the lap; or it can be obvious, involving the entire hand, arm, feet, lips, and chin.
- Rigidity can be felt rather than seen, by slowly passively rotating the patient’s wrist or elbow and feeling resistance. The right and left sides often differ.
- Akinesia or bradykinesia (slowness or lack of movement) can be observed by having the patient walk down a hallway. One may observe reduced arm swing and hesitation in initiating movement.
- Postural instability usually develops later rather than sooner in the disease progression. The patient may need to hold onto someone to maintain balance when getting up or walking.
At least two features must be present to make the diagnosis of parkinsonism. One feature must be tremor or rigidity.
Although the criteria for parkinsonism appear simple, the diagnosis of Parkinson disease is not always clear-cut. For example, shaking can be secondary to a dopamine receptor-blocking medication, to anxiety, or to essential tremor; rigidity and slowness may be due to arthritis; and postural instability can result from a neuropathy. Moreover, other neurodegenerative parkinsonian disorders may respond to levodopa (at least initially) and may present with levodopa-induced dyskinesias. Robust response to levodopa and the occurrence of dyskinesias are two additional features that strongly suggest the diagnosis of Parkinson disease.
Supporting parkinsonian features include stooped posture, masked facies, micrographia (small handwriting), drooling, speech changes (eg, hypophonia or soft speech, stuttering, slurring, monotonic speech), and a shuffling, festinating gait (quick short steps as if falling forward).
PARKINSON MIMICS
Parkinsonism is a broader term than Parkinson disease or idiopathic Parkinson disease. It is characterized by akinetic rigidity and impaired motor activity that leads to reduced function and falls; behavioral changes also may occur.
In the United States, Parkinson disease is the most common cause of parkinsonism. Other nonneurodegenerative causes are drug-induced parkinsonism (due to dopamine receptor antagonists such as antipsychotic or antiemetic drugs), stroke (in the basal ganglia or frontal lobe), and normal-pressure hydrocephalus (causing lower-body parkinsonism). Mimics of parkinsonism include essential tremor and psychogenic parkinsonism.
Parkinsonism can also be caused by Parkinson-plus disorders, ie, neurodegenerative conditions characterized by parkinsonism along with additional signs and symptoms, as listed below. Parkinson-plus disorders include progressive supranuclear palsy, multiple system atrophy, corticobasal degeneration, and Lewy body disease.
Clinical features that suggest a diagnosis other than Parkinson disease include1:
- Poor response to adequate dosages of levodopa
- Early onset of postural instability and falls
- Axial rigidity (eg, stiff neck) more than appendicular rigidity
- Early dementia
- Supranuclear gaze palsy
- Unusual movements besides tremor, eg, limb dystonia, myoclonus, limb levitation or alien limb syndrome
- Profound autonomic dysfunction
- Psychotic symptoms before taking levodopa or dopaminergic medication.
The precise diagnosis of Parkinson-plus disorders is not critical, as the treatment is generally the same for all of them: ie, levodopa (if it shows some efficacy and is well tolerated), with additional symptomatic treatment for features such as depression, cognitive impairment, and autonomic dysfunction, and supportive therapy including physical, occupational, speech, and swallowing therapy.
IMAGING MAY ASSIST IN THE DIAGNOSIS
Dopamine transporter single-photon emission computed tomography (SPECT) is a functional imaging technique that supposedly reflects dopamine uptake by surviving presynaptic dopaminergic neurons in the striate bodies of the basal ganglia. Normal uptake shows distinct cashew-shaped enhancement bilaterally. In Parkinson disease, the enhanced areas are smaller and asymmetric, first with diminution of the tail (representing the putamen), then later involving the head (representing the caudate) along with the other striate bodies (Figure 1).
Dopamine transporter SPECT does not distinguish one neurodegenerative parkinsonian disorder from another. Therefore, it should not be used to distinguish Parkinson disease from other Parkinson-plus syndromes. But it does distinguish neurodegenerative parkinsonian disorders from nonneurodegenerative conditions and mimics, which have a normal result on dopamine transporter SPECT (Table 1).
SLOWING DISEASE PROGRESSION
Current treatments for Parkinson disease can significantly improve symptoms but, unfortunately, do not cure the disease or slow its progression. Testing whether agents modify the disease course is particularly difficult with Parkinson disease, because it affects individuals differently, has a wide spectrum of symptoms, has a long time course, and lacks definitive markers to monitor progression. Some agents have shown promise:
Caffeine. People who drink coffee are less likely to develop Parkinson disease, with the risk declining with the number of cups per day.2 For those who have the disease, drinking coffee is associated with reduced symptoms.
Exercise improves Parkinson disease and may prevent it, and some studies suggest that it can delay its progression.3 Exercise has been shown in an animal model to reduce the vulnerability of dopamine neurons to the toxic agent 6-hydroxydopamine.4 Functional magnetic resonance imaging studies have shown blood flow patterns before and after exercise that are similar to those seen in patients with and without Parkinson medication.3
Rasagiline, a monoamine oxidase B (MAO-B) inhibitor used for symptomatic treatment of Parkinson disease, had conflicting results in a neuroprotective clinical trial. Patients who received rasagiline 1 mg daily—but not those who received 2 mg daily—at the beginning of the trial had better Parkinson motor scores compared with patients who received rasagiline 9 months later.5
Inosine is a urate precursor that elevates urate levels in serum and the central nervous system. For unknown reasons, patients with Parkinson disease tend to have a low uric acid level, and higher levels are associated with milder disease. It is hoped that raising the uric acid level to a “pre-gout level” may slow the progression of Parkinson disease.
Isradipine, a calcium channel blocker, was found in an epidemiologic study of elderly patients to be associated with reduced likelihood of developing Parkinson disease.6 The drug is now undergoing clinical trials.
Smoking. Although cigarette smokers have long been recognized as having a very low risk of developing Parkinson disease, smoking is not recommended.
Agents found ineffective. Agents that have been tested and found ineffective in modifying the course of Parkinson disease include vitamin E, coenzyme Q10, riluzole, GPI-1485, pramipexole, cogane, CEP-1347, TCH-346, and creatine.
NOT JUST DOPAMINE—OR TREMORS
Dopamine deficiency is central to the current understanding of the pathogenesis of Parkinson disease and the focus of treatment efforts, but if dopamine deficiency were the only problem, replacing it should completely ameliorate all parkinsonian features. Other neurotransmitters also play roles: norepinephrine is implicated in orthostatic symptoms and apathy, acetylcholine in cognitive behaviors, glutamate in dyskinesias, and serotonin in depression, anxiety, and sleep abnormalities.
The most recognized area of involvement in the brain has traditionally been the substantia nigra in the midbrain. However, current thinking is that the disease starts lower in the caudal area of the brainstem (along with the olfactory tubercle), moves through the pons to the midbrain, then spreads across the cerebrum with extensive neocortical involvement.
Early premotor indicators are now recognized to occur 15 to 20 years before a tremor appears. The first signs are often hyposmia (diminished sense of smell, reflecting involvement of the olfactory tubercle) and constipation (reflecting involvement of the medulla and the vagus nucleus). With pons involvement, the patient can develop rapid eye movement sleep behavior disorder, depression, or anxiety. Only then does the disease spread to the midbrain and cause resting tremor, rigidity, and bradykinesia.7
Identifying the preclinical stages and starting disease-modifying treatments before the onset of motor symptoms may one day prove important, but at this point, the premotor symptoms (anosmia, constipation, depression) are too nonspecific to be useful, and such treatments have not yet been identified.
TREATMENT: LEVODOPA STILL PRIMARY
When to start drug treatment depends primarily on how much the symptoms bother the patient. Regardless of the clinician’s (or patient’s) belief in the benefits of delaying symptomatic treatment, it is universally considered necessary to start medication when gait problems develop because of the danger of a fall and resulting disability.
Carbidopa-levodopa combination therapy remains the most effective treatment; if it is not effective, another diagnosis may need to be considered. Carbidopa-levodopa improves tremor, rigidity, and bradykinesia, particularly in the early stages of Parkinson disease. It is well tolerated, has rapid onset, reduces the risk of death, and is the least expensive of the medications for Parkinson disease.
Immediate-release and continued-release formulations are available, as well as one that dissolves rapidly on the tongue and can be taken without water. An oral extended-release carbidopa-levodopa formulation (Rytary) was approved by the FDA in January 2015. Tablets are filled with drug-containing microbeads that dissolve at different rates to achieve therapeutic levodopa levels as quickly as the immediate-release formulation and maintain them for an extended time.8
The development of dyskinesias is the major psychological drawback of levodopa, occurring in 80% of patients after 5 to 10 years of treatment. Although many patients fear this side effect, most patients who develop it find it preferable to the rigidity and bradykinesia of Parkinson disease. In most cases, bothersome dyskinesias can be controlled by adjusting medications.9,10
Dopamine agonists include pramipexole, ropinirole, and rotigotine. They are available in generic form as three-times-daily dosing; once-daily dosing is also available, but not as a generic formulation. Dopamine agonists have the advantage of potentially improving depression and delaying the onset of dyskinesias.
However, dopamine agonists have a number of disadvantages compared with levodopa: they have a longer titration period, are less effective, and are less well tolerated, especially in the elderly. Side effects occur more frequently than with levodopa and include general and peripheral edema, hallucinations, nausea, lightheadedness, and sleepiness.11,12 These drugs are also associated with “sleep attacks” (sudden falling asleep while active, such as while driving or eating) and with compulsive and impulsive behaviors such as hypersexuality, buying, binge eating, and gambling. Although these behaviors occur in fewer than 10% of patients, they can be devastating, leading to marital, financial, and legal problems. A bothersome clinical state termed dopamine agonist withdrawal syndrome is characterized by anxiety, depression, jitteriness, and palpitations when dopamine agonists are tapered or discontinued because of a side effect.13
MAO-B inhibitors delay the breakdown of dopamine, allowing it to “stay” in the brain for a longer period of time. Rasagiline for early monotherapy has the advantages of once-daily dosing, no titration, and excellent tolerability, even in the elderly. Potential drug interactions should be considered when using this drug. Early warnings about interactions with tyramine-rich foods were lifted after trials showed that this was not a problem.14
Amantadine is an N-methyl-d-aspartate (NMDA) receptor antagonist often used in early Parkinson disease and for treatment of dyskinesias and fatigue. It is the only drug that is intrinsically antidyskinetic and also improves Parkinson symptoms.15 Side effects include leg swelling, livedo reticularis, and neuropsychiatric and anticholinergic effects.
Anticholinergic agents (eg, trihexyphenidyl) improve tremor but are not as useful for bradykinesia or rigidity, and often have anticholinergic effects such as mental dullness, dry mouth, dry eye, and urinary hesitancy, especially in the elderly, so they have a limited role in Parkinson treatment.
MOTOR COMPLICATIONS: FLUCTUATIONS AND DYSKINESIAS
Motor fluctuations are changes between the akinetic and mobile phases of Parkinson disease, or the off-periods and on-periods of drug treatment. A patient who is “off” is generally rigid and feels that the medication is not working. A patient who is “on” feels loose and mobile and that the medication is working. Variants of motor fluctuations include:
- End-of-dose deterioration
- Delayed onset of response (more than half an hour after taking medication)
- Drug-resistant offs—medication has become ineffective
- Random oscillation—on-off phenomenon
- Freezing—unpredictable inability to start or finish a movement.
Dyskinesias are abnormal involuntary movements such as writhing and twisting. They are associated with dopaminergic therapy at peak dose, when the drug starts to turn on or wear off (termed diphasic dyskinesias).16
The storage hypothesis provides a plausible explanation for the development of motor complications as the disease progresses. Although the half-life of levodopa is only 60 to 90 minutes, it is effective in early disease when given three times a day. It is believed that at this stage of the disease, enough dopaminergic neurons survive to “store” dopamine and release it as needed. As the disease progresses and dopaminergic neurons die, storage capacity diminishes, and the clinical effect slowly starts to approximate the pharmacokinetic profile of the drug. Upon taking the medication, the patient gets a surge of drug, causing dyskinesias, followed later by rigidity as the effect wears off since there are fewer surviving dopaminergic cells to store dopamine.
MANAGING DYSKINESIAS
Patients with dyskinesias should first be asked if they are bothered by them; not all patients are troubled by dyskinesias. If the movements only bother others (eg, family members), then education is often the only treatment needed. If the patient is uncomfortable, the following measures can be tried:
- Taking lower, more frequent doses of levodopa (however, risk of wearing off becomes a problem)
- Adding a dopamine agonist or MAO-B inhibitor while lowering the levodopa dose (however, MAO-B inhibitors pose a risk of side effects in elderly patients)
- Adding clozapine (periodic laboratory testing is required to monitor blood levels and liver and kidney function)
- Adding amantadine (however, this poses a risk of cognitive side effects).
Deep-brain-stimulation surgery is appropriate for select patients who are generally physically healthy, cognitively intact, and emotionally stable, with a strong family support system, but who are bothered by symptoms of parkinsonism (such as tremors), motor fluctuations, or dyskinesias.17
Infusion pump. In January 2015, the FDA approved a new system that continuously delivers levodopa-carbidopa in a 4:1 ratio in gel suspension for 16 hours directly into the small intestine, minimizing motor fluctuations. The patient changes the cartridge daily and turns it off at bedtime.
*Dr. Fernandez has received research support from AbbVie, Acadia, Auspex, Biotie Therapies, Civitas, Kyowa/ProStrakan, Michael J. Fox Foundation, Movement Disorders Society, NIH/NINDS, Parkinson Study Group, Rhythm, Synosia, and Teva. He also has received honoraria from Carling Communications, International Parkinson and Movement Disorders Society, The Ohio State University, and PRIME Education, Inc as a speaker in CME events. He has received honoraria from Biogen, GE Health Care, Lundbeck, Merz Pharmaceuticals, and Pfizer as a consultant. He has received royalty payments from Demos Publishing for serving as a book author/editor. Cleveland Clinic has contracts with AbbVie and Merz Pharmaceuticals for Dr. Fernandez’s role as a member of the Global Steering Committee for LCIG studies and as a consultant or speaker, and as Head Principal Investigator for the Xeomin Registry Study. Dr. Fernandez has received a stipend from International Parkinson and Movement Disorders Society for serving as medical editor of the Movement Disorders Society website.
- Wenning GK, Ben-Shlomo Y, Hughes A, Daniel SE, Lees A, Quinn NP. What clinical features are most useful to distinguish definite multiple system atrophy from Parkinson’s disease? J Neurol Neurosurg Psychiatry 2000; 68:434–440.
- Hernán MA, Takkouche B, Caamaño-Isoma F, et al. A meta-analysis of coffee drinking, cigarette smoking, and risk of Parkinson’s disease. Ann Neurol 2002; 52:276–84.
- Ridgel A, Thota A, Vitek JL, Alberts JL. Forced, not voluntary, exercise improves motor function in Parkinson’s disease patients. Neurorehabil Neural Repair 2009; 23:600–608.
- Smith AD, Zigmond MJ. Can the brain be protected through exercise? Lessons from an animal model of parkinsonism. Exp Neurol 2003; 184:31–39.
- Olanow CW, Rascol O, Hauser R, et al, for the ADAGIO Study Investigators. A double-blind, delayed-start trial of rasagiline in Parkinson’s disease. N Engl J Med 2009; 361:1268–1278.
- Pasternak B, Svanström H, Nielsen NM, Fugger L, Melbye M, Hviid A. Use of calcium channel blockers and Parkinson’s disease. Am J Epidemiol 2012; 175:627-635.
- Braak H, Del Tredici K, Rüb U, de Vos RAI, Jansen Steur ENH, Braak E. Staging of brain pathology related to sporadic Parkinson’s disease. Neurobiol Aging 2003; 24:197–211.
- Hauser RA, Ellenbogen AL, Metman LV, et al. Crossover comparison of IPX066 and a standard levodopa formulation in advanced Parkinson’s disease. Mov Disord 2011; 26:2246–2252.
- Hely MA, Morris JG, Reid WG, Trafficante R. Sydney Multicenter Study of Parkinson’s disease: non-L-dopa-responsive problems dominate at 15 years. Mov Disord 2005; 20:190–199.
- Hung SW, Adeli GM, Arenovich T, Fox SH, Lang AE. Patient perception of dyskinesia in Parkinson’s disease. J Neurol Neurosurg Psychiatry 2010; 81:1112–1115.
- Rascol O, Brooks DJ, Korczyn AD, De Deyn PP, Clarke CE, Lang AE. A five-year study of the incidence of dyskinesia in patients with early Parkinson’s disease who were treated with ropinirole or levodopa. N Engl J Med 2000; 342:1484–1491.
- Parkinson Study Group. Pramipexole vs levodopa as initial treatment for Parkinson disease: a randomized controlled trial. Parkinson Study Group. JAMA 2000; 284:1931–1938.
- Nirenberg MJ. Dopamine agonist withdrawal syndrome: implications for patient care. Drugs Aging 2013; 30:587–592.
- Teva Neuroscience, Inc. Azilect prescribing information. https://www.azilect.com/Content/pdf/azi-40850-azilect-electronic-pi.pdf. Accessed June 29, 2015.
- Snow BJ, Macdonald L, Mcauley D, Wallis W. The effect of amantadine on levodopa-induced dyskinesias in Parkinson’s disease: a double-blind, placebo-controlled study. Clin Neuropharmacol 2000; 23:82–85.
- Adler CH, Ahlskog JE, eds. Parkinson’s Disease and Movement Disorders: Diagnosis and Treatment Guidelines for the Practicing Physician. Totowa, NJ: Humana Press; 2000.
- Machado A, Fernandez HH, Deogaonkar M. Deep brain stimulation: what can patients expect from it? Cleve Clin J Med 2012; 79:113–120.
KEY POINTS
- Parkinson disease is diagnosed by clinical signs with the mnemonic TRAP: Tremor at rest, Rigidity, Akinesia or bradykinesia, and Postural/gait instability.
- A dopamine transporter functional scan can distinguish neurodegenerative parkinsonian disorders from nonneurodegenerative etiologies such as drug-induced parkinsonism and vascular parkinsonism, and from mimics such as psychogenic parkinsonism and essential tremor.
- Coffee consumption and exercise may benefit patients with Parkinson disease.
- Carbidopa-levodopa combination therapy is still the most effective treatment, but most patients develop dyskinesia after 5 to 10 years of treatment.
- Dyskinesias can be managed by adjusting or changing medications, switching to the new levodopa infusion pump system, or with deep-brain-stimulation surgery.
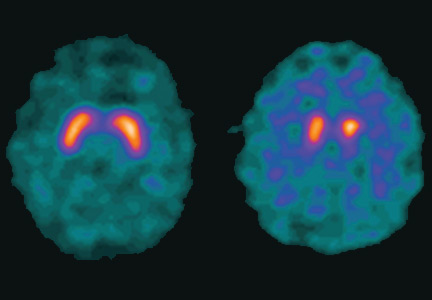
Perioperative MI: Data, practice, and questions

Except in emergency or specific high-risk surgery, or for extremely fragile high-risk patients, we anticipate a successful outcome from noncardiac surgery. The skills and tools of our anesthesiology colleagues have advanced to the point that severe intraoperative and immediate postoperative complications are rare.
Preoperative risk assessment and perioperative medical management in large medical centers are now largely done by hospital-based physicians with interest and expertise in this subspecialty, and are integrated into the care of the surgical patient. This has likely contributed to improved patient outcomes. Yet postoperative cardiovascular events still cause significant morbidity (although they generally occur in less than 10% of patients).
The entity of perioperative myocardial infarction (MI) has an interesting history. We have recognized for several decades that its presentation is often different than the usually diagnosed MI: perioperative MI is often painless and may manifest as unexplained sinus tachycardia, subtle changes in mental status, or mild dyspnea. These symptoms, if they occurred while the patient was at home, would often be mild enough that the patient would not seek immediate medical attention. Autopsy studies suggested that many of these MIs result from a different pathophysiology than the garden variety MI; plaque rupture with or without secondary thrombosis may be less common than myocardial injury resulting from an imbalance between cardiac demand and blood flow. Studies initially suggested that postoperative MI occurred many days after the surgery. But as tests to diagnose myocyte injury became more sensitive (electrocardiography, creatine kinase, creatine kinase MB, and now troponin), it was recognized that cardiac injury actually occurred very soon after or even during surgery.
With the advent of highly sensitive and fairly specific troponin assays, it seems that perioperative cardiac injury is extremely common, perhaps occurring in up to 20% of patients (if we include patients at high risk based on traditional criteria). This has led to the newly described entity of “myocardial injury after noncardiac surgery” (MINS). MINS patients, diagnosed by troponin elevations, usually are asymptomatic, and many do not meet criteria for any type of MI. But strikingly, as discussed in this issue of the Journal by Horr et al, simply having a postoperative troponin elevation predicts an increased risk of clinical cardiovascular events and a decreased 30-day survival rate.
Adding postoperative troponin measurement to the usual preoperative screening protocol significantly increases our ability to predict delayed cardiovascular events and mortality. As pointed out by Cohn in his accompanying editorial, the benefit, if any, of screening low-risk patients remains to be defined. But an even more important issue, as commented upon in both papers, is what to do when an elevated troponin is detected in a postoperative patient who is otherwise doing perfectly well. Given our current knowledge of the pathophysiology of postoperative MI and the still overall low mortality, it seems unreasonable to immediately take all of these patients to the catheterization suite. Yet with current knowledge of the prognostic significance of troponin elevation, this can’t be ignored. Should all patients receive immediate high-intensity statin therapy, antiplatelet therapy if safe in the specific perioperative setting, and postdischarge physiologic stress studies, or should we “just” take it as a potential high-impact teaching moment and advise patients of their increased cardiovascular risk and offer our usual heart-healthy admonitions?
The confirmed observation that postoperative troponin elevation predicts morbidity and mortality over the subsequent 30 days, and perhaps even longer, has triggered the start of several interventional trials. The results of these will, hopefully, help us to further improve perioperative outcomes.
Postoperative troponin surveillance: A diagnostic dilemma
A major goal of perioperative medicine is to prevent, detect, and treat postoperative complications—in particular, cardiovascular complications. In the Perioperative Ischemic Evaluation (POISE) study,1 the 30-day mortality rate was four times higher in patients who had a perioperative myocardial infarction (MI) than in those who did not.1 Yet fewer than half of patients who have a postoperative MI have ischemic symptoms, suggesting that routine monitoring of cardiac biomarkers could detect these events and allow early intervention.
From 10% to 20% of patients have troponin elevations after noncardiac surgery.2 But until recently, many of these elevations were thought to be of minor importance and were ignored unless the patient met diagnostic criteria for MI. A new entity called MINS (myocardial injury after noncardiac surgery)3 was defined as a troponin level exceeding the upper limit of normal with or without ischemic symptoms or electrocardiographic changes and excluding noncardiac causes such as stroke, sepsis, and pulmonary embolism. Because elevations of troponin at any level have been associated with increased 30-day mortality rates, the question of the value of routine screening of asymptomatic postoperative patients for troponin elevation has been raised.
In this issue of Cleveland Clinic Journal of Medicine, Horr et al4 review the controversy of postoperative screening using troponin measurement and propose an algorithm for management.
QUESTIONS TO CONSIDER
Before recommending screening asymptomatic patients for troponin elevation, we need to consider a number of questions:
- Which patients should be screened?
- How should troponin elevations be treated?
- Would casting a wider net improve outcomes?
- What are the possible harms of troponin screening?
The bottom line is, will postoperative troponin screening change management and result in improved outcomes?
WHICH PATIENTS SHOULD BE SCREENED?
Why routine screening may be indicated
Elevated or even just detectable troponin levels are associated with adverse outcomes. A systematic review and meta-analysis of 3,318 patients2 demonstrated that high troponin levels after noncardiac surgery were independently associated with a risk of death three times higher than in patients with normal troponin levels.
In the Vascular Events in Noncardiac Surgery Patients Cohort Evaluation (VISION) study,5 troponin T was measured in 15,133 patients after surgery. The overall mortality rate was 1.9%, and the higher the peak troponin T level the higher the risk of death.
In a single-center Canadian retrospective cohort analysis of 51,701 consecutive patients by Beattie et al,6 the peak postoperative level of troponin I improved the ability of a multivariable model to predict the risk of death. As in the VISION study, the mortality rate rose with the troponin level.6
In a study by van Waes et al7 in 2,232 consecutive noncardiac surgery patients over age 60 at intermediate to high risk, the all-cause mortality rate was 3%, and troponin I was elevated in 19% of patients. As in VISION and the Canadian retrospective study, the mortality rate increased with the troponin level.
Why routine screening may not help
In VISION,5 the probability of detecting myocardial injury was three times higher if patients were screened for 3 days after surgery than if they were tested only if clinical signs or symptoms indicated it.
However, in deciding whether to screen troponin levels in postoperative patients, we must take into account the patient’s clinical risk as well as the risk of the surgical procedure. Troponin elevation in low-risk patients is associated with a low mortality rate, and troponin elevations often are secondary to causes other than myocardial ischemia. In the study by van Waes et al,7 the association was stronger with all-cause mortality than with myocardial infarction, and in VISION5 there were more nonvascular deaths than vascular deaths, suggesting that troponin elevation is a nonspecific marker of adverse events.
Beattie et al6 found that the probability that a patient’s postoperative troponin level would be elevated increased as the patient’s clinical risk increased, but the yield was very low and the mortality rate was less than 1% in patients in risk classes 1 through 3 (of a possible 5 classes). In risk class 4, troponin I was elevated in 21.8%, and the mortality rate was 2.5%; in risk class 5 troponin I was elevated in 18.6%, and the mortality rate was 11.9%. Analyzing the data according to the type of surgery, mortality rates were highest in patients undergoing vascular surgery, neurosurgery, general surgery, and thoracic procedures, with all-cause mortality rates ranging from 2.6% to 5.2%.6
Screening should depend on risk
If postoperative troponin screening is to be recommended, it should not be routine for all patients but should be restricted to those with high clinical risk and those undergoing high-risk surgical procedures.
Rodseth and Devereaux8 recommended routine postoperative troponin measurement not only after vascular surgery, but also after high-risk surgery (general, neurosurgery, emergency surgery), as well as in patients over age 65 and patients with established atherosclerotic disease or risk factors for it. However, I believe this latter group may not be at high enough risk to justify routine screening.
Beattie et al6 advocated limiting postoperative troponin screening to patients with at least a moderate risk of MI and also suggested an international consensus conference to define criteria for postoperative MI, populations who should have routine postoperative screening, and consensus on treatment of patients with troponin elevations but not meeting the criteria for MI. Without this consensus on treatment, it is unclear if protocols for universal postoperative screening would improve outcomes.
For these reasons, the 2014 joint guidelines of the American College of Cardiology and American Heart Association9 (ACC/AHA) stated that the benefit of postoperative screening of troponin levels in patients with a high perioperative risk of MI but no signs or symptoms of myocardial ischemia or MI is “uncertain in the absence of established risks and benefits of a defined management strategy.” This recommendation was given a class IIb rating (may be considered) and level of evidence B (usefulness or efficacy less well established). On the other hand, the guidelines recommend measuring troponin levels if signs or symptoms suggest myocardial ischemia or MI (class I recommendation, level of evidence A) but state there is no benefit in routine screening of unselected patients without signs or symptoms of ischemia (class III recommendation, level of evidence B).
HOW SHOULD ELEVATIONS BE TREATED?
Because a troponin elevation in a patient without signs or symptoms of ischemia does not predict a specific type of death, physicians need to treat patients individually. Perioperative ischemia and inflammation could lead to injury of other organs, and death could result from multiorgan injury rather than from myocardial injury. Treating these troponin elevations in the same way we treat MI—ie, with antiplatelet therapy and anticoagulation—may result in increased bleeding or unnecessary cardiac catheterization, and starting beta-blockers in the perioperative period may be harmful. Because it is unclear how to manage these patients, cardiac medications have not routinely been given in previous studies.
POISE provided some evidence that patients with postoperative MI who were given aspirin and a statin did better.1 And the results of a smaller study10 suggested that intensification of drug therapy (aspirin, statin, beta-blocker, angiotensin-converting enzyme inhibitor) in patients with postoperative troponin I elevations was associated with improved outcomes at 1 year. If the bleeding risk is low, I believe that there is potential benefit in prescribing aspirin and statins for these patients.
CASTING A WIDER NET
Further complicating matters in the near future is the issue of using fifth-generation high-sensitivity troponin T assays. The European Society of Cardiology guidelines11 are somewhat more liberal than the ACC/AHA guidelines, stating that measuring high-sensitivity troponin after surgery “may be considered in high-risk patients to improve risk stratification.” This is a class IIB recommendation, level of evidence B.
With fifth-generation high-sensitivity troponin assays, troponin may be elevated in as many as 20% of patients preoperatively and 40% postoperatively, significantly increasing the number of patients said to have a complication. Besides potentially subjecting these patients to unproven treatments, such results would give the false impression that hospitals and surgeons using the screening tools actually had higher complication rates than those that did not screen.
POSSIBLE HARMS OF SCREENING
Elevated postoperative troponin may identify patients at higher risk of any adverse event but not specifically of cardiac-specific events. In an editorial, Beckman12 stated that routine measurement of troponin “is more likely to cause harm than to provide benefit and should not be used as a screening modality” because of the lack of a proven beneficial treatment strategy, because of the possible harm from applying the standard treatment for type 1 MI, and because it could divert attention from a true cause of an adverse event to a false one—ie, from a nonvascular condition to MI.11
There is clearly a need for clinical trials to determine which treatment, if any, can improve outcomes in these patients, and several trials have been started. But until we have evidence, we can only speculate as to whether screening postoperative patients for troponin elevation is beneficial or detrimental.
- Devereaux PJ, Xavier D, Pogue J, et al. Characteristics and short-term prognosis of perioperative myocardial infarction in patients undergoing noncardiac surgery: a cohort study. Ann Intern Med 2011; 154:523–528.
- Levy M, Heels-Ansdell D, Hiralal R, et al. Prognostic value of troponin and creatine kinase muscle and brain isoenzyme measurement after noncardiac surgery: a systematic review and meta-analysis. Anesthesiology 2011; 114:796–806.
- Botto F, Alonso-Coello P, Chan MT, et al. Myocardial injury after noncardiac surgery: a large, international, prospective cohort study establishing diagnostic criteria, characteristics, predictors, and 30-day outcomes. Anesthesiology 2014; 120:564–578.
- Horr S, Reed G, Menon V. Troponin elevation after noncardiac surgery: significance and management. Cleve Clin J Med 2015; 82:595–602.
- Vascular Events In Noncardiac Surgery Patients Cohort Evaluation Study I, Devereaux PJ, Chan MT, Alonso-Coello P, et al. Association between postoperative troponin levels and 30-day mortality among patients undergoing noncardiac surgery. JAMA 2012; 307:2295–2304.
- Beattie WS, Karkouti K, Tait G, et al. Use of clinically based troponin underestimates the cardiac injury in non-cardiac surgery: a single-centre cohort study in 51,701 consecutive patients. Can J Anaesth 2012; 59:1013–1022.
- van Waes JA, Nathoe HM, de Graaff JC, et al. Myocardial injury after noncardiac surgery and its association with short-term mortality. Circulation 2013; 127:2264–2271.
- Rodseth R, Devereaux PJ. Should we measure troponin routinely in patients after vascular surgery? American College of Cardiology. www.acc.org/latest-in-cardiology/articles/2014/07/18/14/46/should-we-measure-troponin-routinely-in-patients-after-vascular-surgery?w_nav=LC. Accessed August 5, 2015.
- Fleisher LA, Fleischmann KE, Auerbach AD, et al. 2014 ACC/AHA guideline on perioperative cardiovascular evaluation and management of patients undergoing noncardiac surgery: a report of the American College of Cardiology/American Heart Association Task Force on Practice Guidelines. J Am Coll Cardiol 2014; 64:e77–e137.
- Foucrier A, Rodseth R, Aissaoui M, et al. The long-term impact of early cardiovascular therapy intensification for postoperative troponin elevation after major vascular surgery. Anesth Analg 2014; 119:1053–1063.
- Kristensen SD, Knuuti J, Saraste A, et al. 2014 ESC/ESA Guidelines on non-cardiac surgery: cardiovascular assessment and management: The Joint Task Force on non-cardiac surgery: cardiovascular assessment and management of the European Society of Cardiology (ESC) and the European Society of Anaesthesiology (ESA). Eur Heart J 2014; 35:2383–2431.
- Beckman JA. Postoperative troponin screening: a cardiac Cassandra? Circulation 2013; 127:2253–2266.
A major goal of perioperative medicine is to prevent, detect, and treat postoperative complications—in particular, cardiovascular complications. In the Perioperative Ischemic Evaluation (POISE) study,1 the 30-day mortality rate was four times higher in patients who had a perioperative myocardial infarction (MI) than in those who did not.1 Yet fewer than half of patients who have a postoperative MI have ischemic symptoms, suggesting that routine monitoring of cardiac biomarkers could detect these events and allow early intervention.
From 10% to 20% of patients have troponin elevations after noncardiac surgery.2 But until recently, many of these elevations were thought to be of minor importance and were ignored unless the patient met diagnostic criteria for MI. A new entity called MINS (myocardial injury after noncardiac surgery)3 was defined as a troponin level exceeding the upper limit of normal with or without ischemic symptoms or electrocardiographic changes and excluding noncardiac causes such as stroke, sepsis, and pulmonary embolism. Because elevations of troponin at any level have been associated with increased 30-day mortality rates, the question of the value of routine screening of asymptomatic postoperative patients for troponin elevation has been raised.
In this issue of Cleveland Clinic Journal of Medicine, Horr et al4 review the controversy of postoperative screening using troponin measurement and propose an algorithm for management.
QUESTIONS TO CONSIDER
Before recommending screening asymptomatic patients for troponin elevation, we need to consider a number of questions:
- Which patients should be screened?
- How should troponin elevations be treated?
- Would casting a wider net improve outcomes?
- What are the possible harms of troponin screening?
The bottom line is, will postoperative troponin screening change management and result in improved outcomes?
WHICH PATIENTS SHOULD BE SCREENED?
Why routine screening may be indicated
Elevated or even just detectable troponin levels are associated with adverse outcomes. A systematic review and meta-analysis of 3,318 patients2 demonstrated that high troponin levels after noncardiac surgery were independently associated with a risk of death three times higher than in patients with normal troponin levels.
In the Vascular Events in Noncardiac Surgery Patients Cohort Evaluation (VISION) study,5 troponin T was measured in 15,133 patients after surgery. The overall mortality rate was 1.9%, and the higher the peak troponin T level the higher the risk of death.
In a single-center Canadian retrospective cohort analysis of 51,701 consecutive patients by Beattie et al,6 the peak postoperative level of troponin I improved the ability of a multivariable model to predict the risk of death. As in the VISION study, the mortality rate rose with the troponin level.6
In a study by van Waes et al7 in 2,232 consecutive noncardiac surgery patients over age 60 at intermediate to high risk, the all-cause mortality rate was 3%, and troponin I was elevated in 19% of patients. As in VISION and the Canadian retrospective study, the mortality rate increased with the troponin level.
Why routine screening may not help
In VISION,5 the probability of detecting myocardial injury was three times higher if patients were screened for 3 days after surgery than if they were tested only if clinical signs or symptoms indicated it.
However, in deciding whether to screen troponin levels in postoperative patients, we must take into account the patient’s clinical risk as well as the risk of the surgical procedure. Troponin elevation in low-risk patients is associated with a low mortality rate, and troponin elevations often are secondary to causes other than myocardial ischemia. In the study by van Waes et al,7 the association was stronger with all-cause mortality than with myocardial infarction, and in VISION5 there were more nonvascular deaths than vascular deaths, suggesting that troponin elevation is a nonspecific marker of adverse events.
Beattie et al6 found that the probability that a patient’s postoperative troponin level would be elevated increased as the patient’s clinical risk increased, but the yield was very low and the mortality rate was less than 1% in patients in risk classes 1 through 3 (of a possible 5 classes). In risk class 4, troponin I was elevated in 21.8%, and the mortality rate was 2.5%; in risk class 5 troponin I was elevated in 18.6%, and the mortality rate was 11.9%. Analyzing the data according to the type of surgery, mortality rates were highest in patients undergoing vascular surgery, neurosurgery, general surgery, and thoracic procedures, with all-cause mortality rates ranging from 2.6% to 5.2%.6
Screening should depend on risk
If postoperative troponin screening is to be recommended, it should not be routine for all patients but should be restricted to those with high clinical risk and those undergoing high-risk surgical procedures.
Rodseth and Devereaux8 recommended routine postoperative troponin measurement not only after vascular surgery, but also after high-risk surgery (general, neurosurgery, emergency surgery), as well as in patients over age 65 and patients with established atherosclerotic disease or risk factors for it. However, I believe this latter group may not be at high enough risk to justify routine screening.
Beattie et al6 advocated limiting postoperative troponin screening to patients with at least a moderate risk of MI and also suggested an international consensus conference to define criteria for postoperative MI, populations who should have routine postoperative screening, and consensus on treatment of patients with troponin elevations but not meeting the criteria for MI. Without this consensus on treatment, it is unclear if protocols for universal postoperative screening would improve outcomes.
For these reasons, the 2014 joint guidelines of the American College of Cardiology and American Heart Association9 (ACC/AHA) stated that the benefit of postoperative screening of troponin levels in patients with a high perioperative risk of MI but no signs or symptoms of myocardial ischemia or MI is “uncertain in the absence of established risks and benefits of a defined management strategy.” This recommendation was given a class IIb rating (may be considered) and level of evidence B (usefulness or efficacy less well established). On the other hand, the guidelines recommend measuring troponin levels if signs or symptoms suggest myocardial ischemia or MI (class I recommendation, level of evidence A) but state there is no benefit in routine screening of unselected patients without signs or symptoms of ischemia (class III recommendation, level of evidence B).
HOW SHOULD ELEVATIONS BE TREATED?
Because a troponin elevation in a patient without signs or symptoms of ischemia does not predict a specific type of death, physicians need to treat patients individually. Perioperative ischemia and inflammation could lead to injury of other organs, and death could result from multiorgan injury rather than from myocardial injury. Treating these troponin elevations in the same way we treat MI—ie, with antiplatelet therapy and anticoagulation—may result in increased bleeding or unnecessary cardiac catheterization, and starting beta-blockers in the perioperative period may be harmful. Because it is unclear how to manage these patients, cardiac medications have not routinely been given in previous studies.
POISE provided some evidence that patients with postoperative MI who were given aspirin and a statin did better.1 And the results of a smaller study10 suggested that intensification of drug therapy (aspirin, statin, beta-blocker, angiotensin-converting enzyme inhibitor) in patients with postoperative troponin I elevations was associated with improved outcomes at 1 year. If the bleeding risk is low, I believe that there is potential benefit in prescribing aspirin and statins for these patients.
CASTING A WIDER NET
Further complicating matters in the near future is the issue of using fifth-generation high-sensitivity troponin T assays. The European Society of Cardiology guidelines11 are somewhat more liberal than the ACC/AHA guidelines, stating that measuring high-sensitivity troponin after surgery “may be considered in high-risk patients to improve risk stratification.” This is a class IIB recommendation, level of evidence B.
With fifth-generation high-sensitivity troponin assays, troponin may be elevated in as many as 20% of patients preoperatively and 40% postoperatively, significantly increasing the number of patients said to have a complication. Besides potentially subjecting these patients to unproven treatments, such results would give the false impression that hospitals and surgeons using the screening tools actually had higher complication rates than those that did not screen.
POSSIBLE HARMS OF SCREENING
Elevated postoperative troponin may identify patients at higher risk of any adverse event but not specifically of cardiac-specific events. In an editorial, Beckman12 stated that routine measurement of troponin “is more likely to cause harm than to provide benefit and should not be used as a screening modality” because of the lack of a proven beneficial treatment strategy, because of the possible harm from applying the standard treatment for type 1 MI, and because it could divert attention from a true cause of an adverse event to a false one—ie, from a nonvascular condition to MI.11
There is clearly a need for clinical trials to determine which treatment, if any, can improve outcomes in these patients, and several trials have been started. But until we have evidence, we can only speculate as to whether screening postoperative patients for troponin elevation is beneficial or detrimental.
- Devereaux PJ, Xavier D, Pogue J, et al. Characteristics and short-term prognosis of perioperative myocardial infarction in patients undergoing noncardiac surgery: a cohort study. Ann Intern Med 2011; 154:523–528.
- Levy M, Heels-Ansdell D, Hiralal R, et al. Prognostic value of troponin and creatine kinase muscle and brain isoenzyme measurement after noncardiac surgery: a systematic review and meta-analysis. Anesthesiology 2011; 114:796–806.
- Botto F, Alonso-Coello P, Chan MT, et al. Myocardial injury after noncardiac surgery: a large, international, prospective cohort study establishing diagnostic criteria, characteristics, predictors, and 30-day outcomes. Anesthesiology 2014; 120:564–578.
- Horr S, Reed G, Menon V. Troponin elevation after noncardiac surgery: significance and management. Cleve Clin J Med 2015; 82:595–602.
- Vascular Events In Noncardiac Surgery Patients Cohort Evaluation Study I, Devereaux PJ, Chan MT, Alonso-Coello P, et al. Association between postoperative troponin levels and 30-day mortality among patients undergoing noncardiac surgery. JAMA 2012; 307:2295–2304.
- Beattie WS, Karkouti K, Tait G, et al. Use of clinically based troponin underestimates the cardiac injury in non-cardiac surgery: a single-centre cohort study in 51,701 consecutive patients. Can J Anaesth 2012; 59:1013–1022.
- van Waes JA, Nathoe HM, de Graaff JC, et al. Myocardial injury after noncardiac surgery and its association with short-term mortality. Circulation 2013; 127:2264–2271.
- Rodseth R, Devereaux PJ. Should we measure troponin routinely in patients after vascular surgery? American College of Cardiology. www.acc.org/latest-in-cardiology/articles/2014/07/18/14/46/should-we-measure-troponin-routinely-in-patients-after-vascular-surgery?w_nav=LC. Accessed August 5, 2015.
- Fleisher LA, Fleischmann KE, Auerbach AD, et al. 2014 ACC/AHA guideline on perioperative cardiovascular evaluation and management of patients undergoing noncardiac surgery: a report of the American College of Cardiology/American Heart Association Task Force on Practice Guidelines. J Am Coll Cardiol 2014; 64:e77–e137.
- Foucrier A, Rodseth R, Aissaoui M, et al. The long-term impact of early cardiovascular therapy intensification for postoperative troponin elevation after major vascular surgery. Anesth Analg 2014; 119:1053–1063.
- Kristensen SD, Knuuti J, Saraste A, et al. 2014 ESC/ESA Guidelines on non-cardiac surgery: cardiovascular assessment and management: The Joint Task Force on non-cardiac surgery: cardiovascular assessment and management of the European Society of Cardiology (ESC) and the European Society of Anaesthesiology (ESA). Eur Heart J 2014; 35:2383–2431.
- Beckman JA. Postoperative troponin screening: a cardiac Cassandra? Circulation 2013; 127:2253–2266.

Troponin elevation after noncardiac surgery: Significance and management
More than 200 million patients undergo noncardiac surgery each year, and the volume is increasing.1 Cardiovascular complications are a major cause of morbidity and mortality in the perioperative period.
Before the advent of modern cardiac biomarkers, an estimated 2% to 3% of all patients undergoing noncardiac surgery had a major adverse cardiac event.2 However, more recent studies suggest that 5% to 25% of patients have troponin elevations after noncardiac surgery, depending on the patient population,3–6 and many are asymptomatic, suggesting that many patients are sustaining undetected myocardial injury. Those who suffer a myocardial infarction or myocardial injury have elevated morbidity and mortality rates, not only perioperatively, but also at 30 days and even at up to 1 year.3–5,7–11
Yet there are almost no data on how best to manage these patients; the available guidelines, therefore, do not provide sufficient recommendations for clinical practice.
To address the lack of guidelines, we examine the incidence and proposed mechanisms of myocardial injury after noncardiac surgery, suggest an approach to identifying patients at risk, recommend treatment strategies, and consider future directions.
CARDIAC BIOMARKERS
When cardiac cellular injury from ischemia, direct trauma, or other cause disrupts the cell membrane, intracellular contents enter the extracellular space, including the blood stream. If the myocyte damage is extensive enough, biochemical assays can detect these substances.

Troponin, creatine kinase, myoglobin, and lactate dehydrogenase are common biomarkers of necrosis that, when detected in the plasma, may indicate cardiac injury. Each can be detected at varying times after cardiac injury (Figure 1).12
Cardiac troponins I and T
Of the biomarkers, cardiac troponin I and cardiac troponin T are now the most widely used and are the most specific for myocyte injury.
Troponins are proteins that regulate the calcium-induced interaction between myosin and actin that results in muscle contraction. Troponin is a complex consisting of three subunits: troponin C, troponin I, and troponin T. The cardiac troponin I and T isoforms are distinct from those found in skeletal muscle, making them specific for myocyte injury, and they are currently the recommended markers for diagnosing acute myocardial infarction.13
The troponin immunoassays currently available are not standardized among laboratories and point-of-care methods, and thus, levels cannot be compared across testing centers.14 Each assay has unique performance characteristics, but guidelines recommend using the 99th percentile value from a normal reference population for a given assay to define whether myocardial injury is present.13
Troponin elevation has prognostic value in patients presenting with acute coronary syndromes,15–18 and the degree of elevation correlates with infarct size.19–21
Controversy exists as to whether troponin and other biomarkers are released only after myocardial necrosis or after reversible injury as well. Using newer, highly sensitive assays, troponin elevations have been detected after short periods of ischemia during stress testing22,23 and in patients with stable angina,24 suggesting that reversible cardiac stress and injury can lead to troponin release. This mechanism may play an important role during the myocardial injury that can occur in patients undergoing noncardiac surgery.
MYOCARDIAL INFARCTION vs MYOCARDIAL INJURY
In 2000, the Joint Task Force of the European Society of Cardiology, American College of Cardiology Foundation, American Heart Association, and World Heart Federation revised the criteria for the diagnosis of myocardial infarction created by the World Health Organization in 1979. The definition was revised again in 2007 and once more in 2012 to create the third universal definition of myocardial infarction.
Acute myocardial infarction
Acute myocardial infarction is defined as evidence of myocardial necrosis in a setting of myocardial ischemia, not related to causes such as trauma or pulmonary embolism, with a rise or a fall (or a rise and a fall) of cardiac biomarkers (at least one value being above the 99th percentile in the reference population) and any of the following:
- Symptoms of ischemia
- New ST-segment changes or new left bundle branch block
- Pathologic Q waves
- Imaging evidence of new loss of viable myocardium or new regional wall-motion abnormality
- Intracoronary thrombus by angiography or autopsy.13
Myocardial injury after noncardiac surgery
Studies10,11 have shown that many patients undergoing noncardiac surgery have evidence of cardiac biomarker release but do not meet the universal definition of myocardial infarction.
The Perioperative Ischemic Evaluation (POISE) trial10 reported that 415 (5%) of its patients met the definition of myocardial infarction, of whom only about 35% had symptoms of ischemia. Another 697 patients (8.3%) had isolated elevations in biomarkers without meeting the definition of myocardial infarction.
The VISION study11 (Vascular Events in Noncardiac Surgery Patients Cohort Evaluation) prospectively screened more than 15,000 patients in several countries for troponin elevation during the first 3 postoperative days and for ischemic symptoms and features. Of the patients screened, approximately 1,200 (8%) had troponin elevations, with fewer than half fulfilling the criteria for myocardial infarction.
In another study, van Waes et al6 prospectively screened 2,232 patients ages 60 and older undergoing intermediate- to high-risk noncardiac surgery. Troponin levels were elevated in 19% of the patients, but only 10 of these patients met the universal definition of myocardial infarction.
In all of these studies, patients with isolated elevation in myocardial biomarkers had worse short-term and long-term outcomes than those without. These observations led to a proposed definition of “myocardial injury after noncardiac surgery” that is broader than that of myocardial infarction and requires only elevation of cardiac biomarkers judged to be due to myocardial ischemia (ie, not from another obvious cause such as pulmonary embolism or myocarditis).3
FIVE TYPES OF MYOCARDIAL INFARCTION
The Joint Task Force13 categorizes myocardial infarction into five distinct types:
- Type 1—due to plaque rupture
- Type 2—due to imbalance between oxygen supply and demand
- Type 3—sudden cardiac death
- Type 4a—associated with percutaneous coronary intervention
- Type 4b—associated with stent thrombosis
- Type 5—associated with coronary artery bypass surgery.
Types 1 and 2 have both been implicated in perioperative myocardial infarction and injury. Patient characteristics and the physiologic response to surgical and anesthetic stressors likely contribute to the development of myocardial infarction and injury after noncardiac surgery.
Plaque rupture as a cause of postoperative myocardial infarction
The mechanism of type 1 myocardial infarction—plaque rupture or erosion leading to thrombosis and infarction—plays a significant role in most cases of acute coronary syndromes. Its role in perioperative and postoperative myocardial infarction or injury, however, is less clear.
In an autopsy study of 26 patients who died of myocardial infarction after noncardiac surgery, plaque rupture was evident in 12 (46%).25 A prospective angiographic study of 120 patients with acute coronary syndromes after noncardiac surgery found that nearly 50% had evidence of plaque rupture.26
Higher levels of catecholamines, cortisol,27,28 platelet reactivity,29 procoagulant factors,30 and coronary artery shear stress31 are all present in the postoperative period and may contribute to an increased propensity for plaque rupture or erosion. Whether plaque rupture is present in patients who have isolated troponin elevation but do not meet the criteria for myocardial infarction has not been investigated.
Oxygen supply-demand imbalance during and after surgery
Oxygen supply-demand imbalance (the mechanism in type 2 myocardial infarction) leading to myocyte stress, ischemia, and subsequent infarction is likely common in the perioperative and postoperative periods. As previously discussed, this imbalance may be present with or without symptoms.
Oxygen demand may increase in this period as a result of tachycardia32 caused by bleeding, pain, and catecholamines or increased wall stress from hypertension due to vasoconstriction or pain.33 Oxygen supply can be decreased secondary to tachycardia, anemia,34 hypotension, hypoxemia, hypercarbia, intravascular fluid shifts (bleeding or volume overload), or coronary vasoconstriction.33,35
These mechanisms of myocardial injury, infarction, or both can occur with or without underlying significant obstructive coronary artery disease. However, severe coronary artery disease is more common in those who have had a perioperative myocardial infarction.36
POSTOPERATIVE TROPONIN ELEVATION CARRIES A WORSE PROGNOSIS
Patients who suffer a myocardial infarction after noncardiac surgery have worse short- and long-term outcomes than their counterparts.4,5,7, 8,10,33 In the POISE trial,10 the 30-day mortality rate was 11.6% in those who had had a perioperative myocardial infarction, compared with 2.2% in those who did not (P < .001). The patients who had had a myocardial infarction were also more likely to have nonfatal cardiac arrest, coronary revascularization, and congestive heart failure.
Myocardial injury not fulfilling the criteria for myocardial infarction after noncardiac surgery is also associated with worse short-term and long-term outcomes.3,6,10,11,37,38 POISE patients with isolated elevations in cardiac biomarkers had a higher 30-day risk of coronary revascularization and nonfatal arrest.10 In the VISION trial, an elevation in troponin was the strongest predictor of death within 30 days after noncardiac surgery. This analysis also showed that the higher the peak troponin value, the greater the risk of death and the shorter the median time until death.11
A meta-analysis of 14 studies in 3,139 patients found that elevated troponin after noncardiac surgery was an independent predictor of death within 1 year (odds ratio [OR] 6.7, 95% confidence interval [CI] 4.1–10.9) and beyond 1 year (OR 1.8, 95% CI 1.4–2.3).37
SHOULD SCREENING BE ROUTINE AFTER NONCARDIAC SURGERY?
Since patients suffering myocardial infarction or injury after noncardiac surgery have a worse prognosis, many experts advocate routinely screening all high-risk patients and those undergoing moderate- to high-risk surgery. Many tools exist to determine which patients undergoing noncardiac surgery are at high risk of cardiac complications.
The revised Goldman Cardiac Risk Index is commonly used and well validated. Variables in this index that predict major cardiac complications are:
- High-risk surgery (vascular surgery, orthopedic surgery, and intraperitoneal or intrathoracic surgery)
- History of ischemic heart disease
- History of congestive heart failure
- History of cerebrovascular disease
- Diabetes requiring insulin therapy
- Chronic kidney disease with a creatinine > 2.0 mg/dL.
The more of these variables that are present, the higher the risk of perioperative cardiac events2,4:
- No risk factors: 0.4% risk (95% CI 0.1–0.8)
- One risk factor: 1.0% risk (95% CI 0.5–1.4)
- Two risk factors: 2.4% risk (95% CI 1.3–3.5)
- Three or more risk factors: 5.4% risk (95% CI 2.7–7.9).
Current guidelines from the American College of Cardiology and the American Heart Association give a class I recommendation (the highest) for measuring troponin levels after noncardiac surgery in patients who have symptoms or signs suggesting myocardial ischemia. They give a class IIb recommendation (usefulness is less well established) for screening those at high risk but without symptoms or signs of ischemia, despite the previously cited evidence that patients with troponin elevation are at increased risk. The IIb recommendation is due to a lack of validated treatment strategies to modify and attenuate the recognized risk with troponin elevation in this setting.39
LITTLE EVIDENCE TO GUIDE TREATMENT
In current practice, internists and cardiologists are often asked to consult on patients with troponin elevations noted after noncardiac surgery. Although published and ongoing studies examine strategies to prevent cardiovascular events during noncardiac surgery, we lack data on managing the cases of myocardial infarction and injury that actually occur after noncardiac surgery.
When managing a patient who has a troponin elevation after surgery, many clinical factors must be weighed, including hemodynamic and clinical stability and risk of bleeding. Confronted with ST-segment elevation myocardial infarction or high-risk non–ST-segment elevation myocardial infarction, most clinicians would favor an early invasive reperfusion strategy in accordance with guidelines on managing acute coronary syndrome. Fibrinolytic drugs for ST-segment elevation myocardial infarction are likely to be contraindicated in the postoperative period because they pose an unacceptable risk of bleeding.
Guideline-directed medical therapies for those suffering perioperative myocardial infarction may lower the risk of future cardiovascular events, as suggested by a retrospective study of 66 patients diagnosed with perioperative myocardial infarction after vascular surgery.40 Those in whom medical therapy for coronary artery disease was not intensified—defined as adding or increasing the dose of antiplatelet agent, statin, beta-blocker, or angiotensin-converting enzyme inhibitor—had higher rates of cardiovascular events at 12 months (hazard ratio [HR] 2.80, 95% CI 1.05–24.2).40
In those with asymptomatic myocardial infarction or isolated elevation in cardiac biomarkers, no treatment strategies have been assessed prospectively or in randomized trials. However, statins and aspirin have been suggested as providing some benefit. In a substudy of the POISE trial, the use of aspirin was associated with a 46% reduction in the 30-day mortality rate in those suffering a perioperative myocardial infarction, and statins were associated with a 76% reduction.10 In a single-center retrospective analysis of 337 patients undergoing moderate- to high-risk vascular surgery, statin therapy was associated with a lower 1-year mortality rate (OR 0.63, 95% CI 0.40–0.98).38
We propose a treatment algorithm for patients identified as having cardiovascular events after noncardiac surgery (Figure 2), based on current evidence and guidelines. Ultimately, treatment decisions should be tailored to the individual patient. Discussion of the risks and benefits of therapeutic options should include the patient and surgeon.
Ongoing and future trials
Ongoing and future trials are aimed at addressing definitive treatment strategies in this patient population.
The MANAGE trial (Management of Myocardial Injury After Non-cardiac Surgery Trial) is randomizing patients suffering myocardial injury after noncardiac surgery to receive either dabigatran and omeprazole or placebo to assess the efficacy of these agents in preventing major adverse cardiac events and the safety of anticoagulation (ClinicalTrials.gov Identifier: NCT01661101).
The INTREPID trial (Study of Ticagrelor Versus Aspirin Treatment in Patients With Myocardial Injury Post Major Non-Cardiac Surgery) will assess the efficacy and safety of ticagrelor treatment compared with aspirin in a similar population (ClinicalTrial.gov Identifier: NCT02291419). The trial will enroll approximately 1,000 patients identified as having a postoperative troponin elevation more than two times the upper limit of normal of the assay during the index hospitalization (Figure 3). Enrollment was to have begun in mid-2015.
- Weiser TG, Regenbogen SE, Thompson KD, et al. An estimation of the global volume of surgery: a modelling strategy based on available data. Lancet 2008; 372:139–144.
- Lee TH, Marcantonio ER, Mangione CM, et al. Derivation and prospective validation of a simple index for prediction of cardiac risk of major noncardiac surgery. Circulation 1999; 100:1043–1049.
- Botto F, Alonso-Coello P, Chan MT, et al. Myocardial injury after noncardiac surgery: a large, international, prospective cohort study establishing diagnostic criteria, characteristics, predictors, and 30-day outcomes. Anesthesiology 2014; 120:564–578.
- Devereaux PJ, Goldman L, Cook DJ, Gilbert K, Leslie K, Guyatt GH. Perioperative cardiac events in patients undergoing noncardiac surgery: a review of the magnitude of the problem, the pathophysiology of the events and methods to estimate and communicate risk. CMAJ 2005; 173:627–634.
- McFalls EO, Ward HB, Moritz TE, et al. Predictors and outcomes of a perioperative myocardial infarction following elective vascular surgery in patients with documented coronary artery disease: results of the CARP trial. Eur Heart J 2008; 29:394–401.
- van Waes JA, Nathoe HM, de Graaff JC, et al. Myocardial injury after noncardiac surgery and its association with short-term mortality. Circulation 2013; 127:2264–2271.
- Badner NH, Knill RL, Brown JE, Novick TV, Gelb AW. Myocardial infarction after noncardiac surgery. Anesthesiology 1998; 88:572–578.
- Kim LJ, Martinez EA, Faraday N, et al. Cardiac troponin I predicts short-term mortality in vascular surgery patients. Circulation 2002; 106:2366–2371.
- Landesberg G, Shatz V, Akopnik I, et al. Association of cardiac troponin, CK-MB, and postoperative myocardial ischemia with long-term survival after major vascular surgery. J Am Coll Cardiol 2003; 42:1547–1554.
- Devereaux PJ, Xavier D, Pogue J, et al. Characteristics and short-term prognosis of perioperative myocardial infarction in patients undergoing noncardiac surgery: a cohort study. Ann Intern Med 2011; 154:523–528.
- Devereaux PJ, Chan MT, Alonso-Coello P, et al. Association between postoperative troponin levels and 30-day mortality among patients undergoing noncardiac surgery. JAMA 2012; 307:2295–2304.
- Kumar A, Cannon CP. Acute coronary syndromes: diagnosis and management, part I. Mayo Clin Proc 2009; 84:917–938.
- Thygesen K, Alpert JS, Jaffe AS, et al. Third universal definition of myocardial infarction. Circulation 2012; 126:2020–2035.
- Apple FS, Quist HE, Doyle PJ, Otto AP, Murakami MM. Plasma 99th percentile reference limits for cardiac troponin and creatine kinase MB mass for use with European Society of Cardiology/American College of Cardiology consensus recommendations. Clin Chem 2003; 49:1331–1336.
- Ottani F, Galvani M, Nicolini FA, et al. Elevated cardiac troponin levels predict the risk of adverse outcome in patients with acute coronary syndromes. Am Heart J 2000; 140:917–927.
- Ohman EM, Armstrong PW, White HD, et al. Risk stratification with a point-of-care cardiac troponin T test in acute myocardial infarction. GUSTO III investigators. Global Use of Strategies to Open Occluded Coronary Arteries. Am J Cardiol 1999; 84:1281–1286.
- deFilippi CR, Tocchi M, Parmar RJ, et al. Cardiac troponin T in chest pain unit patients without ischemic electrocardiographic changes: angiographic correlates and long-term clinical outcomes. J Am Coll Cardiol 2000; 35:1827–1834.
- Heidenreich PA, Alloggiamento T, Melsop K, McDonald KM, Go AS, Hlatky MA. The prognostic value of troponin in patients with non-ST elevation acute coronary syndromes: a meta-analysis. J Am Coll Cardiol 2001; 38:478–485.
- Steen H, Giannitsis E, Futterer S, Merten C, Juenger C, Katus HA. Cardiac troponin T at 96 hours after acute myocardial infarction correlates with infarct size and cardiac function. J Am Coll Cardiol 2006; 48:2192–2194.
- Licka M, Zimmermann R, Zehelein J, Dengler TJ, Katus HA, Kubler W. Troponin T concentrations 72 hours after myocardial infarction as a serological estimate of infarct size. Heart 2002; 87:520–524.
- Vasile VC, Babuin L, Giannitsis E, Katus HA, Jaffe AS. Relationship of MRI-determined infarct size and cTnI measurements in patients with ST-elevation myocardial infarction. Clin Chem 2008; 54:617–619.
- Sabatine MS, Morrow DA, de Lemos JA, Jarolim P, Braunwald E. Detection of acute changes in circulating troponin in the setting of transient stress test-induced myocardial ischaemia using an ultrasensitive assay: results from TIMI 35. Eur Heart J 2009; 30:162–169.
- Siriwardena M, Campbell V, Richards AM, Pemberton CJ. Cardiac biomarker responses to dobutamine stress echocardiography in healthy volunteers and patients with coronary artery disease. Clin Chem 2012; 58:1492–1494.
- Turer AT, Addo TA, Martin JL, et al. Myocardial ischemia induced by rapid atrial pacing causes troponin T release detectable by a highly sensitive assay: insights from a coronary sinus sampling study. J Am Coll Cardiol 2011; 57:2398–2405.
- Cohen MC, Aretz TH. Histological analysis of coronary artery lesions in fatal postoperative myocardial infarction. Cardiovasc Pathol 1999; 8:133–139.
- Gualandro DM, Campos CA, Calderaro D, et al. Coronary plaque rupture in patients with myocardial infarction after noncardiac surgery: frequent and dangerous. Atherosclerosis 2012; 222:191–195.
- Sametz W, Metzler H, Gries M, et al. Perioperative catecholamine changes in cardiac risk patients. Eur J Clin Invest 1999; 29:582–587.
- Frank SM, Higgins MS, Breslow MJ, et al. The catecholamine, cortisol, and hemodynamic responses to mild perioperative hypothermia. A randomized clinical trial. Anesthesiology 1995; 82:83–93.
- Rosenfeld BA, Faraday N, Campbell D, et al. Perioperative platelet reactivity and the effects of clonidine. Anesthesiology 1993; 79:255–261.
- Lison S, Weiss G, Spannagl M, Heindl B. Postoperative changes in procoagulant factors after major surgery. Blood Coagul Fibrinolysis 2011; 22:190–196.
- Fukumoto Y, Hiro T, Fujii T, et al. Localized elevation of shear stress is related to coronary plaque rupture: a 3-dimensional intravascular ultrasound study with in-vivo color mapping of shear stress distribution. J Am Coll Cardiol 2008; 51:645–650.
- Feringa HH, Bax JJ, Boersma E, et al. High-dose beta-blockers and tight heart rate control reduce myocardial ischemia and troponin T release in vascular surgery patients. Circulation 2006; 114:I-344–I-349.
- Landesberg G. The pathophysiology of perioperative myocardial infarction: facts and perspectives. J Cardiothorac Vasc Anesth 2003; 17:90–100.
- Nelson AH, Fleisher LA, Rosenbaum SH. Relationship between postoperative anemia and cardiac morbidity in high-risk vascular patients in the intensive care unit. Crit Care Med 1993; 21:860–866.
- Landesberg G, Beattie WS, Mosseri M, Jaffe AS, Alpert JS. Perioperative myocardial infarction. Circulation 2009; 119:2936–2944.
- Ellis SG, Hertzer NR, Young JR, Brener S. Angiographic correlates of cardiac death and myocardial infarction complicating major nonthoracic vascular surgery. Am J Cardiol 1996; 77:1126–1128.
- Levy M, Heels-Ansdell D, Hiralal R, et al. Prognostic value of troponin and creatine kinase muscle and brain isoenzyme measurement after noncardiac surgery: a systematic review and meta-analysis. Anesthesiology 2011; 114:796–806.
- Garcia S, Marston N, Sandoval Y, et al. Prognostic value of 12-lead electrocardiogram and peak troponin I level after vascular surgery. J Vasc Surg 2013; 57:166–172.
- Fleisher LA, Fleischmann KE, Auerbach AD, et al. 2014 ACC/AHA guideline on perioperative cardiovascular evaluation and management of patients undergoing noncardiac surgery: a report of the American College of Cardiology/American Heart Association task force on practice guidelines. J Am Coll Cardiol 2014; 64:e77–e137.
- Foucrier A, Rodseth R, Aissaoui M, et al. The long-term impact of early cardiovascular therapy intensification for postoperative troponin elevation after major vascular surgery. Anesth Analg 2014; 119:1053–1063.
More than 200 million patients undergo noncardiac surgery each year, and the volume is increasing.1 Cardiovascular complications are a major cause of morbidity and mortality in the perioperative period.
Before the advent of modern cardiac biomarkers, an estimated 2% to 3% of all patients undergoing noncardiac surgery had a major adverse cardiac event.2 However, more recent studies suggest that 5% to 25% of patients have troponin elevations after noncardiac surgery, depending on the patient population,3–6 and many are asymptomatic, suggesting that many patients are sustaining undetected myocardial injury. Those who suffer a myocardial infarction or myocardial injury have elevated morbidity and mortality rates, not only perioperatively, but also at 30 days and even at up to 1 year.3–5,7–11
Yet there are almost no data on how best to manage these patients; the available guidelines, therefore, do not provide sufficient recommendations for clinical practice.
To address the lack of guidelines, we examine the incidence and proposed mechanisms of myocardial injury after noncardiac surgery, suggest an approach to identifying patients at risk, recommend treatment strategies, and consider future directions.
CARDIAC BIOMARKERS
When cardiac cellular injury from ischemia, direct trauma, or other cause disrupts the cell membrane, intracellular contents enter the extracellular space, including the blood stream. If the myocyte damage is extensive enough, biochemical assays can detect these substances.
Troponin, creatine kinase, myoglobin, and lactate dehydrogenase are common biomarkers of necrosis that, when detected in the plasma, may indicate cardiac injury. Each can be detected at varying times after cardiac injury (Figure 1).12
Cardiac troponins I and T
Of the biomarkers, cardiac troponin I and cardiac troponin T are now the most widely used and are the most specific for myocyte injury.
Troponins are proteins that regulate the calcium-induced interaction between myosin and actin that results in muscle contraction. Troponin is a complex consisting of three subunits: troponin C, troponin I, and troponin T. The cardiac troponin I and T isoforms are distinct from those found in skeletal muscle, making them specific for myocyte injury, and they are currently the recommended markers for diagnosing acute myocardial infarction.13
The troponin immunoassays currently available are not standardized among laboratories and point-of-care methods, and thus, levels cannot be compared across testing centers.14 Each assay has unique performance characteristics, but guidelines recommend using the 99th percentile value from a normal reference population for a given assay to define whether myocardial injury is present.13
Troponin elevation has prognostic value in patients presenting with acute coronary syndromes,15–18 and the degree of elevation correlates with infarct size.19–21
Controversy exists as to whether troponin and other biomarkers are released only after myocardial necrosis or after reversible injury as well. Using newer, highly sensitive assays, troponin elevations have been detected after short periods of ischemia during stress testing22,23 and in patients with stable angina,24 suggesting that reversible cardiac stress and injury can lead to troponin release. This mechanism may play an important role during the myocardial injury that can occur in patients undergoing noncardiac surgery.
MYOCARDIAL INFARCTION vs MYOCARDIAL INJURY
In 2000, the Joint Task Force of the European Society of Cardiology, American College of Cardiology Foundation, American Heart Association, and World Heart Federation revised the criteria for the diagnosis of myocardial infarction created by the World Health Organization in 1979. The definition was revised again in 2007 and once more in 2012 to create the third universal definition of myocardial infarction.
Acute myocardial infarction
Acute myocardial infarction is defined as evidence of myocardial necrosis in a setting of myocardial ischemia, not related to causes such as trauma or pulmonary embolism, with a rise or a fall (or a rise and a fall) of cardiac biomarkers (at least one value being above the 99th percentile in the reference population) and any of the following:
- Symptoms of ischemia
- New ST-segment changes or new left bundle branch block
- Pathologic Q waves
- Imaging evidence of new loss of viable myocardium or new regional wall-motion abnormality
- Intracoronary thrombus by angiography or autopsy.13
Myocardial injury after noncardiac surgery
Studies10,11 have shown that many patients undergoing noncardiac surgery have evidence of cardiac biomarker release but do not meet the universal definition of myocardial infarction.
The Perioperative Ischemic Evaluation (POISE) trial10 reported that 415 (5%) of its patients met the definition of myocardial infarction, of whom only about 35% had symptoms of ischemia. Another 697 patients (8.3%) had isolated elevations in biomarkers without meeting the definition of myocardial infarction.
The VISION study11 (Vascular Events in Noncardiac Surgery Patients Cohort Evaluation) prospectively screened more than 15,000 patients in several countries for troponin elevation during the first 3 postoperative days and for ischemic symptoms and features. Of the patients screened, approximately 1,200 (8%) had troponin elevations, with fewer than half fulfilling the criteria for myocardial infarction.
In another study, van Waes et al6 prospectively screened 2,232 patients ages 60 and older undergoing intermediate- to high-risk noncardiac surgery. Troponin levels were elevated in 19% of the patients, but only 10 of these patients met the universal definition of myocardial infarction.
In all of these studies, patients with isolated elevation in myocardial biomarkers had worse short-term and long-term outcomes than those without. These observations led to a proposed definition of “myocardial injury after noncardiac surgery” that is broader than that of myocardial infarction and requires only elevation of cardiac biomarkers judged to be due to myocardial ischemia (ie, not from another obvious cause such as pulmonary embolism or myocarditis).3
FIVE TYPES OF MYOCARDIAL INFARCTION
The Joint Task Force13 categorizes myocardial infarction into five distinct types:
- Type 1—due to plaque rupture
- Type 2—due to imbalance between oxygen supply and demand
- Type 3—sudden cardiac death
- Type 4a—associated with percutaneous coronary intervention
- Type 4b—associated with stent thrombosis
- Type 5—associated with coronary artery bypass surgery.
Types 1 and 2 have both been implicated in perioperative myocardial infarction and injury. Patient characteristics and the physiologic response to surgical and anesthetic stressors likely contribute to the development of myocardial infarction and injury after noncardiac surgery.
Plaque rupture as a cause of postoperative myocardial infarction
The mechanism of type 1 myocardial infarction—plaque rupture or erosion leading to thrombosis and infarction—plays a significant role in most cases of acute coronary syndromes. Its role in perioperative and postoperative myocardial infarction or injury, however, is less clear.
In an autopsy study of 26 patients who died of myocardial infarction after noncardiac surgery, plaque rupture was evident in 12 (46%).25 A prospective angiographic study of 120 patients with acute coronary syndromes after noncardiac surgery found that nearly 50% had evidence of plaque rupture.26
Higher levels of catecholamines, cortisol,27,28 platelet reactivity,29 procoagulant factors,30 and coronary artery shear stress31 are all present in the postoperative period and may contribute to an increased propensity for plaque rupture or erosion. Whether plaque rupture is present in patients who have isolated troponin elevation but do not meet the criteria for myocardial infarction has not been investigated.
Oxygen supply-demand imbalance during and after surgery
Oxygen supply-demand imbalance (the mechanism in type 2 myocardial infarction) leading to myocyte stress, ischemia, and subsequent infarction is likely common in the perioperative and postoperative periods. As previously discussed, this imbalance may be present with or without symptoms.
Oxygen demand may increase in this period as a result of tachycardia32 caused by bleeding, pain, and catecholamines or increased wall stress from hypertension due to vasoconstriction or pain.33 Oxygen supply can be decreased secondary to tachycardia, anemia,34 hypotension, hypoxemia, hypercarbia, intravascular fluid shifts (bleeding or volume overload), or coronary vasoconstriction.33,35
These mechanisms of myocardial injury, infarction, or both can occur with or without underlying significant obstructive coronary artery disease. However, severe coronary artery disease is more common in those who have had a perioperative myocardial infarction.36
POSTOPERATIVE TROPONIN ELEVATION CARRIES A WORSE PROGNOSIS
Patients who suffer a myocardial infarction after noncardiac surgery have worse short- and long-term outcomes than their counterparts.4,5,7, 8,10,33 In the POISE trial,10 the 30-day mortality rate was 11.6% in those who had had a perioperative myocardial infarction, compared with 2.2% in those who did not (P < .001). The patients who had had a myocardial infarction were also more likely to have nonfatal cardiac arrest, coronary revascularization, and congestive heart failure.
Myocardial injury not fulfilling the criteria for myocardial infarction after noncardiac surgery is also associated with worse short-term and long-term outcomes.3,6,10,11,37,38 POISE patients with isolated elevations in cardiac biomarkers had a higher 30-day risk of coronary revascularization and nonfatal arrest.10 In the VISION trial, an elevation in troponin was the strongest predictor of death within 30 days after noncardiac surgery. This analysis also showed that the higher the peak troponin value, the greater the risk of death and the shorter the median time until death.11
A meta-analysis of 14 studies in 3,139 patients found that elevated troponin after noncardiac surgery was an independent predictor of death within 1 year (odds ratio [OR] 6.7, 95% confidence interval [CI] 4.1–10.9) and beyond 1 year (OR 1.8, 95% CI 1.4–2.3).37
SHOULD SCREENING BE ROUTINE AFTER NONCARDIAC SURGERY?
Since patients suffering myocardial infarction or injury after noncardiac surgery have a worse prognosis, many experts advocate routinely screening all high-risk patients and those undergoing moderate- to high-risk surgery. Many tools exist to determine which patients undergoing noncardiac surgery are at high risk of cardiac complications.
The revised Goldman Cardiac Risk Index is commonly used and well validated. Variables in this index that predict major cardiac complications are:
- High-risk surgery (vascular surgery, orthopedic surgery, and intraperitoneal or intrathoracic surgery)
- History of ischemic heart disease
- History of congestive heart failure
- History of cerebrovascular disease
- Diabetes requiring insulin therapy
- Chronic kidney disease with a creatinine > 2.0 mg/dL.
The more of these variables that are present, the higher the risk of perioperative cardiac events2,4:
- No risk factors: 0.4% risk (95% CI 0.1–0.8)
- One risk factor: 1.0% risk (95% CI 0.5–1.4)
- Two risk factors: 2.4% risk (95% CI 1.3–3.5)
- Three or more risk factors: 5.4% risk (95% CI 2.7–7.9).
Current guidelines from the American College of Cardiology and the American Heart Association give a class I recommendation (the highest) for measuring troponin levels after noncardiac surgery in patients who have symptoms or signs suggesting myocardial ischemia. They give a class IIb recommendation (usefulness is less well established) for screening those at high risk but without symptoms or signs of ischemia, despite the previously cited evidence that patients with troponin elevation are at increased risk. The IIb recommendation is due to a lack of validated treatment strategies to modify and attenuate the recognized risk with troponin elevation in this setting.39
LITTLE EVIDENCE TO GUIDE TREATMENT
In current practice, internists and cardiologists are often asked to consult on patients with troponin elevations noted after noncardiac surgery. Although published and ongoing studies examine strategies to prevent cardiovascular events during noncardiac surgery, we lack data on managing the cases of myocardial infarction and injury that actually occur after noncardiac surgery.
When managing a patient who has a troponin elevation after surgery, many clinical factors must be weighed, including hemodynamic and clinical stability and risk of bleeding. Confronted with ST-segment elevation myocardial infarction or high-risk non–ST-segment elevation myocardial infarction, most clinicians would favor an early invasive reperfusion strategy in accordance with guidelines on managing acute coronary syndrome. Fibrinolytic drugs for ST-segment elevation myocardial infarction are likely to be contraindicated in the postoperative period because they pose an unacceptable risk of bleeding.
Guideline-directed medical therapies for those suffering perioperative myocardial infarction may lower the risk of future cardiovascular events, as suggested by a retrospective study of 66 patients diagnosed with perioperative myocardial infarction after vascular surgery.40 Those in whom medical therapy for coronary artery disease was not intensified—defined as adding or increasing the dose of antiplatelet agent, statin, beta-blocker, or angiotensin-converting enzyme inhibitor—had higher rates of cardiovascular events at 12 months (hazard ratio [HR] 2.80, 95% CI 1.05–24.2).40
In those with asymptomatic myocardial infarction or isolated elevation in cardiac biomarkers, no treatment strategies have been assessed prospectively or in randomized trials. However, statins and aspirin have been suggested as providing some benefit. In a substudy of the POISE trial, the use of aspirin was associated with a 46% reduction in the 30-day mortality rate in those suffering a perioperative myocardial infarction, and statins were associated with a 76% reduction.10 In a single-center retrospective analysis of 337 patients undergoing moderate- to high-risk vascular surgery, statin therapy was associated with a lower 1-year mortality rate (OR 0.63, 95% CI 0.40–0.98).38
We propose a treatment algorithm for patients identified as having cardiovascular events after noncardiac surgery (Figure 2), based on current evidence and guidelines. Ultimately, treatment decisions should be tailored to the individual patient. Discussion of the risks and benefits of therapeutic options should include the patient and surgeon.
Ongoing and future trials
Ongoing and future trials are aimed at addressing definitive treatment strategies in this patient population.
The MANAGE trial (Management of Myocardial Injury After Non-cardiac Surgery Trial) is randomizing patients suffering myocardial injury after noncardiac surgery to receive either dabigatran and omeprazole or placebo to assess the efficacy of these agents in preventing major adverse cardiac events and the safety of anticoagulation (ClinicalTrials.gov Identifier: NCT01661101).
The INTREPID trial (Study of Ticagrelor Versus Aspirin Treatment in Patients With Myocardial Injury Post Major Non-Cardiac Surgery) will assess the efficacy and safety of ticagrelor treatment compared with aspirin in a similar population (ClinicalTrial.gov Identifier: NCT02291419). The trial will enroll approximately 1,000 patients identified as having a postoperative troponin elevation more than two times the upper limit of normal of the assay during the index hospitalization (Figure 3). Enrollment was to have begun in mid-2015.
- Weiser TG, Regenbogen SE, Thompson KD, et al. An estimation of the global volume of surgery: a modelling strategy based on available data. Lancet 2008; 372:139–144.
- Lee TH, Marcantonio ER, Mangione CM, et al. Derivation and prospective validation of a simple index for prediction of cardiac risk of major noncardiac surgery. Circulation 1999; 100:1043–1049.
- Botto F, Alonso-Coello P, Chan MT, et al. Myocardial injury after noncardiac surgery: a large, international, prospective cohort study establishing diagnostic criteria, characteristics, predictors, and 30-day outcomes. Anesthesiology 2014; 120:564–578.
- Devereaux PJ, Goldman L, Cook DJ, Gilbert K, Leslie K, Guyatt GH. Perioperative cardiac events in patients undergoing noncardiac surgery: a review of the magnitude of the problem, the pathophysiology of the events and methods to estimate and communicate risk. CMAJ 2005; 173:627–634.
- McFalls EO, Ward HB, Moritz TE, et al. Predictors and outcomes of a perioperative myocardial infarction following elective vascular surgery in patients with documented coronary artery disease: results of the CARP trial. Eur Heart J 2008; 29:394–401.
- van Waes JA, Nathoe HM, de Graaff JC, et al. Myocardial injury after noncardiac surgery and its association with short-term mortality. Circulation 2013; 127:2264–2271.
- Badner NH, Knill RL, Brown JE, Novick TV, Gelb AW. Myocardial infarction after noncardiac surgery. Anesthesiology 1998; 88:572–578.
- Kim LJ, Martinez EA, Faraday N, et al. Cardiac troponin I predicts short-term mortality in vascular surgery patients. Circulation 2002; 106:2366–2371.
- Landesberg G, Shatz V, Akopnik I, et al. Association of cardiac troponin, CK-MB, and postoperative myocardial ischemia with long-term survival after major vascular surgery. J Am Coll Cardiol 2003; 42:1547–1554.
- Devereaux PJ, Xavier D, Pogue J, et al. Characteristics and short-term prognosis of perioperative myocardial infarction in patients undergoing noncardiac surgery: a cohort study. Ann Intern Med 2011; 154:523–528.
- Devereaux PJ, Chan MT, Alonso-Coello P, et al. Association between postoperative troponin levels and 30-day mortality among patients undergoing noncardiac surgery. JAMA 2012; 307:2295–2304.
- Kumar A, Cannon CP. Acute coronary syndromes: diagnosis and management, part I. Mayo Clin Proc 2009; 84:917–938.
- Thygesen K, Alpert JS, Jaffe AS, et al. Third universal definition of myocardial infarction. Circulation 2012; 126:2020–2035.
- Apple FS, Quist HE, Doyle PJ, Otto AP, Murakami MM. Plasma 99th percentile reference limits for cardiac troponin and creatine kinase MB mass for use with European Society of Cardiology/American College of Cardiology consensus recommendations. Clin Chem 2003; 49:1331–1336.
- Ottani F, Galvani M, Nicolini FA, et al. Elevated cardiac troponin levels predict the risk of adverse outcome in patients with acute coronary syndromes. Am Heart J 2000; 140:917–927.
- Ohman EM, Armstrong PW, White HD, et al. Risk stratification with a point-of-care cardiac troponin T test in acute myocardial infarction. GUSTO III investigators. Global Use of Strategies to Open Occluded Coronary Arteries. Am J Cardiol 1999; 84:1281–1286.
- deFilippi CR, Tocchi M, Parmar RJ, et al. Cardiac troponin T in chest pain unit patients without ischemic electrocardiographic changes: angiographic correlates and long-term clinical outcomes. J Am Coll Cardiol 2000; 35:1827–1834.
- Heidenreich PA, Alloggiamento T, Melsop K, McDonald KM, Go AS, Hlatky MA. The prognostic value of troponin in patients with non-ST elevation acute coronary syndromes: a meta-analysis. J Am Coll Cardiol 2001; 38:478–485.
- Steen H, Giannitsis E, Futterer S, Merten C, Juenger C, Katus HA. Cardiac troponin T at 96 hours after acute myocardial infarction correlates with infarct size and cardiac function. J Am Coll Cardiol 2006; 48:2192–2194.
- Licka M, Zimmermann R, Zehelein J, Dengler TJ, Katus HA, Kubler W. Troponin T concentrations 72 hours after myocardial infarction as a serological estimate of infarct size. Heart 2002; 87:520–524.
- Vasile VC, Babuin L, Giannitsis E, Katus HA, Jaffe AS. Relationship of MRI-determined infarct size and cTnI measurements in patients with ST-elevation myocardial infarction. Clin Chem 2008; 54:617–619.
- Sabatine MS, Morrow DA, de Lemos JA, Jarolim P, Braunwald E. Detection of acute changes in circulating troponin in the setting of transient stress test-induced myocardial ischaemia using an ultrasensitive assay: results from TIMI 35. Eur Heart J 2009; 30:162–169.
- Siriwardena M, Campbell V, Richards AM, Pemberton CJ. Cardiac biomarker responses to dobutamine stress echocardiography in healthy volunteers and patients with coronary artery disease. Clin Chem 2012; 58:1492–1494.
- Turer AT, Addo TA, Martin JL, et al. Myocardial ischemia induced by rapid atrial pacing causes troponin T release detectable by a highly sensitive assay: insights from a coronary sinus sampling study. J Am Coll Cardiol 2011; 57:2398–2405.
- Cohen MC, Aretz TH. Histological analysis of coronary artery lesions in fatal postoperative myocardial infarction. Cardiovasc Pathol 1999; 8:133–139.
- Gualandro DM, Campos CA, Calderaro D, et al. Coronary plaque rupture in patients with myocardial infarction after noncardiac surgery: frequent and dangerous. Atherosclerosis 2012; 222:191–195.
- Sametz W, Metzler H, Gries M, et al. Perioperative catecholamine changes in cardiac risk patients. Eur J Clin Invest 1999; 29:582–587.
- Frank SM, Higgins MS, Breslow MJ, et al. The catecholamine, cortisol, and hemodynamic responses to mild perioperative hypothermia. A randomized clinical trial. Anesthesiology 1995; 82:83–93.
- Rosenfeld BA, Faraday N, Campbell D, et al. Perioperative platelet reactivity and the effects of clonidine. Anesthesiology 1993; 79:255–261.
- Lison S, Weiss G, Spannagl M, Heindl B. Postoperative changes in procoagulant factors after major surgery. Blood Coagul Fibrinolysis 2011; 22:190–196.
- Fukumoto Y, Hiro T, Fujii T, et al. Localized elevation of shear stress is related to coronary plaque rupture: a 3-dimensional intravascular ultrasound study with in-vivo color mapping of shear stress distribution. J Am Coll Cardiol 2008; 51:645–650.
- Feringa HH, Bax JJ, Boersma E, et al. High-dose beta-blockers and tight heart rate control reduce myocardial ischemia and troponin T release in vascular surgery patients. Circulation 2006; 114:I-344–I-349.
- Landesberg G. The pathophysiology of perioperative myocardial infarction: facts and perspectives. J Cardiothorac Vasc Anesth 2003; 17:90–100.
- Nelson AH, Fleisher LA, Rosenbaum SH. Relationship between postoperative anemia and cardiac morbidity in high-risk vascular patients in the intensive care unit. Crit Care Med 1993; 21:860–866.
- Landesberg G, Beattie WS, Mosseri M, Jaffe AS, Alpert JS. Perioperative myocardial infarction. Circulation 2009; 119:2936–2944.
- Ellis SG, Hertzer NR, Young JR, Brener S. Angiographic correlates of cardiac death and myocardial infarction complicating major nonthoracic vascular surgery. Am J Cardiol 1996; 77:1126–1128.
- Levy M, Heels-Ansdell D, Hiralal R, et al. Prognostic value of troponin and creatine kinase muscle and brain isoenzyme measurement after noncardiac surgery: a systematic review and meta-analysis. Anesthesiology 2011; 114:796–806.
- Garcia S, Marston N, Sandoval Y, et al. Prognostic value of 12-lead electrocardiogram and peak troponin I level after vascular surgery. J Vasc Surg 2013; 57:166–172.
- Fleisher LA, Fleischmann KE, Auerbach AD, et al. 2014 ACC/AHA guideline on perioperative cardiovascular evaluation and management of patients undergoing noncardiac surgery: a report of the American College of Cardiology/American Heart Association task force on practice guidelines. J Am Coll Cardiol 2014; 64:e77–e137.
- Foucrier A, Rodseth R, Aissaoui M, et al. The long-term impact of early cardiovascular therapy intensification for postoperative troponin elevation after major vascular surgery. Anesth Analg 2014; 119:1053–1063.
KEY POINTS
- Cardiovascular events are a major cause of morbidity and mortality in patients undergoing noncardiac surgery and occur frequently, especially in high-risk patients.
- Myocardial injury or infarction after noncardiac surgery heightens the short- and long-term risk of mortality and major adverse cardiac events.
- The dominant mechanism of myocardial injury after noncardiac surgery remains uncertain.
- In the absence of therapies proven to affect the outcome, the benefit of screening to identify these patients remains uncertain.
- Clinical trials are under way to help clinicians provide optimal care to this at-risk population.
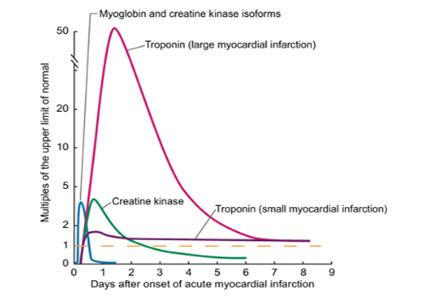
Common Misconceptions of Seizures and Epilepsy
Click here for a partial list of common questions and assumptions that individuals who are newly diagnosed with epilepsy or seizures may have.

Click here for a partial list of common questions and assumptions that individuals who are newly diagnosed with epilepsy or seizures may have.
Click here for a partial list of common questions and assumptions that individuals who are newly diagnosed with epilepsy or seizures may have.
ESC: Aldosterone blockade fails to fly for early MI in ALBATROSS
LONDON – Aldosterone blockade with oral spironolactone showed a disappointing lack of clinical benefit when initiated in the first hours after an acute MI without heart failure in the large, randomized ALBATROSS trial.
ALBATROSS did, however, flash a silver lining under one wing: A whopping 80% reduction in 6-month mortality in a prespecified subgroup analysis restricted to the 1,229 participants with ST-elevation MI, Dr. Gilles Montalescot reported at the annual congress of the European Society of Cardiology.
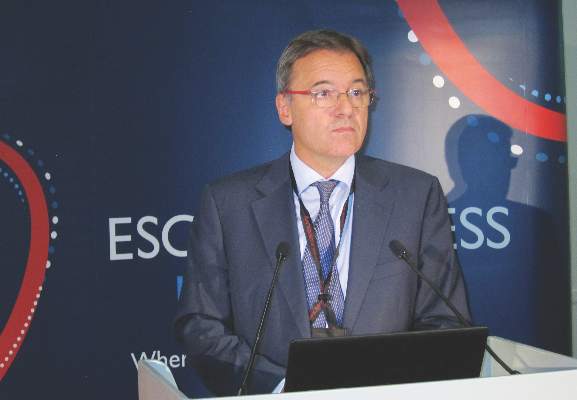
Although this finding is intriguing, hypothesis-generating, and definitely warrants a confirmatory study, he continued, mortality was nevertheless merely a secondary endpoint in ALBATROSS (Aldosterone Lethal Effects Blockade in Acute Myocardial Infarction Treated With or Without Reperfusion to Improve Outcome and Survival at Six Months Follow-up).
In contrast, the primary composite outcome was negative, so the takeaway message is clear: “The results of the ALBATROSS study do not warrant the extension of aldosterone blockade to MI patients without heart failure,” said Dr. Montalescot, professor of cardiology at the University of Paris.
ALBATROSS was a multicenter French trial that randomly assigned 1,603 acute MI patients to standard therapy alone or with added mineralocorticoid antagonist therapy started within the first 2 days of their coronary event. Often the aldosterone antagonist was begun in the ambulance en route to the hospital.
The primary endpoint was a composite of death, resuscitated cardiac arrest, ventricular fibrillation or tachycardia, heart failure, or an indication for an implantable cardioverter defibrillator. There were 194 such events, and they occurred at a similar rate in the patients who got 25 mg/day of spironolactone and those who did not.
The rationale for ALBATROSS was sound, according to the cardiologist. Aldosterone is a stress hormone released in acute MI. It has deleterious cardiac effects, including arrhythmias, heart failure, and a dose-dependent increase in mortality, so it makes good sense to block it as soon as possible in MI patients. In the EPHESUS trial, the aldosterone antagonist eplerenone, when started 3-14 days post MI in patients with early heart failure, significantly reduced mortality (N Engl J Med. 2003 Apr 3;348[14]:1309-2), with the bulk of the benefit occurring in patients in whom the drug was started 3-7 days post MI.
Last year, Dr. Montalescot and his coinvestigators published the REMINDER study, in which 1,012 ST-elevation MI (STEMI) patients without heart failure were randomized to eplerenone or placebo within the first 24 hours. The study showed a significant reduction in levels of brain natriuretic peptide or N-terminal pro-BNP in the eplerenone arm (Eur Heart J. 2014 Sep 7;35[34]:2295-302), but that’s not a clinical endpoint. ALBATROSS was the first study to look at the clinical impact of commencing mineralocorticoid antagonist therapy prior to day 3 post MI.
Discussant Dr. John McMurray, professor of cardiology at the University of Glasgow, said that ALBATROSS was simply underpowered and thus leaves unanswered the clinically important question of whether early initiation of aldosterone blockade post MI in patients without heart failure confers clinical benefit. The investigators projected a total of 269 events in the composite endpoint but got only 194 because the study participants were so well treated and contemporary medical and interventional therapies are quite effective.
He dismissed the sharp reduction seen in 6-month mortality with spironolactone in the STEMI patients as “just implausible – we don’t know of any treatments in medicine that reduce mortality by 80%.”
Noting that there were only 28 deaths in the study, Dr. McMurray asserted that “a subgroup analysis on such a small number of events is never going to give you a reliable result.” Moreover, he added, “subgroup analysis is even more treacherous when the overall trial is underpowered.”
Dr. Montalescot replied that, while he considers the signal of a mortality benefit for aldosterone blockade in STEMI patients worthy of pursuit in a large randomized trial, the prospects for mounting such a study are poor. The medications are now available as generics, so there is no commercial incentive. The French Ministry of Health, which funded ALBATROSS, isn’t prepared to back a follow-up study. The best hope is that eventually one of the pharmaceutical companies developing third-generation aldosterone antagonists, now in phase II studies, will become interested, he said.
Dr. Montalescot said that, while he receives research grants and consulting fees from numerous pharmaceutical companies, these commercial relationships aren’t relevant to the government-funded ALBATROSS trial.
LONDON – Aldosterone blockade with oral spironolactone showed a disappointing lack of clinical benefit when initiated in the first hours after an acute MI without heart failure in the large, randomized ALBATROSS trial.
ALBATROSS did, however, flash a silver lining under one wing: A whopping 80% reduction in 6-month mortality in a prespecified subgroup analysis restricted to the 1,229 participants with ST-elevation MI, Dr. Gilles Montalescot reported at the annual congress of the European Society of Cardiology.
Although this finding is intriguing, hypothesis-generating, and definitely warrants a confirmatory study, he continued, mortality was nevertheless merely a secondary endpoint in ALBATROSS (Aldosterone Lethal Effects Blockade in Acute Myocardial Infarction Treated With or Without Reperfusion to Improve Outcome and Survival at Six Months Follow-up).
In contrast, the primary composite outcome was negative, so the takeaway message is clear: “The results of the ALBATROSS study do not warrant the extension of aldosterone blockade to MI patients without heart failure,” said Dr. Montalescot, professor of cardiology at the University of Paris.
ALBATROSS was a multicenter French trial that randomly assigned 1,603 acute MI patients to standard therapy alone or with added mineralocorticoid antagonist therapy started within the first 2 days of their coronary event. Often the aldosterone antagonist was begun in the ambulance en route to the hospital.
The primary endpoint was a composite of death, resuscitated cardiac arrest, ventricular fibrillation or tachycardia, heart failure, or an indication for an implantable cardioverter defibrillator. There were 194 such events, and they occurred at a similar rate in the patients who got 25 mg/day of spironolactone and those who did not.
The rationale for ALBATROSS was sound, according to the cardiologist. Aldosterone is a stress hormone released in acute MI. It has deleterious cardiac effects, including arrhythmias, heart failure, and a dose-dependent increase in mortality, so it makes good sense to block it as soon as possible in MI patients. In the EPHESUS trial, the aldosterone antagonist eplerenone, when started 3-14 days post MI in patients with early heart failure, significantly reduced mortality (N Engl J Med. 2003 Apr 3;348[14]:1309-2), with the bulk of the benefit occurring in patients in whom the drug was started 3-7 days post MI.
Last year, Dr. Montalescot and his coinvestigators published the REMINDER study, in which 1,012 ST-elevation MI (STEMI) patients without heart failure were randomized to eplerenone or placebo within the first 24 hours. The study showed a significant reduction in levels of brain natriuretic peptide or N-terminal pro-BNP in the eplerenone arm (Eur Heart J. 2014 Sep 7;35[34]:2295-302), but that’s not a clinical endpoint. ALBATROSS was the first study to look at the clinical impact of commencing mineralocorticoid antagonist therapy prior to day 3 post MI.
Discussant Dr. John McMurray, professor of cardiology at the University of Glasgow, said that ALBATROSS was simply underpowered and thus leaves unanswered the clinically important question of whether early initiation of aldosterone blockade post MI in patients without heart failure confers clinical benefit. The investigators projected a total of 269 events in the composite endpoint but got only 194 because the study participants were so well treated and contemporary medical and interventional therapies are quite effective.
He dismissed the sharp reduction seen in 6-month mortality with spironolactone in the STEMI patients as “just implausible – we don’t know of any treatments in medicine that reduce mortality by 80%.”
Noting that there were only 28 deaths in the study, Dr. McMurray asserted that “a subgroup analysis on such a small number of events is never going to give you a reliable result.” Moreover, he added, “subgroup analysis is even more treacherous when the overall trial is underpowered.”
Dr. Montalescot replied that, while he considers the signal of a mortality benefit for aldosterone blockade in STEMI patients worthy of pursuit in a large randomized trial, the prospects for mounting such a study are poor. The medications are now available as generics, so there is no commercial incentive. The French Ministry of Health, which funded ALBATROSS, isn’t prepared to back a follow-up study. The best hope is that eventually one of the pharmaceutical companies developing third-generation aldosterone antagonists, now in phase II studies, will become interested, he said.
Dr. Montalescot said that, while he receives research grants and consulting fees from numerous pharmaceutical companies, these commercial relationships aren’t relevant to the government-funded ALBATROSS trial.
AT THE ESC CONGRESS 2015
Key clinical point: Giving aldosterone antagonists to acute MI patients without heart failure doesn’t improve clinical outcomes.
Major finding: The 6-month rate of a multipronged composite clinical endpoint was closely similar, regardless of whether patients with acute MI without heart failure were placed on spironolactone within the first couple of days post-MI.
Data source: ALBATROSS was an open-label, multicenter French study in which 1,603 patients were randomized to 6 months of aldosterone blockade or not within the first hours after an acute MI without heart failure.
Disclosures: The investigator-initiated ALBATROSS trial was funded by the French Ministry of Health.

Tips for Seniors With Epilepsy -- Avoiding Falls
Prolonged TV watching linked to fatal PE
LONDON—Results of a large study suggest that watching television for prolonged periods may increase a person’s risk of fatal pulmonary embolism (PE).
The study, which included more than 86,000 subjects, showed that watching an average of 5 or more hours of TV per day was associated with more than twice the risk of fatal PE as watching less than 2.5 hours daily.
And the risk was higher among younger subjects than older ones.
Toru Shirakawa, of Osaka University in Japan, presented this research at the ESC Congress 2015 (abstract P2686*).
“We showed that prolonged television viewing may be a risky behavior for death from pulmonary embolism,” Shirakawa said. “Leg immobility during television viewing may, in part, explain the finding. Public awareness of the risk of pulmonary embolism from lengthy leg immobility is essential.”
For this research, Shirakawa and his colleagues evaluated 86,024 individuals—36,007 men and 50,017 women ages 40 to 79—who were participating in the Japanese Collaborative Cohort Study.
The subjects completed a self-administered questionnaire that included information about average time spent watching TV each day. They were followed for a median of 18.4 years until 2009. Mortality from PE was determined from death certificates.
Subjects were divided into 3 groups according to the amount of TV they watched per day: less than 2.5 hours, 2.5 to 4.9 hours, and 5 or more hours.
The researchers calculated the risk of death from PE according to the amount of TV watched after adjusting for subjects’ age at baseline, gender, history of hypertension, history of diabetes, smoking status, drinking status, body mass index, walking and sports habits, and menopausal status.
During the follow-up period, there were 59 deaths from PE. And the multiavariate analysis revealed a link between extended TV viewing and fatal PE.
Compared to subjects who tended to watch less than 2.5 hours of TV per day, those who watched an average of 2.5 to 4.9 hours had an increased risk of fatal PE (hazard ratio [HR]=1.59). And the risk was greater among subjects whose average TV viewing time was more than 5 hours per day (HR=2.36).
Among subjects ages 40 to 59, the association between prolonged TV watching and fatal PE was more prominent.
Watching 2.5 to 4.9 hours of TV a day more than tripled the risk of fatal PE when compared to watching less than 2.5 hours (HR=3.24). And watching TV for more than 5 hours a day was associated with a more than 6-fold greater risk of fatal PE than watching less than 2.5 hours (HR=6.49).
Because prolonged leg immobility may explain these findings, Shirakawa and his colleagues recommend taking simple steps to prevent PE while watching TV for extended periods.
“[T]ake a break, stand up, and walk around during the television viewing,” he said. “Drinking water for preventing dehydration is also important.”
Shirakawa also noted that other media-based activities involving prolonged sitting may pose a risk of fatal PE.
“In this era of information technology, use of other visual-based media devices, such as personal computers or smartphones, is popular,” he said.
“Prolonged computer gaming has been associated with death from pulmonary embolism, but, to our knowledge, a relationship with prolonged smartphone use has not yet been reported. More research is needed to assess the risks of prolonged use of new technologies on pulmonary embolism morbidity and mortality.” ![]()
*Information in the abstract differs from that presented at the meeting.