User login
2016-2017 flu season continues to wind down
Influenza activity took another healthy step down as outpatient visits continued to drop, according to the Centers for Disease Control and Prevention.
The proportion of outpatient visits for influenza-like illness (ILI) was down to 3.2% for the week ending March 18, 2017, the CDC reported, compared with 3.6% the week before. (The figure of 3.7% previously reported for last week has been adjusted this week, so the halt in the decline in outpatient visits was actually more of a slowdown.) The national baseline for outpatient ILI visits is 2.2%.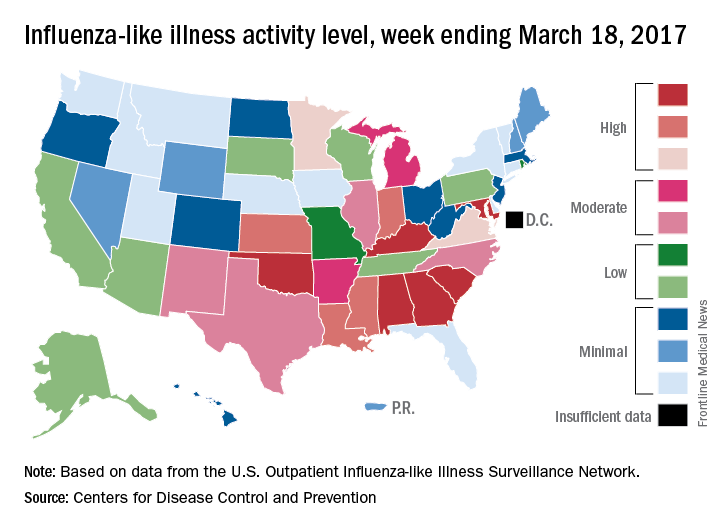
Two flu-related pediatric deaths were reported during the week of March 18, but both occurred earlier: one during the week ending Feb. 18 and the other in the week ending Feb. 25, the CDC reported. The total number of pediatric flu deaths reported is now 55 for the 2016-2017 season.
Influenza activity took another healthy step down as outpatient visits continued to drop, according to the Centers for Disease Control and Prevention.
The proportion of outpatient visits for influenza-like illness (ILI) was down to 3.2% for the week ending March 18, 2017, the CDC reported, compared with 3.6% the week before. (The figure of 3.7% previously reported for last week has been adjusted this week, so the halt in the decline in outpatient visits was actually more of a slowdown.) The national baseline for outpatient ILI visits is 2.2%.
Two flu-related pediatric deaths were reported during the week of March 18, but both occurred earlier: one during the week ending Feb. 18 and the other in the week ending Feb. 25, the CDC reported. The total number of pediatric flu deaths reported is now 55 for the 2016-2017 season.
Influenza activity took another healthy step down as outpatient visits continued to drop, according to the Centers for Disease Control and Prevention.
The proportion of outpatient visits for influenza-like illness (ILI) was down to 3.2% for the week ending March 18, 2017, the CDC reported, compared with 3.6% the week before. (The figure of 3.7% previously reported for last week has been adjusted this week, so the halt in the decline in outpatient visits was actually more of a slowdown.) The national baseline for outpatient ILI visits is 2.2%.
Two flu-related pediatric deaths were reported during the week of March 18, but both occurred earlier: one during the week ending Feb. 18 and the other in the week ending Feb. 25, the CDC reported. The total number of pediatric flu deaths reported is now 55 for the 2016-2017 season.
SPECT reveals perfusion problems in antiphospholipid syndrome
MELBOURNE – SPECT imaging can identify abnormalities in brain perfusion in patients with multiple antiphospholipid antibodies and neuropsychiatric symptoms, but without a history of thrombosis, according to a study presented at an international congress on systemic lupus erythematosus.
The retrospective study by researchers from National Taiwan University Hospital addresses the challenge posed by patients who have antiphospholipid antibodies and neuropsychiatric symptoms but do not meet the full criteria for antiphospholipid syndrome because of a lack of a history of thromboembolism. Current antiphospholipid syndrome classification criteria are based on thrombosis or pregnancy loss, with a third category of noncriteria manifestations that include a range of neuropsychiatric symptoms, said presenter Ting-Syuan Lin, MD, of the Yun-Lin Branch of National Taiwan University Hospital.

“Some physicians may not give the patient early treatment because they do not fill the criteria,” Dr. Lin said in an interview. “But if we have SPECT image to document the abnormality, then the physician can have more confidence to give them early treatment.”
Dr. Lin and his colleagues looked at the brain SPECT images of 54 patients with a history of positive antiphospholipid antibodies and neuropsychiatric symptoms, but who had no history of thromboembolism or other lupus-related antibodies such as antibodies to double-stranded DNA. When the researchers looked simply at mean brain perfusion according to the number of antiphospholipid antibodies each patient had, they found no significant differences between the groups, including a control group of six patients without antiphospholipid antibodies.
But when they examined heterogeneity of brain perfusion, they saw significantly greater heterogeneity (P = .01) in patients with four antiphospholipid antibodies compared with patients who had no antibodies.
The patients enrolled in the study presented with a range of neuropsychiatric symptoms. The most common was headache (56.7%), followed by dizziness (41.7%), depression (28.3%), psychosis (15%), vertigo (8.3%), and seizures (6.7%). The mean age of the patients was 38 years, and 52 of the patients were women.
One of the patients – a 39-year-old woman with more than four antiphospholipid antibodies – had a normal CT scan but showed significant heterogeneity in brain perfusion on the SPECT imaging. She experienced a stroke 1 year after the study.
Commenting on the presentation, session cochair Timothy Godfrey, MBBS, of St. Vincent’s Hospital in Melbourne, said neuropsychiatric lupus was particularly problematic, especially when patients had normal imaging.
“You’re wondering is the patient just depressed or is there some other explanation, or do they truly have a manifestation of lupus which may require immunosuppression or anticoagulation?” he said in an interview.
This study “is highlighting the fact that maybe we do need to do these tests when the MRI is normal, particularly in people that have documented abnormalities in their blood test.”
Dr. Lin said the next phase of the study would look at whether treatment was associated with changes in brain perfusion on SPECT, and whether the abnormality of the SPECT imaging correlated with clinical outcomes.
No conflicts of interest were declared.
MELBOURNE – SPECT imaging can identify abnormalities in brain perfusion in patients with multiple antiphospholipid antibodies and neuropsychiatric symptoms, but without a history of thrombosis, according to a study presented at an international congress on systemic lupus erythematosus.
The retrospective study by researchers from National Taiwan University Hospital addresses the challenge posed by patients who have antiphospholipid antibodies and neuropsychiatric symptoms but do not meet the full criteria for antiphospholipid syndrome because of a lack of a history of thromboembolism. Current antiphospholipid syndrome classification criteria are based on thrombosis or pregnancy loss, with a third category of noncriteria manifestations that include a range of neuropsychiatric symptoms, said presenter Ting-Syuan Lin, MD, of the Yun-Lin Branch of National Taiwan University Hospital.
“Some physicians may not give the patient early treatment because they do not fill the criteria,” Dr. Lin said in an interview. “But if we have SPECT image to document the abnormality, then the physician can have more confidence to give them early treatment.”
Dr. Lin and his colleagues looked at the brain SPECT images of 54 patients with a history of positive antiphospholipid antibodies and neuropsychiatric symptoms, but who had no history of thromboembolism or other lupus-related antibodies such as antibodies to double-stranded DNA. When the researchers looked simply at mean brain perfusion according to the number of antiphospholipid antibodies each patient had, they found no significant differences between the groups, including a control group of six patients without antiphospholipid antibodies.
But when they examined heterogeneity of brain perfusion, they saw significantly greater heterogeneity (P = .01) in patients with four antiphospholipid antibodies compared with patients who had no antibodies.
The patients enrolled in the study presented with a range of neuropsychiatric symptoms. The most common was headache (56.7%), followed by dizziness (41.7%), depression (28.3%), psychosis (15%), vertigo (8.3%), and seizures (6.7%). The mean age of the patients was 38 years, and 52 of the patients were women.
One of the patients – a 39-year-old woman with more than four antiphospholipid antibodies – had a normal CT scan but showed significant heterogeneity in brain perfusion on the SPECT imaging. She experienced a stroke 1 year after the study.
Commenting on the presentation, session cochair Timothy Godfrey, MBBS, of St. Vincent’s Hospital in Melbourne, said neuropsychiatric lupus was particularly problematic, especially when patients had normal imaging.
“You’re wondering is the patient just depressed or is there some other explanation, or do they truly have a manifestation of lupus which may require immunosuppression or anticoagulation?” he said in an interview.
This study “is highlighting the fact that maybe we do need to do these tests when the MRI is normal, particularly in people that have documented abnormalities in their blood test.”
Dr. Lin said the next phase of the study would look at whether treatment was associated with changes in brain perfusion on SPECT, and whether the abnormality of the SPECT imaging correlated with clinical outcomes.
No conflicts of interest were declared.
MELBOURNE – SPECT imaging can identify abnormalities in brain perfusion in patients with multiple antiphospholipid antibodies and neuropsychiatric symptoms, but without a history of thrombosis, according to a study presented at an international congress on systemic lupus erythematosus.
The retrospective study by researchers from National Taiwan University Hospital addresses the challenge posed by patients who have antiphospholipid antibodies and neuropsychiatric symptoms but do not meet the full criteria for antiphospholipid syndrome because of a lack of a history of thromboembolism. Current antiphospholipid syndrome classification criteria are based on thrombosis or pregnancy loss, with a third category of noncriteria manifestations that include a range of neuropsychiatric symptoms, said presenter Ting-Syuan Lin, MD, of the Yun-Lin Branch of National Taiwan University Hospital.
“Some physicians may not give the patient early treatment because they do not fill the criteria,” Dr. Lin said in an interview. “But if we have SPECT image to document the abnormality, then the physician can have more confidence to give them early treatment.”
Dr. Lin and his colleagues looked at the brain SPECT images of 54 patients with a history of positive antiphospholipid antibodies and neuropsychiatric symptoms, but who had no history of thromboembolism or other lupus-related antibodies such as antibodies to double-stranded DNA. When the researchers looked simply at mean brain perfusion according to the number of antiphospholipid antibodies each patient had, they found no significant differences between the groups, including a control group of six patients without antiphospholipid antibodies.
But when they examined heterogeneity of brain perfusion, they saw significantly greater heterogeneity (P = .01) in patients with four antiphospholipid antibodies compared with patients who had no antibodies.
The patients enrolled in the study presented with a range of neuropsychiatric symptoms. The most common was headache (56.7%), followed by dizziness (41.7%), depression (28.3%), psychosis (15%), vertigo (8.3%), and seizures (6.7%). The mean age of the patients was 38 years, and 52 of the patients were women.
One of the patients – a 39-year-old woman with more than four antiphospholipid antibodies – had a normal CT scan but showed significant heterogeneity in brain perfusion on the SPECT imaging. She experienced a stroke 1 year after the study.
Commenting on the presentation, session cochair Timothy Godfrey, MBBS, of St. Vincent’s Hospital in Melbourne, said neuropsychiatric lupus was particularly problematic, especially when patients had normal imaging.
“You’re wondering is the patient just depressed or is there some other explanation, or do they truly have a manifestation of lupus which may require immunosuppression or anticoagulation?” he said in an interview.
This study “is highlighting the fact that maybe we do need to do these tests when the MRI is normal, particularly in people that have documented abnormalities in their blood test.”
Dr. Lin said the next phase of the study would look at whether treatment was associated with changes in brain perfusion on SPECT, and whether the abnormality of the SPECT imaging correlated with clinical outcomes.
No conflicts of interest were declared.
AT LUPUS 2017
Key clinical point: SPECT may be worthwhile in patients who don’t meet antiphospholipid syndrome criteria but have aPL antibodies, neuropsychiatric symptoms, and no thrombosis history.
Major finding: Patients with four antiphospholipid antibodies have significantly greater heterogeneity in brain perfusion on SPECT imaging than do patients with no antiphospholipid antibodies.
Data source: A retrospective cohort study in 54 patients with antiphospholipid syndrome.
Disclosures: No conflicts of interest were declared.
Oral agent found promising for subset of chronic rhinosinusitis patients
ATLANTA – The use of dexpramipexole by patients with chronic rhinosinusitis was well tolerated and showed robust and tissue eosinophil–lowering activity, according to results from a small study.
Dexpramipexole is an investigational oral agent that has been studied in previous clinical trials for patients with amyotrophic lateral sclerosis, Calman Prussin, MD, said in an interview at the annual meeting of the American Academy of Allergy, Asthma, and Immunology. The drug did not meet the clinical endpoint for ALS patients, but its investigators noted that it lowered eosinophil counts by about 50%. “It was a serendipitous finding,” said Dr. Prussin, senior director of clinical and translational medicine for Pittsburgh-based Knopp Biosciences. “We do not have a mechanism of action, but we think it’s working on progenitor cells in the bone marrow.”

In all, 16 of the 20 patients completed the trial. Dr. Prussin and his associates found that the baseline eosinophil count fell from 0.525 x 10⁹/L to 0.031 x 10⁹/L at 6 months, a reduction of 94% (P less than.001). “I don’t think any of us expected to see this,” he said, noting that the drug’s maximal eosinophil-lowering effect was maximal after 2 months. No reduction in total polyp score was observed.
Biopsies conducted in 12 of the patients revealed that polyp tissue eosinophilia was reduced from a mean of 233 to 5 eosinophils/high-powered field, a drop of 97% (P = .001). No serious drug-related adverse effects occurred. The most common adverse event was infection (50%), followed by respiratory symptoms (35%) and gastrointestinal disorders (20%).
Knopp Biosciences funded the study. Dr. Prussin is an employee of the company.
ATLANTA – The use of dexpramipexole by patients with chronic rhinosinusitis was well tolerated and showed robust and tissue eosinophil–lowering activity, according to results from a small study.
Dexpramipexole is an investigational oral agent that has been studied in previous clinical trials for patients with amyotrophic lateral sclerosis, Calman Prussin, MD, said in an interview at the annual meeting of the American Academy of Allergy, Asthma, and Immunology. The drug did not meet the clinical endpoint for ALS patients, but its investigators noted that it lowered eosinophil counts by about 50%. “It was a serendipitous finding,” said Dr. Prussin, senior director of clinical and translational medicine for Pittsburgh-based Knopp Biosciences. “We do not have a mechanism of action, but we think it’s working on progenitor cells in the bone marrow.”
In all, 16 of the 20 patients completed the trial. Dr. Prussin and his associates found that the baseline eosinophil count fell from 0.525 x 10⁹/L to 0.031 x 10⁹/L at 6 months, a reduction of 94% (P less than.001). “I don’t think any of us expected to see this,” he said, noting that the drug’s maximal eosinophil-lowering effect was maximal after 2 months. No reduction in total polyp score was observed.
Biopsies conducted in 12 of the patients revealed that polyp tissue eosinophilia was reduced from a mean of 233 to 5 eosinophils/high-powered field, a drop of 97% (P = .001). No serious drug-related adverse effects occurred. The most common adverse event was infection (50%), followed by respiratory symptoms (35%) and gastrointestinal disorders (20%).
Knopp Biosciences funded the study. Dr. Prussin is an employee of the company.
ATLANTA – The use of dexpramipexole by patients with chronic rhinosinusitis was well tolerated and showed robust and tissue eosinophil–lowering activity, according to results from a small study.
Dexpramipexole is an investigational oral agent that has been studied in previous clinical trials for patients with amyotrophic lateral sclerosis, Calman Prussin, MD, said in an interview at the annual meeting of the American Academy of Allergy, Asthma, and Immunology. The drug did not meet the clinical endpoint for ALS patients, but its investigators noted that it lowered eosinophil counts by about 50%. “It was a serendipitous finding,” said Dr. Prussin, senior director of clinical and translational medicine for Pittsburgh-based Knopp Biosciences. “We do not have a mechanism of action, but we think it’s working on progenitor cells in the bone marrow.”
In all, 16 of the 20 patients completed the trial. Dr. Prussin and his associates found that the baseline eosinophil count fell from 0.525 x 10⁹/L to 0.031 x 10⁹/L at 6 months, a reduction of 94% (P less than.001). “I don’t think any of us expected to see this,” he said, noting that the drug’s maximal eosinophil-lowering effect was maximal after 2 months. No reduction in total polyp score was observed.
Biopsies conducted in 12 of the patients revealed that polyp tissue eosinophilia was reduced from a mean of 233 to 5 eosinophils/high-powered field, a drop of 97% (P = .001). No serious drug-related adverse effects occurred. The most common adverse event was infection (50%), followed by respiratory symptoms (35%) and gastrointestinal disorders (20%).
Knopp Biosciences funded the study. Dr. Prussin is an employee of the company.
AT THE 2017 AAAAI ANNUAL MEETING
Key clinical point:
Major finding: The baseline eosinophil count fell from 0.525 x 10⁹/L to 0.031 x 10⁹/L at 6 months, a reduction of 94% (P less than .001).
Data source: Results from a open-label trial in 16 chronic rhinosinusitis patients who received dexpramipexole 150 mg b.i.d. for 6 months.
Disclosures: Knopp Biosciences funded the study. Dr. Prussin is an employee of the company.
Freezing of Gait May Be Associated With Anxiety and Depression in Parkinson’s Disease
MIAMI—Freezing of gait in Parkinson's disease may be associated with higher levels of anxiety and depressive symptoms, as well as recurrent falls and lower quality of life, according to research presented at the First Pan American Parkinson's Disease and Movement Disorders Congress.
"Our data suggest that people with Parkinson's disease and freezing of gait have advanced disease, functional limitations, lower balance confidence, and a higher level of anxiety and depressive symptoms, which may negatively impact their quality of life," said Milla Pimenta, a medical student at the Bahiana School of Medicine and Public Health in Brazil, and colleagues. "Future prospective studies should elucidate whether the treatment of anxiety can contribute to reduce the frequency or severity of freezing of gait episodes."
To identify the association between freezing of gait and symptoms of anxiety and depression, the researchers recruited consecutive patients with idiopathic Parkinson's disease and independent walking ability from the Movement Disorders Clinic at the State of Bahia Health Attention Center for the Elderly in Brazil. They excluded patients with other neurologic conditions or comorbidities that affect balance.
The investigators assessed patients' demographics, Parkinson's disease severity and symptoms, medication, disability, freezing, anxiety, depression, self-efficacy, and quality of life.
A total of 78 people with Parkinson's disease (mean age, 70.5; mean Unified Parkinson's Disease Rating Scale motor score, 32; Hoehn and Yahr stages between 1.5 and 4) were included in the study.
Twenty-seven participants (35%) were identified as having freezing of gait (ie, they scored at least 1 point on item 3 of the Freezing of Gait Questionnaire).
Patients with freezing of gait had higher Hospital Anxiety and Depression Scale scores and lower Activities-Specific Balance Confidence Scale scores, compared with patients without freezing.
Patients with freezing of gait were more likely to have had recurrent falls in the previous year. In addition, patients with freezing had longer median disease duration (nine years versus four years) and received a higher median levodopa equivalent dose (800 mg/day vs 532 mg/day) than patients without freezing. Quality of life, as assessed by the eight-item Parkinson's Disease Questionnaire, was worse in patients with freezing of gait (40.6 vs 25).
—Jake Remaly
MIAMI—Freezing of gait in Parkinson's disease may be associated with higher levels of anxiety and depressive symptoms, as well as recurrent falls and lower quality of life, according to research presented at the First Pan American Parkinson's Disease and Movement Disorders Congress.
"Our data suggest that people with Parkinson's disease and freezing of gait have advanced disease, functional limitations, lower balance confidence, and a higher level of anxiety and depressive symptoms, which may negatively impact their quality of life," said Milla Pimenta, a medical student at the Bahiana School of Medicine and Public Health in Brazil, and colleagues. "Future prospective studies should elucidate whether the treatment of anxiety can contribute to reduce the frequency or severity of freezing of gait episodes."
To identify the association between freezing of gait and symptoms of anxiety and depression, the researchers recruited consecutive patients with idiopathic Parkinson's disease and independent walking ability from the Movement Disorders Clinic at the State of Bahia Health Attention Center for the Elderly in Brazil. They excluded patients with other neurologic conditions or comorbidities that affect balance.
The investigators assessed patients' demographics, Parkinson's disease severity and symptoms, medication, disability, freezing, anxiety, depression, self-efficacy, and quality of life.
A total of 78 people with Parkinson's disease (mean age, 70.5; mean Unified Parkinson's Disease Rating Scale motor score, 32; Hoehn and Yahr stages between 1.5 and 4) were included in the study.
Twenty-seven participants (35%) were identified as having freezing of gait (ie, they scored at least 1 point on item 3 of the Freezing of Gait Questionnaire).
Patients with freezing of gait had higher Hospital Anxiety and Depression Scale scores and lower Activities-Specific Balance Confidence Scale scores, compared with patients without freezing.
Patients with freezing of gait were more likely to have had recurrent falls in the previous year. In addition, patients with freezing had longer median disease duration (nine years versus four years) and received a higher median levodopa equivalent dose (800 mg/day vs 532 mg/day) than patients without freezing. Quality of life, as assessed by the eight-item Parkinson's Disease Questionnaire, was worse in patients with freezing of gait (40.6 vs 25).
—Jake Remaly
MIAMI—Freezing of gait in Parkinson's disease may be associated with higher levels of anxiety and depressive symptoms, as well as recurrent falls and lower quality of life, according to research presented at the First Pan American Parkinson's Disease and Movement Disorders Congress.
"Our data suggest that people with Parkinson's disease and freezing of gait have advanced disease, functional limitations, lower balance confidence, and a higher level of anxiety and depressive symptoms, which may negatively impact their quality of life," said Milla Pimenta, a medical student at the Bahiana School of Medicine and Public Health in Brazil, and colleagues. "Future prospective studies should elucidate whether the treatment of anxiety can contribute to reduce the frequency or severity of freezing of gait episodes."
To identify the association between freezing of gait and symptoms of anxiety and depression, the researchers recruited consecutive patients with idiopathic Parkinson's disease and independent walking ability from the Movement Disorders Clinic at the State of Bahia Health Attention Center for the Elderly in Brazil. They excluded patients with other neurologic conditions or comorbidities that affect balance.
The investigators assessed patients' demographics, Parkinson's disease severity and symptoms, medication, disability, freezing, anxiety, depression, self-efficacy, and quality of life.
A total of 78 people with Parkinson's disease (mean age, 70.5; mean Unified Parkinson's Disease Rating Scale motor score, 32; Hoehn and Yahr stages between 1.5 and 4) were included in the study.
Twenty-seven participants (35%) were identified as having freezing of gait (ie, they scored at least 1 point on item 3 of the Freezing of Gait Questionnaire).
Patients with freezing of gait had higher Hospital Anxiety and Depression Scale scores and lower Activities-Specific Balance Confidence Scale scores, compared with patients without freezing.
Patients with freezing of gait were more likely to have had recurrent falls in the previous year. In addition, patients with freezing had longer median disease duration (nine years versus four years) and received a higher median levodopa equivalent dose (800 mg/day vs 532 mg/day) than patients without freezing. Quality of life, as assessed by the eight-item Parkinson's Disease Questionnaire, was worse in patients with freezing of gait (40.6 vs 25).
—Jake Remaly
Advanced CLL treatment approach depends on comorbidity burden
ORLANDO – The choice of first-line therapy in symptomatic chronic lymphocytic leukemia patients depends largely on comorbidity burden, Andrew D. Zelenetz, MD, PhD, said at the annual conference of the National Comprehensive Cancer Network.
“This is a disease of elderly patients. Frequently they have comorbidities,” he said. Categorizing these patients as having a low or high comorbidity burden can be done with the Cumulative Index Rating Scale score, which involves scoring of all organ systems on a 0-5 scale representing “not affected” to “extremely disabled.”
“We use this to determine first-line therapy,” said Dr. Zelenetz of Memorial Sloan Kettering Cancer Center, New York. Dr. Zelenetz is chair of the NCCN Non-Hodgkin Lymphoma Guidelines panel.

Patients with a score of greater than 12 on the 0- to 56-point scale, are “no-go” patients with respect to therapy, and are typically treated only with palliative approaches. Those with a score of 7-12 (“slow-go” patients) have a significant comorbidity burden, but can undergo treatment, thought typically to be at reduced intensity. Those with a score of 0-6 are “go-go” patients with respect to treatment, as they are physically fit, have excellent renal function, and have no significant comorbidities, he said.
Treatment options for ‘go-go’ CLL patients
Among the treatment options for the latter is FCR–the combination of fludarabine, cyclophosphamide, and rituximab, which was shown in the phase III CLL10 trial of patients with advanced CLL to be associated with improved complete response rates compared with the popular regimen of bendamustine and rituximab (BR), both overall and in patients under age 65. In older patients, the advantage disappeared, Dr. Zelenetz said.
FCR was also associated with improved outcomes vs. BR in patients with del(11q).
The primary endpoint of the study was progression-free survival, which favored FCR (median of 55.2 vs. 41.7 months; hazard ratio, 1.643), he said, noting that no difference was seen between the two regimens in terms of overall survival.
In a recent publication, MD Anderson Cancer Center reported its experience with its first 300 CLL patients treated with FCR. With long-term follow-up of at least 9-10 years (median of 12.8 years), patients in this trial have done extremely well.
“But interestingly, when you stratify these patients by whether they have IGHV [immunoglobulin heavy chain variable] mutated or unmutated [disease], the IGHV mutated patients have something that looks a whole lot like a survival plateau, and that survival plateau is not trivial – it’s about 60%,” he said. “So there is a group of patients with CLL who are, in fact, curable with conventional chemoimmunotherapy.
“This is an appropriate treatment for a young, fit, ‘go-go’ patient, and it has a big implication,” he said. That is, patients who are young and fit require IGHV mutation testing, as “you will absolutely choose FCR chemotherapy for the fit, young patients who has IGHV mutated disease.
“In that setting IGHV testing is now mandatory,” he stressed, noting that the benefits in this population extend to overall survival as well as progression-free survival.
Dr. Zelenetz also emphasized the need for increasing the single dose of rituximab from 375 mg/m2 during cycle 1 to 500 mg/m2 during cycles 2-6 in those receiving FCR, as this is often forgotten.
The data demonstrating the efficacy of FCR were based on this approach, he said.
Fludarabine is to be given at a dose of 25 mg/m2, and cyclophosphamide at a dose of 250 mg/m2 – both for 2-4 days during cycle 1 and for 1-3 days during cycles 2-6.
Treatment options for ‘slow-go’ CLL patients
In “slow-go” patients, an interesting approach is to use new anti-CD20 antibodies such as ofatumumab and obinutuzumab, which have features that are distinct from rituximab.
Both have been studied in CLL. The CLL11 trial compared chlorambucil, rituximab+chlorambucil, and obinutuzumab+chlorambucil, and the latest analysis showed substantial improvement in progression-free survival with obinutuzumab+chlorambucil vs. the other two regimens (26.7 months vs. 11.1 and 16.3 months, respectively), Dr. Zelenetz said, noting that rituximab+chlorambucil was also superior to chlorambucil alone, but that only the obinutuzumab regimen had an overall survival advantage vs. chlorambucil alone.
An updated analysis to be reported soon will show emerging evidence of a survival advantage of obinutuzumab+chlorambucil vs. rituximab+chlorambucil, he said.
“This suggests that obinutuzumab is a far better antibody,” he added, noting that the reasons for that are under debate, “but the way it’s given, it works better in CLL, and that, I think is unequivocal.”
A similar study looking at chlorambucil with and without ofatumumab in “slow-go” patients also demonstrated an improvement in PFS with ofatumumab, but showed “no difference whatsoever in overall survival.”
“This is actually very similar to the rituximab result, and I actually call this the ‘death of ofatumumab’ study, because clearly obinutuzumab in CLL is, I think, a superior anti-CD20 antibody,” Dr. Zelenetz said.
Studies in which obinutuzumab is substituted for rituximab in the FCR combination are currently underway as are a number of other studies of obinutuzumab, he noted.
Another treatment option in the up-front setting is ibrutinib, which was shown to be effective in the RESONATE 2 trial .
“But notice, a very, very small [complete response rate]. CRs are very difficult to achieve with ibrutinib alone, so this drug is given continuously, lifelong,” Dr. Zelenetz said, noting that it was, however, associated with an overall survival advantage vs. chlorambucil.
“Should this be the standard of care? I think it is in patients who have del(17p) or mutation of TP53. Outside of that setting, I’m still concerned about the cost of long-term tolerability of the agent,” he said.
Future of first-line CLL treatment
Avoidance of long-term therapy and conventional chemotherapy in patients with CLL is a goal, he added, noting that new understanding from studies in patients in the relapsed/refractory CLL setting – such as recent findings from a phase Ib study of venetoclax plus rituximab, which demonstrated potentially durable responses after treatment discontinuation in minimal residual disease (MRD)–negative patients – are providing insights into achieving MRD negativity that could be applied in the front line treatment setting.
“We’re still trying to figure out how to best use this. We want to try to use some of this knowledge about achievement of MRD negativity in the up-front setting so we don’t have to give patients long-term therapy, and we would like to avoid conventional chemotherapy,” he said. “So I’m hoping we’re going to be able to replace chronic long-term therapy of CLL with a defined course of treatment with high levels of MRD negativity.”
Dr. Zelenetz reported receiving consulting fees, honoraria, and/or grant/research support from Acerta Pharma, Amgen Inc., BeiGene, Bristol-Myers Squibb, Celgene Corporation, Genentech, Gilead Sciences, Janssen Pharmaceutica Products, MEI Pharma, NanoString Technologies, Pharmacyclics, Portola Pharmaceuticals, Roche Laboratories, and Takeda Pharmaceuticals North America.
ORLANDO – The choice of first-line therapy in symptomatic chronic lymphocytic leukemia patients depends largely on comorbidity burden, Andrew D. Zelenetz, MD, PhD, said at the annual conference of the National Comprehensive Cancer Network.
“This is a disease of elderly patients. Frequently they have comorbidities,” he said. Categorizing these patients as having a low or high comorbidity burden can be done with the Cumulative Index Rating Scale score, which involves scoring of all organ systems on a 0-5 scale representing “not affected” to “extremely disabled.”
“We use this to determine first-line therapy,” said Dr. Zelenetz of Memorial Sloan Kettering Cancer Center, New York. Dr. Zelenetz is chair of the NCCN Non-Hodgkin Lymphoma Guidelines panel.
Patients with a score of greater than 12 on the 0- to 56-point scale, are “no-go” patients with respect to therapy, and are typically treated only with palliative approaches. Those with a score of 7-12 (“slow-go” patients) have a significant comorbidity burden, but can undergo treatment, thought typically to be at reduced intensity. Those with a score of 0-6 are “go-go” patients with respect to treatment, as they are physically fit, have excellent renal function, and have no significant comorbidities, he said.
Treatment options for ‘go-go’ CLL patients
Among the treatment options for the latter is FCR–the combination of fludarabine, cyclophosphamide, and rituximab, which was shown in the phase III CLL10 trial of patients with advanced CLL to be associated with improved complete response rates compared with the popular regimen of bendamustine and rituximab (BR), both overall and in patients under age 65. In older patients, the advantage disappeared, Dr. Zelenetz said.
FCR was also associated with improved outcomes vs. BR in patients with del(11q).
The primary endpoint of the study was progression-free survival, which favored FCR (median of 55.2 vs. 41.7 months; hazard ratio, 1.643), he said, noting that no difference was seen between the two regimens in terms of overall survival.
In a recent publication, MD Anderson Cancer Center reported its experience with its first 300 CLL patients treated with FCR. With long-term follow-up of at least 9-10 years (median of 12.8 years), patients in this trial have done extremely well.
“But interestingly, when you stratify these patients by whether they have IGHV [immunoglobulin heavy chain variable] mutated or unmutated [disease], the IGHV mutated patients have something that looks a whole lot like a survival plateau, and that survival plateau is not trivial – it’s about 60%,” he said. “So there is a group of patients with CLL who are, in fact, curable with conventional chemoimmunotherapy.
“This is an appropriate treatment for a young, fit, ‘go-go’ patient, and it has a big implication,” he said. That is, patients who are young and fit require IGHV mutation testing, as “you will absolutely choose FCR chemotherapy for the fit, young patients who has IGHV mutated disease.
“In that setting IGHV testing is now mandatory,” he stressed, noting that the benefits in this population extend to overall survival as well as progression-free survival.
Dr. Zelenetz also emphasized the need for increasing the single dose of rituximab from 375 mg/m2 during cycle 1 to 500 mg/m2 during cycles 2-6 in those receiving FCR, as this is often forgotten.
The data demonstrating the efficacy of FCR were based on this approach, he said.
Fludarabine is to be given at a dose of 25 mg/m2, and cyclophosphamide at a dose of 250 mg/m2 – both for 2-4 days during cycle 1 and for 1-3 days during cycles 2-6.
Treatment options for ‘slow-go’ CLL patients
In “slow-go” patients, an interesting approach is to use new anti-CD20 antibodies such as ofatumumab and obinutuzumab, which have features that are distinct from rituximab.
Both have been studied in CLL. The CLL11 trial compared chlorambucil, rituximab+chlorambucil, and obinutuzumab+chlorambucil, and the latest analysis showed substantial improvement in progression-free survival with obinutuzumab+chlorambucil vs. the other two regimens (26.7 months vs. 11.1 and 16.3 months, respectively), Dr. Zelenetz said, noting that rituximab+chlorambucil was also superior to chlorambucil alone, but that only the obinutuzumab regimen had an overall survival advantage vs. chlorambucil alone.
An updated analysis to be reported soon will show emerging evidence of a survival advantage of obinutuzumab+chlorambucil vs. rituximab+chlorambucil, he said.
“This suggests that obinutuzumab is a far better antibody,” he added, noting that the reasons for that are under debate, “but the way it’s given, it works better in CLL, and that, I think is unequivocal.”
A similar study looking at chlorambucil with and without ofatumumab in “slow-go” patients also demonstrated an improvement in PFS with ofatumumab, but showed “no difference whatsoever in overall survival.”
“This is actually very similar to the rituximab result, and I actually call this the ‘death of ofatumumab’ study, because clearly obinutuzumab in CLL is, I think, a superior anti-CD20 antibody,” Dr. Zelenetz said.
Studies in which obinutuzumab is substituted for rituximab in the FCR combination are currently underway as are a number of other studies of obinutuzumab, he noted.
Another treatment option in the up-front setting is ibrutinib, which was shown to be effective in the RESONATE 2 trial .
“But notice, a very, very small [complete response rate]. CRs are very difficult to achieve with ibrutinib alone, so this drug is given continuously, lifelong,” Dr. Zelenetz said, noting that it was, however, associated with an overall survival advantage vs. chlorambucil.
“Should this be the standard of care? I think it is in patients who have del(17p) or mutation of TP53. Outside of that setting, I’m still concerned about the cost of long-term tolerability of the agent,” he said.
Future of first-line CLL treatment
Avoidance of long-term therapy and conventional chemotherapy in patients with CLL is a goal, he added, noting that new understanding from studies in patients in the relapsed/refractory CLL setting – such as recent findings from a phase Ib study of venetoclax plus rituximab, which demonstrated potentially durable responses after treatment discontinuation in minimal residual disease (MRD)–negative patients – are providing insights into achieving MRD negativity that could be applied in the front line treatment setting.
“We’re still trying to figure out how to best use this. We want to try to use some of this knowledge about achievement of MRD negativity in the up-front setting so we don’t have to give patients long-term therapy, and we would like to avoid conventional chemotherapy,” he said. “So I’m hoping we’re going to be able to replace chronic long-term therapy of CLL with a defined course of treatment with high levels of MRD negativity.”
Dr. Zelenetz reported receiving consulting fees, honoraria, and/or grant/research support from Acerta Pharma, Amgen Inc., BeiGene, Bristol-Myers Squibb, Celgene Corporation, Genentech, Gilead Sciences, Janssen Pharmaceutica Products, MEI Pharma, NanoString Technologies, Pharmacyclics, Portola Pharmaceuticals, Roche Laboratories, and Takeda Pharmaceuticals North America.
ORLANDO – The choice of first-line therapy in symptomatic chronic lymphocytic leukemia patients depends largely on comorbidity burden, Andrew D. Zelenetz, MD, PhD, said at the annual conference of the National Comprehensive Cancer Network.
“This is a disease of elderly patients. Frequently they have comorbidities,” he said. Categorizing these patients as having a low or high comorbidity burden can be done with the Cumulative Index Rating Scale score, which involves scoring of all organ systems on a 0-5 scale representing “not affected” to “extremely disabled.”
“We use this to determine first-line therapy,” said Dr. Zelenetz of Memorial Sloan Kettering Cancer Center, New York. Dr. Zelenetz is chair of the NCCN Non-Hodgkin Lymphoma Guidelines panel.
Patients with a score of greater than 12 on the 0- to 56-point scale, are “no-go” patients with respect to therapy, and are typically treated only with palliative approaches. Those with a score of 7-12 (“slow-go” patients) have a significant comorbidity burden, but can undergo treatment, thought typically to be at reduced intensity. Those with a score of 0-6 are “go-go” patients with respect to treatment, as they are physically fit, have excellent renal function, and have no significant comorbidities, he said.
Treatment options for ‘go-go’ CLL patients
Among the treatment options for the latter is FCR–the combination of fludarabine, cyclophosphamide, and rituximab, which was shown in the phase III CLL10 trial of patients with advanced CLL to be associated with improved complete response rates compared with the popular regimen of bendamustine and rituximab (BR), both overall and in patients under age 65. In older patients, the advantage disappeared, Dr. Zelenetz said.
FCR was also associated with improved outcomes vs. BR in patients with del(11q).
The primary endpoint of the study was progression-free survival, which favored FCR (median of 55.2 vs. 41.7 months; hazard ratio, 1.643), he said, noting that no difference was seen between the two regimens in terms of overall survival.
In a recent publication, MD Anderson Cancer Center reported its experience with its first 300 CLL patients treated with FCR. With long-term follow-up of at least 9-10 years (median of 12.8 years), patients in this trial have done extremely well.
“But interestingly, when you stratify these patients by whether they have IGHV [immunoglobulin heavy chain variable] mutated or unmutated [disease], the IGHV mutated patients have something that looks a whole lot like a survival plateau, and that survival plateau is not trivial – it’s about 60%,” he said. “So there is a group of patients with CLL who are, in fact, curable with conventional chemoimmunotherapy.
“This is an appropriate treatment for a young, fit, ‘go-go’ patient, and it has a big implication,” he said. That is, patients who are young and fit require IGHV mutation testing, as “you will absolutely choose FCR chemotherapy for the fit, young patients who has IGHV mutated disease.
“In that setting IGHV testing is now mandatory,” he stressed, noting that the benefits in this population extend to overall survival as well as progression-free survival.
Dr. Zelenetz also emphasized the need for increasing the single dose of rituximab from 375 mg/m2 during cycle 1 to 500 mg/m2 during cycles 2-6 in those receiving FCR, as this is often forgotten.
The data demonstrating the efficacy of FCR were based on this approach, he said.
Fludarabine is to be given at a dose of 25 mg/m2, and cyclophosphamide at a dose of 250 mg/m2 – both for 2-4 days during cycle 1 and for 1-3 days during cycles 2-6.
Treatment options for ‘slow-go’ CLL patients
In “slow-go” patients, an interesting approach is to use new anti-CD20 antibodies such as ofatumumab and obinutuzumab, which have features that are distinct from rituximab.
Both have been studied in CLL. The CLL11 trial compared chlorambucil, rituximab+chlorambucil, and obinutuzumab+chlorambucil, and the latest analysis showed substantial improvement in progression-free survival with obinutuzumab+chlorambucil vs. the other two regimens (26.7 months vs. 11.1 and 16.3 months, respectively), Dr. Zelenetz said, noting that rituximab+chlorambucil was also superior to chlorambucil alone, but that only the obinutuzumab regimen had an overall survival advantage vs. chlorambucil alone.
An updated analysis to be reported soon will show emerging evidence of a survival advantage of obinutuzumab+chlorambucil vs. rituximab+chlorambucil, he said.
“This suggests that obinutuzumab is a far better antibody,” he added, noting that the reasons for that are under debate, “but the way it’s given, it works better in CLL, and that, I think is unequivocal.”
A similar study looking at chlorambucil with and without ofatumumab in “slow-go” patients also demonstrated an improvement in PFS with ofatumumab, but showed “no difference whatsoever in overall survival.”
“This is actually very similar to the rituximab result, and I actually call this the ‘death of ofatumumab’ study, because clearly obinutuzumab in CLL is, I think, a superior anti-CD20 antibody,” Dr. Zelenetz said.
Studies in which obinutuzumab is substituted for rituximab in the FCR combination are currently underway as are a number of other studies of obinutuzumab, he noted.
Another treatment option in the up-front setting is ibrutinib, which was shown to be effective in the RESONATE 2 trial .
“But notice, a very, very small [complete response rate]. CRs are very difficult to achieve with ibrutinib alone, so this drug is given continuously, lifelong,” Dr. Zelenetz said, noting that it was, however, associated with an overall survival advantage vs. chlorambucil.
“Should this be the standard of care? I think it is in patients who have del(17p) or mutation of TP53. Outside of that setting, I’m still concerned about the cost of long-term tolerability of the agent,” he said.
Future of first-line CLL treatment
Avoidance of long-term therapy and conventional chemotherapy in patients with CLL is a goal, he added, noting that new understanding from studies in patients in the relapsed/refractory CLL setting – such as recent findings from a phase Ib study of venetoclax plus rituximab, which demonstrated potentially durable responses after treatment discontinuation in minimal residual disease (MRD)–negative patients – are providing insights into achieving MRD negativity that could be applied in the front line treatment setting.
“We’re still trying to figure out how to best use this. We want to try to use some of this knowledge about achievement of MRD negativity in the up-front setting so we don’t have to give patients long-term therapy, and we would like to avoid conventional chemotherapy,” he said. “So I’m hoping we’re going to be able to replace chronic long-term therapy of CLL with a defined course of treatment with high levels of MRD negativity.”
Dr. Zelenetz reported receiving consulting fees, honoraria, and/or grant/research support from Acerta Pharma, Amgen Inc., BeiGene, Bristol-Myers Squibb, Celgene Corporation, Genentech, Gilead Sciences, Janssen Pharmaceutica Products, MEI Pharma, NanoString Technologies, Pharmacyclics, Portola Pharmaceuticals, Roche Laboratories, and Takeda Pharmaceuticals North America.
EXPERT ANALYSIS FROM THE NCCN ANNUAL CONFERENCE
Is your patient’s valproic acid dosage too low or high? Adjust it with this equation
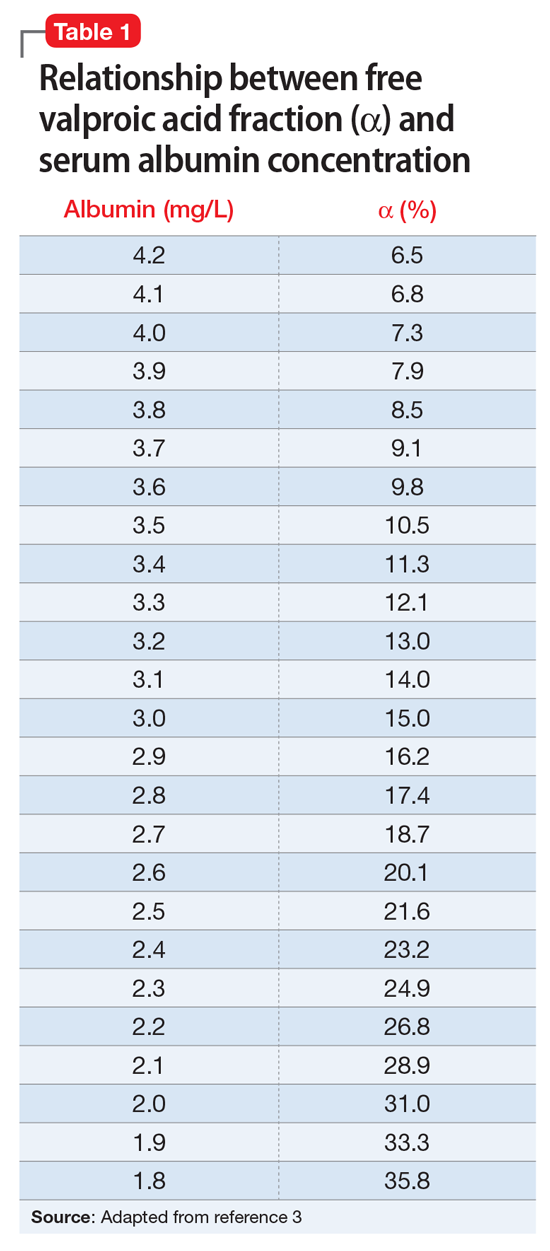
Valproic acid (VPA) often is used to treat mania in bipolar disorder, and it has a therapeutic range of 50 to 125 µg/mL of total serum concentration.1 VPA binds highly to albumin, resulting in free drug concentrations (5 to 15 mg/L) that are responsible for its therapeutic effect.2 Monitoring total VPA levels in patients with hypoalbuminemia could reveal seemingly subtherapeutic VPA levels, which could lead to unnecessary dosage adjustments or drug toxicity. Hermida et al3 devised a correction equation to normalize total VPA serum concentrations <75 µg/mL in patients with hypoalbuminemia (Table 1, Box).
We present a case employing this equation in a patient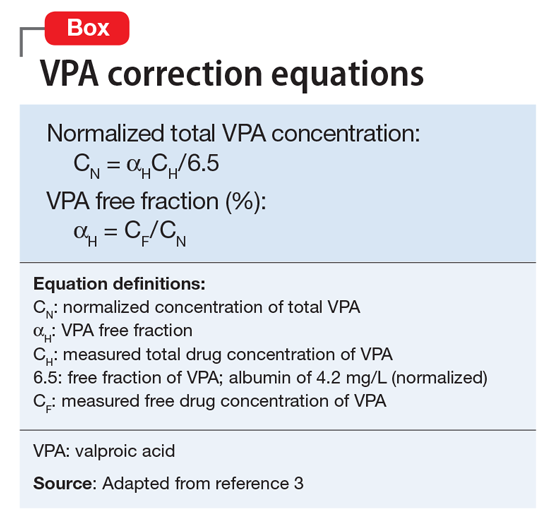
Case
Ms. T, age 75, is admitted to the hospital with delusional, paranoid, assaultive, and combative behavior. By applying Ms. T’s baseline lab findings (Table 2) to the equation, a normalized total VPA level and estimated free VPA level of 70 µg/mL and 7 µg/mL, respectively, can be approximated. These estimates fall within the therapeutic range and are validated by the measured free VPA level of 9 µg/mL.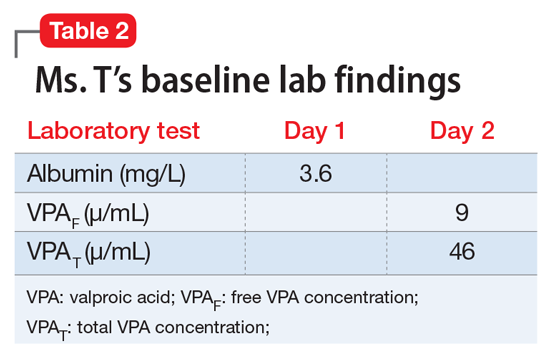
VPA serum levels should be assessed 2 to 4 days after initiation or dosage adjustments.1 Also, consider patient-specific goals and intended clinical effect when adjusting VPA dosage. In practice settings, where free VPA levels are not routinely monitored or are cost prohibitive, this equation can guide clinical decision-making.3
1. Depakote [divalproex sodium]. North Chicago, IL: AbbVie Inc; 2016.
2. DeVane CL. Pharmacokinetics, drug interactions, and tolerability of valproate. Psychopharmacol Bull. 2003;37(suppl 2):25-42.
3. Hermida J, Tutor JC. A theoretical method for normalizing total serum valproic acid concentration in hypoalbuminemic patients. J Pharmacol Sci. 2005;97(4):489-493.
Valproic acid (VPA) often is used to treat mania in bipolar disorder, and it has a therapeutic range of 50 to 125 µg/mL of total serum concentration.1 VPA binds highly to albumin, resulting in free drug concentrations (5 to 15 mg/L) that are responsible for its therapeutic effect.2 Monitoring total VPA levels in patients with hypoalbuminemia could reveal seemingly subtherapeutic VPA levels, which could lead to unnecessary dosage adjustments or drug toxicity. Hermida et al3 devised a correction equation to normalize total VPA serum concentrations <75 µg/mL in patients with hypoalbuminemia (Table 1, Box).
We present a case employing this equation in a patient
Case
Ms. T, age 75, is admitted to the hospital with delusional, paranoid, assaultive, and combative behavior. By applying Ms. T’s baseline lab findings (Table 2) to the equation, a normalized total VPA level and estimated free VPA level of 70 µg/mL and 7 µg/mL, respectively, can be approximated. These estimates fall within the therapeutic range and are validated by the measured free VPA level of 9 µg/mL.
VPA serum levels should be assessed 2 to 4 days after initiation or dosage adjustments.1 Also, consider patient-specific goals and intended clinical effect when adjusting VPA dosage. In practice settings, where free VPA levels are not routinely monitored or are cost prohibitive, this equation can guide clinical decision-making.3
Valproic acid (VPA) often is used to treat mania in bipolar disorder, and it has a therapeutic range of 50 to 125 µg/mL of total serum concentration.1 VPA binds highly to albumin, resulting in free drug concentrations (5 to 15 mg/L) that are responsible for its therapeutic effect.2 Monitoring total VPA levels in patients with hypoalbuminemia could reveal seemingly subtherapeutic VPA levels, which could lead to unnecessary dosage adjustments or drug toxicity. Hermida et al3 devised a correction equation to normalize total VPA serum concentrations <75 µg/mL in patients with hypoalbuminemia (Table 1, Box).
We present a case employing this equation in a patient
Case
Ms. T, age 75, is admitted to the hospital with delusional, paranoid, assaultive, and combative behavior. By applying Ms. T’s baseline lab findings (Table 2) to the equation, a normalized total VPA level and estimated free VPA level of 70 µg/mL and 7 µg/mL, respectively, can be approximated. These estimates fall within the therapeutic range and are validated by the measured free VPA level of 9 µg/mL.
VPA serum levels should be assessed 2 to 4 days after initiation or dosage adjustments.1 Also, consider patient-specific goals and intended clinical effect when adjusting VPA dosage. In practice settings, where free VPA levels are not routinely monitored or are cost prohibitive, this equation can guide clinical decision-making.3
1. Depakote [divalproex sodium]. North Chicago, IL: AbbVie Inc; 2016.
2. DeVane CL. Pharmacokinetics, drug interactions, and tolerability of valproate. Psychopharmacol Bull. 2003;37(suppl 2):25-42.
3. Hermida J, Tutor JC. A theoretical method for normalizing total serum valproic acid concentration in hypoalbuminemic patients. J Pharmacol Sci. 2005;97(4):489-493.
1. Depakote [divalproex sodium]. North Chicago, IL: AbbVie Inc; 2016.
2. DeVane CL. Pharmacokinetics, drug interactions, and tolerability of valproate. Psychopharmacol Bull. 2003;37(suppl 2):25-42.
3. Hermida J, Tutor JC. A theoretical method for normalizing total serum valproic acid concentration in hypoalbuminemic patients. J Pharmacol Sci. 2005;97(4):489-493.
The Cardiovascular Safety of Nonsteroidal Anti-Inflammatory Drugs: Putting the Evidence in Perspective
Topics Include:
- Key Prospective Clinical Trials
- Danish Registry Study
- Meta-Analyses
- FDA Actions
- PRECISION Trial
Faculty/Faculty Disclosure:
Martin Quan, MD
Professor of Clinical Family Medicine
David Geffen School of Medicine at UCLA
Vice Chair for Academic Affairs
UCLA Department of Family Medicine
Los Angeles, CA
Dr. Quan discloses that he has no real or apparent conflicts to report.
Topics Include:
- Key Prospective Clinical Trials
- Danish Registry Study
- Meta-Analyses
- FDA Actions
- PRECISION Trial
Faculty/Faculty Disclosure:
Martin Quan, MD
Professor of Clinical Family Medicine
David Geffen School of Medicine at UCLA
Vice Chair for Academic Affairs
UCLA Department of Family Medicine
Los Angeles, CA
Dr. Quan discloses that he has no real or apparent conflicts to report.
Topics Include:
- Key Prospective Clinical Trials
- Danish Registry Study
- Meta-Analyses
- FDA Actions
- PRECISION Trial
Faculty/Faculty Disclosure:
Martin Quan, MD
Professor of Clinical Family Medicine
David Geffen School of Medicine at UCLA
Vice Chair for Academic Affairs
UCLA Department of Family Medicine
Los Angeles, CA
Dr. Quan discloses that he has no real or apparent conflicts to report.
Prognosticating with the hospitalized-patient one-year mortality risk score using information abstracted from the medical record
A patient’s prognosis can strongly influence their medical care. Decisions about diagnostic modalities, treatment options, and the use of preventive therapies can all be affected by the likelihood of a patient’s death in the near future. For example, patients with severely limited survival might forego prophylactic therapy, avoid interventions for asymptomatic issues, and cease screening interventions. Knowing survival probability would also be very helpful as a controlling variable in research analyses whenever death risk might be a possible confounder.
Sixteen indices that aim to predict patient death risk have been described by Yourman et al.1 They were all created from secondary analyses of clinical and administrative datasets, were applicable to patients in a variety of settings (including the community, nursing home, or hospital), and predicted survival probabilities in time horizons ranging from 6 months to 5 years. Prognostic factors that were most commonly included in these indices were comorbidity and functional status. In validation populations, the discrimination of these indices for 1-year survival in hospitalized patients was moderate (with C statistics that ranged from 0.64 to 0.79) with good calibration for broad prognostic ranges.
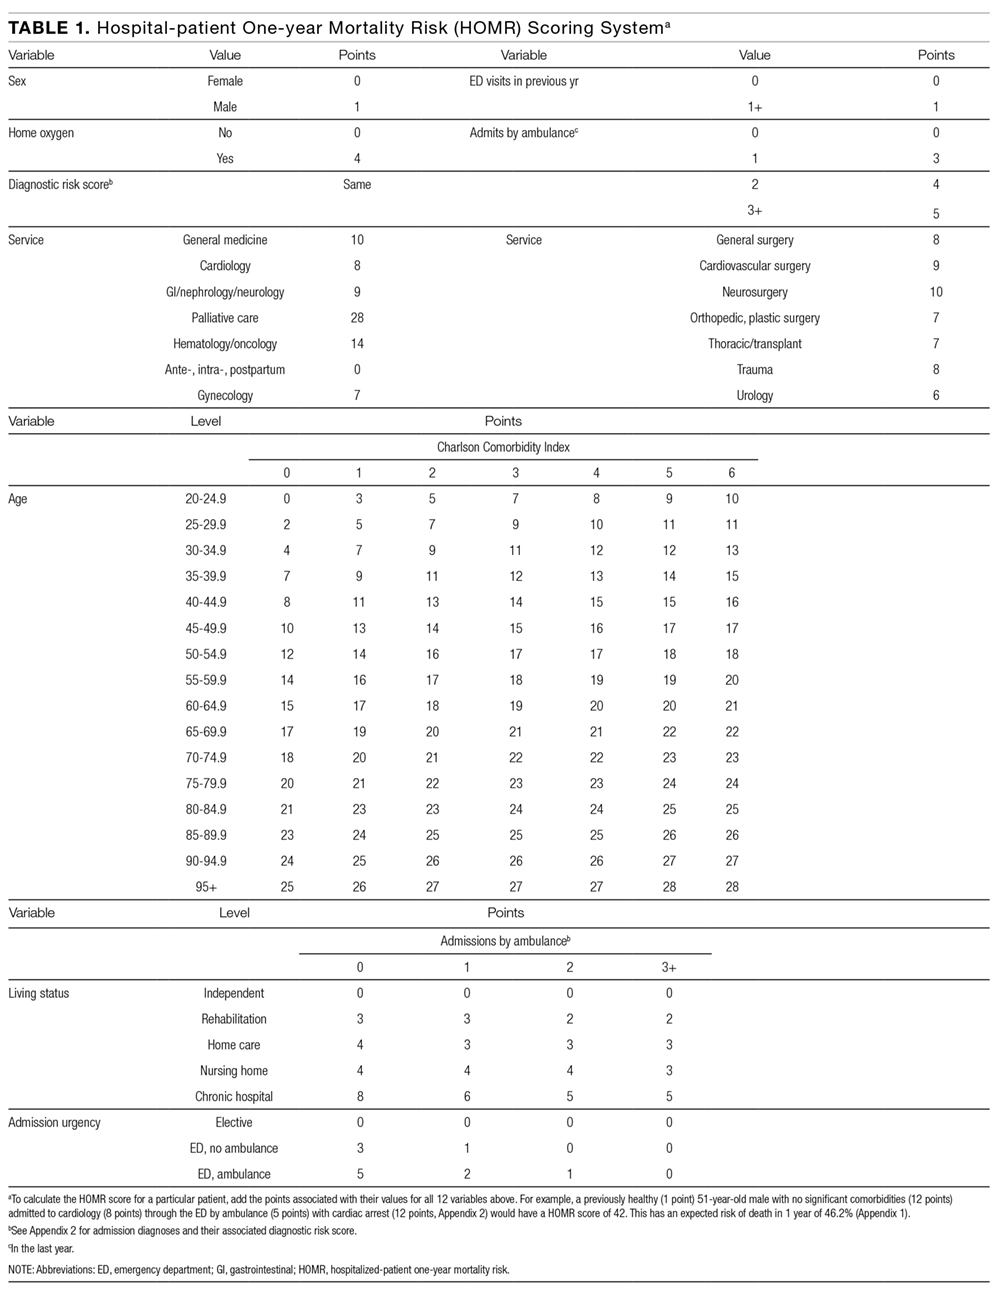
In 2014, we published the Hospitalized-patient One-year Mortality Risk (HOMR) score.2 This study used health administrative data for all adult Ontarians admitted in 2011 to hospital under nonpsychiatric services (n = 640,022) to estimate the probability of dying within 1 year of admission to hospital (which happened in 11.7% of people). The HOMR score included 12 patient and hospitalization factors (Table 1). It was highly discriminative (C statistic, 0.923; [0.922-0.924]) and well calibrated (the mean relative difference between observed and expected death risk was 2.0% [range, 0.0% to 7.0%]). It was externally validated in more than 3 million adults from Ontario, Alberta, and Boston in whom the C statistic ranged from 0.89 to 0.92 and calibration was excellent.3 We concluded from these studies that the HOMR score is excellent for prognosticating a diverse group of patients using health administrative data.
However, we do not know whether the HOMR score can be applied to patients using primary data (ie, those taken directly from the chart). This question is important for 2 reasons. First, if HOMR accurately predicts death risk using data abstracted from the medical record, it could be used in the clinical setting to assist in clinical decision-making. Second, HOMR uses multiple administrative datasets that are difficult to access and use by most clinical researchers; it is, therefore, important to determine if HOMR is accurate for clinical research based on primary medical record review. The primary objective of this study was to determine the accuracy of the HOMR score when calculated using data abstracted from clinical notes that were available when patients were admitted to hospital. Secondary objectives included determining whether functional measures abstracted were significantly associated with death risk beyond the HOMR score and whether HOMR scores calculated from chart review deviated from those calculated from administrative data.
METHODS
Study Cohort
The study, which was approved by our local research ethics board, took place at the Ottawa Hospital, a 1000-bed teaching hospital that is the primary referral center in our region. We used the hospital admission registry to identify all people 18 years or older who were admitted to a nonpsychiatric service at our hospital between January 1, 2011 and December 31, 2011 (this time frame corresponds with the year used to derive the HOMR score). We excluded overnight patients in the same-day surgery or the bone-marrow transplant units (since they would not have been included in the original study) and those without a valid health card number (which was required to link to provincial data to identify outcomes). From this list, we randomly selected 5000 patients.
Primary Data Collection
For each patient, we retrieved all data required to calculate the HOMR score from the medical record (Table 1). Patient registration information in our electronic medical record was used to identify patient age, sex, admitting service, number of emergency department (ED) visits in the previous year, number of admissions in the previous year (the nursing triage note was reviewed for each admission to determine if it was by ambulance), and whether or not the patient had been discharged from hospital in the previous 30 days. The admitting service consult note was used to determine the admitting diagnosis and whether or not the patient was admitted directly to the intensive care unit. If they were present, the emergency nursing triage note, the ED record of treatment, the admission consult note, the pre-operative consult note, and consult notes were all used to determine the patient’s comorbidities, living status, and home oxygen status. Admission urgency was determined using information from the patient registration information and the ED nursing triage note. All data were abstracted from information that had been registered prior to when the patient was physically transferred to their hospital bed. This ensured that we used only data available at the start of the admission.
Patient functional status has been shown to be strongly associated with survival4 but HOMR only indirectly captures functional information (through the patient’s living status). We, therefore, collected more detailed functional information from the medical record by determining if the patient was dependent for any activities of daily living (ADL) from the emergency nursing triage note, the ED record of treatment, the admission consult note, and the pre-operative consultation. We also collected information that might indicate frailty, which we defined per Clegg et al.5 as “a state of increased vulnerability to poor resolution of homeostasis following a stress.” This information included: delirium or more than 1 fall recorded on the emergency nursing triage note, the ED record of treatment, or the admission consultation note; or whether a geriatric nursing specialist assessment occurred in the ED in the previous 6 months. Finally, we recorded possible indicators of limited social support (no fixed address [from patient registration and nursing triage note], primary contact is not a family member [from the emergency notes, consult, and patient registration], and no religion noted in system [from patient registration]). Patients for whom religion status was missing were classified as having “no religion.”
Analysis
These data were encrypted and linked anonymously to population-based databases to determine whether patients died within 1 year of admission to hospital. We calculated the chart-HOMR score using information from the chart review and determined its association with the outcome using bivariate logistic regression. We compared observed and expected risk of death within 1 year of admission to hospital for each chart-HOMR score value, with expected risks determined from the external validation study.3 We regressed observed death risks on expected death risks for chart-HOMR scores (clustered into 22 groups to ensure adequate numbers in each group); and we gauged overall deviations from expected risk and the relationship between the observed and expected death risk (based on the chart-HOMR score) using the line’s intercept and slope, respectively.6 Next, we replicated methods from our studies2,3 to calculate the administrative-HOMR score in our study cohort using administrative databases. We compared these chart-HOMR and administrative-HOMR scores (and scores for each of its components). Finally, we determined which of the socio-functional factors were associated with 1-year death risk independent of the chart-HOMR score. We used the likelihood ratio test to determine whether these additional socio-functional factors significantly improved the model beyond the chart-HOMR score.7 This test subtracted the -2 logL value of the full model from that containing the chart-HOMR score alone, comparing its value to the χ2 distribution (with degrees of freedom equivalent to the number of additional parameters in the nested model) to determine statistical significance. All analyses were completed using SAS v9.4 (SAS Institute Inc., Cary, North Carolina).
RESULTS
There were 43,883 overnight hospitalizations at our hospital in 2011, and 38,886 hospitalizations were excluded: 1883 hospitalizations were in the same-day surgery or the bone-marrow transplant unit; 2485 did not have a valid health card number; 34,515 were not randomly selected; the records of 3 randomly selected patients had been blocked by our hospital’s privacy department; and 1 patient could not be linked with the population-based administrative datasets.
The 4996 study patients were middle-aged and predominantly female (Table 2). The extensive majority of patients was admitted from the community, was independent for ADL, had a family member as the principal contact, and had no admissions by ambulance in the previous year. Most people had no significant comorbidities or ED visits in the year prior to their admission. The mean chart-HOMR score was 22 (standard deviation [SD], 12), which is associated with a 1.2% expected risk of death within 1 year of hospital admission (Appendix 1).3
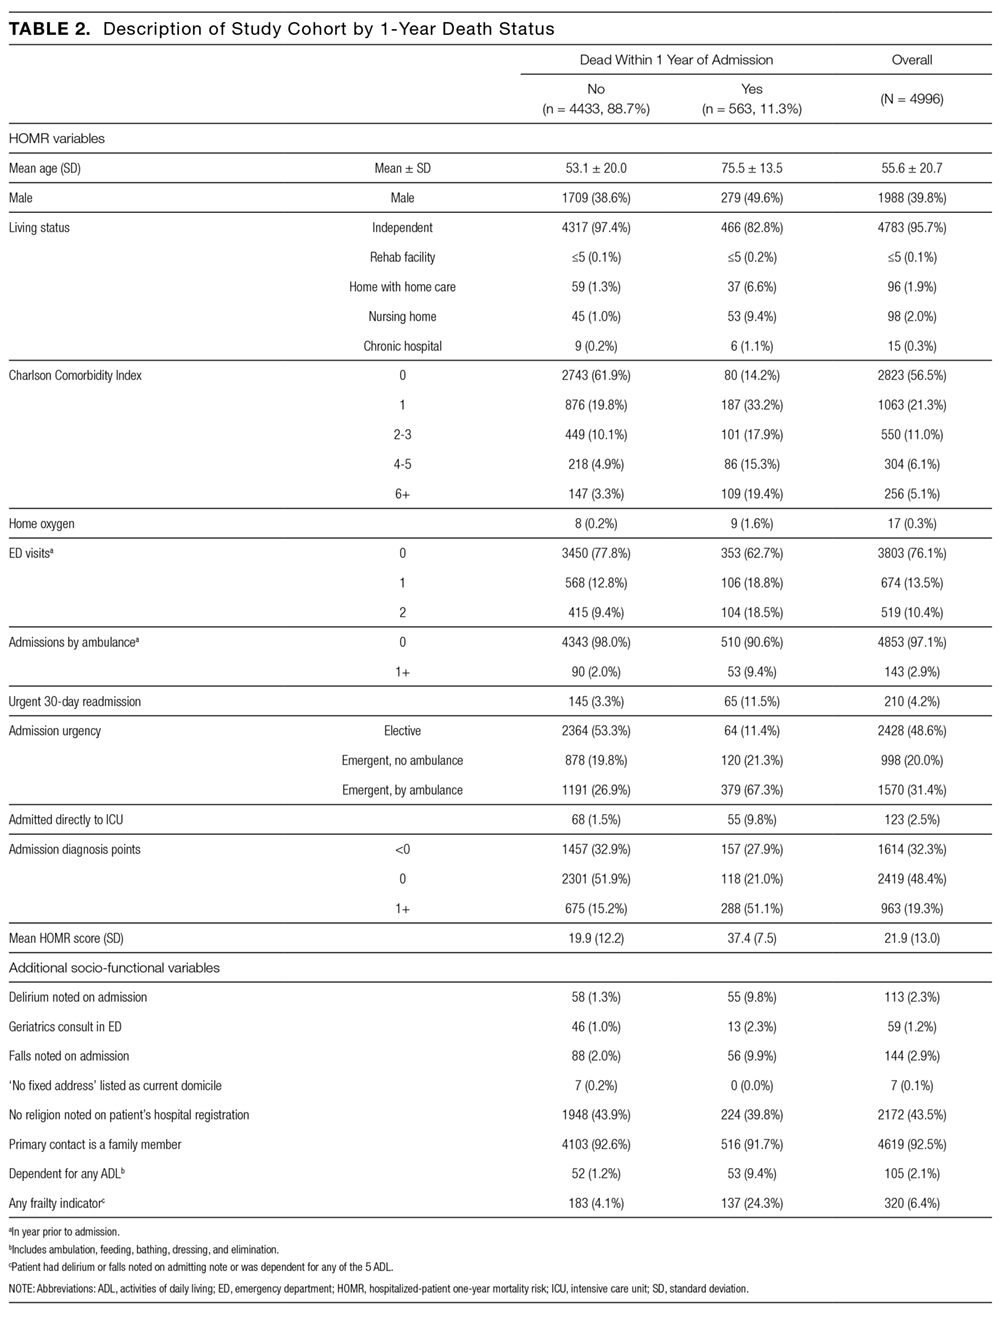
A total of 563 patients (11.3%) died within 1 year of admission to hospital (Table 2). In the study cohort, each chart-HOMR component was associated with death status. People who died were older, more likely to be male, had a greater number of important comorbidities, had more ED visits and admissions by ambulance in the previous year, and were more likely to have been discharged in the previous 30 days, and were admitted urgently, directly to the intensive care unit, or with complicated diagnoses. The mean chart-HOMR score differed extensively by survival status (37.4 [SD, 7.5] in those who died vs. 19.9 [SD, 12.2] in those who survived). Three of the socio-functional variables (delirium and falls noted on admission documents, and dependent for any ADL) also varied with death status.
The chart-HOMR score was strongly associated with the likelihood of death within 1 year of admission. When included in a logistic regression model having 1-year death as the outcome, a 1-point increase in the chart-HOMR score was associated with a 19% increase in the odds of death (P < 0.0001). This model (with only the chart-HOMR score) was highly discriminative (C statistic, 0.888) and well calibrated (Hosmer-Lemeshow test, 12.9 [8 df, P = 0.11]).
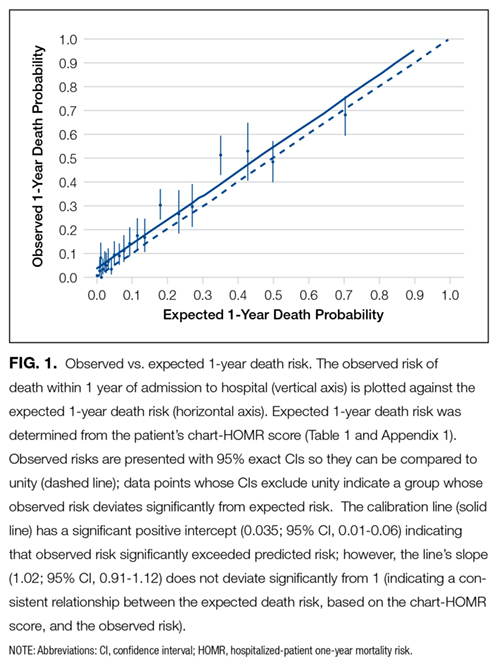
Observed and expected death risks by chart-HOMR score were similar (Figure 1). The observed total number of deaths (n = 563; 11.3%) exceeded the expected number of deaths (n = 437, 8.7%). When we regressed observed death risks on expected death risks for chart-HOMR scores (clustered into 22 groups), the Hosmer-Lemeshow test was significant, indicating that differences between observed and expected risks were beyond that expected by chance (Hosmer-Lemeshow test, 141.9, 21 df, P < 0.0001). The intercept of this model (0.035; 95% CI, 0.01-0.06) was statistically significant (P = 0.01), indicating that the observed number of cases significantly exceeded the expected; however, its calibration slope (1.02; 95% CI, 0.89-1.16) did not deviate significantly from unity, indicating that the relationship between the observed and expected death risk (based on the chart-HOMR score) remained intact (Figure 1).
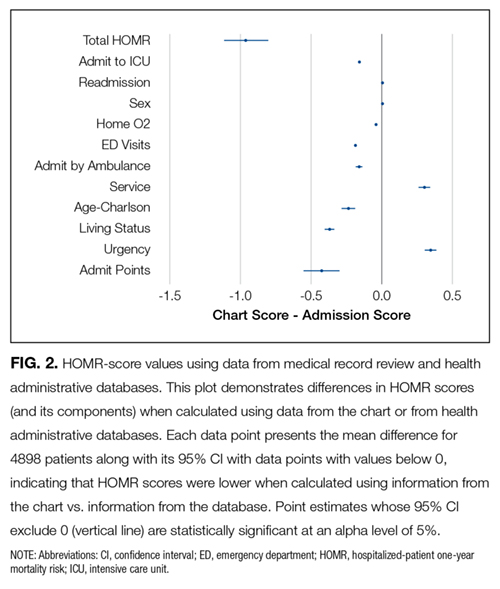
The deviations between observed and expected death risks reflected deviations between the c chart-HOMR score and the administrative-HOMR score, with the former being significantly lower than the latter (Figure 2). Overall, the chart-HOMR score was 0.96 points lower (95% CI, 0.81-1.12) than the administrative-HOMR score. The HOMR score components that were notably underestimated using chart data included those for the age-Charlson Comorbidity Index interaction, living status, and admit points. Points for only 2 components (admitting service and admission urgency) were higher when calculated using chart data.
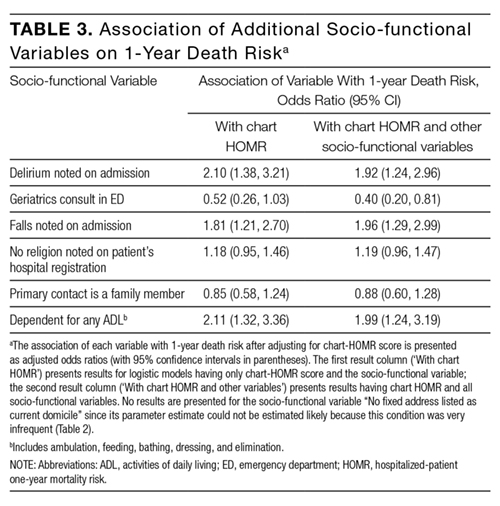
Four additional socio-functional variables collected from medical record review were significantly associated with 1-year death risk independent of the chart-HOMR score (Table 3). Admission documentation noting either delirium or falls were both associated with a significantly increased death risk (adjusted odds ratio [OR], 1.92 [95% CI, 1.24-2.96] and OR 1.96 [95% CI, 1.29-2.99], respectively). An independently increased death risk was also noted in patients who were dependent for any ADL (adjusted OR, 1.99 [95% CI, 1.24-3.19]). The presence of an ED geriatrics consultation within the previous 6 months was associated with a significantly decreased death risk of 60% (adjusted OR, 0.40 [95% CI, 0.20-0.81]). Adding these covariates to the logistic model with the chart-HOMR score significantly improved predictions (likelihood ratio statistic = 33.569, 4df, P < 0.00001).
DISCUSSION
In a large random sample of patients from our hospital, we found that the HOMR score using data abstracted from the medical record was significantly associated with 1-year death risk. The expected death risk based on the chart-HOMR score underestimated observed death risk but the relationship between the chart-HOMR score and death risk was similar to that in studies using administrative data. The HOMR score calculated using data from the chart was lower than that calculated using data from population-based administrative datasets; additional variables indicating patient frailty were significantly associated with 1-year death risk independent of the chart-HOMR score. Since the HOMR score was derived and initially validated using health administrative data, this study using data abstracted from the health record shows that the HOMR score has methodological generalizability.8
We think that our study has several notable findings. First, we found that data abstracted from the medical record can be used to calculate the HOMR score to accurately predict individual death risk. The chart-HOMR score discriminated very well between patients who did and did not die (C statistic, 0.88), which extensively exceeds the discrimination of published death risk indices (whose C statistics range between 0.69 and 0.82). It is also possible that chart abstraction for the HOMR score—without functional status—is simpler than other indices since its components are primarily very objective. (Other indices for hospital-based patients required factors that could be difficult to abstract reliably from the medical record including meeting more than 1 guideline for noncancer hospice care9; ambulation difficulties10; scales such as the Exton-Smith Scale or the Short Portable Mental Status Questionnaire11; weight loss12; functional status4; and pressure sore risk.13) Although expected risks for the chart-HOMR consistently underestimated observed risks (Figure 1), the mean deviation was small (with an absolute difference of 3.5% that can be used as a correction factor when determining expected risks with HOMR scores calculated from chart review), but it was an association between the chart-HOMR score and death risk that remained consistent through the cohort. Second, we found a small but significant decrease in the chart-HOMR score vs. the administrative-HOMR score (Figure 2). Some of these underestimates such as those for the number of ED visits or admissions by ambulance were expected since population-based health administrative databases would best capture such data. However, we were surprised that the comorbidity score was less when calculated using chart vs. database data (Figure 2). This finding is distinct from studies finding that particular comorbidities are documented in the chart are sometimes not coded.14,15 However, we identified comorbidities in the administrative databases using a 1-year ‘look-back’ period so that diagnostic codes from multiple hospitalizations (and from multiple hospitals) could be used to calculate the Charlson Comorbidity Index for a particular patient; this has been shown to increase the capture of comorbidities.16 Third, we found that variables from the chart review indicating frailty were predictive of 1-year death risk independent of the chart-HOMR score (Table 2). This illustrates that mortality risk prediction can be improved for particular patient groups by adding new covariates to the HOMR. Further work is required to determine how to incorporate these (and possibly other) covariates into the HOMR to create a unique chart-HOMR score. Finally, we found that a geriatrics assessment in the ED was associated with a significant (and notable) decrease in death risk. With these data, we are unable to indicate whether this association is causative. However, these findings indicate that the influence of emergency geriatric assessments on patient survival needs to be explored in more detail.
Several issues about our study should be considered when interpreting its results. First, this was a single-center study and the generalizability of our results to other centers is unknown. However, our study had the largest sample size of all primary data prognostic index validation studies1 ensuring that our results are, at the very least, internally reliable. In addition, our simple random sample ensured that we studied a broad assortment of patients to be certain that our results are representative of our institution. Second, we used a single abstractor for the study, which could limit the generalizability of our results. However, almost all the data points that were abstracted for our study were very objective.
In summary, our study shows that the HOMR score can be used to accurately predict 1-year death risk using data abstracted from the patient record. These findings will aid in individual patient prognostication for clinicians and researchers.
Disclosure
The authors report no financial conflicts of interest.
1. Yourman LC, Lee SJ, Schonberg MA, Widera EW, Smith AK. Prognostic indices for older adults: a systematic review. JAMA. 2012;307(2):182-192. PubMed
2. van Walraven C. The Hospital-patient One-year Mortality Risk score accurately predicts long term death risk in hospitalized patients. J Clin Epidemiol. 2014;67(9):1025-1034. PubMed
3. van Walraven C, McAlister FA, Bakal JA, Hawken S, Donzé J. External validation of the Hospital-patient One-year Mortality Risk (HOMR) model for predicting death within 1 year after hospital admission. CMAJ. 2015;187(10):725-733. PubMed
4. Walter LC, Brand RJ, Counsell SR, et al. Development and validation of a prognostic index for 1-year mortality in older adults after hospitalization. JAMA. 2001;285(23):2987-2994. PubMed
5. Clegg A, Young J, Iliffe S et al. Frailty in elderly people. The Lancet 2002;381:752-762. PubMed
6. Crowson CS, Atkinson EJ, Therneau TM. Assessing calibration of prognostic risk scores. Stat Methods Med Res. 2016;25(4):1692-1706. PubMed
7. Harrell FE Jr. Overview of Maximum Likelihood Estimation. Regression Modeling Strategies. New York, NY: Springer-Verlag; 2001: 179-212.
8. Justice AC, Covinsky KE, Berlin JA. Assessing the generalizability of prognostic information. Ann Intern Med. 1999;130(6):515-524. PubMed
9. Fischer SM, Gozansky WS, Sauaia A, Min SJ, Kutner JS, Kramer A. A practical tool to identify patients who may benefit from a palliative approach: the CARING criteria. J Pain Symptom Manage. 2006;31(4):285-292. PubMed
10. Inouye SK, Bogardus ST, Jr, Vitagliano G, et al. Burden of illness score for elderly persons: risk adjustment incorporating the cumulative impact of diseases, physiologic abnormalities, and functional impairments. Med Care. 2003;41(1):70-83. PubMed
11. Pilotto A, Ferrucci L, Franceschi M, et al. Development and validation of a multidimensional prognostic index for one-year mortality from comprehensive geriatric assessment in hospitalized older patients. Rejuvenation Res. 2008;11(1):151-161. PubMed
12. Teno JM, Harrell FE Jr, Knaus W, et al. Prediction of survival for older hospitalized patients: the HELP survival model. Hospitalized Elderly Longitudinal Project. J Am Geriatr Soc. 2000;48(5 suppl):S16-S24. PubMed
13. Dramé M, Novella JL, Lang PO, et al. Derivation and validation of a mortality-risk index from a cohort of frail elderly patients hospitalised in medical wards via emergencies: the SAFES study. Eur J Epidemiol. 2008;23(12):783-791. PubMed
14. Kieszak SM, Flanders WD, Kosinski AS, Shipp CC, Karp H. A comparison of the Charlson comorbidity index derived from medical record data and administrative billing data. J Clin Epidemiol. 1999;52(2):137-142. PubMed
15. Quan H, Parsons GA, Ghali WA. Validity of procedure codes in International Classification of Diseases, 9th revision, clinical modification administrative data. Med Care. 2004;42(8):801-809. PubMed
16. Zhang JX, Iwashyna TJ, Christakis NA. The performance of different lookback periods and sources of information for Charlson cComorbidity adjustment in Medicare claims. Med Care. 1999;37(11):1128-1139. PubMed
A patient’s prognosis can strongly influence their medical care. Decisions about diagnostic modalities, treatment options, and the use of preventive therapies can all be affected by the likelihood of a patient’s death in the near future. For example, patients with severely limited survival might forego prophylactic therapy, avoid interventions for asymptomatic issues, and cease screening interventions. Knowing survival probability would also be very helpful as a controlling variable in research analyses whenever death risk might be a possible confounder.
Sixteen indices that aim to predict patient death risk have been described by Yourman et al.1 They were all created from secondary analyses of clinical and administrative datasets, were applicable to patients in a variety of settings (including the community, nursing home, or hospital), and predicted survival probabilities in time horizons ranging from 6 months to 5 years. Prognostic factors that were most commonly included in these indices were comorbidity and functional status. In validation populations, the discrimination of these indices for 1-year survival in hospitalized patients was moderate (with C statistics that ranged from 0.64 to 0.79) with good calibration for broad prognostic ranges.
In 2014, we published the Hospitalized-patient One-year Mortality Risk (HOMR) score.2 This study used health administrative data for all adult Ontarians admitted in 2011 to hospital under nonpsychiatric services (n = 640,022) to estimate the probability of dying within 1 year of admission to hospital (which happened in 11.7% of people). The HOMR score included 12 patient and hospitalization factors (Table 1). It was highly discriminative (C statistic, 0.923; [0.922-0.924]) and well calibrated (the mean relative difference between observed and expected death risk was 2.0% [range, 0.0% to 7.0%]). It was externally validated in more than 3 million adults from Ontario, Alberta, and Boston in whom the C statistic ranged from 0.89 to 0.92 and calibration was excellent.3 We concluded from these studies that the HOMR score is excellent for prognosticating a diverse group of patients using health administrative data.
However, we do not know whether the HOMR score can be applied to patients using primary data (ie, those taken directly from the chart). This question is important for 2 reasons. First, if HOMR accurately predicts death risk using data abstracted from the medical record, it could be used in the clinical setting to assist in clinical decision-making. Second, HOMR uses multiple administrative datasets that are difficult to access and use by most clinical researchers; it is, therefore, important to determine if HOMR is accurate for clinical research based on primary medical record review. The primary objective of this study was to determine the accuracy of the HOMR score when calculated using data abstracted from clinical notes that were available when patients were admitted to hospital. Secondary objectives included determining whether functional measures abstracted were significantly associated with death risk beyond the HOMR score and whether HOMR scores calculated from chart review deviated from those calculated from administrative data.
METHODS
Study Cohort
The study, which was approved by our local research ethics board, took place at the Ottawa Hospital, a 1000-bed teaching hospital that is the primary referral center in our region. We used the hospital admission registry to identify all people 18 years or older who were admitted to a nonpsychiatric service at our hospital between January 1, 2011 and December 31, 2011 (this time frame corresponds with the year used to derive the HOMR score). We excluded overnight patients in the same-day surgery or the bone-marrow transplant units (since they would not have been included in the original study) and those without a valid health card number (which was required to link to provincial data to identify outcomes). From this list, we randomly selected 5000 patients.
Primary Data Collection
For each patient, we retrieved all data required to calculate the HOMR score from the medical record (Table 1). Patient registration information in our electronic medical record was used to identify patient age, sex, admitting service, number of emergency department (ED) visits in the previous year, number of admissions in the previous year (the nursing triage note was reviewed for each admission to determine if it was by ambulance), and whether or not the patient had been discharged from hospital in the previous 30 days. The admitting service consult note was used to determine the admitting diagnosis and whether or not the patient was admitted directly to the intensive care unit. If they were present, the emergency nursing triage note, the ED record of treatment, the admission consult note, the pre-operative consult note, and consult notes were all used to determine the patient’s comorbidities, living status, and home oxygen status. Admission urgency was determined using information from the patient registration information and the ED nursing triage note. All data were abstracted from information that had been registered prior to when the patient was physically transferred to their hospital bed. This ensured that we used only data available at the start of the admission.
Patient functional status has been shown to be strongly associated with survival4 but HOMR only indirectly captures functional information (through the patient’s living status). We, therefore, collected more detailed functional information from the medical record by determining if the patient was dependent for any activities of daily living (ADL) from the emergency nursing triage note, the ED record of treatment, the admission consult note, and the pre-operative consultation. We also collected information that might indicate frailty, which we defined per Clegg et al.5 as “a state of increased vulnerability to poor resolution of homeostasis following a stress.” This information included: delirium or more than 1 fall recorded on the emergency nursing triage note, the ED record of treatment, or the admission consultation note; or whether a geriatric nursing specialist assessment occurred in the ED in the previous 6 months. Finally, we recorded possible indicators of limited social support (no fixed address [from patient registration and nursing triage note], primary contact is not a family member [from the emergency notes, consult, and patient registration], and no religion noted in system [from patient registration]). Patients for whom religion status was missing were classified as having “no religion.”
Analysis
These data were encrypted and linked anonymously to population-based databases to determine whether patients died within 1 year of admission to hospital. We calculated the chart-HOMR score using information from the chart review and determined its association with the outcome using bivariate logistic regression. We compared observed and expected risk of death within 1 year of admission to hospital for each chart-HOMR score value, with expected risks determined from the external validation study.3 We regressed observed death risks on expected death risks for chart-HOMR scores (clustered into 22 groups to ensure adequate numbers in each group); and we gauged overall deviations from expected risk and the relationship between the observed and expected death risk (based on the chart-HOMR score) using the line’s intercept and slope, respectively.6 Next, we replicated methods from our studies2,3 to calculate the administrative-HOMR score in our study cohort using administrative databases. We compared these chart-HOMR and administrative-HOMR scores (and scores for each of its components). Finally, we determined which of the socio-functional factors were associated with 1-year death risk independent of the chart-HOMR score. We used the likelihood ratio test to determine whether these additional socio-functional factors significantly improved the model beyond the chart-HOMR score.7 This test subtracted the -2 logL value of the full model from that containing the chart-HOMR score alone, comparing its value to the χ2 distribution (with degrees of freedom equivalent to the number of additional parameters in the nested model) to determine statistical significance. All analyses were completed using SAS v9.4 (SAS Institute Inc., Cary, North Carolina).
RESULTS
There were 43,883 overnight hospitalizations at our hospital in 2011, and 38,886 hospitalizations were excluded: 1883 hospitalizations were in the same-day surgery or the bone-marrow transplant unit; 2485 did not have a valid health card number; 34,515 were not randomly selected; the records of 3 randomly selected patients had been blocked by our hospital’s privacy department; and 1 patient could not be linked with the population-based administrative datasets.
The 4996 study patients were middle-aged and predominantly female (Table 2). The extensive majority of patients was admitted from the community, was independent for ADL, had a family member as the principal contact, and had no admissions by ambulance in the previous year. Most people had no significant comorbidities or ED visits in the year prior to their admission. The mean chart-HOMR score was 22 (standard deviation [SD], 12), which is associated with a 1.2% expected risk of death within 1 year of hospital admission (Appendix 1).3
A total of 563 patients (11.3%) died within 1 year of admission to hospital (Table 2). In the study cohort, each chart-HOMR component was associated with death status. People who died were older, more likely to be male, had a greater number of important comorbidities, had more ED visits and admissions by ambulance in the previous year, and were more likely to have been discharged in the previous 30 days, and were admitted urgently, directly to the intensive care unit, or with complicated diagnoses. The mean chart-HOMR score differed extensively by survival status (37.4 [SD, 7.5] in those who died vs. 19.9 [SD, 12.2] in those who survived). Three of the socio-functional variables (delirium and falls noted on admission documents, and dependent for any ADL) also varied with death status.
The chart-HOMR score was strongly associated with the likelihood of death within 1 year of admission. When included in a logistic regression model having 1-year death as the outcome, a 1-point increase in the chart-HOMR score was associated with a 19% increase in the odds of death (P < 0.0001). This model (with only the chart-HOMR score) was highly discriminative (C statistic, 0.888) and well calibrated (Hosmer-Lemeshow test, 12.9 [8 df, P = 0.11]).
Observed and expected death risks by chart-HOMR score were similar (Figure 1). The observed total number of deaths (n = 563; 11.3%) exceeded the expected number of deaths (n = 437, 8.7%). When we regressed observed death risks on expected death risks for chart-HOMR scores (clustered into 22 groups), the Hosmer-Lemeshow test was significant, indicating that differences between observed and expected risks were beyond that expected by chance (Hosmer-Lemeshow test, 141.9, 21 df, P < 0.0001). The intercept of this model (0.035; 95% CI, 0.01-0.06) was statistically significant (P = 0.01), indicating that the observed number of cases significantly exceeded the expected; however, its calibration slope (1.02; 95% CI, 0.89-1.16) did not deviate significantly from unity, indicating that the relationship between the observed and expected death risk (based on the chart-HOMR score) remained intact (Figure 1).
The deviations between observed and expected death risks reflected deviations between the c chart-HOMR score and the administrative-HOMR score, with the former being significantly lower than the latter (Figure 2). Overall, the chart-HOMR score was 0.96 points lower (95% CI, 0.81-1.12) than the administrative-HOMR score. The HOMR score components that were notably underestimated using chart data included those for the age-Charlson Comorbidity Index interaction, living status, and admit points. Points for only 2 components (admitting service and admission urgency) were higher when calculated using chart data.
Four additional socio-functional variables collected from medical record review were significantly associated with 1-year death risk independent of the chart-HOMR score (Table 3). Admission documentation noting either delirium or falls were both associated with a significantly increased death risk (adjusted odds ratio [OR], 1.92 [95% CI, 1.24-2.96] and OR 1.96 [95% CI, 1.29-2.99], respectively). An independently increased death risk was also noted in patients who were dependent for any ADL (adjusted OR, 1.99 [95% CI, 1.24-3.19]). The presence of an ED geriatrics consultation within the previous 6 months was associated with a significantly decreased death risk of 60% (adjusted OR, 0.40 [95% CI, 0.20-0.81]). Adding these covariates to the logistic model with the chart-HOMR score significantly improved predictions (likelihood ratio statistic = 33.569, 4df, P < 0.00001).
DISCUSSION
In a large random sample of patients from our hospital, we found that the HOMR score using data abstracted from the medical record was significantly associated with 1-year death risk. The expected death risk based on the chart-HOMR score underestimated observed death risk but the relationship between the chart-HOMR score and death risk was similar to that in studies using administrative data. The HOMR score calculated using data from the chart was lower than that calculated using data from population-based administrative datasets; additional variables indicating patient frailty were significantly associated with 1-year death risk independent of the chart-HOMR score. Since the HOMR score was derived and initially validated using health administrative data, this study using data abstracted from the health record shows that the HOMR score has methodological generalizability.8
We think that our study has several notable findings. First, we found that data abstracted from the medical record can be used to calculate the HOMR score to accurately predict individual death risk. The chart-HOMR score discriminated very well between patients who did and did not die (C statistic, 0.88), which extensively exceeds the discrimination of published death risk indices (whose C statistics range between 0.69 and 0.82). It is also possible that chart abstraction for the HOMR score—without functional status—is simpler than other indices since its components are primarily very objective. (Other indices for hospital-based patients required factors that could be difficult to abstract reliably from the medical record including meeting more than 1 guideline for noncancer hospice care9; ambulation difficulties10; scales such as the Exton-Smith Scale or the Short Portable Mental Status Questionnaire11; weight loss12; functional status4; and pressure sore risk.13) Although expected risks for the chart-HOMR consistently underestimated observed risks (Figure 1), the mean deviation was small (with an absolute difference of 3.5% that can be used as a correction factor when determining expected risks with HOMR scores calculated from chart review), but it was an association between the chart-HOMR score and death risk that remained consistent through the cohort. Second, we found a small but significant decrease in the chart-HOMR score vs. the administrative-HOMR score (Figure 2). Some of these underestimates such as those for the number of ED visits or admissions by ambulance were expected since population-based health administrative databases would best capture such data. However, we were surprised that the comorbidity score was less when calculated using chart vs. database data (Figure 2). This finding is distinct from studies finding that particular comorbidities are documented in the chart are sometimes not coded.14,15 However, we identified comorbidities in the administrative databases using a 1-year ‘look-back’ period so that diagnostic codes from multiple hospitalizations (and from multiple hospitals) could be used to calculate the Charlson Comorbidity Index for a particular patient; this has been shown to increase the capture of comorbidities.16 Third, we found that variables from the chart review indicating frailty were predictive of 1-year death risk independent of the chart-HOMR score (Table 2). This illustrates that mortality risk prediction can be improved for particular patient groups by adding new covariates to the HOMR. Further work is required to determine how to incorporate these (and possibly other) covariates into the HOMR to create a unique chart-HOMR score. Finally, we found that a geriatrics assessment in the ED was associated with a significant (and notable) decrease in death risk. With these data, we are unable to indicate whether this association is causative. However, these findings indicate that the influence of emergency geriatric assessments on patient survival needs to be explored in more detail.
Several issues about our study should be considered when interpreting its results. First, this was a single-center study and the generalizability of our results to other centers is unknown. However, our study had the largest sample size of all primary data prognostic index validation studies1 ensuring that our results are, at the very least, internally reliable. In addition, our simple random sample ensured that we studied a broad assortment of patients to be certain that our results are representative of our institution. Second, we used a single abstractor for the study, which could limit the generalizability of our results. However, almost all the data points that were abstracted for our study were very objective.
In summary, our study shows that the HOMR score can be used to accurately predict 1-year death risk using data abstracted from the patient record. These findings will aid in individual patient prognostication for clinicians and researchers.
Disclosure
The authors report no financial conflicts of interest.
A patient’s prognosis can strongly influence their medical care. Decisions about diagnostic modalities, treatment options, and the use of preventive therapies can all be affected by the likelihood of a patient’s death in the near future. For example, patients with severely limited survival might forego prophylactic therapy, avoid interventions for asymptomatic issues, and cease screening interventions. Knowing survival probability would also be very helpful as a controlling variable in research analyses whenever death risk might be a possible confounder.
Sixteen indices that aim to predict patient death risk have been described by Yourman et al.1 They were all created from secondary analyses of clinical and administrative datasets, were applicable to patients in a variety of settings (including the community, nursing home, or hospital), and predicted survival probabilities in time horizons ranging from 6 months to 5 years. Prognostic factors that were most commonly included in these indices were comorbidity and functional status. In validation populations, the discrimination of these indices for 1-year survival in hospitalized patients was moderate (with C statistics that ranged from 0.64 to 0.79) with good calibration for broad prognostic ranges.
In 2014, we published the Hospitalized-patient One-year Mortality Risk (HOMR) score.2 This study used health administrative data for all adult Ontarians admitted in 2011 to hospital under nonpsychiatric services (n = 640,022) to estimate the probability of dying within 1 year of admission to hospital (which happened in 11.7% of people). The HOMR score included 12 patient and hospitalization factors (Table 1). It was highly discriminative (C statistic, 0.923; [0.922-0.924]) and well calibrated (the mean relative difference between observed and expected death risk was 2.0% [range, 0.0% to 7.0%]). It was externally validated in more than 3 million adults from Ontario, Alberta, and Boston in whom the C statistic ranged from 0.89 to 0.92 and calibration was excellent.3 We concluded from these studies that the HOMR score is excellent for prognosticating a diverse group of patients using health administrative data.
However, we do not know whether the HOMR score can be applied to patients using primary data (ie, those taken directly from the chart). This question is important for 2 reasons. First, if HOMR accurately predicts death risk using data abstracted from the medical record, it could be used in the clinical setting to assist in clinical decision-making. Second, HOMR uses multiple administrative datasets that are difficult to access and use by most clinical researchers; it is, therefore, important to determine if HOMR is accurate for clinical research based on primary medical record review. The primary objective of this study was to determine the accuracy of the HOMR score when calculated using data abstracted from clinical notes that were available when patients were admitted to hospital. Secondary objectives included determining whether functional measures abstracted were significantly associated with death risk beyond the HOMR score and whether HOMR scores calculated from chart review deviated from those calculated from administrative data.
METHODS
Study Cohort
The study, which was approved by our local research ethics board, took place at the Ottawa Hospital, a 1000-bed teaching hospital that is the primary referral center in our region. We used the hospital admission registry to identify all people 18 years or older who were admitted to a nonpsychiatric service at our hospital between January 1, 2011 and December 31, 2011 (this time frame corresponds with the year used to derive the HOMR score). We excluded overnight patients in the same-day surgery or the bone-marrow transplant units (since they would not have been included in the original study) and those without a valid health card number (which was required to link to provincial data to identify outcomes). From this list, we randomly selected 5000 patients.
Primary Data Collection
For each patient, we retrieved all data required to calculate the HOMR score from the medical record (Table 1). Patient registration information in our electronic medical record was used to identify patient age, sex, admitting service, number of emergency department (ED) visits in the previous year, number of admissions in the previous year (the nursing triage note was reviewed for each admission to determine if it was by ambulance), and whether or not the patient had been discharged from hospital in the previous 30 days. The admitting service consult note was used to determine the admitting diagnosis and whether or not the patient was admitted directly to the intensive care unit. If they were present, the emergency nursing triage note, the ED record of treatment, the admission consult note, the pre-operative consult note, and consult notes were all used to determine the patient’s comorbidities, living status, and home oxygen status. Admission urgency was determined using information from the patient registration information and the ED nursing triage note. All data were abstracted from information that had been registered prior to when the patient was physically transferred to their hospital bed. This ensured that we used only data available at the start of the admission.
Patient functional status has been shown to be strongly associated with survival4 but HOMR only indirectly captures functional information (through the patient’s living status). We, therefore, collected more detailed functional information from the medical record by determining if the patient was dependent for any activities of daily living (ADL) from the emergency nursing triage note, the ED record of treatment, the admission consult note, and the pre-operative consultation. We also collected information that might indicate frailty, which we defined per Clegg et al.5 as “a state of increased vulnerability to poor resolution of homeostasis following a stress.” This information included: delirium or more than 1 fall recorded on the emergency nursing triage note, the ED record of treatment, or the admission consultation note; or whether a geriatric nursing specialist assessment occurred in the ED in the previous 6 months. Finally, we recorded possible indicators of limited social support (no fixed address [from patient registration and nursing triage note], primary contact is not a family member [from the emergency notes, consult, and patient registration], and no religion noted in system [from patient registration]). Patients for whom religion status was missing were classified as having “no religion.”
Analysis
These data were encrypted and linked anonymously to population-based databases to determine whether patients died within 1 year of admission to hospital. We calculated the chart-HOMR score using information from the chart review and determined its association with the outcome using bivariate logistic regression. We compared observed and expected risk of death within 1 year of admission to hospital for each chart-HOMR score value, with expected risks determined from the external validation study.3 We regressed observed death risks on expected death risks for chart-HOMR scores (clustered into 22 groups to ensure adequate numbers in each group); and we gauged overall deviations from expected risk and the relationship between the observed and expected death risk (based on the chart-HOMR score) using the line’s intercept and slope, respectively.6 Next, we replicated methods from our studies2,3 to calculate the administrative-HOMR score in our study cohort using administrative databases. We compared these chart-HOMR and administrative-HOMR scores (and scores for each of its components). Finally, we determined which of the socio-functional factors were associated with 1-year death risk independent of the chart-HOMR score. We used the likelihood ratio test to determine whether these additional socio-functional factors significantly improved the model beyond the chart-HOMR score.7 This test subtracted the -2 logL value of the full model from that containing the chart-HOMR score alone, comparing its value to the χ2 distribution (with degrees of freedom equivalent to the number of additional parameters in the nested model) to determine statistical significance. All analyses were completed using SAS v9.4 (SAS Institute Inc., Cary, North Carolina).
RESULTS
There were 43,883 overnight hospitalizations at our hospital in 2011, and 38,886 hospitalizations were excluded: 1883 hospitalizations were in the same-day surgery or the bone-marrow transplant unit; 2485 did not have a valid health card number; 34,515 were not randomly selected; the records of 3 randomly selected patients had been blocked by our hospital’s privacy department; and 1 patient could not be linked with the population-based administrative datasets.
The 4996 study patients were middle-aged and predominantly female (Table 2). The extensive majority of patients was admitted from the community, was independent for ADL, had a family member as the principal contact, and had no admissions by ambulance in the previous year. Most people had no significant comorbidities or ED visits in the year prior to their admission. The mean chart-HOMR score was 22 (standard deviation [SD], 12), which is associated with a 1.2% expected risk of death within 1 year of hospital admission (Appendix 1).3
A total of 563 patients (11.3%) died within 1 year of admission to hospital (Table 2). In the study cohort, each chart-HOMR component was associated with death status. People who died were older, more likely to be male, had a greater number of important comorbidities, had more ED visits and admissions by ambulance in the previous year, and were more likely to have been discharged in the previous 30 days, and were admitted urgently, directly to the intensive care unit, or with complicated diagnoses. The mean chart-HOMR score differed extensively by survival status (37.4 [SD, 7.5] in those who died vs. 19.9 [SD, 12.2] in those who survived). Three of the socio-functional variables (delirium and falls noted on admission documents, and dependent for any ADL) also varied with death status.
The chart-HOMR score was strongly associated with the likelihood of death within 1 year of admission. When included in a logistic regression model having 1-year death as the outcome, a 1-point increase in the chart-HOMR score was associated with a 19% increase in the odds of death (P < 0.0001). This model (with only the chart-HOMR score) was highly discriminative (C statistic, 0.888) and well calibrated (Hosmer-Lemeshow test, 12.9 [8 df, P = 0.11]).
Observed and expected death risks by chart-HOMR score were similar (Figure 1). The observed total number of deaths (n = 563; 11.3%) exceeded the expected number of deaths (n = 437, 8.7%). When we regressed observed death risks on expected death risks for chart-HOMR scores (clustered into 22 groups), the Hosmer-Lemeshow test was significant, indicating that differences between observed and expected risks were beyond that expected by chance (Hosmer-Lemeshow test, 141.9, 21 df, P < 0.0001). The intercept of this model (0.035; 95% CI, 0.01-0.06) was statistically significant (P = 0.01), indicating that the observed number of cases significantly exceeded the expected; however, its calibration slope (1.02; 95% CI, 0.89-1.16) did not deviate significantly from unity, indicating that the relationship between the observed and expected death risk (based on the chart-HOMR score) remained intact (Figure 1).
The deviations between observed and expected death risks reflected deviations between the c chart-HOMR score and the administrative-HOMR score, with the former being significantly lower than the latter (Figure 2). Overall, the chart-HOMR score was 0.96 points lower (95% CI, 0.81-1.12) than the administrative-HOMR score. The HOMR score components that were notably underestimated using chart data included those for the age-Charlson Comorbidity Index interaction, living status, and admit points. Points for only 2 components (admitting service and admission urgency) were higher when calculated using chart data.
Four additional socio-functional variables collected from medical record review were significantly associated with 1-year death risk independent of the chart-HOMR score (Table 3). Admission documentation noting either delirium or falls were both associated with a significantly increased death risk (adjusted odds ratio [OR], 1.92 [95% CI, 1.24-2.96] and OR 1.96 [95% CI, 1.29-2.99], respectively). An independently increased death risk was also noted in patients who were dependent for any ADL (adjusted OR, 1.99 [95% CI, 1.24-3.19]). The presence of an ED geriatrics consultation within the previous 6 months was associated with a significantly decreased death risk of 60% (adjusted OR, 0.40 [95% CI, 0.20-0.81]). Adding these covariates to the logistic model with the chart-HOMR score significantly improved predictions (likelihood ratio statistic = 33.569, 4df, P < 0.00001).
DISCUSSION
In a large random sample of patients from our hospital, we found that the HOMR score using data abstracted from the medical record was significantly associated with 1-year death risk. The expected death risk based on the chart-HOMR score underestimated observed death risk but the relationship between the chart-HOMR score and death risk was similar to that in studies using administrative data. The HOMR score calculated using data from the chart was lower than that calculated using data from population-based administrative datasets; additional variables indicating patient frailty were significantly associated with 1-year death risk independent of the chart-HOMR score. Since the HOMR score was derived and initially validated using health administrative data, this study using data abstracted from the health record shows that the HOMR score has methodological generalizability.8
We think that our study has several notable findings. First, we found that data abstracted from the medical record can be used to calculate the HOMR score to accurately predict individual death risk. The chart-HOMR score discriminated very well between patients who did and did not die (C statistic, 0.88), which extensively exceeds the discrimination of published death risk indices (whose C statistics range between 0.69 and 0.82). It is also possible that chart abstraction for the HOMR score—without functional status—is simpler than other indices since its components are primarily very objective. (Other indices for hospital-based patients required factors that could be difficult to abstract reliably from the medical record including meeting more than 1 guideline for noncancer hospice care9; ambulation difficulties10; scales such as the Exton-Smith Scale or the Short Portable Mental Status Questionnaire11; weight loss12; functional status4; and pressure sore risk.13) Although expected risks for the chart-HOMR consistently underestimated observed risks (Figure 1), the mean deviation was small (with an absolute difference of 3.5% that can be used as a correction factor when determining expected risks with HOMR scores calculated from chart review), but it was an association between the chart-HOMR score and death risk that remained consistent through the cohort. Second, we found a small but significant decrease in the chart-HOMR score vs. the administrative-HOMR score (Figure 2). Some of these underestimates such as those for the number of ED visits or admissions by ambulance were expected since population-based health administrative databases would best capture such data. However, we were surprised that the comorbidity score was less when calculated using chart vs. database data (Figure 2). This finding is distinct from studies finding that particular comorbidities are documented in the chart are sometimes not coded.14,15 However, we identified comorbidities in the administrative databases using a 1-year ‘look-back’ period so that diagnostic codes from multiple hospitalizations (and from multiple hospitals) could be used to calculate the Charlson Comorbidity Index for a particular patient; this has been shown to increase the capture of comorbidities.16 Third, we found that variables from the chart review indicating frailty were predictive of 1-year death risk independent of the chart-HOMR score (Table 2). This illustrates that mortality risk prediction can be improved for particular patient groups by adding new covariates to the HOMR. Further work is required to determine how to incorporate these (and possibly other) covariates into the HOMR to create a unique chart-HOMR score. Finally, we found that a geriatrics assessment in the ED was associated with a significant (and notable) decrease in death risk. With these data, we are unable to indicate whether this association is causative. However, these findings indicate that the influence of emergency geriatric assessments on patient survival needs to be explored in more detail.
Several issues about our study should be considered when interpreting its results. First, this was a single-center study and the generalizability of our results to other centers is unknown. However, our study had the largest sample size of all primary data prognostic index validation studies1 ensuring that our results are, at the very least, internally reliable. In addition, our simple random sample ensured that we studied a broad assortment of patients to be certain that our results are representative of our institution. Second, we used a single abstractor for the study, which could limit the generalizability of our results. However, almost all the data points that were abstracted for our study were very objective.
In summary, our study shows that the HOMR score can be used to accurately predict 1-year death risk using data abstracted from the patient record. These findings will aid in individual patient prognostication for clinicians and researchers.
Disclosure
The authors report no financial conflicts of interest.
1. Yourman LC, Lee SJ, Schonberg MA, Widera EW, Smith AK. Prognostic indices for older adults: a systematic review. JAMA. 2012;307(2):182-192. PubMed
2. van Walraven C. The Hospital-patient One-year Mortality Risk score accurately predicts long term death risk in hospitalized patients. J Clin Epidemiol. 2014;67(9):1025-1034. PubMed
3. van Walraven C, McAlister FA, Bakal JA, Hawken S, Donzé J. External validation of the Hospital-patient One-year Mortality Risk (HOMR) model for predicting death within 1 year after hospital admission. CMAJ. 2015;187(10):725-733. PubMed
4. Walter LC, Brand RJ, Counsell SR, et al. Development and validation of a prognostic index for 1-year mortality in older adults after hospitalization. JAMA. 2001;285(23):2987-2994. PubMed
5. Clegg A, Young J, Iliffe S et al. Frailty in elderly people. The Lancet 2002;381:752-762. PubMed
6. Crowson CS, Atkinson EJ, Therneau TM. Assessing calibration of prognostic risk scores. Stat Methods Med Res. 2016;25(4):1692-1706. PubMed
7. Harrell FE Jr. Overview of Maximum Likelihood Estimation. Regression Modeling Strategies. New York, NY: Springer-Verlag; 2001: 179-212.
8. Justice AC, Covinsky KE, Berlin JA. Assessing the generalizability of prognostic information. Ann Intern Med. 1999;130(6):515-524. PubMed
9. Fischer SM, Gozansky WS, Sauaia A, Min SJ, Kutner JS, Kramer A. A practical tool to identify patients who may benefit from a palliative approach: the CARING criteria. J Pain Symptom Manage. 2006;31(4):285-292. PubMed
10. Inouye SK, Bogardus ST, Jr, Vitagliano G, et al. Burden of illness score for elderly persons: risk adjustment incorporating the cumulative impact of diseases, physiologic abnormalities, and functional impairments. Med Care. 2003;41(1):70-83. PubMed
11. Pilotto A, Ferrucci L, Franceschi M, et al. Development and validation of a multidimensional prognostic index for one-year mortality from comprehensive geriatric assessment in hospitalized older patients. Rejuvenation Res. 2008;11(1):151-161. PubMed
12. Teno JM, Harrell FE Jr, Knaus W, et al. Prediction of survival for older hospitalized patients: the HELP survival model. Hospitalized Elderly Longitudinal Project. J Am Geriatr Soc. 2000;48(5 suppl):S16-S24. PubMed
13. Dramé M, Novella JL, Lang PO, et al. Derivation and validation of a mortality-risk index from a cohort of frail elderly patients hospitalised in medical wards via emergencies: the SAFES study. Eur J Epidemiol. 2008;23(12):783-791. PubMed
14. Kieszak SM, Flanders WD, Kosinski AS, Shipp CC, Karp H. A comparison of the Charlson comorbidity index derived from medical record data and administrative billing data. J Clin Epidemiol. 1999;52(2):137-142. PubMed
15. Quan H, Parsons GA, Ghali WA. Validity of procedure codes in International Classification of Diseases, 9th revision, clinical modification administrative data. Med Care. 2004;42(8):801-809. PubMed
16. Zhang JX, Iwashyna TJ, Christakis NA. The performance of different lookback periods and sources of information for Charlson cComorbidity adjustment in Medicare claims. Med Care. 1999;37(11):1128-1139. PubMed
1. Yourman LC, Lee SJ, Schonberg MA, Widera EW, Smith AK. Prognostic indices for older adults: a systematic review. JAMA. 2012;307(2):182-192. PubMed
2. van Walraven C. The Hospital-patient One-year Mortality Risk score accurately predicts long term death risk in hospitalized patients. J Clin Epidemiol. 2014;67(9):1025-1034. PubMed
3. van Walraven C, McAlister FA, Bakal JA, Hawken S, Donzé J. External validation of the Hospital-patient One-year Mortality Risk (HOMR) model for predicting death within 1 year after hospital admission. CMAJ. 2015;187(10):725-733. PubMed
4. Walter LC, Brand RJ, Counsell SR, et al. Development and validation of a prognostic index for 1-year mortality in older adults after hospitalization. JAMA. 2001;285(23):2987-2994. PubMed
5. Clegg A, Young J, Iliffe S et al. Frailty in elderly people. The Lancet 2002;381:752-762. PubMed
6. Crowson CS, Atkinson EJ, Therneau TM. Assessing calibration of prognostic risk scores. Stat Methods Med Res. 2016;25(4):1692-1706. PubMed
7. Harrell FE Jr. Overview of Maximum Likelihood Estimation. Regression Modeling Strategies. New York, NY: Springer-Verlag; 2001: 179-212.
8. Justice AC, Covinsky KE, Berlin JA. Assessing the generalizability of prognostic information. Ann Intern Med. 1999;130(6):515-524. PubMed
9. Fischer SM, Gozansky WS, Sauaia A, Min SJ, Kutner JS, Kramer A. A practical tool to identify patients who may benefit from a palliative approach: the CARING criteria. J Pain Symptom Manage. 2006;31(4):285-292. PubMed
10. Inouye SK, Bogardus ST, Jr, Vitagliano G, et al. Burden of illness score for elderly persons: risk adjustment incorporating the cumulative impact of diseases, physiologic abnormalities, and functional impairments. Med Care. 2003;41(1):70-83. PubMed
11. Pilotto A, Ferrucci L, Franceschi M, et al. Development and validation of a multidimensional prognostic index for one-year mortality from comprehensive geriatric assessment in hospitalized older patients. Rejuvenation Res. 2008;11(1):151-161. PubMed
12. Teno JM, Harrell FE Jr, Knaus W, et al. Prediction of survival for older hospitalized patients: the HELP survival model. Hospitalized Elderly Longitudinal Project. J Am Geriatr Soc. 2000;48(5 suppl):S16-S24. PubMed
13. Dramé M, Novella JL, Lang PO, et al. Derivation and validation of a mortality-risk index from a cohort of frail elderly patients hospitalised in medical wards via emergencies: the SAFES study. Eur J Epidemiol. 2008;23(12):783-791. PubMed
14. Kieszak SM, Flanders WD, Kosinski AS, Shipp CC, Karp H. A comparison of the Charlson comorbidity index derived from medical record data and administrative billing data. J Clin Epidemiol. 1999;52(2):137-142. PubMed
15. Quan H, Parsons GA, Ghali WA. Validity of procedure codes in International Classification of Diseases, 9th revision, clinical modification administrative data. Med Care. 2004;42(8):801-809. PubMed
16. Zhang JX, Iwashyna TJ, Christakis NA. The performance of different lookback periods and sources of information for Charlson cComorbidity adjustment in Medicare claims. Med Care. 1999;37(11):1128-1139. PubMed
© 2017 Society of Hospital Medicine
Predicting 30-day pneumonia readmissions using electronic health record data
Pneumonia is a leading cause of hospitalizations in the U.S., accounting for more than 1.1 million discharges annually.1 Pneumonia is frequently complicated by hospital readmission, which is costly and potentially avoidable.2,3 Due to financial penalties imposed on hospitals for higher than expected 30-day readmission rates, there is increasing attention to implementing interventions to reduce readmissions in this population.4,5 However, because these programs are resource-intensive, interventions are thought to be most cost-effective if they are targeted to high-risk individuals who are most likely to benefit.6-8
Current pneumonia-specific readmission risk-prediction models that could enable identification of high-risk patients suffer from poor predictive ability, greatly limiting their use, and most were validated among older adults or by using data from single academic medical centers, limiting their generalizability.9-14 A potential reason for poor predictive accuracy is the omission of known robust clinical predictors of pneumonia-related outcomes, including pneumonia severity of illness and stability on discharge.15-17 Approaches using electronic health record (EHR) data, which include this clinically granular data, could enable hospitals to more accurately and pragmatically identify high-risk patients during the index hospitalization and enable interventions to be initiated prior to discharge.
An alternative strategy to identifying high-risk patients for readmission is to use a multi-condition risk-prediction model. Developing and implementing models for every condition may be time-consuming and costly. We have derived and validated 2 multi-condition risk-prediction models using EHR data—1 using data from the first day of hospital admission (‘first-day’ model), and the second incorporating data from the entire hospitalization (‘full-stay’ model) to reflect in-hospital complications and clinical stability at discharge.18,19 However, it is unknown if a multi-condition model for pneumonia would perform as well as a disease-specific model.
This study aimed to develop 2 EHR-based pneumonia-specific readmission risk-prediction models using data routinely collected in clinical practice—a ‘first-day’ and a ‘full-stay’ model—and compare the performance of each model to: 1) one another; 2) the corresponding multi-condition EHR model; and 3) to other potentially useful models in predicting pneumonia readmissions (the Centers for Medicare and Medicaid Services [CMS] pneumonia model, and 2 commonly used pneumonia severity of illness scores validated for predicting mortality). We hypothesized that the pneumonia-specific EHR models would outperform other models; and the full-stay pneumonia-specific model would outperform the first-day pneumonia-specific model.
METHODS
Study Design, Population, and Data Sources
We conducted an observational study using EHR data collected from 6 hospitals (including safety net, community, teaching, and nonteaching hospitals) in north Texas between November 2009 and October 2010, All hospitals used the Epic EHR (Epic Systems Corporation, Verona, WI). Details of this cohort have been published.18,19
We included consecutive hospitalizations among adults 18 years and older discharged from any medicine service with principal discharge diagnoses of pneumonia (ICD-9-CM codes 480-483, 485, 486-487), sepsis (ICD-9-CM codes 038, 995.91, 995.92, 785.52), or respiratory failure (ICD-9-CM codes 518.81, 518.82, 518.84, 799.1) when the latter 2 were also accompanied by a secondary diagnosis of pneumonia.20 For individuals with multiple hospitalizations during the study period, we included only the first hospitalization. We excluded individuals who died during the index hospitalization or within 30 days of discharge, were transferred to another acute care facility, or left against medical advice.
Outcomes
The primary outcome was all-cause 30-day readmission, defined as a nonelective hospitalization within 30 days of discharge to any of 75 acute care hospitals within a 100-mile radius of Dallas, ascertained from an all-payer regional hospitalization database.
Predictor Variables for the Pneumonia-Specific Readmission Models
The selection of candidate predictors was informed by our validated multi-condition risk-prediction models using EHR data available within 24 hours of admission (‘first-day’ multi-condition EHR model) or during the entire hospitalization (‘full-stay’ multi-condition EHR model).18,19 For the pneumonia-specific models, we included all variables in our published multi-condition models as candidate predictors, including sociodemographics, prior utilization, Charlson Comorbidity Index, select laboratory and vital sign abnormalities, length of stay, hospital complications (eg, venous thromboembolism), vital sign instabilities, and disposition status (see Supplemental Table 1 for complete list of variables). We also assessed additional variables specific to pneumonia for inclusion that were: (1) available in the EHR of all participating hospitals; (2) routinely collected or available at the time of admission or discharge; and (3) plausible predictors of adverse outcomes based on literature and clinical expertise. These included select comorbidities (eg, psychiatric conditions, chronic lung disease, history of pneumonia),10,11,21,22 the pneumonia severity index (PSI),16,23,24 intensive care unit stay, and receipt of invasive or noninvasive ventilation. We used a modified PSI score because certain data elements were missing. The modified PSI (henceforth referred to as PSI) did not include nursing home residence and included diagnostic codes as proxies for the presence of pleural effusion (ICD-9-CM codes 510, 511.1, and 511.9) and altered mental status (ICD-9-CM codes 780.0X, 780.97, 293.0, 293.1, and 348.3X).
Statistical Analysis
Model Derivation. Candidate predictor variables were classified as available in the EHR within 24 hours of admission and/or at the time of discharge. For example, socioeconomic factors could be ascertained within the first day of hospitalization, whereas length of stay would not be available until the day of discharge. Predictors with missing values were assumed to be normal (less than 1% missing for each variable). Univariate relationships between readmission and each candidate predictor were assessed in the overall cohort using a pre-specified significance threshold of P ≤ 0.10. Significant variables were entered in the respective first-day and full-stay pneumonia-specific multivariable logistic regression models using stepwise-backward selection with a pre-specified significance threshold of P ≤ 0.05. In sensitivity analyses, we alternately derived our models using stepwise-forward selection, as well as stepwise-backward selection minimizing the Bayesian information criterion and Akaike information criterion separately. These alternate modeling strategies yielded identical predictors to our final models.
Model Validation. Model validation was performed using 5-fold cross-validation, with the overall cohort randomly divided into 5 equal-size subsets.25 For each cycle, 4 subsets were used for training to estimate model coefficients, and the fifth subset was used for validation. This cycle was repeated 5 times with each randomly-divided subset used once as the validation set. We repeated this entire process 50 times and averaged the C statistic estimates to derive an optimism-corrected C statistic. Model calibration was assessed qualitatively by comparing predicted to observed probabilities of readmission by quintiles of predicted risk, and with the Hosmer-Lemeshow goodness-of-fit test.
Comparison to Other Models. The main comparisons of the first-day and full-stay pneumonia-specific EHR model performance were to each other and the corresponding multi-condition EHR model.18,19 The multi-condition EHR models were separately derived and validated within the larger parent cohort from which this study cohort was derived, and outperformed the CMS all-cause model, the HOSPITAL model, and the LACE index.19 To further triangulate our findings, given the lack of other rigorously validated pneumonia-specific risk-prediction models for readmission,14 we compared the pneumonia-specific EHR models to the CMS pneumonia model derived from administrative claims data,10 and 2 commonly used risk-prediction scores for short-term mortality among patients with community-acquired pneumonia, the PSI and CURB-65 scores.16 Although derived and validated using patient-level data, the CMS model was developed to benchmark hospitals according to hospital-level readmission rates.10 The CURB-65 score in this study was also modified to include the same altered mental status diagnostic codes according to the modified PSI as a proxy for “confusion.” Both the PSI and CURB-65 scores were calculated using the most abnormal values within the first 24 hours of admission. The ‘updated’ PSI and the ‘updated’ CURB-65 were calculated using the most abnormal values within 24 hours prior to discharge, or the last known observation prior to discharge if no results were recorded within this time period. A complete list of variables for each of the comparison models are shown in Supplemental Table 1.
We assessed model performance by calculating the C statistic, integrated discrimination index, and net reclassification index (NRI) compared to our pneumonia-specific models. The integrated discrimination index is the difference in the mean predicted probability of readmission between patients who were and were not actually readmitted between 2 models, where more positive values suggest improvement in model performance compared to a reference model.26 The NRI is defined as the sum of the net proportions of correctly reclassified persons with and without the event of interest.27 Here, we calculated a category-based NRI to evaluate the performance of pneumonia-specific models in correctly classifying individuals with and without readmissions into the 2 highest readmission risk quintiles vs the lowest 3 risk quintiles compared to other models.27 This pre-specified cutoff is relevant for hospitals interested in identifying the highest risk individuals for targeted intervention.7 Finally, we assessed calibration of comparator models in our cohort by comparing predicted probability to observed probability of readmission by quintiles of risk for each model. We conducted all analyses using Stata 12.1 (StataCorp, College Station, Texas). This study was approved by the University of Texas Southwestern Medical Center Institutional Review Board.
RESULTS
Of 1463 index hospitalizations (Supplemental Figure 1), the 30-day all-cause readmission rate was 13.6%. Individuals with a 30-day readmission had markedly different sociodemographic and clinical characteristics compared to those not readmitted (Table 1; see Supplemental Table 2 for additional clinical characteristics).
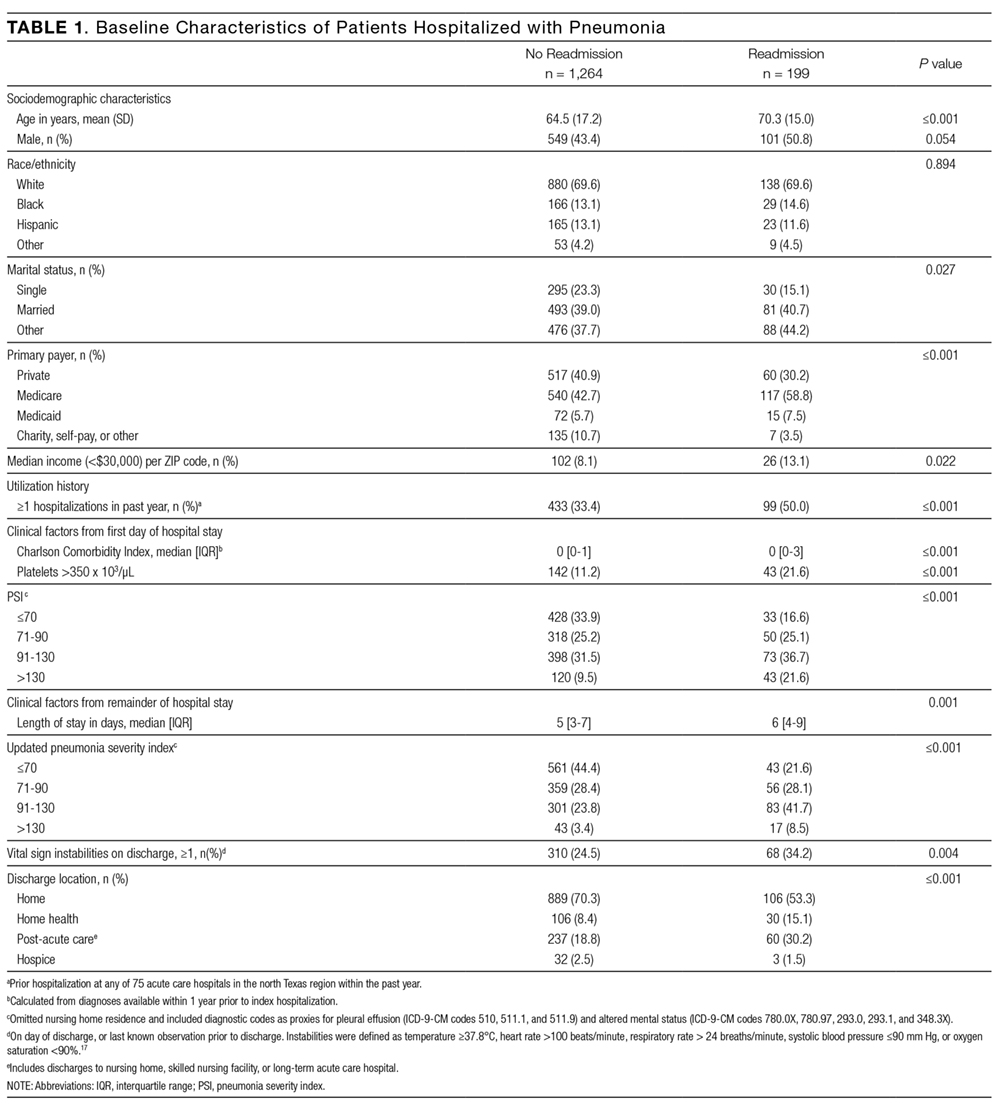
Derivation, Validation, and Performance of the Pneumonia-Specific Readmission Risk-Prediction Models
The final first-day pneumonia-specific EHR model included 7 variables, including sociodemographic characteristics; prior hospitalizations; thrombocytosis, and PSI (Table 2). The first-day pneumonia-specific model had adequate discrimination (C statistic, 0.695; optimism-corrected C statistic 0.675, 95% confidence interval [CI], 0.667-0.685; Table 3). It also effectively stratified individuals across a broad range of risk (average predicted decile of risk ranged from 4% to 33%; Table 3) and was well calibrated (Supplemental Table 3).
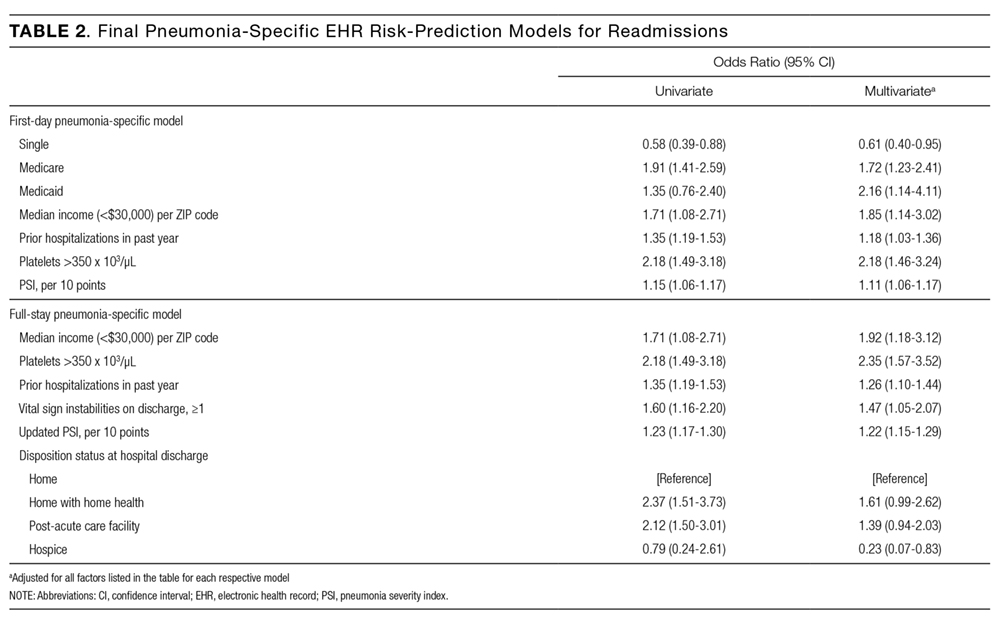
The final full-stay pneumonia-specific EHR readmission model included 8 predictors, including 3 variables from the first-day model (median income, thrombocytosis, and prior hospitalizations; Table 2). The full-stay pneumonia-specific EHR model also included vital sign instabilities on discharge, updated PSI, and disposition status (ie, being discharged with home health or to a post-acute care facility was associated with greater odds of readmission, and hospice with lower odds). The full-stay pneumonia-specific EHR model had good discrimination (C statistic, 0.731; optimism-corrected C statistic, 0.714; 95% CI, 0.706-0.720), and stratified individuals across a broad range of risk (average predicted decile of risk ranged from 3% to 37%; Table 3), and was also well calibrated (Supplemental Table 3).
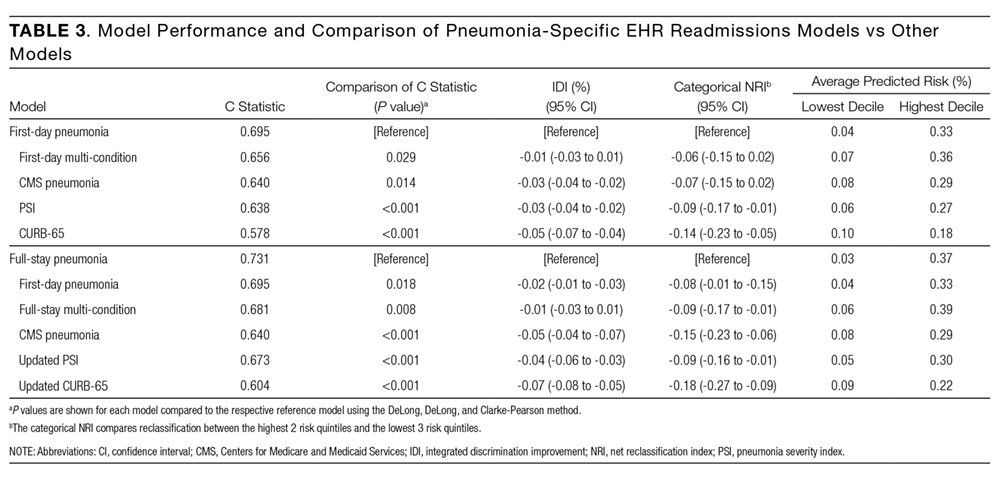
First-Day Pneumonia-Specific EHR Model vs First-Day Multi-Condition EHR Model
The first-day pneumonia-specific EHR model outperformed the first-day multi-condition EHR model with better discrimination (P = 0.029) and more correctly classified individuals in the top 2 highest risk quintiles vs the bottom 3 risk quintiles (Table 3, Supplemental Table 4, and Supplemental Figure 2A). With respect to calibration, the first-day multi-condition EHR model overestimated risk among the highest quintile risk group compared to the first-day pneumonia-specific EHR model (Figure 1A, 1B).
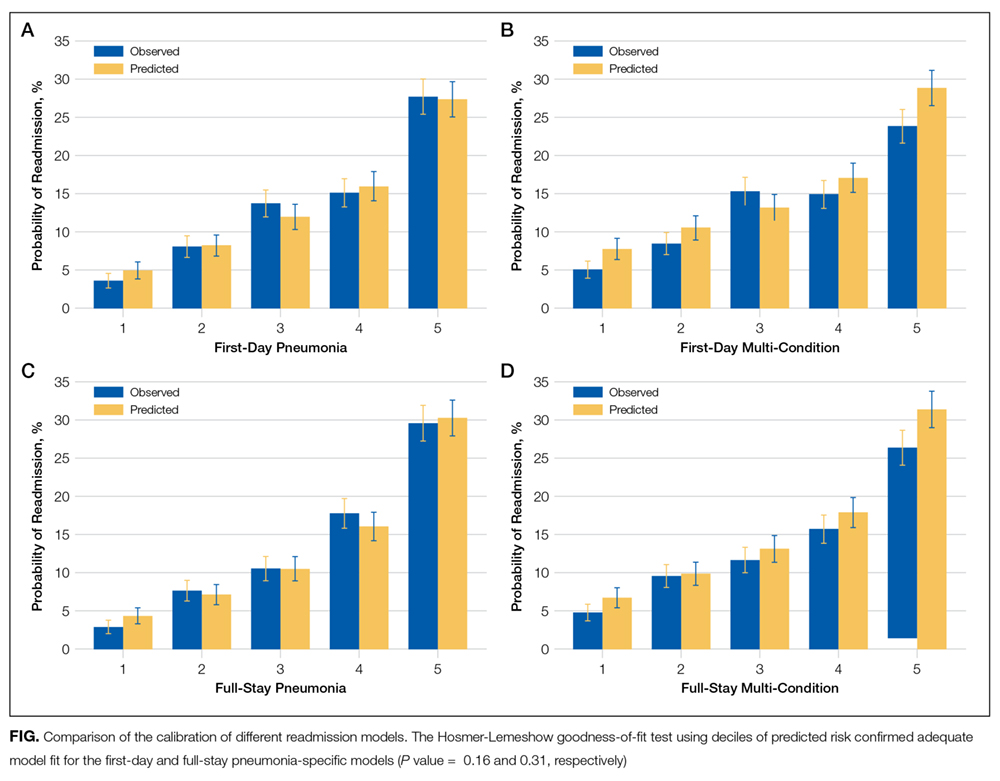
Full-Stay Pneumonia-Specific EHR Model vs Other Models
The full-stay pneumonia-specific EHR model comparatively outperformed the corresponding full-stay multi-condition EHR model, as well as the first-day pneumonia-specific EHR model, the CMS pneumonia model, the updated PSI, and the updated CURB-65 (Table 3, Supplemental Table 5, Supplemental Table 6, and Supplemental Figures 2B and 2C). Compared to the full-stay multi-condition and first-day pneumonia-specific EHR models, the full-stay pneumonia-specific EHR model had better discrimination, better reclassification (NRI, 0.09 and 0.08, respectively), and was able to stratify individuals across a broader range of readmission risk (Table 3). It also had better calibration in the highest quintile risk group compared to the full-stay multi-condition EHR model (Figure 1C and 1D).
Updated vs First-Day Modified PSI and CURB-65 Scores
The updated PSI was more strongly predictive of readmission than the PSI calculated on the day of admission (Wald test, 9.83; P = 0.002). Each 10-point increase in the updated PSI was associated with a 22% increased odds of readmission vs an 11% increase for the PSI calculated upon admission (Table 2). The improved predictive ability of the updated PSI and CURB-65 scores was also reflected in the superior discrimination and calibration vs the respective first-day pneumonia severity of illness scores (Table 3).
DISCUSSION
Using routinely available EHR data from 6 diverse hospitals, we developed 2 pneumonia-specific readmission risk-prediction models that aimed to allow hospitals to identify patients hospitalized with pneumonia at high risk for readmission. Overall, we found that a pneumonia-specific model using EHR data from the entire hospitalization outperformed all other models—including the first-day pneumonia-specific model using data present only on admission, our own multi-condition EHR models, and the CMS pneumonia model based on administrative claims data—in all aspects of model performance (discrimination, calibration, and reclassification). We found that socioeconomic status, prior hospitalizations, thrombocytosis, and measures of clinical severity and stability were important predictors of 30-day all-cause readmissions among patients hospitalized with pneumonia. Additionally, an updated discharge PSI score was a stronger independent predictor of readmissions compared to the PSI score calculated upon admission; and inclusion of the updated PSI in our full-stay pneumonia model led to improved prediction of 30-day readmissions.
The marked improvement in performance of the full-stay pneumonia-specific EHR model compared to the first-day pneumonia-specific model suggests that clinical stability and trajectory during hospitalization (as modeled through disposition status, updated PSI, and vital sign instabilities at discharge) are important predictors of 30-day readmission among patients hospitalized for pneumonia, which was not the case for our EHR-based multi-condition models.19 With the inclusion of these measures, the full-stay pneumonia-specific model correctly reclassified an additional 8% of patients according to their true risk compared to the first-day pneumonia-specific model. One implication of these findings is that hospitals interested in targeting their highest risk individuals with pneumonia for transitional care interventions could do so using the first-day pneumonia-specific EHR model and could refine their targeted strategy at the time of discharge by using the full-stay pneumonia model. This staged risk-prediction strategy would enable hospitals to initiate transitional care interventions for high-risk individuals in the inpatient setting (ie, patient education).7 Then, hospitals could enroll both persistent and newly identified high-risk individuals for outpatient interventions (ie, follow-up telephone call) in the immediate post-discharge period, an interval characterized by heightened vulnerability for adverse events,28 based on patients’ illness severity and stability at discharge. This approach can be implemented by hospitals by building these risk-prediction models directly into the EHR, or by extracting EHR data in near real time as our group has done successfully for heart failure.7
Another key implication of our study is that, for pneumonia, a disease-specific modeling approach has better predictive ability than using a multi-condition model. Compared to multi-condition models, the first-day and full-stay pneumonia-specific EHR models correctly reclassified an additional 6% and 9% of patients, respectively. Thus, hospitals interested in identifying the highest risk patients with pneumonia for targeted interventions should do so using the disease-specific models, if the costs and resources of doing so are within reach of the healthcare system.
An additional novel finding of our study is the added value of an updated PSI for predicting adverse events. Studies of pneumonia severity of illness scores have calculated the PSI and CURB-65 scores using data present only on admission.16,24 While our study also confirms that the PSI calculated upon admission is a significant predictor of readmission,23,29 this study extends this work by showing that an updated PSI score calculated at the time of discharge is an even stronger predictor for readmission, and its inclusion in the model significantly improves risk stratification and prognostication.
Our study was noteworthy for several strengths. First, we used data from a common EHR system, thus potentially allowing for the implementation of the pneumonia-specific models in real time across a number of hospitals. The use of routinely collected data for risk-prediction modeling makes this approach scalable and sustainable, because it obviates the need for burdensome data collection and entry. Second, to our knowledge, this is the first study to measure the additive influence of illness severity and stability at discharge on the readmission risk among patients hospitalized with pneumonia. Third, our study population was derived from 6 hospitals diverse in payer status, age, race/ethnicity, and socioeconomic status. Fourth, our models are less likely to be overfit to the idiosyncrasies of our data given that several predictors included in our final pneumonia-specific models have been associated with readmission in this population, including marital status,13,30 income,11,31 prior hospitalizations,11,13 thrombocytosis,32-34 and vital sign instabilities on discharge.17 Lastly, the discrimination of the CMS pneumonia model in our cohort (C statistic, 0.64) closely matched the discrimination observed in 4 independent cohorts (C statistic, 0.63), suggesting adequate generalizability of our study setting and population.10,12
Our results should be interpreted in the context of several limitations. First, generalizability to other regions beyond north Texas is unknown. Second, although we included a diverse cohort of safety net, community, teaching, and nonteaching hospitals, the pneumonia-specific models were not externally validated in a separate cohort, which may lead to more optimistic estimates of model performance. Third, PSI and CURB-65 scores were modified to use diagnostic codes for altered mental status and pleural effusion, and omitted nursing home residence. Thus, the independent associations for the PSI and CURB-65 scores and their predictive ability are likely attenuated. Fourth, we were unable to include data on medications (antibiotics and steroid use) and outpatient visits, which may influence readmission risk.2,9,13,35-40 Fifth, we included only the first pneumonia hospitalization per patient in this study. Had we included multiple hospitalizations per patient, we anticipate better model performance for the 2 pneumonia-specific EHR models since prior hospitalization was a robust predictor of readmission.
In conclusion, the full-stay pneumonia-specific EHR readmission risk-prediction model outperformed the first-day pneumonia-specific model, multi-condition EHR models, and the CMS pneumonia model. This suggests that: measures of clinical severity and stability at the time of discharge are important predictors for identifying patients at highest risk for readmission; and that EHR data routinely collected for clinical practice can be used to accurately predict risk of readmission among patients hospitalized for pneumonia.
Acknowledgments
The authors would like to acknowledge Ruben Amarasingham, MD, MBA, president and chief executive officer of Parkland Center for Clinical Innovation, and Ferdinand Velasco, MD, chief health information officer at Texas Health Resources for their assistance in assembling the 6-hospital cohort used in this study.
Disclosures
This work was supported by the Agency for Healthcare Research and Quality-funded UT Southwestern Center for Patient-Centered Outcomes Research (R24 HS022418-01); the Commonwealth Foundation (#20100323); the UT Southwestern KL2 Scholars Program supported by the National Institutes of Health (KL2 TR001103 to ANM and OKN); and the National Center for Advancing Translational Sciences at the National Institute of Health (U54 RFA-TR-12-006 to E.A.H.). The study sponsors had no role in design and conduct of the study; collection, management, analysis, and interpretation of the data; and preparation, review, or approval of the manuscript. The authors have no financial conflicts of interest to disclose
1. Centers for Disease Control and Prevention. Pneumonia. http://www.cdc.gov/nchs/fastats/pneumonia.htm. Accessed January 26, 2016.
33. Prina E, Ferrer M, Ranzani OT, et al. Thrombocytosis is a marker of poor outcome in community-acquired pneumonia. Chest. 2013;143(3):767-775. PubMed
34. Violi F, Cangemi R, Calvieri C. Pneumonia, thrombosis and vascular disease. J Thromb Haemost. 2014;12(9):1391-1400. PubMed
35. Weinberger M, Oddone EZ, Henderson WG. Does increased access to primary care reduce hospital readmissions? Veterans Affairs Cooperative Study Group on Primary Care and Hospital Readmission. N Engl J Med. 1996;334(22):1441-1447. PubMed
36. Field TS, Ogarek J, Garber L, Reed G, Gurwitz JH. Association of early post-discharge follow-up by a primary care physician and 30-day rehospitalization among older adults. J Gen Intern Med. 2015;30(5):565-571. PubMed
37. Spatz ES, Sheth SD, Gosch KL, et al. Usual source of care and outcomes following acute myocardial infarction. J Gen Intern Med. 2014;29(6):862-869. PubMed
38. Brooke BS, Stone DH, Cronenwett JL, et al. Early primary care provider follow-up and readmission after high-risk surgery. JAMA Surg. 2014;149(8):821-828. PubMed
39. Adamuz J, Viasus D, Campreciós-Rodriguez P, et al. A prospective cohort study of healthcare visits and rehospitalizations after discharge of patients with community-acquired pneumonia. Respirology. 2011;16(7):1119-1126. PubMed
40. Shorr AF, Zilberberg MD, Reichley R, et al. Readmission following hospitalization for pneumonia: the impact of pneumonia type and its implication for hospitals. Clin Infect Dis. 2013;57(3):362-367. PubMed
Pneumonia is a leading cause of hospitalizations in the U.S., accounting for more than 1.1 million discharges annually.1 Pneumonia is frequently complicated by hospital readmission, which is costly and potentially avoidable.2,3 Due to financial penalties imposed on hospitals for higher than expected 30-day readmission rates, there is increasing attention to implementing interventions to reduce readmissions in this population.4,5 However, because these programs are resource-intensive, interventions are thought to be most cost-effective if they are targeted to high-risk individuals who are most likely to benefit.6-8
Current pneumonia-specific readmission risk-prediction models that could enable identification of high-risk patients suffer from poor predictive ability, greatly limiting their use, and most were validated among older adults or by using data from single academic medical centers, limiting their generalizability.9-14 A potential reason for poor predictive accuracy is the omission of known robust clinical predictors of pneumonia-related outcomes, including pneumonia severity of illness and stability on discharge.15-17 Approaches using electronic health record (EHR) data, which include this clinically granular data, could enable hospitals to more accurately and pragmatically identify high-risk patients during the index hospitalization and enable interventions to be initiated prior to discharge.
An alternative strategy to identifying high-risk patients for readmission is to use a multi-condition risk-prediction model. Developing and implementing models for every condition may be time-consuming and costly. We have derived and validated 2 multi-condition risk-prediction models using EHR data—1 using data from the first day of hospital admission (‘first-day’ model), and the second incorporating data from the entire hospitalization (‘full-stay’ model) to reflect in-hospital complications and clinical stability at discharge.18,19 However, it is unknown if a multi-condition model for pneumonia would perform as well as a disease-specific model.
This study aimed to develop 2 EHR-based pneumonia-specific readmission risk-prediction models using data routinely collected in clinical practice—a ‘first-day’ and a ‘full-stay’ model—and compare the performance of each model to: 1) one another; 2) the corresponding multi-condition EHR model; and 3) to other potentially useful models in predicting pneumonia readmissions (the Centers for Medicare and Medicaid Services [CMS] pneumonia model, and 2 commonly used pneumonia severity of illness scores validated for predicting mortality). We hypothesized that the pneumonia-specific EHR models would outperform other models; and the full-stay pneumonia-specific model would outperform the first-day pneumonia-specific model.
METHODS
Study Design, Population, and Data Sources
We conducted an observational study using EHR data collected from 6 hospitals (including safety net, community, teaching, and nonteaching hospitals) in north Texas between November 2009 and October 2010, All hospitals used the Epic EHR (Epic Systems Corporation, Verona, WI). Details of this cohort have been published.18,19
We included consecutive hospitalizations among adults 18 years and older discharged from any medicine service with principal discharge diagnoses of pneumonia (ICD-9-CM codes 480-483, 485, 486-487), sepsis (ICD-9-CM codes 038, 995.91, 995.92, 785.52), or respiratory failure (ICD-9-CM codes 518.81, 518.82, 518.84, 799.1) when the latter 2 were also accompanied by a secondary diagnosis of pneumonia.20 For individuals with multiple hospitalizations during the study period, we included only the first hospitalization. We excluded individuals who died during the index hospitalization or within 30 days of discharge, were transferred to another acute care facility, or left against medical advice.
Outcomes
The primary outcome was all-cause 30-day readmission, defined as a nonelective hospitalization within 30 days of discharge to any of 75 acute care hospitals within a 100-mile radius of Dallas, ascertained from an all-payer regional hospitalization database.
Predictor Variables for the Pneumonia-Specific Readmission Models
The selection of candidate predictors was informed by our validated multi-condition risk-prediction models using EHR data available within 24 hours of admission (‘first-day’ multi-condition EHR model) or during the entire hospitalization (‘full-stay’ multi-condition EHR model).18,19 For the pneumonia-specific models, we included all variables in our published multi-condition models as candidate predictors, including sociodemographics, prior utilization, Charlson Comorbidity Index, select laboratory and vital sign abnormalities, length of stay, hospital complications (eg, venous thromboembolism), vital sign instabilities, and disposition status (see Supplemental Table 1 for complete list of variables). We also assessed additional variables specific to pneumonia for inclusion that were: (1) available in the EHR of all participating hospitals; (2) routinely collected or available at the time of admission or discharge; and (3) plausible predictors of adverse outcomes based on literature and clinical expertise. These included select comorbidities (eg, psychiatric conditions, chronic lung disease, history of pneumonia),10,11,21,22 the pneumonia severity index (PSI),16,23,24 intensive care unit stay, and receipt of invasive or noninvasive ventilation. We used a modified PSI score because certain data elements were missing. The modified PSI (henceforth referred to as PSI) did not include nursing home residence and included diagnostic codes as proxies for the presence of pleural effusion (ICD-9-CM codes 510, 511.1, and 511.9) and altered mental status (ICD-9-CM codes 780.0X, 780.97, 293.0, 293.1, and 348.3X).
Statistical Analysis
Model Derivation. Candidate predictor variables were classified as available in the EHR within 24 hours of admission and/or at the time of discharge. For example, socioeconomic factors could be ascertained within the first day of hospitalization, whereas length of stay would not be available until the day of discharge. Predictors with missing values were assumed to be normal (less than 1% missing for each variable). Univariate relationships between readmission and each candidate predictor were assessed in the overall cohort using a pre-specified significance threshold of P ≤ 0.10. Significant variables were entered in the respective first-day and full-stay pneumonia-specific multivariable logistic regression models using stepwise-backward selection with a pre-specified significance threshold of P ≤ 0.05. In sensitivity analyses, we alternately derived our models using stepwise-forward selection, as well as stepwise-backward selection minimizing the Bayesian information criterion and Akaike information criterion separately. These alternate modeling strategies yielded identical predictors to our final models.
Model Validation. Model validation was performed using 5-fold cross-validation, with the overall cohort randomly divided into 5 equal-size subsets.25 For each cycle, 4 subsets were used for training to estimate model coefficients, and the fifth subset was used for validation. This cycle was repeated 5 times with each randomly-divided subset used once as the validation set. We repeated this entire process 50 times and averaged the C statistic estimates to derive an optimism-corrected C statistic. Model calibration was assessed qualitatively by comparing predicted to observed probabilities of readmission by quintiles of predicted risk, and with the Hosmer-Lemeshow goodness-of-fit test.
Comparison to Other Models. The main comparisons of the first-day and full-stay pneumonia-specific EHR model performance were to each other and the corresponding multi-condition EHR model.18,19 The multi-condition EHR models were separately derived and validated within the larger parent cohort from which this study cohort was derived, and outperformed the CMS all-cause model, the HOSPITAL model, and the LACE index.19 To further triangulate our findings, given the lack of other rigorously validated pneumonia-specific risk-prediction models for readmission,14 we compared the pneumonia-specific EHR models to the CMS pneumonia model derived from administrative claims data,10 and 2 commonly used risk-prediction scores for short-term mortality among patients with community-acquired pneumonia, the PSI and CURB-65 scores.16 Although derived and validated using patient-level data, the CMS model was developed to benchmark hospitals according to hospital-level readmission rates.10 The CURB-65 score in this study was also modified to include the same altered mental status diagnostic codes according to the modified PSI as a proxy for “confusion.” Both the PSI and CURB-65 scores were calculated using the most abnormal values within the first 24 hours of admission. The ‘updated’ PSI and the ‘updated’ CURB-65 were calculated using the most abnormal values within 24 hours prior to discharge, or the last known observation prior to discharge if no results were recorded within this time period. A complete list of variables for each of the comparison models are shown in Supplemental Table 1.
We assessed model performance by calculating the C statistic, integrated discrimination index, and net reclassification index (NRI) compared to our pneumonia-specific models. The integrated discrimination index is the difference in the mean predicted probability of readmission between patients who were and were not actually readmitted between 2 models, where more positive values suggest improvement in model performance compared to a reference model.26 The NRI is defined as the sum of the net proportions of correctly reclassified persons with and without the event of interest.27 Here, we calculated a category-based NRI to evaluate the performance of pneumonia-specific models in correctly classifying individuals with and without readmissions into the 2 highest readmission risk quintiles vs the lowest 3 risk quintiles compared to other models.27 This pre-specified cutoff is relevant for hospitals interested in identifying the highest risk individuals for targeted intervention.7 Finally, we assessed calibration of comparator models in our cohort by comparing predicted probability to observed probability of readmission by quintiles of risk for each model. We conducted all analyses using Stata 12.1 (StataCorp, College Station, Texas). This study was approved by the University of Texas Southwestern Medical Center Institutional Review Board.
RESULTS
Of 1463 index hospitalizations (Supplemental Figure 1), the 30-day all-cause readmission rate was 13.6%. Individuals with a 30-day readmission had markedly different sociodemographic and clinical characteristics compared to those not readmitted (Table 1; see Supplemental Table 2 for additional clinical characteristics).
Derivation, Validation, and Performance of the Pneumonia-Specific Readmission Risk-Prediction Models
The final first-day pneumonia-specific EHR model included 7 variables, including sociodemographic characteristics; prior hospitalizations; thrombocytosis, and PSI (Table 2). The first-day pneumonia-specific model had adequate discrimination (C statistic, 0.695; optimism-corrected C statistic 0.675, 95% confidence interval [CI], 0.667-0.685; Table 3). It also effectively stratified individuals across a broad range of risk (average predicted decile of risk ranged from 4% to 33%; Table 3) and was well calibrated (Supplemental Table 3).
The final full-stay pneumonia-specific EHR readmission model included 8 predictors, including 3 variables from the first-day model (median income, thrombocytosis, and prior hospitalizations; Table 2). The full-stay pneumonia-specific EHR model also included vital sign instabilities on discharge, updated PSI, and disposition status (ie, being discharged with home health or to a post-acute care facility was associated with greater odds of readmission, and hospice with lower odds). The full-stay pneumonia-specific EHR model had good discrimination (C statistic, 0.731; optimism-corrected C statistic, 0.714; 95% CI, 0.706-0.720), and stratified individuals across a broad range of risk (average predicted decile of risk ranged from 3% to 37%; Table 3), and was also well calibrated (Supplemental Table 3).
First-Day Pneumonia-Specific EHR Model vs First-Day Multi-Condition EHR Model
The first-day pneumonia-specific EHR model outperformed the first-day multi-condition EHR model with better discrimination (P = 0.029) and more correctly classified individuals in the top 2 highest risk quintiles vs the bottom 3 risk quintiles (Table 3, Supplemental Table 4, and Supplemental Figure 2A). With respect to calibration, the first-day multi-condition EHR model overestimated risk among the highest quintile risk group compared to the first-day pneumonia-specific EHR model (Figure 1A, 1B).
Full-Stay Pneumonia-Specific EHR Model vs Other Models
The full-stay pneumonia-specific EHR model comparatively outperformed the corresponding full-stay multi-condition EHR model, as well as the first-day pneumonia-specific EHR model, the CMS pneumonia model, the updated PSI, and the updated CURB-65 (Table 3, Supplemental Table 5, Supplemental Table 6, and Supplemental Figures 2B and 2C). Compared to the full-stay multi-condition and first-day pneumonia-specific EHR models, the full-stay pneumonia-specific EHR model had better discrimination, better reclassification (NRI, 0.09 and 0.08, respectively), and was able to stratify individuals across a broader range of readmission risk (Table 3). It also had better calibration in the highest quintile risk group compared to the full-stay multi-condition EHR model (Figure 1C and 1D).
Updated vs First-Day Modified PSI and CURB-65 Scores
The updated PSI was more strongly predictive of readmission than the PSI calculated on the day of admission (Wald test, 9.83; P = 0.002). Each 10-point increase in the updated PSI was associated with a 22% increased odds of readmission vs an 11% increase for the PSI calculated upon admission (Table 2). The improved predictive ability of the updated PSI and CURB-65 scores was also reflected in the superior discrimination and calibration vs the respective first-day pneumonia severity of illness scores (Table 3).
DISCUSSION
Using routinely available EHR data from 6 diverse hospitals, we developed 2 pneumonia-specific readmission risk-prediction models that aimed to allow hospitals to identify patients hospitalized with pneumonia at high risk for readmission. Overall, we found that a pneumonia-specific model using EHR data from the entire hospitalization outperformed all other models—including the first-day pneumonia-specific model using data present only on admission, our own multi-condition EHR models, and the CMS pneumonia model based on administrative claims data—in all aspects of model performance (discrimination, calibration, and reclassification). We found that socioeconomic status, prior hospitalizations, thrombocytosis, and measures of clinical severity and stability were important predictors of 30-day all-cause readmissions among patients hospitalized with pneumonia. Additionally, an updated discharge PSI score was a stronger independent predictor of readmissions compared to the PSI score calculated upon admission; and inclusion of the updated PSI in our full-stay pneumonia model led to improved prediction of 30-day readmissions.
The marked improvement in performance of the full-stay pneumonia-specific EHR model compared to the first-day pneumonia-specific model suggests that clinical stability and trajectory during hospitalization (as modeled through disposition status, updated PSI, and vital sign instabilities at discharge) are important predictors of 30-day readmission among patients hospitalized for pneumonia, which was not the case for our EHR-based multi-condition models.19 With the inclusion of these measures, the full-stay pneumonia-specific model correctly reclassified an additional 8% of patients according to their true risk compared to the first-day pneumonia-specific model. One implication of these findings is that hospitals interested in targeting their highest risk individuals with pneumonia for transitional care interventions could do so using the first-day pneumonia-specific EHR model and could refine their targeted strategy at the time of discharge by using the full-stay pneumonia model. This staged risk-prediction strategy would enable hospitals to initiate transitional care interventions for high-risk individuals in the inpatient setting (ie, patient education).7 Then, hospitals could enroll both persistent and newly identified high-risk individuals for outpatient interventions (ie, follow-up telephone call) in the immediate post-discharge period, an interval characterized by heightened vulnerability for adverse events,28 based on patients’ illness severity and stability at discharge. This approach can be implemented by hospitals by building these risk-prediction models directly into the EHR, or by extracting EHR data in near real time as our group has done successfully for heart failure.7
Another key implication of our study is that, for pneumonia, a disease-specific modeling approach has better predictive ability than using a multi-condition model. Compared to multi-condition models, the first-day and full-stay pneumonia-specific EHR models correctly reclassified an additional 6% and 9% of patients, respectively. Thus, hospitals interested in identifying the highest risk patients with pneumonia for targeted interventions should do so using the disease-specific models, if the costs and resources of doing so are within reach of the healthcare system.
An additional novel finding of our study is the added value of an updated PSI for predicting adverse events. Studies of pneumonia severity of illness scores have calculated the PSI and CURB-65 scores using data present only on admission.16,24 While our study also confirms that the PSI calculated upon admission is a significant predictor of readmission,23,29 this study extends this work by showing that an updated PSI score calculated at the time of discharge is an even stronger predictor for readmission, and its inclusion in the model significantly improves risk stratification and prognostication.
Our study was noteworthy for several strengths. First, we used data from a common EHR system, thus potentially allowing for the implementation of the pneumonia-specific models in real time across a number of hospitals. The use of routinely collected data for risk-prediction modeling makes this approach scalable and sustainable, because it obviates the need for burdensome data collection and entry. Second, to our knowledge, this is the first study to measure the additive influence of illness severity and stability at discharge on the readmission risk among patients hospitalized with pneumonia. Third, our study population was derived from 6 hospitals diverse in payer status, age, race/ethnicity, and socioeconomic status. Fourth, our models are less likely to be overfit to the idiosyncrasies of our data given that several predictors included in our final pneumonia-specific models have been associated with readmission in this population, including marital status,13,30 income,11,31 prior hospitalizations,11,13 thrombocytosis,32-34 and vital sign instabilities on discharge.17 Lastly, the discrimination of the CMS pneumonia model in our cohort (C statistic, 0.64) closely matched the discrimination observed in 4 independent cohorts (C statistic, 0.63), suggesting adequate generalizability of our study setting and population.10,12
Our results should be interpreted in the context of several limitations. First, generalizability to other regions beyond north Texas is unknown. Second, although we included a diverse cohort of safety net, community, teaching, and nonteaching hospitals, the pneumonia-specific models were not externally validated in a separate cohort, which may lead to more optimistic estimates of model performance. Third, PSI and CURB-65 scores were modified to use diagnostic codes for altered mental status and pleural effusion, and omitted nursing home residence. Thus, the independent associations for the PSI and CURB-65 scores and their predictive ability are likely attenuated. Fourth, we were unable to include data on medications (antibiotics and steroid use) and outpatient visits, which may influence readmission risk.2,9,13,35-40 Fifth, we included only the first pneumonia hospitalization per patient in this study. Had we included multiple hospitalizations per patient, we anticipate better model performance for the 2 pneumonia-specific EHR models since prior hospitalization was a robust predictor of readmission.
In conclusion, the full-stay pneumonia-specific EHR readmission risk-prediction model outperformed the first-day pneumonia-specific model, multi-condition EHR models, and the CMS pneumonia model. This suggests that: measures of clinical severity and stability at the time of discharge are important predictors for identifying patients at highest risk for readmission; and that EHR data routinely collected for clinical practice can be used to accurately predict risk of readmission among patients hospitalized for pneumonia.
Acknowledgments
The authors would like to acknowledge Ruben Amarasingham, MD, MBA, president and chief executive officer of Parkland Center for Clinical Innovation, and Ferdinand Velasco, MD, chief health information officer at Texas Health Resources for their assistance in assembling the 6-hospital cohort used in this study.
Disclosures
This work was supported by the Agency for Healthcare Research and Quality-funded UT Southwestern Center for Patient-Centered Outcomes Research (R24 HS022418-01); the Commonwealth Foundation (#20100323); the UT Southwestern KL2 Scholars Program supported by the National Institutes of Health (KL2 TR001103 to ANM and OKN); and the National Center for Advancing Translational Sciences at the National Institute of Health (U54 RFA-TR-12-006 to E.A.H.). The study sponsors had no role in design and conduct of the study; collection, management, analysis, and interpretation of the data; and preparation, review, or approval of the manuscript. The authors have no financial conflicts of interest to disclose
Pneumonia is a leading cause of hospitalizations in the U.S., accounting for more than 1.1 million discharges annually.1 Pneumonia is frequently complicated by hospital readmission, which is costly and potentially avoidable.2,3 Due to financial penalties imposed on hospitals for higher than expected 30-day readmission rates, there is increasing attention to implementing interventions to reduce readmissions in this population.4,5 However, because these programs are resource-intensive, interventions are thought to be most cost-effective if they are targeted to high-risk individuals who are most likely to benefit.6-8
Current pneumonia-specific readmission risk-prediction models that could enable identification of high-risk patients suffer from poor predictive ability, greatly limiting their use, and most were validated among older adults or by using data from single academic medical centers, limiting their generalizability.9-14 A potential reason for poor predictive accuracy is the omission of known robust clinical predictors of pneumonia-related outcomes, including pneumonia severity of illness and stability on discharge.15-17 Approaches using electronic health record (EHR) data, which include this clinically granular data, could enable hospitals to more accurately and pragmatically identify high-risk patients during the index hospitalization and enable interventions to be initiated prior to discharge.
An alternative strategy to identifying high-risk patients for readmission is to use a multi-condition risk-prediction model. Developing and implementing models for every condition may be time-consuming and costly. We have derived and validated 2 multi-condition risk-prediction models using EHR data—1 using data from the first day of hospital admission (‘first-day’ model), and the second incorporating data from the entire hospitalization (‘full-stay’ model) to reflect in-hospital complications and clinical stability at discharge.18,19 However, it is unknown if a multi-condition model for pneumonia would perform as well as a disease-specific model.
This study aimed to develop 2 EHR-based pneumonia-specific readmission risk-prediction models using data routinely collected in clinical practice—a ‘first-day’ and a ‘full-stay’ model—and compare the performance of each model to: 1) one another; 2) the corresponding multi-condition EHR model; and 3) to other potentially useful models in predicting pneumonia readmissions (the Centers for Medicare and Medicaid Services [CMS] pneumonia model, and 2 commonly used pneumonia severity of illness scores validated for predicting mortality). We hypothesized that the pneumonia-specific EHR models would outperform other models; and the full-stay pneumonia-specific model would outperform the first-day pneumonia-specific model.
METHODS
Study Design, Population, and Data Sources
We conducted an observational study using EHR data collected from 6 hospitals (including safety net, community, teaching, and nonteaching hospitals) in north Texas between November 2009 and October 2010, All hospitals used the Epic EHR (Epic Systems Corporation, Verona, WI). Details of this cohort have been published.18,19
We included consecutive hospitalizations among adults 18 years and older discharged from any medicine service with principal discharge diagnoses of pneumonia (ICD-9-CM codes 480-483, 485, 486-487), sepsis (ICD-9-CM codes 038, 995.91, 995.92, 785.52), or respiratory failure (ICD-9-CM codes 518.81, 518.82, 518.84, 799.1) when the latter 2 were also accompanied by a secondary diagnosis of pneumonia.20 For individuals with multiple hospitalizations during the study period, we included only the first hospitalization. We excluded individuals who died during the index hospitalization or within 30 days of discharge, were transferred to another acute care facility, or left against medical advice.
Outcomes
The primary outcome was all-cause 30-day readmission, defined as a nonelective hospitalization within 30 days of discharge to any of 75 acute care hospitals within a 100-mile radius of Dallas, ascertained from an all-payer regional hospitalization database.
Predictor Variables for the Pneumonia-Specific Readmission Models
The selection of candidate predictors was informed by our validated multi-condition risk-prediction models using EHR data available within 24 hours of admission (‘first-day’ multi-condition EHR model) or during the entire hospitalization (‘full-stay’ multi-condition EHR model).18,19 For the pneumonia-specific models, we included all variables in our published multi-condition models as candidate predictors, including sociodemographics, prior utilization, Charlson Comorbidity Index, select laboratory and vital sign abnormalities, length of stay, hospital complications (eg, venous thromboembolism), vital sign instabilities, and disposition status (see Supplemental Table 1 for complete list of variables). We also assessed additional variables specific to pneumonia for inclusion that were: (1) available in the EHR of all participating hospitals; (2) routinely collected or available at the time of admission or discharge; and (3) plausible predictors of adverse outcomes based on literature and clinical expertise. These included select comorbidities (eg, psychiatric conditions, chronic lung disease, history of pneumonia),10,11,21,22 the pneumonia severity index (PSI),16,23,24 intensive care unit stay, and receipt of invasive or noninvasive ventilation. We used a modified PSI score because certain data elements were missing. The modified PSI (henceforth referred to as PSI) did not include nursing home residence and included diagnostic codes as proxies for the presence of pleural effusion (ICD-9-CM codes 510, 511.1, and 511.9) and altered mental status (ICD-9-CM codes 780.0X, 780.97, 293.0, 293.1, and 348.3X).
Statistical Analysis
Model Derivation. Candidate predictor variables were classified as available in the EHR within 24 hours of admission and/or at the time of discharge. For example, socioeconomic factors could be ascertained within the first day of hospitalization, whereas length of stay would not be available until the day of discharge. Predictors with missing values were assumed to be normal (less than 1% missing for each variable). Univariate relationships between readmission and each candidate predictor were assessed in the overall cohort using a pre-specified significance threshold of P ≤ 0.10. Significant variables were entered in the respective first-day and full-stay pneumonia-specific multivariable logistic regression models using stepwise-backward selection with a pre-specified significance threshold of P ≤ 0.05. In sensitivity analyses, we alternately derived our models using stepwise-forward selection, as well as stepwise-backward selection minimizing the Bayesian information criterion and Akaike information criterion separately. These alternate modeling strategies yielded identical predictors to our final models.
Model Validation. Model validation was performed using 5-fold cross-validation, with the overall cohort randomly divided into 5 equal-size subsets.25 For each cycle, 4 subsets were used for training to estimate model coefficients, and the fifth subset was used for validation. This cycle was repeated 5 times with each randomly-divided subset used once as the validation set. We repeated this entire process 50 times and averaged the C statistic estimates to derive an optimism-corrected C statistic. Model calibration was assessed qualitatively by comparing predicted to observed probabilities of readmission by quintiles of predicted risk, and with the Hosmer-Lemeshow goodness-of-fit test.
Comparison to Other Models. The main comparisons of the first-day and full-stay pneumonia-specific EHR model performance were to each other and the corresponding multi-condition EHR model.18,19 The multi-condition EHR models were separately derived and validated within the larger parent cohort from which this study cohort was derived, and outperformed the CMS all-cause model, the HOSPITAL model, and the LACE index.19 To further triangulate our findings, given the lack of other rigorously validated pneumonia-specific risk-prediction models for readmission,14 we compared the pneumonia-specific EHR models to the CMS pneumonia model derived from administrative claims data,10 and 2 commonly used risk-prediction scores for short-term mortality among patients with community-acquired pneumonia, the PSI and CURB-65 scores.16 Although derived and validated using patient-level data, the CMS model was developed to benchmark hospitals according to hospital-level readmission rates.10 The CURB-65 score in this study was also modified to include the same altered mental status diagnostic codes according to the modified PSI as a proxy for “confusion.” Both the PSI and CURB-65 scores were calculated using the most abnormal values within the first 24 hours of admission. The ‘updated’ PSI and the ‘updated’ CURB-65 were calculated using the most abnormal values within 24 hours prior to discharge, or the last known observation prior to discharge if no results were recorded within this time period. A complete list of variables for each of the comparison models are shown in Supplemental Table 1.
We assessed model performance by calculating the C statistic, integrated discrimination index, and net reclassification index (NRI) compared to our pneumonia-specific models. The integrated discrimination index is the difference in the mean predicted probability of readmission between patients who were and were not actually readmitted between 2 models, where more positive values suggest improvement in model performance compared to a reference model.26 The NRI is defined as the sum of the net proportions of correctly reclassified persons with and without the event of interest.27 Here, we calculated a category-based NRI to evaluate the performance of pneumonia-specific models in correctly classifying individuals with and without readmissions into the 2 highest readmission risk quintiles vs the lowest 3 risk quintiles compared to other models.27 This pre-specified cutoff is relevant for hospitals interested in identifying the highest risk individuals for targeted intervention.7 Finally, we assessed calibration of comparator models in our cohort by comparing predicted probability to observed probability of readmission by quintiles of risk for each model. We conducted all analyses using Stata 12.1 (StataCorp, College Station, Texas). This study was approved by the University of Texas Southwestern Medical Center Institutional Review Board.
RESULTS
Of 1463 index hospitalizations (Supplemental Figure 1), the 30-day all-cause readmission rate was 13.6%. Individuals with a 30-day readmission had markedly different sociodemographic and clinical characteristics compared to those not readmitted (Table 1; see Supplemental Table 2 for additional clinical characteristics).
Derivation, Validation, and Performance of the Pneumonia-Specific Readmission Risk-Prediction Models
The final first-day pneumonia-specific EHR model included 7 variables, including sociodemographic characteristics; prior hospitalizations; thrombocytosis, and PSI (Table 2). The first-day pneumonia-specific model had adequate discrimination (C statistic, 0.695; optimism-corrected C statistic 0.675, 95% confidence interval [CI], 0.667-0.685; Table 3). It also effectively stratified individuals across a broad range of risk (average predicted decile of risk ranged from 4% to 33%; Table 3) and was well calibrated (Supplemental Table 3).
The final full-stay pneumonia-specific EHR readmission model included 8 predictors, including 3 variables from the first-day model (median income, thrombocytosis, and prior hospitalizations; Table 2). The full-stay pneumonia-specific EHR model also included vital sign instabilities on discharge, updated PSI, and disposition status (ie, being discharged with home health or to a post-acute care facility was associated with greater odds of readmission, and hospice with lower odds). The full-stay pneumonia-specific EHR model had good discrimination (C statistic, 0.731; optimism-corrected C statistic, 0.714; 95% CI, 0.706-0.720), and stratified individuals across a broad range of risk (average predicted decile of risk ranged from 3% to 37%; Table 3), and was also well calibrated (Supplemental Table 3).
First-Day Pneumonia-Specific EHR Model vs First-Day Multi-Condition EHR Model
The first-day pneumonia-specific EHR model outperformed the first-day multi-condition EHR model with better discrimination (P = 0.029) and more correctly classified individuals in the top 2 highest risk quintiles vs the bottom 3 risk quintiles (Table 3, Supplemental Table 4, and Supplemental Figure 2A). With respect to calibration, the first-day multi-condition EHR model overestimated risk among the highest quintile risk group compared to the first-day pneumonia-specific EHR model (Figure 1A, 1B).
Full-Stay Pneumonia-Specific EHR Model vs Other Models
The full-stay pneumonia-specific EHR model comparatively outperformed the corresponding full-stay multi-condition EHR model, as well as the first-day pneumonia-specific EHR model, the CMS pneumonia model, the updated PSI, and the updated CURB-65 (Table 3, Supplemental Table 5, Supplemental Table 6, and Supplemental Figures 2B and 2C). Compared to the full-stay multi-condition and first-day pneumonia-specific EHR models, the full-stay pneumonia-specific EHR model had better discrimination, better reclassification (NRI, 0.09 and 0.08, respectively), and was able to stratify individuals across a broader range of readmission risk (Table 3). It also had better calibration in the highest quintile risk group compared to the full-stay multi-condition EHR model (Figure 1C and 1D).
Updated vs First-Day Modified PSI and CURB-65 Scores
The updated PSI was more strongly predictive of readmission than the PSI calculated on the day of admission (Wald test, 9.83; P = 0.002). Each 10-point increase in the updated PSI was associated with a 22% increased odds of readmission vs an 11% increase for the PSI calculated upon admission (Table 2). The improved predictive ability of the updated PSI and CURB-65 scores was also reflected in the superior discrimination and calibration vs the respective first-day pneumonia severity of illness scores (Table 3).
DISCUSSION
Using routinely available EHR data from 6 diverse hospitals, we developed 2 pneumonia-specific readmission risk-prediction models that aimed to allow hospitals to identify patients hospitalized with pneumonia at high risk for readmission. Overall, we found that a pneumonia-specific model using EHR data from the entire hospitalization outperformed all other models—including the first-day pneumonia-specific model using data present only on admission, our own multi-condition EHR models, and the CMS pneumonia model based on administrative claims data—in all aspects of model performance (discrimination, calibration, and reclassification). We found that socioeconomic status, prior hospitalizations, thrombocytosis, and measures of clinical severity and stability were important predictors of 30-day all-cause readmissions among patients hospitalized with pneumonia. Additionally, an updated discharge PSI score was a stronger independent predictor of readmissions compared to the PSI score calculated upon admission; and inclusion of the updated PSI in our full-stay pneumonia model led to improved prediction of 30-day readmissions.
The marked improvement in performance of the full-stay pneumonia-specific EHR model compared to the first-day pneumonia-specific model suggests that clinical stability and trajectory during hospitalization (as modeled through disposition status, updated PSI, and vital sign instabilities at discharge) are important predictors of 30-day readmission among patients hospitalized for pneumonia, which was not the case for our EHR-based multi-condition models.19 With the inclusion of these measures, the full-stay pneumonia-specific model correctly reclassified an additional 8% of patients according to their true risk compared to the first-day pneumonia-specific model. One implication of these findings is that hospitals interested in targeting their highest risk individuals with pneumonia for transitional care interventions could do so using the first-day pneumonia-specific EHR model and could refine their targeted strategy at the time of discharge by using the full-stay pneumonia model. This staged risk-prediction strategy would enable hospitals to initiate transitional care interventions for high-risk individuals in the inpatient setting (ie, patient education).7 Then, hospitals could enroll both persistent and newly identified high-risk individuals for outpatient interventions (ie, follow-up telephone call) in the immediate post-discharge period, an interval characterized by heightened vulnerability for adverse events,28 based on patients’ illness severity and stability at discharge. This approach can be implemented by hospitals by building these risk-prediction models directly into the EHR, or by extracting EHR data in near real time as our group has done successfully for heart failure.7
Another key implication of our study is that, for pneumonia, a disease-specific modeling approach has better predictive ability than using a multi-condition model. Compared to multi-condition models, the first-day and full-stay pneumonia-specific EHR models correctly reclassified an additional 6% and 9% of patients, respectively. Thus, hospitals interested in identifying the highest risk patients with pneumonia for targeted interventions should do so using the disease-specific models, if the costs and resources of doing so are within reach of the healthcare system.
An additional novel finding of our study is the added value of an updated PSI for predicting adverse events. Studies of pneumonia severity of illness scores have calculated the PSI and CURB-65 scores using data present only on admission.16,24 While our study also confirms that the PSI calculated upon admission is a significant predictor of readmission,23,29 this study extends this work by showing that an updated PSI score calculated at the time of discharge is an even stronger predictor for readmission, and its inclusion in the model significantly improves risk stratification and prognostication.
Our study was noteworthy for several strengths. First, we used data from a common EHR system, thus potentially allowing for the implementation of the pneumonia-specific models in real time across a number of hospitals. The use of routinely collected data for risk-prediction modeling makes this approach scalable and sustainable, because it obviates the need for burdensome data collection and entry. Second, to our knowledge, this is the first study to measure the additive influence of illness severity and stability at discharge on the readmission risk among patients hospitalized with pneumonia. Third, our study population was derived from 6 hospitals diverse in payer status, age, race/ethnicity, and socioeconomic status. Fourth, our models are less likely to be overfit to the idiosyncrasies of our data given that several predictors included in our final pneumonia-specific models have been associated with readmission in this population, including marital status,13,30 income,11,31 prior hospitalizations,11,13 thrombocytosis,32-34 and vital sign instabilities on discharge.17 Lastly, the discrimination of the CMS pneumonia model in our cohort (C statistic, 0.64) closely matched the discrimination observed in 4 independent cohorts (C statistic, 0.63), suggesting adequate generalizability of our study setting and population.10,12
Our results should be interpreted in the context of several limitations. First, generalizability to other regions beyond north Texas is unknown. Second, although we included a diverse cohort of safety net, community, teaching, and nonteaching hospitals, the pneumonia-specific models were not externally validated in a separate cohort, which may lead to more optimistic estimates of model performance. Third, PSI and CURB-65 scores were modified to use diagnostic codes for altered mental status and pleural effusion, and omitted nursing home residence. Thus, the independent associations for the PSI and CURB-65 scores and their predictive ability are likely attenuated. Fourth, we were unable to include data on medications (antibiotics and steroid use) and outpatient visits, which may influence readmission risk.2,9,13,35-40 Fifth, we included only the first pneumonia hospitalization per patient in this study. Had we included multiple hospitalizations per patient, we anticipate better model performance for the 2 pneumonia-specific EHR models since prior hospitalization was a robust predictor of readmission.
In conclusion, the full-stay pneumonia-specific EHR readmission risk-prediction model outperformed the first-day pneumonia-specific model, multi-condition EHR models, and the CMS pneumonia model. This suggests that: measures of clinical severity and stability at the time of discharge are important predictors for identifying patients at highest risk for readmission; and that EHR data routinely collected for clinical practice can be used to accurately predict risk of readmission among patients hospitalized for pneumonia.
Acknowledgments
The authors would like to acknowledge Ruben Amarasingham, MD, MBA, president and chief executive officer of Parkland Center for Clinical Innovation, and Ferdinand Velasco, MD, chief health information officer at Texas Health Resources for their assistance in assembling the 6-hospital cohort used in this study.
Disclosures
This work was supported by the Agency for Healthcare Research and Quality-funded UT Southwestern Center for Patient-Centered Outcomes Research (R24 HS022418-01); the Commonwealth Foundation (#20100323); the UT Southwestern KL2 Scholars Program supported by the National Institutes of Health (KL2 TR001103 to ANM and OKN); and the National Center for Advancing Translational Sciences at the National Institute of Health (U54 RFA-TR-12-006 to E.A.H.). The study sponsors had no role in design and conduct of the study; collection, management, analysis, and interpretation of the data; and preparation, review, or approval of the manuscript. The authors have no financial conflicts of interest to disclose
1. Centers for Disease Control and Prevention. Pneumonia. http://www.cdc.gov/nchs/fastats/pneumonia.htm. Accessed January 26, 2016.
33. Prina E, Ferrer M, Ranzani OT, et al. Thrombocytosis is a marker of poor outcome in community-acquired pneumonia. Chest. 2013;143(3):767-775. PubMed
34. Violi F, Cangemi R, Calvieri C. Pneumonia, thrombosis and vascular disease. J Thromb Haemost. 2014;12(9):1391-1400. PubMed
35. Weinberger M, Oddone EZ, Henderson WG. Does increased access to primary care reduce hospital readmissions? Veterans Affairs Cooperative Study Group on Primary Care and Hospital Readmission. N Engl J Med. 1996;334(22):1441-1447. PubMed
36. Field TS, Ogarek J, Garber L, Reed G, Gurwitz JH. Association of early post-discharge follow-up by a primary care physician and 30-day rehospitalization among older adults. J Gen Intern Med. 2015;30(5):565-571. PubMed
37. Spatz ES, Sheth SD, Gosch KL, et al. Usual source of care and outcomes following acute myocardial infarction. J Gen Intern Med. 2014;29(6):862-869. PubMed
38. Brooke BS, Stone DH, Cronenwett JL, et al. Early primary care provider follow-up and readmission after high-risk surgery. JAMA Surg. 2014;149(8):821-828. PubMed
39. Adamuz J, Viasus D, Campreciós-Rodriguez P, et al. A prospective cohort study of healthcare visits and rehospitalizations after discharge of patients with community-acquired pneumonia. Respirology. 2011;16(7):1119-1126. PubMed
40. Shorr AF, Zilberberg MD, Reichley R, et al. Readmission following hospitalization for pneumonia: the impact of pneumonia type and its implication for hospitals. Clin Infect Dis. 2013;57(3):362-367. PubMed
1. Centers for Disease Control and Prevention. Pneumonia. http://www.cdc.gov/nchs/fastats/pneumonia.htm. Accessed January 26, 2016.
33. Prina E, Ferrer M, Ranzani OT, et al. Thrombocytosis is a marker of poor outcome in community-acquired pneumonia. Chest. 2013;143(3):767-775. PubMed
34. Violi F, Cangemi R, Calvieri C. Pneumonia, thrombosis and vascular disease. J Thromb Haemost. 2014;12(9):1391-1400. PubMed
35. Weinberger M, Oddone EZ, Henderson WG. Does increased access to primary care reduce hospital readmissions? Veterans Affairs Cooperative Study Group on Primary Care and Hospital Readmission. N Engl J Med. 1996;334(22):1441-1447. PubMed
36. Field TS, Ogarek J, Garber L, Reed G, Gurwitz JH. Association of early post-discharge follow-up by a primary care physician and 30-day rehospitalization among older adults. J Gen Intern Med. 2015;30(5):565-571. PubMed
37. Spatz ES, Sheth SD, Gosch KL, et al. Usual source of care and outcomes following acute myocardial infarction. J Gen Intern Med. 2014;29(6):862-869. PubMed
38. Brooke BS, Stone DH, Cronenwett JL, et al. Early primary care provider follow-up and readmission after high-risk surgery. JAMA Surg. 2014;149(8):821-828. PubMed
39. Adamuz J, Viasus D, Campreciós-Rodriguez P, et al. A prospective cohort study of healthcare visits and rehospitalizations after discharge of patients with community-acquired pneumonia. Respirology. 2011;16(7):1119-1126. PubMed
40. Shorr AF, Zilberberg MD, Reichley R, et al. Readmission following hospitalization for pneumonia: the impact of pneumonia type and its implication for hospitals. Clin Infect Dis. 2013;57(3):362-367. PubMed
© 2017 Society of Hospital Medicine
Anxiety in children during a new administration; Why medical psychiatry is vital for my patients; And more
Anxiety in children during a new administration
Since the current administration took office, many children continue to grapple with the initial shock of the election results and the uncertainty of what the next 4 years will bring. In the days after the election, several patients sat in my office and spoke of intense feelings of sadness, anger, and worry. Their stress levels were elevated, and they searched desperately for refuge from the unknown. On the other side of the hospital, patients expressing suicidal ideation filed into the emergency room. A similar scene played out nationally when suicide prevention hotlines experienced a sharp increase in calls.
During this emotional time, it is critical to support our children. Some will be more affected than others. Children from immigrant backgrounds might be particularly fearful of what this means for them and their families. In the days after the election, a video surfaced from a middle school in Michigan featuring kids at lunch chanting, “Build the wall!”
Bullying also is a concern. Despite being a third-generation American, an 8-year-old boy woke up the day after the election confused and scared. One mother told me that a student confronted her 11-year-old son at school, yelling that the election outcome was a “good thing” and he should “go back to his country.” Like his mother, the 11-year-old was born in the United States.
Kids get their cues from the adults in their lives. Parents and teachers play an important role in modeling behavior and providing comfort. Adults need to support children and to do that properly they need make sure they have processed their own feelings. They do not need to be unrealistic or overly positive, but should offer hope and trust in our democratic system. With discussion, children should have ample opportunity to express how they feel. Psychiatrists can evaluate a child’s symptoms and presentation. Are current medications helping enough with the recent changes? Does a child need a medication adjustment or to be seen more often? Does he (she) need to be admitted to the hospital for evaluation of suicidal ideation? As a psychiatrist, do you need to revisit the list of resources in the community and give children a crisis hotline number? Also consider referring a child to a psychotherapist if needed. Some schools offered counseling after the election. It is worthwhile to contact school officials if a student is struggling or could benefit from additional support.
Although many unknowns remain, 1 thing is certain: children will have more questions and we must be ready to answer.
Balkozar S. Adam, MD
Associate Professor of Clinical Psychiatry Child and Adolescent Psychiatry
University of Missouri
Columbia, Missouri
Co-Editor
Missouri Psychiatry Newsletter
Jefferson City, Missouri
Two additional adjunctive therapies for mental health
I was excited to read Dr. Nasrallah’s editorial about adjunctive therapies for mental health disorders (Are you neuroprotecting your patients? 10 Adjunctive therapies to consider,
The article missed 2 important vitamins that play a crucial role in positive mental health treatment outcomes: folic acid and vitamin B12. In my practice, I have found up to 50% of my patients with depression have a vitamin B12 deficiency. After supplementation, these patients’ symptoms improve to the point that we often can reduce or eliminate medication. Folic acid deficiency has been found among individuals with depression and linked to poor response to treatment.1 Higher serum levels of homocysteine—a consequence of low folic acid levels—are linked to increased risk of developing depression later in life, as well as higher risk of cardiovascular disease.2,3 Folate also can be used for enhancing treatment response to antidepressants by increasing production of neurotransmitters.2
Another factor to consider is methylenetetrahydrofolate reductase (MTHFR) variants. Approximately 20% of the population cannot methylate B vitamins because of a variation on the MTHFR gene.4,5 These patients are at increased risk for depression because they are unable to use B vitamins, which are essential in the synthesis of serotonin and dopamine. These patients do not respond to B12 and folate supplements. For these individuals, I recommend methylated products, which can be purchased online.
I have found these practices, as well as many of those listed in the editorial, are effective in treating depression and anxiety.
Lara Kain, PA-C, MPAS
Psychiatric Physician Assistant
Tidewater Psychotherapy Services
Virginia Beach, Virginia
References
1. Kaner G, Soylu M, Yüksel N, et al. Evaluation of nutritional status of patients with depression. Biomed Res Int. 2015;2015:521481. doi: 10.1155/2015/521481.
2. Seppälä J, Koponen H, Kautiainen H, et al. Association between vitamin B12 and melancholic depressive symptoms: a Finnish population-based study. BMC Psychiatry. 2013;13:145. doi: 10.1186/1471-244X-13-145.
3. Petridou ET, Kousoulis AA, Michelakos T, et al. Folate and B12 serum levels in association with depression in the aged: a systemic review and meta-analysis. Aging Ment Health. 2016;20(9):965-973.
4. Lynch B. MTHFR mutations and the conditions they cause. MTHFR.Net. http://mthfr.net/mthfr-mutations-and-the-conditions-they-cause/2011/09/07. Accessed February 16, 2017.
5. Eszlari N, Kovacs D, Petschner P, et al. Distinct effects of folate pathway genes MTHFR and MTHFD1L on ruminative response style: a potential risk mechanism for depression. Transl Psychiatry. 2016;6(3):e745. doi: 10.1038/tp.2016.19.
An honest perspective on Cannabis in therapy
I enjoyed Dr. Nasrallah’s editorial “Maddening therapies: How hallucinogens morphed into novel treatments” (From the
As a psychiatrist specializing in bipolar and psychotic disorders—as well as the founder and Board President of Doctors for Cannabis Regulation—I appreciate his reservations about the potential of Cannabis to trigger psychosis in vulnerable individuals. My reading of the literature is there is good evidence for marijuana as a trigger—not as a cause—of the disease. However, what is the evidence for hallucinogens?
Cannabis can have adverse effects on brain development, but it is not clear whether those effects are worse than those caused by alcohol. In the absence of any head-to-head studies, how can we proceed?
David L. Nathan, MD, DFAPA
Clinical Associate Professor
Rutgers Robert Wood Johnson Medical School
Director of Continuing Medical Education
Princeton HealthCare System
Princeton, New Jersey
Dr. Nasrallah responds
LSD can cause psychosis, paranoid delusions, and altered thinking in addition to vivid visual hallucinations in some individuals but not all, because vulnerability occurs on a spectrum. I postulate that the recently discovered inverse agonist of the serotonin 5-HT2A receptor, pimavanserin (FDA-approved for visual hallucinations and delusions of Parkinson’s disease psychosis), might be effective for LSD psychosis because this hallucinogen has a strong binding affinity to the serotonin 5-HT2A receptors.
Studies show that marijuana can induce apoptosis, which would adversely affect brain development. Patients with schizophrenia who abuse marijuana have a lower gray matter volume than those who do not abuse the drug, and both groups have lower gray matter volume than matched healthy controls. I strongly advise a pregnant woman against smoking marijuana because it could impair the fetus’s brain development.
Henry A. Nasrallah, MD
Professor and Chair
Department of Psychiatry and Behavioral Neuroscience
Saint Louis University School of Medicine
St. Louis, Missouri
Self-administering LSD: Solution or abuse
Dr. Nasrallah’s editorial (From the Editor,
H. Steven Moffic, MD
Retired Tenured Professor of Psychiatry
Medical College of Wisconsin
Milwaukee, Wisconsin
Dr. Nasrallah responds
I am not aware of any systematic data about self-prescribed use of microdoses of LSD to reduce anxiety and depression. Among persons with anxiety and depression who have not had access to psychiatric care, self-medicating with agents such as alcohol, stimulants, ketamine, or LSD is regarded as substance abuse. It also is questionable whether people can determine which microdose of LSD to use. Finally, most drugs of abuse are not “pure,” and many are laced with potentially harmful contaminants.
Henry A. Nasrallah, MD
Professor and Chair
Department of Psychiatry and Behavioral Neuroscience
Saint Louis University School of Medicine
St. Louis, Missouri
Why medical psychiatry is vital for my patients
Dr. Paul Summergrad’s guest editorial “Medical psychiatry: The skill of integrating medical and psychiatric care” (
For me, the most inspiring sentence in Dr. Summergrad’s editorial was, “It is incumbent on us to pursue the medical differential of patients when we think it is needed, even if other physicians disagree.” I believe that this describes our job as physicians who specialize in psychiatry. To have a clinician of Dr. Summergrad’s stature write this was inspiring because it goes to the core of what more of us should do.
Ruth Myers, MD
Psychiatrist
The Community Circle PLLC
Burnsville, Minnesota
Anxiety in children during a new administration
Since the current administration took office, many children continue to grapple with the initial shock of the election results and the uncertainty of what the next 4 years will bring. In the days after the election, several patients sat in my office and spoke of intense feelings of sadness, anger, and worry. Their stress levels were elevated, and they searched desperately for refuge from the unknown. On the other side of the hospital, patients expressing suicidal ideation filed into the emergency room. A similar scene played out nationally when suicide prevention hotlines experienced a sharp increase in calls.
During this emotional time, it is critical to support our children. Some will be more affected than others. Children from immigrant backgrounds might be particularly fearful of what this means for them and their families. In the days after the election, a video surfaced from a middle school in Michigan featuring kids at lunch chanting, “Build the wall!”
Bullying also is a concern. Despite being a third-generation American, an 8-year-old boy woke up the day after the election confused and scared. One mother told me that a student confronted her 11-year-old son at school, yelling that the election outcome was a “good thing” and he should “go back to his country.” Like his mother, the 11-year-old was born in the United States.
Kids get their cues from the adults in their lives. Parents and teachers play an important role in modeling behavior and providing comfort. Adults need to support children and to do that properly they need make sure they have processed their own feelings. They do not need to be unrealistic or overly positive, but should offer hope and trust in our democratic system. With discussion, children should have ample opportunity to express how they feel. Psychiatrists can evaluate a child’s symptoms and presentation. Are current medications helping enough with the recent changes? Does a child need a medication adjustment or to be seen more often? Does he (she) need to be admitted to the hospital for evaluation of suicidal ideation? As a psychiatrist, do you need to revisit the list of resources in the community and give children a crisis hotline number? Also consider referring a child to a psychotherapist if needed. Some schools offered counseling after the election. It is worthwhile to contact school officials if a student is struggling or could benefit from additional support.
Although many unknowns remain, 1 thing is certain: children will have more questions and we must be ready to answer.
Balkozar S. Adam, MD
Associate Professor of Clinical Psychiatry Child and Adolescent Psychiatry
University of Missouri
Columbia, Missouri
Co-Editor
Missouri Psychiatry Newsletter
Jefferson City, Missouri
Two additional adjunctive therapies for mental health
I was excited to read Dr. Nasrallah’s editorial about adjunctive therapies for mental health disorders (Are you neuroprotecting your patients? 10 Adjunctive therapies to consider,
The article missed 2 important vitamins that play a crucial role in positive mental health treatment outcomes: folic acid and vitamin B12. In my practice, I have found up to 50% of my patients with depression have a vitamin B12 deficiency. After supplementation, these patients’ symptoms improve to the point that we often can reduce or eliminate medication. Folic acid deficiency has been found among individuals with depression and linked to poor response to treatment.1 Higher serum levels of homocysteine—a consequence of low folic acid levels—are linked to increased risk of developing depression later in life, as well as higher risk of cardiovascular disease.2,3 Folate also can be used for enhancing treatment response to antidepressants by increasing production of neurotransmitters.2
Another factor to consider is methylenetetrahydrofolate reductase (MTHFR) variants. Approximately 20% of the population cannot methylate B vitamins because of a variation on the MTHFR gene.4,5 These patients are at increased risk for depression because they are unable to use B vitamins, which are essential in the synthesis of serotonin and dopamine. These patients do not respond to B12 and folate supplements. For these individuals, I recommend methylated products, which can be purchased online.
I have found these practices, as well as many of those listed in the editorial, are effective in treating depression and anxiety.
Lara Kain, PA-C, MPAS
Psychiatric Physician Assistant
Tidewater Psychotherapy Services
Virginia Beach, Virginia
References
1. Kaner G, Soylu M, Yüksel N, et al. Evaluation of nutritional status of patients with depression. Biomed Res Int. 2015;2015:521481. doi: 10.1155/2015/521481.
2. Seppälä J, Koponen H, Kautiainen H, et al. Association between vitamin B12 and melancholic depressive symptoms: a Finnish population-based study. BMC Psychiatry. 2013;13:145. doi: 10.1186/1471-244X-13-145.
3. Petridou ET, Kousoulis AA, Michelakos T, et al. Folate and B12 serum levels in association with depression in the aged: a systemic review and meta-analysis. Aging Ment Health. 2016;20(9):965-973.
4. Lynch B. MTHFR mutations and the conditions they cause. MTHFR.Net. http://mthfr.net/mthfr-mutations-and-the-conditions-they-cause/2011/09/07. Accessed February 16, 2017.
5. Eszlari N, Kovacs D, Petschner P, et al. Distinct effects of folate pathway genes MTHFR and MTHFD1L on ruminative response style: a potential risk mechanism for depression. Transl Psychiatry. 2016;6(3):e745. doi: 10.1038/tp.2016.19.
An honest perspective on Cannabis in therapy
I enjoyed Dr. Nasrallah’s editorial “Maddening therapies: How hallucinogens morphed into novel treatments” (From the
As a psychiatrist specializing in bipolar and psychotic disorders—as well as the founder and Board President of Doctors for Cannabis Regulation—I appreciate his reservations about the potential of Cannabis to trigger psychosis in vulnerable individuals. My reading of the literature is there is good evidence for marijuana as a trigger—not as a cause—of the disease. However, what is the evidence for hallucinogens?
Cannabis can have adverse effects on brain development, but it is not clear whether those effects are worse than those caused by alcohol. In the absence of any head-to-head studies, how can we proceed?
David L. Nathan, MD, DFAPA
Clinical Associate Professor
Rutgers Robert Wood Johnson Medical School
Director of Continuing Medical Education
Princeton HealthCare System
Princeton, New Jersey
Dr. Nasrallah responds
LSD can cause psychosis, paranoid delusions, and altered thinking in addition to vivid visual hallucinations in some individuals but not all, because vulnerability occurs on a spectrum. I postulate that the recently discovered inverse agonist of the serotonin 5-HT2A receptor, pimavanserin (FDA-approved for visual hallucinations and delusions of Parkinson’s disease psychosis), might be effective for LSD psychosis because this hallucinogen has a strong binding affinity to the serotonin 5-HT2A receptors.
Studies show that marijuana can induce apoptosis, which would adversely affect brain development. Patients with schizophrenia who abuse marijuana have a lower gray matter volume than those who do not abuse the drug, and both groups have lower gray matter volume than matched healthy controls. I strongly advise a pregnant woman against smoking marijuana because it could impair the fetus’s brain development.
Henry A. Nasrallah, MD
Professor and Chair
Department of Psychiatry and Behavioral Neuroscience
Saint Louis University School of Medicine
St. Louis, Missouri
Self-administering LSD: Solution or abuse
Dr. Nasrallah’s editorial (From the Editor,
H. Steven Moffic, MD
Retired Tenured Professor of Psychiatry
Medical College of Wisconsin
Milwaukee, Wisconsin
Dr. Nasrallah responds
I am not aware of any systematic data about self-prescribed use of microdoses of LSD to reduce anxiety and depression. Among persons with anxiety and depression who have not had access to psychiatric care, self-medicating with agents such as alcohol, stimulants, ketamine, or LSD is regarded as substance abuse. It also is questionable whether people can determine which microdose of LSD to use. Finally, most drugs of abuse are not “pure,” and many are laced with potentially harmful contaminants.
Henry A. Nasrallah, MD
Professor and Chair
Department of Psychiatry and Behavioral Neuroscience
Saint Louis University School of Medicine
St. Louis, Missouri
Why medical psychiatry is vital for my patients
Dr. Paul Summergrad’s guest editorial “Medical psychiatry: The skill of integrating medical and psychiatric care” (
For me, the most inspiring sentence in Dr. Summergrad’s editorial was, “It is incumbent on us to pursue the medical differential of patients when we think it is needed, even if other physicians disagree.” I believe that this describes our job as physicians who specialize in psychiatry. To have a clinician of Dr. Summergrad’s stature write this was inspiring because it goes to the core of what more of us should do.
Ruth Myers, MD
Psychiatrist
The Community Circle PLLC
Burnsville, Minnesota
Anxiety in children during a new administration
Since the current administration took office, many children continue to grapple with the initial shock of the election results and the uncertainty of what the next 4 years will bring. In the days after the election, several patients sat in my office and spoke of intense feelings of sadness, anger, and worry. Their stress levels were elevated, and they searched desperately for refuge from the unknown. On the other side of the hospital, patients expressing suicidal ideation filed into the emergency room. A similar scene played out nationally when suicide prevention hotlines experienced a sharp increase in calls.
During this emotional time, it is critical to support our children. Some will be more affected than others. Children from immigrant backgrounds might be particularly fearful of what this means for them and their families. In the days after the election, a video surfaced from a middle school in Michigan featuring kids at lunch chanting, “Build the wall!”
Bullying also is a concern. Despite being a third-generation American, an 8-year-old boy woke up the day after the election confused and scared. One mother told me that a student confronted her 11-year-old son at school, yelling that the election outcome was a “good thing” and he should “go back to his country.” Like his mother, the 11-year-old was born in the United States.
Kids get their cues from the adults in their lives. Parents and teachers play an important role in modeling behavior and providing comfort. Adults need to support children and to do that properly they need make sure they have processed their own feelings. They do not need to be unrealistic or overly positive, but should offer hope and trust in our democratic system. With discussion, children should have ample opportunity to express how they feel. Psychiatrists can evaluate a child’s symptoms and presentation. Are current medications helping enough with the recent changes? Does a child need a medication adjustment or to be seen more often? Does he (she) need to be admitted to the hospital for evaluation of suicidal ideation? As a psychiatrist, do you need to revisit the list of resources in the community and give children a crisis hotline number? Also consider referring a child to a psychotherapist if needed. Some schools offered counseling after the election. It is worthwhile to contact school officials if a student is struggling or could benefit from additional support.
Although many unknowns remain, 1 thing is certain: children will have more questions and we must be ready to answer.
Balkozar S. Adam, MD
Associate Professor of Clinical Psychiatry Child and Adolescent Psychiatry
University of Missouri
Columbia, Missouri
Co-Editor
Missouri Psychiatry Newsletter
Jefferson City, Missouri
Two additional adjunctive therapies for mental health
I was excited to read Dr. Nasrallah’s editorial about adjunctive therapies for mental health disorders (Are you neuroprotecting your patients? 10 Adjunctive therapies to consider,
The article missed 2 important vitamins that play a crucial role in positive mental health treatment outcomes: folic acid and vitamin B12. In my practice, I have found up to 50% of my patients with depression have a vitamin B12 deficiency. After supplementation, these patients’ symptoms improve to the point that we often can reduce or eliminate medication. Folic acid deficiency has been found among individuals with depression and linked to poor response to treatment.1 Higher serum levels of homocysteine—a consequence of low folic acid levels—are linked to increased risk of developing depression later in life, as well as higher risk of cardiovascular disease.2,3 Folate also can be used for enhancing treatment response to antidepressants by increasing production of neurotransmitters.2
Another factor to consider is methylenetetrahydrofolate reductase (MTHFR) variants. Approximately 20% of the population cannot methylate B vitamins because of a variation on the MTHFR gene.4,5 These patients are at increased risk for depression because they are unable to use B vitamins, which are essential in the synthesis of serotonin and dopamine. These patients do not respond to B12 and folate supplements. For these individuals, I recommend methylated products, which can be purchased online.
I have found these practices, as well as many of those listed in the editorial, are effective in treating depression and anxiety.
Lara Kain, PA-C, MPAS
Psychiatric Physician Assistant
Tidewater Psychotherapy Services
Virginia Beach, Virginia
References
1. Kaner G, Soylu M, Yüksel N, et al. Evaluation of nutritional status of patients with depression. Biomed Res Int. 2015;2015:521481. doi: 10.1155/2015/521481.
2. Seppälä J, Koponen H, Kautiainen H, et al. Association between vitamin B12 and melancholic depressive symptoms: a Finnish population-based study. BMC Psychiatry. 2013;13:145. doi: 10.1186/1471-244X-13-145.
3. Petridou ET, Kousoulis AA, Michelakos T, et al. Folate and B12 serum levels in association with depression in the aged: a systemic review and meta-analysis. Aging Ment Health. 2016;20(9):965-973.
4. Lynch B. MTHFR mutations and the conditions they cause. MTHFR.Net. http://mthfr.net/mthfr-mutations-and-the-conditions-they-cause/2011/09/07. Accessed February 16, 2017.
5. Eszlari N, Kovacs D, Petschner P, et al. Distinct effects of folate pathway genes MTHFR and MTHFD1L on ruminative response style: a potential risk mechanism for depression. Transl Psychiatry. 2016;6(3):e745. doi: 10.1038/tp.2016.19.
An honest perspective on Cannabis in therapy
I enjoyed Dr. Nasrallah’s editorial “Maddening therapies: How hallucinogens morphed into novel treatments” (From the
As a psychiatrist specializing in bipolar and psychotic disorders—as well as the founder and Board President of Doctors for Cannabis Regulation—I appreciate his reservations about the potential of Cannabis to trigger psychosis in vulnerable individuals. My reading of the literature is there is good evidence for marijuana as a trigger—not as a cause—of the disease. However, what is the evidence for hallucinogens?
Cannabis can have adverse effects on brain development, but it is not clear whether those effects are worse than those caused by alcohol. In the absence of any head-to-head studies, how can we proceed?
David L. Nathan, MD, DFAPA
Clinical Associate Professor
Rutgers Robert Wood Johnson Medical School
Director of Continuing Medical Education
Princeton HealthCare System
Princeton, New Jersey
Dr. Nasrallah responds
LSD can cause psychosis, paranoid delusions, and altered thinking in addition to vivid visual hallucinations in some individuals but not all, because vulnerability occurs on a spectrum. I postulate that the recently discovered inverse agonist of the serotonin 5-HT2A receptor, pimavanserin (FDA-approved for visual hallucinations and delusions of Parkinson’s disease psychosis), might be effective for LSD psychosis because this hallucinogen has a strong binding affinity to the serotonin 5-HT2A receptors.
Studies show that marijuana can induce apoptosis, which would adversely affect brain development. Patients with schizophrenia who abuse marijuana have a lower gray matter volume than those who do not abuse the drug, and both groups have lower gray matter volume than matched healthy controls. I strongly advise a pregnant woman against smoking marijuana because it could impair the fetus’s brain development.
Henry A. Nasrallah, MD
Professor and Chair
Department of Psychiatry and Behavioral Neuroscience
Saint Louis University School of Medicine
St. Louis, Missouri
Self-administering LSD: Solution or abuse
Dr. Nasrallah’s editorial (From the Editor,
H. Steven Moffic, MD
Retired Tenured Professor of Psychiatry
Medical College of Wisconsin
Milwaukee, Wisconsin
Dr. Nasrallah responds
I am not aware of any systematic data about self-prescribed use of microdoses of LSD to reduce anxiety and depression. Among persons with anxiety and depression who have not had access to psychiatric care, self-medicating with agents such as alcohol, stimulants, ketamine, or LSD is regarded as substance abuse. It also is questionable whether people can determine which microdose of LSD to use. Finally, most drugs of abuse are not “pure,” and many are laced with potentially harmful contaminants.
Henry A. Nasrallah, MD
Professor and Chair
Department of Psychiatry and Behavioral Neuroscience
Saint Louis University School of Medicine
St. Louis, Missouri
Why medical psychiatry is vital for my patients
Dr. Paul Summergrad’s guest editorial “Medical psychiatry: The skill of integrating medical and psychiatric care” (
For me, the most inspiring sentence in Dr. Summergrad’s editorial was, “It is incumbent on us to pursue the medical differential of patients when we think it is needed, even if other physicians disagree.” I believe that this describes our job as physicians who specialize in psychiatry. To have a clinician of Dr. Summergrad’s stature write this was inspiring because it goes to the core of what more of us should do.
Ruth Myers, MD
Psychiatrist
The Community Circle PLLC
Burnsville, Minnesota