User login
Evaluating automated rules for rapid response system alarm triggers in medical and surgical patients
Patients typically show signs and symptoms of deterioration hours to days prior to cardiorespiratory arrest.1,2 The rate of inhospital cardiorespiratory arrest (CRA) requiring cardiopulmonary resuscitation is estimated to be 0.174 per bed per year in the United States.3 After CRA, survival to discharge is estimated to be as low as 18%.3,4 Efforts to predict and prevent arrest could prove beneficial.1,2
Rapid response systems (RRS) have been proposed as a means of identifying clinical deterioration and facilitating a timely response. These systems were designed to bring clinicians with critical care expertise to the bedside to prevent unnecessary deaths. They typically include an afferent limb (detects deteriorating patients), an efferent limb (responds to calls and acts to avoid further deterioration), and administrative and data analysis limbs.5,6 Automatic provision of recommendations and computer-based systems are desirable components of the afferent limb of the detection system.6 Both are independent predictors of improved clinical practices for clinical decision support systems.7 However, the existing early warning scores (EWS) may not be ready for automation due to low positive predictive values (PPV) and sensitivities.8
It is possible that the low discriminatory accuracy of the published EWS may be secondary to the use of aggregate patient populations for derivation of scores. We hypothesized that these EWS perform differently in medical and in surgical subpopulations. Also, the EWS need to be tested in a time-dependent manner to serve as a realistic clinical support tool for hospitalized patients.
STUDY AIM
The aim of this study was to evaluate the differential performance of widely used EWS in medical vs surgical patients.
METHODS
Site
The study was conducted in an academic center with 2 hospitals in Southeastern Minnesota totaling approximately 1500 general care nonintensive care unit (ICU) beds. The Mayo Clinic Institutional Review Board approved the research proposal.
Subjects
Our retrospective cohort was comprised of all adult inpatients discharged from 2 academic hospitals between January 1, 2011 and December 31, 2011 who spent any time in a general care (non-ICU) unit. We excluded patients younger than 18 years, psychiatric or rehabilitation inpatients, those without research authorization, and patients admitted for research purposes.
Study patients were divided into medical and surgical cohorts. Hospitalizations were considered surgical if patients had surgery at any time during their hospital stay according to billing data. A trigger was an instance in which a patient met the conditions of a specific rule (score/vital sign exceeded the published/defined threshold).
A resuscitation call was defined as a call for cardiopulmonary resuscitation when a patient has a CRA.
An event was an occurrence of 1 of the following in a general care setting: unplanned transfer to the ICU, resuscitation call, or RRS activation.
The RRS activation criteria consisted of an “acute and persistent change” in any 1 or more of the following: oxygen saturations less than 90%, heart rate less than 40 or greater than 130 beats/minute, systolic blood pressure less than 90 mm Hg, or respiratory rate less than 10 or greater than 28 breaths/minute. The RRS activation requires health provider action; they are not electronically generated. Nurses and physicians may also activate the RRS if they are concerned about a patient, even if calling criteria are not met. This is in contrast to the EWS analyzed, which are aggregate composites of multiple parameters. However, whether or not a derangement in vital signs is considered an “acute and persistent change” still involves clinical judgment. Any movement from a general care bed to an ICU bed, or from a general care bed to a procedure area, and from there to an ICU, was considered unplanned. Transfers to the ICU directly from the emergency department or operating room (OR) were not considered as an unplanned transfer and were not included in the analyses.
Coverage time was the period observed for events after a rule was triggered. In this analysis, a coverage time of 24 hours was considered, with a 1-hour look-back. A trigger was counted as a true positive if an event occurred during the following 24 hours. The 1-hour look-back was included to take into account the nursing clinical process of prioritizing a call to the RRS followed by documentation of the altered vital signs that prompted the call.
An episode was the continuous time on the general care floor within a hospitalization, excluding times when a patient was in the OR or ICU. For example, if a patient was admitted to a general bed on a surgery floor, subsequently went to the OR, and then returned to the surgery floor, the 2 episodes were considered separate: the time on the floor before surgery, and the time on the floor after surgery.
Assessment of implementation of RRS in our hospitals showed a significant drop in the failure-to-rescue rate (issues considered related to delay or failure to identify or intervene appropriately when a patient was deteriorating, as identified through mortality review) and a decrease in non-ICU mortality.9,10 This suggests that our current process captures many of the relevant episodes of acute deterioration when a rapid response team is needed and supports using RRS activation as outcomes.
Data Sources
We developed a time-stamped longitudinal database of patient data from the electronic health record, including vital signs, laboratory test results, demographics (age, sex), administrative data (including length of stay), comorbidities, resuscitation code status, location in hospital, and at the minute level throughout each patient’s hospital stay. Physiologically impossible values (eg, blood pressures of 1200 mm Hg) were considered entered in error and eliminated from the database. Time spent in the OR or ICU was excluded because RRS activation would not be applied in these already highly monitored areas. SAS Statistical software (SAS Institute Inc. Cary, North Carolina) was used for database creation.
We applied the current RRS calling criteria in our institution and calculated the Kirkland score,11 along with some of the most widely used early warning scores:12 Modified Early Warning System (MEWS),13 Standardized Early Warning Scoring System (SEWS),14 Global Modified Early Warning Score (GMEWS),15 Worthing physiologic scoring system,16 National Early Warning Score (NEWS),17 and VitaPAC Early Warning Score (ViEWS).18 Published thresholds for these scores were used to create rule triggers in the data. Once a trigger was created to calculate the number of false positives and true positives, all subsequent triggers were ignored until the end of the episode or until 24 hours elapsed. We calculated triggers in a rolling fashion throughout the episodes of care. The EWS score was updated every time a new parameter was entered into the analytical electronic health record, and the most recent value for each was used to calculate the score. SAS statistical software was used for calculation of scores and identification of outcomes.
For our analysis, events were treated as dependent variables, and triggers were independent variables. We calculated the score for each EWS to the minute level throughout our retrospective database. If the score for a specific EWS was higher than the published/recommended threshold for that EWS, an alert was considered to have been issued, and the patient was followed for 24 hours. If the patient had an event in the subsequent 24 hours, or 1 hour before (1-hour look-back), the alert was considered a true positive; if not, a false positive. Events that were not preceded by an alert were false negatives, and 24-hour intervals without either an alert or an event were considered true negatives. This simulation exercise was performed for each EWS in both subcohorts (medical and surgical). Clusters of RRS calls followed by transfers to the ICU within 3 hours were considered as a single adverse event (RRS calls, as it was the first event to occur) to avoid double counting. We have described how well this simulation methodology,8 correlates with results from prospective studies.19
Statistical Analysis
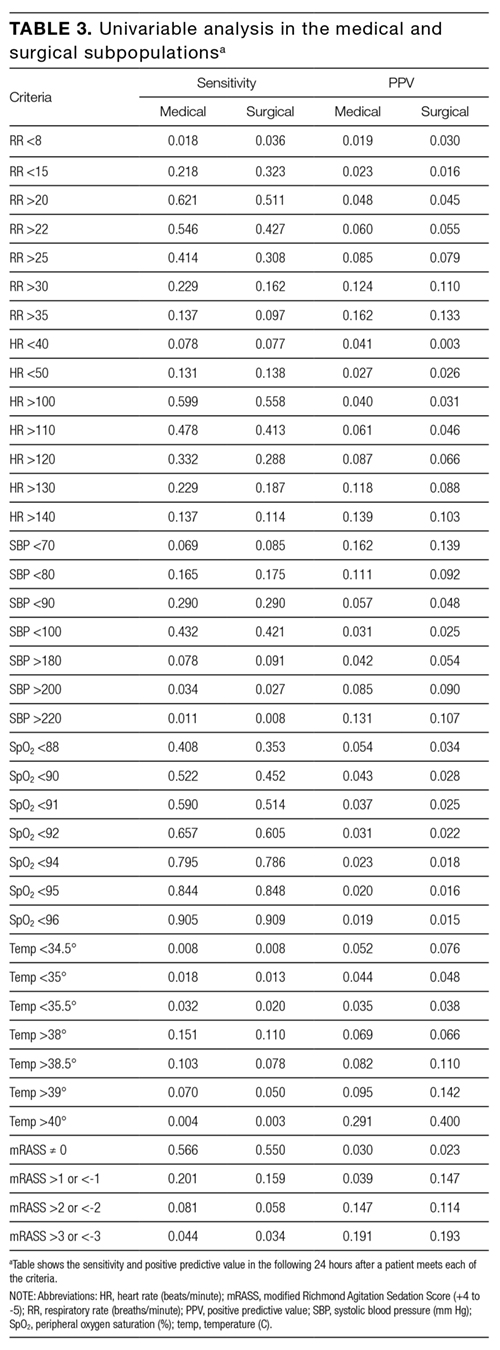
To calculate whether results were statistically significant for subgroups, a jackknife method of calculating variance20 was used. The jackknife method calculates variance by repeating the calculations of the statistic leaving out 1 sample at a time. In our case, we repeated the calculation of sensitivity and PPV leaving out 1 patient at a time. Once the simulation method had been run and the false/true positives/negatives had been assigned, calculation of each metric (PPV and sensitivity) was repeated for n subsamples, each leaving out 1 patient. The variance was calculated and 2 Student t tests were performed for each EWS: 1 for PPV and another for sensitivity. SAS statistical software v 9.3 was used for the simulation analysis; R statistical software v 3.0.2 (The R Foundation, Vienna, Austria) was used for the calculation of the statistical significance of results. A univariable analysis was also performed to assess the sensitivity and PPVs for the published thresholds of the most common variables in each EWS: respiratory rate, systolic blood pressure, heart rate, temperature, and mental status as measured by the modified Richmond Agitation Sedation Score.21
RESULTS
The initial cohort included 60,020 hospitalizations, of which the following were excluded: 2751 because of a lack of appropriate research authorization; 6433 because the patients were younger than 18 years; 2129 as psychiatric admissions; 284 as rehabilitation admissions; 872 as research purposes-only admissions; and 1185 because the patient was never in a general care bed (eg, they were either admitted directly to the ICU, or they were admitted for an outpatient surgical procedure and spent time in the postanesthesia care unit).
Table 1 summarizes patient and trigger characteristics, overall and by subgroup. The final cohort included 75,240 total episodes in 46,366 hospitalizations, from 34,898 unique patients, of which 48.7% were male. There were 23,831 medical and 22,535 surgical hospitalizations. Median length of episode was 2 days both for medical and surgical patients. Median length of stay was 3 days, both for medical and for surgical patients.
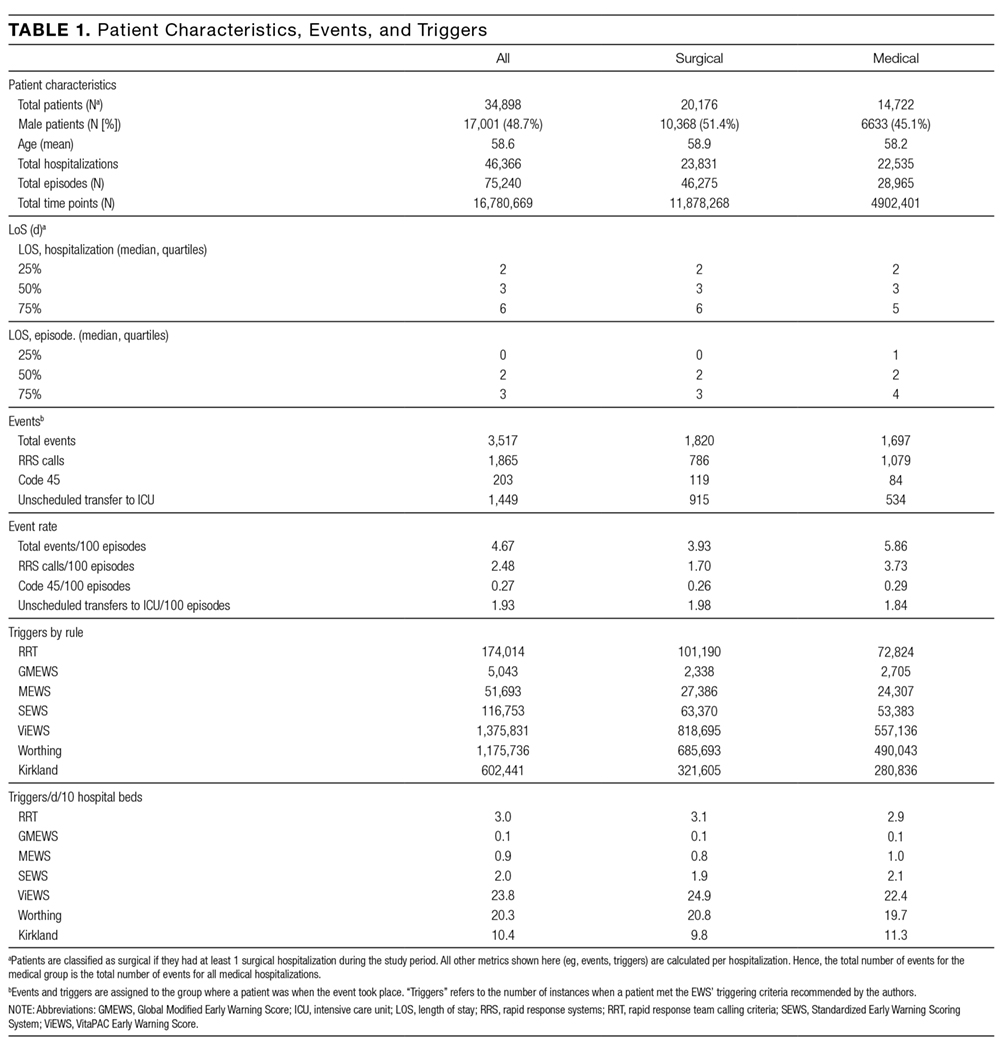
There were 3332 events in total, of which 1709 were RRS calls, 185 were resuscitation calls, and 1438 were unscheduled transfers to the ICU. The rate of events was 4.67 events per 100 episodes in the aggregate adult population. There were 3.93 events per 100 episodes for surgical hospitalizations, and 5.86 events per 100 episodes for medical hospitalizations (P < .001). The number of CRAs in our cohort was 0.27 per 100 episodes, 0.128 per hospital bed per year, or 4.37 per 1000 hospital admissions, similar to other reported numbers in the literature.3, 22,23
The total number of EWS triggers varied greatly between EWS rules, with the volume ranging during the study year from 1363 triggers with the GMEWS rule to 77,711 triggers with the ViEWS score.
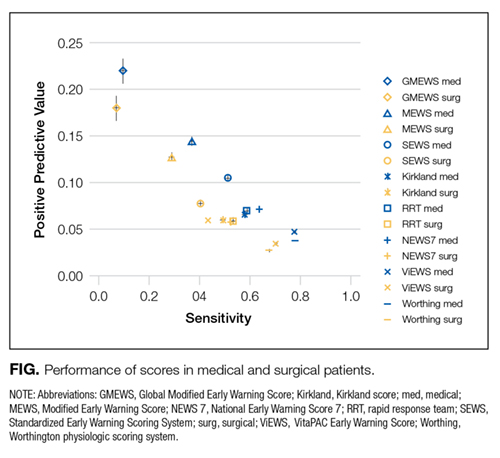
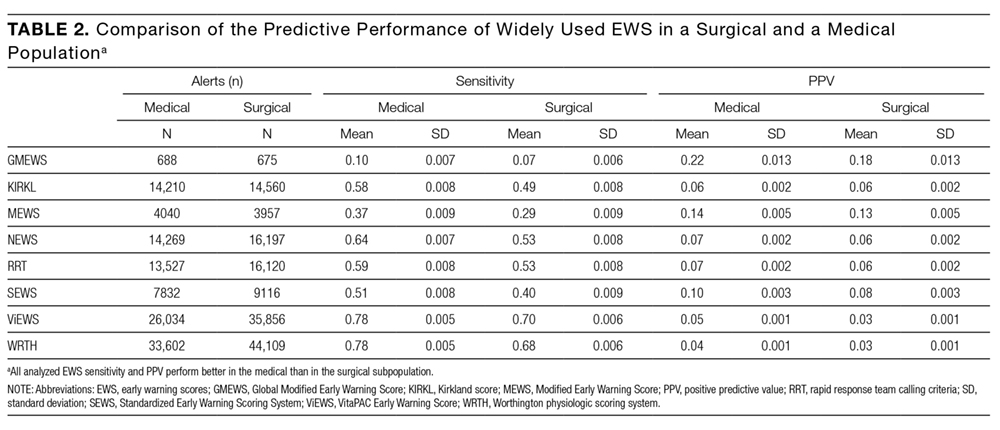
All scores had PPVs less than 25%. As seen in Table 2 and shown graphically in the Figure, all scores performed better on medical patients (blue) than on surgical patients (yellow). The P value was < .0001 for both PPV and sensitivity. The Worthing score had the highest sensitivity (0.78 for medical and 0.68 for surgical) but a very low PPV (0.04 for medical and 0.03 for surgical), while GMEWS was the opposite: low sensitivity (0.10 and 0.07) but the highest PPV (0.22 and 0.18).
The results of the univariable analysis can be seen in Table 3. Most of the criteria performed better (higher sensitivity and PPV) as predictors in the medical hospitalizations than in the surgical hospitalizations.
DISCUSSION
We hypothesized that EWS may perform differently when applied to medical rather than surgical patients. Studies had not analyzed this in a time-dependent manner,24-26 which limited the applicability of the results.8
All analyzed scores performed better in medical patients than in surgical patients (Figure). This could reflect a behavioral difference by the teams on surgical and medical floors in the decision to activate the RRS, or a bias of the clinicians who designed the scores (mostly nonsurgeons). The difference could also mean that physiological deteriorations are intrinsically different in patients who have undergone anesthesia and surgery. For example, in surgical patients, a bleeding episode is more likely to be the cause of their physiological deterioration, or the lingering effects of anesthesia could mask underlying deterioration. Such patients would benefit from scores where variables such as heart rate, blood pressure, or hemoglobin had more influence.
When comparing the different scores, it was much easier for a patient to meet the alerting score with the Worthing score than with GMEWS. In the Worthing score, a respiratory rate greater than 22 breaths per minute, or a systolic blood pressure less than 100 mm Hg, already meet alerting criteria. Similar vital signs result in 0 and 1 points (respectively) in GMEWS, far from its alerting score of 5. This reflects the intrinsic tradeoff of EWS: as the threshold for considering a patient “at risk” drops, not only does the number of true positives (and the sensitivity) increase, but also the number of false positives, thus lowering the PPV.
However, none of the scores analyzed were considered to perform well based on their PPV and sensitivity, particularly in the surgical subpopulation. Focusing on another metric, the area under the receiver operator curve can give misleadingly optimistic results.24,27 However, the extremely low prevalence of acute physiological deterioration can produce low PPVs even when specificity seems acceptable, which is why it is important to evaluate PPV directly.28
To use EWS effectively to activate RRS, they need to be combined with clinical judgment to avoid high levels of false alerts, particularly in surgical patients. It has been reported that RRS is activated only 30% of the time a patient meets RRS calling criteria.29 While there may be cultural characteristics inhibiting the decision to call,30 our study hints at another explanation: if RRS was activated every time a patient met calling criteria based on the scores analyzed, the number of RRS calls would be very high and difficult to manage. So health providers may be doing the right thing when “filtering” RRS calls and not applying the criteria strictly, but in conjunction with clinical judgment.
A limitation of any study like this is how to define “acute physiological deterioration.” We defined an event as recognized episodes of acute physiological deterioration that are signaled by escalations of care (eg, RRS, resuscitation calls, or transfers to an ICU) or unexpected death. By definition, our calculated PPV is affected by clinicians’ recognition of clinical deteriorations. This definition, common in the literature, has the limitation of potentially underestimating EWS’ performance by missing some events that are resolved by the primary care team without an escalation of care. However, we believe our interpretation is not unreasonable since the purpose of EWS is to trigger escalations of care in a timely fashion. Prospective studies could define an event in a way that is less affected by the clinicians’ judgment.
Regarding patient demographics, age was similar between the 2 groups (average, 58.2 years for medical vs 58.9 years for surgical), and there was only a small difference in gender ratios (45.1% male in the medical vs 51.4% in the surgical group). These differences are unlikely to have affected the results significantly, but unknown differences in demographics or other patient characteristics between groups may account for differences in score performance between surgical and medical patients.
Several of the EWS analyzed had overlapping trigger criteria with our own RRS activation criteria (although as single-parameter triggers and not as aggregate). To test how these potential biases could affect our results, we performed a post hoc sensitivity analysis eliminating calls to the RRS as an outcome (so using the alternative outcome of unexpected transfers to the ICU and resuscitation calls). The results are similar to those of our main analysis, with all analyzed scores having lower sensitivity and PPV in surgical hospitalizations when compared to medical hospitalizations.
Our study suggests that, to optimize detection of physiological deterioration events, EWS should try to take into account different patient types, with the most basic distinction being surgical vs medical. This tailoring will make EWS more complex, and less suited for paper-based calculation, but new electronic health records are increasingly able to incorporate decision support, and some EWS have been developed for electronic calculation only. Of particular interest in this regard is the score developed by Escobar et al,31 which groups patients into categories according to the reason for admission, and calculates a different subscore based on that category. While the score by Escobar et al. does not split patients based on medical or surgical status, a more general interpretation of our results suggests that a score may be more accurate if it classifies patients into subgroups with different subscores. This seems to be confirmed by the fact that the score by Escobar et al performs better than MEWS.28 Unfortunately, the paper describing it does not provide enough detail to use it in our database.
A recent systematic review showed increasing evidence that RRS may be effective in reducing CRAs occurring in a non-ICU setting and, more important, overall inhospital mortality.32 While differing implementation strategies (eg, different length of the educational effort, changes in the frequency of vital signs monitoring) can impact the success of such an initiative, it has been speculated that the afferent limb (which often includes an EWS) might be the most critical part of the system.33 Our results show that the most widely used EWS perform significantly worse on surgical patients, and suggest that a way to improve the accuracy of EWS would be to tailor the risk calculation to different patient subgroups (eg, medical and surgical patients). Plausible next steps would be to demonstrate that tailoring risk calculation to medical and surgical patients separately can improve risk predictions and accuracy of EWS.
Disclosure
The authors report no financial conflicts of interest.
1. Buist MD, Jarmolowski E, Burton PR, Bernard SA, Waxman BP, Anderson J. Recognising clinical instability in hospital patients before cardiac arrest or unplanned admission to intensive care. A pilot study in a tertiary-care hospital. Med J Aust. 1999; 171(1):22-25. PubMed
2. Schein RM, Hazday N, Pena M, Ruben BH, Sprung CL. Clinical antecedents to in-hospital cardiopulmonary arrest. Chest. 1990;98(6):1388-1392. PubMed
3. Peberdy MA, Kaye W, Ornato JP, Larkin GL, Nadkarni V, Mancini ME, et al. Cardiopulmonary resuscitation of adults in the hospital: a report of 14720 cardiac arrests from the National Registry of Cardiopulmonary Resuscitation. Resuscitation. 2003; 58(3):297-308. PubMed
4. Nadkarni VM, Larkin GL, Peberdy MA, Carey SM, Kaye W, Mancini ME, et al. First documented rhythm and clinical outcome from in-hospital cardiac arrest among children and adults. JAMA. 2006;295(1):50-57. PubMed
5. Devita MA, Bellomo R, Hillman K, Kellum J, Rotondi A, Teres D, et al. Findings of the first consensus conference on medical emergency teams. Crit Care Med. 2006;34(9):2463-2478. PubMed
6. DeVita MA, Smith GB, Adam SK, Adams-Pizarro I, Buist M, Bellomo R, et al. “Identifying the hospitalised patient in crisis”--a consensus conference on the afferent limb of rapid response systems. Resuscitation. 2010;81(4):375-382. PubMed
7. Kawamoto K, Houlihan CA, Balas EA, Lobach DF. Improving clinical practice using clinical decision support systems: a systematic review of trials to identify features critical to success. BMJ. 2005;330(7494):765. PubMed
8. Romero-Brufau S, Huddleston JM, Naessens JM, Johnson MG, Hickman J, Morlan BW, et al. Widely used track and trigger scores: are they ready for automation in practice? Resuscitation. 2014;85(4):549-552. PubMed
9. Huddleston JM, Diedrich DA, Kinsey GC, Enzler MJ, Manning DM. Learning from every death. J Patient Saf. 2014;10(1):6-12. PubMed
10. Moriarty JP, Schiebel NE, Johnson MG, Jensen JB, Caples SM, Morlan BW, et al. Evaluating implementation of a rapid response team: considering alternative outcome measures. Int J Qual Health Care. 2014;26(1):49-57. PubMed
11. Kirkland LL, Malinchoc M, O’Byrne M, Benson JT, Kashiwagi DT, Burton MC, et al. A clinical deterioration prediction tool for internal medicine patients. Am J Med Qual. 2013;28(2):135-142. PubMed
12. Griffiths JR, Kidney EM. Current use of early warning scores in UK emergency departments. Emerg Med J. 2012;29(1):65-66. PubMed
13. Subbe CP, Kruger M, Rutherford P, Gemmel L. Validation of a modified Early Warning Score in medical admissions. QJM. 2001;94(10):521-526. PubMed
14. Paterson R, MacLeod DC, Thetford D, Beattie A, Graham C, Lam S, et al.. Prediction of in-hospital mortality and length of stay using an early warning scoring system: clinical audit. Clin Med (Lond). 2006;6(3):281-284. PubMed
15. Harrison GA, Jacques T, McLaws ML, Kilborn G. Combinations of early signs of critical illness predict in-hospital death–the SOCCER study (signs of critical conditions and emergency responses). Resuscitation. 2006;71(3):327-334. PubMed
16. Duckitt RW, Buxton-Thomas R, Walker J, Cheek E, Bewick V, Venn R, et al. Worthing physiological scoring system: derivation and validation of a physiological early-warning system for medical admissions. An observational, population-based single-centre study. Br J Anaesth. 2007; 98(6):769-774. PubMed
17. Smith GB, Prytherch DR, Meredith P, Schmidt PE, Featherstone PI. The ability of the National Early Warning Score (NEWS) to discriminate patients at risk of early cardiac arrest, unanticipated intensive care unit admission, and death. Resuscitation. 2013;84(4):465-470. PubMed
18. Prytherch DR, Smith GB, Schmidt PE, Featherstone PI. ViEWS--Towards a national early warning score for detecting adult inpatient deterioration. Resuscitation. 2010;81(8):932-937. PubMed
19. Romero-Brufau S, Huddleston JM. Reply to letter: widely used track and trigger scores: are they ready for automation in practice? Resuscitation. 2014;85(10):e159. PubMed
20. Efron B, Stein C. The jackknife estimate of variance. Annals of Statistics. 1981;586-596.
21. Sessler CN, Gosnell MS, Grap MJ, Brophy GM, O’Neal PV, Keane KA, et al. The Richmond Agitation-Sedation Scale: validity and reliability in adult intensive care unit patients. Am J Respir Crit Care Med. 2002;166(10):1338-1344. PubMed
22. DeVita MA, Braithwaite RS, Mahidhara R, Stuart S, Foraida M, Simmons RL. Medical Emergency Response Improvement Team (MERIT). Use of medical emergency team responses to reduce hospital cardiopulmonary arrests. Qual Saf Health Care. 2004;13(4):251-254. PubMed
23. Goncales PD, Polessi JA, Bass LM, Santos Gde P, Yokota PK, Laselva CR, et al. Reduced frequency of cardiopulmonary arrests by rapid response teams. Einstein (Sao Paulo). 2012;10(4):442-448. PubMed
24. Cuthbertson BH, Boroujerdi M, McKie L, Aucott L, Prescott G. Can physiological variables and early warning scoring systems allow early recognition of the deteriorating surgical patient? Crit Care Med. 2007;35(2):402-409. PubMed
25. Gardner-Thorpe J, Love N, Wrightson J, Walsh S, Keeling N. The value of Modified Early Warning Score (MEWS) in surgical in-patients: a prospective observational study. Ann R Coll Surg Engl. 2006;88(6):571-575. PubMed
26. Stenhouse C, Coates S, Tivey M, Allsop P, Parker T. Prospective evaluation of a modified Early Warning Score to aid earlier detection of patients developing critical illness on a general surgical ward. British Journal of Anaesthesia. 2000;84(5):663-663.
27. Smith GB, Prytherch DR, Schmidt PE, Featherstone PI. Review and performance evaluation of aggregate weighted ‘track and trigger’ systems. Resuscitation. 2008;77(2):170-179. PubMed
28. Romero-Brufau S, Huddleston JM, Escobar GJ, Liebow M. Why the C-statistic is not informative to evaluate early warning scores and what metrics to use. Crit Care. 2015; 19:285. PubMed
29. Hillman K, Chen J, Cretikos M, Bellomo R, Brown D, Doig G, et al. Introduction of the medical emergency team (MET) system: a cluster-randomised controlled trial. Lancet. 2005;365(9477):2091-2097. PubMed
30. Shearer B, Marshall S, Buist MD, Finnigan M, Kitto S, Hore T, et al. What stops hospital clinical staff from following protocols? An analysis of the incidence and factors behind the failure of bedside clinical staff to activate the rapid response system in a multi-campus Australian metropolitan healthcare service. BMJ Qual Saf. 2012;21(7):569-575. PubMed
31. Escobar GJ, LaGuardia JC, Turk BJ, Ragins A, Kipnis P, Draper D. Early detection of impending physiologic deterioration among patients who are not in intensive care: development of predictive models using data from an automated electronic medical record. J Hosp Med. 2012;7(5):388-395. PubMed
32. Winters BD, Weaver SJ, Pfoh ER, Yang T, Pham JC, Dy SM. Rapid-response systems as a patient safety strategy: a systematic review. Ann Intern Med. 2013;158(5 pt 2):417-425. PubMed
33. Jones DA, DeVita MA, Bellomo R. Rapid-response teams. N Engl J Med. 2011;365(2):139-146. PubMed
Patients typically show signs and symptoms of deterioration hours to days prior to cardiorespiratory arrest.1,2 The rate of inhospital cardiorespiratory arrest (CRA) requiring cardiopulmonary resuscitation is estimated to be 0.174 per bed per year in the United States.3 After CRA, survival to discharge is estimated to be as low as 18%.3,4 Efforts to predict and prevent arrest could prove beneficial.1,2
Rapid response systems (RRS) have been proposed as a means of identifying clinical deterioration and facilitating a timely response. These systems were designed to bring clinicians with critical care expertise to the bedside to prevent unnecessary deaths. They typically include an afferent limb (detects deteriorating patients), an efferent limb (responds to calls and acts to avoid further deterioration), and administrative and data analysis limbs.5,6 Automatic provision of recommendations and computer-based systems are desirable components of the afferent limb of the detection system.6 Both are independent predictors of improved clinical practices for clinical decision support systems.7 However, the existing early warning scores (EWS) may not be ready for automation due to low positive predictive values (PPV) and sensitivities.8
It is possible that the low discriminatory accuracy of the published EWS may be secondary to the use of aggregate patient populations for derivation of scores. We hypothesized that these EWS perform differently in medical and in surgical subpopulations. Also, the EWS need to be tested in a time-dependent manner to serve as a realistic clinical support tool for hospitalized patients.
STUDY AIM
The aim of this study was to evaluate the differential performance of widely used EWS in medical vs surgical patients.
METHODS
Site
The study was conducted in an academic center with 2 hospitals in Southeastern Minnesota totaling approximately 1500 general care nonintensive care unit (ICU) beds. The Mayo Clinic Institutional Review Board approved the research proposal.
Subjects
Our retrospective cohort was comprised of all adult inpatients discharged from 2 academic hospitals between January 1, 2011 and December 31, 2011 who spent any time in a general care (non-ICU) unit. We excluded patients younger than 18 years, psychiatric or rehabilitation inpatients, those without research authorization, and patients admitted for research purposes.
Study patients were divided into medical and surgical cohorts. Hospitalizations were considered surgical if patients had surgery at any time during their hospital stay according to billing data. A trigger was an instance in which a patient met the conditions of a specific rule (score/vital sign exceeded the published/defined threshold).
A resuscitation call was defined as a call for cardiopulmonary resuscitation when a patient has a CRA.
An event was an occurrence of 1 of the following in a general care setting: unplanned transfer to the ICU, resuscitation call, or RRS activation.
The RRS activation criteria consisted of an “acute and persistent change” in any 1 or more of the following: oxygen saturations less than 90%, heart rate less than 40 or greater than 130 beats/minute, systolic blood pressure less than 90 mm Hg, or respiratory rate less than 10 or greater than 28 breaths/minute. The RRS activation requires health provider action; they are not electronically generated. Nurses and physicians may also activate the RRS if they are concerned about a patient, even if calling criteria are not met. This is in contrast to the EWS analyzed, which are aggregate composites of multiple parameters. However, whether or not a derangement in vital signs is considered an “acute and persistent change” still involves clinical judgment. Any movement from a general care bed to an ICU bed, or from a general care bed to a procedure area, and from there to an ICU, was considered unplanned. Transfers to the ICU directly from the emergency department or operating room (OR) were not considered as an unplanned transfer and were not included in the analyses.
Coverage time was the period observed for events after a rule was triggered. In this analysis, a coverage time of 24 hours was considered, with a 1-hour look-back. A trigger was counted as a true positive if an event occurred during the following 24 hours. The 1-hour look-back was included to take into account the nursing clinical process of prioritizing a call to the RRS followed by documentation of the altered vital signs that prompted the call.
An episode was the continuous time on the general care floor within a hospitalization, excluding times when a patient was in the OR or ICU. For example, if a patient was admitted to a general bed on a surgery floor, subsequently went to the OR, and then returned to the surgery floor, the 2 episodes were considered separate: the time on the floor before surgery, and the time on the floor after surgery.
Assessment of implementation of RRS in our hospitals showed a significant drop in the failure-to-rescue rate (issues considered related to delay or failure to identify or intervene appropriately when a patient was deteriorating, as identified through mortality review) and a decrease in non-ICU mortality.9,10 This suggests that our current process captures many of the relevant episodes of acute deterioration when a rapid response team is needed and supports using RRS activation as outcomes.
Data Sources
We developed a time-stamped longitudinal database of patient data from the electronic health record, including vital signs, laboratory test results, demographics (age, sex), administrative data (including length of stay), comorbidities, resuscitation code status, location in hospital, and at the minute level throughout each patient’s hospital stay. Physiologically impossible values (eg, blood pressures of 1200 mm Hg) were considered entered in error and eliminated from the database. Time spent in the OR or ICU was excluded because RRS activation would not be applied in these already highly monitored areas. SAS Statistical software (SAS Institute Inc. Cary, North Carolina) was used for database creation.
We applied the current RRS calling criteria in our institution and calculated the Kirkland score,11 along with some of the most widely used early warning scores:12 Modified Early Warning System (MEWS),13 Standardized Early Warning Scoring System (SEWS),14 Global Modified Early Warning Score (GMEWS),15 Worthing physiologic scoring system,16 National Early Warning Score (NEWS),17 and VitaPAC Early Warning Score (ViEWS).18 Published thresholds for these scores were used to create rule triggers in the data. Once a trigger was created to calculate the number of false positives and true positives, all subsequent triggers were ignored until the end of the episode or until 24 hours elapsed. We calculated triggers in a rolling fashion throughout the episodes of care. The EWS score was updated every time a new parameter was entered into the analytical electronic health record, and the most recent value for each was used to calculate the score. SAS statistical software was used for calculation of scores and identification of outcomes.
For our analysis, events were treated as dependent variables, and triggers were independent variables. We calculated the score for each EWS to the minute level throughout our retrospective database. If the score for a specific EWS was higher than the published/recommended threshold for that EWS, an alert was considered to have been issued, and the patient was followed for 24 hours. If the patient had an event in the subsequent 24 hours, or 1 hour before (1-hour look-back), the alert was considered a true positive; if not, a false positive. Events that were not preceded by an alert were false negatives, and 24-hour intervals without either an alert or an event were considered true negatives. This simulation exercise was performed for each EWS in both subcohorts (medical and surgical). Clusters of RRS calls followed by transfers to the ICU within 3 hours were considered as a single adverse event (RRS calls, as it was the first event to occur) to avoid double counting. We have described how well this simulation methodology,8 correlates with results from prospective studies.19
Statistical Analysis
To calculate whether results were statistically significant for subgroups, a jackknife method of calculating variance20 was used. The jackknife method calculates variance by repeating the calculations of the statistic leaving out 1 sample at a time. In our case, we repeated the calculation of sensitivity and PPV leaving out 1 patient at a time. Once the simulation method had been run and the false/true positives/negatives had been assigned, calculation of each metric (PPV and sensitivity) was repeated for n subsamples, each leaving out 1 patient. The variance was calculated and 2 Student t tests were performed for each EWS: 1 for PPV and another for sensitivity. SAS statistical software v 9.3 was used for the simulation analysis; R statistical software v 3.0.2 (The R Foundation, Vienna, Austria) was used for the calculation of the statistical significance of results. A univariable analysis was also performed to assess the sensitivity and PPVs for the published thresholds of the most common variables in each EWS: respiratory rate, systolic blood pressure, heart rate, temperature, and mental status as measured by the modified Richmond Agitation Sedation Score.21
RESULTS
The initial cohort included 60,020 hospitalizations, of which the following were excluded: 2751 because of a lack of appropriate research authorization; 6433 because the patients were younger than 18 years; 2129 as psychiatric admissions; 284 as rehabilitation admissions; 872 as research purposes-only admissions; and 1185 because the patient was never in a general care bed (eg, they were either admitted directly to the ICU, or they were admitted for an outpatient surgical procedure and spent time in the postanesthesia care unit).
Table 1 summarizes patient and trigger characteristics, overall and by subgroup. The final cohort included 75,240 total episodes in 46,366 hospitalizations, from 34,898 unique patients, of which 48.7% were male. There were 23,831 medical and 22,535 surgical hospitalizations. Median length of episode was 2 days both for medical and surgical patients. Median length of stay was 3 days, both for medical and for surgical patients.
There were 3332 events in total, of which 1709 were RRS calls, 185 were resuscitation calls, and 1438 were unscheduled transfers to the ICU. The rate of events was 4.67 events per 100 episodes in the aggregate adult population. There were 3.93 events per 100 episodes for surgical hospitalizations, and 5.86 events per 100 episodes for medical hospitalizations (P < .001). The number of CRAs in our cohort was 0.27 per 100 episodes, 0.128 per hospital bed per year, or 4.37 per 1000 hospital admissions, similar to other reported numbers in the literature.3, 22,23
The total number of EWS triggers varied greatly between EWS rules, with the volume ranging during the study year from 1363 triggers with the GMEWS rule to 77,711 triggers with the ViEWS score.
All scores had PPVs less than 25%. As seen in Table 2 and shown graphically in the Figure, all scores performed better on medical patients (blue) than on surgical patients (yellow). The P value was < .0001 for both PPV and sensitivity. The Worthing score had the highest sensitivity (0.78 for medical and 0.68 for surgical) but a very low PPV (0.04 for medical and 0.03 for surgical), while GMEWS was the opposite: low sensitivity (0.10 and 0.07) but the highest PPV (0.22 and 0.18).
The results of the univariable analysis can be seen in Table 3. Most of the criteria performed better (higher sensitivity and PPV) as predictors in the medical hospitalizations than in the surgical hospitalizations.
DISCUSSION
We hypothesized that EWS may perform differently when applied to medical rather than surgical patients. Studies had not analyzed this in a time-dependent manner,24-26 which limited the applicability of the results.8
All analyzed scores performed better in medical patients than in surgical patients (Figure). This could reflect a behavioral difference by the teams on surgical and medical floors in the decision to activate the RRS, or a bias of the clinicians who designed the scores (mostly nonsurgeons). The difference could also mean that physiological deteriorations are intrinsically different in patients who have undergone anesthesia and surgery. For example, in surgical patients, a bleeding episode is more likely to be the cause of their physiological deterioration, or the lingering effects of anesthesia could mask underlying deterioration. Such patients would benefit from scores where variables such as heart rate, blood pressure, or hemoglobin had more influence.
When comparing the different scores, it was much easier for a patient to meet the alerting score with the Worthing score than with GMEWS. In the Worthing score, a respiratory rate greater than 22 breaths per minute, or a systolic blood pressure less than 100 mm Hg, already meet alerting criteria. Similar vital signs result in 0 and 1 points (respectively) in GMEWS, far from its alerting score of 5. This reflects the intrinsic tradeoff of EWS: as the threshold for considering a patient “at risk” drops, not only does the number of true positives (and the sensitivity) increase, but also the number of false positives, thus lowering the PPV.
However, none of the scores analyzed were considered to perform well based on their PPV and sensitivity, particularly in the surgical subpopulation. Focusing on another metric, the area under the receiver operator curve can give misleadingly optimistic results.24,27 However, the extremely low prevalence of acute physiological deterioration can produce low PPVs even when specificity seems acceptable, which is why it is important to evaluate PPV directly.28
To use EWS effectively to activate RRS, they need to be combined with clinical judgment to avoid high levels of false alerts, particularly in surgical patients. It has been reported that RRS is activated only 30% of the time a patient meets RRS calling criteria.29 While there may be cultural characteristics inhibiting the decision to call,30 our study hints at another explanation: if RRS was activated every time a patient met calling criteria based on the scores analyzed, the number of RRS calls would be very high and difficult to manage. So health providers may be doing the right thing when “filtering” RRS calls and not applying the criteria strictly, but in conjunction with clinical judgment.
A limitation of any study like this is how to define “acute physiological deterioration.” We defined an event as recognized episodes of acute physiological deterioration that are signaled by escalations of care (eg, RRS, resuscitation calls, or transfers to an ICU) or unexpected death. By definition, our calculated PPV is affected by clinicians’ recognition of clinical deteriorations. This definition, common in the literature, has the limitation of potentially underestimating EWS’ performance by missing some events that are resolved by the primary care team without an escalation of care. However, we believe our interpretation is not unreasonable since the purpose of EWS is to trigger escalations of care in a timely fashion. Prospective studies could define an event in a way that is less affected by the clinicians’ judgment.
Regarding patient demographics, age was similar between the 2 groups (average, 58.2 years for medical vs 58.9 years for surgical), and there was only a small difference in gender ratios (45.1% male in the medical vs 51.4% in the surgical group). These differences are unlikely to have affected the results significantly, but unknown differences in demographics or other patient characteristics between groups may account for differences in score performance between surgical and medical patients.
Several of the EWS analyzed had overlapping trigger criteria with our own RRS activation criteria (although as single-parameter triggers and not as aggregate). To test how these potential biases could affect our results, we performed a post hoc sensitivity analysis eliminating calls to the RRS as an outcome (so using the alternative outcome of unexpected transfers to the ICU and resuscitation calls). The results are similar to those of our main analysis, with all analyzed scores having lower sensitivity and PPV in surgical hospitalizations when compared to medical hospitalizations.
Our study suggests that, to optimize detection of physiological deterioration events, EWS should try to take into account different patient types, with the most basic distinction being surgical vs medical. This tailoring will make EWS more complex, and less suited for paper-based calculation, but new electronic health records are increasingly able to incorporate decision support, and some EWS have been developed for electronic calculation only. Of particular interest in this regard is the score developed by Escobar et al,31 which groups patients into categories according to the reason for admission, and calculates a different subscore based on that category. While the score by Escobar et al. does not split patients based on medical or surgical status, a more general interpretation of our results suggests that a score may be more accurate if it classifies patients into subgroups with different subscores. This seems to be confirmed by the fact that the score by Escobar et al performs better than MEWS.28 Unfortunately, the paper describing it does not provide enough detail to use it in our database.
A recent systematic review showed increasing evidence that RRS may be effective in reducing CRAs occurring in a non-ICU setting and, more important, overall inhospital mortality.32 While differing implementation strategies (eg, different length of the educational effort, changes in the frequency of vital signs monitoring) can impact the success of such an initiative, it has been speculated that the afferent limb (which often includes an EWS) might be the most critical part of the system.33 Our results show that the most widely used EWS perform significantly worse on surgical patients, and suggest that a way to improve the accuracy of EWS would be to tailor the risk calculation to different patient subgroups (eg, medical and surgical patients). Plausible next steps would be to demonstrate that tailoring risk calculation to medical and surgical patients separately can improve risk predictions and accuracy of EWS.
Disclosure
The authors report no financial conflicts of interest.
Patients typically show signs and symptoms of deterioration hours to days prior to cardiorespiratory arrest.1,2 The rate of inhospital cardiorespiratory arrest (CRA) requiring cardiopulmonary resuscitation is estimated to be 0.174 per bed per year in the United States.3 After CRA, survival to discharge is estimated to be as low as 18%.3,4 Efforts to predict and prevent arrest could prove beneficial.1,2
Rapid response systems (RRS) have been proposed as a means of identifying clinical deterioration and facilitating a timely response. These systems were designed to bring clinicians with critical care expertise to the bedside to prevent unnecessary deaths. They typically include an afferent limb (detects deteriorating patients), an efferent limb (responds to calls and acts to avoid further deterioration), and administrative and data analysis limbs.5,6 Automatic provision of recommendations and computer-based systems are desirable components of the afferent limb of the detection system.6 Both are independent predictors of improved clinical practices for clinical decision support systems.7 However, the existing early warning scores (EWS) may not be ready for automation due to low positive predictive values (PPV) and sensitivities.8
It is possible that the low discriminatory accuracy of the published EWS may be secondary to the use of aggregate patient populations for derivation of scores. We hypothesized that these EWS perform differently in medical and in surgical subpopulations. Also, the EWS need to be tested in a time-dependent manner to serve as a realistic clinical support tool for hospitalized patients.
STUDY AIM
The aim of this study was to evaluate the differential performance of widely used EWS in medical vs surgical patients.
METHODS
Site
The study was conducted in an academic center with 2 hospitals in Southeastern Minnesota totaling approximately 1500 general care nonintensive care unit (ICU) beds. The Mayo Clinic Institutional Review Board approved the research proposal.
Subjects
Our retrospective cohort was comprised of all adult inpatients discharged from 2 academic hospitals between January 1, 2011 and December 31, 2011 who spent any time in a general care (non-ICU) unit. We excluded patients younger than 18 years, psychiatric or rehabilitation inpatients, those without research authorization, and patients admitted for research purposes.
Study patients were divided into medical and surgical cohorts. Hospitalizations were considered surgical if patients had surgery at any time during their hospital stay according to billing data. A trigger was an instance in which a patient met the conditions of a specific rule (score/vital sign exceeded the published/defined threshold).
A resuscitation call was defined as a call for cardiopulmonary resuscitation when a patient has a CRA.
An event was an occurrence of 1 of the following in a general care setting: unplanned transfer to the ICU, resuscitation call, or RRS activation.
The RRS activation criteria consisted of an “acute and persistent change” in any 1 or more of the following: oxygen saturations less than 90%, heart rate less than 40 or greater than 130 beats/minute, systolic blood pressure less than 90 mm Hg, or respiratory rate less than 10 or greater than 28 breaths/minute. The RRS activation requires health provider action; they are not electronically generated. Nurses and physicians may also activate the RRS if they are concerned about a patient, even if calling criteria are not met. This is in contrast to the EWS analyzed, which are aggregate composites of multiple parameters. However, whether or not a derangement in vital signs is considered an “acute and persistent change” still involves clinical judgment. Any movement from a general care bed to an ICU bed, or from a general care bed to a procedure area, and from there to an ICU, was considered unplanned. Transfers to the ICU directly from the emergency department or operating room (OR) were not considered as an unplanned transfer and were not included in the analyses.
Coverage time was the period observed for events after a rule was triggered. In this analysis, a coverage time of 24 hours was considered, with a 1-hour look-back. A trigger was counted as a true positive if an event occurred during the following 24 hours. The 1-hour look-back was included to take into account the nursing clinical process of prioritizing a call to the RRS followed by documentation of the altered vital signs that prompted the call.
An episode was the continuous time on the general care floor within a hospitalization, excluding times when a patient was in the OR or ICU. For example, if a patient was admitted to a general bed on a surgery floor, subsequently went to the OR, and then returned to the surgery floor, the 2 episodes were considered separate: the time on the floor before surgery, and the time on the floor after surgery.
Assessment of implementation of RRS in our hospitals showed a significant drop in the failure-to-rescue rate (issues considered related to delay or failure to identify or intervene appropriately when a patient was deteriorating, as identified through mortality review) and a decrease in non-ICU mortality.9,10 This suggests that our current process captures many of the relevant episodes of acute deterioration when a rapid response team is needed and supports using RRS activation as outcomes.
Data Sources
We developed a time-stamped longitudinal database of patient data from the electronic health record, including vital signs, laboratory test results, demographics (age, sex), administrative data (including length of stay), comorbidities, resuscitation code status, location in hospital, and at the minute level throughout each patient’s hospital stay. Physiologically impossible values (eg, blood pressures of 1200 mm Hg) were considered entered in error and eliminated from the database. Time spent in the OR or ICU was excluded because RRS activation would not be applied in these already highly monitored areas. SAS Statistical software (SAS Institute Inc. Cary, North Carolina) was used for database creation.
We applied the current RRS calling criteria in our institution and calculated the Kirkland score,11 along with some of the most widely used early warning scores:12 Modified Early Warning System (MEWS),13 Standardized Early Warning Scoring System (SEWS),14 Global Modified Early Warning Score (GMEWS),15 Worthing physiologic scoring system,16 National Early Warning Score (NEWS),17 and VitaPAC Early Warning Score (ViEWS).18 Published thresholds for these scores were used to create rule triggers in the data. Once a trigger was created to calculate the number of false positives and true positives, all subsequent triggers were ignored until the end of the episode or until 24 hours elapsed. We calculated triggers in a rolling fashion throughout the episodes of care. The EWS score was updated every time a new parameter was entered into the analytical electronic health record, and the most recent value for each was used to calculate the score. SAS statistical software was used for calculation of scores and identification of outcomes.
For our analysis, events were treated as dependent variables, and triggers were independent variables. We calculated the score for each EWS to the minute level throughout our retrospective database. If the score for a specific EWS was higher than the published/recommended threshold for that EWS, an alert was considered to have been issued, and the patient was followed for 24 hours. If the patient had an event in the subsequent 24 hours, or 1 hour before (1-hour look-back), the alert was considered a true positive; if not, a false positive. Events that were not preceded by an alert were false negatives, and 24-hour intervals without either an alert or an event were considered true negatives. This simulation exercise was performed for each EWS in both subcohorts (medical and surgical). Clusters of RRS calls followed by transfers to the ICU within 3 hours were considered as a single adverse event (RRS calls, as it was the first event to occur) to avoid double counting. We have described how well this simulation methodology,8 correlates with results from prospective studies.19
Statistical Analysis
To calculate whether results were statistically significant for subgroups, a jackknife method of calculating variance20 was used. The jackknife method calculates variance by repeating the calculations of the statistic leaving out 1 sample at a time. In our case, we repeated the calculation of sensitivity and PPV leaving out 1 patient at a time. Once the simulation method had been run and the false/true positives/negatives had been assigned, calculation of each metric (PPV and sensitivity) was repeated for n subsamples, each leaving out 1 patient. The variance was calculated and 2 Student t tests were performed for each EWS: 1 for PPV and another for sensitivity. SAS statistical software v 9.3 was used for the simulation analysis; R statistical software v 3.0.2 (The R Foundation, Vienna, Austria) was used for the calculation of the statistical significance of results. A univariable analysis was also performed to assess the sensitivity and PPVs for the published thresholds of the most common variables in each EWS: respiratory rate, systolic blood pressure, heart rate, temperature, and mental status as measured by the modified Richmond Agitation Sedation Score.21
RESULTS
The initial cohort included 60,020 hospitalizations, of which the following were excluded: 2751 because of a lack of appropriate research authorization; 6433 because the patients were younger than 18 years; 2129 as psychiatric admissions; 284 as rehabilitation admissions; 872 as research purposes-only admissions; and 1185 because the patient was never in a general care bed (eg, they were either admitted directly to the ICU, or they were admitted for an outpatient surgical procedure and spent time in the postanesthesia care unit).
Table 1 summarizes patient and trigger characteristics, overall and by subgroup. The final cohort included 75,240 total episodes in 46,366 hospitalizations, from 34,898 unique patients, of which 48.7% were male. There were 23,831 medical and 22,535 surgical hospitalizations. Median length of episode was 2 days both for medical and surgical patients. Median length of stay was 3 days, both for medical and for surgical patients.
There were 3332 events in total, of which 1709 were RRS calls, 185 were resuscitation calls, and 1438 were unscheduled transfers to the ICU. The rate of events was 4.67 events per 100 episodes in the aggregate adult population. There were 3.93 events per 100 episodes for surgical hospitalizations, and 5.86 events per 100 episodes for medical hospitalizations (P < .001). The number of CRAs in our cohort was 0.27 per 100 episodes, 0.128 per hospital bed per year, or 4.37 per 1000 hospital admissions, similar to other reported numbers in the literature.3, 22,23
The total number of EWS triggers varied greatly between EWS rules, with the volume ranging during the study year from 1363 triggers with the GMEWS rule to 77,711 triggers with the ViEWS score.
All scores had PPVs less than 25%. As seen in Table 2 and shown graphically in the Figure, all scores performed better on medical patients (blue) than on surgical patients (yellow). The P value was < .0001 for both PPV and sensitivity. The Worthing score had the highest sensitivity (0.78 for medical and 0.68 for surgical) but a very low PPV (0.04 for medical and 0.03 for surgical), while GMEWS was the opposite: low sensitivity (0.10 and 0.07) but the highest PPV (0.22 and 0.18).
The results of the univariable analysis can be seen in Table 3. Most of the criteria performed better (higher sensitivity and PPV) as predictors in the medical hospitalizations than in the surgical hospitalizations.
DISCUSSION
We hypothesized that EWS may perform differently when applied to medical rather than surgical patients. Studies had not analyzed this in a time-dependent manner,24-26 which limited the applicability of the results.8
All analyzed scores performed better in medical patients than in surgical patients (Figure). This could reflect a behavioral difference by the teams on surgical and medical floors in the decision to activate the RRS, or a bias of the clinicians who designed the scores (mostly nonsurgeons). The difference could also mean that physiological deteriorations are intrinsically different in patients who have undergone anesthesia and surgery. For example, in surgical patients, a bleeding episode is more likely to be the cause of their physiological deterioration, or the lingering effects of anesthesia could mask underlying deterioration. Such patients would benefit from scores where variables such as heart rate, blood pressure, or hemoglobin had more influence.
When comparing the different scores, it was much easier for a patient to meet the alerting score with the Worthing score than with GMEWS. In the Worthing score, a respiratory rate greater than 22 breaths per minute, or a systolic blood pressure less than 100 mm Hg, already meet alerting criteria. Similar vital signs result in 0 and 1 points (respectively) in GMEWS, far from its alerting score of 5. This reflects the intrinsic tradeoff of EWS: as the threshold for considering a patient “at risk” drops, not only does the number of true positives (and the sensitivity) increase, but also the number of false positives, thus lowering the PPV.
However, none of the scores analyzed were considered to perform well based on their PPV and sensitivity, particularly in the surgical subpopulation. Focusing on another metric, the area under the receiver operator curve can give misleadingly optimistic results.24,27 However, the extremely low prevalence of acute physiological deterioration can produce low PPVs even when specificity seems acceptable, which is why it is important to evaluate PPV directly.28
To use EWS effectively to activate RRS, they need to be combined with clinical judgment to avoid high levels of false alerts, particularly in surgical patients. It has been reported that RRS is activated only 30% of the time a patient meets RRS calling criteria.29 While there may be cultural characteristics inhibiting the decision to call,30 our study hints at another explanation: if RRS was activated every time a patient met calling criteria based on the scores analyzed, the number of RRS calls would be very high and difficult to manage. So health providers may be doing the right thing when “filtering” RRS calls and not applying the criteria strictly, but in conjunction with clinical judgment.
A limitation of any study like this is how to define “acute physiological deterioration.” We defined an event as recognized episodes of acute physiological deterioration that are signaled by escalations of care (eg, RRS, resuscitation calls, or transfers to an ICU) or unexpected death. By definition, our calculated PPV is affected by clinicians’ recognition of clinical deteriorations. This definition, common in the literature, has the limitation of potentially underestimating EWS’ performance by missing some events that are resolved by the primary care team without an escalation of care. However, we believe our interpretation is not unreasonable since the purpose of EWS is to trigger escalations of care in a timely fashion. Prospective studies could define an event in a way that is less affected by the clinicians’ judgment.
Regarding patient demographics, age was similar between the 2 groups (average, 58.2 years for medical vs 58.9 years for surgical), and there was only a small difference in gender ratios (45.1% male in the medical vs 51.4% in the surgical group). These differences are unlikely to have affected the results significantly, but unknown differences in demographics or other patient characteristics between groups may account for differences in score performance between surgical and medical patients.
Several of the EWS analyzed had overlapping trigger criteria with our own RRS activation criteria (although as single-parameter triggers and not as aggregate). To test how these potential biases could affect our results, we performed a post hoc sensitivity analysis eliminating calls to the RRS as an outcome (so using the alternative outcome of unexpected transfers to the ICU and resuscitation calls). The results are similar to those of our main analysis, with all analyzed scores having lower sensitivity and PPV in surgical hospitalizations when compared to medical hospitalizations.
Our study suggests that, to optimize detection of physiological deterioration events, EWS should try to take into account different patient types, with the most basic distinction being surgical vs medical. This tailoring will make EWS more complex, and less suited for paper-based calculation, but new electronic health records are increasingly able to incorporate decision support, and some EWS have been developed for electronic calculation only. Of particular interest in this regard is the score developed by Escobar et al,31 which groups patients into categories according to the reason for admission, and calculates a different subscore based on that category. While the score by Escobar et al. does not split patients based on medical or surgical status, a more general interpretation of our results suggests that a score may be more accurate if it classifies patients into subgroups with different subscores. This seems to be confirmed by the fact that the score by Escobar et al performs better than MEWS.28 Unfortunately, the paper describing it does not provide enough detail to use it in our database.
A recent systematic review showed increasing evidence that RRS may be effective in reducing CRAs occurring in a non-ICU setting and, more important, overall inhospital mortality.32 While differing implementation strategies (eg, different length of the educational effort, changes in the frequency of vital signs monitoring) can impact the success of such an initiative, it has been speculated that the afferent limb (which often includes an EWS) might be the most critical part of the system.33 Our results show that the most widely used EWS perform significantly worse on surgical patients, and suggest that a way to improve the accuracy of EWS would be to tailor the risk calculation to different patient subgroups (eg, medical and surgical patients). Plausible next steps would be to demonstrate that tailoring risk calculation to medical and surgical patients separately can improve risk predictions and accuracy of EWS.
Disclosure
The authors report no financial conflicts of interest.
1. Buist MD, Jarmolowski E, Burton PR, Bernard SA, Waxman BP, Anderson J. Recognising clinical instability in hospital patients before cardiac arrest or unplanned admission to intensive care. A pilot study in a tertiary-care hospital. Med J Aust. 1999; 171(1):22-25. PubMed
2. Schein RM, Hazday N, Pena M, Ruben BH, Sprung CL. Clinical antecedents to in-hospital cardiopulmonary arrest. Chest. 1990;98(6):1388-1392. PubMed
3. Peberdy MA, Kaye W, Ornato JP, Larkin GL, Nadkarni V, Mancini ME, et al. Cardiopulmonary resuscitation of adults in the hospital: a report of 14720 cardiac arrests from the National Registry of Cardiopulmonary Resuscitation. Resuscitation. 2003; 58(3):297-308. PubMed
4. Nadkarni VM, Larkin GL, Peberdy MA, Carey SM, Kaye W, Mancini ME, et al. First documented rhythm and clinical outcome from in-hospital cardiac arrest among children and adults. JAMA. 2006;295(1):50-57. PubMed
5. Devita MA, Bellomo R, Hillman K, Kellum J, Rotondi A, Teres D, et al. Findings of the first consensus conference on medical emergency teams. Crit Care Med. 2006;34(9):2463-2478. PubMed
6. DeVita MA, Smith GB, Adam SK, Adams-Pizarro I, Buist M, Bellomo R, et al. “Identifying the hospitalised patient in crisis”--a consensus conference on the afferent limb of rapid response systems. Resuscitation. 2010;81(4):375-382. PubMed
7. Kawamoto K, Houlihan CA, Balas EA, Lobach DF. Improving clinical practice using clinical decision support systems: a systematic review of trials to identify features critical to success. BMJ. 2005;330(7494):765. PubMed
8. Romero-Brufau S, Huddleston JM, Naessens JM, Johnson MG, Hickman J, Morlan BW, et al. Widely used track and trigger scores: are they ready for automation in practice? Resuscitation. 2014;85(4):549-552. PubMed
9. Huddleston JM, Diedrich DA, Kinsey GC, Enzler MJ, Manning DM. Learning from every death. J Patient Saf. 2014;10(1):6-12. PubMed
10. Moriarty JP, Schiebel NE, Johnson MG, Jensen JB, Caples SM, Morlan BW, et al. Evaluating implementation of a rapid response team: considering alternative outcome measures. Int J Qual Health Care. 2014;26(1):49-57. PubMed
11. Kirkland LL, Malinchoc M, O’Byrne M, Benson JT, Kashiwagi DT, Burton MC, et al. A clinical deterioration prediction tool for internal medicine patients. Am J Med Qual. 2013;28(2):135-142. PubMed
12. Griffiths JR, Kidney EM. Current use of early warning scores in UK emergency departments. Emerg Med J. 2012;29(1):65-66. PubMed
13. Subbe CP, Kruger M, Rutherford P, Gemmel L. Validation of a modified Early Warning Score in medical admissions. QJM. 2001;94(10):521-526. PubMed
14. Paterson R, MacLeod DC, Thetford D, Beattie A, Graham C, Lam S, et al.. Prediction of in-hospital mortality and length of stay using an early warning scoring system: clinical audit. Clin Med (Lond). 2006;6(3):281-284. PubMed
15. Harrison GA, Jacques T, McLaws ML, Kilborn G. Combinations of early signs of critical illness predict in-hospital death–the SOCCER study (signs of critical conditions and emergency responses). Resuscitation. 2006;71(3):327-334. PubMed
16. Duckitt RW, Buxton-Thomas R, Walker J, Cheek E, Bewick V, Venn R, et al. Worthing physiological scoring system: derivation and validation of a physiological early-warning system for medical admissions. An observational, population-based single-centre study. Br J Anaesth. 2007; 98(6):769-774. PubMed
17. Smith GB, Prytherch DR, Meredith P, Schmidt PE, Featherstone PI. The ability of the National Early Warning Score (NEWS) to discriminate patients at risk of early cardiac arrest, unanticipated intensive care unit admission, and death. Resuscitation. 2013;84(4):465-470. PubMed
18. Prytherch DR, Smith GB, Schmidt PE, Featherstone PI. ViEWS--Towards a national early warning score for detecting adult inpatient deterioration. Resuscitation. 2010;81(8):932-937. PubMed
19. Romero-Brufau S, Huddleston JM. Reply to letter: widely used track and trigger scores: are they ready for automation in practice? Resuscitation. 2014;85(10):e159. PubMed
20. Efron B, Stein C. The jackknife estimate of variance. Annals of Statistics. 1981;586-596.
21. Sessler CN, Gosnell MS, Grap MJ, Brophy GM, O’Neal PV, Keane KA, et al. The Richmond Agitation-Sedation Scale: validity and reliability in adult intensive care unit patients. Am J Respir Crit Care Med. 2002;166(10):1338-1344. PubMed
22. DeVita MA, Braithwaite RS, Mahidhara R, Stuart S, Foraida M, Simmons RL. Medical Emergency Response Improvement Team (MERIT). Use of medical emergency team responses to reduce hospital cardiopulmonary arrests. Qual Saf Health Care. 2004;13(4):251-254. PubMed
23. Goncales PD, Polessi JA, Bass LM, Santos Gde P, Yokota PK, Laselva CR, et al. Reduced frequency of cardiopulmonary arrests by rapid response teams. Einstein (Sao Paulo). 2012;10(4):442-448. PubMed
24. Cuthbertson BH, Boroujerdi M, McKie L, Aucott L, Prescott G. Can physiological variables and early warning scoring systems allow early recognition of the deteriorating surgical patient? Crit Care Med. 2007;35(2):402-409. PubMed
25. Gardner-Thorpe J, Love N, Wrightson J, Walsh S, Keeling N. The value of Modified Early Warning Score (MEWS) in surgical in-patients: a prospective observational study. Ann R Coll Surg Engl. 2006;88(6):571-575. PubMed
26. Stenhouse C, Coates S, Tivey M, Allsop P, Parker T. Prospective evaluation of a modified Early Warning Score to aid earlier detection of patients developing critical illness on a general surgical ward. British Journal of Anaesthesia. 2000;84(5):663-663.
27. Smith GB, Prytherch DR, Schmidt PE, Featherstone PI. Review and performance evaluation of aggregate weighted ‘track and trigger’ systems. Resuscitation. 2008;77(2):170-179. PubMed
28. Romero-Brufau S, Huddleston JM, Escobar GJ, Liebow M. Why the C-statistic is not informative to evaluate early warning scores and what metrics to use. Crit Care. 2015; 19:285. PubMed
29. Hillman K, Chen J, Cretikos M, Bellomo R, Brown D, Doig G, et al. Introduction of the medical emergency team (MET) system: a cluster-randomised controlled trial. Lancet. 2005;365(9477):2091-2097. PubMed
30. Shearer B, Marshall S, Buist MD, Finnigan M, Kitto S, Hore T, et al. What stops hospital clinical staff from following protocols? An analysis of the incidence and factors behind the failure of bedside clinical staff to activate the rapid response system in a multi-campus Australian metropolitan healthcare service. BMJ Qual Saf. 2012;21(7):569-575. PubMed
31. Escobar GJ, LaGuardia JC, Turk BJ, Ragins A, Kipnis P, Draper D. Early detection of impending physiologic deterioration among patients who are not in intensive care: development of predictive models using data from an automated electronic medical record. J Hosp Med. 2012;7(5):388-395. PubMed
32. Winters BD, Weaver SJ, Pfoh ER, Yang T, Pham JC, Dy SM. Rapid-response systems as a patient safety strategy: a systematic review. Ann Intern Med. 2013;158(5 pt 2):417-425. PubMed
33. Jones DA, DeVita MA, Bellomo R. Rapid-response teams. N Engl J Med. 2011;365(2):139-146. PubMed
1. Buist MD, Jarmolowski E, Burton PR, Bernard SA, Waxman BP, Anderson J. Recognising clinical instability in hospital patients before cardiac arrest or unplanned admission to intensive care. A pilot study in a tertiary-care hospital. Med J Aust. 1999; 171(1):22-25. PubMed
2. Schein RM, Hazday N, Pena M, Ruben BH, Sprung CL. Clinical antecedents to in-hospital cardiopulmonary arrest. Chest. 1990;98(6):1388-1392. PubMed
3. Peberdy MA, Kaye W, Ornato JP, Larkin GL, Nadkarni V, Mancini ME, et al. Cardiopulmonary resuscitation of adults in the hospital: a report of 14720 cardiac arrests from the National Registry of Cardiopulmonary Resuscitation. Resuscitation. 2003; 58(3):297-308. PubMed
4. Nadkarni VM, Larkin GL, Peberdy MA, Carey SM, Kaye W, Mancini ME, et al. First documented rhythm and clinical outcome from in-hospital cardiac arrest among children and adults. JAMA. 2006;295(1):50-57. PubMed
5. Devita MA, Bellomo R, Hillman K, Kellum J, Rotondi A, Teres D, et al. Findings of the first consensus conference on medical emergency teams. Crit Care Med. 2006;34(9):2463-2478. PubMed
6. DeVita MA, Smith GB, Adam SK, Adams-Pizarro I, Buist M, Bellomo R, et al. “Identifying the hospitalised patient in crisis”--a consensus conference on the afferent limb of rapid response systems. Resuscitation. 2010;81(4):375-382. PubMed
7. Kawamoto K, Houlihan CA, Balas EA, Lobach DF. Improving clinical practice using clinical decision support systems: a systematic review of trials to identify features critical to success. BMJ. 2005;330(7494):765. PubMed
8. Romero-Brufau S, Huddleston JM, Naessens JM, Johnson MG, Hickman J, Morlan BW, et al. Widely used track and trigger scores: are they ready for automation in practice? Resuscitation. 2014;85(4):549-552. PubMed
9. Huddleston JM, Diedrich DA, Kinsey GC, Enzler MJ, Manning DM. Learning from every death. J Patient Saf. 2014;10(1):6-12. PubMed
10. Moriarty JP, Schiebel NE, Johnson MG, Jensen JB, Caples SM, Morlan BW, et al. Evaluating implementation of a rapid response team: considering alternative outcome measures. Int J Qual Health Care. 2014;26(1):49-57. PubMed
11. Kirkland LL, Malinchoc M, O’Byrne M, Benson JT, Kashiwagi DT, Burton MC, et al. A clinical deterioration prediction tool for internal medicine patients. Am J Med Qual. 2013;28(2):135-142. PubMed
12. Griffiths JR, Kidney EM. Current use of early warning scores in UK emergency departments. Emerg Med J. 2012;29(1):65-66. PubMed
13. Subbe CP, Kruger M, Rutherford P, Gemmel L. Validation of a modified Early Warning Score in medical admissions. QJM. 2001;94(10):521-526. PubMed
14. Paterson R, MacLeod DC, Thetford D, Beattie A, Graham C, Lam S, et al.. Prediction of in-hospital mortality and length of stay using an early warning scoring system: clinical audit. Clin Med (Lond). 2006;6(3):281-284. PubMed
15. Harrison GA, Jacques T, McLaws ML, Kilborn G. Combinations of early signs of critical illness predict in-hospital death–the SOCCER study (signs of critical conditions and emergency responses). Resuscitation. 2006;71(3):327-334. PubMed
16. Duckitt RW, Buxton-Thomas R, Walker J, Cheek E, Bewick V, Venn R, et al. Worthing physiological scoring system: derivation and validation of a physiological early-warning system for medical admissions. An observational, population-based single-centre study. Br J Anaesth. 2007; 98(6):769-774. PubMed
17. Smith GB, Prytherch DR, Meredith P, Schmidt PE, Featherstone PI. The ability of the National Early Warning Score (NEWS) to discriminate patients at risk of early cardiac arrest, unanticipated intensive care unit admission, and death. Resuscitation. 2013;84(4):465-470. PubMed
18. Prytherch DR, Smith GB, Schmidt PE, Featherstone PI. ViEWS--Towards a national early warning score for detecting adult inpatient deterioration. Resuscitation. 2010;81(8):932-937. PubMed
19. Romero-Brufau S, Huddleston JM. Reply to letter: widely used track and trigger scores: are they ready for automation in practice? Resuscitation. 2014;85(10):e159. PubMed
20. Efron B, Stein C. The jackknife estimate of variance. Annals of Statistics. 1981;586-596.
21. Sessler CN, Gosnell MS, Grap MJ, Brophy GM, O’Neal PV, Keane KA, et al. The Richmond Agitation-Sedation Scale: validity and reliability in adult intensive care unit patients. Am J Respir Crit Care Med. 2002;166(10):1338-1344. PubMed
22. DeVita MA, Braithwaite RS, Mahidhara R, Stuart S, Foraida M, Simmons RL. Medical Emergency Response Improvement Team (MERIT). Use of medical emergency team responses to reduce hospital cardiopulmonary arrests. Qual Saf Health Care. 2004;13(4):251-254. PubMed
23. Goncales PD, Polessi JA, Bass LM, Santos Gde P, Yokota PK, Laselva CR, et al. Reduced frequency of cardiopulmonary arrests by rapid response teams. Einstein (Sao Paulo). 2012;10(4):442-448. PubMed
24. Cuthbertson BH, Boroujerdi M, McKie L, Aucott L, Prescott G. Can physiological variables and early warning scoring systems allow early recognition of the deteriorating surgical patient? Crit Care Med. 2007;35(2):402-409. PubMed
25. Gardner-Thorpe J, Love N, Wrightson J, Walsh S, Keeling N. The value of Modified Early Warning Score (MEWS) in surgical in-patients: a prospective observational study. Ann R Coll Surg Engl. 2006;88(6):571-575. PubMed
26. Stenhouse C, Coates S, Tivey M, Allsop P, Parker T. Prospective evaluation of a modified Early Warning Score to aid earlier detection of patients developing critical illness on a general surgical ward. British Journal of Anaesthesia. 2000;84(5):663-663.
27. Smith GB, Prytherch DR, Schmidt PE, Featherstone PI. Review and performance evaluation of aggregate weighted ‘track and trigger’ systems. Resuscitation. 2008;77(2):170-179. PubMed
28. Romero-Brufau S, Huddleston JM, Escobar GJ, Liebow M. Why the C-statistic is not informative to evaluate early warning scores and what metrics to use. Crit Care. 2015; 19:285. PubMed
29. Hillman K, Chen J, Cretikos M, Bellomo R, Brown D, Doig G, et al. Introduction of the medical emergency team (MET) system: a cluster-randomised controlled trial. Lancet. 2005;365(9477):2091-2097. PubMed
30. Shearer B, Marshall S, Buist MD, Finnigan M, Kitto S, Hore T, et al. What stops hospital clinical staff from following protocols? An analysis of the incidence and factors behind the failure of bedside clinical staff to activate the rapid response system in a multi-campus Australian metropolitan healthcare service. BMJ Qual Saf. 2012;21(7):569-575. PubMed
31. Escobar GJ, LaGuardia JC, Turk BJ, Ragins A, Kipnis P, Draper D. Early detection of impending physiologic deterioration among patients who are not in intensive care: development of predictive models using data from an automated electronic medical record. J Hosp Med. 2012;7(5):388-395. PubMed
32. Winters BD, Weaver SJ, Pfoh ER, Yang T, Pham JC, Dy SM. Rapid-response systems as a patient safety strategy: a systematic review. Ann Intern Med. 2013;158(5 pt 2):417-425. PubMed
33. Jones DA, DeVita MA, Bellomo R. Rapid-response teams. N Engl J Med. 2011;365(2):139-146. PubMed
© 2017 Society of Hospital Medicine
Nonoperative management of pediatric appendicitis appears feasible
Nonoperative management of uncomplicated acute appendicitis in the pediatric population appeared feasible and didn’t raise the risk of complications in the first metaanalysis to examine this approach, investigators reported March 27 in JAMA Pediatrics.
Nonoperative management, based on antibiotic treatment and close monitoring of the patient, is accepted as safe and effective in adults but has not been well studied in children and adolescents. “Owing to specific anatomical and pathophysiologic features of children, the clinical scenario of acute appendicitis in pediatric patients is different from that in adults, and treatment decisions for children are more difficult,” said Libin Huang, MD, of West China Hospital and Sichuan University, Chengdu, and his associates.
The few clinical trials that have been performed in children have had small sample sizes, so the investigators performed a meta-analysis to pool the results for 404 patients aged 5-18 years. They analyzed data from four single-center prospective but nonrandomized controlled trials and one single-center randomized controlled trial to compare outcomes between 168 patients initially treated with antibiotics and 236 who underwent immediate appendectomy.
Sixteen patients in the nonoperative group (9.5%) had treatment failure, defined as appendectomy within 48 hours (11 patients) or within 1 month of follow-up (5 patients). Three of these patients developed a complication (perforated appendicitis). In comparison, none of the surgery group had treatment failure, and one developed a complication requiring reoperation. Thus, the rate of success in the nonoperative group was 152 of 168 patients, or 90.5%, and the rate of complications was not significantly different between the two study groups, Dr. Huang and his associates said (JAMA Ped. 2017 Mar 27. doi: 10.1001/jamapediatrics.2017.0057).
During the following year, 27 patients in the nonoperative group had a histopathologically confirmed recurrence of appendicitis and underwent appendectomy; another 8 had the surgery because of parents’ requests. Nonoperative management was significantly more likely to fail in patients who had an appendicolith, so this approach should be considered inappropriate for this subgroup of patients, the investigators said.
Larger clinical trials with a randomized design, standardized criteria for antibiotic therapy, and longer follow-up are needed to confirm these preliminary findings, they added.
No sponsor was cited for this study. Dr. Huang and his associates reported having no relevant financial disclosures.
This is the first data synthesis on the effectiveness of nonoperative management compared with appendectomy in children, and it shows that the evidence at this time is simply insufficient to warrant a change in clinical practice. Appendectomy remains the standard of care for this disease.
Despite the high early “success rate” for nonoperative treatment, patients in this group were nearly nine times more likely to have “treatment failure” than those who underwent immediate appendectomy.
The nonoperative approach remains an experimental proposition and should be offered only under protocol in a clinical trial setting. It clearly merits ongoing consideration, but much more data from high-quality clinical trials are needed.
Monica E. Lopez, MD, and David E. Wesson, MD, are both with the division of pediatric surgery at Baylor College of Medicine and the department of surgery at Texas Children’s Hospital, both in Houston. They reported having no relevant financial disclosures. Dr. Lopez and Dr. Wesson made these remarks in an editorial accompanying Dr. Huang’s report (JAMA Ped. 2017 Mar 27. doi: 10.1001/jamapediatrics.2017.0056).
This is the first data synthesis on the effectiveness of nonoperative management compared with appendectomy in children, and it shows that the evidence at this time is simply insufficient to warrant a change in clinical practice. Appendectomy remains the standard of care for this disease.
Despite the high early “success rate” for nonoperative treatment, patients in this group were nearly nine times more likely to have “treatment failure” than those who underwent immediate appendectomy.
The nonoperative approach remains an experimental proposition and should be offered only under protocol in a clinical trial setting. It clearly merits ongoing consideration, but much more data from high-quality clinical trials are needed.
Monica E. Lopez, MD, and David E. Wesson, MD, are both with the division of pediatric surgery at Baylor College of Medicine and the department of surgery at Texas Children’s Hospital, both in Houston. They reported having no relevant financial disclosures. Dr. Lopez and Dr. Wesson made these remarks in an editorial accompanying Dr. Huang’s report (JAMA Ped. 2017 Mar 27. doi: 10.1001/jamapediatrics.2017.0056).
This is the first data synthesis on the effectiveness of nonoperative management compared with appendectomy in children, and it shows that the evidence at this time is simply insufficient to warrant a change in clinical practice. Appendectomy remains the standard of care for this disease.
Despite the high early “success rate” for nonoperative treatment, patients in this group were nearly nine times more likely to have “treatment failure” than those who underwent immediate appendectomy.
The nonoperative approach remains an experimental proposition and should be offered only under protocol in a clinical trial setting. It clearly merits ongoing consideration, but much more data from high-quality clinical trials are needed.
Monica E. Lopez, MD, and David E. Wesson, MD, are both with the division of pediatric surgery at Baylor College of Medicine and the department of surgery at Texas Children’s Hospital, both in Houston. They reported having no relevant financial disclosures. Dr. Lopez and Dr. Wesson made these remarks in an editorial accompanying Dr. Huang’s report (JAMA Ped. 2017 Mar 27. doi: 10.1001/jamapediatrics.2017.0056).
Nonoperative management of uncomplicated acute appendicitis in the pediatric population appeared feasible and didn’t raise the risk of complications in the first metaanalysis to examine this approach, investigators reported March 27 in JAMA Pediatrics.
Nonoperative management, based on antibiotic treatment and close monitoring of the patient, is accepted as safe and effective in adults but has not been well studied in children and adolescents. “Owing to specific anatomical and pathophysiologic features of children, the clinical scenario of acute appendicitis in pediatric patients is different from that in adults, and treatment decisions for children are more difficult,” said Libin Huang, MD, of West China Hospital and Sichuan University, Chengdu, and his associates.
The few clinical trials that have been performed in children have had small sample sizes, so the investigators performed a meta-analysis to pool the results for 404 patients aged 5-18 years. They analyzed data from four single-center prospective but nonrandomized controlled trials and one single-center randomized controlled trial to compare outcomes between 168 patients initially treated with antibiotics and 236 who underwent immediate appendectomy.
Sixteen patients in the nonoperative group (9.5%) had treatment failure, defined as appendectomy within 48 hours (11 patients) or within 1 month of follow-up (5 patients). Three of these patients developed a complication (perforated appendicitis). In comparison, none of the surgery group had treatment failure, and one developed a complication requiring reoperation. Thus, the rate of success in the nonoperative group was 152 of 168 patients, or 90.5%, and the rate of complications was not significantly different between the two study groups, Dr. Huang and his associates said (JAMA Ped. 2017 Mar 27. doi: 10.1001/jamapediatrics.2017.0057).
During the following year, 27 patients in the nonoperative group had a histopathologically confirmed recurrence of appendicitis and underwent appendectomy; another 8 had the surgery because of parents’ requests. Nonoperative management was significantly more likely to fail in patients who had an appendicolith, so this approach should be considered inappropriate for this subgroup of patients, the investigators said.
Larger clinical trials with a randomized design, standardized criteria for antibiotic therapy, and longer follow-up are needed to confirm these preliminary findings, they added.
No sponsor was cited for this study. Dr. Huang and his associates reported having no relevant financial disclosures.
Nonoperative management of uncomplicated acute appendicitis in the pediatric population appeared feasible and didn’t raise the risk of complications in the first metaanalysis to examine this approach, investigators reported March 27 in JAMA Pediatrics.
Nonoperative management, based on antibiotic treatment and close monitoring of the patient, is accepted as safe and effective in adults but has not been well studied in children and adolescents. “Owing to specific anatomical and pathophysiologic features of children, the clinical scenario of acute appendicitis in pediatric patients is different from that in adults, and treatment decisions for children are more difficult,” said Libin Huang, MD, of West China Hospital and Sichuan University, Chengdu, and his associates.
The few clinical trials that have been performed in children have had small sample sizes, so the investigators performed a meta-analysis to pool the results for 404 patients aged 5-18 years. They analyzed data from four single-center prospective but nonrandomized controlled trials and one single-center randomized controlled trial to compare outcomes between 168 patients initially treated with antibiotics and 236 who underwent immediate appendectomy.
Sixteen patients in the nonoperative group (9.5%) had treatment failure, defined as appendectomy within 48 hours (11 patients) or within 1 month of follow-up (5 patients). Three of these patients developed a complication (perforated appendicitis). In comparison, none of the surgery group had treatment failure, and one developed a complication requiring reoperation. Thus, the rate of success in the nonoperative group was 152 of 168 patients, or 90.5%, and the rate of complications was not significantly different between the two study groups, Dr. Huang and his associates said (JAMA Ped. 2017 Mar 27. doi: 10.1001/jamapediatrics.2017.0057).
During the following year, 27 patients in the nonoperative group had a histopathologically confirmed recurrence of appendicitis and underwent appendectomy; another 8 had the surgery because of parents’ requests. Nonoperative management was significantly more likely to fail in patients who had an appendicolith, so this approach should be considered inappropriate for this subgroup of patients, the investigators said.
Larger clinical trials with a randomized design, standardized criteria for antibiotic therapy, and longer follow-up are needed to confirm these preliminary findings, they added.
No sponsor was cited for this study. Dr. Huang and his associates reported having no relevant financial disclosures.
FROM JAMA PEDIATRICS
Key clinical point: Nonoperative management of uncomplicated appendicitis in the pediatric population appeared feasible and didn’t raise the risk of complications in the first metaanalysis to examine this approach.
Major finding: The rate of treatment success in the nonoperative group was 90.5% (152 of 168 patients).
Data source: A metaanalysis of five single-center clinical trials involving 404 patients aged 5-18 years.
Disclosures: No sponsor was cited for this study. Dr. Huang and his associates reported having no relevant financial disclosures.
Mood and Memory Problems Associated With Deep Brain Stimulation
Bilateral deep brain stimulation of the anterior nucleus of the thalamus can help control seizures, but there are reports that suggest it also causes memory problems and depression. When Tröster et al analyzed data from a randomized trial (SANTE), they did find subjective evidence of both adverse events but were unable to confirm the presence of these problems with objective neurobehavioral measures. Nonetheless, they recommend that patients undergoing deep brain stimulation be monitored and undergo neuropsychological assessment for depression and memory problems.
Tröster AI, Meador KJ, Irwin CP, Fisher RS. Memory and mood outcomes after anterior thalamic stimulation for refractory partial epilepsy. Seizure. 2017;45:133-141.
Bilateral deep brain stimulation of the anterior nucleus of the thalamus can help control seizures, but there are reports that suggest it also causes memory problems and depression. When Tröster et al analyzed data from a randomized trial (SANTE), they did find subjective evidence of both adverse events but were unable to confirm the presence of these problems with objective neurobehavioral measures. Nonetheless, they recommend that patients undergoing deep brain stimulation be monitored and undergo neuropsychological assessment for depression and memory problems.
Tröster AI, Meador KJ, Irwin CP, Fisher RS. Memory and mood outcomes after anterior thalamic stimulation for refractory partial epilepsy. Seizure. 2017;45:133-141.
Bilateral deep brain stimulation of the anterior nucleus of the thalamus can help control seizures, but there are reports that suggest it also causes memory problems and depression. When Tröster et al analyzed data from a randomized trial (SANTE), they did find subjective evidence of both adverse events but were unable to confirm the presence of these problems with objective neurobehavioral measures. Nonetheless, they recommend that patients undergoing deep brain stimulation be monitored and undergo neuropsychological assessment for depression and memory problems.
Tröster AI, Meador KJ, Irwin CP, Fisher RS. Memory and mood outcomes after anterior thalamic stimulation for refractory partial epilepsy. Seizure. 2017;45:133-141.
Why Do Patients Vary in Their Response to Cortical Electric Stimulation?
Patients vary widely in their response to cortical electric stimulation (CES). A retrospective analysis of 92 patients with medically intractable epilepsy who underwent CES was unable to detect any clinical or demographic factors that would explain the varied response to the procedure. Corley et al also found striking variability and a wide range of motor, sensory, and speech response thresholds between patients and within the different regions of the brain in the same patient.
Corley JA, Nazari P, Rossi VJ, et al. Cortical stimulation parameters for functional mapping. Seizure. 2017;45:36-71.
Patients vary widely in their response to cortical electric stimulation (CES). A retrospective analysis of 92 patients with medically intractable epilepsy who underwent CES was unable to detect any clinical or demographic factors that would explain the varied response to the procedure. Corley et al also found striking variability and a wide range of motor, sensory, and speech response thresholds between patients and within the different regions of the brain in the same patient.
Corley JA, Nazari P, Rossi VJ, et al. Cortical stimulation parameters for functional mapping. Seizure. 2017;45:36-71.
Patients vary widely in their response to cortical electric stimulation (CES). A retrospective analysis of 92 patients with medically intractable epilepsy who underwent CES was unable to detect any clinical or demographic factors that would explain the varied response to the procedure. Corley et al also found striking variability and a wide range of motor, sensory, and speech response thresholds between patients and within the different regions of the brain in the same patient.
Corley JA, Nazari P, Rossi VJ, et al. Cortical stimulation parameters for functional mapping. Seizure. 2017;45:36-71.
Deciphering the Significance of Generalized Periodic Discharges
Dementia, poor mental status during electroencephalogram (EEG), chronic focal abnormalities on neuroimaging, cardiac arrest, and chronic obstructive pulmonary disease (COPD) were independently associated with increased in-hospital mortality in patients with generalized periodic discharges (GPDs), according to an analysis of 113 patients at 3 hospitals. To determine the prognostic significance of GPDs observed during EEGs, Jadeja et al reviewed EEG tracings of the patients, of whom there were 60 inpatient deaths (53.1%).
Jadeja N, Zarnegar R, Legatt AD. Clinical outcomes in patients with generalized periodic discharges. Seizure. 2017; 45:114-118.
Dementia, poor mental status during electroencephalogram (EEG), chronic focal abnormalities on neuroimaging, cardiac arrest, and chronic obstructive pulmonary disease (COPD) were independently associated with increased in-hospital mortality in patients with generalized periodic discharges (GPDs), according to an analysis of 113 patients at 3 hospitals. To determine the prognostic significance of GPDs observed during EEGs, Jadeja et al reviewed EEG tracings of the patients, of whom there were 60 inpatient deaths (53.1%).
Jadeja N, Zarnegar R, Legatt AD. Clinical outcomes in patients with generalized periodic discharges. Seizure. 2017; 45:114-118.
Dementia, poor mental status during electroencephalogram (EEG), chronic focal abnormalities on neuroimaging, cardiac arrest, and chronic obstructive pulmonary disease (COPD) were independently associated with increased in-hospital mortality in patients with generalized periodic discharges (GPDs), according to an analysis of 113 patients at 3 hospitals. To determine the prognostic significance of GPDs observed during EEGs, Jadeja et al reviewed EEG tracings of the patients, of whom there were 60 inpatient deaths (53.1%).
Jadeja N, Zarnegar R, Legatt AD. Clinical outcomes in patients with generalized periodic discharges. Seizure. 2017; 45:114-118.
ACGME finalizes return of trainees’ 24-hour max shift
First-year residents will once again be permitted to work up to 24 consecutive hours following a reversal of a rule implemented in 2011 that restricted them to 16 hours, the Accreditation Council for Graduate Medical Education (ACGME) announced.
According to a memo issued by the ACGME March 10, 2017, the change reverting back to the 24-hour ceiling was evidence based.
“The preponderance of the evidence from a number of studies conducted after the current 16-hour cap was implemented in 2011 suggests that it may not have had an incremental benefit in patient safety, and that there might be significant negative impacts to the quality of physician education and professional development,” the memo states. The work week is still capped at 80 hours worked per week, with 1 day free from clinical experience or education in 7, and in-house call no more frequent than every third night.
An ACGME task force determined “that the hypothesized benefits associated with the changes made to first-year resident scheduled hours in 2011 have not been realized, and the disruption of team-based care and supervisory systems has had a significant negative impact on the professional education of the first-year resident, and the effectiveness of care delivery of the team as a whole.”

Sharmila Dissanaike, MD, FACS, chair and professor of surgery at Texas Tech University, Lubbock, said in an interview that the change back to a 24-hour ceiling provides “an increased flexibility for all residents in order to allow completion of immediate patient care responsibilities, such as finishing an operation, and ensure smooth handoffs. Both of these should improve work flow for both trainees and supervisors.”
Mark A. Malangoni, MD, FACS, associate executive director of the American Board of Surgery, said he believes the change back to 24 hours is a positive thing.

“The 16-hour requirement posed a lot of scheduling problems,” he said in an interview. “In essence, what it meant was you had residents that either couldn’t take call or they did take call, it was very limited in what they could do.”
Complicating the issue of time is the nature of what needs to be taught to residents.
“What has definitely changed is the breadth of knowledge and repertoire of technical skills that must be learned by today’s residents,” Dr. Dissanaike said. “As scientific knowledge and technical capabilities expand, there is ever more to learn and increasingly less time in which to learn it.”
Dr. Malangoni added that the time restraints didn’t allow for residents to see the natural progression of the patient’s condition. “You don’t have the chance to continue to assess that over a longer period of time,” he said. “That is really important in learning when to operate on someone, but also when not to operate on someone because they will get better without an operation.”
Compounding that is a greater need for reporting to meet regulatory requirements.
“Concurrently, we have increased requirements for documentation and clerical tasks, and reduced time available to do it,” Dr. Dissanaike continued. “All of this has led to a severe ‘work-compression’ for the modern resident, and I suspect the high rates of burnout and depression that are being reported in many specialties are at least partly a result of this phenomenon.”
That being said, Dr. Dissanaike was quick to add that this latest change should not be considered a “final solution” and that there are “many ongoing issues around resident fatigue, as well as adequacy of educational experience that still need to be addressed.”
Dr. Malangoni added that residents need to be more mindful and take more responsibility for their own health and well-being.
“I think what residents need to understand is they are really in charge of their own well-being. Making that point is really a key,” he said. “So it’s not only what you do while you are in the hospital, but you are also responsible for what you do when you are not in the hospital. ACGME cannot regulate what people do in their free time. If you work a 24-hour shift and you decide you are not going to sleep the next day for whatever reason, your well-being is likely not going to be what you want it to be and what, I think, your patients want it to be.”
First-year residents will once again be permitted to work up to 24 consecutive hours following a reversal of a rule implemented in 2011 that restricted them to 16 hours, the Accreditation Council for Graduate Medical Education (ACGME) announced.
According to a memo issued by the ACGME March 10, 2017, the change reverting back to the 24-hour ceiling was evidence based.
“The preponderance of the evidence from a number of studies conducted after the current 16-hour cap was implemented in 2011 suggests that it may not have had an incremental benefit in patient safety, and that there might be significant negative impacts to the quality of physician education and professional development,” the memo states. The work week is still capped at 80 hours worked per week, with 1 day free from clinical experience or education in 7, and in-house call no more frequent than every third night.
An ACGME task force determined “that the hypothesized benefits associated with the changes made to first-year resident scheduled hours in 2011 have not been realized, and the disruption of team-based care and supervisory systems has had a significant negative impact on the professional education of the first-year resident, and the effectiveness of care delivery of the team as a whole.”
Sharmila Dissanaike, MD, FACS, chair and professor of surgery at Texas Tech University, Lubbock, said in an interview that the change back to a 24-hour ceiling provides “an increased flexibility for all residents in order to allow completion of immediate patient care responsibilities, such as finishing an operation, and ensure smooth handoffs. Both of these should improve work flow for both trainees and supervisors.”
Mark A. Malangoni, MD, FACS, associate executive director of the American Board of Surgery, said he believes the change back to 24 hours is a positive thing.
“The 16-hour requirement posed a lot of scheduling problems,” he said in an interview. “In essence, what it meant was you had residents that either couldn’t take call or they did take call, it was very limited in what they could do.”
Complicating the issue of time is the nature of what needs to be taught to residents.
“What has definitely changed is the breadth of knowledge and repertoire of technical skills that must be learned by today’s residents,” Dr. Dissanaike said. “As scientific knowledge and technical capabilities expand, there is ever more to learn and increasingly less time in which to learn it.”
Dr. Malangoni added that the time restraints didn’t allow for residents to see the natural progression of the patient’s condition. “You don’t have the chance to continue to assess that over a longer period of time,” he said. “That is really important in learning when to operate on someone, but also when not to operate on someone because they will get better without an operation.”
Compounding that is a greater need for reporting to meet regulatory requirements.
“Concurrently, we have increased requirements for documentation and clerical tasks, and reduced time available to do it,” Dr. Dissanaike continued. “All of this has led to a severe ‘work-compression’ for the modern resident, and I suspect the high rates of burnout and depression that are being reported in many specialties are at least partly a result of this phenomenon.”
That being said, Dr. Dissanaike was quick to add that this latest change should not be considered a “final solution” and that there are “many ongoing issues around resident fatigue, as well as adequacy of educational experience that still need to be addressed.”
Dr. Malangoni added that residents need to be more mindful and take more responsibility for their own health and well-being.
“I think what residents need to understand is they are really in charge of their own well-being. Making that point is really a key,” he said. “So it’s not only what you do while you are in the hospital, but you are also responsible for what you do when you are not in the hospital. ACGME cannot regulate what people do in their free time. If you work a 24-hour shift and you decide you are not going to sleep the next day for whatever reason, your well-being is likely not going to be what you want it to be and what, I think, your patients want it to be.”
First-year residents will once again be permitted to work up to 24 consecutive hours following a reversal of a rule implemented in 2011 that restricted them to 16 hours, the Accreditation Council for Graduate Medical Education (ACGME) announced.
According to a memo issued by the ACGME March 10, 2017, the change reverting back to the 24-hour ceiling was evidence based.
“The preponderance of the evidence from a number of studies conducted after the current 16-hour cap was implemented in 2011 suggests that it may not have had an incremental benefit in patient safety, and that there might be significant negative impacts to the quality of physician education and professional development,” the memo states. The work week is still capped at 80 hours worked per week, with 1 day free from clinical experience or education in 7, and in-house call no more frequent than every third night.
An ACGME task force determined “that the hypothesized benefits associated with the changes made to first-year resident scheduled hours in 2011 have not been realized, and the disruption of team-based care and supervisory systems has had a significant negative impact on the professional education of the first-year resident, and the effectiveness of care delivery of the team as a whole.”
Sharmila Dissanaike, MD, FACS, chair and professor of surgery at Texas Tech University, Lubbock, said in an interview that the change back to a 24-hour ceiling provides “an increased flexibility for all residents in order to allow completion of immediate patient care responsibilities, such as finishing an operation, and ensure smooth handoffs. Both of these should improve work flow for both trainees and supervisors.”
Mark A. Malangoni, MD, FACS, associate executive director of the American Board of Surgery, said he believes the change back to 24 hours is a positive thing.
“The 16-hour requirement posed a lot of scheduling problems,” he said in an interview. “In essence, what it meant was you had residents that either couldn’t take call or they did take call, it was very limited in what they could do.”
Complicating the issue of time is the nature of what needs to be taught to residents.
“What has definitely changed is the breadth of knowledge and repertoire of technical skills that must be learned by today’s residents,” Dr. Dissanaike said. “As scientific knowledge and technical capabilities expand, there is ever more to learn and increasingly less time in which to learn it.”
Dr. Malangoni added that the time restraints didn’t allow for residents to see the natural progression of the patient’s condition. “You don’t have the chance to continue to assess that over a longer period of time,” he said. “That is really important in learning when to operate on someone, but also when not to operate on someone because they will get better without an operation.”
Compounding that is a greater need for reporting to meet regulatory requirements.
“Concurrently, we have increased requirements for documentation and clerical tasks, and reduced time available to do it,” Dr. Dissanaike continued. “All of this has led to a severe ‘work-compression’ for the modern resident, and I suspect the high rates of burnout and depression that are being reported in many specialties are at least partly a result of this phenomenon.”
That being said, Dr. Dissanaike was quick to add that this latest change should not be considered a “final solution” and that there are “many ongoing issues around resident fatigue, as well as adequacy of educational experience that still need to be addressed.”
Dr. Malangoni added that residents need to be more mindful and take more responsibility for their own health and well-being.
“I think what residents need to understand is they are really in charge of their own well-being. Making that point is really a key,” he said. “So it’s not only what you do while you are in the hospital, but you are also responsible for what you do when you are not in the hospital. ACGME cannot regulate what people do in their free time. If you work a 24-hour shift and you decide you are not going to sleep the next day for whatever reason, your well-being is likely not going to be what you want it to be and what, I think, your patients want it to be.”
Preoperative VTEs occurred in 10% of cancer patients
SEATTLE – Venous thromboembolism (VTE) is common in cancer, but 10% of asymptomatic patients undergoing major oncologic surgery have a preoperative VTE, according to findings presented at the annual Society of Surgical Oncology Cancer Symposium.
The incidence of preoperative VTE was associated with increasing age, a history of previous VTE, and a diagnosis of sepsis 1 month prior to undergoing oncologic surgery.
Surprisingly, noted study author Dr. Melanie Gainsbury of Cedar’s Sinai Medical Center, Los Angeles, it was not associated with oncologic factors such as locally recurrent disease, metastatic disease, or the receipt of neoadjuvant therapy.
“One may argue that patients undergoing oncologic surgery should receive preoperative lower-extremity duplex screening,” especially those who appear to be at high risk, she said.
About one in five cases of VTE is cancer related, and postoperative VTE is a leading cause of morbidity in cancer patients. However, Dr. Gainsbury noted, the incidence of preoperative VTE has not been well established or studied.
In this study, she and her colleagues evaluated the prevalence and risk factors associated with preoperative VTE in asymptomatic patients who were undergoing major oncologic surgery at an academic medical center.
In their retrospective analysis, the investigators identified 412 patients from the hospital’s database who underwent open abdominopelvic oncologic surgery between 2009 to 2016. All patients in the cohort had received a preoperative lower-extremity venous duplex scan (VDS).
The authors found that the overall incidence of preoperative VTE detected on VDS in this asymptomatic population was 10.1%. Of this group, 48.6% of the VTEs were acute, 42.9% were chronic, and a small subset (8.5%) was classified as subacute.
The majority of VTEs (62.9%) were located below the knee, and all of those patients with above-the-knee VTEs (37.1%) received inferior vena cava filters prior to surgery.
None of the patients in this cohort experienced a postoperative pulmonary embolism.
The investigators also looked at various risk factors that could predispose patients to a higher risk of developing a VTE. They did not find any statistically significant differences between those with a preoperative VTE and those without one when looking at gender, body mass index, or cancer type.
There was, however, a statistically significant difference in age, with older age being significantly associated with preoperative VTE. Further analysis showed that patients were 1.3 times more likely to have a preoperative DVT for every 5-year increase in age (odds ratio, 1.3; 95% confidence interval, 1.1-1.6).
In addition, patients with preoperative VTEs were significantly more likely to experience postoperative complications, with an almost twofold increased incidence (25.7% vs. 13.2%, P = .046).
“Patients with preoperative VTE were 1.95 times more likely to develop a postoperative complication than patients without a preoperative VTE,” Dr. Gainsbury said.
In terms of comorbidities, there was no statistically significant difference in regards to history of a known lung disease, varicose veins, a known coagulation mutation, congestive heart failure, and inflammatory bowel disease.
There were also no statistical differences between hormone use or anticoagulants in patients with and without VTEs.
Of note, a recent history of sepsis appeared to be an important factor that put patients at risk for a subsequent VTE. “The preoperative VTE group had a higher rate of diagnosed sepsis during the month prior to surgery,” she said. “We believe that the preoperative diagnosis of sepsis represents a prior hospitalization and perhaps a sicker population at risk for VTEs.”
There was no funding source disclosed in the abstract. Dr. Gainsbury and her coauthors had no disclosures.
SEATTLE – Venous thromboembolism (VTE) is common in cancer, but 10% of asymptomatic patients undergoing major oncologic surgery have a preoperative VTE, according to findings presented at the annual Society of Surgical Oncology Cancer Symposium.
The incidence of preoperative VTE was associated with increasing age, a history of previous VTE, and a diagnosis of sepsis 1 month prior to undergoing oncologic surgery.
Surprisingly, noted study author Dr. Melanie Gainsbury of Cedar’s Sinai Medical Center, Los Angeles, it was not associated with oncologic factors such as locally recurrent disease, metastatic disease, or the receipt of neoadjuvant therapy.
“One may argue that patients undergoing oncologic surgery should receive preoperative lower-extremity duplex screening,” especially those who appear to be at high risk, she said.
About one in five cases of VTE is cancer related, and postoperative VTE is a leading cause of morbidity in cancer patients. However, Dr. Gainsbury noted, the incidence of preoperative VTE has not been well established or studied.
In this study, she and her colleagues evaluated the prevalence and risk factors associated with preoperative VTE in asymptomatic patients who were undergoing major oncologic surgery at an academic medical center.
In their retrospective analysis, the investigators identified 412 patients from the hospital’s database who underwent open abdominopelvic oncologic surgery between 2009 to 2016. All patients in the cohort had received a preoperative lower-extremity venous duplex scan (VDS).
The authors found that the overall incidence of preoperative VTE detected on VDS in this asymptomatic population was 10.1%. Of this group, 48.6% of the VTEs were acute, 42.9% were chronic, and a small subset (8.5%) was classified as subacute.
The majority of VTEs (62.9%) were located below the knee, and all of those patients with above-the-knee VTEs (37.1%) received inferior vena cava filters prior to surgery.
None of the patients in this cohort experienced a postoperative pulmonary embolism.
The investigators also looked at various risk factors that could predispose patients to a higher risk of developing a VTE. They did not find any statistically significant differences between those with a preoperative VTE and those without one when looking at gender, body mass index, or cancer type.
There was, however, a statistically significant difference in age, with older age being significantly associated with preoperative VTE. Further analysis showed that patients were 1.3 times more likely to have a preoperative DVT for every 5-year increase in age (odds ratio, 1.3; 95% confidence interval, 1.1-1.6).
In addition, patients with preoperative VTEs were significantly more likely to experience postoperative complications, with an almost twofold increased incidence (25.7% vs. 13.2%, P = .046).
“Patients with preoperative VTE were 1.95 times more likely to develop a postoperative complication than patients without a preoperative VTE,” Dr. Gainsbury said.
In terms of comorbidities, there was no statistically significant difference in regards to history of a known lung disease, varicose veins, a known coagulation mutation, congestive heart failure, and inflammatory bowel disease.
There were also no statistical differences between hormone use or anticoagulants in patients with and without VTEs.
Of note, a recent history of sepsis appeared to be an important factor that put patients at risk for a subsequent VTE. “The preoperative VTE group had a higher rate of diagnosed sepsis during the month prior to surgery,” she said. “We believe that the preoperative diagnosis of sepsis represents a prior hospitalization and perhaps a sicker population at risk for VTEs.”
There was no funding source disclosed in the abstract. Dr. Gainsbury and her coauthors had no disclosures.
SEATTLE – Venous thromboembolism (VTE) is common in cancer, but 10% of asymptomatic patients undergoing major oncologic surgery have a preoperative VTE, according to findings presented at the annual Society of Surgical Oncology Cancer Symposium.
The incidence of preoperative VTE was associated with increasing age, a history of previous VTE, and a diagnosis of sepsis 1 month prior to undergoing oncologic surgery.
Surprisingly, noted study author Dr. Melanie Gainsbury of Cedar’s Sinai Medical Center, Los Angeles, it was not associated with oncologic factors such as locally recurrent disease, metastatic disease, or the receipt of neoadjuvant therapy.
“One may argue that patients undergoing oncologic surgery should receive preoperative lower-extremity duplex screening,” especially those who appear to be at high risk, she said.
About one in five cases of VTE is cancer related, and postoperative VTE is a leading cause of morbidity in cancer patients. However, Dr. Gainsbury noted, the incidence of preoperative VTE has not been well established or studied.
In this study, she and her colleagues evaluated the prevalence and risk factors associated with preoperative VTE in asymptomatic patients who were undergoing major oncologic surgery at an academic medical center.
In their retrospective analysis, the investigators identified 412 patients from the hospital’s database who underwent open abdominopelvic oncologic surgery between 2009 to 2016. All patients in the cohort had received a preoperative lower-extremity venous duplex scan (VDS).
The authors found that the overall incidence of preoperative VTE detected on VDS in this asymptomatic population was 10.1%. Of this group, 48.6% of the VTEs were acute, 42.9% were chronic, and a small subset (8.5%) was classified as subacute.
The majority of VTEs (62.9%) were located below the knee, and all of those patients with above-the-knee VTEs (37.1%) received inferior vena cava filters prior to surgery.
None of the patients in this cohort experienced a postoperative pulmonary embolism.
The investigators also looked at various risk factors that could predispose patients to a higher risk of developing a VTE. They did not find any statistically significant differences between those with a preoperative VTE and those without one when looking at gender, body mass index, or cancer type.
There was, however, a statistically significant difference in age, with older age being significantly associated with preoperative VTE. Further analysis showed that patients were 1.3 times more likely to have a preoperative DVT for every 5-year increase in age (odds ratio, 1.3; 95% confidence interval, 1.1-1.6).
In addition, patients with preoperative VTEs were significantly more likely to experience postoperative complications, with an almost twofold increased incidence (25.7% vs. 13.2%, P = .046).
“Patients with preoperative VTE were 1.95 times more likely to develop a postoperative complication than patients without a preoperative VTE,” Dr. Gainsbury said.
In terms of comorbidities, there was no statistically significant difference in regards to history of a known lung disease, varicose veins, a known coagulation mutation, congestive heart failure, and inflammatory bowel disease.
There were also no statistical differences between hormone use or anticoagulants in patients with and without VTEs.
Of note, a recent history of sepsis appeared to be an important factor that put patients at risk for a subsequent VTE. “The preoperative VTE group had a higher rate of diagnosed sepsis during the month prior to surgery,” she said. “We believe that the preoperative diagnosis of sepsis represents a prior hospitalization and perhaps a sicker population at risk for VTEs.”
There was no funding source disclosed in the abstract. Dr. Gainsbury and her coauthors had no disclosures.
AT SSO 2017
Key clinical point: 10% of asymptomatic cancer patients undergoing major cancer surgery have preoperative venous thromboembolism.
Major finding: Patients with preoperative VTEs were significantly more likely to experience postoperative complications, with an almost twofold increased incidence (25.7% vs. 13.2%, P = .046).
Data source: Retrospective analysis that included 412 who underwent open abdominopelvic oncologic surgery at a single academic center.
Disclosures: There was no funding source disclosed in the abstract. Dr. Gainsbury and her coauthors had no disclosures.
Flu Activity Falling Across the U.S.
Flu activity remained elevated for the entire U.S. for the week ending March 18, 2017, according the most recent report from the Centers for Disease Control and Prevention (CDC). The percentage of respiratory specimens testing positive for influenza in clinical laboratories also is falling, suggesting that flu season is coming to a close. The most frequently identified influenza continues to be virus subtype was influenza A (H3).
According to the CDC, 31,673 influenza positive specimens have been collected and reported by public health laboratories in the U.S. during the 2016-2017 season. The CDC genetically characterized 1,510 influenza viruses and the HA gene segment of all influenza A (H1N1)pdm09 viruses analyzed belonged to genetic group 6B.1. Influenza A (H3N2) virus HA gene segments analyzed belonged to genetic groups 3C.2a or 3C.3a. Genetic group 3C.2a includes a newly emerging subgroup known as 3C.2a1. The HA of influenza B/Victoria-lineage viruses all belonged to genetic group V1A. The HA of influenza B/Yamagata-lineage viruses analyzed all belonged to genetic group Y3.
Outpatient visits for influenza-like illness (ILI) dropped to 3.2%, still well above the national baseline (2.2%). Seven of 10 regions continued to experience high ILI activity. Alabama, Georgia, Indiana, Kansas, Kentucky, Louisiana, Maryland, Minnesota, Mississippi, Oklahoma, South Carolina, and Virginia all experienced high ILI activity. New York City, Puerto Rico, Colorado, Connecticut, Delaware, Florida, Hawaii, Idaho, Iowa, Maine, Massachusetts, Montana, Nebraska, Nevada, New Hampshire, New Jersey, New York, North Dakota, Ohio, Oregon, Utah, Vermont, Washington, West Virginia, and Wyoming all experienced minimal ILI activity.
Two more influenza-associated pediatric deaths were reported to CDC during the first week of March 2017. A total of 55 influenza-associated pediatric deaths have been reported for the 2016-2017 season..
Flu activity remained elevated for the entire U.S. for the week ending March 18, 2017, according the most recent report from the Centers for Disease Control and Prevention (CDC). The percentage of respiratory specimens testing positive for influenza in clinical laboratories also is falling, suggesting that flu season is coming to a close. The most frequently identified influenza continues to be virus subtype was influenza A (H3).
According to the CDC, 31,673 influenza positive specimens have been collected and reported by public health laboratories in the U.S. during the 2016-2017 season. The CDC genetically characterized 1,510 influenza viruses and the HA gene segment of all influenza A (H1N1)pdm09 viruses analyzed belonged to genetic group 6B.1. Influenza A (H3N2) virus HA gene segments analyzed belonged to genetic groups 3C.2a or 3C.3a. Genetic group 3C.2a includes a newly emerging subgroup known as 3C.2a1. The HA of influenza B/Victoria-lineage viruses all belonged to genetic group V1A. The HA of influenza B/Yamagata-lineage viruses analyzed all belonged to genetic group Y3.
Outpatient visits for influenza-like illness (ILI) dropped to 3.2%, still well above the national baseline (2.2%). Seven of 10 regions continued to experience high ILI activity. Alabama, Georgia, Indiana, Kansas, Kentucky, Louisiana, Maryland, Minnesota, Mississippi, Oklahoma, South Carolina, and Virginia all experienced high ILI activity. New York City, Puerto Rico, Colorado, Connecticut, Delaware, Florida, Hawaii, Idaho, Iowa, Maine, Massachusetts, Montana, Nebraska, Nevada, New Hampshire, New Jersey, New York, North Dakota, Ohio, Oregon, Utah, Vermont, Washington, West Virginia, and Wyoming all experienced minimal ILI activity.
Two more influenza-associated pediatric deaths were reported to CDC during the first week of March 2017. A total of 55 influenza-associated pediatric deaths have been reported for the 2016-2017 season..
Flu activity remained elevated for the entire U.S. for the week ending March 18, 2017, according the most recent report from the Centers for Disease Control and Prevention (CDC). The percentage of respiratory specimens testing positive for influenza in clinical laboratories also is falling, suggesting that flu season is coming to a close. The most frequently identified influenza continues to be virus subtype was influenza A (H3).
According to the CDC, 31,673 influenza positive specimens have been collected and reported by public health laboratories in the U.S. during the 2016-2017 season. The CDC genetically characterized 1,510 influenza viruses and the HA gene segment of all influenza A (H1N1)pdm09 viruses analyzed belonged to genetic group 6B.1. Influenza A (H3N2) virus HA gene segments analyzed belonged to genetic groups 3C.2a or 3C.3a. Genetic group 3C.2a includes a newly emerging subgroup known as 3C.2a1. The HA of influenza B/Victoria-lineage viruses all belonged to genetic group V1A. The HA of influenza B/Yamagata-lineage viruses analyzed all belonged to genetic group Y3.
Outpatient visits for influenza-like illness (ILI) dropped to 3.2%, still well above the national baseline (2.2%). Seven of 10 regions continued to experience high ILI activity. Alabama, Georgia, Indiana, Kansas, Kentucky, Louisiana, Maryland, Minnesota, Mississippi, Oklahoma, South Carolina, and Virginia all experienced high ILI activity. New York City, Puerto Rico, Colorado, Connecticut, Delaware, Florida, Hawaii, Idaho, Iowa, Maine, Massachusetts, Montana, Nebraska, Nevada, New Hampshire, New Jersey, New York, North Dakota, Ohio, Oregon, Utah, Vermont, Washington, West Virginia, and Wyoming all experienced minimal ILI activity.
Two more influenza-associated pediatric deaths were reported to CDC during the first week of March 2017. A total of 55 influenza-associated pediatric deaths have been reported for the 2016-2017 season..
Lower risk of heart attack with VKAs than with DOACs, aspirin

A large, retrospective study suggests patients with atrial fibrillation may have a lower risk of acute myocardial infarction (AMI) if they receive vitamin K antagonists (VKAs) rather than other anticoagulants.
Investigators found that patients taking direct oral anticoagulants (DOACs, rivaroxaban or dabigatran) had more than twice the AMI risk of patients taking VKAs.
And the AMI risk for patients taking low-dose aspirin was nearly double that of those taking VKAs.
Leo M. Stolk, PharmD, PhD, of Maastricht University Medical Centre in the Netherlands, and his colleagues reported these results in the British Journal of Clinical Pharmacology.
The investigators analyzed data on 30,146 adults with atrial fibrillation who were new users of DOACs (n=1266), VKAs (n=13,098), low-dose aspirin (n=15,400), or mixed anticoagulants (n=382). Most DOAC users were taking rivaroxaban (71.6%), but some were taking dabigatran (28.4%).
The mean follow-up was 0.95 years for DOAC users, 2.72 years for VKA users, 2.86 years for low-dose aspirin users, and 2.99 years for mixed medication users.
The investigators estimated the hazard ratio (HR) of AMI for users of DOACs, aspirin, or mixed medications versus VKAs. The team adjusted their analysis for age, sex, lifestyle, risk factors, comorbidities, and use of other medications.
Compared to VKA users, the risk of AMI was significantly higher for DOAC users (HR=2.11; 95% CI 1.08 – 4.12, P<0.05) and aspirin users (HR=1.91; 95% CI 1.45-2.51, P<0.05). The risk was not significantly higher for mixed medication users (HR=1.69; 95% CI 0.69, 4.16).
When patients were stratified by gender, there was a significantly increased risk of AMI for aspirin users who were male (HR=1.60; 95% CI 1.10, 2.33, P<0.05) or female (HR=2.33; 95% CI 1.55, 3.50, P<0.05), when compared to VKA users. Neither DOACs nor mixed medications were associated with a significantly increased risk of AMI in this analysis.
The investigators also stratified patients according to their CHA2DS2-VASc score at the index date.
Among patients with a high score (≥4), there was a significantly increased risk of AMI for aspirin users compared to VKA users (HR=2.21; 95% CI 1.37,3.55, P<0.05).
Among patients with a medium score (>1 and <4), the risk of AMI was significantly higher for DOAC users (HR=2.67; 95% CI 1.11, 6.40, P<0.05) and aspirin users (HR=1.82; 95% CI 1.23, 2.68, P<0.05) compared to VKA users.
The investigators said this study suggests VKAs probably have greater beneficial effects on AMI than DOACs, and ongoing research is needed as the use of DOACs increases. 
A large, retrospective study suggests patients with atrial fibrillation may have a lower risk of acute myocardial infarction (AMI) if they receive vitamin K antagonists (VKAs) rather than other anticoagulants.
Investigators found that patients taking direct oral anticoagulants (DOACs, rivaroxaban or dabigatran) had more than twice the AMI risk of patients taking VKAs.
And the AMI risk for patients taking low-dose aspirin was nearly double that of those taking VKAs.
Leo M. Stolk, PharmD, PhD, of Maastricht University Medical Centre in the Netherlands, and his colleagues reported these results in the British Journal of Clinical Pharmacology.
The investigators analyzed data on 30,146 adults with atrial fibrillation who were new users of DOACs (n=1266), VKAs (n=13,098), low-dose aspirin (n=15,400), or mixed anticoagulants (n=382). Most DOAC users were taking rivaroxaban (71.6%), but some were taking dabigatran (28.4%).
The mean follow-up was 0.95 years for DOAC users, 2.72 years for VKA users, 2.86 years for low-dose aspirin users, and 2.99 years for mixed medication users.
The investigators estimated the hazard ratio (HR) of AMI for users of DOACs, aspirin, or mixed medications versus VKAs. The team adjusted their analysis for age, sex, lifestyle, risk factors, comorbidities, and use of other medications.
Compared to VKA users, the risk of AMI was significantly higher for DOAC users (HR=2.11; 95% CI 1.08 – 4.12, P<0.05) and aspirin users (HR=1.91; 95% CI 1.45-2.51, P<0.05). The risk was not significantly higher for mixed medication users (HR=1.69; 95% CI 0.69, 4.16).
When patients were stratified by gender, there was a significantly increased risk of AMI for aspirin users who were male (HR=1.60; 95% CI 1.10, 2.33, P<0.05) or female (HR=2.33; 95% CI 1.55, 3.50, P<0.05), when compared to VKA users. Neither DOACs nor mixed medications were associated with a significantly increased risk of AMI in this analysis.
The investigators also stratified patients according to their CHA2DS2-VASc score at the index date.
Among patients with a high score (≥4), there was a significantly increased risk of AMI for aspirin users compared to VKA users (HR=2.21; 95% CI 1.37,3.55, P<0.05).
Among patients with a medium score (>1 and <4), the risk of AMI was significantly higher for DOAC users (HR=2.67; 95% CI 1.11, 6.40, P<0.05) and aspirin users (HR=1.82; 95% CI 1.23, 2.68, P<0.05) compared to VKA users.
The investigators said this study suggests VKAs probably have greater beneficial effects on AMI than DOACs, and ongoing research is needed as the use of DOACs increases.
A large, retrospective study suggests patients with atrial fibrillation may have a lower risk of acute myocardial infarction (AMI) if they receive vitamin K antagonists (VKAs) rather than other anticoagulants.
Investigators found that patients taking direct oral anticoagulants (DOACs, rivaroxaban or dabigatran) had more than twice the AMI risk of patients taking VKAs.
And the AMI risk for patients taking low-dose aspirin was nearly double that of those taking VKAs.
Leo M. Stolk, PharmD, PhD, of Maastricht University Medical Centre in the Netherlands, and his colleagues reported these results in the British Journal of Clinical Pharmacology.
The investigators analyzed data on 30,146 adults with atrial fibrillation who were new users of DOACs (n=1266), VKAs (n=13,098), low-dose aspirin (n=15,400), or mixed anticoagulants (n=382). Most DOAC users were taking rivaroxaban (71.6%), but some were taking dabigatran (28.4%).
The mean follow-up was 0.95 years for DOAC users, 2.72 years for VKA users, 2.86 years for low-dose aspirin users, and 2.99 years for mixed medication users.
The investigators estimated the hazard ratio (HR) of AMI for users of DOACs, aspirin, or mixed medications versus VKAs. The team adjusted their analysis for age, sex, lifestyle, risk factors, comorbidities, and use of other medications.
Compared to VKA users, the risk of AMI was significantly higher for DOAC users (HR=2.11; 95% CI 1.08 – 4.12, P<0.05) and aspirin users (HR=1.91; 95% CI 1.45-2.51, P<0.05). The risk was not significantly higher for mixed medication users (HR=1.69; 95% CI 0.69, 4.16).
When patients were stratified by gender, there was a significantly increased risk of AMI for aspirin users who were male (HR=1.60; 95% CI 1.10, 2.33, P<0.05) or female (HR=2.33; 95% CI 1.55, 3.50, P<0.05), when compared to VKA users. Neither DOACs nor mixed medications were associated with a significantly increased risk of AMI in this analysis.
The investigators also stratified patients according to their CHA2DS2-VASc score at the index date.
Among patients with a high score (≥4), there was a significantly increased risk of AMI for aspirin users compared to VKA users (HR=2.21; 95% CI 1.37,3.55, P<0.05).
Among patients with a medium score (>1 and <4), the risk of AMI was significantly higher for DOAC users (HR=2.67; 95% CI 1.11, 6.40, P<0.05) and aspirin users (HR=1.82; 95% CI 1.23, 2.68, P<0.05) compared to VKA users.
The investigators said this study suggests VKAs probably have greater beneficial effects on AMI than DOACs, and ongoing research is needed as the use of DOACs increases.
Company again withdraws application for pacritinib
CTI BioPharma has withdrawn its application for marketing authorization of pacritinib (Enpaxiq) in the European Union, according to the European Medicines Agency’s Committee for Medicinal Products for Human Use (CHMP).
The company was seeking approval for pacritinib, a JAK2/FLT3 inhibitor, to treat splenomegaly or symptoms of myelofibrosis (MF) in adults with primary MF, post-polycythemia vera MF, or post-essential thrombocythemia MF.
When the application was withdrawn, the CHMP was of the provisional opinion that pacritinib could not have been approved for this indication.
Last year, CTI BioPharma withdrew its application for approval of pacritinib in the US.
Issues preventing approval
The CHMP said it had a number of concerns related to the PERSIST-1 trial, which was used to support the application for approval in the European Union. In this trial, researchers compared pacritinib to best available therapy, excluding JAK inhibitors, in patients with MF.
The CHMP said the reduction in spleen size, which was the main efficacy outcome in the study, appeared to be lower with pacritinib than with another medicine of its class, with no improvement in symptom scores.
In addition, the incidence of thrombocytopenia was higher in patients treated with pacritinib.
And more deaths occurred in patients taking pacritinib than in those receiving best available therapy, including deaths due to bleeding and adverse effects on the heart.
The CHMP also said it needs more information about the starting materials used in the manufacture of pacritinib and how the drug acts on target proteins.
Given these concerns, the CHMP was of the opinion that pacritinib’s benefits had not been shown to outweigh its risks.
CTI BioPharma said it could address the CHMP’s concerns by providing data from a second study of pacritinib, PERSIST-2.
However, there was not enough time in the current application procedure to provide the data, so the company decided to withdraw the application.
CTI BioPharma said it intends to integrate data from PERSIST-2 into its current dossier before approaching the European Medicines Agency to discuss a new application.
The company also said the withdrawal of its application will not affect patients currently enrolled in clinical trials of pacritinib or compassionate use programs for the drug.
Previous withdrawal, clinical hold
CTI BioPharma withdrew its application for approval of pacritinib in the US after the US Food and Drug Administration (FDA) placed a full clinical hold on trials of the drug.
The FDA placed the hold on pacritinib trials in February 2016 after results from PERSIST-1 and PERSIST-2 showed excess mortality in patients who received pacritinib.
The FDA lifted the hold in January 2017 after CTI BioPharma agreed to conduct dose-exploration studies for pacritinib, submit final study reports and data sets for PERSIST-1 and PERSIST-2, and make modifications to protocols and study-related documents.
CTI BioPharma has withdrawn its application for marketing authorization of pacritinib (Enpaxiq) in the European Union, according to the European Medicines Agency’s Committee for Medicinal Products for Human Use (CHMP).
The company was seeking approval for pacritinib, a JAK2/FLT3 inhibitor, to treat splenomegaly or symptoms of myelofibrosis (MF) in adults with primary MF, post-polycythemia vera MF, or post-essential thrombocythemia MF.
When the application was withdrawn, the CHMP was of the provisional opinion that pacritinib could not have been approved for this indication.
Last year, CTI BioPharma withdrew its application for approval of pacritinib in the US.
Issues preventing approval
The CHMP said it had a number of concerns related to the PERSIST-1 trial, which was used to support the application for approval in the European Union. In this trial, researchers compared pacritinib to best available therapy, excluding JAK inhibitors, in patients with MF.
The CHMP said the reduction in spleen size, which was the main efficacy outcome in the study, appeared to be lower with pacritinib than with another medicine of its class, with no improvement in symptom scores.
In addition, the incidence of thrombocytopenia was higher in patients treated with pacritinib.
And more deaths occurred in patients taking pacritinib than in those receiving best available therapy, including deaths due to bleeding and adverse effects on the heart.
The CHMP also said it needs more information about the starting materials used in the manufacture of pacritinib and how the drug acts on target proteins.
Given these concerns, the CHMP was of the opinion that pacritinib’s benefits had not been shown to outweigh its risks.
CTI BioPharma said it could address the CHMP’s concerns by providing data from a second study of pacritinib, PERSIST-2.
However, there was not enough time in the current application procedure to provide the data, so the company decided to withdraw the application.
CTI BioPharma said it intends to integrate data from PERSIST-2 into its current dossier before approaching the European Medicines Agency to discuss a new application.
The company also said the withdrawal of its application will not affect patients currently enrolled in clinical trials of pacritinib or compassionate use programs for the drug.
Previous withdrawal, clinical hold
CTI BioPharma withdrew its application for approval of pacritinib in the US after the US Food and Drug Administration (FDA) placed a full clinical hold on trials of the drug.
The FDA placed the hold on pacritinib trials in February 2016 after results from PERSIST-1 and PERSIST-2 showed excess mortality in patients who received pacritinib.
The FDA lifted the hold in January 2017 after CTI BioPharma agreed to conduct dose-exploration studies for pacritinib, submit final study reports and data sets for PERSIST-1 and PERSIST-2, and make modifications to protocols and study-related documents.
CTI BioPharma has withdrawn its application for marketing authorization of pacritinib (Enpaxiq) in the European Union, according to the European Medicines Agency’s Committee for Medicinal Products for Human Use (CHMP).
The company was seeking approval for pacritinib, a JAK2/FLT3 inhibitor, to treat splenomegaly or symptoms of myelofibrosis (MF) in adults with primary MF, post-polycythemia vera MF, or post-essential thrombocythemia MF.
When the application was withdrawn, the CHMP was of the provisional opinion that pacritinib could not have been approved for this indication.
Last year, CTI BioPharma withdrew its application for approval of pacritinib in the US.
Issues preventing approval
The CHMP said it had a number of concerns related to the PERSIST-1 trial, which was used to support the application for approval in the European Union. In this trial, researchers compared pacritinib to best available therapy, excluding JAK inhibitors, in patients with MF.
The CHMP said the reduction in spleen size, which was the main efficacy outcome in the study, appeared to be lower with pacritinib than with another medicine of its class, with no improvement in symptom scores.
In addition, the incidence of thrombocytopenia was higher in patients treated with pacritinib.
And more deaths occurred in patients taking pacritinib than in those receiving best available therapy, including deaths due to bleeding and adverse effects on the heart.
The CHMP also said it needs more information about the starting materials used in the manufacture of pacritinib and how the drug acts on target proteins.
Given these concerns, the CHMP was of the opinion that pacritinib’s benefits had not been shown to outweigh its risks.
CTI BioPharma said it could address the CHMP’s concerns by providing data from a second study of pacritinib, PERSIST-2.
However, there was not enough time in the current application procedure to provide the data, so the company decided to withdraw the application.
CTI BioPharma said it intends to integrate data from PERSIST-2 into its current dossier before approaching the European Medicines Agency to discuss a new application.
The company also said the withdrawal of its application will not affect patients currently enrolled in clinical trials of pacritinib or compassionate use programs for the drug.
Previous withdrawal, clinical hold
CTI BioPharma withdrew its application for approval of pacritinib in the US after the US Food and Drug Administration (FDA) placed a full clinical hold on trials of the drug.
The FDA placed the hold on pacritinib trials in February 2016 after results from PERSIST-1 and PERSIST-2 showed excess mortality in patients who received pacritinib.
The FDA lifted the hold in January 2017 after CTI BioPharma agreed to conduct dose-exploration studies for pacritinib, submit final study reports and data sets for PERSIST-1 and PERSIST-2, and make modifications to protocols and study-related documents.