User login
FDA approves rituximab for treating pemphigus vulgaris
Rituximab (Rituxan) has been approved for the treatment of adults with moderate to severe pemphigus vulgaris, the manufacturer announced on June 7.
Rituximab is the first biologic approved for treating pemphigus vulgaris, Genentech, a member of the Roche group, stated in a press release announcing the approval.
The prospective, multicenter, open-label, randomized trial, conducted in France, compared the rituximab product approved in the European Union, plus short-term corticosteroid therapy (1,000 mg rituximab administered intravenously at baseline and day 14, then 500 mg at 12 and 18 months, plus 0.5 mg/kg or 1.0 mg/kg per day of prednisone tapered over 3 or 6 months) to corticosteroid therapy alone (oral prednisone 1.0 or 1.5 mg/kg per day tapered over 12 or 18 months), in 90 patients newly diagnosed with moderate to severe pemphigus.
At 24 months, 89% of those in the rituximab group met the primary endpoint, complete remission off therapy at 24 months, compared with 34% of those on corticosteroids (P less than .0001), the investigators reported (Lancet. 2017 May 20;389[10083]:2031-40). Severe adverse events were more commonly reported in the prednisone-only group.
First approved in 1997, rituximab, an anti-CD20 monoclonal antibody, is approved for non-Hodgkin lymphoma, rheumatoid arthritis, chronic lymphocytic leukemia, and granulomatosis with polyangiitis. The prescribing information includes a boxed warning about the risks of fatal infusion reactions, severe mucocutaneous reactions, hepatitis B virus reactivation, and progressive multifocal leukoencephalopathy.
The study published in the Lancet was funded by Roche, the French Ministry of Health, and the French Society of Dermatology.
Multi-Modal Pain Control in Ambulatory Hand Surgery
ABSTRACT
We evaluated postoperative pain control and narcotic usage after thumb carpometacarpal (CMC) arthroplasty or open reduction and internal fixation (ORIF) of the distal radius in patients given opiates with or without other non-opiate medication using a specific dosing regimen. A prospective, randomized study of 79 patients undergoing elective CMC arthroplasty or ORIF of the distal radius evaluated postoperative pain in the first 5 postoperative days. Patients were divided into 4 groups: Group 1, oxycodone and acetaminophen PRN; Group 2, oxycodone and acetaminophen with specific dosing; Group 3, oxycodone, acetaminophen, and OxyContin with specific dosing; and Group 4, oxycodone, acetaminophen, and ketorolac with specific dosing. During the first 5 postoperative days, we recorded pain levels according to a numeric pain scale, opioid usage, and complications. Although differences in our data did not reach statistical significance, overall pain scores, opioid usage, and complication rates were less prevalent in the oxycodone, acetaminophen, and ketorolac group. Postoperative pain following ambulatory hand and wrist surgery under regional anesthesia was more effectively controlled with fewer complications using a combination of oxycodone, acetaminophen, and ketorolac with a specific dosing regimen.
Continue to: Regional anesthesia...
Regional anesthesia is a safe and effective modality of perioperative pain control in patients undergoing ambulatory hand procedures.1-10 Often, as the regional block wears off, patients experience a rebound pain effect that can be challenging to manage.
We sought to determine if an organized, multimodal approach in patients undergoing thumb carpometacarpal (CMC) arthroplasty or open reduction and internal fixation (ORIF) of distal radius fractures would provide better postoperative pain control. We hypothesized that this approach would significantly reduce postoperative pain and the need for narcotic pain medication compared with PRN dosing of oxycodone/acetaminophen alone.11-14
MATERIALS AND METHODS
Our study was approved by our Institutional Review Board. Informed consent was obtained from each patient. Patients presenting for elective thumb CMC arthroplasty or ORIF of the distal radius were screened for inclusion in a prospective, randomized study. Inclusion criteria included patients aged 18 to 65 years who could provide informed consent. Patients with chronic pain syndromes, long-term narcotic usage, chronic medical conditions precluding the use of opiates or nonsteroidal anti-inflammatory drugs (NSAIDs), and those who did not have a complete sensory and motor block postoperatively were excluded.
Patients were randomly divided into 1 of 4 study arms. Randomization was performed via sealed envelopes, which were opened in the recovery area when postoperative prescriptions were written. The group distribution was as follows: Group 1, Percocet 5 mg/325 mg alone (control); Group 2, oxycodone 5 mg, acetaminophen 325 mg administered separately; Group 3, oxycodone 5 mg, acetaminophen 325 mg, and oxycodone SR (OxyContin) 10 mg; and Group 4, oxycodone 5 mg, acetaminophen 325 mg, and ketorolac (Toradol) 10 mg (Table 1). Patients in the control group were instructed to take 1 or 2 tablets every 4 to 6 hours as needed for pain. Patients in the 3 experimental groups were given detailed instructions regarding when and how to take their medications. All patients were instructed to take 650 mg of acetaminophen every 6 hours. Patients were provided a sliding scale to assist in dosing their opioid medications according to their numeric pain score (NPS) (Table 2). Group 2 patients were given oxycodone 10 mg in the postanesthesia care unit (PACU) and instructed to take oxycodone 10 mg with acetaminophen 650 mg every 6 hours on a scheduled basis until their block wore off, then dose themselves using the NPS.
Table 1. Patient Groups
Group | Anesthesia | Pain Medications |
1 (standard treatment) | Brachial plexus block | Percocet (oxycodone and acetaminophen) 5-10 mg every 4-6 hours as needed for pain. |
2 | Brachial plexus block | 1. Oxycodone 0-15 mg every 4-6 hours as needed for pain based on pain scale score. 2. Tylenol (Acetaminophen) 650 mg every 6 hours, scheduled. |
3 | Brachial plexus block | 1. Oxycodone 0-15 mg every 4-6 hours as needed for pain based on numeric pain scale. 2. Tylenol (Acetaminophen) 650 mg every 6 hours, scheduled. 3. OxyContin (oxycodone sustained release) 10 mg twice a day, scheduled. |
4 | Brachial plexus block | 1. Oxycodone 0-15 mg every 4-6 hours as needed for pain based on pain scale score. 2. Tylenol (Acetaminophen) 650 mg every 6 hours, scheduled. 3. Toradol (Ketorolac) 10mg every 6 hours, scheduled. |
Table 2. Sliding Scale for Pain Control in the Experimental Groups
Pain Score | Oxycodone Dose |
0-3 | 5 mg (1 tablet) |
4-7 | 10 mg (2 tablets) |
8-10 | 15 mg (3 tablets) |
Group 3 patients were given oxycodone 10 mg in the PACU and instructed to take oxycodone 10 mg with acetaminophen 650 mg every 6 hours and OxyContin 10 mg every 12 hours on a scheduled basis until their block wore off, then dose themselves using NPS. Group 4 patients were given oxycodone 10 mg postoperatively and ketorolac 30 mg intravenously in the PACU and instructed to take oxycodone 10 mg, acetaminophen 650 mg, and ketorolac 10 mg every 6 hours on a scheduled basis until their block wore off, then dose themselves using the NPS.
Patients were provided with a journal and asked to record their medication usage, NPS, and any adverse effects (nausea, vomiting, and uncontrolled pain were specifically mentioned) or complications for 5 days after their procedure. We also attempted to contact patients by telephone on each of the 5 days after their procedure to remind them to complete their logs. They were asked specifically if they were having difficulty with their medications. They were also asked specifically about nausea, vomiting, and over-sedation. If patients requested additional medication to help treat their pain, they were instructed to add an over-the-counter NSAID of their choice based on the label’s suggested dosing.
Continue to: All patients received a supraclavicular...
All patients received a supraclavicular brachial plexus block using 0.75% ropivacaine under the supervision of an attending anesthesiologist experienced in regional anesthesia. Patients underwent thumb CMC arthroplasty utilizing complete resection of the trapezium followed by abductor pollicis longus suspensionplasty under the supervision of 1 of 3 fellowship-trained hand surgeons. ORIF of the distal radius was completed utilizing a volar approach and distal radius locking plate under the supervision of 1 of 3 fellowship-trained hand surgeons.
Primary outcome measures were the total number of oxycodone tablets taken daily and the average daily NPS. Secondary outcomes measured included adverse effects as noted above and the need for a trip to the emergency department for unrelieved pain.
A power analysis was completed prior to the beginning of the study. To detect a difference of at least 1 on the NPS, we determined that 18 patients per group would provide 80% power. This was based on literature utilizing the visual analog scale (VAS), a 100-mm line on which patients can place a mark to describe the intensity of their pain. The standard deviation on the VAS is approximately 15 mm. To account for potential dropout, we elected to recruit 20 patients per group. Non-paired t tests were used to compare groups.
RESULTS
One hundred and eighteen patients enrolled in the study. Of those, 79 patients completed and returned their summary logs (by group: 18 control, 20 oxycodone, 17 OxyContin, and 24 ketorolac). The remaining patients were excluded from the final analysis because they did not return their summary logs. Only 1 patient was excluded from the analysis because he did not have adequate regional anesthesia. Demographic data were analyzed and showed no significant differences between groups at the P < .05 level of significance. Surgical procedures were completed by 3 fellowship-trained hand surgeons. Distal radius fractures were performed using a volar approach. CMC arthroplasty was performed using a procedure that was standardized across surgeons. There were no between-surgeon differences in outcomes.
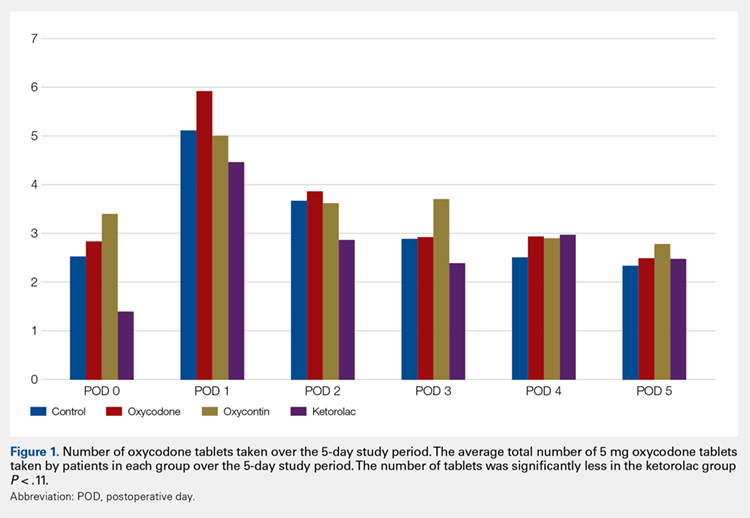
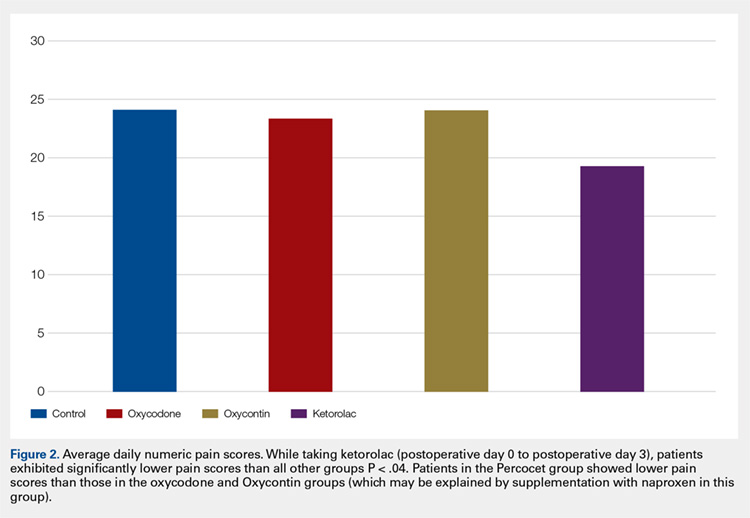
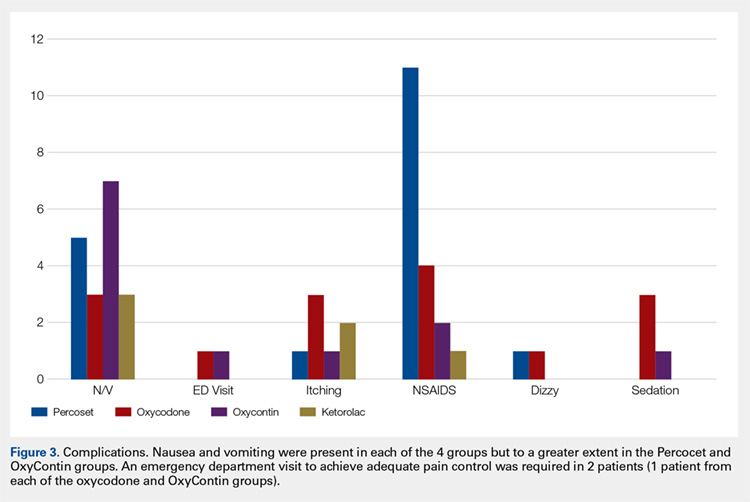
Average daily NPS (Figure 1) and the total number of oxycodone tablets taken (Figure 2) over the 5-day study period were recorded. Patients in the ketorolac group used fewer oxycodone tablets (19.3) than patients in the other 3 groups (24.4), P =.11, but the difference was not statistically significant. The maximum number of oxycodone tablets used was 71 in the Percocet group, 57 in the oxycodone and ketorolac groups, and 73 in the OxyContin group. The average daily NPS was lower in the ketorolac group during the period of medication use. This value only reached statistical significance on postoperative day 0 when the ketorolac group was compared with the OxyContin group (P = .01) and on postoperative day 1 when the ketorolac group was compared with the oxycodone group (P = .04). Complications (Figure 3) were greater in the non-ketorolac groups. One patient each in the oxycodone and OxyContin groups required a trip to the emergency department for pain control after their block wore off. Nausea and vomiting were present in each of the 4 groups but to a much greater degree in the Percocet and OxyContin groups; however, these results did not reach statistical significance (P = .129). Eleven of the 18 patients in the Percocet group required an additional NSAID (naproxen) and still did not achieve pain control similar to the other groups. This may explain why the average daily pain score in the Percocet group was lower than that in the oxycodone group, in which only 4 of the 20 patients supplemented with naproxen. Patients did, however, require many more oxycodone tablets to achieve pain control in the Percocet group. Over-sedation was reported in 3 patients in the oxycodone group and in 1 patient in the OxyContin group. No patients were found to have bleeding, renal, or other systemic complications.
Continue to: Discussion...
DISCUSSION
In this prospective, randomized study, we sought to determine whether a more organized approach to treating postoperative pain using a specific dosing regimen or opiates in conjunction with non-opiate medications would lead to improved pain control and a decreased need for opiates. We found that adding ketorolac to the postoperative pain regimen and outlining a more detailed set of instructions could lower narcotic usage in the first 4 postoperative days. In addition, adding ketorolac decreased other complications commonly seen with narcotic usage and was shown to be safe in our patient population.
Ketorolac has been shown to decrease narcotic pain medication usage in several surgical settings and across different surgical specialties. It is hypothesized that ketorolac potentiates the effects of narcotics.11 Ketorolac given alone has a potent analgesic effect by acting as a strong non-selective cyclooxygenase inhibitor. The major drawback to ketorolac use has been its well-known side-effect profile. Ketorolac is renally excreted, and as such, should not be used in patients with renal insufficiency. In addition, ketorolac has been shown to cause increased gastrointestinal bleeding when used for >5 days.15 Caution should be taken when combining ketorolac with thromboprophylactic medications, especially in older patients.
Many surgeons use NSAIDs along with narcotics as part of a postoperative pain regimen. While this is often adequate for some procedures, when the surgery involves manipulating fractures, internal fixation, or resection arthroplasty, the variation in individual patient pain may call for a more robust protocol. Additionally, as surgeons expand to more complex procedures performed in the outpatient setting, evaluating different combinations of analgesics taken in a more structured manner may provide for improved pain control.
A major component of patient satisfaction is postoperative pain control.3-8,12,16,17 Regional anesthesia is an important tool that allows patients to undergo a surgical procedure with a greatly reduced amount of opioid pain medications. In addition, regional anesthesia can provide significant pain control after the patient has left the ambulatory surgery center, but this relief is short-lived because the medication is designed to lose effectiveness over time. As the effects of regional anesthesia wear off, patients can experience “rebound pain” with severe levels of pain that, on occasion, cannot be controlled with oral analgesics alone. The addition of ketorolac provided improved pain control when compared with the other regimens during this transition period when the regional anesthesia was becoming ineffective. In addition, because patients taking ketorolac used less narcotic medication, they experienced less nausea, vomiting, and over-sedation.
Additionally, patients were instructed to record their medication usage and pain scores on a prospective basis, with the hope of eliminating recall bias. A potential weakness is the inability to show significance for pain relief and reduced narcotic usage with the addition of ketorolac, although there was a trend toward significance. Many of the patients who enrolled in the trial did not return their medication logs. While these patients had to be excluded from data analysis, we continued enrollment until we obtained an adequate number of patients in each group. In addition, in the OxyContin group (Group 3), we could only recruit 17 participants, instead of the 18 needed based on our power study. Although this has a potential to alter the significance of our results, we do not feel this had a substantial impact on our results.
Many patients in the non-ketorolac groups supplemented their medication regimens with NSAIDs, which may have falsely lowered pain scores and narcotic usage. While this confounds our study results, we do not believe that it invalidates the conclusion that ketorolac can be an effective adjunct pain medication for use in patients undergoing ambulatory hand surgery.
The study examined postoperative pain control for only 2 procedures, thumb basal joint arthroplasty and distal radius fracture fixation, both commonly performed in the outpatient setting under regional anesthesia and both typically requiring narcotic pain medication. Perhaps the utilization of these medication regimens with different surgical procedures would have differing results.
We conclude that ketorolac potentially provides patients with improved pain control over the use of narcotic pain medications alone in the setting of ambulatory hand surgery.
This paper will be judged for the Resident Writer’s Award.
- Boezaart AP, Davis G, Le-Wendling L. Recovery after orthopedic surgery: techniques to increase duration of pain control. Curr Opin Anaesthesiol. 2012;25(6):665-672. doi:10.1097/ACO.0b013e328359ab5a.
- Buvanendran A, Kroin JS. Useful adjuvants for postoperative pain management. Best Pract Res Clin Anaesthesiol. 2007;21(1):31-49. doi:10.1016/j.bpa.2006.12.003.
- Coluzzi F, Bragazzi L, Di Bussolo E, Pizza G, Mattia C. Determinants of patient satisfaction in postoperative pain management following hand ambulatory day-surgery. Minerva Med. 2011;102(3):177-186.
- Elvir-Lazo OL, White PF. Postoperative pain management after ambulatory surgery: role of multimodal analgesia. Anesthesiol Clin. 2010;28(2):217-224. doi: 10.1016/j.anclin.2010.02.011.
- Kopp SL, Horlocker TT. Regional anaesthesia in day-stay and short-stay surgery. Anaesthesia. 2010;65(Suppl 1):84-96. doi:10.1111/j.1365-2044.2009.06204.x.
- Rawal N. Postoperative pain treatment for ambulatory surgery. Best Pract Res Clin Anaesthesiol. 2007;21(1):129-148. doi:10.1016/j.bpa.2006.11.005.
- Schug SA, Chong C. Pain management after ambulatory surgery. Curr Opin Anaesthesiol. 2009;22(6):738-743. doi:10.1097/ACO.0b013e32833020f4.
- Sripada R, Bowens C Jr. Regional anesthesia procedures for shoulder and upper arm surgery upper extremity update--2005 to present. Int Anesthesiol Clin. 2012;50(1):26-46. doi:10.1097/AIA.0b013e31821a0284.
- Trompeter A, Camilleri G, Narang K, Hauf W, Venn R. Analgesia requirements after interscalene block for shoulder arthroscopy: the 5 days following surgery. Arch Orthop Trauma Surg. 2010;130(3):417-421. doi:10.1007/s00402-009-0959-9.
- Dufeu N, Marchand-Maillet F, Atchabahian A, et al. Efficacy and safety of ultrasound-guided distal blocks for analgesia without motor blockade after ambulatory hand surgery. J Hand Surg Am. 2014;39(4):737-743. doi:10.1016/j.jhsa.2014.01.011.
- Gutta R, Koehn CR, James LE. Does ketorolac have a preemptive analgesic effect? A randomized, double-blind, control study. J Oral Maxillofac Surg. 2013;71(12):2029-2034. doi:10.1016/j.joms.2013.06.220.
- Nossaman VE, Ramadhyani U, Kadowitz PJ, Nossaman BD. Advances in perioperative pain management: use of medications with dual analgesic mechanisms, tramadol & tapentadol. Anesthesiol Clin. 2010;28(4):647-666. doi:10.1016/j.anclin.2010.08.009.
- Warren-Stomberg M, Brattwall M, Jakobsson JG. Non-opioid analgesics for pain management following ambulatory surgery: a review. Minerva Anestesiol. 2013;79(9):1077-1087.
- Wickerts L, Warrén Stomberg M, Brattwall M, Jakobsson JJ. Coxibs: is there a benefit when compared to traditional non-selective NSAIDs in postoperative pain management? Minerva Anestesiol. 2011;77(11):1084-1098.
- Strom BL, Berlin JA, Kinman JL, et al. Parenteral ketorolac and risk of gastrointestinal and operative site bleeding. A postmarketing surveillance study. JAMA. 1996;275(5):376-382. doi:10.1001/jama.275.5.376.
- Hegarty M, Calder A, Davies K, et al. Does take-home analgesia improve postoperative pain after elective day case surgery? A comparison of hospital vs parent-supplied analgesia. Paediatr Anaesth. 2013;23(5):385-389. doi:10.1111/pan.12077.
- Weber SC, Jain R, Parise C. Pain scores in the management of postoperative pain in shoulder surgery. Arthroscopy. 2007;23(1):65-72. doi:10.1016/j.arthro.2006.11.002.
ABSTRACT
We evaluated postoperative pain control and narcotic usage after thumb carpometacarpal (CMC) arthroplasty or open reduction and internal fixation (ORIF) of the distal radius in patients given opiates with or without other non-opiate medication using a specific dosing regimen. A prospective, randomized study of 79 patients undergoing elective CMC arthroplasty or ORIF of the distal radius evaluated postoperative pain in the first 5 postoperative days. Patients were divided into 4 groups: Group 1, oxycodone and acetaminophen PRN; Group 2, oxycodone and acetaminophen with specific dosing; Group 3, oxycodone, acetaminophen, and OxyContin with specific dosing; and Group 4, oxycodone, acetaminophen, and ketorolac with specific dosing. During the first 5 postoperative days, we recorded pain levels according to a numeric pain scale, opioid usage, and complications. Although differences in our data did not reach statistical significance, overall pain scores, opioid usage, and complication rates were less prevalent in the oxycodone, acetaminophen, and ketorolac group. Postoperative pain following ambulatory hand and wrist surgery under regional anesthesia was more effectively controlled with fewer complications using a combination of oxycodone, acetaminophen, and ketorolac with a specific dosing regimen.
Continue to: Regional anesthesia...
Regional anesthesia is a safe and effective modality of perioperative pain control in patients undergoing ambulatory hand procedures.1-10 Often, as the regional block wears off, patients experience a rebound pain effect that can be challenging to manage.
We sought to determine if an organized, multimodal approach in patients undergoing thumb carpometacarpal (CMC) arthroplasty or open reduction and internal fixation (ORIF) of distal radius fractures would provide better postoperative pain control. We hypothesized that this approach would significantly reduce postoperative pain and the need for narcotic pain medication compared with PRN dosing of oxycodone/acetaminophen alone.11-14
MATERIALS AND METHODS
Our study was approved by our Institutional Review Board. Informed consent was obtained from each patient. Patients presenting for elective thumb CMC arthroplasty or ORIF of the distal radius were screened for inclusion in a prospective, randomized study. Inclusion criteria included patients aged 18 to 65 years who could provide informed consent. Patients with chronic pain syndromes, long-term narcotic usage, chronic medical conditions precluding the use of opiates or nonsteroidal anti-inflammatory drugs (NSAIDs), and those who did not have a complete sensory and motor block postoperatively were excluded.
Patients were randomly divided into 1 of 4 study arms. Randomization was performed via sealed envelopes, which were opened in the recovery area when postoperative prescriptions were written. The group distribution was as follows: Group 1, Percocet 5 mg/325 mg alone (control); Group 2, oxycodone 5 mg, acetaminophen 325 mg administered separately; Group 3, oxycodone 5 mg, acetaminophen 325 mg, and oxycodone SR (OxyContin) 10 mg; and Group 4, oxycodone 5 mg, acetaminophen 325 mg, and ketorolac (Toradol) 10 mg (Table 1). Patients in the control group were instructed to take 1 or 2 tablets every 4 to 6 hours as needed for pain. Patients in the 3 experimental groups were given detailed instructions regarding when and how to take their medications. All patients were instructed to take 650 mg of acetaminophen every 6 hours. Patients were provided a sliding scale to assist in dosing their opioid medications according to their numeric pain score (NPS) (Table 2). Group 2 patients were given oxycodone 10 mg in the postanesthesia care unit (PACU) and instructed to take oxycodone 10 mg with acetaminophen 650 mg every 6 hours on a scheduled basis until their block wore off, then dose themselves using the NPS.
Table 1. Patient Groups
Group | Anesthesia | Pain Medications |
1 (standard treatment) | Brachial plexus block | Percocet (oxycodone and acetaminophen) 5-10 mg every 4-6 hours as needed for pain. |
2 | Brachial plexus block | 1. Oxycodone 0-15 mg every 4-6 hours as needed for pain based on pain scale score. 2. Tylenol (Acetaminophen) 650 mg every 6 hours, scheduled. |
3 | Brachial plexus block | 1. Oxycodone 0-15 mg every 4-6 hours as needed for pain based on numeric pain scale. 2. Tylenol (Acetaminophen) 650 mg every 6 hours, scheduled. 3. OxyContin (oxycodone sustained release) 10 mg twice a day, scheduled. |
4 | Brachial plexus block | 1. Oxycodone 0-15 mg every 4-6 hours as needed for pain based on pain scale score. 2. Tylenol (Acetaminophen) 650 mg every 6 hours, scheduled. 3. Toradol (Ketorolac) 10mg every 6 hours, scheduled. |
Table 2. Sliding Scale for Pain Control in the Experimental Groups
Pain Score | Oxycodone Dose |
0-3 | 5 mg (1 tablet) |
4-7 | 10 mg (2 tablets) |
8-10 | 15 mg (3 tablets) |
Group 3 patients were given oxycodone 10 mg in the PACU and instructed to take oxycodone 10 mg with acetaminophen 650 mg every 6 hours and OxyContin 10 mg every 12 hours on a scheduled basis until their block wore off, then dose themselves using NPS. Group 4 patients were given oxycodone 10 mg postoperatively and ketorolac 30 mg intravenously in the PACU and instructed to take oxycodone 10 mg, acetaminophen 650 mg, and ketorolac 10 mg every 6 hours on a scheduled basis until their block wore off, then dose themselves using the NPS.
Patients were provided with a journal and asked to record their medication usage, NPS, and any adverse effects (nausea, vomiting, and uncontrolled pain were specifically mentioned) or complications for 5 days after their procedure. We also attempted to contact patients by telephone on each of the 5 days after their procedure to remind them to complete their logs. They were asked specifically if they were having difficulty with their medications. They were also asked specifically about nausea, vomiting, and over-sedation. If patients requested additional medication to help treat their pain, they were instructed to add an over-the-counter NSAID of their choice based on the label’s suggested dosing.
Continue to: All patients received a supraclavicular...
All patients received a supraclavicular brachial plexus block using 0.75% ropivacaine under the supervision of an attending anesthesiologist experienced in regional anesthesia. Patients underwent thumb CMC arthroplasty utilizing complete resection of the trapezium followed by abductor pollicis longus suspensionplasty under the supervision of 1 of 3 fellowship-trained hand surgeons. ORIF of the distal radius was completed utilizing a volar approach and distal radius locking plate under the supervision of 1 of 3 fellowship-trained hand surgeons.
Primary outcome measures were the total number of oxycodone tablets taken daily and the average daily NPS. Secondary outcomes measured included adverse effects as noted above and the need for a trip to the emergency department for unrelieved pain.
A power analysis was completed prior to the beginning of the study. To detect a difference of at least 1 on the NPS, we determined that 18 patients per group would provide 80% power. This was based on literature utilizing the visual analog scale (VAS), a 100-mm line on which patients can place a mark to describe the intensity of their pain. The standard deviation on the VAS is approximately 15 mm. To account for potential dropout, we elected to recruit 20 patients per group. Non-paired t tests were used to compare groups.
RESULTS
One hundred and eighteen patients enrolled in the study. Of those, 79 patients completed and returned their summary logs (by group: 18 control, 20 oxycodone, 17 OxyContin, and 24 ketorolac). The remaining patients were excluded from the final analysis because they did not return their summary logs. Only 1 patient was excluded from the analysis because he did not have adequate regional anesthesia. Demographic data were analyzed and showed no significant differences between groups at the P < .05 level of significance. Surgical procedures were completed by 3 fellowship-trained hand surgeons. Distal radius fractures were performed using a volar approach. CMC arthroplasty was performed using a procedure that was standardized across surgeons. There were no between-surgeon differences in outcomes.
Average daily NPS (Figure 1) and the total number of oxycodone tablets taken (Figure 2) over the 5-day study period were recorded. Patients in the ketorolac group used fewer oxycodone tablets (19.3) than patients in the other 3 groups (24.4), P =.11, but the difference was not statistically significant. The maximum number of oxycodone tablets used was 71 in the Percocet group, 57 in the oxycodone and ketorolac groups, and 73 in the OxyContin group. The average daily NPS was lower in the ketorolac group during the period of medication use. This value only reached statistical significance on postoperative day 0 when the ketorolac group was compared with the OxyContin group (P = .01) and on postoperative day 1 when the ketorolac group was compared with the oxycodone group (P = .04). Complications (Figure 3) were greater in the non-ketorolac groups. One patient each in the oxycodone and OxyContin groups required a trip to the emergency department for pain control after their block wore off. Nausea and vomiting were present in each of the 4 groups but to a much greater degree in the Percocet and OxyContin groups; however, these results did not reach statistical significance (P = .129). Eleven of the 18 patients in the Percocet group required an additional NSAID (naproxen) and still did not achieve pain control similar to the other groups. This may explain why the average daily pain score in the Percocet group was lower than that in the oxycodone group, in which only 4 of the 20 patients supplemented with naproxen. Patients did, however, require many more oxycodone tablets to achieve pain control in the Percocet group. Over-sedation was reported in 3 patients in the oxycodone group and in 1 patient in the OxyContin group. No patients were found to have bleeding, renal, or other systemic complications.
Continue to: Discussion...
DISCUSSION
In this prospective, randomized study, we sought to determine whether a more organized approach to treating postoperative pain using a specific dosing regimen or opiates in conjunction with non-opiate medications would lead to improved pain control and a decreased need for opiates. We found that adding ketorolac to the postoperative pain regimen and outlining a more detailed set of instructions could lower narcotic usage in the first 4 postoperative days. In addition, adding ketorolac decreased other complications commonly seen with narcotic usage and was shown to be safe in our patient population.
Ketorolac has been shown to decrease narcotic pain medication usage in several surgical settings and across different surgical specialties. It is hypothesized that ketorolac potentiates the effects of narcotics.11 Ketorolac given alone has a potent analgesic effect by acting as a strong non-selective cyclooxygenase inhibitor. The major drawback to ketorolac use has been its well-known side-effect profile. Ketorolac is renally excreted, and as such, should not be used in patients with renal insufficiency. In addition, ketorolac has been shown to cause increased gastrointestinal bleeding when used for >5 days.15 Caution should be taken when combining ketorolac with thromboprophylactic medications, especially in older patients.
Many surgeons use NSAIDs along with narcotics as part of a postoperative pain regimen. While this is often adequate for some procedures, when the surgery involves manipulating fractures, internal fixation, or resection arthroplasty, the variation in individual patient pain may call for a more robust protocol. Additionally, as surgeons expand to more complex procedures performed in the outpatient setting, evaluating different combinations of analgesics taken in a more structured manner may provide for improved pain control.
A major component of patient satisfaction is postoperative pain control.3-8,12,16,17 Regional anesthesia is an important tool that allows patients to undergo a surgical procedure with a greatly reduced amount of opioid pain medications. In addition, regional anesthesia can provide significant pain control after the patient has left the ambulatory surgery center, but this relief is short-lived because the medication is designed to lose effectiveness over time. As the effects of regional anesthesia wear off, patients can experience “rebound pain” with severe levels of pain that, on occasion, cannot be controlled with oral analgesics alone. The addition of ketorolac provided improved pain control when compared with the other regimens during this transition period when the regional anesthesia was becoming ineffective. In addition, because patients taking ketorolac used less narcotic medication, they experienced less nausea, vomiting, and over-sedation.
Additionally, patients were instructed to record their medication usage and pain scores on a prospective basis, with the hope of eliminating recall bias. A potential weakness is the inability to show significance for pain relief and reduced narcotic usage with the addition of ketorolac, although there was a trend toward significance. Many of the patients who enrolled in the trial did not return their medication logs. While these patients had to be excluded from data analysis, we continued enrollment until we obtained an adequate number of patients in each group. In addition, in the OxyContin group (Group 3), we could only recruit 17 participants, instead of the 18 needed based on our power study. Although this has a potential to alter the significance of our results, we do not feel this had a substantial impact on our results.
Many patients in the non-ketorolac groups supplemented their medication regimens with NSAIDs, which may have falsely lowered pain scores and narcotic usage. While this confounds our study results, we do not believe that it invalidates the conclusion that ketorolac can be an effective adjunct pain medication for use in patients undergoing ambulatory hand surgery.
The study examined postoperative pain control for only 2 procedures, thumb basal joint arthroplasty and distal radius fracture fixation, both commonly performed in the outpatient setting under regional anesthesia and both typically requiring narcotic pain medication. Perhaps the utilization of these medication regimens with different surgical procedures would have differing results.
We conclude that ketorolac potentially provides patients with improved pain control over the use of narcotic pain medications alone in the setting of ambulatory hand surgery.
This paper will be judged for the Resident Writer’s Award.
- Boezaart AP, Davis G, Le-Wendling L. Recovery after orthopedic surgery: techniques to increase duration of pain control. Curr Opin Anaesthesiol. 2012;25(6):665-672. doi:10.1097/ACO.0b013e328359ab5a.
- Buvanendran A, Kroin JS. Useful adjuvants for postoperative pain management. Best Pract Res Clin Anaesthesiol. 2007;21(1):31-49. doi:10.1016/j.bpa.2006.12.003.
- Coluzzi F, Bragazzi L, Di Bussolo E, Pizza G, Mattia C. Determinants of patient satisfaction in postoperative pain management following hand ambulatory day-surgery. Minerva Med. 2011;102(3):177-186.
- Elvir-Lazo OL, White PF. Postoperative pain management after ambulatory surgery: role of multimodal analgesia. Anesthesiol Clin. 2010;28(2):217-224. doi: 10.1016/j.anclin.2010.02.011.
- Kopp SL, Horlocker TT. Regional anaesthesia in day-stay and short-stay surgery. Anaesthesia. 2010;65(Suppl 1):84-96. doi:10.1111/j.1365-2044.2009.06204.x.
- Rawal N. Postoperative pain treatment for ambulatory surgery. Best Pract Res Clin Anaesthesiol. 2007;21(1):129-148. doi:10.1016/j.bpa.2006.11.005.
- Schug SA, Chong C. Pain management after ambulatory surgery. Curr Opin Anaesthesiol. 2009;22(6):738-743. doi:10.1097/ACO.0b013e32833020f4.
- Sripada R, Bowens C Jr. Regional anesthesia procedures for shoulder and upper arm surgery upper extremity update--2005 to present. Int Anesthesiol Clin. 2012;50(1):26-46. doi:10.1097/AIA.0b013e31821a0284.
- Trompeter A, Camilleri G, Narang K, Hauf W, Venn R. Analgesia requirements after interscalene block for shoulder arthroscopy: the 5 days following surgery. Arch Orthop Trauma Surg. 2010;130(3):417-421. doi:10.1007/s00402-009-0959-9.
- Dufeu N, Marchand-Maillet F, Atchabahian A, et al. Efficacy and safety of ultrasound-guided distal blocks for analgesia without motor blockade after ambulatory hand surgery. J Hand Surg Am. 2014;39(4):737-743. doi:10.1016/j.jhsa.2014.01.011.
- Gutta R, Koehn CR, James LE. Does ketorolac have a preemptive analgesic effect? A randomized, double-blind, control study. J Oral Maxillofac Surg. 2013;71(12):2029-2034. doi:10.1016/j.joms.2013.06.220.
- Nossaman VE, Ramadhyani U, Kadowitz PJ, Nossaman BD. Advances in perioperative pain management: use of medications with dual analgesic mechanisms, tramadol & tapentadol. Anesthesiol Clin. 2010;28(4):647-666. doi:10.1016/j.anclin.2010.08.009.
- Warren-Stomberg M, Brattwall M, Jakobsson JG. Non-opioid analgesics for pain management following ambulatory surgery: a review. Minerva Anestesiol. 2013;79(9):1077-1087.
- Wickerts L, Warrén Stomberg M, Brattwall M, Jakobsson JJ. Coxibs: is there a benefit when compared to traditional non-selective NSAIDs in postoperative pain management? Minerva Anestesiol. 2011;77(11):1084-1098.
- Strom BL, Berlin JA, Kinman JL, et al. Parenteral ketorolac and risk of gastrointestinal and operative site bleeding. A postmarketing surveillance study. JAMA. 1996;275(5):376-382. doi:10.1001/jama.275.5.376.
- Hegarty M, Calder A, Davies K, et al. Does take-home analgesia improve postoperative pain after elective day case surgery? A comparison of hospital vs parent-supplied analgesia. Paediatr Anaesth. 2013;23(5):385-389. doi:10.1111/pan.12077.
- Weber SC, Jain R, Parise C. Pain scores in the management of postoperative pain in shoulder surgery. Arthroscopy. 2007;23(1):65-72. doi:10.1016/j.arthro.2006.11.002.
TAKE-HOME POINTS
- While regional anesthesia is safe and effective for patients who undergo ambulatory hand surgery, patients often experience rebound pain as it wears off.
- We tested a multimodal approach for patients who underwent thumb CMC arthroplasty or ORIF of distal radius fracture.
- Patients were provided with a journal and asked to record medication usage, a NPS, and adverse effects. Seventy-nine patients completed the study.
- We found that adding ketorolac to the postoperative pain protocol, with detailed instructions, lowered narcotic usage in the first 4 postoperative days.
- Ketorolac potentially provides patients with improved pain control over the use of narcotic pain medication alone in an ambulatory hand surgery setting.
Hospital-acquired conditions drop 8% since 2014, saving 8,000 lives and $3 billion
From 2014 to 2016, the rate of potentially deadly hospital-acquired conditions in the United States dropped by 8% – a change that translated into 350,000 fewer such conditions, 8,000 fewer inpatient deaths, and a national savings of almost $3 billion.
The preliminary new baseline rate for hospital-acquired conditions (HACs) is 90 per 1,000 discharges – down from 98 per 1,000 discharges at the end of 2014, according to the Agency for Healthcare Research and Quality’s new report, “AHRQ National Scorecard on Hospital-Acquired Conditions – Updated Baseline Rates and Preliminary Results 2014-2016.”
The largest improvements occurred in central line–associated bloodstream infections (down 31% from 2014), postoperative venous thromboembolism (21% decline), adverse drug events (15% decline), and pressure ulcers (10% decline). A new category, C. difficile infections, also showed a large decline over 2014 (11%).
These numbers build on earlier successes associated with a national goal set by the Centers for Medicare & Medicaid Services to reduce HACs by 20% by 2019. They should be hailed as proof that attention to prevention strategies can save lives and money, said Seema Verma, CMS administrator.
“Today’s results show that this is a tremendous accomplishment by America’s hospitals in delivering high-quality, affordable healthcare,” Ms. Verma said in a press statement. “CMS is committed to moving the healthcare system to one that improves quality and fosters innovation while reducing administrative burden and lowering costs. This work could not be accomplished without the concerted effort of our many hospital, patient, provider, private, and federal partners – all working together to ensure the best possible care by protecting patients from harm and making care safer.”
The numbers continue to go in the right direction, the report noted. Data reported in late 2016 found a 17% decline in HACs from 2010 to 2014. This equated to 2.1 million HACs, 87,000 fewer deaths, and a savings of $19.9 billion.
Much work remains to be done to achieve the stated 2019 goal, the report noted, but the rewards are great. Reaching the 20% reduction goal would secure a total decrease in the HAC rate from 98 to 78 per 1,000 discharges. This would result in 1.78 million fewer HAC in the years from 2015-2019. That decrease would ultimately save 53,000 lives and $19.1 billion over 5 years.

Pomalidomide triplet significantly extends PFS in R/R MM

CHICAGO—The addition of pomalidomide to bortezomib and low‐dose dexamethasone (PVd) significantly improves progression-free survival (PFS) in lenalidomide-exposed patients with relapsed or refractory (R/R) multiple myeloma (MM), a new study reveals.
Up until now, pomalidomide and dexamethasone (Pd) had been the only therapy investigated exclusively after lenalidomide therapy, according to Paul G. Richardson, MD.
Now, he said, “a triple combination of PVd demonstrated promising activity in early phase clinical trials of lenalidomide-refractory patients.”
Dr Richardson, of the Dana-Farber Cancer Institute in Boston, Massachusetts, presented the findings of the phase 3 OPTIMISMM trial (abstract 8001) at the 2018 ASCO Annual Meeting.
The oral immunomodulatory agent pomalidomide, a standard-of-care treatment in R/R MM, has demonstrated synergistic anti-myeloma activity with dexamethasone and proteasome inhibitors.
A combination of pomalidomide and dexamethasone is indicated for MM patients after 2 or more prior therapies, including lenalidomide and a proteasome inhibitor.
“Lenalidomide is an established therapy in newly diagnosed multiple myeloma,” Dr Richardson explained. “Therefore, patients for whom lenalidomide is no longer a treatment option represent a clinically relevant population with unmet need.”
Phase 3 OPTIMISMM trial (NCT01734928)
Dr Richardson reported the final PFS and safety data from the first phase 3 pomalidomide triplet trial comparing PVd against bortezomib and dexamethasone (Vd) in an entirely post-lenalidomide treated population.
The 559 patients had 1 to 3 prior lines of therapy and 2 or more cycles of prior lenalidomide. They were randomized to receive PVd (281 patients, median age 67 years) or Vd (278 patients, median age 68 years).
In 21-day cycles, patients received pomalidomide 4 mg per day on days 1-14 (PVd arm only); bortezomib 1.3 mg/m² on days 1, 4, 8, and 11 of cycles 1-8 and on day 1 and 8 of cycles 9 and higher; and dexamethasone 20 mg per day (10 mg for those over age 75) on the days of and after bortezomib.
The primary endpoint was PFS.
Results
After a median follow-up of 16 months, “PVd reduced the risk of progression or death by 39% compared with Vd,” Dr Richardson said.
Median PFS was 11.2 months in the PVd group and 7.1 months in the Vd group. Overall survival data are not mature.
The overall response rate was significantly higher with PVd (82.2%) vs Vd (50%).
And the overall response rate was even higher in patients with only 1 prior line of therapy (90.1% vs 54.8%, respectively).
“PVd led to deeper responses with higher stringent complete response/complete response and more very good partial responses than Vd,” Dr Richardson noted.
“PFS was improved with PVd vs Vd across patient subgroups and regardless of lenalidomide refractoriness. The PFS benefit with PVd was maintained through the next line of therapy.”
He reported longer treatment duration and exposure with PVd compared with Vd.
Safety
The safety profile was consistent with known toxicities associated with pomalidomide and low-dose dexamethasone, he said.
Most common grade 3/4 treatment-emergent adverse events were higher with PVd than Vd, including neutropenia (42% vs 9%) and infections (31% vs 18%).
In conclusion, Dr Richardson said, “These results support the use of PVd in first relapse in patients with relapsed/refractory multiple myeloma and prior exposure to lenalidomide.”
Future analyses of the data will include correlatives, minimal residual disease, and quality of life, he said.
The trial was sponsored by Celgene.
Polatuzumab plus BR improves efficacy in DLBCL

CHICAGO—Polatuzumab vedotin, when added to bendamustine (B) and rituximab (R), significantly improved response and survival rates in a cohort of patients with relapsed/refractory diffuse large B-cell lymphoma (DLBCL), according to a phase 2 study.
By contrast, there were no such improvements in a cohort of follicular lymphoma (FL) patients, at least in short-term follow-up, investigator Laurie Helen Sehn, MD, of the BC Cancer Agency in Vancouver, Canada, said at the 2018 ASCO Annual Meeting.
However, the improvement in overall survival in DLBCL patients is “remarkable,” Dr Sehn affirmed in an oral presentation (abstract 7507).
“Based on these encouraging results, polatuzumab vedotin has received breakthrough therapy designation and priority medicines designation by the FDA and EMA for patients with relapsed or refractory DLBCL,” she said.
Polatuzumab-BR study (NCT02257567)
The study by Dr Sehn and colleagues included a cohort of 80 DLBCL patients randomized to BR or polatuzumab-BR for 6 planned 21-day cycles.
Investigators randomized another cohort of 80 FL patients to BR or polatuzumab-BR for 6 planned 28-day cycles.
The primary endpoint was complete response (CR) assessed by fluorodeoxyglucose positron emission tomography (FDG-PET) at 6 to 8 weeks after the end of treatment.
DLBCL patients
A total of 40% of polatuzumab-BR-treated DLBCL patients achieved CR at the end of treatment, versus 15% of BR-treated patients (P=0.012).
That CR improvement translated into a significantly higher progression-free survival (PFS) (6.7 months for polatuzumab-BR vs 2.0 months for BR, P<0.0001) and overall survival (11.8 months versus 4.7 months, P=0.0008), according to Dr Sehn.
The FDG-PET CR rates were higher in the polatuzumab-BR arm regardless of the number of prior lines of treatment for DLBCL, and regardless of relapsed versus refractory status, Dr. Sehn added.
FL patients
By contrast, in the FL cohort, the FDG-PET CR rate was high for both arms, at 69% for polatuzumab-BR and 63% for BR.
And there was no significant difference in progression-free survival (P=0.58) with “relatively short-term follow-up,” she said.
Adverse events
The most common grades 3 – 5 adverse events for both DLBCL and FL patients were higher in the polatuzumab-BR arm than the BR arm and included cytopenias, febrile neutropenia, and infections.
Serious AEs were also higher in the polatuzumab-BR arm and included febrile neutropenia for both FL and DLBCL patients and infection for FL patients.
Five percent of FL patients and 18% of DLBCL had a grade 5 event.
Commentary
Whether polatuzumab vedotin will change treatment paradigms for DLBCL patients may be answered by the ongoing POLARIX study, according to Alison Moskowitz, MD, of Memorial Sloan Kettering Cancer Center in New York, NY.
The randomized phase 3 POLARIX study (abstract TPS7589) is comparing polatuzumab plus R-CHP to R-CHOP in patients with previously untreated DLBCL.
“Certainly, there are patients who do very well with R-CHOP chemotherapy alone, and so we need to learn whether this is necessary for all patients, or only the high-risk patients,” Dr Moskowitz said in a talk at ASCO commenting on the results of the polatuzumab-BR study.
Hoffman-LaRoche is the sponsor of the study.
Clinical course of depression is worse in older people
Older people are much more likely than younger people to experience a poorer clinical course of major depression, even after accounting for differences in social, clinical, and other health factors, new research suggests.
A longitudinal cohort study, published in the Lancet Psychiatry, examined baseline and 2-year follow-up data from 1,042 participants who had a recent diagnosis of a depressive or anxiety disorder in two previous cohort studies.
The authors adjusted initially for the number of major depressive disorder (MDD) episodes, comorbid anxiety, and antidepressant use but still found that older age was significantly associated with increased risk of a depressive diagnosis, a chronic symptom course, reduced likelihood of achieving remission, and a smaller decrease in depression severity.
They also adjusted for other factors common in old age, such as loneliness, social support, pain, other chronic disease, and higher body mass index, and again found that this only led to small reductions in the association with older age. However, the adjustment for loneliness did have the effect of dissipating the association between older age and the presence of any depression diagnosis.
“ and that are thought to worsen the course of the disease,” wrote Roxanne Schaakxs, PhD, of the Amsterdam Public Health Research Institute at VU University Medical Center, and her coauthors.
Researchers also looked for an effect of antidepressant use, in case the age differences might be related to differences in treatment response. “However, adjustment for antidepressant use at baseline did not substantially change our findings, and stratified analysis for participants who did and did not use antidepressants revealed consistent age–MDD course associations for both subsamples,” they wrote.
The authors said their findings suggested that age-tailored treatment might be needed for major depressive disorder, with a particular focus on maintenance treatment for older people.
The two cohort studies were supported by the Netherlands Organization for Health Research and Developments, NutsOhra Fonds, Stichting tot Steun VCVGZ, a NARSAD grant from the Brain & Behavior Research Foundation, and a range of universities and mental health care organizations.
One author declared research funding from Janssen Research and Boehringer Ingelheim not related to the study.
SOURCE: Schaakxs R et al. Lancet Psychiatry. 2018 Jun 7. doi: 10.1016/S2215-0366(18)30166-4.
While major depression appears to follow a worse clinical course in older people, this study is important in providing robust evidence of poorer prognostic outcomes and addresses some major methodological limitations of previous studies.
One limitation, acknowledged by the authors, is the absence of a sufficient measure of cognitive function. Cognitive impairment is associated with major depression, slows recovery from depression, and reduces treatment effectiveness. The study did exclude people with dementia or with Mini-Mental State Examination scores of 18 or lower, but this may not have excluded other variations in cognitive impairment that could have contributed to the age-related differences in outcomes.
Tze Pin Ng, MD, is with the department of psychological medicine at the National University of Singapore. These comments are taken from an accompanying editorial (Lancet Psychiatry. 2018 Jun 7. doi: 10.1016/S2215-0366[18]30186-X). No conflicts of interest were declared.
Older people are much more likely than younger people to experience a poorer clinical course of major depression, even after accounting for differences in social, clinical, and other health factors, new research suggests.
A longitudinal cohort study, published in the Lancet Psychiatry, examined baseline and 2-year follow-up data from 1,042 participants who had a recent diagnosis of a depressive or anxiety disorder in two previous cohort studies.
The authors adjusted initially for the number of major depressive disorder (MDD) episodes, comorbid anxiety, and antidepressant use but still found that older age was significantly associated with increased risk of a depressive diagnosis, a chronic symptom course, reduced likelihood of achieving remission, and a smaller decrease in depression severity.
They also adjusted for other factors common in old age, such as loneliness, social support, pain, other chronic disease, and higher body mass index, and again found that this only led to small reductions in the association with older age. However, the adjustment for loneliness did have the effect of dissipating the association between older age and the presence of any depression diagnosis.
“ and that are thought to worsen the course of the disease,” wrote Roxanne Schaakxs, PhD, of the Amsterdam Public Health Research Institute at VU University Medical Center, and her coauthors.
Researchers also looked for an effect of antidepressant use, in case the age differences might be related to differences in treatment response. “However, adjustment for antidepressant use at baseline did not substantially change our findings, and stratified analysis for participants who did and did not use antidepressants revealed consistent age–MDD course associations for both subsamples,” they wrote.
The authors said their findings suggested that age-tailored treatment might be needed for major depressive disorder, with a particular focus on maintenance treatment for older people.
The two cohort studies were supported by the Netherlands Organization for Health Research and Developments, NutsOhra Fonds, Stichting tot Steun VCVGZ, a NARSAD grant from the Brain & Behavior Research Foundation, and a range of universities and mental health care organizations.
One author declared research funding from Janssen Research and Boehringer Ingelheim not related to the study.
SOURCE: Schaakxs R et al. Lancet Psychiatry. 2018 Jun 7. doi: 10.1016/S2215-0366(18)30166-4.
FROM THE LANCET PSYCHIATRY
Key clinical point: Older people experienced a worse clinical course of depressive disorders, compared with younger people.
Major finding: Older people with depression experienced slower remission and a higher risk of chronicity.
Study details: A longitudinal cohort study of 1,042 people with depressive or anxiety disorders.
Disclosures: The two cohort studies were supported by the Netherlands Organization for Health Research and Developments, NutsOhra Fonds, Stichting tot Steun VCVGZ, a NARSAD grant from the Brain & Behavior Research Foundation, and a range of universities and mental health care organizations. One author declared research funding from pharmaceutical companies that was not related to the study.
Source: Schaakxs R et al. Lancet Psychiatry. 2018 Jun 7. doi: 10.1016/S2215-0366(18)30166-4.
App found to improve quality of life for families of premature infants
TORONTO – Significant improvement in quality of life was observed in neonatal ICU families using the PreeMe+You app, preliminary results from a two-center study showed.
“NICU time is stressful,” one of the study authors, Abigail Whitney, said at the Pediatric Academic Societies annual meeting. “With the birth of a preterm infant, parents are often quickly transitioned into the role of becoming a parent much sooner and in much different circumstances than they might have anticipated. Parents have reported feelings of isolation, alienation, and insecurity in the parental role while in the NICU. Studies have shown that interventions that engage parents in their infant’s progress can decrease parental stress and anxiety, increase positive parent-infant interaction, and even reduce the infant’s length of stay. Also, with advancing technology there has been a push to find ways to use mobile technology to help parents balance engaging with their infant with the rest of their busy lives.”
In a study overseen by PreeMe+You’s chief medical expert, Bree Andrews, MD, MPH, Ms. Whitney and her associates administered the app to 48 families at either the University of Chicago Medicine Comer Children’s Hospital NICU or the Evanston Hospital NICU to assess readiness for using mobile technologies at the bedside. All families were recommended by a child life specialist who identified families who might be interested in using something like PreeMe+You. They excluded any families that were currently involved with child and family services, those with an infant younger than 7 days old, those whose child required escalation of care or upcoming surgeries, and those whose infant was over 37 weeks’ gestation.
First, the researchers briefed NICU staff about the study at charge nurse meetings, faculty meetings, and daily huddles for 2 weeks before first enrollment. “We did this knowing that parents might go to their nurses or doctors about how to answer specific questions within the app, or maybe want to learn more about a certain topic they learned from PreeMe+You,” Ms. Whitney said.
Data measurements included the PreeMe+You composite survey, which pulled questions from the Fragile Infant Parent Readiness Evaluation (FIPRE) and the NICU Parent Risk Evaluation and Engagement Model and Instrument (PREEMI). “We also included additional questions about technology use and capacity, as well as the PedsQL [Pediatric Quality of Life Inventory] Family Impact Module to assess parental quality of life throughout the study,” she said.

Over a period of 9 months, the researchers collected 153 quality of life measurements from 48 families. Of these, 48 occurred at enrollment, 23 occurred less than 1 week after enrollment, 30 occurred 1-2 weeks after enrollment, 28 occurred 3-4 weeks after enrollment, and 24 occurred 4 weeks or more after enrollment. By study closure, the researchers had follow-up data on 44 of the 48 families. The average gestational age at birth was 29.3 weeks, the average day of life at enrollment was 25.4, and the average birth weight was 1,280 grams.
On the app’s composite survey, 14.6% “agreed” and 79.2% “strongly agreed” that they were currently using a smart phone or tablet to look for information about preemies/NICU on the Internet, and about half “agreed” or “strongly agreed” (27.1% and 33.3%, respectively) that they spent more than 30 minutes per week looking up information about their NICU baby online. Nearly all families “agreed” or “strongly agreed” (14.6% and 85.4%) that they had a smart phone or tablet for Internet use in the NICU, and nearly all “agreed” or “strongly agreed” (33.3% and 62.5%) that having an app at the NICU bedside/home would be helpful. “This showed us that families were ready to use technology and interested in something like PreeMe+You at the bedside,” Ms. Whitney said.
At the time of study enrollment, 12 were in the purple stage, 8 were in the blue stage, 19 infants were in the orange stage, and 9 were in the yellow stage. Ms. Whitney reported that based on the PedsQL Family Impact Module, 35 of the 44 families showed increased quality of life functionality after participating in the study. This change was significant, with a P value of .001. Improvements were seen in the measure’s eight domains (physical, emotional, social, cognitive, communication, worry, daily activities, and family relationship functionality). “We saw increases across all of the domains based on how long the parents had been using the app,” Ms. Whitney said. “We found the biggest increase in quality of life in families of babies born less than 25 weeks’ gestational age, those born 25-26 weeks gestational age, those born 27-28 weeks gestational age, and those born 33-37 weeks gestational age. We are encouraged to see some of these quality of life changes in some of the earliest-born gestation babies because these are presumably the families that would have the longest time to go in the NICU and could benefit the most from using an app like PreeMe+You.”
She acknowledged certain limitations of the study, including the fact that it was conducted in two NICUs, “and we definitely need more comparisons to look at the natural trajectory of quality of life changes while families are in the NICU. Also, all of the families enrolled in our study had access to a research team that checked in with them weekly. In the real world, PreeMe+You would probably be self-guided.” Going forward, PreeMe+You plans to include additional features to give parents more self-guidance, making it easier for them to interact and partner with their baby’s medical team.
Funding for the study was provided by the Bucksbaum Institute for Clinical Excellence. Ms. Whitney was supported by a grant from the National Institute of Diabetes and Digestive and Kidney Diseases.
TORONTO – Significant improvement in quality of life was observed in neonatal ICU families using the PreeMe+You app, preliminary results from a two-center study showed.
“NICU time is stressful,” one of the study authors, Abigail Whitney, said at the Pediatric Academic Societies annual meeting. “With the birth of a preterm infant, parents are often quickly transitioned into the role of becoming a parent much sooner and in much different circumstances than they might have anticipated. Parents have reported feelings of isolation, alienation, and insecurity in the parental role while in the NICU. Studies have shown that interventions that engage parents in their infant’s progress can decrease parental stress and anxiety, increase positive parent-infant interaction, and even reduce the infant’s length of stay. Also, with advancing technology there has been a push to find ways to use mobile technology to help parents balance engaging with their infant with the rest of their busy lives.”
In a study overseen by PreeMe+You’s chief medical expert, Bree Andrews, MD, MPH, Ms. Whitney and her associates administered the app to 48 families at either the University of Chicago Medicine Comer Children’s Hospital NICU or the Evanston Hospital NICU to assess readiness for using mobile technologies at the bedside. All families were recommended by a child life specialist who identified families who might be interested in using something like PreeMe+You. They excluded any families that were currently involved with child and family services, those with an infant younger than 7 days old, those whose child required escalation of care or upcoming surgeries, and those whose infant was over 37 weeks’ gestation.
First, the researchers briefed NICU staff about the study at charge nurse meetings, faculty meetings, and daily huddles for 2 weeks before first enrollment. “We did this knowing that parents might go to their nurses or doctors about how to answer specific questions within the app, or maybe want to learn more about a certain topic they learned from PreeMe+You,” Ms. Whitney said.
Data measurements included the PreeMe+You composite survey, which pulled questions from the Fragile Infant Parent Readiness Evaluation (FIPRE) and the NICU Parent Risk Evaluation and Engagement Model and Instrument (PREEMI). “We also included additional questions about technology use and capacity, as well as the PedsQL [Pediatric Quality of Life Inventory] Family Impact Module to assess parental quality of life throughout the study,” she said.
Over a period of 9 months, the researchers collected 153 quality of life measurements from 48 families. Of these, 48 occurred at enrollment, 23 occurred less than 1 week after enrollment, 30 occurred 1-2 weeks after enrollment, 28 occurred 3-4 weeks after enrollment, and 24 occurred 4 weeks or more after enrollment. By study closure, the researchers had follow-up data on 44 of the 48 families. The average gestational age at birth was 29.3 weeks, the average day of life at enrollment was 25.4, and the average birth weight was 1,280 grams.
On the app’s composite survey, 14.6% “agreed” and 79.2% “strongly agreed” that they were currently using a smart phone or tablet to look for information about preemies/NICU on the Internet, and about half “agreed” or “strongly agreed” (27.1% and 33.3%, respectively) that they spent more than 30 minutes per week looking up information about their NICU baby online. Nearly all families “agreed” or “strongly agreed” (14.6% and 85.4%) that they had a smart phone or tablet for Internet use in the NICU, and nearly all “agreed” or “strongly agreed” (33.3% and 62.5%) that having an app at the NICU bedside/home would be helpful. “This showed us that families were ready to use technology and interested in something like PreeMe+You at the bedside,” Ms. Whitney said.
At the time of study enrollment, 12 were in the purple stage, 8 were in the blue stage, 19 infants were in the orange stage, and 9 were in the yellow stage. Ms. Whitney reported that based on the PedsQL Family Impact Module, 35 of the 44 families showed increased quality of life functionality after participating in the study. This change was significant, with a P value of .001. Improvements were seen in the measure’s eight domains (physical, emotional, social, cognitive, communication, worry, daily activities, and family relationship functionality). “We saw increases across all of the domains based on how long the parents had been using the app,” Ms. Whitney said. “We found the biggest increase in quality of life in families of babies born less than 25 weeks’ gestational age, those born 25-26 weeks gestational age, those born 27-28 weeks gestational age, and those born 33-37 weeks gestational age. We are encouraged to see some of these quality of life changes in some of the earliest-born gestation babies because these are presumably the families that would have the longest time to go in the NICU and could benefit the most from using an app like PreeMe+You.”
She acknowledged certain limitations of the study, including the fact that it was conducted in two NICUs, “and we definitely need more comparisons to look at the natural trajectory of quality of life changes while families are in the NICU. Also, all of the families enrolled in our study had access to a research team that checked in with them weekly. In the real world, PreeMe+You would probably be self-guided.” Going forward, PreeMe+You plans to include additional features to give parents more self-guidance, making it easier for them to interact and partner with their baby’s medical team.
Funding for the study was provided by the Bucksbaum Institute for Clinical Excellence. Ms. Whitney was supported by a grant from the National Institute of Diabetes and Digestive and Kidney Diseases.
REPORTING FROM PAS 2018
Key clinical point:
Major finding: In all, 35 of the 44 families showed increased quality of life functionality, based on the PedsQL Family Impact Module (P = .001).
Study details: A two-center study of 44 families with premature infants intended to assess readiness for using mobile technologies at the bedside.
Disclosures: Funding for the study was provided by the Bucksbaum Institute for Clinical Excellence. Ms. Whitney was supported by a grant from the National Institute of Diabetes and Digestive and Kidney Diseases.
CDC concerned about multidrug-resistant Shigella
The Centers for Disease Control and Prevention have issued follow-up recommendations for managing and reporting Shigella infections because of concerns about increasing antibiotic resistance and the possibility of treatment failures.
Isolates with no resistance to quinolone antibiotics have ciprofloxacin minimum inhibitory concentration (MIC) values of less than 0.015 mcg/mL. However, the CDC has continued to identify isolates of Shigella that, while still within the susceptible range for the fluoroquinolone antibiotic ciprofloxacin (that is, having MIC values less than 1 mcg/mL), have MIC values for ciprofloxacin of 0.12-1.0 mcg/mL, thus appearing to harbor one or more resistance mechanisms. Furthermore, the CDC has identified an increasing number of isolates that have MIC values for azithromycin exceeding the epidemiologic cutoff value, which suggests some form of acquired resistance.

“CDC is particularly concerned about people who are at high risk for multidrug-resistant Shigella infections and are more likely to require antibiotic treatment, such as men who have sex with men, patients who are homeless, and immunocompromised patients. These patients often have more severe disease, prolonged shedding, and recurrent infections,” the recommendations stated.
More information can be found in the CDC’s Health Alert Network release.
The Centers for Disease Control and Prevention have issued follow-up recommendations for managing and reporting Shigella infections because of concerns about increasing antibiotic resistance and the possibility of treatment failures.
Isolates with no resistance to quinolone antibiotics have ciprofloxacin minimum inhibitory concentration (MIC) values of less than 0.015 mcg/mL. However, the CDC has continued to identify isolates of Shigella that, while still within the susceptible range for the fluoroquinolone antibiotic ciprofloxacin (that is, having MIC values less than 1 mcg/mL), have MIC values for ciprofloxacin of 0.12-1.0 mcg/mL, thus appearing to harbor one or more resistance mechanisms. Furthermore, the CDC has identified an increasing number of isolates that have MIC values for azithromycin exceeding the epidemiologic cutoff value, which suggests some form of acquired resistance.
“CDC is particularly concerned about people who are at high risk for multidrug-resistant Shigella infections and are more likely to require antibiotic treatment, such as men who have sex with men, patients who are homeless, and immunocompromised patients. These patients often have more severe disease, prolonged shedding, and recurrent infections,” the recommendations stated.
More information can be found in the CDC’s Health Alert Network release.
FDA approves long-acting ESA for dialysis-related anemia in children, adolescents
The patients aged 5-17 years with chronic kidney disease whose hemoglobin had been stabilized with an erythropoiesis-stimulating agent (ESA).
Efficacy was based partly on how well target hemoglobin levels were maintained in this trial, but also on extrapolation from results of trials in adults. The safety profile in these pediatric patients was consistent with those previously observed in adults. Mircera is manufactured by Vifor Pharma.
More information on the approval of Mircera in this population can be found in the FDA release. The prescribing information for Mircera, initially approved in 2007, has also been updated.
Pemphigus remission rate tops 80% with rituximab
ORLANDO – , and could be approved for the indication soon.
With approval pending, “rituximab is quickly emerging as frontline therapy” for pemphigus, so “we should begin to prepare to answer our patients’ questions. It’s likely they will be interested in its use,” said Carolyn Kushner, a medical student and dermatology research fellow at the University of Pennsylvania, Philadelphia. Rituximab manufacturer Genentech announced the priority review for this indication in a Feb. 2018 press release.

“We get a lot of questions in the clinic,” she said at the International Investigative Dermatology meeting. Patients with pemphigus want to know how well rituximab will work, and if they’ll be able to go off other medications. They wonder if it’s safe, and when they’ll need to be retreated. The goal of the study was to provide information for both clinicians and patients regarding what to expect from the treatment.
Overall, 54 patients (48%) achieved a complete response off therapy (CROT) after their first treatment cycle, meaning they had no new lesions for at least 2 months off of all systemic and topical treatments. The median time to a complete response was 7.4 months, and the median time to relapse was 20.9 months after the first infusion. An additional 15 patients (13%) had a complete remission with minimal therapy after one cycle.
In short, “61% of patients achieved complete healing of their skin after one cycle,” Ms. Kushner said. The number rose to 82% (93 patients) when those who had more than one cycle were included. The maximum in the study was seven. Among all patients, the median time from the first to second rituximab dose was 25.1 months.
When age, sex, and disease duration were controlled for, patients who received lymphoma dosing – 375 mg/m2 weekly for 4 weeks – were 2.7 times more likely to achieve CROT than those on the rheumatoid arthritis dosing, two 1,000 mg IV infusions 2 weeks apart (P = .037). “We almost never use RA dosing now,” she said.
The odds of success also increased with age, with patients 45 years and older 3.5 to almost 7 times more likely to achieve CROT than younger patients, also a statistically significant finding.
There were four serious adverse events across 155 cycles of the lymphoma regimen, and one with 90 cycles of arthritis dosing, all infectious and none fatal. Ms. Kushner cautioned the true rate was probably higher, since their review data might have missed some cases.
Race, sex, and disease duration had no significant effect on response rates. About 60% of the patients were women.
Rituximab, approved in 1997, is a CD20-directed cytolytic antibody.
There was no industry funding for the work, and Ms. Kushner didn’t have any disclosures.
SOURCE: Kushner CJ et al. IID 2018, Abstract 552.
ORLANDO – , and could be approved for the indication soon.
With approval pending, “rituximab is quickly emerging as frontline therapy” for pemphigus, so “we should begin to prepare to answer our patients’ questions. It’s likely they will be interested in its use,” said Carolyn Kushner, a medical student and dermatology research fellow at the University of Pennsylvania, Philadelphia. Rituximab manufacturer Genentech announced the priority review for this indication in a Feb. 2018 press release.
“We get a lot of questions in the clinic,” she said at the International Investigative Dermatology meeting. Patients with pemphigus want to know how well rituximab will work, and if they’ll be able to go off other medications. They wonder if it’s safe, and when they’ll need to be retreated. The goal of the study was to provide information for both clinicians and patients regarding what to expect from the treatment.
Overall, 54 patients (48%) achieved a complete response off therapy (CROT) after their first treatment cycle, meaning they had no new lesions for at least 2 months off of all systemic and topical treatments. The median time to a complete response was 7.4 months, and the median time to relapse was 20.9 months after the first infusion. An additional 15 patients (13%) had a complete remission with minimal therapy after one cycle.
In short, “61% of patients achieved complete healing of their skin after one cycle,” Ms. Kushner said. The number rose to 82% (93 patients) when those who had more than one cycle were included. The maximum in the study was seven. Among all patients, the median time from the first to second rituximab dose was 25.1 months.
When age, sex, and disease duration were controlled for, patients who received lymphoma dosing – 375 mg/m2 weekly for 4 weeks – were 2.7 times more likely to achieve CROT than those on the rheumatoid arthritis dosing, two 1,000 mg IV infusions 2 weeks apart (P = .037). “We almost never use RA dosing now,” she said.
The odds of success also increased with age, with patients 45 years and older 3.5 to almost 7 times more likely to achieve CROT than younger patients, also a statistically significant finding.
There were four serious adverse events across 155 cycles of the lymphoma regimen, and one with 90 cycles of arthritis dosing, all infectious and none fatal. Ms. Kushner cautioned the true rate was probably higher, since their review data might have missed some cases.
Race, sex, and disease duration had no significant effect on response rates. About 60% of the patients were women.
Rituximab, approved in 1997, is a CD20-directed cytolytic antibody.
There was no industry funding for the work, and Ms. Kushner didn’t have any disclosures.
SOURCE: Kushner CJ et al. IID 2018, Abstract 552.
REPORTING FROM IID 2018
Key clinical point: Rituximab puts the majority of pemphigus patients in remission, with a median time between doses of about 2 years.
Major finding: Sixty-one percent of patients achieved complete healing of their skin after one cycle, increasing to 82% when those who had more than one cycle were included.
Study details: A single-center review of 113 patients
Disclosures: There was no industry funding, and the lead investigator had no disclosures.
Source: Kushner CJ et al. IID 2018, Abstract 552.