User login
Prevention of Central Line–Associated Bloodstream Infections
Division of Infectious Diseases, Department of Internal Medicine, VA Ann Arbor Healthcare System and University of Michigan Health System, Ann Arbor, MI.
Abstract
- Objective: To review prevention of central line–associated bloodstream infection (CLABSI).
- Method: Review of the literature.
- Results: Evidence-based prevention practices include ensuring hand hygiene before the procedure, using maximal sterile barrier precautions, cleaning the skin with alcoholic chlorhexidine before central line insertion, avoiding the femoral site for insertion, and removing unneeded catheters.
- Conclusion: For continued success in CLABSI prevention, best practices should be followed and patient safety should be emphasized.
Health care–associated infections (HAIs) are a preventable cause of morbidity and mortality in the United States and internationally. A Centers for Disease Control and Prevention (CDC) report estimates that in acute care hospitals, 1 in 25 patients end up with at least one HAI during their hospital stay [1]. HAIs can also be costly; in the United States, the indirect and direct cost has been estimated to be between $96 to $147 billion dollars [2]. National initiatives to prevent these types of infections have included efforts from the Department of Health and Human Services (HHS), the Institute of Medicine (IOM), the Institute for Healthcare Improvement (IHI) and the Centers for Medicare and Medicaid Services (CMS). This work has led to particular success in preventing central line–associated bloodstream infection (CLABSI).
CLABSI can lead to considerable mortality, morbidity, and cost. An estimated 250,000 CLABSIs occur in patients yearly, and about 80,000 of those are estimated to occur in the intensive care unit (ICU) setting [3]. Since central venous catheters (CVCs), or central lines, are most often used in the ICU setting, much of the work on prevention and management of CLABSI has been within the ICU population [4,5]. The increased use of peripherally inserted central catheters (PICCs) in the non-ICU setting and recognition of CLABSI in non-ICU settings has led to new efforts to understand the best way to prevent CLABSI in the non-ICU setting [4,6]. Regardless of setting, the annual cost of these infections has been estimated to be as high as $2.3 billion [7]. One episode is estimated to cost a hospital up to $46,485 per episode with components of excess length of stay, antibiotic cost, and cost of care [8]. In this review, selected best practices in CLABSI prevention are identified and described.
Elements of CLABSI Prevention
One of the key papers in the CLABSI literature was the Keystone ICU project in Michigan [9]. This state-wide effort grew out of a successful pilot patient-safety program that was trialed at Johns Hopkins Medical Institutions to reduce CLABSI in the ICU setting. In 2003, the Agency for Healthcare Research and Quality (AHRQ) funded a study to examine the intervention in ICUs in the state of Michigan. A total of 108 ICUs from 67 individual hospitals participated in the pre-intervention/post-intervention study [9]. A combination of technical and socio-adaptive interventions to prevent CLABSI included clinician education on best practices in insertion of central lines, having a central-line cart in each ICU, an insertion checklist of best practices, empowering nursing staff to stop the procedure if best practices were not being followed, discussing removal of catheters daily, and providing feedback to units regarding rates of CLABSI [10]. Executive administration of each hospital was also involved and there were monthly phone calls for hospital teams to share successes and barriers.
In the pre-intervention phase, the median catheter- related bloodstream infection rate was 2.7 infections per 1000 catheter days for the sum of hospitals. After the interventions were put in place, the median rate of catheter related bloodstream infections was down to 0.34 at 18 months. The study showed that results from a relatively inexpensive and straightforward intervention could be effective and could last in the long term. This study led to many other single center and multicenter studies, nationally and internationally, to replicate results in efforts to decrease CLABSI in ICU populations [5]. The CDC and AHRQ have continued to partner with regional, state and national efforts to focus on CLABSI prevention.
The Bundle Approach
A number of interventions have been proven to be effective at preventing CLABSI. Combining more than one intervention can often have additive effects. This effect has been recognized in numerous quality improvement studies on CLABSI and has been termed using the “bundle” approach. 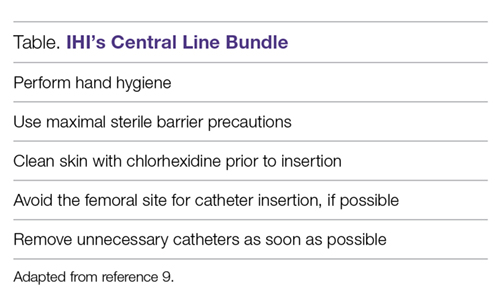
Hand Hygiene
Poor hand hygiene by health care workers is generally thought to be the most common cause of HAIs [12]. Guidelines recommend an alcohol-based waterless product or antiseptic soap and water prior to catheter insertion [13]. The most common underlying etiology of CLABSI is through microorganisms introduced at time of insertion of catheter. This can be extraluminally mediated via skin flora of the patient, or due to lack of hand washing on the inserter’s part and can lead to CLABSI [14]. While a randomized controlled trial would be unethical, several studies have shown when targeted hand hygiene campaigns are held, CLABSI rates tend to decrease [15–17].
Maximal Barrier Precautions
The use of maximal sterile barrier precautions has been associated with less mortality, decreasing catheter colonization, incidence of HAI and cost savings [18–20]. Like most components of the bundle, maximal sterile barrier precautions have rarely been studied alone, but are often a part of a “bundle” or number of interventions [21]. Like hand hygiene, while regularly a part of many hospital’s checklist or bundle process, compliance with this key part of infection prevention can be deficient; one study noted measured maximal sterile barriers compliance to be 44% [22].
Chlorhexidine Skin Antisepsis
Chlorhexidine skin preparation decreases bacterial burden at site of insertion and is thought to reduce infection from this mechanism. Chlorhexidine-alcohol skin preparation has been proven in randomized controlled trials to outperform povidone iodine-alcohol in preventing CLABSI [23,24]. Chlorhexidine skin preparation is considered a technical element of checklists and is thought to be a straightforward and easily implementable action [25]. If a hospital supplies only alcoholic chlorhexidine and doesn’t provide povidone-iodine for skin preparation, then clinicians can be “nudged” towards performing this part of the bundle.
Optimal Catheter Site Selection
For all sites of insertion of CVC, the risk of mechanical and infectious complications depends on the skill and proficiency of operators, the clinical situation, and the availability of ultrasound to help guide placement. These factors are important in determining which anatomical site is best for each patient [26]. The femoral site has been associated with a greater risk of catheter-related infection and catheter-related thrombosis and is not recommended as the initial choice for non-emergent CVC insertion according to national guidelines [13,27]. The internal jugular vein site is associated with a lower risk of severe mechanical complications such as pneumothorax when compared to subclavian vein site [27]. The subclavian vein site is associated with a lower risk of catheter-related blood stream infection and lower rate of thrombosis, but this greatly depends on experience of operator. Experts have proposed that the subclavian site has a lower burden of colonization by bacteria than other sites and is anatomically more protected by catheter dressing; also the subcutaneous course of the central line itself is longer for the subclavian site than other sites and these reasons could contribute to the lower risk of infection [28]. The subclavian site is, however, associated with a higher risk of mechanical complications that can be serious for ICU patients. In general, the femoral vein site should be avoided in non-emergent line placement situations, particularly if the patient is an obese adult [13]. Using ultrasound as a guidance for catheter insertion has also been shown to reduce risk of CLABSI and other mechanical complications and is recommended [29,30].
Daily Review of Line Necessity
Removing unnecessary catheters as soon as possible decreases catheter dwell time and risk of infection. Few studies have concentrated on this step alone in CLABSI prevention, but the studies that have focused on catheter removal usually implement electronic reminders or multidisciplinary catheter rounds (where need for catheter is incorporated into daily rounds or discussed separately by a multidisciplinary group) [5,31].
Additional Considerations
Other basic practices that all hospitals should adopt include the above strategies and providing all inclusive catheter carts or kits, disinfecting hubs in maintenance care of catheters, covering the CVC site with sterile dressings, having recurrent educational interventions and using checklists to assure adherence to the evidence-based bundle (Table) [4,13]. As prevalence of non-ICU central lines has also grown, maintenance care is particularly important in reducing CLABSI. Maintenance bundles that highlight best practices such as aseptic technique, correct hand hygiene, chlorhexidine skin disinfection scrub, antimicrobial bandage application, and catheter hub disinfection have been used with success [32]. Specialized CVC insertion teams with trained personnel have also been recommended [4]. When these basic evidence-based practices are still unable to bring down CLABSI rates for select populations or during an outbreak, supplemental strategies can be tried to reduce CLABSI. These include antimicrobial-impregnated catheters, chlorhexidine-impregnated dressings, and chlorhexidine bathing, which is increasingly being used in the ICU setting [5,13,33].
Epidemiology/Risk Factors
At-risk Populations
ICU patients are at risk for CLABSI because of frequent use of multiple catheters, and the comorbidities and acuity of care that these patients have. ICU patients also tend to have lots of manipulation of their catheters and often these catheters are placed in emergent situations [13]. Patients in the non-ICU and outpatient setting are also at risk for CLABSI when they have a central venous catheter. Long courses of antibiotics for disease states such as osteomyelitis and endocarditis often entail central venous catheters. Recent work has shown that PICCs carry as high of a CLABSI risk as short-term CVCs in hospitalized patients [34]. Patients with end-stage renal disease, especially those undergoing maintenance hemodialysis via a tunneled dialysis catheter are particularly vulnerable to CLABSI [13,35].
Risk Factors for CLABSI
A number of studies have reviewed risk factors and epidemiology of CLABSI in the adult and pediatric population. Factors that have been associated with risk of CLABSI in more than one study include prolonged hospitalization before placement of the central line, prolonged duration of the central line, heavy microbial colonization at the site of insertion, heavy microbial colonization of the catheter hub, multiple lumens, internal jugular site catheterization, femoral vein site catheterization, neutropenia of the patient, a reduced nurse to patient ratio in the ICU setting, presence of total parenteral nutrition, and poor maintenance care of the catheter [4,13,36–40]. One study [41] that calculated a score to help predict risk of PICC-CLABSI found that previous CLABSI (within 3 months of PICC insertion) significantly increases risk of repeat CLABSI.
Conclusion
CLABSI is an important cause of morbidity, mortality and cost. There has been remarkable success in prevention of these infections in recent years due to focused efforts on patient safety. As efforts have multiplied to put into place interventions to decrease CLABSI nationally, the CDC published a Vital Signs report discussing the impact of these efforts [42]. It was estimated that over one decade, infection prevention efforts had avoided 25,000 CLABSIs in U.S. ICUs, a 58% reduction in this infection [42]. CLABSI has served as the best example of using evidence-based interventions through an infection prevention bundle or framework to reduce HAIs. Similar approaches are being used to try to reduce catheter-associated urinary tract infection, Clostridium difficile infection, surgical site infection, and ventilator-associated pneumonia, but there have been less distinct successes nationally and internationally for these other HAIs.
The literature emphasizes that there are several evidence-based measures that can prevent CLABSI. These include hand hygiene, using alcoholic chlorhexidine for skin preparation prior to insertion, maximal sterile barrier precautions, avoiding the femoral site for CVC insertion, and removing unnecessary catheters as soon as possible. Support from administration in emphasizing patient safety and HAI prevention along with following evidence-based practice could lead to long-term improvement in CLABSI prevention across hospital systems.
Corresponding author: Payal K. Patel, MD, MPH, Div of Infectious Diseases, Dept of Internal Medicine, VA Ann Arbor Healthcare System, 2215 Fuller Rd, Ann Arbor, MI 48105, [email protected].
Financial disclosures: None.
1. Magill SS, Edwards JR, Bamberg W, et al; Emerging Infections Program Healthcare-Associated Infections and Antimicrobial Use Prevalence Survey Team. Multistate point-prevalence survey of health care-associated infections. N Engl J Med 2014;370:1198–208.
2. Marchetti A, Rossiter R. Economic burden of healthcare-associated infection in US acute care hospitals: societal perspective. J Med Econ 2013;16:1399–404.
3. O’Neil C, Ball K, Wood H, et al. A central line care maintenance bundle for the prevention of central line-associated bloodstream infection in non-intensive care unit settings. Infect Control Hosp Epidemiol 2016;37:1–7.
4. Shekelle PG, Wachter RM, Pronovost PJ, et al. Making health care safer II: an updated critical analysis of the evidence for patient safety practices. Evid Rep Technol Assess (Full Rep) 2013:1–945.
5. Patel PK, Gupta A, Vaughn VM, Mann JD, Ameling JM, Meddings J. Review of strategies to reduce central line-associated bloodstream infection (CLABSI) and catheter-associated urinary tract infection (CAUTI) in adult ICUs. J Hosp Med 2018;13:105–16.
6. Chopra V, Ratz D, Kuhn L, et al. PICC-associated bloodstream infections: prevalence, patterns, and predictors. Am J Med 2014;127:319–28.
7. Sagana R, Hyzy RC. Achieving zero central line-associated bloodstream infection rates in your intensive care unit. Crit Care Clin 2013;29:1–9.
8. Nelson RE, Angelovic AW, Nelson SD, Gleed JR, Drews FA. An economic analysis of adherence engineering to improve use of best practices during central line maintenance procedures. Infect Control Hosp Epidemiol 2015;36:550–6.
9. Pronovost P, Needham D, Berenholtz S, et al. An intervention to decrease catheter-related bloodstream infections in the ICU. N Engl J Med 2006;355:2725–32.
10. Dumyati G, Concannon C, van Wijngaarden E, et al. Sustained reduction of central line-associated bloodstream infections outside the intensive care unit with a multimodal intervention focusing on central line maintenance. Am J Infect Control 2014;42:723–30.
11. Sacks GD, Diggs BS, Hadjizacharia P, et al. Reducing the rate of catheter-associated bloodstream infections in a surgical intensive care unit using the Institute for Healthcare Improvement Central Line Bundle. Am J Surg 2014;207:817–23.
12. Boyce JM, Pittet D; Healthcare Infection Control Practices Advisory Committee; HICPAC/SHEA/APIC/IDSA Hand Hygiene Task Force. Guideline for hand hygiene in health-care settings: recommendations of the Healthcare Infection Control Practices Advisory Committee and the HICPAC/SHEA/APIC/IDSA Hand Hygiene Task Force. Society for Healthcare Epidemiology of America/Association for Professionals in Infection Control/Infectious Diseases Society of America. MMWR Recomm Rep 2002; 51:1-45, quiz CE1–4.
13. Marschall J, Mermel LA, et al; Society for Healthcare Epidemiology of America. Strategies to prevent central line-associated bloodstream infections in acute care hospitals: 2014 update. Infect Control Hosp Epidemiol 2014;35:753–71.
14. Safdar N, Maki DG. The pathogenesis of catheter-related bloodstream infection with noncuffed short-term central venous catheters. Intensive Care Med 2004;30:62–7.
15. Shabot MM, Chassin MR, France AC, et al. Using the targeted solutions tool(R) to improve hand hygiene compliance is associated with decreased health care-associated infections. Jt Comm J Qual Patient Saf 2016;42:6–17.
16. Johnson L, Grueber S, Schlotzhauer C, et al. A multifactorial action plan improves hand hygiene adherence and significantly reduces central line-associated bloodstream infections. Am J Infect Control 2014;42:1146–51.
17. Barrera L, Zingg W, Mendez F, Pittet D. Effectiveness of a hand hygiene promotion strategy using alcohol-based handrub in 6 intensive care units in Colombia. Am J Infect Control 2011;39:633–9.
18. Hu KK, Lipsky BA, Veenstra DL, Saint S. Using maximal sterile barriers to prevent central venous catheter-related infection: a systematic evidence-based review. Am J Infect Control 2004;32:142–6.
19. Hu KK, Veenstra DL, Lipsky BA, Saint S. Use of maximal sterile barriers during central venous catheter insertion: clinical and economic outcomes. Clin Infect Dis 2004;39:1441–5.
20. Raad II, Hohn DC, Gilbreath BJ, et al. Prevention of central venous catheter-related infections by using maximal sterile barrier precautions during insertion. Infect Control Hosp Epidemiol 1994;15:231–8.
21. Furuya EY, Dick AW, Herzig CT, Pogorzelska-Maziarz M, Larson EL, Stone PW. Central line-associated bloodstream infection reduction and bundle compliance in intensive care units: a national study. Infect Control Hosp Epidemiol 2016;37:805–10.
22. Sherertz RJ, Ely EW, Westbrook DM, et al. Education of physicians-in-training can decrease the risk for vascular catheter infection. Ann Intern Med 2000;132:641–8.
23. Mimoz O, Lucet JC, Kerforne T, Pascal J, et al. Skin antisepsis with chlorhexidine-alcohol versus povidone iodine-alcohol, with and without skin scrubbing, for prevention of intravascular-catheter-related infection (CLEAN): an open-label, multicentre, randomised, controlled, two-by-two factorial trial. Lancet 2015;386:2069–77.
24. Lai NM, Lai NA, O’Riordan E, et al. Skin antisepsis for reducing central venous catheter-related infections. Cochrane Database Syst Rev 2016;7:CD010140.
25. Chopra V, Shojania KG. Recipes for checklists and bundles: one part active ingredient, two parts measurement. BMJ Qual Saf 2013;22:93–6.
26. Marik PE, Flemmer M, Harrison W. The risk of catheter-related bloodstream infection with femoral venous catheters as compared to subclavian and internal jugular venous catheters: a systematic review of the literature and meta-analysis. Crit Care Med 2012;40:2479–85.
27. Timsit JF. What is the best site for central venous catheter insertion in critically ill patients? Crit Care 2003;7:397–99.
28. Parienti JJ, Mongardon N, Megarbane B, et al; 3SITES Study Group. Intravascular complications of central venous catheterization by insertion site. N Engl J Med 2015;373:1220–9.
29. Hind D, Calvert N, McWilliams R, et al. Ultrasonic locating devices for central venous cannulation: meta-analysis. BMJ 2003;327:361.
30. Fragou M, Gravvanis A, Dimitriou V, et al. Real-time ultrasound-guided subclavian vein cannulation versus the landmark method in critical care patients: a prospective randomized study. Crit Care Med 2011;39:1607–12.
31. Pageler NM, Longhurst CA, Wood M, et al. Use of electronic medical record-enhanced checklist and electronic dashboard to decrease CLABSIs. Pediatrics 2014;133:e738–46.
32. Drews FA, Bakdash JZ, Gleed JR. Improving central line maintenance to reduce central line-associated bloodstream infections. Am J Infect Control 2017;45:1224–30.
33. Frost SA, Alogso MC, Metcalfe L, et al. Chlorhexidine bathing and health care-associated infections among adult intensive care patients: a systematic review and meta-analysis. Crit Care 2016;20:379.
34. Chopra V, O’Horo JC, Rogers MA, et al. The risk of bloodstream infection associated with peripherally inserted central catheters compared with central venous catheters in adults: a systematic review and meta-analysis. Infect Control Hosp Epidemiol 2013;34:908–18.
35. Xue H, Ix JH, Wang W, et al. Hemodialysis access usage patterns in the incident dialysis year and associated catheter-related complications. Am J Kidney Dis 2013;61:123–30.
36. Almuneef MA, Memish ZA, Balkhy HH, et al. Rate, risk factors and outcomes of catheter-related bloodstream infection in a paediatric intensive care unit in Saudi Arabia. J Hosp Infect 2006;62:207–13.
37. Alonso-Echanove J, Edwards JR, Richards MJ, et al. Effect of nurse staffing and antimicrobial-impregnated central venous catheters on the risk for bloodstream infections in intensive care units. Infect Control Hosp Epidemiol 2003;24:916–25.
38. Lorente L, Henry C, Martin MM, et al. Central venous catheter-related infection in a prospective and observational study of 2,595 catheters. Crit Care 2005;9:R631–5.
39. Rey C, Alvarez F, De-La-Rua V, et al. Intervention to reduce catheter-related bloodstream infections in a pediatric intensive care unit. Intensive Care Med 2011;37:678–85.
40. O’Brien J, Paquet F, Lindsay R, Valenti D. Insertion of PICCs with minimum number of lumens reduces complications and costs. J Am Coll Radiol. 2013;10:864–8.
41. Herc E, Patel P, Washer LL, et al. A model to predict central-line-associated bloodstream infection among patients with peripherally inserted central catheters: the MPC score. Infect Control Hosp Epidemiol 2017;38:1155–66.
42. Centers for Disease Control and Prevention. Vital signs: central line-associated blood stream infections--United States, 2001, 2008, and 2009. MMWR Morb Mortal Wkly Rep 2011;60:243–8.
Division of Infectious Diseases, Department of Internal Medicine, VA Ann Arbor Healthcare System and University of Michigan Health System, Ann Arbor, MI.
Abstract
- Objective: To review prevention of central line–associated bloodstream infection (CLABSI).
- Method: Review of the literature.
- Results: Evidence-based prevention practices include ensuring hand hygiene before the procedure, using maximal sterile barrier precautions, cleaning the skin with alcoholic chlorhexidine before central line insertion, avoiding the femoral site for insertion, and removing unneeded catheters.
- Conclusion: For continued success in CLABSI prevention, best practices should be followed and patient safety should be emphasized.
Health care–associated infections (HAIs) are a preventable cause of morbidity and mortality in the United States and internationally. A Centers for Disease Control and Prevention (CDC) report estimates that in acute care hospitals, 1 in 25 patients end up with at least one HAI during their hospital stay [1]. HAIs can also be costly; in the United States, the indirect and direct cost has been estimated to be between $96 to $147 billion dollars [2]. National initiatives to prevent these types of infections have included efforts from the Department of Health and Human Services (HHS), the Institute of Medicine (IOM), the Institute for Healthcare Improvement (IHI) and the Centers for Medicare and Medicaid Services (CMS). This work has led to particular success in preventing central line–associated bloodstream infection (CLABSI).
CLABSI can lead to considerable mortality, morbidity, and cost. An estimated 250,000 CLABSIs occur in patients yearly, and about 80,000 of those are estimated to occur in the intensive care unit (ICU) setting [3]. Since central venous catheters (CVCs), or central lines, are most often used in the ICU setting, much of the work on prevention and management of CLABSI has been within the ICU population [4,5]. The increased use of peripherally inserted central catheters (PICCs) in the non-ICU setting and recognition of CLABSI in non-ICU settings has led to new efforts to understand the best way to prevent CLABSI in the non-ICU setting [4,6]. Regardless of setting, the annual cost of these infections has been estimated to be as high as $2.3 billion [7]. One episode is estimated to cost a hospital up to $46,485 per episode with components of excess length of stay, antibiotic cost, and cost of care [8]. In this review, selected best practices in CLABSI prevention are identified and described.
Elements of CLABSI Prevention
One of the key papers in the CLABSI literature was the Keystone ICU project in Michigan [9]. This state-wide effort grew out of a successful pilot patient-safety program that was trialed at Johns Hopkins Medical Institutions to reduce CLABSI in the ICU setting. In 2003, the Agency for Healthcare Research and Quality (AHRQ) funded a study to examine the intervention in ICUs in the state of Michigan. A total of 108 ICUs from 67 individual hospitals participated in the pre-intervention/post-intervention study [9]. A combination of technical and socio-adaptive interventions to prevent CLABSI included clinician education on best practices in insertion of central lines, having a central-line cart in each ICU, an insertion checklist of best practices, empowering nursing staff to stop the procedure if best practices were not being followed, discussing removal of catheters daily, and providing feedback to units regarding rates of CLABSI [10]. Executive administration of each hospital was also involved and there were monthly phone calls for hospital teams to share successes and barriers.
In the pre-intervention phase, the median catheter- related bloodstream infection rate was 2.7 infections per 1000 catheter days for the sum of hospitals. After the interventions were put in place, the median rate of catheter related bloodstream infections was down to 0.34 at 18 months. The study showed that results from a relatively inexpensive and straightforward intervention could be effective and could last in the long term. This study led to many other single center and multicenter studies, nationally and internationally, to replicate results in efforts to decrease CLABSI in ICU populations [5]. The CDC and AHRQ have continued to partner with regional, state and national efforts to focus on CLABSI prevention.
The Bundle Approach
A number of interventions have been proven to be effective at preventing CLABSI. Combining more than one intervention can often have additive effects. This effect has been recognized in numerous quality improvement studies on CLABSI and has been termed using the “bundle” approach.
Hand Hygiene
Poor hand hygiene by health care workers is generally thought to be the most common cause of HAIs [12]. Guidelines recommend an alcohol-based waterless product or antiseptic soap and water prior to catheter insertion [13]. The most common underlying etiology of CLABSI is through microorganisms introduced at time of insertion of catheter. This can be extraluminally mediated via skin flora of the patient, or due to lack of hand washing on the inserter’s part and can lead to CLABSI [14]. While a randomized controlled trial would be unethical, several studies have shown when targeted hand hygiene campaigns are held, CLABSI rates tend to decrease [15–17].
Maximal Barrier Precautions
The use of maximal sterile barrier precautions has been associated with less mortality, decreasing catheter colonization, incidence of HAI and cost savings [18–20]. Like most components of the bundle, maximal sterile barrier precautions have rarely been studied alone, but are often a part of a “bundle” or number of interventions [21]. Like hand hygiene, while regularly a part of many hospital’s checklist or bundle process, compliance with this key part of infection prevention can be deficient; one study noted measured maximal sterile barriers compliance to be 44% [22].
Chlorhexidine Skin Antisepsis
Chlorhexidine skin preparation decreases bacterial burden at site of insertion and is thought to reduce infection from this mechanism. Chlorhexidine-alcohol skin preparation has been proven in randomized controlled trials to outperform povidone iodine-alcohol in preventing CLABSI [23,24]. Chlorhexidine skin preparation is considered a technical element of checklists and is thought to be a straightforward and easily implementable action [25]. If a hospital supplies only alcoholic chlorhexidine and doesn’t provide povidone-iodine for skin preparation, then clinicians can be “nudged” towards performing this part of the bundle.
Optimal Catheter Site Selection
For all sites of insertion of CVC, the risk of mechanical and infectious complications depends on the skill and proficiency of operators, the clinical situation, and the availability of ultrasound to help guide placement. These factors are important in determining which anatomical site is best for each patient [26]. The femoral site has been associated with a greater risk of catheter-related infection and catheter-related thrombosis and is not recommended as the initial choice for non-emergent CVC insertion according to national guidelines [13,27]. The internal jugular vein site is associated with a lower risk of severe mechanical complications such as pneumothorax when compared to subclavian vein site [27]. The subclavian vein site is associated with a lower risk of catheter-related blood stream infection and lower rate of thrombosis, but this greatly depends on experience of operator. Experts have proposed that the subclavian site has a lower burden of colonization by bacteria than other sites and is anatomically more protected by catheter dressing; also the subcutaneous course of the central line itself is longer for the subclavian site than other sites and these reasons could contribute to the lower risk of infection [28]. The subclavian site is, however, associated with a higher risk of mechanical complications that can be serious for ICU patients. In general, the femoral vein site should be avoided in non-emergent line placement situations, particularly if the patient is an obese adult [13]. Using ultrasound as a guidance for catheter insertion has also been shown to reduce risk of CLABSI and other mechanical complications and is recommended [29,30].
Daily Review of Line Necessity
Removing unnecessary catheters as soon as possible decreases catheter dwell time and risk of infection. Few studies have concentrated on this step alone in CLABSI prevention, but the studies that have focused on catheter removal usually implement electronic reminders or multidisciplinary catheter rounds (where need for catheter is incorporated into daily rounds or discussed separately by a multidisciplinary group) [5,31].
Additional Considerations
Other basic practices that all hospitals should adopt include the above strategies and providing all inclusive catheter carts or kits, disinfecting hubs in maintenance care of catheters, covering the CVC site with sterile dressings, having recurrent educational interventions and using checklists to assure adherence to the evidence-based bundle (Table) [4,13]. As prevalence of non-ICU central lines has also grown, maintenance care is particularly important in reducing CLABSI. Maintenance bundles that highlight best practices such as aseptic technique, correct hand hygiene, chlorhexidine skin disinfection scrub, antimicrobial bandage application, and catheter hub disinfection have been used with success [32]. Specialized CVC insertion teams with trained personnel have also been recommended [4]. When these basic evidence-based practices are still unable to bring down CLABSI rates for select populations or during an outbreak, supplemental strategies can be tried to reduce CLABSI. These include antimicrobial-impregnated catheters, chlorhexidine-impregnated dressings, and chlorhexidine bathing, which is increasingly being used in the ICU setting [5,13,33].
Epidemiology/Risk Factors
At-risk Populations
ICU patients are at risk for CLABSI because of frequent use of multiple catheters, and the comorbidities and acuity of care that these patients have. ICU patients also tend to have lots of manipulation of their catheters and often these catheters are placed in emergent situations [13]. Patients in the non-ICU and outpatient setting are also at risk for CLABSI when they have a central venous catheter. Long courses of antibiotics for disease states such as osteomyelitis and endocarditis often entail central venous catheters. Recent work has shown that PICCs carry as high of a CLABSI risk as short-term CVCs in hospitalized patients [34]. Patients with end-stage renal disease, especially those undergoing maintenance hemodialysis via a tunneled dialysis catheter are particularly vulnerable to CLABSI [13,35].
Risk Factors for CLABSI
A number of studies have reviewed risk factors and epidemiology of CLABSI in the adult and pediatric population. Factors that have been associated with risk of CLABSI in more than one study include prolonged hospitalization before placement of the central line, prolonged duration of the central line, heavy microbial colonization at the site of insertion, heavy microbial colonization of the catheter hub, multiple lumens, internal jugular site catheterization, femoral vein site catheterization, neutropenia of the patient, a reduced nurse to patient ratio in the ICU setting, presence of total parenteral nutrition, and poor maintenance care of the catheter [4,13,36–40]. One study [41] that calculated a score to help predict risk of PICC-CLABSI found that previous CLABSI (within 3 months of PICC insertion) significantly increases risk of repeat CLABSI.
Conclusion
CLABSI is an important cause of morbidity, mortality and cost. There has been remarkable success in prevention of these infections in recent years due to focused efforts on patient safety. As efforts have multiplied to put into place interventions to decrease CLABSI nationally, the CDC published a Vital Signs report discussing the impact of these efforts [42]. It was estimated that over one decade, infection prevention efforts had avoided 25,000 CLABSIs in U.S. ICUs, a 58% reduction in this infection [42]. CLABSI has served as the best example of using evidence-based interventions through an infection prevention bundle or framework to reduce HAIs. Similar approaches are being used to try to reduce catheter-associated urinary tract infection, Clostridium difficile infection, surgical site infection, and ventilator-associated pneumonia, but there have been less distinct successes nationally and internationally for these other HAIs.
The literature emphasizes that there are several evidence-based measures that can prevent CLABSI. These include hand hygiene, using alcoholic chlorhexidine for skin preparation prior to insertion, maximal sterile barrier precautions, avoiding the femoral site for CVC insertion, and removing unnecessary catheters as soon as possible. Support from administration in emphasizing patient safety and HAI prevention along with following evidence-based practice could lead to long-term improvement in CLABSI prevention across hospital systems.
Corresponding author: Payal K. Patel, MD, MPH, Div of Infectious Diseases, Dept of Internal Medicine, VA Ann Arbor Healthcare System, 2215 Fuller Rd, Ann Arbor, MI 48105, [email protected].
Financial disclosures: None.
1. Magill SS, Edwards JR, Bamberg W, et al; Emerging Infections Program Healthcare-Associated Infections and Antimicrobial Use Prevalence Survey Team. Multistate point-prevalence survey of health care-associated infections. N Engl J Med 2014;370:1198–208.
2. Marchetti A, Rossiter R. Economic burden of healthcare-associated infection in US acute care hospitals: societal perspective. J Med Econ 2013;16:1399–404.
3. O’Neil C, Ball K, Wood H, et al. A central line care maintenance bundle for the prevention of central line-associated bloodstream infection in non-intensive care unit settings. Infect Control Hosp Epidemiol 2016;37:1–7.
4. Shekelle PG, Wachter RM, Pronovost PJ, et al. Making health care safer II: an updated critical analysis of the evidence for patient safety practices. Evid Rep Technol Assess (Full Rep) 2013:1–945.
5. Patel PK, Gupta A, Vaughn VM, Mann JD, Ameling JM, Meddings J. Review of strategies to reduce central line-associated bloodstream infection (CLABSI) and catheter-associated urinary tract infection (CAUTI) in adult ICUs. J Hosp Med 2018;13:105–16.
6. Chopra V, Ratz D, Kuhn L, et al. PICC-associated bloodstream infections: prevalence, patterns, and predictors. Am J Med 2014;127:319–28.
7. Sagana R, Hyzy RC. Achieving zero central line-associated bloodstream infection rates in your intensive care unit. Crit Care Clin 2013;29:1–9.
8. Nelson RE, Angelovic AW, Nelson SD, Gleed JR, Drews FA. An economic analysis of adherence engineering to improve use of best practices during central line maintenance procedures. Infect Control Hosp Epidemiol 2015;36:550–6.
9. Pronovost P, Needham D, Berenholtz S, et al. An intervention to decrease catheter-related bloodstream infections in the ICU. N Engl J Med 2006;355:2725–32.
10. Dumyati G, Concannon C, van Wijngaarden E, et al. Sustained reduction of central line-associated bloodstream infections outside the intensive care unit with a multimodal intervention focusing on central line maintenance. Am J Infect Control 2014;42:723–30.
11. Sacks GD, Diggs BS, Hadjizacharia P, et al. Reducing the rate of catheter-associated bloodstream infections in a surgical intensive care unit using the Institute for Healthcare Improvement Central Line Bundle. Am J Surg 2014;207:817–23.
12. Boyce JM, Pittet D; Healthcare Infection Control Practices Advisory Committee; HICPAC/SHEA/APIC/IDSA Hand Hygiene Task Force. Guideline for hand hygiene in health-care settings: recommendations of the Healthcare Infection Control Practices Advisory Committee and the HICPAC/SHEA/APIC/IDSA Hand Hygiene Task Force. Society for Healthcare Epidemiology of America/Association for Professionals in Infection Control/Infectious Diseases Society of America. MMWR Recomm Rep 2002; 51:1-45, quiz CE1–4.
13. Marschall J, Mermel LA, et al; Society for Healthcare Epidemiology of America. Strategies to prevent central line-associated bloodstream infections in acute care hospitals: 2014 update. Infect Control Hosp Epidemiol 2014;35:753–71.
14. Safdar N, Maki DG. The pathogenesis of catheter-related bloodstream infection with noncuffed short-term central venous catheters. Intensive Care Med 2004;30:62–7.
15. Shabot MM, Chassin MR, France AC, et al. Using the targeted solutions tool(R) to improve hand hygiene compliance is associated with decreased health care-associated infections. Jt Comm J Qual Patient Saf 2016;42:6–17.
16. Johnson L, Grueber S, Schlotzhauer C, et al. A multifactorial action plan improves hand hygiene adherence and significantly reduces central line-associated bloodstream infections. Am J Infect Control 2014;42:1146–51.
17. Barrera L, Zingg W, Mendez F, Pittet D. Effectiveness of a hand hygiene promotion strategy using alcohol-based handrub in 6 intensive care units in Colombia. Am J Infect Control 2011;39:633–9.
18. Hu KK, Lipsky BA, Veenstra DL, Saint S. Using maximal sterile barriers to prevent central venous catheter-related infection: a systematic evidence-based review. Am J Infect Control 2004;32:142–6.
19. Hu KK, Veenstra DL, Lipsky BA, Saint S. Use of maximal sterile barriers during central venous catheter insertion: clinical and economic outcomes. Clin Infect Dis 2004;39:1441–5.
20. Raad II, Hohn DC, Gilbreath BJ, et al. Prevention of central venous catheter-related infections by using maximal sterile barrier precautions during insertion. Infect Control Hosp Epidemiol 1994;15:231–8.
21. Furuya EY, Dick AW, Herzig CT, Pogorzelska-Maziarz M, Larson EL, Stone PW. Central line-associated bloodstream infection reduction and bundle compliance in intensive care units: a national study. Infect Control Hosp Epidemiol 2016;37:805–10.
22. Sherertz RJ, Ely EW, Westbrook DM, et al. Education of physicians-in-training can decrease the risk for vascular catheter infection. Ann Intern Med 2000;132:641–8.
23. Mimoz O, Lucet JC, Kerforne T, Pascal J, et al. Skin antisepsis with chlorhexidine-alcohol versus povidone iodine-alcohol, with and without skin scrubbing, for prevention of intravascular-catheter-related infection (CLEAN): an open-label, multicentre, randomised, controlled, two-by-two factorial trial. Lancet 2015;386:2069–77.
24. Lai NM, Lai NA, O’Riordan E, et al. Skin antisepsis for reducing central venous catheter-related infections. Cochrane Database Syst Rev 2016;7:CD010140.
25. Chopra V, Shojania KG. Recipes for checklists and bundles: one part active ingredient, two parts measurement. BMJ Qual Saf 2013;22:93–6.
26. Marik PE, Flemmer M, Harrison W. The risk of catheter-related bloodstream infection with femoral venous catheters as compared to subclavian and internal jugular venous catheters: a systematic review of the literature and meta-analysis. Crit Care Med 2012;40:2479–85.
27. Timsit JF. What is the best site for central venous catheter insertion in critically ill patients? Crit Care 2003;7:397–99.
28. Parienti JJ, Mongardon N, Megarbane B, et al; 3SITES Study Group. Intravascular complications of central venous catheterization by insertion site. N Engl J Med 2015;373:1220–9.
29. Hind D, Calvert N, McWilliams R, et al. Ultrasonic locating devices for central venous cannulation: meta-analysis. BMJ 2003;327:361.
30. Fragou M, Gravvanis A, Dimitriou V, et al. Real-time ultrasound-guided subclavian vein cannulation versus the landmark method in critical care patients: a prospective randomized study. Crit Care Med 2011;39:1607–12.
31. Pageler NM, Longhurst CA, Wood M, et al. Use of electronic medical record-enhanced checklist and electronic dashboard to decrease CLABSIs. Pediatrics 2014;133:e738–46.
32. Drews FA, Bakdash JZ, Gleed JR. Improving central line maintenance to reduce central line-associated bloodstream infections. Am J Infect Control 2017;45:1224–30.
33. Frost SA, Alogso MC, Metcalfe L, et al. Chlorhexidine bathing and health care-associated infections among adult intensive care patients: a systematic review and meta-analysis. Crit Care 2016;20:379.
34. Chopra V, O’Horo JC, Rogers MA, et al. The risk of bloodstream infection associated with peripherally inserted central catheters compared with central venous catheters in adults: a systematic review and meta-analysis. Infect Control Hosp Epidemiol 2013;34:908–18.
35. Xue H, Ix JH, Wang W, et al. Hemodialysis access usage patterns in the incident dialysis year and associated catheter-related complications. Am J Kidney Dis 2013;61:123–30.
36. Almuneef MA, Memish ZA, Balkhy HH, et al. Rate, risk factors and outcomes of catheter-related bloodstream infection in a paediatric intensive care unit in Saudi Arabia. J Hosp Infect 2006;62:207–13.
37. Alonso-Echanove J, Edwards JR, Richards MJ, et al. Effect of nurse staffing and antimicrobial-impregnated central venous catheters on the risk for bloodstream infections in intensive care units. Infect Control Hosp Epidemiol 2003;24:916–25.
38. Lorente L, Henry C, Martin MM, et al. Central venous catheter-related infection in a prospective and observational study of 2,595 catheters. Crit Care 2005;9:R631–5.
39. Rey C, Alvarez F, De-La-Rua V, et al. Intervention to reduce catheter-related bloodstream infections in a pediatric intensive care unit. Intensive Care Med 2011;37:678–85.
40. O’Brien J, Paquet F, Lindsay R, Valenti D. Insertion of PICCs with minimum number of lumens reduces complications and costs. J Am Coll Radiol. 2013;10:864–8.
41. Herc E, Patel P, Washer LL, et al. A model to predict central-line-associated bloodstream infection among patients with peripherally inserted central catheters: the MPC score. Infect Control Hosp Epidemiol 2017;38:1155–66.
42. Centers for Disease Control and Prevention. Vital signs: central line-associated blood stream infections--United States, 2001, 2008, and 2009. MMWR Morb Mortal Wkly Rep 2011;60:243–8.
Current Controversies Regarding Nutrition Therapy in the ICU
From the Center for Nursing Science & Clinical Inquiry (Dr. McCarthy), and Nutrition Care Division, (Ms. Phipps), Madigan Army Medical Center, Tacoma, WA.
Abstract
- Background: Many controversies exist in the field of nutrition support today, particularly in the critical care environment where nutrition plays a more primary rather than adjunctive role.
- Objective: To provide a brief review of current controversies regarding nutrition therapy in the ICU focusing on the choices regarding the nutrition regimen and the safe, consistent delivery of nutrition as measured by clinical outcomes.
- Methods: Selected areas of controversy are discussed detailing the strengths and weaknesses of the research behind opposing opinions.
- Results: ICU nutrition support controversies include enteral vs parenteral nutrition, use of supplmental parenteral nutrition, protein quantity and quality, and polymeric vs immune-modulating nutrients. Issues surrounding the safety of nutrition support therapy include gastric vs small bowel feeding and trophic vs full feeding. Evidence-based recommendations published by professional societies are presented.
- Conclusion: Understanding a patient’s risk for disease and predicting their response to treatment will assist clinicians with selecting those nutrition interventions that will achieve the best possible outcomes.
According to the National Library of Medicine’s translation of the Hippocratic oath, nowhere does it explicitly say “First, do no harm.” What is written is this: “I will use those dietary regimens which will benefit my patients according to my greatest ability and judgement, and I will do no harm or injustice to them” [1]. In another renowned text, one can find this observation regarding diet by a noted scholar, clinician, and the founder of modern nursing, Florence Nightingale: “Every careful observer of the sick will agree in this that thousands of patients are annually starved in the midst of plenty, from want of attention to the ways which alone make it possible for them to take food” [2,]. While Nightingale was alluding to malnutrition of hospitalized patients, it seems that her real concern may have been the iatrogenic malnutrition that inevitably accompanies hospitalization, even today [3].
From these philosophic texts, we have two ongoing controversies in modern day nutrition therapy identified: (1) what evidence do we have to support the choice of dietary regimens (ie, enteral vs parenteral therapy, timing of supplemental parenteral nutrition, standard vs high protein formula, polymeric vs immune-modulating nutrients) that best serve critically ill patients, and (2) how do we ensure that ICU patients are fed in a safe, consistent, and effective manner (gastric vs small bowel tube placement, gastric residual monitoring or not, trophic vs full feeding) as measured by clinically relevant outcomes? Many controversies exist in the field of nutrition support today [4–7] and a comprehensive discussion of all of them is beyond the scope of this paper. In this paper we will provide a brief review of current controversies focusing on those mentioned above which have only recently been challenged by new rigorous randomized clinical trials (RCTs), and in some cases, subsequent systematic reviews and meta-analyses [8–11].
The Path to Modern Day Nutrition Support Therapy
The field of nutrition support, in general, has expanded greatly over the last 4 decades, but perhaps the most notable advancements have occurred in the critical care environment where efforts have been directed at advancing our understanding of the molecular and biological effects of nutrients in maintaining homeostasis in the critically ill [6]. In recent years, specialized nutrition, delivered by the enteral or parenteral route, was finally recognized for its contribution to important clinical outcomes in the critically ill population [12]. Critical care clinicians have been educated about the advances in nutrition therapy designed to address the unique needs of a vulnerable population where survival is threatened by poor nutritional status upon admission, compromised immune function, weakened respiratory muscles with decreased ventilation capacity, and gastrointestinal (GI) dysfunction [6]. The rapid deterioration seen in these patients is exaggerated by the all too common ICU conditions of systemic inflammatory response syndrome (SIRS), sepsis, hemodynamic instability, respiratory failure, coagulation disorders, and acute kidney injury [13,14].
Beginning in the early 1990s, formulations of enteral nutrition (EN) contained active nutrients that reportedly reduced oxidative damage to cells and tissues, modulated inflammation, and improved feeding tolerance. These benefits are now referred to as the non-nutritive benefits of enteral feeding [15]. For the next 20 years, scientific publications released new results from studies examining the role of omega-3 fatty acids, antioxidant vitamins, minerals such as selenium and zinc, ribonucleotides, and conditionally essential amino acids like glutamine and arginine, in healing and recovery from critical illness. The excitement was summarized succinctly by Hegazi and Wischmeyer in 2011 when they remarked that the modern ICU clinician now has scientific data to guide specialized nutrition therapy, for example, choosing formulas supplemented with anti-inflammatory, immune-modulating, or tolerance-promoting nutrients that have the potential to enhance natural recovery processes and prevent complications [16].
The improvements in nutritional formulas were accompanied by numerous technological advances including bedside devices (electromagnetic enteral access system, real-time image-guided disposable feeding tube, smart feeding pumps with water flush technology) that quickly and safely establish access for small bowel feedings, which help minimize risk of gastric aspiration and ventilator-associated pneumonia, promote tolerance, decrease radiologic exposure, and may reduce nursing time consumed by tube placements, GI dysfunction, and patient discomfort [17–20]. Nasogastric feeding remains the most common first approach, with local practices, contraindications, and ease of placement usually determining the location of the feeding tube [5]. The advancements helped to overcome the many barriers to initiating and maintaining feedings and thus, efforts to feed critically ill patients early and effectively became more routine, along with nurse, patient, and family satisfaction. In conjunction with the innovative approaches to establishing nutrition therapy, practice guidelines published by United States, European, and Canadian nutrition societies became widely available in the past decade with graded evidence-based recommendations for who, when, what, and how to feed, and unique considerations for various critically ill populations [12,21,22]. The tireless efforts by the nutrition societies to provide much needed guidelines for clinicians were appreciated, yet there was a wide range in the grade of the recommendations, with many based on expert opinion alone. In some cases, the research conducted lacked rigor or had missing data with obvious limits to the generalizability of results. Nevertheless, for the 7 years between the publication of the old and newly revised Society of Critical Care Medicine (SCCM)/ American Society of Parenteral and Enteral Nutrition (ASPEN) Guidelines (2016), [12,23] nutrition therapy was a high-priority intervention in most ICUs. The goal was to initiate feeding within 48 hours, select an immune-modulating or other metabolic support formula, and aggressively advance the rate to 80% to 100% of goal to avoid caloric deficit, impaired intestinal integrity, nitrogen losses, and functional impairments [9,24,25]. Nutrition support evolved from adjunctive care to its rightful place in the ABCD mnemonic of early priorities of ICU care: Airway, Breathing, Circulation, Diet.
The 2016 joint publication of the SCCM/ASPEN guidelines includes primarily randomized controlled trial (RCT) data, along with some observational trial data, indexed in any major publication database through December 2013. In these guidelines there were 98 recommendations, of which only 5 were a Level 1A; most of the recommendations were categorized as “expert consensus” [12]. The results of several important clinical trials in the United States and Europe that were underway at the time have since been published and compared to the SCCM/ASPEN relevant recommendations [7]. The results have forced nutrition support clinicians to take a step back and re-examine their practice. For many seasoned clinicians who comprised the nutrition support teams of the 1980s and 1990s, it feels like a return to the basics. Until biology-driven personalized medicine is commonplace and genotype data is readily available to guide nutrition therapy for each critically ill patient, standard enteral feeding that begins slow and proceeds carefully over 5 to 7 days towards 80% of goal caloric intake under judicious monitoring of biochemical and metabolic indices may be the “best practice” today, without risk of harm [15,26]. As in all aspects of clinical care, this practice is not without controversy.
ICU Nutrition Support Controversies Today
Enteral vs Parenteral Nutrition
There is universal consensus that EN is the preferred route for nutrition therapy due to the superior physiological response and both nutritional and non-nutritional benefits [24]. Changes in gut permeability tend to occur as illness progresses and consequences include increased bacterial challenge, risk for multiple organ dysfunction syndrome, and systemic infection. It is best to intervene with nutrition early, defined as within the first 48 hours of ICU admission, while the likelihood of success and opportunity to impact the disease process is greater [12]. Early initiation of feeding provides the necessary nutrients to support gut-associated lymphoid tissue (GALT), mucosal-associated lymphoid tissue (MALT), and preserve gut integrity and microbial diversity [27]. The intestine is an effective barrier against bacteria and intraluminal toxins due to the high rate of enterocyte turnover, the mucus secreted by the goblet cells, and the large amount of protective immunological tissue; 80% of the immunoglobulins are synthesized in the GI tract [28]. Fasting states for procedures or delays in feeding longer than 3 days for any reason may contribute to disruption of intestinal integrity through atrophy and derangements in the physical structure and function of the microvilli and crypts [29]. Intestinal dysfunction leads to increased intestinal permeability and the possibility of bacterial translocation. Intestinal ischemia resulting from shock and sepsis may produce hypoxia and reperfusion injuries further affecting intestinal wall permeability [29]. In surgical patients, early enteral feeding has been found to reduce inflammation, oxidative stress, and the catabolic response to anesthesia and surgical-induced stress, help restore intestinal motility, reverse enteric mucosal atrophy, and improve wound healing [26].
We did not have sufficient data to refute the benefits of EN over PN until the paper by Harvey et al (2014), which reported no difference in mortality or infectious complications in ICU patients receiving EN or PN within 36 hours of admission and for up to 5 days [30]. This was the largest published pragmatic RCT, referred to as the CALORIES trial, which analyzed 2388 patients from 33 ICUs and resulted in controversy over what was an unchallenged approach up until this time. It was only a matter of time before other investigators would set out to confirm or negate this finding, which is what Elke and coworkers (2016) did a few years later [31]. They performed an updated systematic review and meta-analysis to evaluate the overall effect of the route of nutrition (EN versus PN) on clinical outcomes in adult critically ill patients. Similar to the Harvey et al report, they found no difference in mortality between the two routes of nutrition. However, unlike the earlier report, patients receiving EN compared to PN had a significant reduction in the number of infectious complications and ICU length of stay. No significant effect was found for hospital length of stay or days requiring mechanical ventilation. The authors suggest that EN delivery of macronutrients below predefined targets may be responsible as PN is more likely to meet or exceed these targets and overwhelm metabolic capacity in the early days of critical illness [31].
The most recent trial prompting even more discussion about early PN versus early EN in mechanically ventilated ICU patients in shock is the Reignier et al (2018) NUTRIREA-2 trial involving 2410 patients from 44 ICUs in France [32]. The investigators hypothesized that outcomes would be better with early exclusive EN compared to early exclusive PN; their hypothesis was not supported by the results, which found no difference in 28-day mortality or ICU-acquired infections. Also unexpected was the higher cumulative incidence of gastrointestinal complications including vomiting, diarrhea, bowel ischemia, and acute colonic obstruction in the EN group. The trial was stopped early after an interim analysis determined that additional enrollment was not likely to significantly change the results of the trial. Given the similarities between the CALORIES trial and this NUTRIREA-2 trial, clinicians now have mounting evidence that equivalent options for nutrition therapy exist and an appropriate selection should be made based on patient-specific indications and treatment goals. In summary, EN remains preferable to PN for the majority of adult critically ill patients due to crucial support of gut integrity, but the optimal dose or rate of delivery to favorably influence clinical outcomes in the first few days following admission remains unknown.
Use of Supplemental Parenteral Nutrition
Both the nutrition support and bench science communities have learned a great deal about PN over the 4 decades it has been in existence, with the most compelling data coming from more recent trials [31–38]. This is because it has taken many years to recover from the days of hyperalimentation or overfeeding ICU patients by providing excessive calories to meet the elevated energy demands and to reverse the hypercatabolism of critical illness. This approach contributed to the complications of hyperglycemia, hyperlipidemia, increased infectious complications, and liver steatosis, all of which gave PN a negative reputation [37]. We now have adjusted the caloric distribution and the actual formulation of PN using the recent FDA-approved lipid emulsion (Soy, Medium-chain triglycerides, Olive oil, and Fish oil; SMOF) and created protocols for administering it based on specific indications, such as loss of GI integrity or demonstrated intolerance. In general, the advances in PN have led to a safer more therapeutic formulation that has its place in critical illness. Manzanares et al [40] reported a trend toward a decrease in ventilation requirement and mortality when a fish oil–containing lipid emulsion was administered to patients who were receiving nutrition support either enterally or parenterally. The meta-analysis combined all soybean oil–sparing lipid emulsions for comparison with soybean oil and was able to show the trend for improved clinical outcomes with soybean oil–sparing lipid emulsions. The main findings of this meta-analysis were that fish oil–containing lipid emulsions may reduce infections and may be associated with a tendency toward fewer mechanical ventilation days, although not mortality, when compared with soybean oil-based strategies or administration of other alternative lipid emulsions in ICU patients [40]. Recent trial results do not change the recommendation for selecting EN first but do suggest lowering the threshold for using PN when EN alone is insufficient to meet nutrition goals. A systematic review reported no benefit of early supplemental PN over late supplemental PN and cautioned that our continued inability to explain greater infectious morbidity and unresolved organ failure limits any justification for early PN [35].
Protein Quantity and Quality
The practice of providing protein in the range of 1.2–2.0 g/kg actual body weight early in critical illness is suggested by expert consensus in the 2016 SCCM/ASPEN guidelines [12]; however, the evidence for efficacy remains controversial. It is argued that the evidence for benefit comes from observational studies, not from prospective RCTs, and that the patients at high risk are often excluded from study protocols. It has also been suggested that in patients with limited vital organ function increased protein delivery may lead to organ compromise. In a recent (2017) paper, Rooyackers et al discussed the post-hoc analyses of data from the EPANIC Trial stating the statistical correlation between protein intake and outcomes indicate that protein was associated with unfavorable outcomes, possibly by inhibiting autophagy [41].
The nutrition support community may have widely varying approaches to feeding critically ill patients but most experts agree that protein may be the most important macronutrient delivered during critical illness. There is consensus that the hypercatabolism associated with stress induces proteolysis and the loss of lean muscle mass, which may affect clinical and functional outcomes beyond the ICU stay. Using multiple assessment modalities, Puthucheary et al (2013) demonstrated a reduction in the rectus femoris muscle of 12.5% over the first week of hospitalization in the ICU and up to 17.7% by day 10. These numbers imply that sufficient protein of at least 1.2 g/kg/day should be provided to minimize these losses, even if the effect on overall outcome remains unknown [42]. Evidence is lacking for whether or not we can prevent the muscle wasting that occurs in critical illness with increased protein dosing. We also need to better identify the possible risks involved with a high-protein intake at the level of the individual patient. A secondary analysis done by Heyland et al (2013) determined that no specific dose or type of macronutrient was found to be associated with improved outcome [43]. It is clear that more large-scale RCTs of protein/amino acid interventions are needed to prove that these nutrition interventions have favorable effects on clinically important outcomes, including long-term physical function.
Polymeric vs Immune-Modulating Nutrients
The Marik and Zaloga (2008) systematic review on immunonutrition in the critically ill convinced most clinicians that while fish-oil based immunonutrition improves the outcome of medical ICU patients, diets supplemented with arginine, with or without glutamine or fish oils, do not demonstrate an advantage over standard enteral products in general ICU, trauma, or burn patients[44]. What followed these trials examining early formulations of immunonutrition was decades of well-intentioned research dedicated to elucidating the mechanism of action for individual immune-modulating nutrients for various populations, including those with acute lung injury/acute respiratory distress syndrome (ARDS) [45–47], sepsis/systemic inflammatory response syndrome [48–50], head and neck cancer [51], upper and lower GI cancer [52–55], and severe acute pancreatitis [56]. Our understanding of immunonutrition and the administration of this formulation in specific disease conditions has grown considerably yet clinicians are still asking exactly what is the role of immunonutrition and who stands to benefit the most from immune-modulating nutrition therapy. The enteral formulations currently available have a proprietary composition and dosage of individual nutrients which yield unpredictable physiologic effects. In addition, the pervasive problem of underfeeding during hospitalization prevents adequate delivery of physiologic doses of nutrients thus contributing to the widely variable research results.
Prevailing expert opinion today is that the majority of critically ill patients will benefit from nutrition support initiated early and delivered consistently; the standard polymeric formula will suffice for the majority of patients with surgical ICU patients potentially deriving benefit from immunonutrition that supports a reduction in infectious complications [57]. In the recent multiple-treatment meta-analysis performed by Mazaki et al (2015) involving 74 studies and 7572 patients, immunonutrition was ranked first for reducing the incidence of 7 complications according to the surface under the cumulative ranking curve; these were as follows: any infection, 0.86; overall complication, 0.88; mortality, 0.81; wound infection, 0.79; intra-abdominal abscess, 0.98; anastomotic leak, 0.79; and sepsis, 0.92. immunonutrition was ranked second for reducing ventilator-associated pneumonia and catheter-associated urinary tract infection (CAUTI), behind immune-modulating PN. The authors stated that immunonutrition was efficacious for reducing the incidence of complications in GI surgery unrelated to the timing of administration [57]. The 2014 publication of results from the MetaPlus Trial [58]challenged the published recommendations for the use of immunonutrition in the medical critically ill population. This trial used high-protein immunonutrition or standard formula for 301 adult critically ill patients in 14 European ICUs with diagnoses such as pneumonia or infections of the urinary tract, bloodstream, central nervous system, eye, ear, nose or throat, and the skin and soft tissue. Even with higher than average target energy intakes of 70% for the high protein immunonutrition group and 80% for the high protein standard group, there were no statistically significant differences in the primary outcome of new infections, or the secondary outcomes of days on mechanical ventilation, Sequential Organ Failure Assessment scores, or ICU and hospital length of stay. However, the 6-month mortality rate of 28% was higher in the medical subgroup [58]. Using these results, as well as existing publications of negative outcomes in medical ICU patients [44,46], the SCCM/ASPEN Guidelines Committee updated its position in 2016 to suggest that immunonutrition formulations or disease-specific formulations should no longer be used routinely in medical ICU patients, including those with acute lung injury/ARDS [12]. The Committee did suggest that these formulations should be reserved for patients with traumatic brain injury and for surgical ICU patients. The benefit for ICU postoperative patients has been linked to the synergistic effect of fish oil and arginine, which must both be present to achieve outcome benefits. A meta-analysis comprised of 35 trials was conducted by Drover et al [58], who reported that administering an arginine and fish oil-containing formula postoperatively reduced infection (RR 0.78; 95% CI, 0.64 to 0.95; P = 0.01) and hospital length of stay (WMD –2.23, 95% CI, –3.80 to –0.65; P = 0.006) but not mortality, when compared to use of a standard formula. Similar results were reported in a second meta-analysis [56], thus providing supportive evidence for the current SCCM/ASPEN recommendation to use an immune-modulating formula (containing both arginine and fish oils) in the SICU for the postoperative patient who requires EN therapy [12].
Safe, Consistent, and Effective Nutrition Support Therapy
Gastric vs Small Bowel Feeding
There is a large group of critically ill patients in whom impaired gastric emptying presents challenges to feeding; 50% of mechanically ventilated patients demonstrate delayed gastric emptying, and 80% of patients with increased intracranial pressure following head injury [60]. In one prospective RCT, Huang et al (2012) showed that severely ill patients (defined by an APACHE II score > 20) fed by the nasoduodenal route experienced significantly shortened hospital LOS, fewer complications, and improved nutrient delivery compared to similar patients fed by the nasogastric route. Less severely ill patients (APACHE II < 20) showed no differences between nasogastric and nasoduodenal feeding for the same outcomes [61]. A recent systematic review [17] pooled data from 14 trials of 1109 participants who received either gastric or small bowel feeding. Moderate quality evidence suggested that post-pyloric feeding was associated with lower rates of pneumonia compared with gastric feeding (RR 0.65, 95% CI, 0.51 to 0.84). Low-quality evidence showed an increase in the percentage of total nutrient delivered to the patient by post-pyloric feeding (mean difference 7.8%, 95% CI, 1.43 to 14.18). Overall, the authors found a 30% lower rate of pneumonia associated with post-pyloric feeding. There is insufficient evidence to show that other clinically important outcomes such as duration of mechanical ventilation, mortality, or LOS were affected by the site of feeding. The American Thoracic Society and ASPEN, as well as the Infectious Diseases Society of America, have published guidelines in support of small bowel feeding in the ICU setting due to its association with reduced incidence of health care–associated infections, specifically ventilator-associated pneumonia [62]. The experts who developed the SCCM/ASPEN and Canadian guidelines stress that critically ill patients at high risk for aspiration or feeding intolerance should be fed using small bowel access [12,21]. The reality in ICU clinical practice is that many centers will begin with gastric feeding, barring absolute contraindications, and carefully monitor the patient for signs of intolerance before moving the feeding tube tip into a post-pyloric location. This follows the general recommendation by experts saying in most critically ill patients, it is acceptable to initiate EN in the stomach [12,21]. Protocols that guide management of risk prevention and intolerance typically recommend head of bed elevation, prokinetic agents, and frequent abdominal assessments [63,64].
Once the decision is made to use a post-pyloric feeding tube for nutrition therapy, the next decision is how to safely place the tube, ensure the tip is in an acceptable small bowel location, and minimize delays in feeding. Challenges related to feeding tube insertion may preclude timely advancement to nutrition goals. Placement of feeding tubes into the post-pyloric position is often done at the bedside by trained nursing or medical staff without endoscopic or fluoroscopic guidance; however, the blind bedside approach is not without risks. Success rates of this approach vary greatly depending on the patient population and provider expertise. Placement using endoscopic or fluoroscopic guidance is a safe alternative but usually requires coordinating a transport to the radiologic suite, posing safety risks and possible feeding delays for the patient [65]. Bedside use of an electromagnetic placement device (EMPD), such as Cortrak, provides yet another alternative with reports in the literature of 98% success rates for initial placement in less than 20 minutes. In a multicenter prospective study by Powers et al (2011), only one of 194 patients enrolled had data showing a discrepancy between the original EMPD verification and the final radiograph interpretation, demonstrating a 99.5% agreement between the two readings [20]. Median placement time was 12 minutes and no patient experienced an adverse event related to tube insertion using this device. The ability to monitor the location of the feeding tube tip in real time provides a desirable safety feature for the clinician performing bedside insertions. Nurses should consider incorporating the EMPD into the unit feeding protocol, as this would reduce the time to initiation of feedings with early and accurate tube insertion. Ongoing staff education and experience with the procedure are necessary elements to achieve the high rates of success often reported in the literature [66,67]. Procedural complications from placement of nasoenteral feeding tubes by all methods can be as high as 10%, with complication rates of 1% to 3% for inadvertent placement of the feeding tube in the airway alone [65]. Radiographic confirmation of tube placement is advised prior to initiating feeding, thus eliminating any possibility of misplacement and administration of formula into the lungs.
Gastric Residual Volume Monitoring
A number of factors impede the delivery of EN in the critical care setting; these include gastrointestinal intolerance, under-prescribing to meet daily requirements, frequent interruptions for procedures, and technical issues with tube placement and maintaining patency [68]. Monitoring gastric residual volumes (GRV) contributes to these factors, yet volumes do not correlate well with incidence of pneumonia [69], measures of gastric emptying, or to the incidence of regurgitation and aspiration [70,71]. However, few studies have highlighted the difficulty of obtaining an accurate GRV due to feeding tube tip location, patient position, and type of tube [69]. Several high quality studies have demonstrated that raising the cutoff value for GRV from a lower number of 50–150 mL to a higher number of 250–500 mL does not increase risk for regurgitation, aspiration, or pneumonia [70,71]. A lower cutoff value for GRV does not protect the patient from complications, often leads to inappropriate cessation, and may adversely affect outcome through reduced volume of EN infused [72]. Gastric residual volumes in the range of 200–500 mL should raise concern and lead to the implementation of measures to reduce risk of aspiration, but automatic cessation of feeding should not occur for GRV < 500 mL in the absence of other signs of intolerance [12,69]. Metheny et al (2012) conducted a survey in which more than 97% of nurses responded that they assessed intolerance by measuring GRV; the most frequently cited threshold levels for interrupting feedings were 200 mL and 250 mL [73]. While threshold levels varied widely, only 12.6% of the nurse respondents reported allowing GRV up to 500 mL before interrupting feedings. While monitoring GRV is unnecessary with small bowel feeding, the location of the feeding tube tip should be questioned if gastric contents are obtained from a small bowel tube. The use of GRV as a parameter for trending may also yield important information regarding tolerance of feeding when the patient is unable to communicate abdominal discomfort. Other objective measures to use in the assessment of tolerance include an abdominal exam with documentation of changes in bowel sounds, expanding girth, tenderness or firmness on palpation, increasing nasogastric output, and vomiting [12,68]. If there are indications of intolerance, it is appropriate to divert the tip of the feeding tube into the distal small bowel as discussed previously.
Trophic vs Full Feeding
For the patient with low nutrition risk, there is a lack of convincing data to support an aggressive approach to feeding, either EN or PN, in the first week of critical illness [7]. In recent years, results of several trials suggest early goal-directed feeding in this population may cause net harm with increased morbidity and mortality. When discussing recent controversies in critical care nutrition, one must mention the two schools of thought when it comes to full versus limited energy provision in the first week following ICU admission. Studies in animals and humans have shown a trophic effect of enteral nutrients on the integrity of the gut mucosa, a finding that has provided the rationale for instituting enteral nutrition early during critical illness [15]. However, the inability to provide enteral nutrition early may be a marker of the severity of illness (ie, patients who can be fed enterally are less ill than those who cannot) rather than a mediator of complications and poor outcomes. Compher et al (2017) stated that greater nutritional intake is associated with lower mortality and faster time to discharge alive in high-risk, chronic patients but does not seem to be significant in nutritionally low-risk patients [74]. The findings of the EPaNIC and EDEN trials raised concern that targeting goals that meet full energy needs early in critical illness does not provide benefit and may cause harm in some populations or settings [32,75]. The EDEN trial [32] left us believing that trophic feeding at 10–20 mL/hr may be just as effective as any feeding in the first few days of critical illness striving for 15% to 20% of daily goal calories. After establishing tolerance, advancing daily intake to > 50% to 65% of goal calories, and up to 80% for the highest risk patients, may be required to prevent intestinal permeability and achieve positive clinical outcomes [33].
The systematic review and meta-analysis performed by Al-Dorzi et al (2016) adds further evidence for judicious advancement of EN for critically ill patients [76]. The authors reported finding no association between the dose of caloric intake and hospital mortality. Furthermore, a lower caloric intake resulted in lower risk of bloodstream infections and the need for renal replacement therapy (in 5 of the 21 trials only). As with many other meta-analyses, the authors reported that their results are most assuredly impacted by the heterogeneity in design, feeding route, and dose prescribed and delivered [16,76,77]. Other recent trials such as Arabi et al (2015) that enrolled 894 patients with different feeding targets further confirmed that there is no difference in outcome between groups when it comes to moderate (40% to 60% of goal) vs high (70% to 100% of goal) energy intake, infection rates, or 90-day mortality. The authors summarized their findings saying feeding closer to target is associated with better outcomes compared with severe underfeeding [78]. This adds to the controversy when considering the findings of still other RCTs or meta-analyses that evaluated minimal or trophic feeding versus standard feeding rates [9,46,77]. The meta-analysis performed by Marik and Hooper concluded that there were no differences in the risk of acquired infections, hospital mortality, ICU LOS, or ventilator-free days whether patients received intentional hypocaloric or normocaloric nutrition support [9]. Similarly, there was no significant difference in overall mortality between the underfeeding and full-feeding groups (OR, 0.94; 95% CI, 0.74–1.19; I2 = 26.6%; P = 0.61) in the meta-analysis done by Choi et al (2015), although only 4 trials were included to ensure homogeneity of the population and the intervention [77]. Furthermore, the hospital LOS and ICU LOS did not differ between the 2 groups, nor did any other secondary clinical outcome, leading the authors to conclude that calorie intake of the initial EN support for ICU patients had no bearing on relevant outcomes.
Recent studies have attempted to correlate caloric intake and patient outcomes without success; achieving 100% of caloric goal has not favorably impacted morbidity and mortality. Evidence suggests that intake greater than 65% to 70% of daily caloric requirement in the first 7 to 10 days of ICU stay may be associated with poorer outcomes, particularly when parenteral nutrition is used to supplement intake to achieve the caloric target [33–35].
Conclusion
In this review we described current ICU controversies surrounding nutrition therapy and briefly discussed the data that support more than one course of action. A summary of key points covered is presented in the Table. 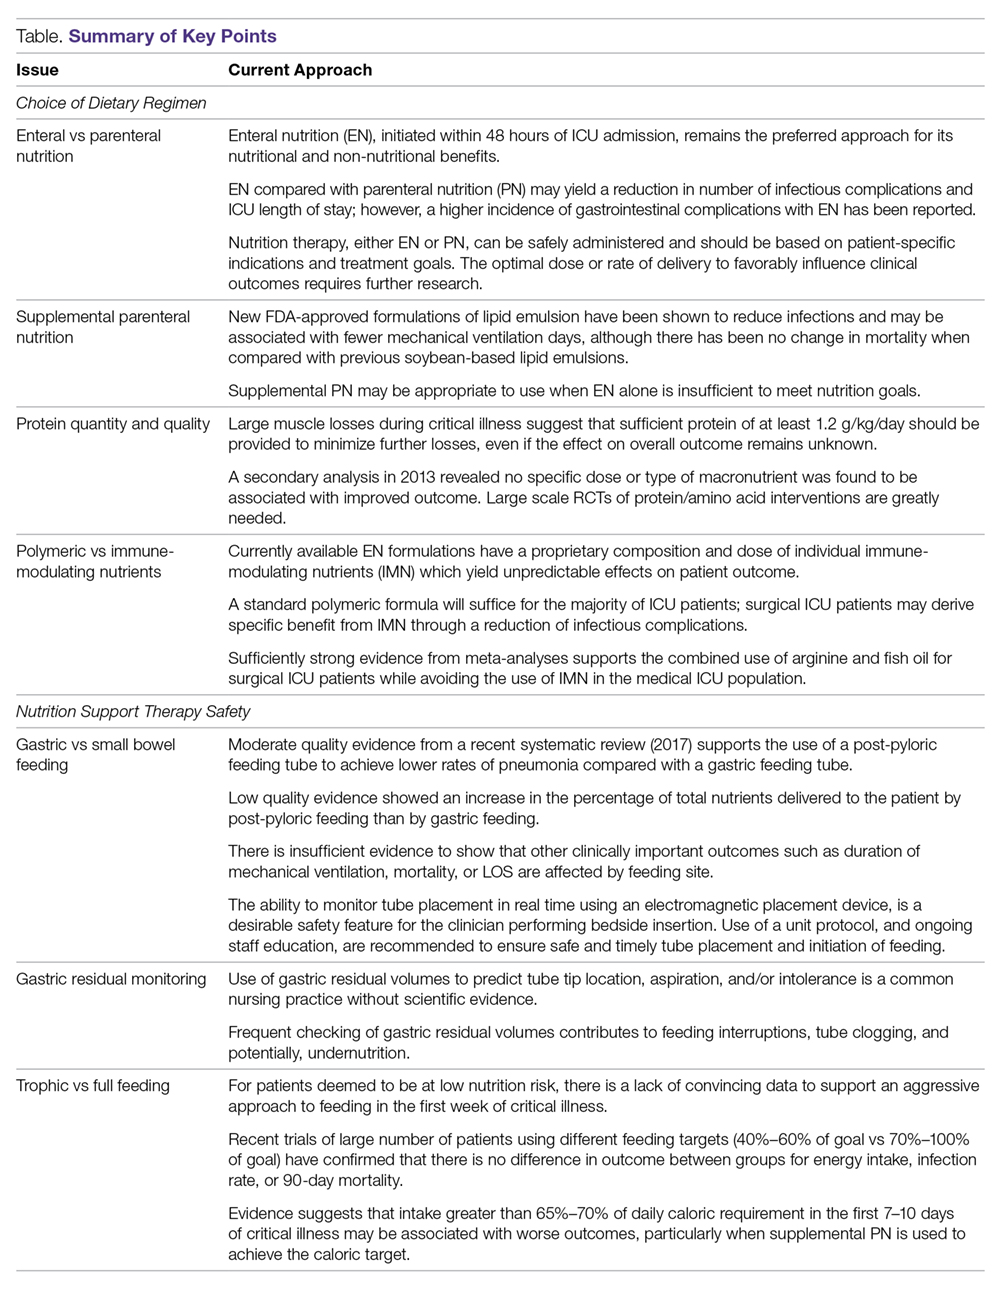
Disclaimer: The views expressed in this paper are those of the authors and do not reflect the official policy of the Department of the Army, the Department of Defense, or the U.S. government.
Corresponding author: Mary S. McCarthy, PhD, RN, CNSC, 1611 Nisqually St, Steilacoom, WA 98388.
Financial disclosures: None.
1. Hippocratic Oath. Translated by Michael North, National Library of Medicine, 2002.
2. Nightingale F. Notes on Nursing. What it is and what it is not. Radford, VA: Wilder Publications, LLC;2007
3. White JV, Guenter P, Jensen G, et al; the Academy Malnutrition Work Group; the ASPEN Malnutrition Task Force; and the ASPEN Board of Directors. Consensus statement: Academy of Nutrition and Dietetics and American Society for Parenteral and Enteral Nutrition: characteristics recommended for the identification and documentation of adult malnutrition (undernutrition). JPEN J Parenter Enteral Nutr 2012;36:275–83.
4. Hooper MH, Marik PE. Controversies and misconceptions in Intensive Care Unit nutrition. Clin Chest Med 2015;36:409–18.
5. Patel JJ, Codner P. Controversies in critical care nutrition support. Crit Care Clin 2016;32:173–89.
6. Rosenthal MD, Vanzant EL, Martindale RG, Moore FA. Evolving paradigms in the nutritional support of critically ill surgical patients. Curr Probl Surg 2015;52:147–82.
7. McCarthy MS, Warren M, Roberts PR. Recent critical care nutrition trials and the revised guidelines: do they reconcile? Nutr Clin Pract 2016;31:150–4.
8. Barker LA, Gray C, Wilson L, et al. Preoperative immunonutrition and its effect on postoperative outcomes in well-nourished and malnourished gastrointestinal surgery patients: a randomised controlled trial. Eur J Clin Nutr 2013;67: 802–807.
9. Marik PE, Hooper MH. Normocaloric versus hypocaloric feeding on the outcomes of ICU patients: a systematic review and meta-analysis. Intensive Care Med 2016;42:316–323.
10. Patkova A, Joskova V, Havel E, et al. Energy, protein, carbohydrate, and lipid intakes and their effects on morbidity and mortality in critically ill adult patients: a systematic review. Adv Nutr 2017;8:624–34.
11. Wong CS, Aly EH. The effects of enteral immunonutrition in upper gastrointestinal surgery: a systematic review and meta-analysis. Int J Surg 2016;29:137–50.
12. McClave SA, Taylor BE, Martindale RG, et al; Society of Critical Care Medicine; American Society for Parenteral and Enteral Nutrition. Guidelines for the provision and assessment of nutrition support therapy in the adult critically ill patient: Society of Critical Care Medicine (SCCM) and American Society of Parenteral and Enteral Nutrition (ASPEN). JPEN J Parenter Enteral Nutr 2016; 40:159–211.
13. Ammori BJ. Importance of the early increase in intestinal permeability in critically ill patients. Eur J Surg 2002;168:660–1.
14. Vazquez-Sandoval A, Ghamande S, Surani S. Critically ill patients and gut motility: are we addressing it? World J Gastrointest Pharmacol Ther 2017;8:174–9.
15. Patel JJ, Martindale RG, McClave SA. Controversies surrounding critical care nutrition: an appraisal of permissive underfeeding, protein, and outcomes. JPEN J Parenter Enteral Nutr 2017; 148607117721908.
16. Hegazi RA, Hustead DS, Evans DC. Preoperative standard oral nutrition supplements vs immunonutrition: results of a systematic review and meta-analysis. J Am Coll Surg 2014;219:1078–87.
17. Alkhawaja S, Martin C, Butler RJ, Gwadry-Sridhar F. Post-pyloric versus gastric tube feeding for preventing pneumonia and improving nutritional outcomes in critically ill adults. Cochrane Database of Syst Rev 2015; CD008875.
18. Davies AR, Morrison SS, Bailey MJ, et al ; ENTERIC Study Investigators; ANZICS Clinical Trials Group. A multi-center randomized controlled trial comparing early nasojejunal with nasogastric nutrition in critical illness. Crit Care Med 2012;40:2342–8.
19. Hsu CW, Sun SF, Lin SL, et al. Duodenal versus gastric feeding in medical intensive care unit patients: a prospective, randomized, clinical study. Crit Care Med 2009;37:1866–72.
20. Powers J, Luebbehusen M, Spitzer T, et al. Verification of an electromagnetic placement device compared with abdominal radiograph to predict accuracy of feeding tube placement. JPEN J Parenter Enteral Nutr 2011;35:535–9.
21. Dhaliwal R, Cahill N, Lemieux M, Heyland DK. The Canadian critical care nutrition guidelines in 2013: an update on current recommendations and implementation strategies. Nutr Clin Pract 2014; 29:29–43.22. Kreymann K, Berger M, Deutz N. et al; DGEM (German Society for Nutritional Medicine); ESPEN (European Society for Parenteral and Enteral Nutrition). ESPEN guidelines on enteral nutrition: intensive care. Clin Nutr 2006;25:210–23.
23. McClave SA, Martindale RG, Vanek VW, et al. Guidelines for the provision and assessment of nutrition support therapy in the adult critically ill patient: Society of Critical Care Medicine (SCCM) and American Society for Parenteral and Enteral Nutrition (ASPEN). JPEN J Parenter Ent Nutr 2009;33:277–316.
24. McClave SA, Martindale RG, Rice TW, Heyland DK. Feeding the critically ill patient. Crit Care Med 2014;42:2600–10.
25. Tian F, Gao X, Wu C, et al. Initial energy supplementation in critically ill patients receiving enteral nutrition: a systematic review and meta-analysis of randomized controlled trials. Asia Pac J Clin Nutr 2017;26:11–9.
26. Martindale RG, Warren M. Should enteral nutrition be started in the first week of critical illness? Curr Opin Clin Nutr Metab Care 2015;18:202–6.
27. McClave SA, Heyland DK. The physiologic response and associated clinical benefits from provision of early enteral nutrition. Nutr Clin Pract 2009;24:305–15.
28. Kang W, Kudsk KA. Is there evidence that the gut contributes to mucosal immunity in humans? JPEN J Parenter Enteral Nutr 2007;31:461–82.
29. Seron-Arbeloa C, Zamora-Elson M, Labarta-Monzon L, Mallor-Bonet T. Enteral nutrition in critical care. J Clin Med Res 2013;5:1-11.
30. Harvey SE, Parrott F, Harrison DA, et al; CALORIES Trial Investigators. Trial of the route of early nutritional support in critically ill adults. N Engl J Med 2014;371:1673–84.
31. Elke G, van Zanten AR, Lemieux M, et al. Enteral versus parenteral nutrition in critically ill patients: an updated systematic review and meta-analysis of randomized controlled trials. Crit Care 2016;20:117.
32. Reignier J, Boisramé-Helms J, Brisard L, et al. Enteral versus parenteral nutrition in ventilated adults with shock: a randomized, controlled, multicenter, open-label, parallel-group study (NUTRIREA-2). Lancet 2018;391:133–43.
33. Rice TW , Wheeler AP, Thompson BT et al;National Heart, Lung, and Blood Institute, Acute Respiratory Distress Syndrome (ARDS) Clinical Trials Network. Initial trophic vs full enteral feeding in patients with acute lung injury: the EDEN randomized trial. JAMA 2012;307:795–803.
34. Heyland DK, Dhaliwal R, Jiang X, Day AG. Identifying critically ill patients who benefit the most from nutrition therapy: the development and initial validation of a novel risk assessment tool. Crit Care 2011;15:R258.
35. Bost RB, Tjan DH, van Zanten AR. Timing of (supplemental) parenteral nutrition in critically ill patients: a systematic review. Ann Intensive Care 2014;4:31.
36. Casaer MP, Mesotten D, Hermans G, et al. Early verus late parenteral nutrition in critically ill adults. N Eng J Med 2011;365:506–17.
37. Harvey SE, Parrott F, Harrison DA, et al; CALORIES Trial Investigators. Trial of the route of early nutritional support in critically ill adults. N Eng J Med 2014;371:1673–84.
38. Manzanares W, Dhaliwal R, Jurewitsch B, et al. Parenteral fish oil lipid emulsions in the critically ill: A systematic review and meta-analysis. JPEN J Parenter Enteral Nutr 2014;38:20–8.
39. Oshima T, Heidegger CP, Pichard C. Supplemental parenteral nutrition is the key to prevent energy deficits in critically ill patients. Nutr Clin Prac 2016;31:432–7.
40. Manzanares W, Langlois PL, Dhaliwal R, Lemieux M, Heyland DK. Intravenous fish oil lipid emulsions in critically ill patients: an updated systematic review and meta-analysis. Crit Care 2015;19:167.
41. Rooyackers O, Sundström Rehal M, Liebau F, et al. High protein intake without concerns? Crit Care 2017;21:106.
42. Puthucheary ZA, Rawal J, McPhail M, et al. Acute skeletal muscle wasting in critical illness. JAMA 2013;310:1591–600.
43. Heyland D, Muscedere J, Wischmeyer PE, et al; Canadian Critical Care Trials Group. A randomized trial of glutamine and antioxidants in critically ill patients. N Engl J Med 2013;368:1489–97.
44. Marik PE, Zaloga GP. Immunonutrition in critically ill patients: a systematic review and analysis of the literature. Intensive Care Med 2008;34:1980–90.
45. Gadek JE, DeMichele SJ, Karlstad MD, et al; Enteral Nutrition in ARDS Study Group. Effect of enteral feeding with eicosapentaenoic acid, gamma-linolenic acid, and antioxidants in patients with acute respiratory distress syndrome. Crit Care Med 1999;27:1409–20.
46. Rice TW, Wheeler AP, Thompson BT, et al; NIH NHLBI Acute Respiratory Distress Syndrome Network of Investigators. Enteral omega-3 fatty acid, gamma-linolenic acid, and antioxidant supplementation in acute lung injury. JAMA 2011;306:1574–81.
47. Singer P, Theilla M, Fisher H, et al. Benefit of an enteral diet enriched with eicosapentaenoic acid and gamma-linolenic acid in ventilated patients with acute lung injury. Crit Care Med 2006;34:1033–38.
48. Atkinson S, Sieffert E, Bihari D. A prospective, randomized, double-blind, controlled clinical trial of enteral immunonutrition in the critically ill. Guy’s Hospital Intensive Care Group. Crit Care Med 1998;26:1164–72.
49. Galbán C, Montejo JC, Mesejo A, et al. An immune-enhancing enteral diet reduces mortality rate and episodes of bacteremia in septic intensive care unit patients. Crit Care Med 2000;28:643–8.
50. Weimann A, Bastian L, Bischoff WE, et al. Influence of arginine, omega-3 fatty acids and nucleotide-supplemented enteral support on systemic inflammatory response syndrome and multiple organ failure in patients after severe trauma. Nutrition 1998;14:165–72.
51. van Bokhorst-De Van Der Schueren MA, Quak JJ, von Blomberg-van der Flier BM, et al. Effect of perioperative nutrition with and without arginine supplementation, on nutritional status, immune function, postoperative morbidity, and survival in severely malnourished head and neck cancer patients. Am J Clin Nutr 2001;73:323–32.
52. Cerantola Y, Hübner M, Grass F, et al. Immunonutrition in gastrointestinal surgery. Br J Surg 2011;98:37–48.
53. Marik PE, Zaloga GP. Immunonutrition in high-risk surgical patients: a systematic review and analysis of the literature. JPEN J Parenter Enteral Nutr 2010;34:378–86.
54. Sultan J, Griffin SM, Di Franco F, et al. Randomized clinical trial of omega-3 fatty acid–supplemented enteral nutrition vs. standard enteral nutrition in patients undergoing oesophagogastric cancer surgery. Br J Surg 2012;99:346–55.
55. Waitzberg DL, Saito H, Plank LD, et al. Postsurgical infections are reduced with specialized nutrition support. World J Surg 2006;30:1592–604.
56. Pearce CB, Sadek SA, Walters AM, et al. A double-blind, randomised, controlled trial to study the effects of an enteral feed supplemented with glutamine, arginine, and omega-3 fatty acid in predicted acute severe pancreatitis. JOP 2006;7:361–71.
57. Mazaki T, Ishii Y, Murai I. Immunoenhancing enteral and parenteral nutrition for gastrointestinal surgery: a multiple treatments meta-analysis. Ann Surg 2015;261:662–9.
58. van Zanten ARH, Sztark F, Kaisers UX, et al. High-protein enteral nutrition enriched with immune-modulating nutrients vs standard high protein enteral nutrition and nosocomial infections in the ICU. JAMA 2014;312:514–24.
59. Drover JW, Dhaliwal R, Weitzel L, et al. Perioperative use of arginine supplemented diets: a systematic review of the evidence. J Am Coll Surg 2011;212:385–99.
60. Stupak D, Abdelsayed GG, Soloway GN. Motility disorders of the upper gastrointestinal tract in the intensive care unit: pathophysiology and contemporary management. J Clin Gastroenterol 2012;46:449–56.
61. Huang HH, Chang SJ, Hsu CW, et al. Severity of illness influences the efficacy of enteral feeding route on clinical outcomes in patients with critical illness. J Acad Nutr Diet 2012;112:1138–46.
62. American Thoracic Society. Guidelines for the management of adults with hospital-acquired, ventilator-associated, and healthcare-associated pneumonia. Am J Respir Crit Care Med 2005;171:388–416.
63. Heyland DK, Cahill NE, Dhaliwal R, et al. Impact of enteral feeding protocols on enteral nutrition delivery: results of a multicenter observational study. JPEN J Parenter Enteral Nutr 2010;34:675–84.
64. Landzinski J, Kiser TH, Fish DN, et al. Gastric motility function in critically ill patients tolerant vs intolerant to gastric nutrition. JPEN J Parenter Enteral Nutr 2008;32:45–50.
65. de Aguilar-Nascimento JE, Kudsk KA. Use of small bore feeding tubes: successes and failures. Curr Opin Clin Nutr Metab Care 2007;10:291–6.
66. Boyer N, McCarthy MS, Mount CA. Analysis of an electromagnetic tube placement device vs a self-advancing nasal jejunal device for postpyloric feeding tube placement . J Hosp Med 2014;9:23–8.
67. Metheny NA, Meert KL. Effectiveness of an electromagnetic feeding tube placement device in detecting inadvertent respiratory placement. Am J Crit Care 2014;23:240–8.
68. Montejo JC, Miñambres E, Bordejé L, et al. Gastric residual volume during enteral nutrition in ICU patients: the REGANE study. Intensive Care Med 2010;36:1386–93.
69. Hurt RT, McClave SA. Gastric residual volumes in critical illness: what do they really mean? Crit Care Clin 2010;26:481–90.
70. Poulard F, Dimet J, Martin-Lefevre L, et al. Impact of not measuring residual gastric volume in mechanically ventilated patients receiving early enteral feeding: a prospective before-after study. JPEN J Parenter Enteral Nutr 2010;34:125–30.
71. Reignier J, Mercier E, Gouge AL, et al; Clinical Research in Intensive Care and Sepsis (CRICS) Group. Effect of not monitoring residual gastric volume on risk of ventilator-associated pneumonia in adults receiving mechanical ventilation and early enteral feeding: a randomized controlled trial. JAMA 2013;309:249–56.
72. Williams TA, Leslie GD, Leen T, et al. Reducing interruptions to continuous enteral nutrition in the intensive care unit: a comparative study. J Clin Nurs 2013;22:2838-2848.
73. Metheny NA, Stewart BJ, Mills AC. Blind insertion of feeding tubes in intensive care units: a national survey. Am J Crit Care 2012;21:352–360.
74. Compher C, Chittams J, Sammarco T, et al. Greater protein and energy intake may be associated with improved mortality in higher risk critically ill patients: A multicenter, multinational observational study. Crit Care Med 2017;45:156–163.
75. Casaer MP, Wilmer A, Hermans G, et al. Role of disease and macronutrient dose in the randomized controlled EPANIC Trial: a post hoc analysis. Am J Resp Crit Care Med 2013;187:247–55.
76. Al-Dorzi HM, Albarrak A, Ferwana M, et al. Lower versus higher dose of enteral caloric intake in adult critically ill patients: a systematic review and meta-analysis. Crit Care 2016;20:358.
77. Choi EY, Park DA, Park J. Calorie intake of enteral nutrition and clinical outcomes in acutely critically ill patients: a meta-analysis of randomized controlled trials. JPEN J Parenter Enteral Nutr 2015;39:291–300.
78. Arabi YM, Aldawood AS, Haddad SH, et al. Permissive underfeeding or standard enteral feeding in critically ill adults. N Engl J Med 2015;372:2398–408.
From the Center for Nursing Science & Clinical Inquiry (Dr. McCarthy), and Nutrition Care Division, (Ms. Phipps), Madigan Army Medical Center, Tacoma, WA.
Abstract
- Background: Many controversies exist in the field of nutrition support today, particularly in the critical care environment where nutrition plays a more primary rather than adjunctive role.
- Objective: To provide a brief review of current controversies regarding nutrition therapy in the ICU focusing on the choices regarding the nutrition regimen and the safe, consistent delivery of nutrition as measured by clinical outcomes.
- Methods: Selected areas of controversy are discussed detailing the strengths and weaknesses of the research behind opposing opinions.
- Results: ICU nutrition support controversies include enteral vs parenteral nutrition, use of supplmental parenteral nutrition, protein quantity and quality, and polymeric vs immune-modulating nutrients. Issues surrounding the safety of nutrition support therapy include gastric vs small bowel feeding and trophic vs full feeding. Evidence-based recommendations published by professional societies are presented.
- Conclusion: Understanding a patient’s risk for disease and predicting their response to treatment will assist clinicians with selecting those nutrition interventions that will achieve the best possible outcomes.
According to the National Library of Medicine’s translation of the Hippocratic oath, nowhere does it explicitly say “First, do no harm.” What is written is this: “I will use those dietary regimens which will benefit my patients according to my greatest ability and judgement, and I will do no harm or injustice to them” [1]. In another renowned text, one can find this observation regarding diet by a noted scholar, clinician, and the founder of modern nursing, Florence Nightingale: “Every careful observer of the sick will agree in this that thousands of patients are annually starved in the midst of plenty, from want of attention to the ways which alone make it possible for them to take food” [2,]. While Nightingale was alluding to malnutrition of hospitalized patients, it seems that her real concern may have been the iatrogenic malnutrition that inevitably accompanies hospitalization, even today [3].
From these philosophic texts, we have two ongoing controversies in modern day nutrition therapy identified: (1) what evidence do we have to support the choice of dietary regimens (ie, enteral vs parenteral therapy, timing of supplemental parenteral nutrition, standard vs high protein formula, polymeric vs immune-modulating nutrients) that best serve critically ill patients, and (2) how do we ensure that ICU patients are fed in a safe, consistent, and effective manner (gastric vs small bowel tube placement, gastric residual monitoring or not, trophic vs full feeding) as measured by clinically relevant outcomes? Many controversies exist in the field of nutrition support today [4–7] and a comprehensive discussion of all of them is beyond the scope of this paper. In this paper we will provide a brief review of current controversies focusing on those mentioned above which have only recently been challenged by new rigorous randomized clinical trials (RCTs), and in some cases, subsequent systematic reviews and meta-analyses [8–11].
The Path to Modern Day Nutrition Support Therapy
The field of nutrition support, in general, has expanded greatly over the last 4 decades, but perhaps the most notable advancements have occurred in the critical care environment where efforts have been directed at advancing our understanding of the molecular and biological effects of nutrients in maintaining homeostasis in the critically ill [6]. In recent years, specialized nutrition, delivered by the enteral or parenteral route, was finally recognized for its contribution to important clinical outcomes in the critically ill population [12]. Critical care clinicians have been educated about the advances in nutrition therapy designed to address the unique needs of a vulnerable population where survival is threatened by poor nutritional status upon admission, compromised immune function, weakened respiratory muscles with decreased ventilation capacity, and gastrointestinal (GI) dysfunction [6]. The rapid deterioration seen in these patients is exaggerated by the all too common ICU conditions of systemic inflammatory response syndrome (SIRS), sepsis, hemodynamic instability, respiratory failure, coagulation disorders, and acute kidney injury [13,14].
Beginning in the early 1990s, formulations of enteral nutrition (EN) contained active nutrients that reportedly reduced oxidative damage to cells and tissues, modulated inflammation, and improved feeding tolerance. These benefits are now referred to as the non-nutritive benefits of enteral feeding [15]. For the next 20 years, scientific publications released new results from studies examining the role of omega-3 fatty acids, antioxidant vitamins, minerals such as selenium and zinc, ribonucleotides, and conditionally essential amino acids like glutamine and arginine, in healing and recovery from critical illness. The excitement was summarized succinctly by Hegazi and Wischmeyer in 2011 when they remarked that the modern ICU clinician now has scientific data to guide specialized nutrition therapy, for example, choosing formulas supplemented with anti-inflammatory, immune-modulating, or tolerance-promoting nutrients that have the potential to enhance natural recovery processes and prevent complications [16].
The improvements in nutritional formulas were accompanied by numerous technological advances including bedside devices (electromagnetic enteral access system, real-time image-guided disposable feeding tube, smart feeding pumps with water flush technology) that quickly and safely establish access for small bowel feedings, which help minimize risk of gastric aspiration and ventilator-associated pneumonia, promote tolerance, decrease radiologic exposure, and may reduce nursing time consumed by tube placements, GI dysfunction, and patient discomfort [17–20]. Nasogastric feeding remains the most common first approach, with local practices, contraindications, and ease of placement usually determining the location of the feeding tube [5]. The advancements helped to overcome the many barriers to initiating and maintaining feedings and thus, efforts to feed critically ill patients early and effectively became more routine, along with nurse, patient, and family satisfaction. In conjunction with the innovative approaches to establishing nutrition therapy, practice guidelines published by United States, European, and Canadian nutrition societies became widely available in the past decade with graded evidence-based recommendations for who, when, what, and how to feed, and unique considerations for various critically ill populations [12,21,22]. The tireless efforts by the nutrition societies to provide much needed guidelines for clinicians were appreciated, yet there was a wide range in the grade of the recommendations, with many based on expert opinion alone. In some cases, the research conducted lacked rigor or had missing data with obvious limits to the generalizability of results. Nevertheless, for the 7 years between the publication of the old and newly revised Society of Critical Care Medicine (SCCM)/ American Society of Parenteral and Enteral Nutrition (ASPEN) Guidelines (2016), [12,23] nutrition therapy was a high-priority intervention in most ICUs. The goal was to initiate feeding within 48 hours, select an immune-modulating or other metabolic support formula, and aggressively advance the rate to 80% to 100% of goal to avoid caloric deficit, impaired intestinal integrity, nitrogen losses, and functional impairments [9,24,25]. Nutrition support evolved from adjunctive care to its rightful place in the ABCD mnemonic of early priorities of ICU care: Airway, Breathing, Circulation, Diet.
The 2016 joint publication of the SCCM/ASPEN guidelines includes primarily randomized controlled trial (RCT) data, along with some observational trial data, indexed in any major publication database through December 2013. In these guidelines there were 98 recommendations, of which only 5 were a Level 1A; most of the recommendations were categorized as “expert consensus” [12]. The results of several important clinical trials in the United States and Europe that were underway at the time have since been published and compared to the SCCM/ASPEN relevant recommendations [7]. The results have forced nutrition support clinicians to take a step back and re-examine their practice. For many seasoned clinicians who comprised the nutrition support teams of the 1980s and 1990s, it feels like a return to the basics. Until biology-driven personalized medicine is commonplace and genotype data is readily available to guide nutrition therapy for each critically ill patient, standard enteral feeding that begins slow and proceeds carefully over 5 to 7 days towards 80% of goal caloric intake under judicious monitoring of biochemical and metabolic indices may be the “best practice” today, without risk of harm [15,26]. As in all aspects of clinical care, this practice is not without controversy.
ICU Nutrition Support Controversies Today
Enteral vs Parenteral Nutrition
There is universal consensus that EN is the preferred route for nutrition therapy due to the superior physiological response and both nutritional and non-nutritional benefits [24]. Changes in gut permeability tend to occur as illness progresses and consequences include increased bacterial challenge, risk for multiple organ dysfunction syndrome, and systemic infection. It is best to intervene with nutrition early, defined as within the first 48 hours of ICU admission, while the likelihood of success and opportunity to impact the disease process is greater [12]. Early initiation of feeding provides the necessary nutrients to support gut-associated lymphoid tissue (GALT), mucosal-associated lymphoid tissue (MALT), and preserve gut integrity and microbial diversity [27]. The intestine is an effective barrier against bacteria and intraluminal toxins due to the high rate of enterocyte turnover, the mucus secreted by the goblet cells, and the large amount of protective immunological tissue; 80% of the immunoglobulins are synthesized in the GI tract [28]. Fasting states for procedures or delays in feeding longer than 3 days for any reason may contribute to disruption of intestinal integrity through atrophy and derangements in the physical structure and function of the microvilli and crypts [29]. Intestinal dysfunction leads to increased intestinal permeability and the possibility of bacterial translocation. Intestinal ischemia resulting from shock and sepsis may produce hypoxia and reperfusion injuries further affecting intestinal wall permeability [29]. In surgical patients, early enteral feeding has been found to reduce inflammation, oxidative stress, and the catabolic response to anesthesia and surgical-induced stress, help restore intestinal motility, reverse enteric mucosal atrophy, and improve wound healing [26].
We did not have sufficient data to refute the benefits of EN over PN until the paper by Harvey et al (2014), which reported no difference in mortality or infectious complications in ICU patients receiving EN or PN within 36 hours of admission and for up to 5 days [30]. This was the largest published pragmatic RCT, referred to as the CALORIES trial, which analyzed 2388 patients from 33 ICUs and resulted in controversy over what was an unchallenged approach up until this time. It was only a matter of time before other investigators would set out to confirm or negate this finding, which is what Elke and coworkers (2016) did a few years later [31]. They performed an updated systematic review and meta-analysis to evaluate the overall effect of the route of nutrition (EN versus PN) on clinical outcomes in adult critically ill patients. Similar to the Harvey et al report, they found no difference in mortality between the two routes of nutrition. However, unlike the earlier report, patients receiving EN compared to PN had a significant reduction in the number of infectious complications and ICU length of stay. No significant effect was found for hospital length of stay or days requiring mechanical ventilation. The authors suggest that EN delivery of macronutrients below predefined targets may be responsible as PN is more likely to meet or exceed these targets and overwhelm metabolic capacity in the early days of critical illness [31].
The most recent trial prompting even more discussion about early PN versus early EN in mechanically ventilated ICU patients in shock is the Reignier et al (2018) NUTRIREA-2 trial involving 2410 patients from 44 ICUs in France [32]. The investigators hypothesized that outcomes would be better with early exclusive EN compared to early exclusive PN; their hypothesis was not supported by the results, which found no difference in 28-day mortality or ICU-acquired infections. Also unexpected was the higher cumulative incidence of gastrointestinal complications including vomiting, diarrhea, bowel ischemia, and acute colonic obstruction in the EN group. The trial was stopped early after an interim analysis determined that additional enrollment was not likely to significantly change the results of the trial. Given the similarities between the CALORIES trial and this NUTRIREA-2 trial, clinicians now have mounting evidence that equivalent options for nutrition therapy exist and an appropriate selection should be made based on patient-specific indications and treatment goals. In summary, EN remains preferable to PN for the majority of adult critically ill patients due to crucial support of gut integrity, but the optimal dose or rate of delivery to favorably influence clinical outcomes in the first few days following admission remains unknown.
Use of Supplemental Parenteral Nutrition
Both the nutrition support and bench science communities have learned a great deal about PN over the 4 decades it has been in existence, with the most compelling data coming from more recent trials [31–38]. This is because it has taken many years to recover from the days of hyperalimentation or overfeeding ICU patients by providing excessive calories to meet the elevated energy demands and to reverse the hypercatabolism of critical illness. This approach contributed to the complications of hyperglycemia, hyperlipidemia, increased infectious complications, and liver steatosis, all of which gave PN a negative reputation [37]. We now have adjusted the caloric distribution and the actual formulation of PN using the recent FDA-approved lipid emulsion (Soy, Medium-chain triglycerides, Olive oil, and Fish oil; SMOF) and created protocols for administering it based on specific indications, such as loss of GI integrity or demonstrated intolerance. In general, the advances in PN have led to a safer more therapeutic formulation that has its place in critical illness. Manzanares et al [40] reported a trend toward a decrease in ventilation requirement and mortality when a fish oil–containing lipid emulsion was administered to patients who were receiving nutrition support either enterally or parenterally. The meta-analysis combined all soybean oil–sparing lipid emulsions for comparison with soybean oil and was able to show the trend for improved clinical outcomes with soybean oil–sparing lipid emulsions. The main findings of this meta-analysis were that fish oil–containing lipid emulsions may reduce infections and may be associated with a tendency toward fewer mechanical ventilation days, although not mortality, when compared with soybean oil-based strategies or administration of other alternative lipid emulsions in ICU patients [40]. Recent trial results do not change the recommendation for selecting EN first but do suggest lowering the threshold for using PN when EN alone is insufficient to meet nutrition goals. A systematic review reported no benefit of early supplemental PN over late supplemental PN and cautioned that our continued inability to explain greater infectious morbidity and unresolved organ failure limits any justification for early PN [35].
Protein Quantity and Quality
The practice of providing protein in the range of 1.2–2.0 g/kg actual body weight early in critical illness is suggested by expert consensus in the 2016 SCCM/ASPEN guidelines [12]; however, the evidence for efficacy remains controversial. It is argued that the evidence for benefit comes from observational studies, not from prospective RCTs, and that the patients at high risk are often excluded from study protocols. It has also been suggested that in patients with limited vital organ function increased protein delivery may lead to organ compromise. In a recent (2017) paper, Rooyackers et al discussed the post-hoc analyses of data from the EPANIC Trial stating the statistical correlation between protein intake and outcomes indicate that protein was associated with unfavorable outcomes, possibly by inhibiting autophagy [41].
The nutrition support community may have widely varying approaches to feeding critically ill patients but most experts agree that protein may be the most important macronutrient delivered during critical illness. There is consensus that the hypercatabolism associated with stress induces proteolysis and the loss of lean muscle mass, which may affect clinical and functional outcomes beyond the ICU stay. Using multiple assessment modalities, Puthucheary et al (2013) demonstrated a reduction in the rectus femoris muscle of 12.5% over the first week of hospitalization in the ICU and up to 17.7% by day 10. These numbers imply that sufficient protein of at least 1.2 g/kg/day should be provided to minimize these losses, even if the effect on overall outcome remains unknown [42]. Evidence is lacking for whether or not we can prevent the muscle wasting that occurs in critical illness with increased protein dosing. We also need to better identify the possible risks involved with a high-protein intake at the level of the individual patient. A secondary analysis done by Heyland et al (2013) determined that no specific dose or type of macronutrient was found to be associated with improved outcome [43]. It is clear that more large-scale RCTs of protein/amino acid interventions are needed to prove that these nutrition interventions have favorable effects on clinically important outcomes, including long-term physical function.
Polymeric vs Immune-Modulating Nutrients
The Marik and Zaloga (2008) systematic review on immunonutrition in the critically ill convinced most clinicians that while fish-oil based immunonutrition improves the outcome of medical ICU patients, diets supplemented with arginine, with or without glutamine or fish oils, do not demonstrate an advantage over standard enteral products in general ICU, trauma, or burn patients[44]. What followed these trials examining early formulations of immunonutrition was decades of well-intentioned research dedicated to elucidating the mechanism of action for individual immune-modulating nutrients for various populations, including those with acute lung injury/acute respiratory distress syndrome (ARDS) [45–47], sepsis/systemic inflammatory response syndrome [48–50], head and neck cancer [51], upper and lower GI cancer [52–55], and severe acute pancreatitis [56]. Our understanding of immunonutrition and the administration of this formulation in specific disease conditions has grown considerably yet clinicians are still asking exactly what is the role of immunonutrition and who stands to benefit the most from immune-modulating nutrition therapy. The enteral formulations currently available have a proprietary composition and dosage of individual nutrients which yield unpredictable physiologic effects. In addition, the pervasive problem of underfeeding during hospitalization prevents adequate delivery of physiologic doses of nutrients thus contributing to the widely variable research results.
Prevailing expert opinion today is that the majority of critically ill patients will benefit from nutrition support initiated early and delivered consistently; the standard polymeric formula will suffice for the majority of patients with surgical ICU patients potentially deriving benefit from immunonutrition that supports a reduction in infectious complications [57]. In the recent multiple-treatment meta-analysis performed by Mazaki et al (2015) involving 74 studies and 7572 patients, immunonutrition was ranked first for reducing the incidence of 7 complications according to the surface under the cumulative ranking curve; these were as follows: any infection, 0.86; overall complication, 0.88; mortality, 0.81; wound infection, 0.79; intra-abdominal abscess, 0.98; anastomotic leak, 0.79; and sepsis, 0.92. immunonutrition was ranked second for reducing ventilator-associated pneumonia and catheter-associated urinary tract infection (CAUTI), behind immune-modulating PN. The authors stated that immunonutrition was efficacious for reducing the incidence of complications in GI surgery unrelated to the timing of administration [57]. The 2014 publication of results from the MetaPlus Trial [58]challenged the published recommendations for the use of immunonutrition in the medical critically ill population. This trial used high-protein immunonutrition or standard formula for 301 adult critically ill patients in 14 European ICUs with diagnoses such as pneumonia or infections of the urinary tract, bloodstream, central nervous system, eye, ear, nose or throat, and the skin and soft tissue. Even with higher than average target energy intakes of 70% for the high protein immunonutrition group and 80% for the high protein standard group, there were no statistically significant differences in the primary outcome of new infections, or the secondary outcomes of days on mechanical ventilation, Sequential Organ Failure Assessment scores, or ICU and hospital length of stay. However, the 6-month mortality rate of 28% was higher in the medical subgroup [58]. Using these results, as well as existing publications of negative outcomes in medical ICU patients [44,46], the SCCM/ASPEN Guidelines Committee updated its position in 2016 to suggest that immunonutrition formulations or disease-specific formulations should no longer be used routinely in medical ICU patients, including those with acute lung injury/ARDS [12]. The Committee did suggest that these formulations should be reserved for patients with traumatic brain injury and for surgical ICU patients. The benefit for ICU postoperative patients has been linked to the synergistic effect of fish oil and arginine, which must both be present to achieve outcome benefits. A meta-analysis comprised of 35 trials was conducted by Drover et al [58], who reported that administering an arginine and fish oil-containing formula postoperatively reduced infection (RR 0.78; 95% CI, 0.64 to 0.95; P = 0.01) and hospital length of stay (WMD –2.23, 95% CI, –3.80 to –0.65; P = 0.006) but not mortality, when compared to use of a standard formula. Similar results were reported in a second meta-analysis [56], thus providing supportive evidence for the current SCCM/ASPEN recommendation to use an immune-modulating formula (containing both arginine and fish oils) in the SICU for the postoperative patient who requires EN therapy [12].
Safe, Consistent, and Effective Nutrition Support Therapy
Gastric vs Small Bowel Feeding
There is a large group of critically ill patients in whom impaired gastric emptying presents challenges to feeding; 50% of mechanically ventilated patients demonstrate delayed gastric emptying, and 80% of patients with increased intracranial pressure following head injury [60]. In one prospective RCT, Huang et al (2012) showed that severely ill patients (defined by an APACHE II score > 20) fed by the nasoduodenal route experienced significantly shortened hospital LOS, fewer complications, and improved nutrient delivery compared to similar patients fed by the nasogastric route. Less severely ill patients (APACHE II < 20) showed no differences between nasogastric and nasoduodenal feeding for the same outcomes [61]. A recent systematic review [17] pooled data from 14 trials of 1109 participants who received either gastric or small bowel feeding. Moderate quality evidence suggested that post-pyloric feeding was associated with lower rates of pneumonia compared with gastric feeding (RR 0.65, 95% CI, 0.51 to 0.84). Low-quality evidence showed an increase in the percentage of total nutrient delivered to the patient by post-pyloric feeding (mean difference 7.8%, 95% CI, 1.43 to 14.18). Overall, the authors found a 30% lower rate of pneumonia associated with post-pyloric feeding. There is insufficient evidence to show that other clinically important outcomes such as duration of mechanical ventilation, mortality, or LOS were affected by the site of feeding. The American Thoracic Society and ASPEN, as well as the Infectious Diseases Society of America, have published guidelines in support of small bowel feeding in the ICU setting due to its association with reduced incidence of health care–associated infections, specifically ventilator-associated pneumonia [62]. The experts who developed the SCCM/ASPEN and Canadian guidelines stress that critically ill patients at high risk for aspiration or feeding intolerance should be fed using small bowel access [12,21]. The reality in ICU clinical practice is that many centers will begin with gastric feeding, barring absolute contraindications, and carefully monitor the patient for signs of intolerance before moving the feeding tube tip into a post-pyloric location. This follows the general recommendation by experts saying in most critically ill patients, it is acceptable to initiate EN in the stomach [12,21]. Protocols that guide management of risk prevention and intolerance typically recommend head of bed elevation, prokinetic agents, and frequent abdominal assessments [63,64].
Once the decision is made to use a post-pyloric feeding tube for nutrition therapy, the next decision is how to safely place the tube, ensure the tip is in an acceptable small bowel location, and minimize delays in feeding. Challenges related to feeding tube insertion may preclude timely advancement to nutrition goals. Placement of feeding tubes into the post-pyloric position is often done at the bedside by trained nursing or medical staff without endoscopic or fluoroscopic guidance; however, the blind bedside approach is not without risks. Success rates of this approach vary greatly depending on the patient population and provider expertise. Placement using endoscopic or fluoroscopic guidance is a safe alternative but usually requires coordinating a transport to the radiologic suite, posing safety risks and possible feeding delays for the patient [65]. Bedside use of an electromagnetic placement device (EMPD), such as Cortrak, provides yet another alternative with reports in the literature of 98% success rates for initial placement in less than 20 minutes. In a multicenter prospective study by Powers et al (2011), only one of 194 patients enrolled had data showing a discrepancy between the original EMPD verification and the final radiograph interpretation, demonstrating a 99.5% agreement between the two readings [20]. Median placement time was 12 minutes and no patient experienced an adverse event related to tube insertion using this device. The ability to monitor the location of the feeding tube tip in real time provides a desirable safety feature for the clinician performing bedside insertions. Nurses should consider incorporating the EMPD into the unit feeding protocol, as this would reduce the time to initiation of feedings with early and accurate tube insertion. Ongoing staff education and experience with the procedure are necessary elements to achieve the high rates of success often reported in the literature [66,67]. Procedural complications from placement of nasoenteral feeding tubes by all methods can be as high as 10%, with complication rates of 1% to 3% for inadvertent placement of the feeding tube in the airway alone [65]. Radiographic confirmation of tube placement is advised prior to initiating feeding, thus eliminating any possibility of misplacement and administration of formula into the lungs.
Gastric Residual Volume Monitoring
A number of factors impede the delivery of EN in the critical care setting; these include gastrointestinal intolerance, under-prescribing to meet daily requirements, frequent interruptions for procedures, and technical issues with tube placement and maintaining patency [68]. Monitoring gastric residual volumes (GRV) contributes to these factors, yet volumes do not correlate well with incidence of pneumonia [69], measures of gastric emptying, or to the incidence of regurgitation and aspiration [70,71]. However, few studies have highlighted the difficulty of obtaining an accurate GRV due to feeding tube tip location, patient position, and type of tube [69]. Several high quality studies have demonstrated that raising the cutoff value for GRV from a lower number of 50–150 mL to a higher number of 250–500 mL does not increase risk for regurgitation, aspiration, or pneumonia [70,71]. A lower cutoff value for GRV does not protect the patient from complications, often leads to inappropriate cessation, and may adversely affect outcome through reduced volume of EN infused [72]. Gastric residual volumes in the range of 200–500 mL should raise concern and lead to the implementation of measures to reduce risk of aspiration, but automatic cessation of feeding should not occur for GRV < 500 mL in the absence of other signs of intolerance [12,69]. Metheny et al (2012) conducted a survey in which more than 97% of nurses responded that they assessed intolerance by measuring GRV; the most frequently cited threshold levels for interrupting feedings were 200 mL and 250 mL [73]. While threshold levels varied widely, only 12.6% of the nurse respondents reported allowing GRV up to 500 mL before interrupting feedings. While monitoring GRV is unnecessary with small bowel feeding, the location of the feeding tube tip should be questioned if gastric contents are obtained from a small bowel tube. The use of GRV as a parameter for trending may also yield important information regarding tolerance of feeding when the patient is unable to communicate abdominal discomfort. Other objective measures to use in the assessment of tolerance include an abdominal exam with documentation of changes in bowel sounds, expanding girth, tenderness or firmness on palpation, increasing nasogastric output, and vomiting [12,68]. If there are indications of intolerance, it is appropriate to divert the tip of the feeding tube into the distal small bowel as discussed previously.
Trophic vs Full Feeding
For the patient with low nutrition risk, there is a lack of convincing data to support an aggressive approach to feeding, either EN or PN, in the first week of critical illness [7]. In recent years, results of several trials suggest early goal-directed feeding in this population may cause net harm with increased morbidity and mortality. When discussing recent controversies in critical care nutrition, one must mention the two schools of thought when it comes to full versus limited energy provision in the first week following ICU admission. Studies in animals and humans have shown a trophic effect of enteral nutrients on the integrity of the gut mucosa, a finding that has provided the rationale for instituting enteral nutrition early during critical illness [15]. However, the inability to provide enteral nutrition early may be a marker of the severity of illness (ie, patients who can be fed enterally are less ill than those who cannot) rather than a mediator of complications and poor outcomes. Compher et al (2017) stated that greater nutritional intake is associated with lower mortality and faster time to discharge alive in high-risk, chronic patients but does not seem to be significant in nutritionally low-risk patients [74]. The findings of the EPaNIC and EDEN trials raised concern that targeting goals that meet full energy needs early in critical illness does not provide benefit and may cause harm in some populations or settings [32,75]. The EDEN trial [32] left us believing that trophic feeding at 10–20 mL/hr may be just as effective as any feeding in the first few days of critical illness striving for 15% to 20% of daily goal calories. After establishing tolerance, advancing daily intake to > 50% to 65% of goal calories, and up to 80% for the highest risk patients, may be required to prevent intestinal permeability and achieve positive clinical outcomes [33].
The systematic review and meta-analysis performed by Al-Dorzi et al (2016) adds further evidence for judicious advancement of EN for critically ill patients [76]. The authors reported finding no association between the dose of caloric intake and hospital mortality. Furthermore, a lower caloric intake resulted in lower risk of bloodstream infections and the need for renal replacement therapy (in 5 of the 21 trials only). As with many other meta-analyses, the authors reported that their results are most assuredly impacted by the heterogeneity in design, feeding route, and dose prescribed and delivered [16,76,77]. Other recent trials such as Arabi et al (2015) that enrolled 894 patients with different feeding targets further confirmed that there is no difference in outcome between groups when it comes to moderate (40% to 60% of goal) vs high (70% to 100% of goal) energy intake, infection rates, or 90-day mortality. The authors summarized their findings saying feeding closer to target is associated with better outcomes compared with severe underfeeding [78]. This adds to the controversy when considering the findings of still other RCTs or meta-analyses that evaluated minimal or trophic feeding versus standard feeding rates [9,46,77]. The meta-analysis performed by Marik and Hooper concluded that there were no differences in the risk of acquired infections, hospital mortality, ICU LOS, or ventilator-free days whether patients received intentional hypocaloric or normocaloric nutrition support [9]. Similarly, there was no significant difference in overall mortality between the underfeeding and full-feeding groups (OR, 0.94; 95% CI, 0.74–1.19; I2 = 26.6%; P = 0.61) in the meta-analysis done by Choi et al (2015), although only 4 trials were included to ensure homogeneity of the population and the intervention [77]. Furthermore, the hospital LOS and ICU LOS did not differ between the 2 groups, nor did any other secondary clinical outcome, leading the authors to conclude that calorie intake of the initial EN support for ICU patients had no bearing on relevant outcomes.
Recent studies have attempted to correlate caloric intake and patient outcomes without success; achieving 100% of caloric goal has not favorably impacted morbidity and mortality. Evidence suggests that intake greater than 65% to 70% of daily caloric requirement in the first 7 to 10 days of ICU stay may be associated with poorer outcomes, particularly when parenteral nutrition is used to supplement intake to achieve the caloric target [33–35].
Conclusion
In this review we described current ICU controversies surrounding nutrition therapy and briefly discussed the data that support more than one course of action. A summary of key points covered is presented in the Table.
Disclaimer: The views expressed in this paper are those of the authors and do not reflect the official policy of the Department of the Army, the Department of Defense, or the U.S. government.
Corresponding author: Mary S. McCarthy, PhD, RN, CNSC, 1611 Nisqually St, Steilacoom, WA 98388.
Financial disclosures: None.
1. Hippocratic Oath. Translated by Michael North, National Library of Medicine, 2002.
2. Nightingale F. Notes on Nursing. What it is and what it is not. Radford, VA: Wilder Publications, LLC;2007
3. White JV, Guenter P, Jensen G, et al; the Academy Malnutrition Work Group; the ASPEN Malnutrition Task Force; and the ASPEN Board of Directors. Consensus statement: Academy of Nutrition and Dietetics and American Society for Parenteral and Enteral Nutrition: characteristics recommended for the identification and documentation of adult malnutrition (undernutrition). JPEN J Parenter Enteral Nutr 2012;36:275–83.
4. Hooper MH, Marik PE. Controversies and misconceptions in Intensive Care Unit nutrition. Clin Chest Med 2015;36:409–18.
5. Patel JJ, Codner P. Controversies in critical care nutrition support. Crit Care Clin 2016;32:173–89.
6. Rosenthal MD, Vanzant EL, Martindale RG, Moore FA. Evolving paradigms in the nutritional support of critically ill surgical patients. Curr Probl Surg 2015;52:147–82.
7. McCarthy MS, Warren M, Roberts PR. Recent critical care nutrition trials and the revised guidelines: do they reconcile? Nutr Clin Pract 2016;31:150–4.
8. Barker LA, Gray C, Wilson L, et al. Preoperative immunonutrition and its effect on postoperative outcomes in well-nourished and malnourished gastrointestinal surgery patients: a randomised controlled trial. Eur J Clin Nutr 2013;67: 802–807.
9. Marik PE, Hooper MH. Normocaloric versus hypocaloric feeding on the outcomes of ICU patients: a systematic review and meta-analysis. Intensive Care Med 2016;42:316–323.
10. Patkova A, Joskova V, Havel E, et al. Energy, protein, carbohydrate, and lipid intakes and their effects on morbidity and mortality in critically ill adult patients: a systematic review. Adv Nutr 2017;8:624–34.
11. Wong CS, Aly EH. The effects of enteral immunonutrition in upper gastrointestinal surgery: a systematic review and meta-analysis. Int J Surg 2016;29:137–50.
12. McClave SA, Taylor BE, Martindale RG, et al; Society of Critical Care Medicine; American Society for Parenteral and Enteral Nutrition. Guidelines for the provision and assessment of nutrition support therapy in the adult critically ill patient: Society of Critical Care Medicine (SCCM) and American Society of Parenteral and Enteral Nutrition (ASPEN). JPEN J Parenter Enteral Nutr 2016; 40:159–211.
13. Ammori BJ. Importance of the early increase in intestinal permeability in critically ill patients. Eur J Surg 2002;168:660–1.
14. Vazquez-Sandoval A, Ghamande S, Surani S. Critically ill patients and gut motility: are we addressing it? World J Gastrointest Pharmacol Ther 2017;8:174–9.
15. Patel JJ, Martindale RG, McClave SA. Controversies surrounding critical care nutrition: an appraisal of permissive underfeeding, protein, and outcomes. JPEN J Parenter Enteral Nutr 2017; 148607117721908.
16. Hegazi RA, Hustead DS, Evans DC. Preoperative standard oral nutrition supplements vs immunonutrition: results of a systematic review and meta-analysis. J Am Coll Surg 2014;219:1078–87.
17. Alkhawaja S, Martin C, Butler RJ, Gwadry-Sridhar F. Post-pyloric versus gastric tube feeding for preventing pneumonia and improving nutritional outcomes in critically ill adults. Cochrane Database of Syst Rev 2015; CD008875.
18. Davies AR, Morrison SS, Bailey MJ, et al ; ENTERIC Study Investigators; ANZICS Clinical Trials Group. A multi-center randomized controlled trial comparing early nasojejunal with nasogastric nutrition in critical illness. Crit Care Med 2012;40:2342–8.
19. Hsu CW, Sun SF, Lin SL, et al. Duodenal versus gastric feeding in medical intensive care unit patients: a prospective, randomized, clinical study. Crit Care Med 2009;37:1866–72.
20. Powers J, Luebbehusen M, Spitzer T, et al. Verification of an electromagnetic placement device compared with abdominal radiograph to predict accuracy of feeding tube placement. JPEN J Parenter Enteral Nutr 2011;35:535–9.
21. Dhaliwal R, Cahill N, Lemieux M, Heyland DK. The Canadian critical care nutrition guidelines in 2013: an update on current recommendations and implementation strategies. Nutr Clin Pract 2014; 29:29–43.22. Kreymann K, Berger M, Deutz N. et al; DGEM (German Society for Nutritional Medicine); ESPEN (European Society for Parenteral and Enteral Nutrition). ESPEN guidelines on enteral nutrition: intensive care. Clin Nutr 2006;25:210–23.
23. McClave SA, Martindale RG, Vanek VW, et al. Guidelines for the provision and assessment of nutrition support therapy in the adult critically ill patient: Society of Critical Care Medicine (SCCM) and American Society for Parenteral and Enteral Nutrition (ASPEN). JPEN J Parenter Ent Nutr 2009;33:277–316.
24. McClave SA, Martindale RG, Rice TW, Heyland DK. Feeding the critically ill patient. Crit Care Med 2014;42:2600–10.
25. Tian F, Gao X, Wu C, et al. Initial energy supplementation in critically ill patients receiving enteral nutrition: a systematic review and meta-analysis of randomized controlled trials. Asia Pac J Clin Nutr 2017;26:11–9.
26. Martindale RG, Warren M. Should enteral nutrition be started in the first week of critical illness? Curr Opin Clin Nutr Metab Care 2015;18:202–6.
27. McClave SA, Heyland DK. The physiologic response and associated clinical benefits from provision of early enteral nutrition. Nutr Clin Pract 2009;24:305–15.
28. Kang W, Kudsk KA. Is there evidence that the gut contributes to mucosal immunity in humans? JPEN J Parenter Enteral Nutr 2007;31:461–82.
29. Seron-Arbeloa C, Zamora-Elson M, Labarta-Monzon L, Mallor-Bonet T. Enteral nutrition in critical care. J Clin Med Res 2013;5:1-11.
30. Harvey SE, Parrott F, Harrison DA, et al; CALORIES Trial Investigators. Trial of the route of early nutritional support in critically ill adults. N Engl J Med 2014;371:1673–84.
31. Elke G, van Zanten AR, Lemieux M, et al. Enteral versus parenteral nutrition in critically ill patients: an updated systematic review and meta-analysis of randomized controlled trials. Crit Care 2016;20:117.
32. Reignier J, Boisramé-Helms J, Brisard L, et al. Enteral versus parenteral nutrition in ventilated adults with shock: a randomized, controlled, multicenter, open-label, parallel-group study (NUTRIREA-2). Lancet 2018;391:133–43.
33. Rice TW , Wheeler AP, Thompson BT et al;National Heart, Lung, and Blood Institute, Acute Respiratory Distress Syndrome (ARDS) Clinical Trials Network. Initial trophic vs full enteral feeding in patients with acute lung injury: the EDEN randomized trial. JAMA 2012;307:795–803.
34. Heyland DK, Dhaliwal R, Jiang X, Day AG. Identifying critically ill patients who benefit the most from nutrition therapy: the development and initial validation of a novel risk assessment tool. Crit Care 2011;15:R258.
35. Bost RB, Tjan DH, van Zanten AR. Timing of (supplemental) parenteral nutrition in critically ill patients: a systematic review. Ann Intensive Care 2014;4:31.
36. Casaer MP, Mesotten D, Hermans G, et al. Early verus late parenteral nutrition in critically ill adults. N Eng J Med 2011;365:506–17.
37. Harvey SE, Parrott F, Harrison DA, et al; CALORIES Trial Investigators. Trial of the route of early nutritional support in critically ill adults. N Eng J Med 2014;371:1673–84.
38. Manzanares W, Dhaliwal R, Jurewitsch B, et al. Parenteral fish oil lipid emulsions in the critically ill: A systematic review and meta-analysis. JPEN J Parenter Enteral Nutr 2014;38:20–8.
39. Oshima T, Heidegger CP, Pichard C. Supplemental parenteral nutrition is the key to prevent energy deficits in critically ill patients. Nutr Clin Prac 2016;31:432–7.
40. Manzanares W, Langlois PL, Dhaliwal R, Lemieux M, Heyland DK. Intravenous fish oil lipid emulsions in critically ill patients: an updated systematic review and meta-analysis. Crit Care 2015;19:167.
41. Rooyackers O, Sundström Rehal M, Liebau F, et al. High protein intake without concerns? Crit Care 2017;21:106.
42. Puthucheary ZA, Rawal J, McPhail M, et al. Acute skeletal muscle wasting in critical illness. JAMA 2013;310:1591–600.
43. Heyland D, Muscedere J, Wischmeyer PE, et al; Canadian Critical Care Trials Group. A randomized trial of glutamine and antioxidants in critically ill patients. N Engl J Med 2013;368:1489–97.
44. Marik PE, Zaloga GP. Immunonutrition in critically ill patients: a systematic review and analysis of the literature. Intensive Care Med 2008;34:1980–90.
45. Gadek JE, DeMichele SJ, Karlstad MD, et al; Enteral Nutrition in ARDS Study Group. Effect of enteral feeding with eicosapentaenoic acid, gamma-linolenic acid, and antioxidants in patients with acute respiratory distress syndrome. Crit Care Med 1999;27:1409–20.
46. Rice TW, Wheeler AP, Thompson BT, et al; NIH NHLBI Acute Respiratory Distress Syndrome Network of Investigators. Enteral omega-3 fatty acid, gamma-linolenic acid, and antioxidant supplementation in acute lung injury. JAMA 2011;306:1574–81.
47. Singer P, Theilla M, Fisher H, et al. Benefit of an enteral diet enriched with eicosapentaenoic acid and gamma-linolenic acid in ventilated patients with acute lung injury. Crit Care Med 2006;34:1033–38.
48. Atkinson S, Sieffert E, Bihari D. A prospective, randomized, double-blind, controlled clinical trial of enteral immunonutrition in the critically ill. Guy’s Hospital Intensive Care Group. Crit Care Med 1998;26:1164–72.
49. Galbán C, Montejo JC, Mesejo A, et al. An immune-enhancing enteral diet reduces mortality rate and episodes of bacteremia in septic intensive care unit patients. Crit Care Med 2000;28:643–8.
50. Weimann A, Bastian L, Bischoff WE, et al. Influence of arginine, omega-3 fatty acids and nucleotide-supplemented enteral support on systemic inflammatory response syndrome and multiple organ failure in patients after severe trauma. Nutrition 1998;14:165–72.
51. van Bokhorst-De Van Der Schueren MA, Quak JJ, von Blomberg-van der Flier BM, et al. Effect of perioperative nutrition with and without arginine supplementation, on nutritional status, immune function, postoperative morbidity, and survival in severely malnourished head and neck cancer patients. Am J Clin Nutr 2001;73:323–32.
52. Cerantola Y, Hübner M, Grass F, et al. Immunonutrition in gastrointestinal surgery. Br J Surg 2011;98:37–48.
53. Marik PE, Zaloga GP. Immunonutrition in high-risk surgical patients: a systematic review and analysis of the literature. JPEN J Parenter Enteral Nutr 2010;34:378–86.
54. Sultan J, Griffin SM, Di Franco F, et al. Randomized clinical trial of omega-3 fatty acid–supplemented enteral nutrition vs. standard enteral nutrition in patients undergoing oesophagogastric cancer surgery. Br J Surg 2012;99:346–55.
55. Waitzberg DL, Saito H, Plank LD, et al. Postsurgical infections are reduced with specialized nutrition support. World J Surg 2006;30:1592–604.
56. Pearce CB, Sadek SA, Walters AM, et al. A double-blind, randomised, controlled trial to study the effects of an enteral feed supplemented with glutamine, arginine, and omega-3 fatty acid in predicted acute severe pancreatitis. JOP 2006;7:361–71.
57. Mazaki T, Ishii Y, Murai I. Immunoenhancing enteral and parenteral nutrition for gastrointestinal surgery: a multiple treatments meta-analysis. Ann Surg 2015;261:662–9.
58. van Zanten ARH, Sztark F, Kaisers UX, et al. High-protein enteral nutrition enriched with immune-modulating nutrients vs standard high protein enteral nutrition and nosocomial infections in the ICU. JAMA 2014;312:514–24.
59. Drover JW, Dhaliwal R, Weitzel L, et al. Perioperative use of arginine supplemented diets: a systematic review of the evidence. J Am Coll Surg 2011;212:385–99.
60. Stupak D, Abdelsayed GG, Soloway GN. Motility disorders of the upper gastrointestinal tract in the intensive care unit: pathophysiology and contemporary management. J Clin Gastroenterol 2012;46:449–56.
61. Huang HH, Chang SJ, Hsu CW, et al. Severity of illness influences the efficacy of enteral feeding route on clinical outcomes in patients with critical illness. J Acad Nutr Diet 2012;112:1138–46.
62. American Thoracic Society. Guidelines for the management of adults with hospital-acquired, ventilator-associated, and healthcare-associated pneumonia. Am J Respir Crit Care Med 2005;171:388–416.
63. Heyland DK, Cahill NE, Dhaliwal R, et al. Impact of enteral feeding protocols on enteral nutrition delivery: results of a multicenter observational study. JPEN J Parenter Enteral Nutr 2010;34:675–84.
64. Landzinski J, Kiser TH, Fish DN, et al. Gastric motility function in critically ill patients tolerant vs intolerant to gastric nutrition. JPEN J Parenter Enteral Nutr 2008;32:45–50.
65. de Aguilar-Nascimento JE, Kudsk KA. Use of small bore feeding tubes: successes and failures. Curr Opin Clin Nutr Metab Care 2007;10:291–6.
66. Boyer N, McCarthy MS, Mount CA. Analysis of an electromagnetic tube placement device vs a self-advancing nasal jejunal device for postpyloric feeding tube placement . J Hosp Med 2014;9:23–8.
67. Metheny NA, Meert KL. Effectiveness of an electromagnetic feeding tube placement device in detecting inadvertent respiratory placement. Am J Crit Care 2014;23:240–8.
68. Montejo JC, Miñambres E, Bordejé L, et al. Gastric residual volume during enteral nutrition in ICU patients: the REGANE study. Intensive Care Med 2010;36:1386–93.
69. Hurt RT, McClave SA. Gastric residual volumes in critical illness: what do they really mean? Crit Care Clin 2010;26:481–90.
70. Poulard F, Dimet J, Martin-Lefevre L, et al. Impact of not measuring residual gastric volume in mechanically ventilated patients receiving early enteral feeding: a prospective before-after study. JPEN J Parenter Enteral Nutr 2010;34:125–30.
71. Reignier J, Mercier E, Gouge AL, et al; Clinical Research in Intensive Care and Sepsis (CRICS) Group. Effect of not monitoring residual gastric volume on risk of ventilator-associated pneumonia in adults receiving mechanical ventilation and early enteral feeding: a randomized controlled trial. JAMA 2013;309:249–56.
72. Williams TA, Leslie GD, Leen T, et al. Reducing interruptions to continuous enteral nutrition in the intensive care unit: a comparative study. J Clin Nurs 2013;22:2838-2848.
73. Metheny NA, Stewart BJ, Mills AC. Blind insertion of feeding tubes in intensive care units: a national survey. Am J Crit Care 2012;21:352–360.
74. Compher C, Chittams J, Sammarco T, et al. Greater protein and energy intake may be associated with improved mortality in higher risk critically ill patients: A multicenter, multinational observational study. Crit Care Med 2017;45:156–163.
75. Casaer MP, Wilmer A, Hermans G, et al. Role of disease and macronutrient dose in the randomized controlled EPANIC Trial: a post hoc analysis. Am J Resp Crit Care Med 2013;187:247–55.
76. Al-Dorzi HM, Albarrak A, Ferwana M, et al. Lower versus higher dose of enteral caloric intake in adult critically ill patients: a systematic review and meta-analysis. Crit Care 2016;20:358.
77. Choi EY, Park DA, Park J. Calorie intake of enteral nutrition and clinical outcomes in acutely critically ill patients: a meta-analysis of randomized controlled trials. JPEN J Parenter Enteral Nutr 2015;39:291–300.
78. Arabi YM, Aldawood AS, Haddad SH, et al. Permissive underfeeding or standard enteral feeding in critically ill adults. N Engl J Med 2015;372:2398–408.
Nivolumab plus Ipilumumab in NSCLC: A New Use for Tumor Mutational Burden?
Study Overview
Objective. To examine the effect of nivolumab plus ipilimumab vs nivolumab monotherapy vs standard of care chemotherapy in front line metastatic non-small cell lung cancer (NSCLC).
Design. Multipart phase 3 randomized controlled trial (CheckMate 227 trial).
Setting and participants. Study patients were enrolled at multiple centers around the world. Patients were eligible for enrollment if they had biopsy-proven metastatic NSCLC and had not received prior systemic anti-cancer therapy. Exclusion criteria were patients with known ALK translocations or EGFR mutations, known autoimmune disease, current comorbidity requiring treatment with steroids or other immunosuppression at the time of randomization, or untreated central nervous system (CNS) metastasis. Patients with CNS metastasis could be enrolled if they were adequately treated and had returned to their neurologic baseline.
Intervention. At the time of randomization, patients were split into two treatment groups based on their PD-L1 percentage. Patients with PD-L1 of greater than or equal to 1% were randomly assigned in a 1:1:1 ratio to nivolumab 3 mg/kg every 2 weeks plus ipilimumab 1mg/kg every 6 weeks, nivolumab 240 mg every 2 weeks, or standard chemotherapy based on tumor type (platinum/pemetrexed for non-squamous histology and platinum/gemcitabine for squamous). Patients with PD-L1 less than 1% were randomly assigned in a 1:1:1 ratio to nivolumab 3 mg/kg every 2 weeks plus ipilimumab 1 mg/kg every 6 weeks, nivolumab 360mg every 3 weeks, or standard chemotherapy based on tumor type. Patient’s with non-squamous histology that had stable disease or a response to chemotherapy could receive maintenance pemetrexed +/- nivolumab. Patients were followed with imaging every 6 weeks for the first year, then every 12 weeks afterwards. All treatments were continued until disease progression, unacceptable toxicity, or completion of protocol (2 years for immunotherapy).
Main outcome measures. There were 2 co-primary outcomes: Progression-free survival (PFS) of nivolumab/ipilimumab vs chemotherapy in patients selected via tumor mutational burden (TMB), and overall survival in patients selected on PD-L1 status. TMB was defined as 10 or greater mutations per megabase. In this publication, only the first primary end point is reported.
Results. Between August 2015 and November 2016, 2877 patients were enrolled and 1739 were randomized on a 1:1:1 to nivolumab plus ipilimumab, nivolumab monotherapy, or standard of care chemotherapy. Of those, 1004 (57.7%) had adequate data for TMB to be evaluated. Of those, 299 patients met the TMB cutoff for the first primary end point—139 in the nivolumab plus ipilimumab arm and 160 in the chemotherapy arm. The 1-year PFS in patients with a high TMB was 42.6% in the immunotherapy arm vs 13.2% with chemotherapy and the median PFS was 7.2 months vs 5.5 months (hazard ratio [HR] 0.58; 97.5% CI 0.41–0.81; P < 0.001). In low TMB patients, the PFS was greater for chemotherapy vs immunotherapy (3.2 vs 5.5 months). The HR for patients with high TMB was significant for all PD-L1 values and for non-squamous histology. For squamous histology, there was a benefit of 12 month PFS of 36% vs 7%, however it was not statistically significant (HR 0.63; 95% CI, 0.39–1.04). In the supplemental index, nivolumab vs chemotherapy with a TMB greater than 13 was shown to have no benefit (HR 0.95; 95% CI 0.64–1.40; P = 0.7776).
With regard to adverse events, 31.2% of the nivolumab plus ipilimumab group experienced a grade 3 or greater event vs 36.1% of the chemotherapy group and 18.9% of the nivolumab monotherapy group. Events higher in the combination immunotherapy group were rash (1.6% vs 0%), diarrhea (1.6% vs 0.7%), and hypothyroidism (0.3% vs 0%). Events higher in the chemotherapy arm were anemia (11.2% vs 1.6%), neutropenia/decreased neutrophil count (15.8% vs 0%), nausea (2.1% vs 0.5%), and vomiting (2.3% vs 0.3%).
Conclusion. Among patients with newly diagnosed metastatic NSCLC with tumor mutational burden of 10 or greater mutations per megabase, the combination of nivolumab and ipilimumab resulted in higher progression-free survival than standard chemotherapy.
Commentary
Non-small cell lung cancer is undergoing a renaissance in improved survival as a result of new targeted therapies [1]. Medications to target the epidermal growth factor receptor (EGFR) and anaplastic lymphoma kinase (ALK) translocations have shown clinical benefit over standard chemotherapy as initial treatment. In addition, in patients with programed death ligand 1 (PD-L1) expression of greater than 50%, pembrolizumab has showed to be superior to standard chemotherapy in the front-line setting. It is currently standard to test all non-squamous lung cancer specimens for EGFR, ALK, and PD-L1, and some argue to test squamous as well. However, through all these treatments, the prognosis of metastatic NSCLC remains poor, as only 4.7% of patients live to 5 years [2].
This study asks if we can add tumor mutational burden (TMB) as actionable information, and should we perform this test on all NSCLC specimens. The theory is that tumors with high TMB will express more foreign antigens, and thus be more responsive to immune checkpoint inhibition. Reviewing the literature, there has been varying correlation between TMB and response to immunotherapy [3]. Despite its potential use as a biomarker, no prior study has shown that using any treatment in a high TMB population conveys any benefit and thus it is not considered standard of care to test for TMB.
This article’s conclusion has several major implications. First, does dual immunotherapy have a role in NSCLC? The data in the trial shows that in high TMB patients there is a clear PFS benefit to nivolumab plus ipilimumab over chemotherapy. In addition, about 40% of patients had a durable response at 2 years follow-up. Strengths of this study are the large size, although smaller when selected for only high TMB patients. Another strength is the long follow-up with a minimum of 11.2 months, with a significant number followed for about 2 years. A weakness of this trial is that patients were randomized before their TMB status was known. In addition, only 57.7% of the randomized patients were able to be analyzed for TMB. The third arm of this study (nivolumab monotherapy), while providing the information that it is less effective in this population, does cloud the information. Finally, while a benefit in PFS was found in the TMB cohort, this does not always correlate with an OS benefit in mature data.
Second, if it does have a role, should TMB be a standard test on all NSCLC specimens? While it was borderline, there was no benefit to squamous histology. In the supplemental index it was reported that nivolumab monotherapy did not show a benefit, thus the need to offer ipilimumab depends on TMB status. Pembrolizumab is already approved in patients with PD-L1 expression greater than 50% [2]. However, in patients with PD-L1 less than 50% and no ALK or EGFR mutation, chemotherapy would be frontline treatment; with TMB testing these patients could be spared this toxic treatment. In addition, a parallel published study shows benefit to adding pembrolizumab to standard chemotherapy [4].
Another consideration is the requirements of tissue for testing TMB. This study used the Foundation One assay. This test required optimally 25 square millimeters of tissue and preferred the whole block of tissue or 10 unstained slides [5]. For patients who are diagnosed with full surgical resection this is not an issue and should not be a barrier for this therapy. However, metastatic disease patients are often diagnosed on core biopsy of a metastatic site, thus getting an accurate TMB profile (in addition to testing other actionable mutations) could be a challenge. Identifying patients who would be a candidate for this therapy prior to biopsy will be important given the tissue requirements.
Another advantage to immunotherapy vs standard chemotherapy has been favorable toxicity rates. PD-L1 inhibitor monotherapy has generally been superior to standard chemotherapy and has been a better option for frail patients. However, the addition of the CTLA-4 inhibitor ipilimumab to PD-L1 blockade has increased the toxicity profile. In this trial, the grade 3 or greater toxicity rate was similar between dual immunotherapy and chemotherapy, although with different major symptoms. In addition, patients with prior autoimmune disease or active brain metastasis were excluded from the study and thus should not be offered dual immunotherapy. A clinician will need to consider if their patient is a candidate for dual immunotherapy before considering the application of this trial.
In the future, researchers will need to compare these agents to the new standard of care. Chemotherapy as a control arm no longer is appropriate in a majority of patients. Some patients in this study were PD-L1 greater than 50% and TMB greater than 10; for them, the control should be pembrolizumab. In addition, sequencing therapy continues to be a challenge. Finally, studies in patients with other malignancies have looked at shorter courses of ipilimumab with reduced toxicity with similar benefit [6], and this could be applied to lung cancer as well.
Application for Clinical Practice
This trial adds an additional actionable target to the array of treatments for NSCLC. In patients with newly diagnosed metastatic non-squamous NSCLC with no actionable EGFR or ALK mutation and PD-L1 less than 50%, testing for TMB on tumor should be performed. If the test shows 10 or greater mutations per megabase, combination nivolumab and ipilimumab should be offered over standard chemotherapy. Special consideration of patient characteristics to determine candidacy and tolerability of this treatment should be evaluated.
— Jacob Elkon, MD, George Washington University School of Medicine, Washington, DC
1. Reck M, Rabe KF. Precision Diagnosis and treatment for advanced non-small-cell lung cancer. N Engl J Med 2017;377:849–61.
2. Noone AM, Howlader N, Krapcho M, et al, editors. SEER Cancer Statistics Review, 1975-2015, National Cancer Institute. Bethesda, MD. Accessed at https://seer.cancer.gov/csr/1975_2015/.
3. Yarchoan M, Hopkins A, Jaffee EM. Tumor mutational burden and response rate to PD-1 Inhibition. N Engl J Med 2017;377:2500–1.
4. Gandhi L, Rodríguez-Abreu D,
5. Foundation One. Specimen instructions. Accessed at https://assets.ctfassets.net/vhribv12lmne/3uuae1yciACmI48kqEMCU4/607ecf55151f20fbaf7067e5fd7c9e22/F1_SpecimenInstructionsNC_01-07_HH.pdf.
6. Motzer RJ, Tannir NM, McDermott DF, et al; CheckMate 214 Investigators. Nivolumab plus ipilimumab versus sunitinib in advanced renal-cell carcinoma. N Engl J Med 2018;378:1277–90.
Study Overview
Objective. To examine the effect of nivolumab plus ipilimumab vs nivolumab monotherapy vs standard of care chemotherapy in front line metastatic non-small cell lung cancer (NSCLC).
Design. Multipart phase 3 randomized controlled trial (CheckMate 227 trial).
Setting and participants. Study patients were enrolled at multiple centers around the world. Patients were eligible for enrollment if they had biopsy-proven metastatic NSCLC and had not received prior systemic anti-cancer therapy. Exclusion criteria were patients with known ALK translocations or EGFR mutations, known autoimmune disease, current comorbidity requiring treatment with steroids or other immunosuppression at the time of randomization, or untreated central nervous system (CNS) metastasis. Patients with CNS metastasis could be enrolled if they were adequately treated and had returned to their neurologic baseline.
Intervention. At the time of randomization, patients were split into two treatment groups based on their PD-L1 percentage. Patients with PD-L1 of greater than or equal to 1% were randomly assigned in a 1:1:1 ratio to nivolumab 3 mg/kg every 2 weeks plus ipilimumab 1mg/kg every 6 weeks, nivolumab 240 mg every 2 weeks, or standard chemotherapy based on tumor type (platinum/pemetrexed for non-squamous histology and platinum/gemcitabine for squamous). Patients with PD-L1 less than 1% were randomly assigned in a 1:1:1 ratio to nivolumab 3 mg/kg every 2 weeks plus ipilimumab 1 mg/kg every 6 weeks, nivolumab 360mg every 3 weeks, or standard chemotherapy based on tumor type. Patient’s with non-squamous histology that had stable disease or a response to chemotherapy could receive maintenance pemetrexed +/- nivolumab. Patients were followed with imaging every 6 weeks for the first year, then every 12 weeks afterwards. All treatments were continued until disease progression, unacceptable toxicity, or completion of protocol (2 years for immunotherapy).
Main outcome measures. There were 2 co-primary outcomes: Progression-free survival (PFS) of nivolumab/ipilimumab vs chemotherapy in patients selected via tumor mutational burden (TMB), and overall survival in patients selected on PD-L1 status. TMB was defined as 10 or greater mutations per megabase. In this publication, only the first primary end point is reported.
Results. Between August 2015 and November 2016, 2877 patients were enrolled and 1739 were randomized on a 1:1:1 to nivolumab plus ipilimumab, nivolumab monotherapy, or standard of care chemotherapy. Of those, 1004 (57.7%) had adequate data for TMB to be evaluated. Of those, 299 patients met the TMB cutoff for the first primary end point—139 in the nivolumab plus ipilimumab arm and 160 in the chemotherapy arm. The 1-year PFS in patients with a high TMB was 42.6% in the immunotherapy arm vs 13.2% with chemotherapy and the median PFS was 7.2 months vs 5.5 months (hazard ratio [HR] 0.58; 97.5% CI 0.41–0.81; P < 0.001). In low TMB patients, the PFS was greater for chemotherapy vs immunotherapy (3.2 vs 5.5 months). The HR for patients with high TMB was significant for all PD-L1 values and for non-squamous histology. For squamous histology, there was a benefit of 12 month PFS of 36% vs 7%, however it was not statistically significant (HR 0.63; 95% CI, 0.39–1.04). In the supplemental index, nivolumab vs chemotherapy with a TMB greater than 13 was shown to have no benefit (HR 0.95; 95% CI 0.64–1.40; P = 0.7776).
With regard to adverse events, 31.2% of the nivolumab plus ipilimumab group experienced a grade 3 or greater event vs 36.1% of the chemotherapy group and 18.9% of the nivolumab monotherapy group. Events higher in the combination immunotherapy group were rash (1.6% vs 0%), diarrhea (1.6% vs 0.7%), and hypothyroidism (0.3% vs 0%). Events higher in the chemotherapy arm were anemia (11.2% vs 1.6%), neutropenia/decreased neutrophil count (15.8% vs 0%), nausea (2.1% vs 0.5%), and vomiting (2.3% vs 0.3%).
Conclusion. Among patients with newly diagnosed metastatic NSCLC with tumor mutational burden of 10 or greater mutations per megabase, the combination of nivolumab and ipilimumab resulted in higher progression-free survival than standard chemotherapy.
Commentary
Non-small cell lung cancer is undergoing a renaissance in improved survival as a result of new targeted therapies [1]. Medications to target the epidermal growth factor receptor (EGFR) and anaplastic lymphoma kinase (ALK) translocations have shown clinical benefit over standard chemotherapy as initial treatment. In addition, in patients with programed death ligand 1 (PD-L1) expression of greater than 50%, pembrolizumab has showed to be superior to standard chemotherapy in the front-line setting. It is currently standard to test all non-squamous lung cancer specimens for EGFR, ALK, and PD-L1, and some argue to test squamous as well. However, through all these treatments, the prognosis of metastatic NSCLC remains poor, as only 4.7% of patients live to 5 years [2].
This study asks if we can add tumor mutational burden (TMB) as actionable information, and should we perform this test on all NSCLC specimens. The theory is that tumors with high TMB will express more foreign antigens, and thus be more responsive to immune checkpoint inhibition. Reviewing the literature, there has been varying correlation between TMB and response to immunotherapy [3]. Despite its potential use as a biomarker, no prior study has shown that using any treatment in a high TMB population conveys any benefit and thus it is not considered standard of care to test for TMB.
This article’s conclusion has several major implications. First, does dual immunotherapy have a role in NSCLC? The data in the trial shows that in high TMB patients there is a clear PFS benefit to nivolumab plus ipilimumab over chemotherapy. In addition, about 40% of patients had a durable response at 2 years follow-up. Strengths of this study are the large size, although smaller when selected for only high TMB patients. Another strength is the long follow-up with a minimum of 11.2 months, with a significant number followed for about 2 years. A weakness of this trial is that patients were randomized before their TMB status was known. In addition, only 57.7% of the randomized patients were able to be analyzed for TMB. The third arm of this study (nivolumab monotherapy), while providing the information that it is less effective in this population, does cloud the information. Finally, while a benefit in PFS was found in the TMB cohort, this does not always correlate with an OS benefit in mature data.
Second, if it does have a role, should TMB be a standard test on all NSCLC specimens? While it was borderline, there was no benefit to squamous histology. In the supplemental index it was reported that nivolumab monotherapy did not show a benefit, thus the need to offer ipilimumab depends on TMB status. Pembrolizumab is already approved in patients with PD-L1 expression greater than 50% [2]. However, in patients with PD-L1 less than 50% and no ALK or EGFR mutation, chemotherapy would be frontline treatment; with TMB testing these patients could be spared this toxic treatment. In addition, a parallel published study shows benefit to adding pembrolizumab to standard chemotherapy [4].
Another consideration is the requirements of tissue for testing TMB. This study used the Foundation One assay. This test required optimally 25 square millimeters of tissue and preferred the whole block of tissue or 10 unstained slides [5]. For patients who are diagnosed with full surgical resection this is not an issue and should not be a barrier for this therapy. However, metastatic disease patients are often diagnosed on core biopsy of a metastatic site, thus getting an accurate TMB profile (in addition to testing other actionable mutations) could be a challenge. Identifying patients who would be a candidate for this therapy prior to biopsy will be important given the tissue requirements.
Another advantage to immunotherapy vs standard chemotherapy has been favorable toxicity rates. PD-L1 inhibitor monotherapy has generally been superior to standard chemotherapy and has been a better option for frail patients. However, the addition of the CTLA-4 inhibitor ipilimumab to PD-L1 blockade has increased the toxicity profile. In this trial, the grade 3 or greater toxicity rate was similar between dual immunotherapy and chemotherapy, although with different major symptoms. In addition, patients with prior autoimmune disease or active brain metastasis were excluded from the study and thus should not be offered dual immunotherapy. A clinician will need to consider if their patient is a candidate for dual immunotherapy before considering the application of this trial.
In the future, researchers will need to compare these agents to the new standard of care. Chemotherapy as a control arm no longer is appropriate in a majority of patients. Some patients in this study were PD-L1 greater than 50% and TMB greater than 10; for them, the control should be pembrolizumab. In addition, sequencing therapy continues to be a challenge. Finally, studies in patients with other malignancies have looked at shorter courses of ipilimumab with reduced toxicity with similar benefit [6], and this could be applied to lung cancer as well.
Application for Clinical Practice
This trial adds an additional actionable target to the array of treatments for NSCLC. In patients with newly diagnosed metastatic non-squamous NSCLC with no actionable EGFR or ALK mutation and PD-L1 less than 50%, testing for TMB on tumor should be performed. If the test shows 10 or greater mutations per megabase, combination nivolumab and ipilimumab should be offered over standard chemotherapy. Special consideration of patient characteristics to determine candidacy and tolerability of this treatment should be evaluated.
— Jacob Elkon, MD, George Washington University School of Medicine, Washington, DC
1. Reck M, Rabe KF. Precision Diagnosis and treatment for advanced non-small-cell lung cancer. N Engl J Med 2017;377:849–61.
2. Noone AM, Howlader N, Krapcho M, et al, editors. SEER Cancer Statistics Review, 1975-2015, National Cancer Institute. Bethesda, MD. Accessed at https://seer.cancer.gov/csr/1975_2015/.
3. Yarchoan M, Hopkins A, Jaffee EM. Tumor mutational burden and response rate to PD-1 Inhibition. N Engl J Med 2017;377:2500–1.
4. Gandhi L, Rodríguez-Abreu D,
5. Foundation One. Specimen instructions. Accessed at https://assets.ctfassets.net/vhribv12lmne/3uuae1yciACmI48kqEMCU4/607ecf55151f20fbaf7067e5fd7c9e22/F1_SpecimenInstructionsNC_01-07_HH.pdf.
6. Motzer RJ, Tannir NM, McDermott DF, et al; CheckMate 214 Investigators. Nivolumab plus ipilimumab versus sunitinib in advanced renal-cell carcinoma. N Engl J Med 2018;378:1277–90.
Balanced Crystalloids in the Critically Ill
Study Overview
Objective. To evaluate balanced crystalloids in comparison with normal saline in the intensive care unit (ICU) population.
Design. Pragmatic, un-blinded, cluster-randomized, multiple-crossover clinical trial (the SMART study).
Setting and participants. The study evaluated critically ill adults > 18 years of age, admitted and readmitted into 5 ICUs, both medical and surgical, from June 2015 to April 2017. 15,802 patients were enrolled, powered to detect a 1.9% percentage point difference in primary outcome. ICUs were randomized to use either balanced crystalloids (lactated Ringer’s [LR] or Plasma-Lyte A, depending on the provider’s preference) or normal saline during alternate calendar months. Relative contraindications to use of balanced crystalloids included traumatic brain injury and hyperkalemia. The admitting emergency rooms and operating rooms coordinated intravenous fluid (IVF) choice with their respective ICUs. An intention-to-treat analysis was conducted. In addition to primary and secondary outcome analyses, subgroup analyses based on factors including total IVF volume to day 30, vasopressor use, predicted in-hospital mortality, sepsis or traumatic brain injury diagnoses, ICU type, source of admission, and kidney function at baseline were also done. Furthermore, sensitivity analyses taking into account the total volume of crystalloid, crossover and excluding readmissions were performed.
Main outcome measures. The primary outcome was the proportion of patients that met at least 1 of the 3 criteria for a Major Adverse Kidney Event at day 30 (MAKE30) or discharge, whichever occurred earlier. MAKE30 is a composite measure consisting of death, persistent renal dysfunction (creatinine ≥ 200% baseline), or new renal replacement therapy (RRT). Patients previously on RRT were included for mortality analysis alone. In addition, secondary clinical outcomes including in-hospital mortality (prior to ICU discharge, at day 30 and day 60), ventilator-free days, vasopressor-free days, ICU-free days, days alive and RRT-free days in the first 28 days were assessed. Secondary renal outcomes such as persistent renal dysfunction, acute kidney injury (AKI) ≥ stage 2 (per Kidney Disease: Improving Global Outcomes Criteria {KDIGO}) criteria, new RRT, highest creatinine during hospitalization, creatinine at discharge and highest change in creatinine during hospitalization were also evaluated.
Results. 7942 patients were randomized to the balanced crystalloid group and 7860 to the saline group. Median age for both groups was 58 years and 57.6% patients were male. In terms of patient acuity, approximately 34% patients were on mechanical ventilation, 26% were on vasopressors, and around 14% carried a diagnosis of sepsis. At time of presentation, 17% had chronic kidney disease (CKD) ≥ stage 3 and approximately 5% were on RRT. Around 8% came in with AKI ≥ stage 2. Baseline creatinine in the both groups was 0.89 (interquartile range [IQR] 0.74–1.1). Median volumes of balanced crystalloid and saline administered was 1L (IQR 0–3.2L) and 1.02L (IQR 0–3.5L) respectively. Less than 5% in both groups received unassigned fluids. Predicted risk of in-hospital death for both groups was approximately 9%.
Significantly higher number of patients had plasma chloride ≥ 110 mmol/L and bicarbonate ≤ 20 mmol/L in the saline group (P < 0.001). In terms of primary outcome, MAKE30 rates in the balanced crystalloid vs saline groups were 14.3 vs 15.4 (marginal odds ratio {OR} 0.91, 95% confidence interval {CI} 0.84–0.99, P = 0.04) with similar results in the pre-specified sensitivity analyses. This difference was more prominent with larger volumes of infused fluids. All 3 components of composite primary outcome were improved in the crystalloid group, although none of the 3 individually achieved statistical significance.
Overall, mortality before discharge and within 30 days of admission in the balanced crystalloid group was 10.3% compared to 11.1% in the saline group (OR 0.9, CI 0.8–1.01, P = 0.06). In-hospital death before ICU discharge and at 60 days also mirrored this trend, although they did not achieve statistical significance either. Of note, in septic patients, 30-day mortality rates were 25.2 vs 29.4 in the balanced crystalloid and saline groups respectively (OR 0.8, 95% CI 0.67–0.97, P = 0.02).
With regard to renal outcomes in the balanced crystalloid vs normal saline groups, results were as follows: new RRT {2.5 vs 2.9%, P = 0.08}, new AKI development 10.7% vs 11.5% (OR 0.9, P = 0.09). In patients with a history of previous RRT or presenting with an AKI, crystalloids appeared to provide better MAKE30 outcomes, although not achieving statistical significance.
Conclusion. In the critically ill population, balanced crystalloids provide a beneficial effect over normal saline on the composite outcome of persistent renal dysfunction, new RRT and mortality at day 30.
Commentary
Unbalanced crystalloids, especially normal saline, are the most commonly used IVF for resuscitation in the critically ill. Given the data suggesting risk of kidney injury, acidosis, and effect on mortality with the use of normal saline, this study aimed to evaluate balanced crystalloids in comparison with normal saline in the ICU population.
Interest in the consequences of hyperchloremia and metabolic acidosis from supra-physiologic chloride concentrations in normal saline first stemmed from data in preclinical models, which demonstrated that chloride-induced renal inflammation adversely impacted renal function and mortality [1,2]. While in theory “balanced” solutions carry dual benefits of both an electrolyte composition that closely mirrors plasma and the presence of buffers which improve acid-base milieu, the exact repercussions on patient-centered outcomes with use of one over the other remain unknown.
An exploratory randomized control trial (RCT) evaluating biochemistry up to day 4 in normal saline vs Plasma-Lyte groups in 70 critically ill adults showed significantly higher hyperchloremia with normal saline but no difference in AKI rates between the two groups [3]. A pilot study evaluating “chloride-restrictive vs chloride liberal” strategies in 760 ICU patients involved use of Hartmann’s solution and Plasma-Lyte in place of saline for a 6-month period except in case of specific contraindications such as traumatic brain injury. Results indicated that incidence of AKI and use of RRT significantly reduced by limiting chloride. No changes in mortality, ICU length of stay or RRT on discharge were noted [4].A large retrospective study in over 53,000 ICU patients admitted with sepsis and on vasopressors across 360 US hospitals showed that balanced fluids were associated with lower in-hospital mortality especially when higher volume of IVFs were infused. While no differences were seen in terms of AKI rates, lower risk of CKD was noted in balanced fluid groups [5].
In post-surgical populations, an observational study analyzing saline vs balanced fluids over 30,000 patients showed significantly lower mortality, renal failure, acidosis investigation/intervention rates with balanced fluids [6].Additionally, a meta-analysis assessing outcomes in peri-operative and ICU patients based on whether they received high or low chloride containing fluids was performed on over 6000 patients across 21 studies. No association with mortality was found. However, statistically significant correlations were noted between high chloride fluids and hyperchloremia, metabolic acidosis, AKI, mechanical ventilation times and blood transfusion volumes [7].
In 2015, a large RCT involving ICUs in New Zealand evaluated balanced crystalloids vs normal saline and rates of AKI in a double-blind, cluster-randomized, double-crossover trial (the SPLIT study). 2278 patients from medical and surgical ICUs were enrolled. Patients already receiving RRT were excluded. No significant difference in incidence of AKI (defined as a two-fold rise or a 0.5mg/dL increase in creatinine), new RRT or mortality was detected between the two groups [8].
Given the ambiguity and lack of consensus on outcomes, the current SMART study addresses an important gap in knowledge. Its large sample size makes it well powered, geared to detect small signals in outcomes. Inclusion of medical, surgical, and neurologic ICUs helps diversify applicability. Being a pragmatic, intention-to-treat RCT, the study design mirrors real-world clinical practice.
In terms of patient acuity, less than a third of the patients were intubated or on vasopressors. Predicted mortality rates were 9%. In addition, median volume infused was around 1 L. Given the investigators’ conclusions that the MAKE30 outcome signals were more pronounced with larger volumes of infusions, this brings into question whether more dramatic signals could have been appreciated in each of the 3 components of the primary outcome had the study population been a higher acuity group requiring larger infusion volumes.
While the composite MAKE30 outcome reflects a sense of an overarching benefit with balanced crystalloids, there was no statistically significant improvement noted in each primary component. This questions the rationale for combining the components of the MAKE30 outcome as well as how generalizable the results are. Overall, as is the case with many studies that evaluate a composite outcome, this raises concern about overestimation of the intervention’s true impact.
The study was un-blinded, raising concern for bias, and it was a single-center trial, which raises questions regarding generalizability. Un-blinding may have played a role in influencing decisions to initiate RRT earlier in the saline group. The extent to which this impacted RRT rates (one of the MAKE30 outcomes), remains unclear. Furthermore, approximately 5% of the participants received unassigned fluids, and while this is in line with the pragmatic/intention-to-treat design, the clinical repercussions remain unclear. Hyperkalemia is an exclusion criterion for balanced fluids and it is unclear whether a proportion of patients presenting with AKI-associated hyperkalemia were restricted from receiving balanced fluids. In addition, very few patients received Plasma-Lyte, confining the study’s conclusions to lactated Ringer’s alone.
Despite these pitfalls, the study addresses an extremely relevant clinical question. It urges clinicians to tailor fluid choices on a case-by-case basis and pay attention to the long-term implications of daily biochemical changes on renal outcomes, particularly in large volume resuscitation scenarios. There is a negligible cost difference between lactated Ringer’s and saline, making use of a balanced fluid economically feasible. The number needed to treat for MAKE30 based on this study is 94 patients, and changes in clinical practice extrapolated to ICUs nationwide could have an impact on renal outcomes from an epidemiologic point of view without risking financial burden at an institution level.
Applications for Clinical Practice
Overall, this trial clarifies an important gap in knowledge regarding fluid choice in the care of critically ill adults. The composite outcome of death, persistent renal dysfunction, and new RRT was significantly lower when a balanced fluid was used in comparison with saline. The ease of implementation, low financial impact, and epidemiologically significant renal outcomes supports a consideration for change in practice. However, clinicians should evaluate implementation on a case-by-case basis. More studies evaluating MAKE30 outcomes individually in specific diagnoses and clinical contexts are necessary. Moreover, data on long-term MAKE outcomes would help characterize long-term public health implications of 30-day effects.
—Divya Padmanabhan Menon, MD, Christopher L. Trautman, MD, and Neal M. Patel, MD, Mayo Clinic, Jacksonville, FL
1. Zhou F, Peng ZY, Bishop JV, et al. Effects of fluid resuscitation with 0.9% saline versus a balanced electrolyte solution on acute kidney injury in a rat model of sepsis. Crit Care Med 2014;42:e270–8.
2.
3. Verma B, Luethi N, Cioccari L, et al. A multicentre randomised controlled pilot study of fluid resuscitation with saline or Plasma-Lyte 148 in critically ill patients. Crit Care Resusc 2016;18:205–12.
4. Yunos NM, Bellomo R, Hegarty C, et al. Association between a chloride-liberal vs chloride-restrictive intravenous fluid administration strategy and kidney injury in critically ill adults. JAMA 2012;308:1566–72.
5. Raghunathan K, Shaw A, Nathanson B, et al. Association between the choice of IV crystalloid and in-hospital mortality among critically ill adults with sepsis. Crit Care Med 2014;42:1585–91.
6. Shaw AD, Bagshaw SM, Goldstein SL, et al. Major complications, mortality, and resource utilization after open abdominal surgery: 0.9% saline compared to Plasma-Lyte. Ann Surg 2012;255:821–9.
7. Krajewski ML, Raghunathan K, Paluszkiewicz SM, et al. Meta-analysis of high- versus low-chloride content in perioperative and critical care fluid resuscitation. Br J Surg 2015 102:24–36.
8. Young P, Bailey M, Beasley R, et al., Effect of a buffered crystalloid solution vs saline on acute kidney injury among patients in the intensive care unit: The SPLIT randomized clinical trial. JAMA 2015;314:1701–10.
Study Overview
Objective. To evaluate balanced crystalloids in comparison with normal saline in the intensive care unit (ICU) population.
Design. Pragmatic, un-blinded, cluster-randomized, multiple-crossover clinical trial (the SMART study).
Setting and participants. The study evaluated critically ill adults > 18 years of age, admitted and readmitted into 5 ICUs, both medical and surgical, from June 2015 to April 2017. 15,802 patients were enrolled, powered to detect a 1.9% percentage point difference in primary outcome. ICUs were randomized to use either balanced crystalloids (lactated Ringer’s [LR] or Plasma-Lyte A, depending on the provider’s preference) or normal saline during alternate calendar months. Relative contraindications to use of balanced crystalloids included traumatic brain injury and hyperkalemia. The admitting emergency rooms and operating rooms coordinated intravenous fluid (IVF) choice with their respective ICUs. An intention-to-treat analysis was conducted. In addition to primary and secondary outcome analyses, subgroup analyses based on factors including total IVF volume to day 30, vasopressor use, predicted in-hospital mortality, sepsis or traumatic brain injury diagnoses, ICU type, source of admission, and kidney function at baseline were also done. Furthermore, sensitivity analyses taking into account the total volume of crystalloid, crossover and excluding readmissions were performed.
Main outcome measures. The primary outcome was the proportion of patients that met at least 1 of the 3 criteria for a Major Adverse Kidney Event at day 30 (MAKE30) or discharge, whichever occurred earlier. MAKE30 is a composite measure consisting of death, persistent renal dysfunction (creatinine ≥ 200% baseline), or new renal replacement therapy (RRT). Patients previously on RRT were included for mortality analysis alone. In addition, secondary clinical outcomes including in-hospital mortality (prior to ICU discharge, at day 30 and day 60), ventilator-free days, vasopressor-free days, ICU-free days, days alive and RRT-free days in the first 28 days were assessed. Secondary renal outcomes such as persistent renal dysfunction, acute kidney injury (AKI) ≥ stage 2 (per Kidney Disease: Improving Global Outcomes Criteria {KDIGO}) criteria, new RRT, highest creatinine during hospitalization, creatinine at discharge and highest change in creatinine during hospitalization were also evaluated.
Results. 7942 patients were randomized to the balanced crystalloid group and 7860 to the saline group. Median age for both groups was 58 years and 57.6% patients were male. In terms of patient acuity, approximately 34% patients were on mechanical ventilation, 26% were on vasopressors, and around 14% carried a diagnosis of sepsis. At time of presentation, 17% had chronic kidney disease (CKD) ≥ stage 3 and approximately 5% were on RRT. Around 8% came in with AKI ≥ stage 2. Baseline creatinine in the both groups was 0.89 (interquartile range [IQR] 0.74–1.1). Median volumes of balanced crystalloid and saline administered was 1L (IQR 0–3.2L) and 1.02L (IQR 0–3.5L) respectively. Less than 5% in both groups received unassigned fluids. Predicted risk of in-hospital death for both groups was approximately 9%.
Significantly higher number of patients had plasma chloride ≥ 110 mmol/L and bicarbonate ≤ 20 mmol/L in the saline group (P < 0.001). In terms of primary outcome, MAKE30 rates in the balanced crystalloid vs saline groups were 14.3 vs 15.4 (marginal odds ratio {OR} 0.91, 95% confidence interval {CI} 0.84–0.99, P = 0.04) with similar results in the pre-specified sensitivity analyses. This difference was more prominent with larger volumes of infused fluids. All 3 components of composite primary outcome were improved in the crystalloid group, although none of the 3 individually achieved statistical significance.
Overall, mortality before discharge and within 30 days of admission in the balanced crystalloid group was 10.3% compared to 11.1% in the saline group (OR 0.9, CI 0.8–1.01, P = 0.06). In-hospital death before ICU discharge and at 60 days also mirrored this trend, although they did not achieve statistical significance either. Of note, in septic patients, 30-day mortality rates were 25.2 vs 29.4 in the balanced crystalloid and saline groups respectively (OR 0.8, 95% CI 0.67–0.97, P = 0.02).
With regard to renal outcomes in the balanced crystalloid vs normal saline groups, results were as follows: new RRT {2.5 vs 2.9%, P = 0.08}, new AKI development 10.7% vs 11.5% (OR 0.9, P = 0.09). In patients with a history of previous RRT or presenting with an AKI, crystalloids appeared to provide better MAKE30 outcomes, although not achieving statistical significance.
Conclusion. In the critically ill population, balanced crystalloids provide a beneficial effect over normal saline on the composite outcome of persistent renal dysfunction, new RRT and mortality at day 30.
Commentary
Unbalanced crystalloids, especially normal saline, are the most commonly used IVF for resuscitation in the critically ill. Given the data suggesting risk of kidney injury, acidosis, and effect on mortality with the use of normal saline, this study aimed to evaluate balanced crystalloids in comparison with normal saline in the ICU population.
Interest in the consequences of hyperchloremia and metabolic acidosis from supra-physiologic chloride concentrations in normal saline first stemmed from data in preclinical models, which demonstrated that chloride-induced renal inflammation adversely impacted renal function and mortality [1,2]. While in theory “balanced” solutions carry dual benefits of both an electrolyte composition that closely mirrors plasma and the presence of buffers which improve acid-base milieu, the exact repercussions on patient-centered outcomes with use of one over the other remain unknown.
An exploratory randomized control trial (RCT) evaluating biochemistry up to day 4 in normal saline vs Plasma-Lyte groups in 70 critically ill adults showed significantly higher hyperchloremia with normal saline but no difference in AKI rates between the two groups [3]. A pilot study evaluating “chloride-restrictive vs chloride liberal” strategies in 760 ICU patients involved use of Hartmann’s solution and Plasma-Lyte in place of saline for a 6-month period except in case of specific contraindications such as traumatic brain injury. Results indicated that incidence of AKI and use of RRT significantly reduced by limiting chloride. No changes in mortality, ICU length of stay or RRT on discharge were noted [4].A large retrospective study in over 53,000 ICU patients admitted with sepsis and on vasopressors across 360 US hospitals showed that balanced fluids were associated with lower in-hospital mortality especially when higher volume of IVFs were infused. While no differences were seen in terms of AKI rates, lower risk of CKD was noted in balanced fluid groups [5].
In post-surgical populations, an observational study analyzing saline vs balanced fluids over 30,000 patients showed significantly lower mortality, renal failure, acidosis investigation/intervention rates with balanced fluids [6].Additionally, a meta-analysis assessing outcomes in peri-operative and ICU patients based on whether they received high or low chloride containing fluids was performed on over 6000 patients across 21 studies. No association with mortality was found. However, statistically significant correlations were noted between high chloride fluids and hyperchloremia, metabolic acidosis, AKI, mechanical ventilation times and blood transfusion volumes [7].
In 2015, a large RCT involving ICUs in New Zealand evaluated balanced crystalloids vs normal saline and rates of AKI in a double-blind, cluster-randomized, double-crossover trial (the SPLIT study). 2278 patients from medical and surgical ICUs were enrolled. Patients already receiving RRT were excluded. No significant difference in incidence of AKI (defined as a two-fold rise or a 0.5mg/dL increase in creatinine), new RRT or mortality was detected between the two groups [8].
Given the ambiguity and lack of consensus on outcomes, the current SMART study addresses an important gap in knowledge. Its large sample size makes it well powered, geared to detect small signals in outcomes. Inclusion of medical, surgical, and neurologic ICUs helps diversify applicability. Being a pragmatic, intention-to-treat RCT, the study design mirrors real-world clinical practice.
In terms of patient acuity, less than a third of the patients were intubated or on vasopressors. Predicted mortality rates were 9%. In addition, median volume infused was around 1 L. Given the investigators’ conclusions that the MAKE30 outcome signals were more pronounced with larger volumes of infusions, this brings into question whether more dramatic signals could have been appreciated in each of the 3 components of the primary outcome had the study population been a higher acuity group requiring larger infusion volumes.
While the composite MAKE30 outcome reflects a sense of an overarching benefit with balanced crystalloids, there was no statistically significant improvement noted in each primary component. This questions the rationale for combining the components of the MAKE30 outcome as well as how generalizable the results are. Overall, as is the case with many studies that evaluate a composite outcome, this raises concern about overestimation of the intervention’s true impact.
The study was un-blinded, raising concern for bias, and it was a single-center trial, which raises questions regarding generalizability. Un-blinding may have played a role in influencing decisions to initiate RRT earlier in the saline group. The extent to which this impacted RRT rates (one of the MAKE30 outcomes), remains unclear. Furthermore, approximately 5% of the participants received unassigned fluids, and while this is in line with the pragmatic/intention-to-treat design, the clinical repercussions remain unclear. Hyperkalemia is an exclusion criterion for balanced fluids and it is unclear whether a proportion of patients presenting with AKI-associated hyperkalemia were restricted from receiving balanced fluids. In addition, very few patients received Plasma-Lyte, confining the study’s conclusions to lactated Ringer’s alone.
Despite these pitfalls, the study addresses an extremely relevant clinical question. It urges clinicians to tailor fluid choices on a case-by-case basis and pay attention to the long-term implications of daily biochemical changes on renal outcomes, particularly in large volume resuscitation scenarios. There is a negligible cost difference between lactated Ringer’s and saline, making use of a balanced fluid economically feasible. The number needed to treat for MAKE30 based on this study is 94 patients, and changes in clinical practice extrapolated to ICUs nationwide could have an impact on renal outcomes from an epidemiologic point of view without risking financial burden at an institution level.
Applications for Clinical Practice
Overall, this trial clarifies an important gap in knowledge regarding fluid choice in the care of critically ill adults. The composite outcome of death, persistent renal dysfunction, and new RRT was significantly lower when a balanced fluid was used in comparison with saline. The ease of implementation, low financial impact, and epidemiologically significant renal outcomes supports a consideration for change in practice. However, clinicians should evaluate implementation on a case-by-case basis. More studies evaluating MAKE30 outcomes individually in specific diagnoses and clinical contexts are necessary. Moreover, data on long-term MAKE outcomes would help characterize long-term public health implications of 30-day effects.
—Divya Padmanabhan Menon, MD, Christopher L. Trautman, MD, and Neal M. Patel, MD, Mayo Clinic, Jacksonville, FL
1. Zhou F, Peng ZY, Bishop JV, et al. Effects of fluid resuscitation with 0.9% saline versus a balanced electrolyte solution on acute kidney injury in a rat model of sepsis. Crit Care Med 2014;42:e270–8.
2.
3. Verma B, Luethi N, Cioccari L, et al. A multicentre randomised controlled pilot study of fluid resuscitation with saline or Plasma-Lyte 148 in critically ill patients. Crit Care Resusc 2016;18:205–12.
4. Yunos NM, Bellomo R, Hegarty C, et al. Association between a chloride-liberal vs chloride-restrictive intravenous fluid administration strategy and kidney injury in critically ill adults. JAMA 2012;308:1566–72.
5. Raghunathan K, Shaw A, Nathanson B, et al. Association between the choice of IV crystalloid and in-hospital mortality among critically ill adults with sepsis. Crit Care Med 2014;42:1585–91.
6. Shaw AD, Bagshaw SM, Goldstein SL, et al. Major complications, mortality, and resource utilization after open abdominal surgery: 0.9% saline compared to Plasma-Lyte. Ann Surg 2012;255:821–9.
7. Krajewski ML, Raghunathan K, Paluszkiewicz SM, et al. Meta-analysis of high- versus low-chloride content in perioperative and critical care fluid resuscitation. Br J Surg 2015 102:24–36.
8. Young P, Bailey M, Beasley R, et al., Effect of a buffered crystalloid solution vs saline on acute kidney injury among patients in the intensive care unit: The SPLIT randomized clinical trial. JAMA 2015;314:1701–10.
Non-Culprit Lesion PCI Strategies in Patients with Acute Myocardial Infarction and Cardiogenic Shock Revisited
Study Overview
Objective. To determine the prognostic impact of multivessel percutaneous coronary intervention (PCI) in patients with ST-segment elevation myocardial infarction (STEMI) multivessel disease presenting with cardiogenic shock.
Design. Retrospective study using the nationwide, multicenter, prospective KAMIR-NIH (Korea Acute Myocardial Infarction-National Institutes of Health) registry.
Setting and participants. Among the 13,104 patients enrolled in the KAMIR-NIH registry, 659 patients with STEMI with multivessel disease presenting with cardiogenic shock who underwent primary PCI were selected.
Main outcome measures. The primary outcome was all-cause death at 1 year. Secondary outcomes included patient-oriented composite outcome (composite of all-cause death, any myocardial infarction, and any repeat revascularization) and its individual components.
Main results. A total of 260 patients were treated with multivessel PCI and 399 patients were treated with infarct-related artery (IRA) PCI only. The risk of all-cause death was significantly lower in the multivessel PCI group (21.3% vs 31.7%; hazard ratio [HR] 0.59, 95% CI 0.43–0.82, P = 0.001). Non-IRA repeat revascularization was significantly lower in the multivessel group (6.7% vs 8.2%; HR 0.39, 95% CI 0.17–0.90, P = 0.028). In multivariate model, multivessel PCI was independently associated with reduced risk of 1-year all-cause death and patient-oriented composite outcome.
Conclusion. Among patients with STEMI and multivessel disease with cardiogenic shock, multivessel PCI was associated with significantly lower risk of all-cause death and non-IRA repeat revascularization.
Commentary
Historically, non-culprit vessel revascularization in the setting of acute myocardial infarction (AMI) was not routinely performed. However, recent trials have shown the benefit of non-culprit vessel revascularization in patients with hemodynamically stable AMI [1–3]. The result of these trials have led to upgrade in U.S. guideline recommendations for non-infarct-related artery PCI in hemodynamically stable patients presenting with AMI to Class IIb from Class III [4]. Whether these findings can be extended to hemodynamically unstable (cardiogenic shock) patients is controversial. Recently, results of a well-designed randomized control trial (CULPRIT-SHOCK) suggested worse outcome with immediate multivessel PCI in this population [5]. The composite endpoint of death and renal replacement therapy at 30 days was higher in the multivessel PCI at the time of primary PCI group compared to initial culprit lesion only group (55.9% vs 45.9%, P = 0.01). The composite endpoint was mainly driven by death (51.6% vs 43.3%, P = 0.03), and the rate of renal replacement therapy was numerically higher in the mutivessel PCI group (16.4% vs 11.6%, P = 0.07).
Lee et al investigated a similar clinical question using the nationwide, multicenter, prospective KAMIR-NIH registry data [6]. In this study, the primary endpoint of all cause death occurred in 53 of the 260 patients (21.3%) in the multivessel PCI group and 126 of the 399 patients (31.7%) in the IRA-only PCI group (relative risk [RR] 0.59, 95% CI 0.43–0.82, P = 0.001). Similarly, the multivessel PCI group had lower non-IRA repeat revascularization (RR 0.39, 95% CI 0.17-0.90, P = 0.028) and lower patient-oriented composite outcome (all-cause death, any myocardial infarction, or any repeat revascularization) (RR 0.58, 95% CI 0.44–0.77, P < 0.001). These results remained similar after multivariate adjustment, propensity matching, and inverse probability weighted analysis.
The discrepancy of the results of the KAMIR study compared to CULPRIT-SHOCK is likely related to the difference in the design of the two studies. First, CUPRIT-SHOCK compared multivessel revascularization during index primary PCI to culprit-only revascularization strategy with staged revascularization if necessary. There were 9.4% randomized to multivessel PCI who crossed over to IRA-only PCI and 17.4% randomized to IRA-only PCI who crossed over to multivessel PCI during the index hospitalization. In contrast, the KAMIR registry compared patients who underwent IRA-only PCI to multivessel PCI, which included those who had immediate revascularization during the primary PCI and those who had staged revascularization during the index hospitalization. Therefore, multivessel PCI is defined very differently in both studies and cannot be considered equivalent.
Second, CULPRIT-SHOCK was a prospective randomized control study and KAMIR was an observational study analyzing data from a prospectively collected large database. Although multiple statistical adjustments were performed, this observational nature of the study is subject to selection bias and other unmeasured biases such as frailty assessment.
Third, the timing of the revascularization was different between two studies. In CULPRIT-SHOCK, immediate revascularization of non-IRA was achieved in 90.6% of patients in the multivessel PCI group. On the other hand, only 60.4% of patients of multivessel PCI group in KAMIR study underwent immediate revascularization of the non-IRA and 39.6 % of patients underwent staged procedure. This leads to significant survival bias, since these 39.6% of patients survived the initial event to be able to undergo the staged procedure. Patients who had planned staged intervention but could not survive were included in the IRA-only PCI group.
Fourth, there may be difference in the severity of the patient population included in the analysis. In the CULPRIT-SHOCK trial, a significant non-IRA was defined as > 70% stenosis, and all chronic total occlusions (CTO) were attempted in the multivessel PCI group according to trial protocol. In CULPRIT-SHOCK, 23% of patient had one or more CTO lesions. In the KAMIR registry, a significant non-IRA was defined as > 50% stenosis of the non-culprit vessel and CTO vessels were not accounted for. Although CTO intervention improves angina and ejection fraction [7,8], whether CTO intervention has mortality benefit needs further investigation. In a recent EXPLORE trial, the feasibility and safety of intervention of chronic total occlusion in non-infarct-related artery in STEMI population was established [8]. However, only hemodynamically stable patients were included in the study and all CTO interventions were performed in staged fashion (5 ± 2 days after index procedure) [8]. There is a possibility of attempting CTO PCI in this acute setting caused more harm than benefit.
Finally, in order to be enrolled in the CULPRIT-SHOCK trial, patients needed to meet stringent criteria for cardiogenic shock. In KAMIR study, this data was retrospectively determined and individual components used to define cardiogenic shock were not available. This difference may have led to inclusion of more stable patients as evidenced by lower mortality rate in KAMIR study compared to CULPRIT-SHOCK (51.6% mortality for multivessel PCI in CULPRIT-SHOCK and 21.3% mortality for multivessel PCI patients in KAMIR study). CULPRIT-SHOCK trial had a high rate of mechanical ventilation (~80%), requirement of catecholamine support (~90%), and long ICU stays (median 5 days). This information is not reported in the KAMIR study.
Considering above differences in the study design, the evidence level for CULPRIT-SHOCK appears to be stronger compared to the KAMIR study, which should be considered as hypothesis-generating as all other observational studies. However, the KAMIR study is still an important study suggesting possible benefit of multivessel PCI in patients presenting with ST elevation myocardial infarction and cardiogenic shock. This leads us to an answered question whether staged multivessel intervention or less aggressive multivessel intervention (not attempting CTO) is a better option in this population.
Applications for Clinical Practice
In patients presenting with cardiogenic shock and acute myocardial infarction, culprit lesion-only intervention and staged intervention if necessary, seems to be a better strategy. However, there may be benefit in multivessel intervention in this population, depending on the timing and revascularization strategy. Further studies are needed.
—Taishi Hirai, MD, and John E.A. Blair, MD, University of Chicago Medical Center, Chicago, IL
1. Wald DS, Morris JK, Wald NJ, et al. Randomized trial of preventive angioplasty in myocardial infarction. N Engl J Med 2013;369:1115–23.
2. Gershlick AH, Khan JN, Kelly DJ, et al. Randomized trial of complete versus lesion-only revascularization in patients undergoing primary percutaneous coronary intervention for STEMI and multivessel disease: the CvLPRIT trial. J Am Coll Cardiol 2015;65:963–72.
3. Engstrom T, Kelbaek H, Helqvist S, et al. Complete revascularisation versus treatment of the culprit lesion only in patients with ST-segment elevation myocardial infarction and multivessel disease (DANAMI-3-PRIMULTI): an open-label, randomised controlled trial. Lancet 2015;386:665–71.
4. Levine GN, Bates ER, Blankenship JC, et al. 2015 ACC/AHA/SCAI focused update on primary percutaneous coronary intervention for patients with st-elevation myocardial infarction: an update of the 2011 ACCF/AHA/SCAI guideline for percutaneous coronary intervention and the 2013 ACCF/AHA guideline for the management of ST-elevation myocardial infarction. J Am Coll Cardiol 2016;67:1235–50.
5. Thiele H, Akin I, Sandri M, et al. PCI strategies in patients with acute myocardial infarction and cardiogenic shock. N Engl J Med 2017;377:2419–32.
6. Lee JM, Rhee TM, Hahn JY, et al. Multivessel percutaneous coronary intervention in patients with st-segment elevation myocardial infarction with cardiogenic shock. J Am Coll Cardiol 2018;71:844–56.
7. Sapontis J, Salisbury AC, Yeh RW, et al. Early procedural and health status outcomes after chronic total occlusion angioplasty: a report from the OPEN-CTO Registry (Outcomes, Patient Health Status, and Efficiency in Chronic Total Occlusion Hybrid Procedures). JACC Cardiovasc Interv 2017;10:1523–34.
8. Henriques JP, Hoebers LP, Ramunddal T, et al. Percutaneous intervention for concurrent chronic total occlusions in patients with STEMI: the EXPLORE trial. J Am Coll Cardiol 2016;68:1622–32.
Study Overview
Objective. To determine the prognostic impact of multivessel percutaneous coronary intervention (PCI) in patients with ST-segment elevation myocardial infarction (STEMI) multivessel disease presenting with cardiogenic shock.
Design. Retrospective study using the nationwide, multicenter, prospective KAMIR-NIH (Korea Acute Myocardial Infarction-National Institutes of Health) registry.
Setting and participants. Among the 13,104 patients enrolled in the KAMIR-NIH registry, 659 patients with STEMI with multivessel disease presenting with cardiogenic shock who underwent primary PCI were selected.
Main outcome measures. The primary outcome was all-cause death at 1 year. Secondary outcomes included patient-oriented composite outcome (composite of all-cause death, any myocardial infarction, and any repeat revascularization) and its individual components.
Main results. A total of 260 patients were treated with multivessel PCI and 399 patients were treated with infarct-related artery (IRA) PCI only. The risk of all-cause death was significantly lower in the multivessel PCI group (21.3% vs 31.7%; hazard ratio [HR] 0.59, 95% CI 0.43–0.82, P = 0.001). Non-IRA repeat revascularization was significantly lower in the multivessel group (6.7% vs 8.2%; HR 0.39, 95% CI 0.17–0.90, P = 0.028). In multivariate model, multivessel PCI was independently associated with reduced risk of 1-year all-cause death and patient-oriented composite outcome.
Conclusion. Among patients with STEMI and multivessel disease with cardiogenic shock, multivessel PCI was associated with significantly lower risk of all-cause death and non-IRA repeat revascularization.
Commentary
Historically, non-culprit vessel revascularization in the setting of acute myocardial infarction (AMI) was not routinely performed. However, recent trials have shown the benefit of non-culprit vessel revascularization in patients with hemodynamically stable AMI [1–3]. The result of these trials have led to upgrade in U.S. guideline recommendations for non-infarct-related artery PCI in hemodynamically stable patients presenting with AMI to Class IIb from Class III [4]. Whether these findings can be extended to hemodynamically unstable (cardiogenic shock) patients is controversial. Recently, results of a well-designed randomized control trial (CULPRIT-SHOCK) suggested worse outcome with immediate multivessel PCI in this population [5]. The composite endpoint of death and renal replacement therapy at 30 days was higher in the multivessel PCI at the time of primary PCI group compared to initial culprit lesion only group (55.9% vs 45.9%, P = 0.01). The composite endpoint was mainly driven by death (51.6% vs 43.3%, P = 0.03), and the rate of renal replacement therapy was numerically higher in the mutivessel PCI group (16.4% vs 11.6%, P = 0.07).
Lee et al investigated a similar clinical question using the nationwide, multicenter, prospective KAMIR-NIH registry data [6]. In this study, the primary endpoint of all cause death occurred in 53 of the 260 patients (21.3%) in the multivessel PCI group and 126 of the 399 patients (31.7%) in the IRA-only PCI group (relative risk [RR] 0.59, 95% CI 0.43–0.82, P = 0.001). Similarly, the multivessel PCI group had lower non-IRA repeat revascularization (RR 0.39, 95% CI 0.17-0.90, P = 0.028) and lower patient-oriented composite outcome (all-cause death, any myocardial infarction, or any repeat revascularization) (RR 0.58, 95% CI 0.44–0.77, P < 0.001). These results remained similar after multivariate adjustment, propensity matching, and inverse probability weighted analysis.
The discrepancy of the results of the KAMIR study compared to CULPRIT-SHOCK is likely related to the difference in the design of the two studies. First, CUPRIT-SHOCK compared multivessel revascularization during index primary PCI to culprit-only revascularization strategy with staged revascularization if necessary. There were 9.4% randomized to multivessel PCI who crossed over to IRA-only PCI and 17.4% randomized to IRA-only PCI who crossed over to multivessel PCI during the index hospitalization. In contrast, the KAMIR registry compared patients who underwent IRA-only PCI to multivessel PCI, which included those who had immediate revascularization during the primary PCI and those who had staged revascularization during the index hospitalization. Therefore, multivessel PCI is defined very differently in both studies and cannot be considered equivalent.
Second, CULPRIT-SHOCK was a prospective randomized control study and KAMIR was an observational study analyzing data from a prospectively collected large database. Although multiple statistical adjustments were performed, this observational nature of the study is subject to selection bias and other unmeasured biases such as frailty assessment.
Third, the timing of the revascularization was different between two studies. In CULPRIT-SHOCK, immediate revascularization of non-IRA was achieved in 90.6% of patients in the multivessel PCI group. On the other hand, only 60.4% of patients of multivessel PCI group in KAMIR study underwent immediate revascularization of the non-IRA and 39.6 % of patients underwent staged procedure. This leads to significant survival bias, since these 39.6% of patients survived the initial event to be able to undergo the staged procedure. Patients who had planned staged intervention but could not survive were included in the IRA-only PCI group.
Fourth, there may be difference in the severity of the patient population included in the analysis. In the CULPRIT-SHOCK trial, a significant non-IRA was defined as > 70% stenosis, and all chronic total occlusions (CTO) were attempted in the multivessel PCI group according to trial protocol. In CULPRIT-SHOCK, 23% of patient had one or more CTO lesions. In the KAMIR registry, a significant non-IRA was defined as > 50% stenosis of the non-culprit vessel and CTO vessels were not accounted for. Although CTO intervention improves angina and ejection fraction [7,8], whether CTO intervention has mortality benefit needs further investigation. In a recent EXPLORE trial, the feasibility and safety of intervention of chronic total occlusion in non-infarct-related artery in STEMI population was established [8]. However, only hemodynamically stable patients were included in the study and all CTO interventions were performed in staged fashion (5 ± 2 days after index procedure) [8]. There is a possibility of attempting CTO PCI in this acute setting caused more harm than benefit.
Finally, in order to be enrolled in the CULPRIT-SHOCK trial, patients needed to meet stringent criteria for cardiogenic shock. In KAMIR study, this data was retrospectively determined and individual components used to define cardiogenic shock were not available. This difference may have led to inclusion of more stable patients as evidenced by lower mortality rate in KAMIR study compared to CULPRIT-SHOCK (51.6% mortality for multivessel PCI in CULPRIT-SHOCK and 21.3% mortality for multivessel PCI patients in KAMIR study). CULPRIT-SHOCK trial had a high rate of mechanical ventilation (~80%), requirement of catecholamine support (~90%), and long ICU stays (median 5 days). This information is not reported in the KAMIR study.
Considering above differences in the study design, the evidence level for CULPRIT-SHOCK appears to be stronger compared to the KAMIR study, which should be considered as hypothesis-generating as all other observational studies. However, the KAMIR study is still an important study suggesting possible benefit of multivessel PCI in patients presenting with ST elevation myocardial infarction and cardiogenic shock. This leads us to an answered question whether staged multivessel intervention or less aggressive multivessel intervention (not attempting CTO) is a better option in this population.
Applications for Clinical Practice
In patients presenting with cardiogenic shock and acute myocardial infarction, culprit lesion-only intervention and staged intervention if necessary, seems to be a better strategy. However, there may be benefit in multivessel intervention in this population, depending on the timing and revascularization strategy. Further studies are needed.
—Taishi Hirai, MD, and John E.A. Blair, MD, University of Chicago Medical Center, Chicago, IL
1. Wald DS, Morris JK, Wald NJ, et al. Randomized trial of preventive angioplasty in myocardial infarction. N Engl J Med 2013;369:1115–23.
2. Gershlick AH, Khan JN, Kelly DJ, et al. Randomized trial of complete versus lesion-only revascularization in patients undergoing primary percutaneous coronary intervention for STEMI and multivessel disease: the CvLPRIT trial. J Am Coll Cardiol 2015;65:963–72.
3. Engstrom T, Kelbaek H, Helqvist S, et al. Complete revascularisation versus treatment of the culprit lesion only in patients with ST-segment elevation myocardial infarction and multivessel disease (DANAMI-3-PRIMULTI): an open-label, randomised controlled trial. Lancet 2015;386:665–71.
4. Levine GN, Bates ER, Blankenship JC, et al. 2015 ACC/AHA/SCAI focused update on primary percutaneous coronary intervention for patients with st-elevation myocardial infarction: an update of the 2011 ACCF/AHA/SCAI guideline for percutaneous coronary intervention and the 2013 ACCF/AHA guideline for the management of ST-elevation myocardial infarction. J Am Coll Cardiol 2016;67:1235–50.
5. Thiele H, Akin I, Sandri M, et al. PCI strategies in patients with acute myocardial infarction and cardiogenic shock. N Engl J Med 2017;377:2419–32.
6. Lee JM, Rhee TM, Hahn JY, et al. Multivessel percutaneous coronary intervention in patients with st-segment elevation myocardial infarction with cardiogenic shock. J Am Coll Cardiol 2018;71:844–56.
7. Sapontis J, Salisbury AC, Yeh RW, et al. Early procedural and health status outcomes after chronic total occlusion angioplasty: a report from the OPEN-CTO Registry (Outcomes, Patient Health Status, and Efficiency in Chronic Total Occlusion Hybrid Procedures). JACC Cardiovasc Interv 2017;10:1523–34.
8. Henriques JP, Hoebers LP, Ramunddal T, et al. Percutaneous intervention for concurrent chronic total occlusions in patients with STEMI: the EXPLORE trial. J Am Coll Cardiol 2016;68:1622–32.
Does Oral Chemotherapy Venetoclax Combined with Rituximab Improve Survival in Patients with Relapsed or Refractory Chronic Lymphocytic Leukemia?
Study Overview
Objective. To assess whether a combination of venetoclax with rituximab, compared to standard chemoimmunotherapy (bendamustine with rituximab), improves outcomes in patients with relapsed or refractory chronic lymphocytic leukemia.
Design. International, randomized, open-label, phase 3 clinical trial (MURANO).
Setting and participants. Patients were eligilble for the study if they were 18 years of age or older with a diagnosis of relapsed or refractory chronic lymphocytic leukemia that required therapy, and had received 1 to 3 previous treatments (including at least 1 chemotherapy-containing regimen), had an Eastern Cooperative Oncology Group performance status score of 0 or 1, and had adequate bone marrow, renal, and hepatic function. Patients were randomly assigned either to receive venetoclax plus rituximab or bendamustine plus rituximab. Randomization was stratified by geographic region, responsiveness to previous therapy, as well as the presence or absence of chromosome 17p deletion.
Main outcome measures. Primary outcome was investigator-assessed progression-free survival, which was defined as the time from randomization to the first occurrence of disease progression or relapse or death from any cause, whichever occurs first. Secondary efficacy endpoints included independent review committee-assessed progression-free survival (stratified by chromosome 17p deletion), independent review committee-assessed overall response rate and complete response rate, overall survival, rates of clearance of minimal residual disease, the duration of response, event-free survival, and the time to the next treatment for chronic lymphocytic leukemia.
Main results. From 31 March 2014 to 23 September 2015, a total of 389 patients were enrolled at 109 sites in 20 countries and were randomly assigned to receive venetoclax plus rituximab (n = 194), or bendamustine plus rituximab (n = 195). Median age was 65 years (range, 22–85) and a majority of the patients (73.8%) were men. Overall, the demographic and disease characteristics of the 2 groups were similar at baseline.
The median follow-up period was 23.8 months (range, 0–37.4). The median investigator-assessed progression-free survival was significantly longer in the venetoclax-rituximab group (median progression-free survival not reached, 32 events of progression or death in 194 patients) and was 17 months in the bendamustine-rituximab group (114 events in 195 patients). The 2-year rate of investigator-assessed progression-free survival was 84.9% (95% confidence interval [CI] 79.1–90.5) in the venetoclax-rituximab group and 36.3% (95% CI 28.5–44.0) in the bendamustine-rituximab group (hazard ratio for progression or death, 0.17; 95% CI 0.11 to 0.25; P < 0.001). Benefit was consistent in favor of the venetoclax-rituximab group in all prespecified subgroup analyses, with or without chromosome 17p deletion.
The rate of overall survival was higher in the venetoclax-rituximab group than in the bendamustine-rituximab group, with 24-month rates of 91.9% and 86.6%, respectively (hazard ratio 0.58, 95% CI 0.25–0.90). Assessments of minimal residual disease were available for 366 of the 389 patients (94.1%). On the basis of peripheral-blood samples, the venetoclax-rituximab group had a higher minimal residual disease compared to the bendamustine-rituximab group (121 of 194 patients [62.4%] vs. 26 of 195 patients [13.3%]). In bone marrow aspirate, higher rates of clearance of minimal residual disease was seen in the venetoclax-rituximab group (53 of 194 patients [27.3%]) as compared to the bendamustine-rituximab group (3 of 195 patients [1.5%]).
In terms of safety, the most common adverse event reported was neutropenia (60.8% of the patients in the venetoclax-rituximab group vs. 44.1% of the patients in the bendamustine-rituximab group). This contributed to the overall higher grade 3 or 4 adverse event rate in the venetoclax-rituximab group (159 of the 194 patients, or 82.0%) as compared to the bendamustine-rituximab group (132 of 188 patients, or 70.2%). The incidence of serious adverse events, as well as adverse events that resulted in death were similar in the 2 groups.
Conclusion. For patients with relapsed or refractory chronic lymphocytic leukemia, venetoclax plus rituximab resulted in significantly higher rates of progression-free survival than standard therapy with bendamustine plus rituximab.
Commentary
Despite advances in treatment, chronic lymphocytic leukemia remains incurable with conventional chemoimmunotherapy regimens, and almost all patient relapse after initial therapy. Following relapse of the disease, the goal is to provide durable progression-free survival, which may extend overall survival [1]. In a subset of chronic lymphocytic leukemia patients with deletion or mutation of TP53 loci on chromosome 17p13, their disease responds especially poorly to conventional treatment and they have a median survival of less than 3 years from the time of initiating first treatment.
Apoptosis defines a process of programmed cell death with an extrinsic and intrinsic cellular apoptotic pathway. B-cell lymphoma/leukemia 2 (BCL-2) protein is a key regulator of the intrinsic apoptotic pathway and almost all chronic lymphocytic leukemia cells elude apoptosis through overexpression of BCL-2. Venetoclax is an orally administered, highly selective, potent BCL-2 inhibitor approved by the FDA in 2016 for the treatment of chronic lymphocytic leukemia patients with 17p deletion who have received at least 1 prior therapy [3]. There has been great interest in combining venetoclax with other active agents in chronic lymphocytic leukemia such as chemotherapy, monoclonal antibodies, and B-cell receptor inhibitors. The combination of venetoclax with the CD20 antibody rituximab was found to be able to overcome micro-environment-induced resistance to venetoclax [4].
In this analysis of the phase 3 MURANO trial of venetoclax plus rituximab in relapsed or refractory chronic lymphocytic leukemia by Seymour et al, the authors demonstrated a significantly higher rate of progression-free survival with venetoclax plus rituximab than with standard chemoimmunotherapy bendamustine plus rituximab. In addition, secondary efficacy measures, including the complete response rate, the overall response rate, and overall survival were also higher in the venetoclax plus rituximab than with bendamustine plus rituximab.
There are several limitations of this study. First, this study was terminated early at the time of the data review on 6 September 2017. The independent data monitoring committee recommended that the primary analysis be conducted at that time because the prespecified statistical boundaries for early stopping were crossed for progression-free survival on the basis of stratified log-rank tests. In a letter to the editor, Alexander et al questioned the validity of results when design stages are violated. In immunotherapy trials, progression-free survival curves often separated at later time, rather than as a constant process; this violates the key assumption of proportionality of hazard functions. When the study was terminated early, post hoc confirmatory analyses and evaluations of robustness of the statistical plan could be used; however, prespecified analyses are critical to reproducibility in trials that are meant to be practice-changing [5]. Second, complete response rates were lower when responses was assessed by the independent review committee than when assessed by the investigator. While this represented a certain degree of author bias, the overall results were similar and the effect of venetoclax plus rituximab remain significantly better than bendamustine plus rituximab.
Applications for Clinical Practice
The current study demonstrated that venetoclax is safe and effective when combining with rituximab in the treating of chronic lymphocytic leukemia patients with or without 17p deletion who have received at least one prior therapy. The most common serious adverse event was neutropenia, correlated with tumor lysis syndrome. Careful monitoring, slow dose ramp-up, and adequate prophylaxis can mitigate some of the adverse effects.
—Ka Ming Gordon Ngai, MD, MPH
1. Tam CS, Stilgenbauder S. How best to manage patients with chronic lymphocytic leuekmia with 17p deletion and/or TP53 mutation? Leuk Lymphoma 2015;56:587–93.
2. Zenz T, Eichhorst B, B
3. FDA news release. FDA approves new drug for chronic lymphocytic leukemia in patients with a specific chromosomal abnormality. 11 April 2016. Accessed 9 May 2018 at www.fda.gov/newsevents/newsroom/pressannouncements/ucm495253.htm.
4. Thijssen R, Slinger E, Weller K, et al. Resistance to ABT-199 induced by micro-environmental signals in chronic lymphocytic leukemia can be counteracted by CD20 antibodies or kinase inhibitors. Haematologica 2015;100:e302-e306.
5. Alexander BM, Schoenfeld JD, Trippa L. Hazards of hazard ratios—deviations from model assumptions in immunotherapy. N Engl J Med 2018;378:1158–9.
Study Overview
Objective. To assess whether a combination of venetoclax with rituximab, compared to standard chemoimmunotherapy (bendamustine with rituximab), improves outcomes in patients with relapsed or refractory chronic lymphocytic leukemia.
Design. International, randomized, open-label, phase 3 clinical trial (MURANO).
Setting and participants. Patients were eligilble for the study if they were 18 years of age or older with a diagnosis of relapsed or refractory chronic lymphocytic leukemia that required therapy, and had received 1 to 3 previous treatments (including at least 1 chemotherapy-containing regimen), had an Eastern Cooperative Oncology Group performance status score of 0 or 1, and had adequate bone marrow, renal, and hepatic function. Patients were randomly assigned either to receive venetoclax plus rituximab or bendamustine plus rituximab. Randomization was stratified by geographic region, responsiveness to previous therapy, as well as the presence or absence of chromosome 17p deletion.
Main outcome measures. Primary outcome was investigator-assessed progression-free survival, which was defined as the time from randomization to the first occurrence of disease progression or relapse or death from any cause, whichever occurs first. Secondary efficacy endpoints included independent review committee-assessed progression-free survival (stratified by chromosome 17p deletion), independent review committee-assessed overall response rate and complete response rate, overall survival, rates of clearance of minimal residual disease, the duration of response, event-free survival, and the time to the next treatment for chronic lymphocytic leukemia.
Main results. From 31 March 2014 to 23 September 2015, a total of 389 patients were enrolled at 109 sites in 20 countries and were randomly assigned to receive venetoclax plus rituximab (n = 194), or bendamustine plus rituximab (n = 195). Median age was 65 years (range, 22–85) and a majority of the patients (73.8%) were men. Overall, the demographic and disease characteristics of the 2 groups were similar at baseline.
The median follow-up period was 23.8 months (range, 0–37.4). The median investigator-assessed progression-free survival was significantly longer in the venetoclax-rituximab group (median progression-free survival not reached, 32 events of progression or death in 194 patients) and was 17 months in the bendamustine-rituximab group (114 events in 195 patients). The 2-year rate of investigator-assessed progression-free survival was 84.9% (95% confidence interval [CI] 79.1–90.5) in the venetoclax-rituximab group and 36.3% (95% CI 28.5–44.0) in the bendamustine-rituximab group (hazard ratio for progression or death, 0.17; 95% CI 0.11 to 0.25; P < 0.001). Benefit was consistent in favor of the venetoclax-rituximab group in all prespecified subgroup analyses, with or without chromosome 17p deletion.
The rate of overall survival was higher in the venetoclax-rituximab group than in the bendamustine-rituximab group, with 24-month rates of 91.9% and 86.6%, respectively (hazard ratio 0.58, 95% CI 0.25–0.90). Assessments of minimal residual disease were available for 366 of the 389 patients (94.1%). On the basis of peripheral-blood samples, the venetoclax-rituximab group had a higher minimal residual disease compared to the bendamustine-rituximab group (121 of 194 patients [62.4%] vs. 26 of 195 patients [13.3%]). In bone marrow aspirate, higher rates of clearance of minimal residual disease was seen in the venetoclax-rituximab group (53 of 194 patients [27.3%]) as compared to the bendamustine-rituximab group (3 of 195 patients [1.5%]).
In terms of safety, the most common adverse event reported was neutropenia (60.8% of the patients in the venetoclax-rituximab group vs. 44.1% of the patients in the bendamustine-rituximab group). This contributed to the overall higher grade 3 or 4 adverse event rate in the venetoclax-rituximab group (159 of the 194 patients, or 82.0%) as compared to the bendamustine-rituximab group (132 of 188 patients, or 70.2%). The incidence of serious adverse events, as well as adverse events that resulted in death were similar in the 2 groups.
Conclusion. For patients with relapsed or refractory chronic lymphocytic leukemia, venetoclax plus rituximab resulted in significantly higher rates of progression-free survival than standard therapy with bendamustine plus rituximab.
Commentary
Despite advances in treatment, chronic lymphocytic leukemia remains incurable with conventional chemoimmunotherapy regimens, and almost all patient relapse after initial therapy. Following relapse of the disease, the goal is to provide durable progression-free survival, which may extend overall survival [1]. In a subset of chronic lymphocytic leukemia patients with deletion or mutation of TP53 loci on chromosome 17p13, their disease responds especially poorly to conventional treatment and they have a median survival of less than 3 years from the time of initiating first treatment.
Apoptosis defines a process of programmed cell death with an extrinsic and intrinsic cellular apoptotic pathway. B-cell lymphoma/leukemia 2 (BCL-2) protein is a key regulator of the intrinsic apoptotic pathway and almost all chronic lymphocytic leukemia cells elude apoptosis through overexpression of BCL-2. Venetoclax is an orally administered, highly selective, potent BCL-2 inhibitor approved by the FDA in 2016 for the treatment of chronic lymphocytic leukemia patients with 17p deletion who have received at least 1 prior therapy [3]. There has been great interest in combining venetoclax with other active agents in chronic lymphocytic leukemia such as chemotherapy, monoclonal antibodies, and B-cell receptor inhibitors. The combination of venetoclax with the CD20 antibody rituximab was found to be able to overcome micro-environment-induced resistance to venetoclax [4].
In this analysis of the phase 3 MURANO trial of venetoclax plus rituximab in relapsed or refractory chronic lymphocytic leukemia by Seymour et al, the authors demonstrated a significantly higher rate of progression-free survival with venetoclax plus rituximab than with standard chemoimmunotherapy bendamustine plus rituximab. In addition, secondary efficacy measures, including the complete response rate, the overall response rate, and overall survival were also higher in the venetoclax plus rituximab than with bendamustine plus rituximab.
There are several limitations of this study. First, this study was terminated early at the time of the data review on 6 September 2017. The independent data monitoring committee recommended that the primary analysis be conducted at that time because the prespecified statistical boundaries for early stopping were crossed for progression-free survival on the basis of stratified log-rank tests. In a letter to the editor, Alexander et al questioned the validity of results when design stages are violated. In immunotherapy trials, progression-free survival curves often separated at later time, rather than as a constant process; this violates the key assumption of proportionality of hazard functions. When the study was terminated early, post hoc confirmatory analyses and evaluations of robustness of the statistical plan could be used; however, prespecified analyses are critical to reproducibility in trials that are meant to be practice-changing [5]. Second, complete response rates were lower when responses was assessed by the independent review committee than when assessed by the investigator. While this represented a certain degree of author bias, the overall results were similar and the effect of venetoclax plus rituximab remain significantly better than bendamustine plus rituximab.
Applications for Clinical Practice
The current study demonstrated that venetoclax is safe and effective when combining with rituximab in the treating of chronic lymphocytic leukemia patients with or without 17p deletion who have received at least one prior therapy. The most common serious adverse event was neutropenia, correlated with tumor lysis syndrome. Careful monitoring, slow dose ramp-up, and adequate prophylaxis can mitigate some of the adverse effects.
—Ka Ming Gordon Ngai, MD, MPH
1. Tam CS, Stilgenbauder S. How best to manage patients with chronic lymphocytic leuekmia with 17p deletion and/or TP53 mutation? Leuk Lymphoma 2015;56:587–93.
2. Zenz T, Eichhorst B, B
3. FDA news release. FDA approves new drug for chronic lymphocytic leukemia in patients with a specific chromosomal abnormality. 11 April 2016. Accessed 9 May 2018 at www.fda.gov/newsevents/newsroom/pressannouncements/ucm495253.htm.
4. Thijssen R, Slinger E, Weller K, et al. Resistance to ABT-199 induced by micro-environmental signals in chronic lymphocytic leukemia can be counteracted by CD20 antibodies or kinase inhibitors. Haematologica 2015;100:e302-e306.
5. Alexander BM, Schoenfeld JD, Trippa L. Hazards of hazard ratios—deviations from model assumptions in immunotherapy. N Engl J Med 2018;378:1158–9.
TAILORx marks major advance for precision medicine in breast cancer
CHICAGO – , sparing them adverse effects and preventing overtreatment, TAILORx trial results show.
The findings, which were reported in the plenary session at the annual meeting of the American Society of Clinical Oncology and simultaneously published in the New England Journal of Medicine, mark a major advance in precision medicine.

The recurrence score is known to be prognostic and to be predictive of benefit from adding chemotherapy to endocrine therapy, Dr. Sparano said. “But there was a major gap: There was uncertain benefit for patients who had a midrange score, about two-thirds of all patients who are treated.”
The phase 3 TAILORx trial registered 10,273 women with hormone receptor–positive, HER2-negative, node-negative early-stage breast cancer, making it the largest adjuvant breast cancer trial to date. Analyses focused on the 6,711 evaluable women with a midrange recurrence score (defined as 11 through 25 in the trial), who were randomized to receive endocrine therapy alone or adjuvant chemotherapy plus endocrine therapy, with a noninferiority design. Of note, contemporary drugs and regimens were used.
Results at a median follow-up of 7.5 years showed that the trial met its primary endpoint: The risk of invasive disease-free survival events (invasive disease recurrence, second primary cancer, or death) was not inferior for women given endocrine therapy alone compared with counterparts given chemotherapy plus endocrine therapy (hazard ratio, 1.08; P = .26), Dr. Sparano reported.
The groups were also on par, with absolute differences of no more than 1% between rates, with respect to a variety of other efficacy outcomes: freedom from distant recurrence and any recurrence, and overall survival.
Findings were similar across most subgroups. But analyses suggested that women aged 50 years and younger having a recurrence score of 16-25 did fare better when they received chemotherapy. “Though exploratory from a statistical perspective, this is a highly clinically relevant observation,” he maintained. “It suggests ... that chemotherapy should be spared with caution in this subgroup, after a careful discussion of potential benefits and risks in a shared decision process.”
In other findings, analyses of the trial’s nonrandomized groups confirmed excellent outcomes among women with a low recurrence score (defined as 0-10) given endocrine therapy alone, and at the other end of the spectrum, need for a more aggressive approach, including chemotherapy, among women with a high recurrence score (defined as 26-100).
Ultimately, application of the recurrence score allowed 69% of the entire trial population to skip chemotherapy: all of those women with a score of 0-10 (16% of the trial population), those older than 50 years with a score of 11-25 (45%), and those aged 50 years or younger with a score of 11-15 (8%).
“Although this trial was designed in 2003, it was designed with the goal of addressing one of the themes at this 2018 meeting, expanding the reach of precision medicine,” Dr. Sparano pointed out. “It also embodies the core values of ASCO: By providing the highest level of evidence, it can have a direct and immediate impact on the care of our patients.”
An ongoing companion phase 3 trial, RxPONDER, is assessing the benefit of applying the recurrence score in women who are similar but instead have node-positive disease.
Tailoring treatment: ‘not too much and not too little’
“These are very important data because this is the most common form of breast cancer in the United States and other developed countries, and the most challenging decision we make with these patients is whether or not to recommend adjuvant chemotherapy with all of its side effects and with its potential benefits,” said ASCO Expert Harold Burstein, MD, PhD, FASCO. “The data provided here today from this massive NCI-sponsored trial show that the vast majority of women who have this test performed on their tumor can be told that they don’t need chemotherapy, and that can be said with tremendous confidence and reassurance.”

“This is not so much about de-escalation ... The goal of this study was not to just use less treatment, the goal was to tailor treatment – they chose the title very aptly, with the idea of saying some women are going to need more of one kind of therapy and less of another, and others will get a different treatment based on the biology of their tumor,” said Dr. Burstein, a medical oncologist at the Dana-Farber Cancer Institute and associate professor of medicine, Harvard Medical School, Boston.
“This is extraordinary data for breast cancer doctors and women who have breast cancer. It allows you to individualize treatment based on extraordinary science, which now has tremendous prospective validation,” he said. Overall, “women with breast cancer who are getting modern therapy are doing extraordinarily well, and this test shows us how to tailor that management so they get exactly the right amount of treatment – not too much and not too little.”
Study details
All of the women with hormone receptor–positive, HER2-negative, node-negative early-stage breast cancer enrolled in TAILORx met National Comprehensive Cancer Network guidelines for receiving adjuvant chemotherapy.
Roughly 69% had an intermediate recurrence score (11-25) and were randomized. All of the 17% having a low recurrence score (0-10) were given only endocrine therapy, and all of the 14% with a high recurrence score (26-100) were given both adjuvant chemotherapy and endocrine therapy.
Of note, the recurrence scores used to define midrange were adjusted downward from those conventionally used to account for exclusion of patients with higher-risk HER2-positive disease and to minimize potential for undertreatment, Dr. Sparano explained. “I think you will see changes in the near future as to how Genomic Health reports their results.”
Among the women with midrange scores who were randomized, the hazard ratio for invasive disease-free survival with endocrine therapy alone compared with chemotherapy plus endocrine therapy (1.08) fell well within the predefined hazard ratio for noninferiority (1.322). The 9-year rate of invasive disease–free survival was 83.3% with endocrine therapy and 84.3% with chemotherapy plus endocrine therapy.
The groups had similar rates of freedom from distant recurrence (94.5% vs. 95.0%; hazard ratio, 1.10; P = .48) and distant or locoregional recurrence (92.2% vs. 92.9%; hazard ratio, 1.11; P = .33), and similar overall survival (93.9% vs. 93.8%; hazard ratio for death, 0.99; P = .89).
In exploratory analyses, there was an interaction of age and recurrence score (P = .004) whereby women aged 50 or younger derived some benefit from chemotherapy if they had a recurrence score of 16-20 (9% fewer invasive disease–free survival events, including 2% fewer distant recurrences) or a recurrence score 21-25 (6% fewer invasive disease–free survival events, mainly distant recurrences). “This is information that could drive some younger women who have a recurrence score in this range to accept chemotherapy,” Dr. Sparano said.
The 9-year rate of distant recurrence averaged 5% among the women with midrange scores overall. It was just 3% among the women with a low recurrence score given endocrine therapy alone, but it was still 13% among the women with a high recurrence score despite receiving both endocrine therapy and chemotherapy. The last finding may “indicate the need to explore potentially more effective therapies in this setting,” he proposed.
Dr. Sparano disclosed that he has a consulting or advisory role with Genentech/Roche, Novartis, AstraZeneca, Celgene, Lilly, Celldex, Pfizer, Prescient Therapeutics, Juno Therapeutics, and Merrimack; has stock or other ownership interests with Metastat; and receives research funding (institutional) from Prescient Therapeutics, Deciphera, Genentech/Roche, Merck, Novartis, and Merrimack. This study received funding primarily from the National Cancer Institute, National Institutes of Health. Additional support was provided by the Breast Cancer Research Foundation, Komen Foundation, and U.S. Postal Service Breast Cancer Stamp.
SOURCE: Sparano et al. ASCO 2018 Abstract LBA1
CHICAGO – , sparing them adverse effects and preventing overtreatment, TAILORx trial results show.
The findings, which were reported in the plenary session at the annual meeting of the American Society of Clinical Oncology and simultaneously published in the New England Journal of Medicine, mark a major advance in precision medicine.
The recurrence score is known to be prognostic and to be predictive of benefit from adding chemotherapy to endocrine therapy, Dr. Sparano said. “But there was a major gap: There was uncertain benefit for patients who had a midrange score, about two-thirds of all patients who are treated.”
The phase 3 TAILORx trial registered 10,273 women with hormone receptor–positive, HER2-negative, node-negative early-stage breast cancer, making it the largest adjuvant breast cancer trial to date. Analyses focused on the 6,711 evaluable women with a midrange recurrence score (defined as 11 through 25 in the trial), who were randomized to receive endocrine therapy alone or adjuvant chemotherapy plus endocrine therapy, with a noninferiority design. Of note, contemporary drugs and regimens were used.
Results at a median follow-up of 7.5 years showed that the trial met its primary endpoint: The risk of invasive disease-free survival events (invasive disease recurrence, second primary cancer, or death) was not inferior for women given endocrine therapy alone compared with counterparts given chemotherapy plus endocrine therapy (hazard ratio, 1.08; P = .26), Dr. Sparano reported.
The groups were also on par, with absolute differences of no more than 1% between rates, with respect to a variety of other efficacy outcomes: freedom from distant recurrence and any recurrence, and overall survival.
Findings were similar across most subgroups. But analyses suggested that women aged 50 years and younger having a recurrence score of 16-25 did fare better when they received chemotherapy. “Though exploratory from a statistical perspective, this is a highly clinically relevant observation,” he maintained. “It suggests ... that chemotherapy should be spared with caution in this subgroup, after a careful discussion of potential benefits and risks in a shared decision process.”
In other findings, analyses of the trial’s nonrandomized groups confirmed excellent outcomes among women with a low recurrence score (defined as 0-10) given endocrine therapy alone, and at the other end of the spectrum, need for a more aggressive approach, including chemotherapy, among women with a high recurrence score (defined as 26-100).
Ultimately, application of the recurrence score allowed 69% of the entire trial population to skip chemotherapy: all of those women with a score of 0-10 (16% of the trial population), those older than 50 years with a score of 11-25 (45%), and those aged 50 years or younger with a score of 11-15 (8%).
“Although this trial was designed in 2003, it was designed with the goal of addressing one of the themes at this 2018 meeting, expanding the reach of precision medicine,” Dr. Sparano pointed out. “It also embodies the core values of ASCO: By providing the highest level of evidence, it can have a direct and immediate impact on the care of our patients.”
An ongoing companion phase 3 trial, RxPONDER, is assessing the benefit of applying the recurrence score in women who are similar but instead have node-positive disease.
Tailoring treatment: ‘not too much and not too little’
“These are very important data because this is the most common form of breast cancer in the United States and other developed countries, and the most challenging decision we make with these patients is whether or not to recommend adjuvant chemotherapy with all of its side effects and with its potential benefits,” said ASCO Expert Harold Burstein, MD, PhD, FASCO. “The data provided here today from this massive NCI-sponsored trial show that the vast majority of women who have this test performed on their tumor can be told that they don’t need chemotherapy, and that can be said with tremendous confidence and reassurance.”
“This is not so much about de-escalation ... The goal of this study was not to just use less treatment, the goal was to tailor treatment – they chose the title very aptly, with the idea of saying some women are going to need more of one kind of therapy and less of another, and others will get a different treatment based on the biology of their tumor,” said Dr. Burstein, a medical oncologist at the Dana-Farber Cancer Institute and associate professor of medicine, Harvard Medical School, Boston.
“This is extraordinary data for breast cancer doctors and women who have breast cancer. It allows you to individualize treatment based on extraordinary science, which now has tremendous prospective validation,” he said. Overall, “women with breast cancer who are getting modern therapy are doing extraordinarily well, and this test shows us how to tailor that management so they get exactly the right amount of treatment – not too much and not too little.”
Study details
All of the women with hormone receptor–positive, HER2-negative, node-negative early-stage breast cancer enrolled in TAILORx met National Comprehensive Cancer Network guidelines for receiving adjuvant chemotherapy.
Roughly 69% had an intermediate recurrence score (11-25) and were randomized. All of the 17% having a low recurrence score (0-10) were given only endocrine therapy, and all of the 14% with a high recurrence score (26-100) were given both adjuvant chemotherapy and endocrine therapy.
Of note, the recurrence scores used to define midrange were adjusted downward from those conventionally used to account for exclusion of patients with higher-risk HER2-positive disease and to minimize potential for undertreatment, Dr. Sparano explained. “I think you will see changes in the near future as to how Genomic Health reports their results.”
Among the women with midrange scores who were randomized, the hazard ratio for invasive disease-free survival with endocrine therapy alone compared with chemotherapy plus endocrine therapy (1.08) fell well within the predefined hazard ratio for noninferiority (1.322). The 9-year rate of invasive disease–free survival was 83.3% with endocrine therapy and 84.3% with chemotherapy plus endocrine therapy.
The groups had similar rates of freedom from distant recurrence (94.5% vs. 95.0%; hazard ratio, 1.10; P = .48) and distant or locoregional recurrence (92.2% vs. 92.9%; hazard ratio, 1.11; P = .33), and similar overall survival (93.9% vs. 93.8%; hazard ratio for death, 0.99; P = .89).
In exploratory analyses, there was an interaction of age and recurrence score (P = .004) whereby women aged 50 or younger derived some benefit from chemotherapy if they had a recurrence score of 16-20 (9% fewer invasive disease–free survival events, including 2% fewer distant recurrences) or a recurrence score 21-25 (6% fewer invasive disease–free survival events, mainly distant recurrences). “This is information that could drive some younger women who have a recurrence score in this range to accept chemotherapy,” Dr. Sparano said.
The 9-year rate of distant recurrence averaged 5% among the women with midrange scores overall. It was just 3% among the women with a low recurrence score given endocrine therapy alone, but it was still 13% among the women with a high recurrence score despite receiving both endocrine therapy and chemotherapy. The last finding may “indicate the need to explore potentially more effective therapies in this setting,” he proposed.
Dr. Sparano disclosed that he has a consulting or advisory role with Genentech/Roche, Novartis, AstraZeneca, Celgene, Lilly, Celldex, Pfizer, Prescient Therapeutics, Juno Therapeutics, and Merrimack; has stock or other ownership interests with Metastat; and receives research funding (institutional) from Prescient Therapeutics, Deciphera, Genentech/Roche, Merck, Novartis, and Merrimack. This study received funding primarily from the National Cancer Institute, National Institutes of Health. Additional support was provided by the Breast Cancer Research Foundation, Komen Foundation, and U.S. Postal Service Breast Cancer Stamp.
SOURCE: Sparano et al. ASCO 2018 Abstract LBA1
REPORTING FROM ASCO 2018
Key clinical point: The majority of women with HR-positive, HER2-negative, node-negative early-stage breast cancer who have an intermediate recurrence score can safely skip adjuvant chemotherapy.
Major finding: Among women with an Oncotype DX Recurrence Score in the midrange (11-25), invasive disease–free survival with endocrine therapy alone was not inferior to that with chemotherapy plus endocrine therapy (hazard ratio, 1.08; P = .26).
Study details: A phase 3 trial among 10,273 women with HR-positive, HER2-negative, node-negative early-stage breast cancer, with a noninferiority randomized component among the 6,711 women with a midrange recurrence score (TAILORx trial).
Disclosures: Dr. Sparano disclosed that he has a consulting or advisory role with Genentech/Roche, Novartis, AstraZeneca, Celgene, Lilly, Celldex, Pfizer, Prescient Therapeutics, Juno Therapeutics, and Merrimack; has stock or other ownership interests with MetaStat; and receives research funding (institutional) from Prescient Therapeutics, Deciphera, Genentech/Roche, Merck, Novartis, and Merrimack. This study received funding primarily from the National Cancer Institute, National Institutes of Health. Additional support was provided by the Breast Cancer Research Foundation, Komen Foundation, and U.S. Postal Service Breast Cancer Stamp.
Source: Sparano et al. ASCO 2018 Abstract LBA1.
Red-Brown Plaque on the Leg
The Diagnosis: Wells Syndrome
A punch biopsy taken from the perimeter of the lesion demonstrated mild spongiosis overlying a dense nodular to diffuse infiltrate of lymphocytes, neutrophils, and numerous eosinophils, some involving underlying fat lobules (Figure, A and B). In some areas, eosinophilic degeneration of collagen bundles surrounded by a rim of histiocytes, "flame features," were observed (Figure C). The clinical and histological features were consistent with Wells syndrome (WS), also known as eosinophilic cellulitis. Given the localized mild nature of the disease, the patient was started on a midpotency topical corticosteroid.

Wells syndrome is a rare inflammatory condition characterized by clinical polymorphism, suggestive histologic findings, and a recurrent course.1,2 This condition is especially rare in children.3,4 Caputo et al1 described 7 variants in their case series of 19 patients: classic plaque-type variant (the most common clinical presentation in children); annular granuloma-like (the most common clinical presentation in adults); urticarialike; bullous; papulonodular; papulovesicular; and fixed drug eruption-like. Wells syndrome is thought to result from excess production of IL-5 in response to a hypersensitivity reaction to an exogenous or endogenous circulating antigen.3,4 Increased levels of IL-5 enhance eosinophil accumulation in the skin, degranulation, and subsequent tissue destruction.3,4 Reported triggers include insect bites, viral and bacterial infections, drug eruptions, recent vaccination, and paraphenylenediamine in henna tattoos.3-7 Additionally, WS has been reported in the setting of gastrointestinal pathologies, such as celiac disease and ulcerative colitis, and with asthma exacerbations.8,9 However, in half of pediatric cases, no trigger can be identified.7
Clinically, WS presents with pruritic, mildly tender plaques.7 Lesions may be localized or diffuse and range from mild annular or circinate plaques with infiltrated borders to cellulitic-appearing lesions that are occasionally associated with bullae.5,6 Patients often report prodromal symptoms of burning and pruritus.5,6 Lesions rapidly progress over 2 to 3 days, pass through a blue grayish discoloration phase, and gradually resolve over 2 to 8 weeks.5,6,10 Although patients generally heal without scarring, WS lesions have been described to resolve with atrophy and hyperpigmentation resembling morphea.5-7 Additionally, patients typically experience a relapsing remitting course over months to years with eventual spontaneous resolution.1,5 Patients also may experience systemic symptoms including fever, lymphadenopathy, and arthralgia, though they do not develop more widespread systemic manifestations.2,3,7
Diagnosis of WS is based on clinicopathologic correlation. Histopathology of WS lesions demonstrates 3 phases. The acute phase demonstrates edema of the superficial and mid dermis with a dense dermal eosinophilic infiltrate.1,6,10 The subacute granulomatous phase demonstrates flame figures in the dermis.1,2,6,7,10 Flame figures consist of palisading groups of eosinophils and histiocytes around a core of degenerating basophilic collagen bundles associated with major basic protein.1,2,6,7,10 Finally, in the resolution phase, eosinophils gradually disappear while histiocytes and giant cells persist, forming microgranulomas.1,2,10 Notably, no vasculitis is observed and direct immunofluorescence is negative.3,7 Although flame figures are suggestive of WS, they are not pathognomonic and are observed in other conditions including Churg-Strauss syndrome, parasitic and fungal infections, herpes gestationis, bullous pemphigoid, and follicular mucinosis.2,5
Wells syndrome is a self-resolving and benign condition.1,10 Physicians are recommended to gather a complete history including review of medications and vaccinations; a history of insect bites, infections, and asthma; laboratory workup consisting of a complete blood cell count with differential and stool samples for ova and parasites; and a skin biopsy if the diagnosis is unclear.7 Identification and treatment of underlying causes often results in resolution.6 Systemic corticosteroids frequently are used in both adult and pediatric patients, though practitioners should consider alternative treatments when recurrences occur to avoid steroid side effects.3,6 Midpotency topical corticosteroids present a safe alternative to systemic corticosteroids in the pediatric population, especially in cases of localized WS without systemic symptoms.3 Other medications reported in the literature include cyclosporine, dapsone, antimalarial medications, and azathioprine.6 Despite appropriate therapy, patients and physicians should anticipate recurrence over months to years.1,6
- Caputo R, Marzano AV, Vezzoli P, et al. Wells syndrome in adults and children: a report of 19 cases. Arch Dermatol. 2006;142:1157-1161.
- Smith SM, Kiracofe EA, Clark LN, et al. Idiopathic hypereosinophilic syndrome with cutaneous manifestations and flame figures: a spectrum of eosinophilic dermatoses whose features overlap with Wells' syndrome. Am J Dermatopathol. 2015;37:910-914.
- Gilliam AE, Bruckner AL, Howard RM, et al. Bullous "cellulitis" with eosinophilia: case report and review of Wells' syndrome in childhood. Pediatrics. 2005;116:E149-E155.
- Nacaroglu HT, Celegen M, Karkıner CS, et al. Eosinophilic cellulitis (Wells' syndrome) caused by a temporary henna tattoo. Postepy Dermatol Alergol. 2014;31:322-324.
- Heelan K, Ryan JF, Shear NH, et al. Wells syndrome (eosinophilic cellulitis): proposed diagnostic criteria and a literature review of the drug-induced variant. J Dermatol Case Rep. 2013;7:113-120.
- Sinno H, Lacroix JP, Lee J, et al. Diagnosis and management of eosinophilic cellulitis (Wells' syndrome): a case series and literature review. Can J Plast Surg. 2012;20:91-97.
- Cherng E, McClung AA, Rosenthal HM, et al. Wells' syndrome associated with parvovirus in a 5-year-old boy. Pediatr Dermatol. 2012;29:762-764.
- Eren M, Açikalin M. A case report of Wells' syndrome in a celiac patient. Turk J Gastroenterol. 2010;21:172-174.
- Cruz MJ, Mota A, Baudrier T, et al. Recurrent Wells' syndrome associated with allergic asthma exacerbation. Cutan Ocul Toxicol. 2012;31:154-156.
- Van der Straaten S, Wojciechowski M, Salgado R, et al. Eosinophilic cellulitis or Wells' syndrome in a 6-year-old child. Eur J Pediatr. 2006;165:197-198.
The Diagnosis: Wells Syndrome
A punch biopsy taken from the perimeter of the lesion demonstrated mild spongiosis overlying a dense nodular to diffuse infiltrate of lymphocytes, neutrophils, and numerous eosinophils, some involving underlying fat lobules (Figure, A and B). In some areas, eosinophilic degeneration of collagen bundles surrounded by a rim of histiocytes, "flame features," were observed (Figure C). The clinical and histological features were consistent with Wells syndrome (WS), also known as eosinophilic cellulitis. Given the localized mild nature of the disease, the patient was started on a midpotency topical corticosteroid.
Wells syndrome is a rare inflammatory condition characterized by clinical polymorphism, suggestive histologic findings, and a recurrent course.1,2 This condition is especially rare in children.3,4 Caputo et al1 described 7 variants in their case series of 19 patients: classic plaque-type variant (the most common clinical presentation in children); annular granuloma-like (the most common clinical presentation in adults); urticarialike; bullous; papulonodular; papulovesicular; and fixed drug eruption-like. Wells syndrome is thought to result from excess production of IL-5 in response to a hypersensitivity reaction to an exogenous or endogenous circulating antigen.3,4 Increased levels of IL-5 enhance eosinophil accumulation in the skin, degranulation, and subsequent tissue destruction.3,4 Reported triggers include insect bites, viral and bacterial infections, drug eruptions, recent vaccination, and paraphenylenediamine in henna tattoos.3-7 Additionally, WS has been reported in the setting of gastrointestinal pathologies, such as celiac disease and ulcerative colitis, and with asthma exacerbations.8,9 However, in half of pediatric cases, no trigger can be identified.7
Clinically, WS presents with pruritic, mildly tender plaques.7 Lesions may be localized or diffuse and range from mild annular or circinate plaques with infiltrated borders to cellulitic-appearing lesions that are occasionally associated with bullae.5,6 Patients often report prodromal symptoms of burning and pruritus.5,6 Lesions rapidly progress over 2 to 3 days, pass through a blue grayish discoloration phase, and gradually resolve over 2 to 8 weeks.5,6,10 Although patients generally heal without scarring, WS lesions have been described to resolve with atrophy and hyperpigmentation resembling morphea.5-7 Additionally, patients typically experience a relapsing remitting course over months to years with eventual spontaneous resolution.1,5 Patients also may experience systemic symptoms including fever, lymphadenopathy, and arthralgia, though they do not develop more widespread systemic manifestations.2,3,7
Diagnosis of WS is based on clinicopathologic correlation. Histopathology of WS lesions demonstrates 3 phases. The acute phase demonstrates edema of the superficial and mid dermis with a dense dermal eosinophilic infiltrate.1,6,10 The subacute granulomatous phase demonstrates flame figures in the dermis.1,2,6,7,10 Flame figures consist of palisading groups of eosinophils and histiocytes around a core of degenerating basophilic collagen bundles associated with major basic protein.1,2,6,7,10 Finally, in the resolution phase, eosinophils gradually disappear while histiocytes and giant cells persist, forming microgranulomas.1,2,10 Notably, no vasculitis is observed and direct immunofluorescence is negative.3,7 Although flame figures are suggestive of WS, they are not pathognomonic and are observed in other conditions including Churg-Strauss syndrome, parasitic and fungal infections, herpes gestationis, bullous pemphigoid, and follicular mucinosis.2,5
Wells syndrome is a self-resolving and benign condition.1,10 Physicians are recommended to gather a complete history including review of medications and vaccinations; a history of insect bites, infections, and asthma; laboratory workup consisting of a complete blood cell count with differential and stool samples for ova and parasites; and a skin biopsy if the diagnosis is unclear.7 Identification and treatment of underlying causes often results in resolution.6 Systemic corticosteroids frequently are used in both adult and pediatric patients, though practitioners should consider alternative treatments when recurrences occur to avoid steroid side effects.3,6 Midpotency topical corticosteroids present a safe alternative to systemic corticosteroids in the pediatric population, especially in cases of localized WS without systemic symptoms.3 Other medications reported in the literature include cyclosporine, dapsone, antimalarial medications, and azathioprine.6 Despite appropriate therapy, patients and physicians should anticipate recurrence over months to years.1,6
- Caputo R, Marzano AV, Vezzoli P, et al. Wells syndrome in adults and children: a report of 19 cases. Arch Dermatol. 2006;142:1157-1161.
- Smith SM, Kiracofe EA, Clark LN, et al. Idiopathic hypereosinophilic syndrome with cutaneous manifestations and flame figures: a spectrum of eosinophilic dermatoses whose features overlap with Wells' syndrome. Am J Dermatopathol. 2015;37:910-914.
- Gilliam AE, Bruckner AL, Howard RM, et al. Bullous "cellulitis" with eosinophilia: case report and review of Wells' syndrome in childhood. Pediatrics. 2005;116:E149-E155.
- Nacaroglu HT, Celegen M, Karkıner CS, et al. Eosinophilic cellulitis (Wells' syndrome) caused by a temporary henna tattoo. Postepy Dermatol Alergol. 2014;31:322-324.
- Heelan K, Ryan JF, Shear NH, et al. Wells syndrome (eosinophilic cellulitis): proposed diagnostic criteria and a literature review of the drug-induced variant. J Dermatol Case Rep. 2013;7:113-120.
- Sinno H, Lacroix JP, Lee J, et al. Diagnosis and management of eosinophilic cellulitis (Wells' syndrome): a case series and literature review. Can J Plast Surg. 2012;20:91-97.
- Cherng E, McClung AA, Rosenthal HM, et al. Wells' syndrome associated with parvovirus in a 5-year-old boy. Pediatr Dermatol. 2012;29:762-764.
- Eren M, Açikalin M. A case report of Wells' syndrome in a celiac patient. Turk J Gastroenterol. 2010;21:172-174.
- Cruz MJ, Mota A, Baudrier T, et al. Recurrent Wells' syndrome associated with allergic asthma exacerbation. Cutan Ocul Toxicol. 2012;31:154-156.
- Van der Straaten S, Wojciechowski M, Salgado R, et al. Eosinophilic cellulitis or Wells' syndrome in a 6-year-old child. Eur J Pediatr. 2006;165:197-198.

A healthy 7-year-old boy presented with an enlarging hyperpigmented plaque on the anterior aspect of the lower left leg of 2 months' duration. His mother reported onset following a mosquito bite. Clotrimazole was used without improvement. His mother denied recent travel, similar lesions in close contacts, fever, asthma, and arthralgia. Physical examination revealed a 5.2 ×3-cm nonscaly, red-brown, ovoid, thin plaque with a slightly raised border.

A Peek at Our June 2018 Issue
The video associated with this article is no longer available on this site. Please view all of our videos on the MDedge YouTube channel
The video associated with this article is no longer available on this site. Please view all of our videos on the MDedge YouTube channel
The video associated with this article is no longer available on this site. Please view all of our videos on the MDedge YouTube channel
Antidepressants and children