User login
ADHD and comorbidities
No pediatrician thinks caring for children with attention-deficit/hyperactivity disorder (ADHD) is easy, but some of these patients are far easier than others! The difference between your patients with ADHD who give you nightmares and those you are eager to see at return visits is usually the presence of comorbidities (not counting parent issues!).
Comorbidities are very common with ADHD, occurring in nearly half of all patients. One of the tricky things about comorbidities in ADHD is that several of them, or medicines used to treat them, also are potential explanations for the ADHD symptoms themselves.
The most common comorbid conditions are learning disabilities, which are present in 12% when narrowly defined, but school underachievement occurs in up to 60% of children with ADHD. Children with learning difficulties that are not adequately accommodated can present with “ADHD symptoms.” These children can be inattentive, fidgety, or out of their seats; may do classwork slowly or poorly; and may ultimately be disruptive in class. What child wouldn’t act this way if he or she couldn’t understand the work? Remember that a child will do anything to “save face.” Acting up and getting sent out of class is a last resort, but not a bad option over being humiliated by looking dumb, being teased, or being embarrassed in front of peers.
Some clues that learning disabilities are responsible for symptoms include behaviors that occur selectively during specific subjects, reports of disliking the subject, or refusal to do homework for certain subjects. One would think that poor grades would point to learning disabilities, but this is not always true either because the teacher is not that discerning or because a bright child compensates while still struggling. Be sure to have some grade-level assessment you can administer yourself such as the Einstein Evaluation of School-Related Skills or the WRAT (Wide Range Achievement Test). A large proportion of children with ADHD have a reading disability so having standard paragraphs available is important in deciding who needs complete psychological testing.
With this high prevalence of reading disabilities, it should not surprise you that language disorders also are comorbid with ADHD, occurring in 4% of these children. Because language disorder is among the developmental issues most amenable to intervention, detection and referral are especially important. If a child does not answer your questions with the grammar, vocabulary, or flow of ideas you expect at a particular age, consider using the Sentence Repetition Test to check for understanding. There are no easy screens for the complex language expected of school-aged children, so consider referral to a speech-language pathologist if you are suspicious.
Anxiety is comorbid with ADHD in 21% of children, but most importantly, it the most-often-missed diagnosis causing ADHD symptoms. Consider anxiety when a child is too nervous to pay attention, is distracted by worry, is concerned about what peers think to the point of having to listen in on their conversations, is unable to come up with an answer for a teacher that is perceived as critical, or is perfectionistic about work so it never gets done on time. Although children with ADHD are rather poor observers of their own symptoms, I always ask, “Is it hard to pay attention in class?” and follow up on a “yes” by asking, “What is going through your mind when you are not paying attention?” Reports of daydreams about skateboarding are one thing, but if children say they are thinking about their mother or worrying about an upcoming test, then further evaluation for anxiety is in order. Using a screening self-report tool such as the SCARED (Screen for Childhood Anxiety and Related Disorders) or the Pediatric Anxiety Rating Scale have rather low sensitivity, but can help the conversation to define anxiety symptoms, something children do not find easy to do if asked directly.
Remember that anxiety disorders do not “fly alone” either: Children with one anxiety disorder have a greater than 60% chance of having two, and children with two have a 30% chance of having three or more anxiety disorders. That means that children with generalized anxiety disorder may well have obsessive-compulsive disorder or a specific phobia as well. Just watching for general worrying is not enough. Add to this that the parent coming in worried about their child may be the genetic source with an anxiety disorder themselves, potentially contributing to the child’s distress and making it harder for you to assess the severity of either the anxiety or the ADHD symptoms!
I am sometimes grateful that a child with ADHD has excessive anxiety because it may protect him from jumping out of windows! But the combination has downsides in making the child even less preferred by peers and more likely to have hostile bias attribution – the tendency to see others as a threat. This combination can result in impulsive proactive aggression. Recognizing the role of anxiety in the aggressive episodes, and helping the child and parent to identify it, also is crucial to successful management. Anxiety is rarely perceived by parents, teachers, or children themselves as a cause of oppositional or aggressive behavior, so you need to probe for this connection. There is no substitute for debriefing a specific example of aggression and asking the child, “What were you thinking right before this happened?” You may suspect anxiety simply by watching the child’s reaction to what the parent says in the interview. Having the child draw a picture of a child, tell a story about “What happens next?” and then “How does the story end?” can be another adjunct to detecting anxiety.
Sometimes the treatment of ADHD makes the comorbid condition worse or vice versa. A prime example where treatment of one exacerbates the other is the use of stimulants, especially amphetamines, which can produce or worsen anxiety. Even though the reported side effects of stimulants do not state that there is more anxiety with amphetamines, I often prefer to prescribe dexmethylphenidate when both ADHD and anxiety coexist. The longer-acting preparations such as methylphenidate in a long-acting liquid or patch also seem to allow for finer tuning of dose with less anxiety exacerbation than shorter-acting preparations. Nonstimulants such as long-acting guanfacine or atomoxetine as treatment for the ADHD may be needed alone or in combination to allow a lower dose when the side effects of the stimulants on the anxiety outweigh their benefits. On the other hand, if the child is on selective serotonin reuptake inhibitors for anxiety (not the first-line treatment, which is cognitive-behavior therapy), he or she may experience behavioral activation that looks a lot like worsening ADHD!
Depression is “the other side” of anxiety – often developing at a later age after an earlier diagnosis of anxiety disorder – and another common comorbidity to ADHD occurring in 18% of children. Depression is less likely to masquerade as ADHD, but still may present as inattention or poor performance. Remember that children with depression may act irritable or aggressive rather than lethargic. Depression screens such as the Patient Health Questionnaire–9 can help sort this out.
Oppositional-defiant disorder (32%) and conduct disorder (25%) are more commonly comorbid with ADHD than are the conditions just discussed, but because they are “acting-out” conditions they are of great concern to parents and thus not likely to be missed in your office visits. Other medical conditions such as tics, enuresis, encopresis and even asthma also are comorbid and should be asked about.
The Vanderbilt Initial questionnaires have a few items for anxiety, depression, and conduct as well as performance items about academic functioning. A general screening tool such as the Pediatric Symptom Checklist, perhaps followed by a diagnostic tool such as the CHADIS DSM questionnaire, can be completed by parents online or on paper to detect and help diagnose any of these comorbidities before visits.
Pediatricians are the main clinicians diagnosing (for 53% of children with ADHD) and managing this condition (Natl. Health Stat Report. 2015 Sep;81:1-8). You should be proud of how well we have recently risen to the occasion and are now identifying and treating ADHD using evidence-based tools (90%) and attempting to collect data from schools (82%) as well as parents. The biggest gap in effective primary care management of ADHD now is detecting and managing its comorbidities.
Dr. Howard is assistant professor of pediatrics at the Johns Hopkins University School of Medicine, Baltimore, and creator of CHADIS (www.CHADIS.com). She had no other relevant disclosures. Dr. Howard’s contribution to this publication was as a paid expert to Frontline Medical Communications. E-mail her at [email protected].
Hip Fracture and the Weekend Effect: Does Weekend Admission Affect Patient Outcomes?
Weekend admission has been hypothesized to be a risk factor for increased patient mortality and complications during hospital stays—commonly referred to as the weekend effect.1 Reduced hospital staffing on weekends, particularly of senior-level physicians and ancillary nursing services, may affect the quality of diagnosis and management for patients admitted for traumatic and emergent conditions. Investigators have found increased mortality in weekend admissions for stroke,2 subdural hematoma,3 gastrointestinal bleeding,4,5 atrial fibrillation,6 and pulmonary embolism.7 Investigators have not found increased mortality in weekend admissions for hip fracture, though the majority of the data was derived from European patient populations, which may be subject to management and staffing strategies different from those for US patients.8-10 Furthermore, data on this topic in US patients are limited to a multispecialty study of 50 different admission diagnoses, which used 1 year of data from a single US state.1
We conducted a study to comprehensively assess the effect of weekend admission on adverse outcomes during hospital stays. The literature suggests that surgery for hip fracture can be delayed up to 48 hours without significant additional risk of death,11-13 allowing orthopedic departments to stabilize routine hip fracture admissions on weekends and operate whenever limited surgical teams become available. Surgical delay has not been thoroughly analyzed by day of admission among US patients,14 but the combined potential of more conservative preoperative management and the availability of fewer senior physicians and ancillary providers may result in worse outcomes for weekend versus weekday admissions.
Materials and Methods
Study Population
Part of the Healthcare Cost and Utilization Project, the Nationwide Inpatient Sample (NIS) provides a 20% representative sample of annual US hospital admissions.15 For these admissions, the NIS includes data related to demographic and clinical variables, such as International Classification of Diseases, Ninth Revision, Clinical Modification (ICD-9-CM) diagnosis and procedure codes, as well as descriptive variables for the hospitals where the patients were admitted. The NIS is publicly available to researchers. As its health information is deidentified, we did not have to obtain institutional review board approval for this study.
Ascertainment of Cases
Our initial study population, drawn from the period 1998–2010, consisted of 821,531 patients with a principal ICD-9-CM diagnosis of femoral neck fracture (820.0-820.9). To best capture the typical presentation of hip fracture, we excluded:
- Patients with open femoral neck fractures (820.1, 820.3, 820.9).
- Patients who did not have open reduction and internal fixation (ORIF) (79.35), hemiarthroplasty (81.52), closed reduction and internal fixation (CRIF) (79.15), internal fixation (78.55), or total hip arthroplasty (THA) (81.51) as their primary surgical procedure.
- Patients admitted from sources other than the emergency department.
- Patients who underwent surgery before admission.
- Patients whose admission type was not classified as emergency or urgent.
Ascertainment of Covariates
For all patients, we extracted data on exposure of interest, day of admission (weekend or weekday), and demographic variables including age, sex, race (white, black, Hispanic, other, missing), and insurance (Medicare, Medicaid, private, other). We used the Elixhauser method to determine 30 different comorbidities from ICD-9-CM diagnosis coding16 and sorted patients by total number of comorbidities (0, 1, 2, 3 or 4, ≥5). As has been done before,17 we excluded blood loss anemia, coagulopathy, and fluid and electrolyte disorders from this comorbidity calculation, as these conditions can be secondary to trauma. We also extracted data on the admission itself, including hospital region (Northeast, Midwest, South, West), hospital bed size (small, medium, large), hospital teaching status (nonteaching, teaching), and hospital location (rural, urban). We used diagnosis codes to categorize fracture location as “not otherwise specified” (820.8), intracapsular (820.0), or extracapsular (820.2).
Because of low frequencies, we collapsed 2 race designations (Native American, Asian or Pacific Islander) into the “other race” category and 2 insurance designations (self-pay, no charge) into the “other insurance” category. For a substantial number of patients, race information was missing, so we included “missing” as its own category in analyses. Patients who were missing data on day of admission, age, sex, insurance, or hospital characteristics were excluded from our final cohort, as missing frequencies for each variable were small.
Ascertainment of Outcomes
For all patients, we extracted data on death status at discharge and length of hospital stay. We log-transformed length of stay because of its right skew, assigning the value of 12 hours to patients admitted and discharged the same day. Perioperative complications were calculated using ICD-9-CM codes as defined by a recent study of orthopedics-related complications by Lin and colleagues.18 There were 14 possible complications, including acute renal failure (584.5-9), tachycardia (427), wound hemorrhage (719.15, 998.31-2), wound disruption (998.3, 998.31-2), wound infection (682.6, 686.9, 891, 891.1-2, 894, 894.1-2, 998.5, 998.51, 998.6, 998.83, 998.59), deep vein thrombosis (453.4, 453.41-2, 453.9), acute myocardial infarction (410, 410.01, 410.11, 410.2, 410.21, 410.3, 410.31, 410.4, 410.41, 410.5, 410.51, 410.6, 410.9, 410.91, 997.1), pneumonia (480-480.9, 481, 482-482.9, 483, 483.1, 483.8, 484, 484.1, 484.3, 484.5-8, 485, 486, 487, 507), pulmonary embolism (415.11, 415.19), sepsis (995.91-2), stroke (997.02), urinary tract infection (599, 997.5), implant infection (996.66-7, 996.69), and incision and débridement (86.04, 86.09, 86.22, 86.28, 86.3). In our statistical analyses, we examined both the risk of having a complicated admission (≥1 perioperative complication) and the risk of having each specific complication.
Statistical Analysis
To assess similarity between weekend and weekday admissions, we used the Fisher exact test and χ2P values. Logistic regression was used to calculate the odds ratios (ORs) of mortality and perioperative complications for weekend versus weekday admissions. Linear regression was used to calculate parameter estimates for length of hospital stay for weekend versus weekday admissions. We interpreted parameter estimates as percentage differences using the formula 100(eb–1), where b is the estimated standardized regression coefficient of a log-transformed outcome variable.19 All regression models were controlled for age, sex, race, insurance, number of comorbidities, fracture location, hospital region, hospital bed size, hospital teaching status, and hospital location. We also stratified our study population by surgical delay in hours (<24, 24-48, 49-72, 73-120, ≥121) and by surgery performed (ORIF, hemiarthroplasty, CRIF, internal fixation only, THA, multiple procedures) to examine the effect of weekend admission on mortality, perioperative complications, and length of stay within each stratum. We did not control for these variables in our regression models because they were potential mediators of mortality, complications, and length of stay. All statistical analyses in this study were performed using SAS Version 9.1 (SAS Institute), and P < .05 was interpreted as statistically significant.
Results
After exclusions, our study population consisted of 96,892 weekend admissions and 248,097 weekday admissions. Among all admissions, mean age was 79.3 years (range, 0-113 years), with patients primarily being female and white, paying with Medicare, and having 1 to 4 comorbidities. Admissions were primarily for extracapsular femoral neck fractures and occurred most often in the South region, in hospitals with large beds, in nonteaching hospitals, and in urban locations. Table 1 lists details of baseline characteristics for weekend and weekday admissions.

Hospital stay details, including surgical delay and procedure performed, were examined for weekend and weekday admissions. Mean delay to surgery was 31.0 hours for weekend admissions and 30.2 hours for weekday admissions (P < .0001). The difference was driven by a higher proportion of weekend admissions in which surgery was performed 24 to 120 hours after admission. Patients admitted on the weekend also underwent more ORIF procedures and fewer hemiarthroplasties. Table 2 is a full list of hospital stay characteristics.

In regression analyses, weekend OR of mortality was 0.94 (95% CI, 0.89-0.99), weekend OR of having at least 1 complication was 1.00 (95% CI, 0.98-1.02), and weekend mean hospital stay was 3.74% shorter (95% CI, 3.40-4.08) in comparison with weekday figures. Within our models, risk of mortality and complications and mean length of stay increased as the number of patient comorbidities increased. Table 3 lists selected results from our regression models. Comprehensive tables for each outcome’s model are presented in Appendices 1 to 3.

In our analyses of specific complications, there were no significant associations between weekend admissions and risk of acute renal failure, wound hemorrhage, wound disruption, wound infection, deep vein thrombosis, myocardial infarction, pneumonia, pulmonary embolism, sepsis, urinary tract infection, implant infection, or incision and débridement. In addition, we found a lower risk of tachycardia (OR, 0.90; 95% CI, 0.82-1.00) and a higher risk (P < .10) of stroke (OR, 1.16; 95% CI, 0.99-1.35). Table 4 is a full list of the specific complications and their risks for weekend versus weekday admissions.

According to stratified analyses involving surgical delay, weekend admissions in which patients had surgery the same day as admission had decreased risk of mortality (OR, 0.81; 95% CI, 0.72-0.91) and perioperative complications (OR, 0.96; 95% CI, 0.92-0.99). In addition, hospital stay was shorter for weekend admissions with surgical delay of less than 24 hours (4.89% shorter; 95% CI, 4.22-5.55), 24 to 48 hours (5.93% shorter; 95% CI, 5.51-6.35), and 49 to 72 hours (3.50% shorter; 95% CI, 2.80-4.20). When admissions were stratified by procedure performed, patients who were admitted on the weekend and underwent ORIF, hemiarthroplasty, CRIF, internal fixation only, and THA had shorter stays than patients admitted on weekdays. For all surgeries performed, the risk of both mortality and complications did not significantly differ by day of admission. Table 5 lists the comprehensive results of all our stratified analyses.

Discussion
In this large, multiyear analysis of patients admitted for hip fracture in the United States, risk of mortality was slightly lower for weekend versus weekday admissions, hospital stay was significantly shorter, and risk of perioperative complications was not significantly different between admission types. In secondary analyses, shorter hospital stay was limited to patients who were admitted on weekends and underwent surgery within 48 hours. Our results therefore suggest that the weekend effect does not apply to hip fracture patients in the United States.
Our results are largely consistent with the literature on the topic.11-14 An Australian study of 4183 patients with acute hip fracture found no significant difference in 2- or 30-day mortality among weekend and weekday admissions.11 Similarly, 2 Danish studies did not find a difference in hospital-stay or 30-day mortality between weekend and weekday admissions among samples of 600 and 38,020 patients with hip fracture, respectively.12,13 In US patients, a cross-specialty study that included hip fractures did not find a difference in hospital-stay mortality among 22,001 admissions in the state of California in 1998.14 Our analysis significantly extended the findings of these studies by using comprehensive admission data from 46 US states over a 13-year period (1998–2010) and by examining outcomes other than mortality, including perioperative complications and length of hospital stay.
Our study had several limitations. First, the clinical data on fracture diagnoses and surgical procedures were based on ICD-9-CM codes, limiting our ability to account for the full details of fracture severity and subsequent management. Second, our analyses were limited to outcomes during the hospital stay, and we could not examine the effect of weekend admission on readmission and long-term mortality. Third, because of the dichotomization of admission day in the NIS database, we could not selectively examine the effect of Friday, Saturday, or Sunday admission on our outcomes. Fourth, we excluded admissions that were missing demographic and clinical data, potentially creating a complete-case bias. However, these exclusions were needed to accurately capture the common presentation of acute hip fracture, and there is no reason to believe that differences in record coding were nonrandom. Last, our study was observational, and we cannot rule out the effect of residual confounding on our results.
Our results failed to show a weekend effect on mortality, perioperative complications, or length of hospital stay in US patients with hip fracture. The reason for this, as suggested before,12 may be that hip fractures are becoming easier to diagnose. Furthermore, the observation that hospital stay was shorter for weekend admissions suggests that, despite decreased staffing of nursing and rehabilitation services, the lower volume of elective surgeries on weekends may actually increase staff availability to hip fracture patients.


1. Cram P, Hillis SL, Barnett M, Rosenthal GE. Effects of weekend admission and hospital teaching status on in-hospital mortality. Am J Med. 2004;117(3):151-157.
2. Saposnik G, Baibergenova A, Bayer N, Hachinski V. Weekends: a dangerous time for having a stroke? Stroke. 2007;38(4):1211-1215.
3. Busl KM, Prabhakaran S. Predictors of mortality in nontraumatic subdural hematoma. J Neurosurg. 2013;119(5):1296-1301.
4. Ananthakrishnan AN, McGinley EL, Saeian K. Outcomes of weekend admissions for upper gastrointestinal hemorrhage: a nationwide analysis. Clin Gastroenterol Hepatol. 2009;7(3):296e1-302e1.
5. Shaheen AA, Kaplan GG, Myers RP. Weekend versus weekday admission and mortality from gastrointestinal hemorrhage caused by peptic ulcer disease. Clin Gastroenterol Hepatol. 2009;7(3):303-310.
6. Deshmukh A, Pant S, Kumar G, Bursac Z, Paydak H, Mehta JL. Comparison of outcomes of weekend versus weekday admissions for atrial fibrillation. Am J Cardiol. 2012;110(2):208-211.
7. Aujesky D, Jiménez D, Mor MK, Geng M, Fine MJ, Ibrahim SA. Weekend versus weekday admission and mortality after acute pulmonary embolism. Circulation. 2009;119(7):962-968.
8. Clarke MS, Wills RA, Bowman RV, et al. Exploratory study of the ‘weekend effect’ for acute medical admissions to public hospitals in Queensland, Australia. Intern Med J. 2010;40(11):777-783.
9. Daugaard CL, Jørgensen HL, Riis T, Lauritzen JB, Duus BR, Van der mark S. Is mortality after hip fracture associated with surgical delay or admission during weekends and public holidays? A retrospective study of 38,020 patients. Acta Orthop. 2012;83(6):609-613.
10. Foss NB, Kehlet H. Short-term mortality in hip fracture patients admitted during weekends and holidays. Br J Anaesth. 2006;96(4):450-4514.
11. Shiga T, Wajima Z, Ohe Y. Is operative delay associated with increased mortality of hip fracture patients? Systematic review, meta-analysis and meta-regression. Can J Anaesth. 2008;55(3):146-154.
12. Zuckerman JD, Skovron ML, Koval KJ, Aharonoff G, Frankel VH. Postoperative complications and mortality associated with operative delay in older patients who have a fracture of the hip. J Bone Joint Surg Am. 1995;77(10):1551-1556.
13. Lefaivre KA, Macadam SA, Davidson DJ, Gandhi R, Chan H, Broekhuyse HM. Length of stay, mortality, morbidity and delay to surgery in hip fractures. J Bone Joint Surg Br. 2009;91(7):922-927.
14. Ho V, Hamilton BH, Roos LL. Multiple approaches to assessing the effects of delays for hip fracture patients in the United States and Canada. Health Serv Res. 2000;34(7):1499-1518.
15. Steiner C, Elixhauser A, Schnaier J. The Healthcare Cost and Utilization Project: an overview. Eff Clin Pract. 2002;5(3):143-151.
16. Elixhauser A, Steiner C, Harris DR, Coffey RM. Comorbidity measures for use with administrative data. Med Care. 1998;36(1):8-27.
17. Brasel KJ, Guse CE, Layde P, Weigelt JA. Rib fractures: relationship with pneumonia and mortality. Crit Care Med. 2006;34(6):1642-1646.
18. Lin CA, Kuo AC, Takemoto S. Comorbidities and perioperative complications in HIV-positive patients undergoing primary total hip and knee arthroplasty. J Bone Joint Surg Am. 2013;95(11):1028-1036.
19. Vittinghoff E, Glidden DV, Shiboski SC, McCulloch CE. Regression Methods in Biostatistics: Linear, Logistic, Survival, and Repeated Measures Models. 2nd ed. New York, NY: Springer-Verlag; 2012. Statistics for Biology and Health.
Weekend admission has been hypothesized to be a risk factor for increased patient mortality and complications during hospital stays—commonly referred to as the weekend effect.1 Reduced hospital staffing on weekends, particularly of senior-level physicians and ancillary nursing services, may affect the quality of diagnosis and management for patients admitted for traumatic and emergent conditions. Investigators have found increased mortality in weekend admissions for stroke,2 subdural hematoma,3 gastrointestinal bleeding,4,5 atrial fibrillation,6 and pulmonary embolism.7 Investigators have not found increased mortality in weekend admissions for hip fracture, though the majority of the data was derived from European patient populations, which may be subject to management and staffing strategies different from those for US patients.8-10 Furthermore, data on this topic in US patients are limited to a multispecialty study of 50 different admission diagnoses, which used 1 year of data from a single US state.1
We conducted a study to comprehensively assess the effect of weekend admission on adverse outcomes during hospital stays. The literature suggests that surgery for hip fracture can be delayed up to 48 hours without significant additional risk of death,11-13 allowing orthopedic departments to stabilize routine hip fracture admissions on weekends and operate whenever limited surgical teams become available. Surgical delay has not been thoroughly analyzed by day of admission among US patients,14 but the combined potential of more conservative preoperative management and the availability of fewer senior physicians and ancillary providers may result in worse outcomes for weekend versus weekday admissions.
Materials and Methods
Study Population
Part of the Healthcare Cost and Utilization Project, the Nationwide Inpatient Sample (NIS) provides a 20% representative sample of annual US hospital admissions.15 For these admissions, the NIS includes data related to demographic and clinical variables, such as International Classification of Diseases, Ninth Revision, Clinical Modification (ICD-9-CM) diagnosis and procedure codes, as well as descriptive variables for the hospitals where the patients were admitted. The NIS is publicly available to researchers. As its health information is deidentified, we did not have to obtain institutional review board approval for this study.
Ascertainment of Cases
Our initial study population, drawn from the period 1998–2010, consisted of 821,531 patients with a principal ICD-9-CM diagnosis of femoral neck fracture (820.0-820.9). To best capture the typical presentation of hip fracture, we excluded:
- Patients with open femoral neck fractures (820.1, 820.3, 820.9).
- Patients who did not have open reduction and internal fixation (ORIF) (79.35), hemiarthroplasty (81.52), closed reduction and internal fixation (CRIF) (79.15), internal fixation (78.55), or total hip arthroplasty (THA) (81.51) as their primary surgical procedure.
- Patients admitted from sources other than the emergency department.
- Patients who underwent surgery before admission.
- Patients whose admission type was not classified as emergency or urgent.
Ascertainment of Covariates
For all patients, we extracted data on exposure of interest, day of admission (weekend or weekday), and demographic variables including age, sex, race (white, black, Hispanic, other, missing), and insurance (Medicare, Medicaid, private, other). We used the Elixhauser method to determine 30 different comorbidities from ICD-9-CM diagnosis coding16 and sorted patients by total number of comorbidities (0, 1, 2, 3 or 4, ≥5). As has been done before,17 we excluded blood loss anemia, coagulopathy, and fluid and electrolyte disorders from this comorbidity calculation, as these conditions can be secondary to trauma. We also extracted data on the admission itself, including hospital region (Northeast, Midwest, South, West), hospital bed size (small, medium, large), hospital teaching status (nonteaching, teaching), and hospital location (rural, urban). We used diagnosis codes to categorize fracture location as “not otherwise specified” (820.8), intracapsular (820.0), or extracapsular (820.2).
Because of low frequencies, we collapsed 2 race designations (Native American, Asian or Pacific Islander) into the “other race” category and 2 insurance designations (self-pay, no charge) into the “other insurance” category. For a substantial number of patients, race information was missing, so we included “missing” as its own category in analyses. Patients who were missing data on day of admission, age, sex, insurance, or hospital characteristics were excluded from our final cohort, as missing frequencies for each variable were small.
Ascertainment of Outcomes
For all patients, we extracted data on death status at discharge and length of hospital stay. We log-transformed length of stay because of its right skew, assigning the value of 12 hours to patients admitted and discharged the same day. Perioperative complications were calculated using ICD-9-CM codes as defined by a recent study of orthopedics-related complications by Lin and colleagues.18 There were 14 possible complications, including acute renal failure (584.5-9), tachycardia (427), wound hemorrhage (719.15, 998.31-2), wound disruption (998.3, 998.31-2), wound infection (682.6, 686.9, 891, 891.1-2, 894, 894.1-2, 998.5, 998.51, 998.6, 998.83, 998.59), deep vein thrombosis (453.4, 453.41-2, 453.9), acute myocardial infarction (410, 410.01, 410.11, 410.2, 410.21, 410.3, 410.31, 410.4, 410.41, 410.5, 410.51, 410.6, 410.9, 410.91, 997.1), pneumonia (480-480.9, 481, 482-482.9, 483, 483.1, 483.8, 484, 484.1, 484.3, 484.5-8, 485, 486, 487, 507), pulmonary embolism (415.11, 415.19), sepsis (995.91-2), stroke (997.02), urinary tract infection (599, 997.5), implant infection (996.66-7, 996.69), and incision and débridement (86.04, 86.09, 86.22, 86.28, 86.3). In our statistical analyses, we examined both the risk of having a complicated admission (≥1 perioperative complication) and the risk of having each specific complication.
Statistical Analysis
To assess similarity between weekend and weekday admissions, we used the Fisher exact test and χ2P values. Logistic regression was used to calculate the odds ratios (ORs) of mortality and perioperative complications for weekend versus weekday admissions. Linear regression was used to calculate parameter estimates for length of hospital stay for weekend versus weekday admissions. We interpreted parameter estimates as percentage differences using the formula 100(eb–1), where b is the estimated standardized regression coefficient of a log-transformed outcome variable.19 All regression models were controlled for age, sex, race, insurance, number of comorbidities, fracture location, hospital region, hospital bed size, hospital teaching status, and hospital location. We also stratified our study population by surgical delay in hours (<24, 24-48, 49-72, 73-120, ≥121) and by surgery performed (ORIF, hemiarthroplasty, CRIF, internal fixation only, THA, multiple procedures) to examine the effect of weekend admission on mortality, perioperative complications, and length of stay within each stratum. We did not control for these variables in our regression models because they were potential mediators of mortality, complications, and length of stay. All statistical analyses in this study were performed using SAS Version 9.1 (SAS Institute), and P < .05 was interpreted as statistically significant.
Results
After exclusions, our study population consisted of 96,892 weekend admissions and 248,097 weekday admissions. Among all admissions, mean age was 79.3 years (range, 0-113 years), with patients primarily being female and white, paying with Medicare, and having 1 to 4 comorbidities. Admissions were primarily for extracapsular femoral neck fractures and occurred most often in the South region, in hospitals with large beds, in nonteaching hospitals, and in urban locations. Table 1 lists details of baseline characteristics for weekend and weekday admissions.
Hospital stay details, including surgical delay and procedure performed, were examined for weekend and weekday admissions. Mean delay to surgery was 31.0 hours for weekend admissions and 30.2 hours for weekday admissions (P < .0001). The difference was driven by a higher proportion of weekend admissions in which surgery was performed 24 to 120 hours after admission. Patients admitted on the weekend also underwent more ORIF procedures and fewer hemiarthroplasties. Table 2 is a full list of hospital stay characteristics.
In regression analyses, weekend OR of mortality was 0.94 (95% CI, 0.89-0.99), weekend OR of having at least 1 complication was 1.00 (95% CI, 0.98-1.02), and weekend mean hospital stay was 3.74% shorter (95% CI, 3.40-4.08) in comparison with weekday figures. Within our models, risk of mortality and complications and mean length of stay increased as the number of patient comorbidities increased. Table 3 lists selected results from our regression models. Comprehensive tables for each outcome’s model are presented in Appendices 1 to 3.
In our analyses of specific complications, there were no significant associations between weekend admissions and risk of acute renal failure, wound hemorrhage, wound disruption, wound infection, deep vein thrombosis, myocardial infarction, pneumonia, pulmonary embolism, sepsis, urinary tract infection, implant infection, or incision and débridement. In addition, we found a lower risk of tachycardia (OR, 0.90; 95% CI, 0.82-1.00) and a higher risk (P < .10) of stroke (OR, 1.16; 95% CI, 0.99-1.35). Table 4 is a full list of the specific complications and their risks for weekend versus weekday admissions.
According to stratified analyses involving surgical delay, weekend admissions in which patients had surgery the same day as admission had decreased risk of mortality (OR, 0.81; 95% CI, 0.72-0.91) and perioperative complications (OR, 0.96; 95% CI, 0.92-0.99). In addition, hospital stay was shorter for weekend admissions with surgical delay of less than 24 hours (4.89% shorter; 95% CI, 4.22-5.55), 24 to 48 hours (5.93% shorter; 95% CI, 5.51-6.35), and 49 to 72 hours (3.50% shorter; 95% CI, 2.80-4.20). When admissions were stratified by procedure performed, patients who were admitted on the weekend and underwent ORIF, hemiarthroplasty, CRIF, internal fixation only, and THA had shorter stays than patients admitted on weekdays. For all surgeries performed, the risk of both mortality and complications did not significantly differ by day of admission. Table 5 lists the comprehensive results of all our stratified analyses.
Discussion
In this large, multiyear analysis of patients admitted for hip fracture in the United States, risk of mortality was slightly lower for weekend versus weekday admissions, hospital stay was significantly shorter, and risk of perioperative complications was not significantly different between admission types. In secondary analyses, shorter hospital stay was limited to patients who were admitted on weekends and underwent surgery within 48 hours. Our results therefore suggest that the weekend effect does not apply to hip fracture patients in the United States.
Our results are largely consistent with the literature on the topic.11-14 An Australian study of 4183 patients with acute hip fracture found no significant difference in 2- or 30-day mortality among weekend and weekday admissions.11 Similarly, 2 Danish studies did not find a difference in hospital-stay or 30-day mortality between weekend and weekday admissions among samples of 600 and 38,020 patients with hip fracture, respectively.12,13 In US patients, a cross-specialty study that included hip fractures did not find a difference in hospital-stay mortality among 22,001 admissions in the state of California in 1998.14 Our analysis significantly extended the findings of these studies by using comprehensive admission data from 46 US states over a 13-year period (1998–2010) and by examining outcomes other than mortality, including perioperative complications and length of hospital stay.
Our study had several limitations. First, the clinical data on fracture diagnoses and surgical procedures were based on ICD-9-CM codes, limiting our ability to account for the full details of fracture severity and subsequent management. Second, our analyses were limited to outcomes during the hospital stay, and we could not examine the effect of weekend admission on readmission and long-term mortality. Third, because of the dichotomization of admission day in the NIS database, we could not selectively examine the effect of Friday, Saturday, or Sunday admission on our outcomes. Fourth, we excluded admissions that were missing demographic and clinical data, potentially creating a complete-case bias. However, these exclusions were needed to accurately capture the common presentation of acute hip fracture, and there is no reason to believe that differences in record coding were nonrandom. Last, our study was observational, and we cannot rule out the effect of residual confounding on our results.
Our results failed to show a weekend effect on mortality, perioperative complications, or length of hospital stay in US patients with hip fracture. The reason for this, as suggested before,12 may be that hip fractures are becoming easier to diagnose. Furthermore, the observation that hospital stay was shorter for weekend admissions suggests that, despite decreased staffing of nursing and rehabilitation services, the lower volume of elective surgeries on weekends may actually increase staff availability to hip fracture patients.
1. Cram P, Hillis SL, Barnett M, Rosenthal GE. Effects of weekend admission and hospital teaching status on in-hospital mortality. Am J Med. 2004;117(3):151-157.
2. Saposnik G, Baibergenova A, Bayer N, Hachinski V. Weekends: a dangerous time for having a stroke? Stroke. 2007;38(4):1211-1215.
3. Busl KM, Prabhakaran S. Predictors of mortality in nontraumatic subdural hematoma. J Neurosurg. 2013;119(5):1296-1301.
4. Ananthakrishnan AN, McGinley EL, Saeian K. Outcomes of weekend admissions for upper gastrointestinal hemorrhage: a nationwide analysis. Clin Gastroenterol Hepatol. 2009;7(3):296e1-302e1.
5. Shaheen AA, Kaplan GG, Myers RP. Weekend versus weekday admission and mortality from gastrointestinal hemorrhage caused by peptic ulcer disease. Clin Gastroenterol Hepatol. 2009;7(3):303-310.
6. Deshmukh A, Pant S, Kumar G, Bursac Z, Paydak H, Mehta JL. Comparison of outcomes of weekend versus weekday admissions for atrial fibrillation. Am J Cardiol. 2012;110(2):208-211.
7. Aujesky D, Jiménez D, Mor MK, Geng M, Fine MJ, Ibrahim SA. Weekend versus weekday admission and mortality after acute pulmonary embolism. Circulation. 2009;119(7):962-968.
8. Clarke MS, Wills RA, Bowman RV, et al. Exploratory study of the ‘weekend effect’ for acute medical admissions to public hospitals in Queensland, Australia. Intern Med J. 2010;40(11):777-783.
9. Daugaard CL, Jørgensen HL, Riis T, Lauritzen JB, Duus BR, Van der mark S. Is mortality after hip fracture associated with surgical delay or admission during weekends and public holidays? A retrospective study of 38,020 patients. Acta Orthop. 2012;83(6):609-613.
10. Foss NB, Kehlet H. Short-term mortality in hip fracture patients admitted during weekends and holidays. Br J Anaesth. 2006;96(4):450-4514.
11. Shiga T, Wajima Z, Ohe Y. Is operative delay associated with increased mortality of hip fracture patients? Systematic review, meta-analysis and meta-regression. Can J Anaesth. 2008;55(3):146-154.
12. Zuckerman JD, Skovron ML, Koval KJ, Aharonoff G, Frankel VH. Postoperative complications and mortality associated with operative delay in older patients who have a fracture of the hip. J Bone Joint Surg Am. 1995;77(10):1551-1556.
13. Lefaivre KA, Macadam SA, Davidson DJ, Gandhi R, Chan H, Broekhuyse HM. Length of stay, mortality, morbidity and delay to surgery in hip fractures. J Bone Joint Surg Br. 2009;91(7):922-927.
14. Ho V, Hamilton BH, Roos LL. Multiple approaches to assessing the effects of delays for hip fracture patients in the United States and Canada. Health Serv Res. 2000;34(7):1499-1518.
15. Steiner C, Elixhauser A, Schnaier J. The Healthcare Cost and Utilization Project: an overview. Eff Clin Pract. 2002;5(3):143-151.
16. Elixhauser A, Steiner C, Harris DR, Coffey RM. Comorbidity measures for use with administrative data. Med Care. 1998;36(1):8-27.
17. Brasel KJ, Guse CE, Layde P, Weigelt JA. Rib fractures: relationship with pneumonia and mortality. Crit Care Med. 2006;34(6):1642-1646.
18. Lin CA, Kuo AC, Takemoto S. Comorbidities and perioperative complications in HIV-positive patients undergoing primary total hip and knee arthroplasty. J Bone Joint Surg Am. 2013;95(11):1028-1036.
19. Vittinghoff E, Glidden DV, Shiboski SC, McCulloch CE. Regression Methods in Biostatistics: Linear, Logistic, Survival, and Repeated Measures Models. 2nd ed. New York, NY: Springer-Verlag; 2012. Statistics for Biology and Health.

The Pathobiology of Diabetes Mellitus in Bone Metabolism, Fracture Healing, and Complications
Diabetes mellitus (DM) affects a significant portion of the world’s people, and the problem is increasing in magnitude as the population ages and becomes more obese.1 An estimated 347 million people have diabetes.1 In the United States, 26 million (roughly 8% of the population) are affected, making DM a major health issue.2 Given the prevalence of diabetes in the general population, it is not surprising that increasing numbers of fracture patients have DM. Unfortunately, for these patients, many relatively simple fractures can have disastrous outcomes. Infections and wound complications occur in disproportionate numbers, healing time is delayed, and risk for nonunion or malunion is substantially higher.3
It is imperative to understand the pathophysiology of DM to appreciate potential interventions and strategies aimed at decreasing complications and improving outcomes of fractures in patients with the disease. In type 1 DM (T1DM), autoimmune destruction of the insulin-secreting β cells in the pancreas results in a complete absence of insulin. Patients with T1DM are dependent on exogenous insulin, and, despite hyperglycemia, most cells in the body are starved for energy. This leads to a catabolic condition, high lipid and protein metabolism, and, in many cases, ketoacidosis. When insulin resistance develops, the β cells are forced to secrete large amounts of insulin; when they fail to keep up, type 2 DM (T2DM) develops. T2DM is often associated with obesity, as excess adipose tissue leads to insulin resistance. Although exogenous insulin may be necessary to treat advanced T2DM, other medications are commonly used to effectively lower blood glucose: Secretagogues (eg, sulfonylureas) facilitate insulin release from β cells, and sensitizers (eg, metformin) increase insulin sensitivity.4,5
The potential morbidity of fractures in patients with DM can be appreciated with the example of ankle fractures. These typically uncomplicated fractures can have very poor outcomes in the setting of DM. In a prospective study of approximately 1500 patients with ankle fractures treated with open reduction and internal fixation, Wukich and colleagues6 found that 9.5% of patients with DM (vs 2.4% of patients without DM) developed surgical site infections. As defined by Jones and colleagues,7 major complications of treating ankle fractures in patients with DM include infection, malunion, nonunion, Charcot arthropathy, and amputation. The authors reported major complications in 31% and 17% of patients with and without DM, respectively. Highlighting the importance of glycemic control, Wukich and colleagues6 found relative risks of 3.8 for infection, 3.4 for noninfectious complications, and 5.0 for revision in complicated (vs uncomplicated) fractures in patients with DM.
Given the magnitude of problems in the treatment of fractures in patients with DM, we focus our review on the pathobiology of diabetes in terms of bone metabolism and fracture healing, wound healing and vasculopathy, infection, and potential new treatment modalities.
Bone Metabolism and Fracture Healing in Diabetes
Insulin appears to play a role in bone metabolism and fracture healing. Therefore, absence of insulin in T1DM and elevated insulin levels associated with T2DM likely influence these metabolic and fracture-healing processes. Insulin has been hypothesized to have an anabolic effect on bone, and in both human and animal models bone mineral density (BMD) is significantly lower in T1DM. Furthermore, BMD in T2DM has been shown to be normal or even elevated.8 Other metabolic effects of insulin on bone metabolism and growth include slower growth rates and lower BMD in pediatric patients with T1DM versus patients without diabetes, and some animal models show bone microarchitecture altered in the absence of insulin (and reversible with insulin supplementation).9 These factors seem to contradict the markedly elevated risk for osteoporotic fracture in patients with T2DM, but the mechanisms responsible for this have not been elucidated.8
In terms of fracture healing, resorption of cartilage during transition to hard callus appears to be influenced by diabetes. It has been hypothesized that the smaller callus observed in diabetic mice may be secondary to upregulation of osteoclasts. Initial callus size appears not to differ between mice with streptozotocin-induced diabetes, which exhibit a complete absence of insulin, and control mice, but levels of osteoclast and osteoclastogenesis mediators were significantly higher in the diabetic mice.10 Some investigators think that the reduction in cartilage callus size in diabetic mice is caused by altered mRNA expression and collagen production.11 Diabetic mice, in addition to showing increased resorption by osteoclasts, demonstrate increased chondrocyte apoptosis, which is thought to activate cartilage resorption events. Exogenous insulin effectively reverses this cartilage loss to baseline levels.12
Osteoblasts are a crucial component of the fracture-healing cascade, and acute and chronic hyperglycemia, the hallmark of diabetes, has a variety of effects on osteoblasts.13 Genes for cell-signal proteins such as osteocalcin, MMP-13, and vascular endothelial growth factor are downregulated in the presence of chronic hyperglycemia, whereas genes for alkaline phosphate are upregulated. Acute hyperglycemia by way of hyperosmolarity is associated with MMP-13 downregulation. Thus, osteoblasts appear to respond to hyperglycemia through 2 different processes: Hyperosmolarity, through osteoblast cell shrinkage, influences the acute response, and hyperglycemia itself, through pathways such as nonenzymatic glycosylation, protein kinase C (PKC) signaling, and the polyol pathway, is the force behind the chronic response.14 The lineage of osteoblasts from mesenchymal stem cells also can be affected by hyperglycemia, with lower growth rates for mesenchymal stem cells and preferential development toward the adipocyte lineage, while the osteoblast and chondrocyte lineages are downregulated.15
Increased osteoblast apoptosis has been associated with diabetes through advanced glycation end-products (AGEs), which modify the structure and function of bioactive compounds through AGE receptors that cross-link and bond to amino groups on bioactive molecules.16 It has been reported that AGEs interfere with osteoblast development and collagen and osteocalcin production.17 A common AGE, carboxymethyl lysine-modified collagen, has been associated with a significant increase in apoptosis through the mitogen-activated protein kinase (MAPK) pathway. Although most of the literature suggests that osteoblast apoptosis is activated by hypoxia, nitric oxide, or integrins, these factors all have the MAPK pathway in common.18
Osteoclasts are also influenced by diabetes. Recent work in T1DM demonstrated that osteoclasts are hyperactive and more sensitive to receptor activator of nuclear factor kB ligand (RANKL) compared with osteoclasts from the population without diabetes. It is also known that osteoclasts are under the control of immunologic mediators like lipopolysaccharide (LPS), a surface component of gram-negative bacteria, and various other proinflammatory cytokines. In patients with diabetes, osteoclasts react differently to LPS and other proinflammatory cytokines, at times with opposing effects, including secretion of RANKL to stimulate resorption by the osteoclast, and precursors preventing progression into osteoclasts. In healthy people, high LPS levels not only prevent precursors from producing more osteoclasts, but promote them to mature into immune-like cells that actually phagocytose bacteria. So, in a state of infection, precursors shift from bone-resorbing osteoclasts to protective immune cells. This phenomenon does not occur in patients with diabetes, in whom the osteoclasts instead resorb more bone and stimulate inflammation by releasing cytokines.19
Interestingly, osteoblasts and osteoclasts are also affected by medications commonly used to treat diabetes. Thiazolidinediones are a class of sensitizers often used to treat patients with T2DM. Thiazolidinediones, particularly rosiglitazone, have been associated with increased bone loss primarily caused by increased bone resorption by osteoclasts.20 In addition, some investigators think that thiazolidinediones induce osteocyte apoptosis, contributing to impaired bone growth.8 Metformin, an insulin sensitizer, appears to have a positive effect on bone growth and fracture risk by enhancing osteoblastogenesis and inhibiting osteoclastogenesis, leading to a protective effect on bone.8
Peripheral neuropathy, which is often associated with diabetes, appears to play a major role in fracture-healing complications, even more so than hyperglycemia does. A recent clinical paper found that patients with diabetic neuropathy had a 44% risk of foot and ankle fracture-healing complications.21 Regardless of the risk, the pathogenesis of diabetic neuropathy can be caused by several mechanisms. Neural tissue does not require insulin for glucose uptake; therefore, in a state of hyperglycemia, aldose reductase shunts glucose to sorbitol while using protective glutathione and generating reactive oxygen species. This oxidative stress results in nerve damage or neuropathy. Microangiopathy, which we discuss in more detail later, also contributes to the development of neuropathy, through compromised flow of blood to neural tissue.22 Another mechanism contributing to diabetic neuropathy involves PKC, which is activated by 1,2-diacylglycerol in the presence of glucose, leading to vascular changes that restrict the flow of blood to peripheral nerves.23 Finally, AGEs may also participate by altering nerve function after binding to neural tissue.
Charcot neuroarthropathy is a complication associated with diabetes, particularly after injury in which chronic inflammation results in damage to the joint through fracture, dislocation, and osteolytic bony destruction. The pathophysiology is attributed to repeated microtrauma caused by loss of protective sensibility and hyperemia caused by dysregulation.24 Sympathetic and sensory nerve fibers are associated with bone, but a few serve as mechanoreceptors and nociceptors, which can activate substance P, calcitonin gene-related peptide, and vasoactive intestinal peptide—neuropeptides all thought to be involved in the inflammatory process, and in the activation of osteoblasts and osteoclasts. In diabetic neuropathy, many of these neuropeptides show a reduced regulation response, which can lead to impaired fracture healing. In particular, osteoclast activity is upregulated, and consequently bone resorption is increased. In addition to the neuropeptides mentioned, RANKL is one mechanism by which this upregulation occurs.25
It is clear that bone metabolism and fracture healing are complex processes. In the patient with diabetes, many factors are affected, including BMD, bone microarchitecture and bone growth, cartilage resorption during callus formation, osteoblast and osteoclast activation through both altered responses to cell signals and pharmacologic interactions, and, finally, peripheral neuropathy. Given the complex interactions described, it is likely that these factors in combination, as well as those yet undiscovered, negatively affect fracture healing.
Wound Healing and Vasculopathy in Diabetes
Bone healing and soft-tissue healing depend on many of the same factors. Therefore, interactions between neuropathy and vasculopathy can have a tremendous influence on wound healing in patients with diabetes. The vascular pathology that occurs in diabetes depends in part on the fact that endothelial cells do not require insulin for glucose uptake and therefore are more susceptible to damage by hyperglycemia. As already discussed, shunting of glucose through the polyol pathway with the resultant oxidative stress is partly responsible for angiopathy in diabetes.
Also as already discussed, AGEs affect intracellular processes by protein binding and gene regulation and by disrupting the communication between cells and the surrounding matrix. From an extracellular standpoint, AGEs bind to circulating proteins, promoting inflammation and upregulation/downregulation of growth factors, including endothelial nitric oxide synthase, a critical vasodilator. Endothelin 1, on the other hand, is a potent vasoconstrictor. It is upregulated while transforming growth factor b and plasminogen activator inhibitor 1 are upregulated, resulting in further vascular damage.26 The common mechanism for this vasculopathy appears to be superoxide production in the mitochondria, caused by excess glucose oxidation forcing coenzyme Q to donate electrons to oxygen, producing the superoxides. Superoxides in turn inhibit glyceraldehyde 3-phosphate dehydrogenase, which activates the polyol pathway, AGE formation, PKC, and the hexosamine pathway.26 In addition to coenzyme Q, several other enzymes generate reactive oxygen species, including nicotinamide adenine dinucleotide phosphate oxidase, aldehyde oxidase, xanthine oxidase, and glucose oxidase.27 These reactive oxygen species exacerbate oxidative stress, leading to further endothelial cell damage, and cause vascular smooth muscle injury.28
Further influencing the wound-healing environment are the effects of diabetes on blood vessel maintenance and repair as well as angiogenesis in response to local-tissue hypoxia. Vessel-repair mechanisms require endothelial progenitor cells (EPCs), which are released in response to cytokines and neural impulses.29 Bone marrow–derived EPCs have inadequate proliferative and migratory ability in patients with diabetes.28,30 In a diabetic mouse model, EPCs appear in the bone marrow at normal levels, but levels in circulation are lower than anticipated, because of poor proliferation and mobilization, it is thought. In terms of local-tissue hypoxia, hypoxia-inducible factor 1 (HIF-1) is an important transcription factor that promotes the expression of genes that in turn induce angiogenesis. The mechanism of this response is complex, and hyperglycemia has the potential to interfere in various steps of the cycle. In response to local-tissue hypoxia, the HIF-1a subunit must localize to the target site, where it combines with HIF-1b to create the active dimer, HIF-1.31 This active dimer is regulated through degradation of the a subunit in the presence of normal oxygen levels. However, in a state of hypoxia, the molecule is stabilized, promoting angiogenesis and fibroblast migration.32 Recent evidence suggests that hyperglycemia interferes with the dimerization process and that there is a failure of HIF-1a to locate into the nucleus, which is crucial for gene upregulation.31-33
Infection in Diabetes
Throughout the literature, the risk for infection after fracture is consistently higher in patients with diabetes than without diabetes. There likely are many contributing factors, including diminished blood flow and vasculopathy as well as a dampened immune response as a result of defective granulocytic, phagocytic, and chemotactic functions and defective macrophagic activity. Typically, polymorphonuclear leukocytes (PMNs) migrate to bacteria and initiate bacteriocidal activity, and then macrophages phagocytize PMNs and other damaged cells. PMNs demonstrate impaired function in patients with diabetes—reduced phagocytic response and respiratory burst as well as chemotaxis impairment. The diminished phagocytic potential is substantial, with experiments showing an almost 50% reduction in ingestion of Staphylococcus aureus in a patient with diabetes than in one without diabetes.34 Expression of surface integrins, which mediate PMN adhesion to the basement membrane of the tissue, appears to be negatively altered in both T1DM and T2DM, furthering diminishing the chemotactic response of PMNs.35 Impaired leukocyte function may also be a downstream effect of vasculopathy and associated hypoxia/hypoxemia as PMNs use superoxide radicals and other oxidizing agents to create a bacteriocidal environment that is negatively impacted in a low oxygen state.3 In addition, macrophages are disabled in patients with diabetes. (In rats with streptozotocin-induced diabetes, there is inadequate activation of macrophages in the early stages of healing.36) Furthermore, AGEs similar to those mentioned earlier have a significant negative impact on macrophagic function.37 Thus, both the activation and the activity of macrophages appear to be impeded in the setting of diabetes.
Potential New Treatment Modalities
There is tremendous potential for clinical intervention to prevent pathologic outcomes in patients with diabetes, given the complex tissue, cellular, and molecular interactions, particularly those caused by hyperglycemia. At the bone tissue level, increased osteoclastic activity in patients with diabetes has been associated with many complications, including Charcot arthropathy. RANKL modulates differentiation and activation of osteoclasts; thus, RANKL inhibition is a possible therapeutic target.38 Elevated AGE levels have also been observed in patients with Charcot arthropathy, and RAGE, the receptor for AGE, has been seen at lower than expected levels in patients with diabetes. RAGE appears to provide a protective effect against excessive bone resorption; therefore, treatment that increases RAGE levels—such as angiotensin-converting-enzyme inhibitors, statins, and glitazones—may be capable of mitigating the osteoclastic effects in Charcot arthropathy.39
AGE formation appears to be central to many pathologic processes in diabetes, so it is a logical therapeutic target, particularly for pathologic processes at the vascular tissue level. Aminoguanidine is an anti-AGE agent that was initially used to prevent diabetic retinopathy, but it has also been shown to prevent general vascular complications in diabetic animal models. The terminal amino residue in the compound specifically binds glucose-derived reactive intermediates and prevents cross-linking, which renders them inactive. Disrupting those cross-links is another treatment strategy. N-phenacylthiazolium bromide and 3-phenacyl-4,5-dimethylthiazolium chloride (ALT-711 or alagebrium) are compounds that have been shown to break cross-links in a diabetic rat model.16
Another tactic for reducing vascular pathology involves mitigating superoxide radicals, as these radicals are generated from the glycolytic intermediates in hyperglycemic states. It has been reasoned that, if the concentration of these intermediates can be decreased, there would be less substrate available for the pathways that lead to radical formation. One approach is to use transketolase, an enzyme that shunts intermediates to pathways that do not produce superoxide radicals. In the treatment of patients with diabetic retinopathy, early data appear promising with benfotiamine, a thiamine derivative, which upregulates transketolase 250%. An additional tactic involves catalytic antioxidants—namely, superoxide dismutase/catalase mimetic, which has been shown to reduce hyperglycemia-induced superoxides. These interventions are appealing because of their nonstoichiometric reactions, which render them potentially more potent antioxidants.26
Potential neurologic interventions include recombinant human nerve growth factor, neurotrophic factors, and gene therapy, all directed toward preventing or regenerating neuropathic tissues in patients with diabetes. Most of these interventions, however, remain theoretical. Few trials have demonstrated clinically significant improvement. In patients with T1DM, however, the absence of circulating C-peptide is thought to contribute to diabetic neuropathy. Results of trials with subcutaneous C-peptide treatment suggest improvement in both sural sensory and vibration perception after only 12 weeks.40 These novel treatments further emphasize the potential for intervention at the tissue, cellular, and molecular levels.
Conclusion
Whereas most fractures are uncomplicated in healthy patients, they can have devastating consequences in patients with diabetes. In this review, we have highlighted many of the pathologic processes that can influence outcomes of fractures in patients with diabetes. These problems will become more common as the population ages, age-related risks for osteoporosis and fragility fracture increase, and diabetes becomes nearly epidemic in our increasingly obese, sedentary society. Although some progress has been made, a more thorough intervention strategy is needed to improve both bone and soft-tissue outcomes of fractures in patients with diabetes.
1. Danaei G, Finucane MM, Lu Y, et al; Global Burden of Metabolic Risk Factors of Chronic Diseases Collaborating Group (Blood Glucose). National, regional, and global trends in fasting plasma glucose and diabetes prevalence since 1980: systematic analysis of health examination surveys and epidemiological studies with 370 country-years and 2.7 million participants. Lancet. 2011;378(9785):31-40.
2. Centers for Disease Control and Prevention. National Diabetes Fact Sheet: National Estimates and General Information on Diabetes and Prediabetes in the United States, 2011. Atlanta, GA: Centers for Disease Control and Prevention, US Dept of Health and Human Services; 2011.
3. Wukich DK, Joseph A, Ryan M, Ramirez C, Irrgang JJ. Outcomes of ankle fractures in patients with uncomplicated versus complicated diabetes. Foot Ankle Int. 2011;32(2):120-130.
4. Kumar V, Abbas AK, Fausto N, Robbins SL, Cotran RS. Pathologic Basis of Disease. 8th ed. Philadelphia, PA: Elsevier Saunders; 2010.
5. Diabetes basics. Centers for Disease Control and Prevention website. http://www.cdc.gov/diabetes/basics/index.html. Updated October 25, 2014. Accessed August 24, 2015.
6. Wukich DK, McMillen RL, Lowery NJ, Frykberg RG. Surgical site infections after foot and ankle surgery. Diabetes Care. 2001;34(10):2211-2213.
7. Jones KB, Maiers-Yelden KA, Marsh JL, et al. Ankle fractures in patients with diabetes mellitus. J Bone Joint Surg Br. 2005;87(4):489-495.
8. Yan W, Li X. Impact of diabetes and its treatments on skeletal diseases. Front Med. 2013;7(1):81-90.
9. Thrailkill K, Lumpkin C Jr, Bunn R, Kemp S, Fowlkes J. Is insulin an anabolic agent in bone? Dissecting the diabetic bone for clues. Am J Physiol Endocrinol Metab. 2005;289(5):E735-E745.
10. Kayal RA, Tsatsas D, Bauer MA, et al. Diminished bone formation during diabetic fracture healing is related to the premature resorption of cartilage associated with increased osteoclast activity. J Bone Miner Res. 2007;22(4):560-568.
11. Gooch HL, Hale JE, Fujioka H, Balian G, Hurwitz SR. Alterations of cartilage and collagen expression during fracture healing in experimental diabetes. Connect Tissue Res. 2000;41(2):81-91.
12. Kayal RA, Alblowi J, McKenzie E, et al. Diabetes causes the accelerated loss of cartilage during fracture repair which is reversed by insulin treatment. Bone. 2009;44(2):357-363.
13. Motyl K, Botolin S, Irwin R, et al. Bone inflammation and altered gene expression with type I diabetes early onset. J Cell Physiol. 2009;218(3):575-583.
14. Botolin S, McCabe LR. Chronic hyperglycemia modulates osteoblast gene expression through osmotic and non-osmotic pathways. J Cell Biochem. 2006;99(2):411-424.
15. Keats E, Khanz ZA. Unique responses of stem cell-derived vascular endothelial and mesenchymal cells to high levels of glucose. PLoS One. 2012;7(6):e38752.
16. Vlassara H, Palace MR. Diabetes and advanced glycation endproducts. J Intern Med. 2002;251(2):87-101.
17. Fong Y, Edelstein D, Wang E, Brownlee M. Inhibition of matrix-induced bone differentiation by advanced glycation end-products in rats. Diabetologia. 1993;36(9):802-807.
18. Alikhani M, Alikhani Z, Boyd C, et al. Advanced glycation endproducts stimulate osteoblast apoptosis via the MAP kinase and cytosolic apoptotic pathways. Bone. 2007;40(2):345-353.
19. Catalfamo DL, Calderon NL, Harden SW, Sorenson HL, Neiva KG, Wallet SM. Augmented LPS responsiveness in type 1 diabetes-derived osteoclasts. J Cell Physiol. 2013;228(2):349-361.
20. Kahn SE, Lachin JM, Zinman B, et al; ADOPT Study Group. Effects of rosiglitazone, glyburide, and metformin on β-cell function and insulin sensitivity in ADOPT. Diabetes. 2011;60(5):1552-1560.
21. Shibuya N, Humphers JM, Fluhman BL, Jupiter DC. Factors associated with nonunion, delayed union, and malunion in foot and ankle surgery in diabetic patients. J Foot Ankle Surg. 2013;52(2):207-211.
22. Shami SK, Chittenden SJ. Microangiopathy in diabetes mellitus: II. Features, complications and investigation. Diabetes Res. 1991;17(4):157-168.
23. Nishikawa T, Edelstein D, Du XL, et al. Normalizing mitochondrial superoxide production blocks three pathways of hyperglycemic damage. Nature. 2000;404(6779):787-790.
24. Jeffcoate WJ. Theories concerning the pathogenesis of the acute Charcot foot suggest future therapy. Curr Diab Rep. 2005;5(6):430-435.
25. Lerner UH, Persson E. Osteotropic effects by the neuropeptides calcitonin gene-related peptide, substance P and vasoactive intestinal peptide. J Musculoskelet Neuronal Interact. 2008;8(2):154-165.
26. Brownlee M. The pathobiology of diabetic complications—a unifying mechanism. Diabetes. 2005;54(6):1615-1625.
27. Tsuji S, Taniuchi S, Hasui M, Yamamoto A, Kobayashi Y. Increased nitric oxide production by neutrophils from patients with chronic granulomatous disease on trimethoprim-sulfamethoxazole. Nitric Oxide. 2002;7(4):283-288.
28. Kolluru GK, Bir SC, Kevil CG. Endothelial dysfunction and diabetes: effects on angiogenesis, vascular remodeling, and wound healing. Int J Vasc Med. 2012;2012:918267.
29. Westerweel PE. Impaired endothelial progenitor cell mobilization and dysfunctional bone marrow stroma in diabetes mellitus. PLoS One. 2013;8(3):e60357.
30. Fadini GP, Avogaro A. It is all in the blood: the multifaceted contribution of circulating progenitor cells in diabetic complications. Exp Diabetes Res. 2012;2012:742976.
31. Gadad PC, Matthews KH, Knott RM. Role of HIF1α and PKCβ in mediating the effect of oxygen and glucose in a novel wound assay. Microvasc Res. 2013;88:61-69.
32. Botusan IR, Sunkari VG, Savu O, et al. Stabilization of HIF-1alpha is critical to improve wound healing in diabetic mice. Proc Natl Acad Sci U S A. 2008;105(49):19426-19431.
33. Catrina SB, Okamoto K, Pereira T, Brismar K, Poellinger L. Hyperglycemia regulates hypoxia-inducible factor-1alpha protein stability and function. Diabetes. 2004;53(12):3226-3232.
34. Marhoffer W, Stein M, Maeser E, Federlin K. Impairment of polymorphonuclear leukocyte function and metabolic control of diabetes. Diabetes Care. 1992;15(2):256-260.
35. Calmi G, Montana M, Citarella R, Porretto F, Catania A, Lo Presti R. Polymorphonuclear leukocyte integrin profile in diabetes mellitus. Clin Hemorheol Microcirc. 2002;27(2):83-89.
36. Miao M, Niu Y, Xie T, Yuan B, Qing C, Lu S. Diabetes-impaired wound healing and altered macrophage activation: a possible pathophysiologic correlation. Wound Repair Regen. 2012;20(2):203-213.
37. Liu BF, Miyata S, Kojima H, et al. Low phagocytic activity of resident peritoneal macrophages in diabetic mice: relevance to the formation of advanced glycation end products. Diabetes. 1999;48(10):2074-2082.
38. Mabilleau G, Petrova NL, Edmonds ME, Sabokbar A. Increased osteoclastic activity in acute Charcot’s osteoarthropathy: the role of receptor activator of nuclear factor-kappaB ligand. Diabetologia. 2008;51(6):1035-1040.
39. Witzke KA, Vinik AI, Grant LM, et al. Loss of RAGE defense: a cause of Charcot neuroarthropathy? Diabetes Care. 2011;34(7):1617-1621.
40. Pittenger G, Vinik A. Nerve growth factor and diabetic neuropathy. Exp Diabesity Res. 2003;4(4):271-285.
Diabetes mellitus (DM) affects a significant portion of the world’s people, and the problem is increasing in magnitude as the population ages and becomes more obese.1 An estimated 347 million people have diabetes.1 In the United States, 26 million (roughly 8% of the population) are affected, making DM a major health issue.2 Given the prevalence of diabetes in the general population, it is not surprising that increasing numbers of fracture patients have DM. Unfortunately, for these patients, many relatively simple fractures can have disastrous outcomes. Infections and wound complications occur in disproportionate numbers, healing time is delayed, and risk for nonunion or malunion is substantially higher.3
It is imperative to understand the pathophysiology of DM to appreciate potential interventions and strategies aimed at decreasing complications and improving outcomes of fractures in patients with the disease. In type 1 DM (T1DM), autoimmune destruction of the insulin-secreting β cells in the pancreas results in a complete absence of insulin. Patients with T1DM are dependent on exogenous insulin, and, despite hyperglycemia, most cells in the body are starved for energy. This leads to a catabolic condition, high lipid and protein metabolism, and, in many cases, ketoacidosis. When insulin resistance develops, the β cells are forced to secrete large amounts of insulin; when they fail to keep up, type 2 DM (T2DM) develops. T2DM is often associated with obesity, as excess adipose tissue leads to insulin resistance. Although exogenous insulin may be necessary to treat advanced T2DM, other medications are commonly used to effectively lower blood glucose: Secretagogues (eg, sulfonylureas) facilitate insulin release from β cells, and sensitizers (eg, metformin) increase insulin sensitivity.4,5
The potential morbidity of fractures in patients with DM can be appreciated with the example of ankle fractures. These typically uncomplicated fractures can have very poor outcomes in the setting of DM. In a prospective study of approximately 1500 patients with ankle fractures treated with open reduction and internal fixation, Wukich and colleagues6 found that 9.5% of patients with DM (vs 2.4% of patients without DM) developed surgical site infections. As defined by Jones and colleagues,7 major complications of treating ankle fractures in patients with DM include infection, malunion, nonunion, Charcot arthropathy, and amputation. The authors reported major complications in 31% and 17% of patients with and without DM, respectively. Highlighting the importance of glycemic control, Wukich and colleagues6 found relative risks of 3.8 for infection, 3.4 for noninfectious complications, and 5.0 for revision in complicated (vs uncomplicated) fractures in patients with DM.
Given the magnitude of problems in the treatment of fractures in patients with DM, we focus our review on the pathobiology of diabetes in terms of bone metabolism and fracture healing, wound healing and vasculopathy, infection, and potential new treatment modalities.
Bone Metabolism and Fracture Healing in Diabetes
Insulin appears to play a role in bone metabolism and fracture healing. Therefore, absence of insulin in T1DM and elevated insulin levels associated with T2DM likely influence these metabolic and fracture-healing processes. Insulin has been hypothesized to have an anabolic effect on bone, and in both human and animal models bone mineral density (BMD) is significantly lower in T1DM. Furthermore, BMD in T2DM has been shown to be normal or even elevated.8 Other metabolic effects of insulin on bone metabolism and growth include slower growth rates and lower BMD in pediatric patients with T1DM versus patients without diabetes, and some animal models show bone microarchitecture altered in the absence of insulin (and reversible with insulin supplementation).9 These factors seem to contradict the markedly elevated risk for osteoporotic fracture in patients with T2DM, but the mechanisms responsible for this have not been elucidated.8
In terms of fracture healing, resorption of cartilage during transition to hard callus appears to be influenced by diabetes. It has been hypothesized that the smaller callus observed in diabetic mice may be secondary to upregulation of osteoclasts. Initial callus size appears not to differ between mice with streptozotocin-induced diabetes, which exhibit a complete absence of insulin, and control mice, but levels of osteoclast and osteoclastogenesis mediators were significantly higher in the diabetic mice.10 Some investigators think that the reduction in cartilage callus size in diabetic mice is caused by altered mRNA expression and collagen production.11 Diabetic mice, in addition to showing increased resorption by osteoclasts, demonstrate increased chondrocyte apoptosis, which is thought to activate cartilage resorption events. Exogenous insulin effectively reverses this cartilage loss to baseline levels.12
Osteoblasts are a crucial component of the fracture-healing cascade, and acute and chronic hyperglycemia, the hallmark of diabetes, has a variety of effects on osteoblasts.13 Genes for cell-signal proteins such as osteocalcin, MMP-13, and vascular endothelial growth factor are downregulated in the presence of chronic hyperglycemia, whereas genes for alkaline phosphate are upregulated. Acute hyperglycemia by way of hyperosmolarity is associated with MMP-13 downregulation. Thus, osteoblasts appear to respond to hyperglycemia through 2 different processes: Hyperosmolarity, through osteoblast cell shrinkage, influences the acute response, and hyperglycemia itself, through pathways such as nonenzymatic glycosylation, protein kinase C (PKC) signaling, and the polyol pathway, is the force behind the chronic response.14 The lineage of osteoblasts from mesenchymal stem cells also can be affected by hyperglycemia, with lower growth rates for mesenchymal stem cells and preferential development toward the adipocyte lineage, while the osteoblast and chondrocyte lineages are downregulated.15
Increased osteoblast apoptosis has been associated with diabetes through advanced glycation end-products (AGEs), which modify the structure and function of bioactive compounds through AGE receptors that cross-link and bond to amino groups on bioactive molecules.16 It has been reported that AGEs interfere with osteoblast development and collagen and osteocalcin production.17 A common AGE, carboxymethyl lysine-modified collagen, has been associated with a significant increase in apoptosis through the mitogen-activated protein kinase (MAPK) pathway. Although most of the literature suggests that osteoblast apoptosis is activated by hypoxia, nitric oxide, or integrins, these factors all have the MAPK pathway in common.18
Osteoclasts are also influenced by diabetes. Recent work in T1DM demonstrated that osteoclasts are hyperactive and more sensitive to receptor activator of nuclear factor kB ligand (RANKL) compared with osteoclasts from the population without diabetes. It is also known that osteoclasts are under the control of immunologic mediators like lipopolysaccharide (LPS), a surface component of gram-negative bacteria, and various other proinflammatory cytokines. In patients with diabetes, osteoclasts react differently to LPS and other proinflammatory cytokines, at times with opposing effects, including secretion of RANKL to stimulate resorption by the osteoclast, and precursors preventing progression into osteoclasts. In healthy people, high LPS levels not only prevent precursors from producing more osteoclasts, but promote them to mature into immune-like cells that actually phagocytose bacteria. So, in a state of infection, precursors shift from bone-resorbing osteoclasts to protective immune cells. This phenomenon does not occur in patients with diabetes, in whom the osteoclasts instead resorb more bone and stimulate inflammation by releasing cytokines.19
Interestingly, osteoblasts and osteoclasts are also affected by medications commonly used to treat diabetes. Thiazolidinediones are a class of sensitizers often used to treat patients with T2DM. Thiazolidinediones, particularly rosiglitazone, have been associated with increased bone loss primarily caused by increased bone resorption by osteoclasts.20 In addition, some investigators think that thiazolidinediones induce osteocyte apoptosis, contributing to impaired bone growth.8 Metformin, an insulin sensitizer, appears to have a positive effect on bone growth and fracture risk by enhancing osteoblastogenesis and inhibiting osteoclastogenesis, leading to a protective effect on bone.8
Peripheral neuropathy, which is often associated with diabetes, appears to play a major role in fracture-healing complications, even more so than hyperglycemia does. A recent clinical paper found that patients with diabetic neuropathy had a 44% risk of foot and ankle fracture-healing complications.21 Regardless of the risk, the pathogenesis of diabetic neuropathy can be caused by several mechanisms. Neural tissue does not require insulin for glucose uptake; therefore, in a state of hyperglycemia, aldose reductase shunts glucose to sorbitol while using protective glutathione and generating reactive oxygen species. This oxidative stress results in nerve damage or neuropathy. Microangiopathy, which we discuss in more detail later, also contributes to the development of neuropathy, through compromised flow of blood to neural tissue.22 Another mechanism contributing to diabetic neuropathy involves PKC, which is activated by 1,2-diacylglycerol in the presence of glucose, leading to vascular changes that restrict the flow of blood to peripheral nerves.23 Finally, AGEs may also participate by altering nerve function after binding to neural tissue.
Charcot neuroarthropathy is a complication associated with diabetes, particularly after injury in which chronic inflammation results in damage to the joint through fracture, dislocation, and osteolytic bony destruction. The pathophysiology is attributed to repeated microtrauma caused by loss of protective sensibility and hyperemia caused by dysregulation.24 Sympathetic and sensory nerve fibers are associated with bone, but a few serve as mechanoreceptors and nociceptors, which can activate substance P, calcitonin gene-related peptide, and vasoactive intestinal peptide—neuropeptides all thought to be involved in the inflammatory process, and in the activation of osteoblasts and osteoclasts. In diabetic neuropathy, many of these neuropeptides show a reduced regulation response, which can lead to impaired fracture healing. In particular, osteoclast activity is upregulated, and consequently bone resorption is increased. In addition to the neuropeptides mentioned, RANKL is one mechanism by which this upregulation occurs.25
It is clear that bone metabolism and fracture healing are complex processes. In the patient with diabetes, many factors are affected, including BMD, bone microarchitecture and bone growth, cartilage resorption during callus formation, osteoblast and osteoclast activation through both altered responses to cell signals and pharmacologic interactions, and, finally, peripheral neuropathy. Given the complex interactions described, it is likely that these factors in combination, as well as those yet undiscovered, negatively affect fracture healing.
Wound Healing and Vasculopathy in Diabetes
Bone healing and soft-tissue healing depend on many of the same factors. Therefore, interactions between neuropathy and vasculopathy can have a tremendous influence on wound healing in patients with diabetes. The vascular pathology that occurs in diabetes depends in part on the fact that endothelial cells do not require insulin for glucose uptake and therefore are more susceptible to damage by hyperglycemia. As already discussed, shunting of glucose through the polyol pathway with the resultant oxidative stress is partly responsible for angiopathy in diabetes.
Also as already discussed, AGEs affect intracellular processes by protein binding and gene regulation and by disrupting the communication between cells and the surrounding matrix. From an extracellular standpoint, AGEs bind to circulating proteins, promoting inflammation and upregulation/downregulation of growth factors, including endothelial nitric oxide synthase, a critical vasodilator. Endothelin 1, on the other hand, is a potent vasoconstrictor. It is upregulated while transforming growth factor b and plasminogen activator inhibitor 1 are upregulated, resulting in further vascular damage.26 The common mechanism for this vasculopathy appears to be superoxide production in the mitochondria, caused by excess glucose oxidation forcing coenzyme Q to donate electrons to oxygen, producing the superoxides. Superoxides in turn inhibit glyceraldehyde 3-phosphate dehydrogenase, which activates the polyol pathway, AGE formation, PKC, and the hexosamine pathway.26 In addition to coenzyme Q, several other enzymes generate reactive oxygen species, including nicotinamide adenine dinucleotide phosphate oxidase, aldehyde oxidase, xanthine oxidase, and glucose oxidase.27 These reactive oxygen species exacerbate oxidative stress, leading to further endothelial cell damage, and cause vascular smooth muscle injury.28
Further influencing the wound-healing environment are the effects of diabetes on blood vessel maintenance and repair as well as angiogenesis in response to local-tissue hypoxia. Vessel-repair mechanisms require endothelial progenitor cells (EPCs), which are released in response to cytokines and neural impulses.29 Bone marrow–derived EPCs have inadequate proliferative and migratory ability in patients with diabetes.28,30 In a diabetic mouse model, EPCs appear in the bone marrow at normal levels, but levels in circulation are lower than anticipated, because of poor proliferation and mobilization, it is thought. In terms of local-tissue hypoxia, hypoxia-inducible factor 1 (HIF-1) is an important transcription factor that promotes the expression of genes that in turn induce angiogenesis. The mechanism of this response is complex, and hyperglycemia has the potential to interfere in various steps of the cycle. In response to local-tissue hypoxia, the HIF-1a subunit must localize to the target site, where it combines with HIF-1b to create the active dimer, HIF-1.31 This active dimer is regulated through degradation of the a subunit in the presence of normal oxygen levels. However, in a state of hypoxia, the molecule is stabilized, promoting angiogenesis and fibroblast migration.32 Recent evidence suggests that hyperglycemia interferes with the dimerization process and that there is a failure of HIF-1a to locate into the nucleus, which is crucial for gene upregulation.31-33
Infection in Diabetes
Throughout the literature, the risk for infection after fracture is consistently higher in patients with diabetes than without diabetes. There likely are many contributing factors, including diminished blood flow and vasculopathy as well as a dampened immune response as a result of defective granulocytic, phagocytic, and chemotactic functions and defective macrophagic activity. Typically, polymorphonuclear leukocytes (PMNs) migrate to bacteria and initiate bacteriocidal activity, and then macrophages phagocytize PMNs and other damaged cells. PMNs demonstrate impaired function in patients with diabetes—reduced phagocytic response and respiratory burst as well as chemotaxis impairment. The diminished phagocytic potential is substantial, with experiments showing an almost 50% reduction in ingestion of Staphylococcus aureus in a patient with diabetes than in one without diabetes.34 Expression of surface integrins, which mediate PMN adhesion to the basement membrane of the tissue, appears to be negatively altered in both T1DM and T2DM, furthering diminishing the chemotactic response of PMNs.35 Impaired leukocyte function may also be a downstream effect of vasculopathy and associated hypoxia/hypoxemia as PMNs use superoxide radicals and other oxidizing agents to create a bacteriocidal environment that is negatively impacted in a low oxygen state.3 In addition, macrophages are disabled in patients with diabetes. (In rats with streptozotocin-induced diabetes, there is inadequate activation of macrophages in the early stages of healing.36) Furthermore, AGEs similar to those mentioned earlier have a significant negative impact on macrophagic function.37 Thus, both the activation and the activity of macrophages appear to be impeded in the setting of diabetes.
Potential New Treatment Modalities
There is tremendous potential for clinical intervention to prevent pathologic outcomes in patients with diabetes, given the complex tissue, cellular, and molecular interactions, particularly those caused by hyperglycemia. At the bone tissue level, increased osteoclastic activity in patients with diabetes has been associated with many complications, including Charcot arthropathy. RANKL modulates differentiation and activation of osteoclasts; thus, RANKL inhibition is a possible therapeutic target.38 Elevated AGE levels have also been observed in patients with Charcot arthropathy, and RAGE, the receptor for AGE, has been seen at lower than expected levels in patients with diabetes. RAGE appears to provide a protective effect against excessive bone resorption; therefore, treatment that increases RAGE levels—such as angiotensin-converting-enzyme inhibitors, statins, and glitazones—may be capable of mitigating the osteoclastic effects in Charcot arthropathy.39
AGE formation appears to be central to many pathologic processes in diabetes, so it is a logical therapeutic target, particularly for pathologic processes at the vascular tissue level. Aminoguanidine is an anti-AGE agent that was initially used to prevent diabetic retinopathy, but it has also been shown to prevent general vascular complications in diabetic animal models. The terminal amino residue in the compound specifically binds glucose-derived reactive intermediates and prevents cross-linking, which renders them inactive. Disrupting those cross-links is another treatment strategy. N-phenacylthiazolium bromide and 3-phenacyl-4,5-dimethylthiazolium chloride (ALT-711 or alagebrium) are compounds that have been shown to break cross-links in a diabetic rat model.16
Another tactic for reducing vascular pathology involves mitigating superoxide radicals, as these radicals are generated from the glycolytic intermediates in hyperglycemic states. It has been reasoned that, if the concentration of these intermediates can be decreased, there would be less substrate available for the pathways that lead to radical formation. One approach is to use transketolase, an enzyme that shunts intermediates to pathways that do not produce superoxide radicals. In the treatment of patients with diabetic retinopathy, early data appear promising with benfotiamine, a thiamine derivative, which upregulates transketolase 250%. An additional tactic involves catalytic antioxidants—namely, superoxide dismutase/catalase mimetic, which has been shown to reduce hyperglycemia-induced superoxides. These interventions are appealing because of their nonstoichiometric reactions, which render them potentially more potent antioxidants.26
Potential neurologic interventions include recombinant human nerve growth factor, neurotrophic factors, and gene therapy, all directed toward preventing or regenerating neuropathic tissues in patients with diabetes. Most of these interventions, however, remain theoretical. Few trials have demonstrated clinically significant improvement. In patients with T1DM, however, the absence of circulating C-peptide is thought to contribute to diabetic neuropathy. Results of trials with subcutaneous C-peptide treatment suggest improvement in both sural sensory and vibration perception after only 12 weeks.40 These novel treatments further emphasize the potential for intervention at the tissue, cellular, and molecular levels.
Conclusion
Whereas most fractures are uncomplicated in healthy patients, they can have devastating consequences in patients with diabetes. In this review, we have highlighted many of the pathologic processes that can influence outcomes of fractures in patients with diabetes. These problems will become more common as the population ages, age-related risks for osteoporosis and fragility fracture increase, and diabetes becomes nearly epidemic in our increasingly obese, sedentary society. Although some progress has been made, a more thorough intervention strategy is needed to improve both bone and soft-tissue outcomes of fractures in patients with diabetes.
1. Danaei G, Finucane MM, Lu Y, et al; Global Burden of Metabolic Risk Factors of Chronic Diseases Collaborating Group (Blood Glucose). National, regional, and global trends in fasting plasma glucose and diabetes prevalence since 1980: systematic analysis of health examination surveys and epidemiological studies with 370 country-years and 2.7 million participants. Lancet. 2011;378(9785):31-40.
2. Centers for Disease Control and Prevention. National Diabetes Fact Sheet: National Estimates and General Information on Diabetes and Prediabetes in the United States, 2011. Atlanta, GA: Centers for Disease Control and Prevention, US Dept of Health and Human Services; 2011.
3. Wukich DK, Joseph A, Ryan M, Ramirez C, Irrgang JJ. Outcomes of ankle fractures in patients with uncomplicated versus complicated diabetes. Foot Ankle Int. 2011;32(2):120-130.
4. Kumar V, Abbas AK, Fausto N, Robbins SL, Cotran RS. Pathologic Basis of Disease. 8th ed. Philadelphia, PA: Elsevier Saunders; 2010.
5. Diabetes basics. Centers for Disease Control and Prevention website. http://www.cdc.gov/diabetes/basics/index.html. Updated October 25, 2014. Accessed August 24, 2015.
6. Wukich DK, McMillen RL, Lowery NJ, Frykberg RG. Surgical site infections after foot and ankle surgery. Diabetes Care. 2001;34(10):2211-2213.
7. Jones KB, Maiers-Yelden KA, Marsh JL, et al. Ankle fractures in patients with diabetes mellitus. J Bone Joint Surg Br. 2005;87(4):489-495.
8. Yan W, Li X. Impact of diabetes and its treatments on skeletal diseases. Front Med. 2013;7(1):81-90.
9. Thrailkill K, Lumpkin C Jr, Bunn R, Kemp S, Fowlkes J. Is insulin an anabolic agent in bone? Dissecting the diabetic bone for clues. Am J Physiol Endocrinol Metab. 2005;289(5):E735-E745.
10. Kayal RA, Tsatsas D, Bauer MA, et al. Diminished bone formation during diabetic fracture healing is related to the premature resorption of cartilage associated with increased osteoclast activity. J Bone Miner Res. 2007;22(4):560-568.
11. Gooch HL, Hale JE, Fujioka H, Balian G, Hurwitz SR. Alterations of cartilage and collagen expression during fracture healing in experimental diabetes. Connect Tissue Res. 2000;41(2):81-91.
12. Kayal RA, Alblowi J, McKenzie E, et al. Diabetes causes the accelerated loss of cartilage during fracture repair which is reversed by insulin treatment. Bone. 2009;44(2):357-363.
13. Motyl K, Botolin S, Irwin R, et al. Bone inflammation and altered gene expression with type I diabetes early onset. J Cell Physiol. 2009;218(3):575-583.
14. Botolin S, McCabe LR. Chronic hyperglycemia modulates osteoblast gene expression through osmotic and non-osmotic pathways. J Cell Biochem. 2006;99(2):411-424.
15. Keats E, Khanz ZA. Unique responses of stem cell-derived vascular endothelial and mesenchymal cells to high levels of glucose. PLoS One. 2012;7(6):e38752.
16. Vlassara H, Palace MR. Diabetes and advanced glycation endproducts. J Intern Med. 2002;251(2):87-101.
17. Fong Y, Edelstein D, Wang E, Brownlee M. Inhibition of matrix-induced bone differentiation by advanced glycation end-products in rats. Diabetologia. 1993;36(9):802-807.
18. Alikhani M, Alikhani Z, Boyd C, et al. Advanced glycation endproducts stimulate osteoblast apoptosis via the MAP kinase and cytosolic apoptotic pathways. Bone. 2007;40(2):345-353.
19. Catalfamo DL, Calderon NL, Harden SW, Sorenson HL, Neiva KG, Wallet SM. Augmented LPS responsiveness in type 1 diabetes-derived osteoclasts. J Cell Physiol. 2013;228(2):349-361.
20. Kahn SE, Lachin JM, Zinman B, et al; ADOPT Study Group. Effects of rosiglitazone, glyburide, and metformin on β-cell function and insulin sensitivity in ADOPT. Diabetes. 2011;60(5):1552-1560.
21. Shibuya N, Humphers JM, Fluhman BL, Jupiter DC. Factors associated with nonunion, delayed union, and malunion in foot and ankle surgery in diabetic patients. J Foot Ankle Surg. 2013;52(2):207-211.
22. Shami SK, Chittenden SJ. Microangiopathy in diabetes mellitus: II. Features, complications and investigation. Diabetes Res. 1991;17(4):157-168.
23. Nishikawa T, Edelstein D, Du XL, et al. Normalizing mitochondrial superoxide production blocks three pathways of hyperglycemic damage. Nature. 2000;404(6779):787-790.
24. Jeffcoate WJ. Theories concerning the pathogenesis of the acute Charcot foot suggest future therapy. Curr Diab Rep. 2005;5(6):430-435.
25. Lerner UH, Persson E. Osteotropic effects by the neuropeptides calcitonin gene-related peptide, substance P and vasoactive intestinal peptide. J Musculoskelet Neuronal Interact. 2008;8(2):154-165.
26. Brownlee M. The pathobiology of diabetic complications—a unifying mechanism. Diabetes. 2005;54(6):1615-1625.
27. Tsuji S, Taniuchi S, Hasui M, Yamamoto A, Kobayashi Y. Increased nitric oxide production by neutrophils from patients with chronic granulomatous disease on trimethoprim-sulfamethoxazole. Nitric Oxide. 2002;7(4):283-288.
28. Kolluru GK, Bir SC, Kevil CG. Endothelial dysfunction and diabetes: effects on angiogenesis, vascular remodeling, and wound healing. Int J Vasc Med. 2012;2012:918267.
29. Westerweel PE. Impaired endothelial progenitor cell mobilization and dysfunctional bone marrow stroma in diabetes mellitus. PLoS One. 2013;8(3):e60357.
30. Fadini GP, Avogaro A. It is all in the blood: the multifaceted contribution of circulating progenitor cells in diabetic complications. Exp Diabetes Res. 2012;2012:742976.
31. Gadad PC, Matthews KH, Knott RM. Role of HIF1α and PKCβ in mediating the effect of oxygen and glucose in a novel wound assay. Microvasc Res. 2013;88:61-69.
32. Botusan IR, Sunkari VG, Savu O, et al. Stabilization of HIF-1alpha is critical to improve wound healing in diabetic mice. Proc Natl Acad Sci U S A. 2008;105(49):19426-19431.
33. Catrina SB, Okamoto K, Pereira T, Brismar K, Poellinger L. Hyperglycemia regulates hypoxia-inducible factor-1alpha protein stability and function. Diabetes. 2004;53(12):3226-3232.
34. Marhoffer W, Stein M, Maeser E, Federlin K. Impairment of polymorphonuclear leukocyte function and metabolic control of diabetes. Diabetes Care. 1992;15(2):256-260.
35. Calmi G, Montana M, Citarella R, Porretto F, Catania A, Lo Presti R. Polymorphonuclear leukocyte integrin profile in diabetes mellitus. Clin Hemorheol Microcirc. 2002;27(2):83-89.
36. Miao M, Niu Y, Xie T, Yuan B, Qing C, Lu S. Diabetes-impaired wound healing and altered macrophage activation: a possible pathophysiologic correlation. Wound Repair Regen. 2012;20(2):203-213.
37. Liu BF, Miyata S, Kojima H, et al. Low phagocytic activity of resident peritoneal macrophages in diabetic mice: relevance to the formation of advanced glycation end products. Diabetes. 1999;48(10):2074-2082.
38. Mabilleau G, Petrova NL, Edmonds ME, Sabokbar A. Increased osteoclastic activity in acute Charcot’s osteoarthropathy: the role of receptor activator of nuclear factor-kappaB ligand. Diabetologia. 2008;51(6):1035-1040.
39. Witzke KA, Vinik AI, Grant LM, et al. Loss of RAGE defense: a cause of Charcot neuroarthropathy? Diabetes Care. 2011;34(7):1617-1621.
40. Pittenger G, Vinik A. Nerve growth factor and diabetic neuropathy. Exp Diabesity Res. 2003;4(4):271-285.
Mentoring that takes it up a notch
Everything seems to be extreme nowadays – “Extreme Makeover: Home Edition,” “Extreme Weight Loss,” even “Extreme Fishing” and “Extreme Couponing” – so it was only a matter of time that extreme came to cardiothoracic surgery.
Dr. Michael K. Pasque of Washington University in St. Louis explored “Extreme Mentoring in Cardiothoracic Surgery” in his commentary published online ahead of print for the October issue of the Journal of Thoracic and Cardiovascular Surgery (J Thorac Cardiovasc Surg. 2015 doi: 10.1016/j.jtcvs.2015.04.056).

Meaningful mentoring “carries with it considerable responsibility. Extreme mentoring comes only at a price – it is going to cost us,” Dr. Pasque wrote, calling on academic cardiothoracic surgical mentors to perform a self-appraisal of their commitment and mentoring skills. He even developed a self-appraisal checklist that involves 37 different markers in four different categories: general; goals, pathways, and meetings; milestone timelines and taking action; and clinical assistance.
The first step in extreme mentoring for the academic cardiothoracic surgeon is to focus exclusively on the mentee. “As cardiothoracic surgeons, we are used to having the attention focused on us,” Dr. Pasque noted, but mentoring is different: the “energy of our relationship” must focus on the mentee.
The next step involves an objective assessment of the mentee. “If we are to throw our support wholeheartedly behind our mentee, we must genuinely believe in them,” he said. This assessment leads to setting goals for the mentee. “My formula is to honestly estimate the surgical, research, teaching and academic life goals that are both desired by and within reach of our mentee – and then double them,” he said. “We must set very aggressive goals for our mentee.”
Achieving those goals involves directing mentees to the right pathway and then helping them stay on that pathway despite obstacles. “When their progress through these barriers is discussed – and that should be often – then ours should be the voice that reminds them that despite the momentary setbacks, the goals we have set are going to happen,” Dr. Pasque said.
The process involves frequent “and substantive” meetings between mentor and mentee and establishing timelines for achieving milestones and goals. The mentor must back up what happens in those meetings with action – both overt, like assisting them in surgery or introducing them to influential colleagues, and covert in ways the mentee may never know about.
One “clandestine” operation involves the mentor keeping an updated list of 10 individuals who have the most to offer the mentee, “especially in areas in which we have limited or no influence,” and habitually following up with them. The mentor must be willing to “pick a fight” so the mentee doesn’t get left behind on call while senior colleagues attend meetings.
“We must be the senior voice that speaks up for them,” Dr. Pasque wrote. “They need to attend these meetings, even if it is we who must stay behind in their place.”
The mentoring process involves being across the operating room table from them at key milestones in their surgical development and being on-call 24/7 for the mentee. That may seem like extreme handholding to some critics, but Dr. Pasque said that letting a patient suffer or die is inexcusable. “Our first priority is always the patient’s well-being.”
The mentor must show respect to the mentee and practice “extreme encouragement,” especially in the operating room. “There is something magical about being told you are a good surgeon,” he said. “You become one.” This isn’t about falsely building up the mentee, but instilling the confidence to act on the patient’s behalf. The mentee will face enough doubters. “We must be the voice that assures them otherwise,” he said.
Teaching leadership also is key for the mentor. Mentors teach leadership by modeling it. “The best leaders are always those who place the needs of others above their own,” Dr. Pasque pointed out, harkening back to putting the focus on the mentee. “We can’t teach them to put the needs of others above their own without putting their needs about ours.”
Ultimately, the mentor’s greatest desire should be that the mentee exceeds them, “that they make everyone forget about us,” Dr. Pasque said. That would be the “crowning achievement” that would make the mentor “most unforgettable.”
Dr. Pasque had no disclosures.
Everything seems to be extreme nowadays – “Extreme Makeover: Home Edition,” “Extreme Weight Loss,” even “Extreme Fishing” and “Extreme Couponing” – so it was only a matter of time that extreme came to cardiothoracic surgery.
Dr. Michael K. Pasque of Washington University in St. Louis explored “Extreme Mentoring in Cardiothoracic Surgery” in his commentary published online ahead of print for the October issue of the Journal of Thoracic and Cardiovascular Surgery (J Thorac Cardiovasc Surg. 2015 doi: 10.1016/j.jtcvs.2015.04.056).
Meaningful mentoring “carries with it considerable responsibility. Extreme mentoring comes only at a price – it is going to cost us,” Dr. Pasque wrote, calling on academic cardiothoracic surgical mentors to perform a self-appraisal of their commitment and mentoring skills. He even developed a self-appraisal checklist that involves 37 different markers in four different categories: general; goals, pathways, and meetings; milestone timelines and taking action; and clinical assistance.
The first step in extreme mentoring for the academic cardiothoracic surgeon is to focus exclusively on the mentee. “As cardiothoracic surgeons, we are used to having the attention focused on us,” Dr. Pasque noted, but mentoring is different: the “energy of our relationship” must focus on the mentee.
The next step involves an objective assessment of the mentee. “If we are to throw our support wholeheartedly behind our mentee, we must genuinely believe in them,” he said. This assessment leads to setting goals for the mentee. “My formula is to honestly estimate the surgical, research, teaching and academic life goals that are both desired by and within reach of our mentee – and then double them,” he said. “We must set very aggressive goals for our mentee.”
Achieving those goals involves directing mentees to the right pathway and then helping them stay on that pathway despite obstacles. “When their progress through these barriers is discussed – and that should be often – then ours should be the voice that reminds them that despite the momentary setbacks, the goals we have set are going to happen,” Dr. Pasque said.
The process involves frequent “and substantive” meetings between mentor and mentee and establishing timelines for achieving milestones and goals. The mentor must back up what happens in those meetings with action – both overt, like assisting them in surgery or introducing them to influential colleagues, and covert in ways the mentee may never know about.
One “clandestine” operation involves the mentor keeping an updated list of 10 individuals who have the most to offer the mentee, “especially in areas in which we have limited or no influence,” and habitually following up with them. The mentor must be willing to “pick a fight” so the mentee doesn’t get left behind on call while senior colleagues attend meetings.
“We must be the senior voice that speaks up for them,” Dr. Pasque wrote. “They need to attend these meetings, even if it is we who must stay behind in their place.”
The mentoring process involves being across the operating room table from them at key milestones in their surgical development and being on-call 24/7 for the mentee. That may seem like extreme handholding to some critics, but Dr. Pasque said that letting a patient suffer or die is inexcusable. “Our first priority is always the patient’s well-being.”
The mentor must show respect to the mentee and practice “extreme encouragement,” especially in the operating room. “There is something magical about being told you are a good surgeon,” he said. “You become one.” This isn’t about falsely building up the mentee, but instilling the confidence to act on the patient’s behalf. The mentee will face enough doubters. “We must be the voice that assures them otherwise,” he said.
Teaching leadership also is key for the mentor. Mentors teach leadership by modeling it. “The best leaders are always those who place the needs of others above their own,” Dr. Pasque pointed out, harkening back to putting the focus on the mentee. “We can’t teach them to put the needs of others above their own without putting their needs about ours.”
Ultimately, the mentor’s greatest desire should be that the mentee exceeds them, “that they make everyone forget about us,” Dr. Pasque said. That would be the “crowning achievement” that would make the mentor “most unforgettable.”
Dr. Pasque had no disclosures.
Topical resiquimod effective for early-stage cutaneous T-cell lymphoma
Topical resiquimod was effective and well tolerated in patients with early-stage cutaneous T-cell lymphoma (CTCL), in some cases inducing regression in both treated and untreated lesions, according to researchers.
The mean number of prior unsuccessful therapies among the patients was 6, yet the majority of patients (11 of 12) experienced significant improvement, and 2 patients had complete clinical responses with no evidence of disease after treatment. One patient, despite a 15-year history of disease and 11 unsuccessful treatments, experienced a complete resolution of both treated and untreated skin lesions.

The open-label, phase I trial evaluated 12 patients with early-stage CTCL. Patients experienced minor adverse effects (all grade 1), which were primarily skin irritation. The trial evaluated 0.03% and 0.06% resiquimod, with complete and more rapid responses occurring at the higher dose. Both doses were equally well tolerated.
“These studies support further trials of this medication in early-stage, skin-limited CTCL and suggest resiquimod might also be useful as an adjuvant therapy in the treatment of more advanced CTCL,” wrote Dr. Alain Rook of the Department of Dermatology and the Center for Clinical Biostatistics and Epidemiology, Perelman School of Medicine, Philadelphia, and colleagues.
Arising from T cells that traffic to the skin, CTCLs are non-Hodgkin lymphomas whose only potential cure is stem cell transplantation. Studies suggest that host antitumor immunity plays an important role in the disease, and in this study, high responders showed recruitment and expansion of benign T-cell clones and activation of T cells and natural killer cells in the skin.
In the absence of cell-surface markers to distinguish malignant from benign T cells in the lesion, the team used high throughput screening of the T-cell receptor–beta gene to quantify malignant cells and monitor response to therapy. Of the 10 patients with identified malignant cells, biopsied lesions showed that most had reduction of malignant T-cell clones and 3 had complete eradication. The results may not reflect responses in nonbiopsied lesions.
Resiquimod recruits T cells and other immune cells to the skin, causing inflammation that the researchers observed persisted after complete or nearly complete malignant T-cell eradication. Study results suggested that activation of CD4+ cells and expansion of tumor-specific T cells is critical for effectiveness of resiquimod.
Topical resiquimod was effective and well tolerated in patients with early-stage cutaneous T-cell lymphoma (CTCL), in some cases inducing regression in both treated and untreated lesions, according to researchers.
The mean number of prior unsuccessful therapies among the patients was 6, yet the majority of patients (11 of 12) experienced significant improvement, and 2 patients had complete clinical responses with no evidence of disease after treatment. One patient, despite a 15-year history of disease and 11 unsuccessful treatments, experienced a complete resolution of both treated and untreated skin lesions.
The open-label, phase I trial evaluated 12 patients with early-stage CTCL. Patients experienced minor adverse effects (all grade 1), which were primarily skin irritation. The trial evaluated 0.03% and 0.06% resiquimod, with complete and more rapid responses occurring at the higher dose. Both doses were equally well tolerated.
“These studies support further trials of this medication in early-stage, skin-limited CTCL and suggest resiquimod might also be useful as an adjuvant therapy in the treatment of more advanced CTCL,” wrote Dr. Alain Rook of the Department of Dermatology and the Center for Clinical Biostatistics and Epidemiology, Perelman School of Medicine, Philadelphia, and colleagues.
Arising from T cells that traffic to the skin, CTCLs are non-Hodgkin lymphomas whose only potential cure is stem cell transplantation. Studies suggest that host antitumor immunity plays an important role in the disease, and in this study, high responders showed recruitment and expansion of benign T-cell clones and activation of T cells and natural killer cells in the skin.
In the absence of cell-surface markers to distinguish malignant from benign T cells in the lesion, the team used high throughput screening of the T-cell receptor–beta gene to quantify malignant cells and monitor response to therapy. Of the 10 patients with identified malignant cells, biopsied lesions showed that most had reduction of malignant T-cell clones and 3 had complete eradication. The results may not reflect responses in nonbiopsied lesions.
Resiquimod recruits T cells and other immune cells to the skin, causing inflammation that the researchers observed persisted after complete or nearly complete malignant T-cell eradication. Study results suggested that activation of CD4+ cells and expansion of tumor-specific T cells is critical for effectiveness of resiquimod.
FROM BLOOD
Key clinical point: Topical resiquimod was effective and well tolerated in patients with early-stage cutaneous T-cell lymphoma (CTCL).
Major finding: In total, 11 of 12 patients had significant improvement: 2 had resolution of all evidence of disease, and 9 experienced improvement greater than or equal to 50%.
Data source: The open-label, phase I trial evaluated 12 patients with early stage CTCL.
Disclosures: Dr. Rook and one coauthor have patents pending on HTS in cutaneous lymphoma. His coauthor is employed by Adaptive Biotechnologies.
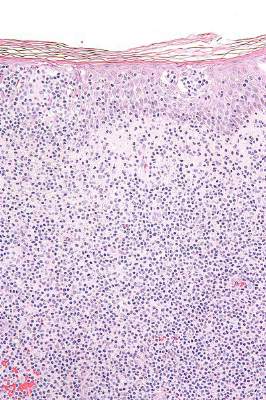
Abs from transplanted AML patients enhance GvL effect in vitro
NEW YORK—Investigators have found that B cells may play a role in stimulating graft-versus-leukemia (GvL) responses in patients with acute myeloid leukemia (AML) who have undergone allogeneic hematopoietic stem cell transplant (HSCT).
The team created B cell lines from these patients, isolated AML-specific antibodies, and found that these antibodies can induce the death of AML cells through oncosis.
Oncosis is a non-apoptotic type of cell death that involves swelling and coagulation of the cytoplasm.
Mette Hazenberg, MD, PhD, from the Academic Medical Center in Amsterdam, The Netherlands, reported these findings at the inaugural CRI-CIMT-EATI-AACR International Cancer Immunotherapy Conference as poster B052.
The investigators cloned B cells from 3 high-risk AML patients who had a strong GvL response after HSCT.
The team transduced memory B cells from the patients’ peripheral blood using BCL-6 and BCL-xL. They then screened the B cells for those that produced antibodies that bound specifically to surface antigens on AML cell lines and blasts.
Six of the 15 AML antibodies retrieved from the patients bound specifically to snRNp200. In normal cells, snRNp200 is in the nucleus, but, in AML, it is exposed on the cell membrane.
The investigators then confirmed this by ELISA.
They found 7 of the 15 AML antibodies directly lysed AML blasts without the addition of effector cells or complement. Time-lapse images showed that cell death by the AML antibodies occurred rapidly, within minutes after incubation.
“The leukemia blasts popped like balloons,” Dr Hazenberg said.
The investigators confirmed that the antibodies induced cell death by oncosis and that oncosis occurred independently of temperature. The antibodies were cytotoxic at 4°C and 37°C.
Cytotoxicity of the antibodies could be blocked by the membrane stabilizer cytochalasin D but not by apoptosis inhibitors.
The team concluded that a potent GvL response could be mediated by these antibodies against tumor-associated antigens on AML cells.
Dr Hazenberg’s hope is that, at some point, these antibodies can be combined with chemotherapy—as is rituximab—so patients won’t need to undergo transplant. ![]()
Team identifies new virus in blood supply
![]()
Photo courtesy of UAB Hospital
Scientists say they have discovered a new virus that can be transmitted through the blood supply.
It is currently unclear whether the virus is harmful or not, but researchers found that it shares genetic features with hepatitis C virus (HCV) and human
pegivirus (HPgV), which was formerly known as hepatitis G virus.
The new virus, which the researchers have named human hepegivirus-1 (HHpgV-1), is described in the journal mBio.
“HHpgV-1 is unique because it shares genetic similarity with both highly pathogenic HCV and the apparently non-pathogenic HPgV,” said study author Amit Kapoor, PhD, of Columbia University in New York, New York. “People need to be aware of this new infection in humans.”
To identify HHpgV-1, Dr Kapoor and his colleagues performed high-throughput sequencing on blood samples from 46 individuals in the Transfusion-Transmitted Viruses Study. The samples were collected between July 1974 and June 1980.
The researchers analyzed samples both pre- and post-transfusion and, along with a variety of known viruses, they identified HHpgV-1 in 2 individuals.
The virus was only present in post-transfusion samples, and additional tests showed that both patients were able to clear HHpgV-1.
Genetic analysis revealed that the virus was related to HCV and HPgV. Genomic testing of 70 additional individuals in the Transfusion-Transmitted Viruses Study did not detect further cases of HHpgV-1.
The researchers also performed high-throughput sequencing on samples from 106 individuals in the Multicenter Hemophilia Cohort Study who received plasma-derived clotting factor concentrates.
The team identified HHpgV-1 in 2 individuals, one of whom had persistent long-term infection (5.4 years).
“We just don’t know how many viruses are transmitted through the blood supply,” Dr Kapoor said. “There are so many viruses out there, and they need to be characterized in order to ensure that transfusions are safe.”
He said the next steps are to determine the prevalence of HHpgV-1 and whether it causes disease. If it causes disease, screening the blood supply for the virus will be appropriate.
“Ultimately, once we know more about this, we will look for the presence of this virus in people with certain diseases,” Dr Kapoor said.
“The unusually high infection prevalence of HCV, HBV, and HIV in hemophilia patients and other transfusion recipients could have been prevented by earlier identification of these viruses and development of accurate diagnostic assays.” ![]()
Imaging provides clearer picture of HSCs

in the bone marrow
By imaging the bone marrow of mice, researchers have uncovered new details about hematopoietic stem cells (HSCs).
The team’s deep imaging technique confirmed some previous findings and unearthed new information about where HSCs are located and how they are maintained.
The researchers said these findings, published in Nature, provide a significant advance toward understanding the microenvironment in which HSCs reside.
“The bone marrow and [HSCs] are like a haystack with needles inside,” said study author Sean Morrison, PhD, of the University of Texas Southwestern Medical Center in Dallas.
“Researchers in the past have been able to find a few stem cells, but they’ve only seen a small percentage of the stem cells that are there, so there has been some controversy about where exactly they’re located.”
“We developed a technique that allows us to digitally reconstruct the entire haystack and see all the needles—all the [HSCs] that are present in the bone marrow—and to know exactly where they are and how far they are from every other cell type.”
The team began by identifying a genetic marker that is almost exclusively expressed in HSCs. They then took green fluorescent protein from jellyfish and inserted it into the genetic marker, Ctnnal1, so they could identify the HSCs.
“Using a tissue-clearing technique that makes the bone and bone marrow see-through, and employing a high-resolution, confocal microscope to scan the entire bone marrow compartment, we were able to image large segments of bone marrow to locate every [HSC] and its relation to other cells,” said Melih Acar, PhD, also of the University of Texas Southwestern Medical Center.
The team’s work yielded new findings and confirmed others. They found that HSCs tend to be clustered in the center of the bone marrow, not closer to bone surfaces as some researchers previously thought.
They also found that HSCs are indeed associated with sinusoidal blood vessels, and there are no spatially distinct niches for dividing and non-dividing HSCs.
“With this improved understanding of the microenvironment and mechanisms that maintain [HSCs], we are closer to being able to replicate the environment for [HSCs] in culture,” Dr Morrison said.
“That achievement would significantly improve the safety and effectiveness of bone marrow transplants and potentially save thousands of additional lives each year.” ![]()
Inflammation, coagulation may contribute to CM pathogenesis
Image by Bruce Blaus
Cells associated with inflammation and coagulation accumulate in the brains of children with cerebral malaria (CM), according to research published in mBio.
The researchers studied autopsied brain tissue from more than 100 African children and found that children with CM had a more than 9-fold greater number of intravascular monocytes and platelets than children who did not have malaria.
In addition, HIV-positive children had more than twice the amount of intravascular monocytes and platelets than was observed in children who were not HIV-positive.
“Our study clearly shows that HIV exacerbates the disease process in cerebral malaria and also leads to some really interesting insights into what may be going on with children who are dying of cerebral malaria, which has been very controversial,” said study author Kami Kim, MD, of the Albert Einstein College of Medicine in the Bronx, New York.
“Children who are HIV-positive and at risk for malaria may benefit from targeted antimalaria drugs, and adjunctive therapies that target inflammation or blood clotting may improve outcomes from CM.”
CM is one of the most severe complications of malaria and can lead to behavioral problems, seizures, coma, or death. It is mainly seen in children younger than 5 living in sub-Saharan Africa.
CM is fairly rare, affecting about 2% of children with malaria, but CM is also thought to be responsible for half of malaria deaths.
“So it’s a big deal,” Dr Kim said. “The more we know about CM, the more that we can theoretically do something either to better treat or prevent it.”
With this goal in mind, Dr Kim and her colleagues analyzed children in an ongoing study of pediatric CM in Blantyre, Malawi. The researchers enrolled more than 3000 participants and completed 103 autopsies in those who died from either CM or other causes of coma.
HIV prevalence was higher than expected and led to higher mortality in CM patients. The prevalence of HIV was 14.5% in children enrolled in the study, compared to 2% in the general Malawi pediatric population.
Twenty-three percent of HIV-positive children died, while 17% of those without HIV died. Twenty percent of autopsy cases were HIV-positive.
The researchers noted that HIV-infected children with CM were older than children without HIV (an average of 99 months vs 32 months) and were not severely immunocompromised.
In addition, monocytes and platelets were significantly more prevalent in HIV-positive children with CM than neutrophils.
“We identified a unique and pervasive pathology pattern in pediatric CM, marked by monocytes and platelets, which is more severe in HIV-positive children,” Dr Kim said.
“It doesn’t prove that these cells cause clinical disease, but the fact that they’re there in huge abundance when there’s a lot of parasites is pretty strongly suggestive evidence that they’re doing something. We never see that in healthy brain tissue.”
Additional studies of children with varying severities of malaria are necessary in order to design better treatment algorithms, Dr Kim added. ![]()
Generalizations of a generalist — common themes among systemic therapies for common cancers
Click on the PDF icon at the top of this introduction to read the full article.
Click on the PDF icon at the top of this introduction to read the full article.
Click on the PDF icon at the top of this introduction to read the full article.