User login
David Henry's JCSO podcast, August 2015
In this month’s podcast for The Journal of Community and Supportive Oncology, Dr David Henry highlights a Review article on the role of targeted therapy in HIV-positive patients with lung cancer and 2 Original Reports, one on the impact of bladder volume on radiation dose to the rectum in patients with prostate cancer and a second on treatment outcomes in stage IIIA non-small-cell lung cancer in a community cancer center setting. Also discussed are a Commentary by David Cella and Lynne Wagner about re-personalizing precision medicine, and a Feature article on genomic oncology, the foundation of targeted, personalized therapies. A Community Translations article on the recent approval of the histone deacetylase inhibitor panobinostat demonstrates how a novel mechanism of action has been harnessed to produce a therapy that can extend progression-free survival in patients with relapsed multiple myeloma, and 2 Case Reports document the presentation and treatment of 2 patients with rare conditions – nonislet cell tumor-induced hypoglycemia and drug-induced immune hemolytic anemia.
In this month’s podcast for The Journal of Community and Supportive Oncology, Dr David Henry highlights a Review article on the role of targeted therapy in HIV-positive patients with lung cancer and 2 Original Reports, one on the impact of bladder volume on radiation dose to the rectum in patients with prostate cancer and a second on treatment outcomes in stage IIIA non-small-cell lung cancer in a community cancer center setting. Also discussed are a Commentary by David Cella and Lynne Wagner about re-personalizing precision medicine, and a Feature article on genomic oncology, the foundation of targeted, personalized therapies. A Community Translations article on the recent approval of the histone deacetylase inhibitor panobinostat demonstrates how a novel mechanism of action has been harnessed to produce a therapy that can extend progression-free survival in patients with relapsed multiple myeloma, and 2 Case Reports document the presentation and treatment of 2 patients with rare conditions – nonislet cell tumor-induced hypoglycemia and drug-induced immune hemolytic anemia.
In this month’s podcast for The Journal of Community and Supportive Oncology, Dr David Henry highlights a Review article on the role of targeted therapy in HIV-positive patients with lung cancer and 2 Original Reports, one on the impact of bladder volume on radiation dose to the rectum in patients with prostate cancer and a second on treatment outcomes in stage IIIA non-small-cell lung cancer in a community cancer center setting. Also discussed are a Commentary by David Cella and Lynne Wagner about re-personalizing precision medicine, and a Feature article on genomic oncology, the foundation of targeted, personalized therapies. A Community Translations article on the recent approval of the histone deacetylase inhibitor panobinostat demonstrates how a novel mechanism of action has been harnessed to produce a therapy that can extend progression-free survival in patients with relapsed multiple myeloma, and 2 Case Reports document the presentation and treatment of 2 patients with rare conditions – nonislet cell tumor-induced hypoglycemia and drug-induced immune hemolytic anemia.
Dermatoses of Pregnancy
After, test your knowledge by answering the 5 practice questions.
Practice Questions
1. Which dermatosis of pregnancy occurs during the third trimester and is associated with multiple gestation pregnancies?
a. atopic eruption of pregnancy
b. gestational pemphigoid
c. intrahepatic cholestasis of pregnancy
d. prurigo of pregnancy
e. pruritic urticarial papules and plaques of pregnancy
2. Which dermatosis of pregnancy frequently flares after delivery?
a. atopic eruption of pregnancy
b. gestational pemphigoid
c. polymorphic eruption of pregnancy
d. prurigo gravidarum
e. prurigo of pregnancy
3. Which dermatosis of pregnancy has lesions that have a predilection for the abdominal striae?
a. cholestasis of pregnancy
b. gestational pemphigoid
c. prurigo gestationis
d. prurigo of pregnancy
e. pruritic urticarial papules and plaques of pregnancy
4. Which dermatosis of pregnancy has a risk for the development of hydatidiform moles and choriocarcinomas?
a. atopic eruption of pregnancy
b. cholestasis of pregnancy
c. gestational pemphigoid
d. pruritic urticarial papules and plaques of pregnancy
e. toxic erythema of pregnancy
5. Intrahepatic cholestasis of pregnancy has been associated with:
a. fetal mortality as high as 13%
b. jaundice in 20% of cases
c. onset in the third trimester of pregnancy
d. recurrence in subsequent pregnancies
e. all of the above
The answers appear on the next page.
1. Which dermatosis of pregnancy occurs during the third trimester and is associated with multiple gestation pregnancies?
a. atopic eruption of pregnancy
b. gestational pemphigoid
c. intrahepatic cholestasis of pregnancy
d. prurigo of pregnancy
e. pruritic urticarial papules and plaques of pregnancy
2. Which dermatosis of pregnancy frequently flares after delivery?
a. atopic eruption of pregnancy
b. gestational pemphigoid
c. polymorphic eruption of pregnancy
d. prurigo gravidarum
e. prurigo of pregnancy
3. Which dermatosis of pregnancy has lesions that have a predilection for the abdominal striae?
a. cholestasis of pregnancy
b. gestational pemphigoid
c. prurigo gestationis
d. prurigo of pregnancy
e. pruritic urticarial papules and plaques of pregnancy
4. Which dermatosis of pregnancy has a risk for the development of hydatidiform moles and choriocarcinomas?
a. atopic eruption of pregnancy
b. cholestasis of pregnancy
c. gestational pemphigoid
d. pruritic urticarial papules and plaques of pregnancy
e. toxic erythema of pregnancy
5. Intrahepatic cholestasis of pregnancy has been associated with:
a. fetal mortality as high as 13%
b. jaundice in 20% of cases
c. onset in the third trimester of pregnancy
d. recurrence in subsequent pregnancies
e. all of the above

Utilization of Fusion PET/CT in Mapping Surgical/Medical Treatment Algorithms: Individualizing Patient Care for Suspicious Colorectal Masses
Purpose: Determine the utility of fusion positron emission tomography/computed tomography (PET/CT) in mapping surgical procedures for suspicious colorectal masses in the era of minimally invasive surgery—laparoscopy/robotics where haptic feedback is absent.
Background: The National Comprehensive Cancer Network (NCCN) guidelines recommend using CT of the chest, abdomen, and pelvis for colorectal cancer staging. This is largely because PET/CT is not widely available, thus limiting access. Colonoscopy is used to locate/diagnose colorectal masses. Gastroenterologists often “guestimate” the location of the lesion either by anatomical landmarks or by measurement on the colonoscope itself. These are often inaccurate. It is the standard of care to ink the location of the lesion as well. This is not always done or easy to identify. It is often necessary to perform an intraoperative colonoscopy to locate the lesion in question and then make incisions or dock the robot accordingly.
Methods: Retrospective data from a colorectal surgeon were reviewed. Surgeries performed at the Raymond G. Murphy VAMC from March 2012 to June 2015 were included. Data were reviewed for these patients to evaluate for the efficacy of fusion PET/CT studies in identifying the lesion in question regardless of benign or cancerous lesion, mapping of the planned procedure, and how it affected planned treatment algorithms.
Results: Fifty patients were referred for evaluation and treatment of a suspicious colorectal mass, and 45 patients underwent PET/CT for staging. The lesion was not PET avid in 9 patients, and 36 patients had positive findings on the study. Thirty-two of those patients had findings fairly consistent with the colonoscopy site identifiers. In 5 patients, the PET/ CT results changed the planned surgery or delayed surgery for neoadjuvant chemoradiotherapy. The nonvisualized patients were either mucinous or no residual tumor remained.
Conclusions: Although PET/CT is not the recommended staging study by NCCN guidelines for colorectal cancers, it is readily available at our VAMC and proves useful in differentiating scar from tumor when compared with CT alone. Our experience showed that PET/CT is often positive in suspicious colorectal masses, helps to map the surgery, and acts as a baseline for ongoing surveillance. It ultimately can change the entire treatment algorithm for our individual patients.
Colorectal Cancer Statistics Among Patients Reported in the Veterans Affairs Central Cancer Registry
Purpose: On average, VA patients are older and sicker than is the general population. Our objectives were to provide an overview of VA colorectal (CRC) incidence and make comparisons with the Surveillance, Epidemiology, and End Results (SEER) data, which provides U.S. cancer statistics.
Background: About 3,400 incidents of CRC are reported in the Veterans Affairs Central Cancer Registry (VACCR) annually. This equates to nearly 9% of VA cancers.
Methods/Data Analysis: Data were obtained from VACCR for incident CRC diagnosed/treated in VA from fiscal year (FY) 2009 to 2012. Using VHA Support Service Center information about the distribution of VA health care system enrollees for corresponding years, we made age and gender adjustments for the underlying VA population. Colorectal incidence among VA patients was descriptively compared with projected national 2014 CRC-specific SEER and supporting data sources.
Results: From FY 2009 to 2012, we identified 15,205 VA patients nationwide. For analysis, there were 12,551 patients (n = 322, 2.6% women; n = 12,229, 97.4% men). Among patients in the VACCR, the most common tumor location was proximal colon (n = 4,830, 38%), followed by rectum (n = 3,907, 31%), distal colon (n = 3,240, 26%), and other colon (n = 574, 5%). These percentages are comparable with those of SEER, in which proximal colon and rectum are most common. Among patients in the VACCR, SEER summary stage distribution was 44% (n = 5,517) local, 36% (n = 4,488) regional, 17% (n = 2,091) distant, and 4% (n = 455) unknown. These percentages also align with those of SEER, in which about 40% of CRC cases are diagnosed locally. Mirroring SEER, among the VACCR, overall CRC incidence rate decreased from 0.22 to 0.16 cases per 1,000 veterans in FYs 2009 and 2012, respectively.
Implications: VACCR data indicate that incident CRC in FY 2009 to 2012 approximated SEER projections during a similar time frame. National VA CRC incidence, location, and stage distribution are also similar. This suggests that despite VA patients being more complex than their general population counterparts, VA patients are generally diagnosed with comparable CRC locations and stages. This analysis also suggests that, like SEER, the VACCR may have utility for epidemiologic tracking and research.
Molecular Imaging of ER Status in Breast Cancer: A Preclinical Study
Background: Currently there are no FDA-approved imaging biomarkers capable of accurately identifying and quantitatively differentiating estrogen receptor (ER) status in breast cancer. The current preclinical study evaluated the ability of a Ga-68 positron emission tomography (PET) imaging biomarker and the analogous Lu-177 theranostic peptide construct to target and determine the status of ER expression.
Methods: Five human breast cancer cell line xenograft models were established in severe combined immunodeficiency mice. Western blot analysis confirmed the BB2r expression. The BB2r antagonist peptide construct was radiolabeled with Ga-68 and Lu-177, using fully automated radiochemistry labeling techniques. Pharmacokinetic, micro-SPECT/CT, and micro-PET/CT studies were performed.
Results: Pharmacokinetic studies confirmed that the Lu-177 construct targeted BB2r positive tissue in ER+ tumor xenograft models to a much greater extent than in ER- tumor xenograft models. In contrast, the ER-tumor xenografts demonstrated low initial uptake, followed by nearly complete washout from all tumor tissue within 24-hours after injection. The variances in tracer uptake by the tumor tissue correlated with BB2r expression via western blot analysis. Ga-68 micro-PET/CT data also correlated with the Lu-177 pharma-cokinetic studies, demonstrating visualization of BB2r+ tumor tissue with trends in standardized uptake values correlating directly with BB2r expression and ER status.
Conclusions: In summary, our study demonstrates selective tumor targeting for both a Ga-68 PET imaging biomarker and a Lu-177 theranostic agent in all breast cancer models studied. The Ga-68 PET SUV data suggest that PET imaging with this tracer or an analog of this tracer may have the potential to noninvasively differentiate ER status in vivo. Further studies are required involving an expanded panel of human cell lines and correlation with BB2 receptor expression/ER status obtained from biopsy data to confirm the potential validity of this finding.
Compared to Open Repair, EVAR Reduces Mortality up to 3 Years
NEW YORK - Endovascular repair (EVAR) of abdominal aortic aneurysms (AAAs) is associated with an initial survival advantage over open repair, according to a study of "real-world" data from California.
However, the difference disappears in the long term, researchers report in JAMA Surgery, online September 2.
Dr. David C. Chang of Harvard Medical School in Boston said by email that the study "highlights the importance of looking at real-world data in evaluating surgical options. Clinically, our study found that the survival advantage for EVAR repairs is maintained until 3 years, after which mortality was higher for patients who had EVAR repairs."
The team studied more than 23,000 patients who underwent AAA repair between 2001 and 2009. Just over half had EVAR while the remaining patients underwent open repair. Median follow-up was for three years.
EVAR was associated with improved 30-day all-cause mortality (1.54% vs. 4.74%) and significantly improved survival until three years postoperatively. After that mortality rose, and the researchers found no difference in long-term mortality for the entire cohort after adjusting for confounders (hazard ratio, 0.99; p=0.64).
EVAR was linked with a significantly higher rate of reinterventions and AAA late ruptures. At five years, for instance, the reintervention rate was 6.59% in the EVAR group vs. 1.48% in the open group.
"This is different from data from clinical trials," Dr. Chang pointed out. "The short-term survival advantage of EVAR from clinical trials data likely eroded as patient risk factors exact their toll over time. These are real-world issues and concerns that are often not captured in idealized clinical trials."
Senior author Dr. Samuel E. Wilson, of the University of California-Irvine Medical Center, added by email that EVAR is safer than the open procedure, which it has replaced. The mortality advantage last for three years, "then other morbidity, especially effects of smoking, even out survival."
Dr. Chang went on to note that "our use of data from the State of California also has an important policy implication: That many states actually have better and more complete population data than the federal government when it comes to healthcare quality. While research and policies related to healthcare quality are driven mostly by the federal government
currently (through Medicare), the federal government has limited data on patient care outside of Medicare."
"Therefore," Dr. Chang concluded, "an argument can be made that the federal government should delegate healthcare research and quality improvement responsibilities to individual states, and support state-level efforts to examine and improve healthcare quality. Healthcare, like politics, is all local."
In an accompanying editorial, Drs. Jamie E. Anderson and James W. Holcroft, of the University of California Davis Medical Center, Sacramento, observe that the study "offers a glimpse into the future of population-based health services research methods."
In a joint email, they said, "Harnessing information already captured for patient care or billing purposes to advance medical research makes sense."
First-line BV can produce high response rate in older HL patients

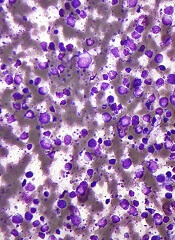
Photo from Business Wire
First-line treatment with brentuximab vedotin (BV) can produce a high response rate in older Hodgkin lymphoma (HL) patients who are unfit for chemotherapy, according to research published in Blood.
In this small study, single-agent BV produced an overall response rate of 92% and a complete response rate of 73%.
However, the drug also produced a high rate of peripheral sensory neuropathy (78%), which was the most common adverse event.
This phase 2 trial is the first to assess BV as front-line treatment. The study was funded by Seattle Genetics, Inc., which is developing BV in collaboration with Takeda Pharmaceutical Company.
Andres Forero-Torres, MD, of the University of Alabama at Birmingham, and his colleagues conducted the research, enrolling 27 HL patients (ages 64 to 92) in the trial.
The patients were either ineligible for conventional chemotherapy or declined treatment after receiving information about its risks.
They received 1.8 mg/kg of intravenous BV every 3 weeks for up to 16 doses. Those who benefitted from the drug could continue beyond this time period until disease progression, unacceptable toxicity, or study closure.
Patients received a median of 8 cycles, with 4 patients completing 16 cycles and 1 patient completing 23 cycles.
Peripheral neuropathy was the primary adverse event leading to dose modifications. Fourteen patients (52%) had dose delays, typically lasting a week (range, 1 to 3). But 11 patients (41%) had permanent dose reductions to 1.2 mg/kg.
Safety
All 27 patients were evaluable for safety, and all experienced at least 1 adverse event. The most commonly reported events were peripheral sensory neuropathy (n=21, 78%), fatigue (n=12, 44%), and nausea (n=12, 44%).
Treatment-emergent grade 3 adverse events included peripheral sensory neuropathy (n=7, 26%), rash (n=2, 7%), urinary tract infection (n=1, 4%), and maculopapular rash (n=1, 4%)
There were 2 grade 4 events—hyperuricemia and drug hypersensitivity to anesthesia—considered unrelated to BV.
Efficacy
Twenty-six patients were evaluable for efficacy. One patient was found to have nodular lymphocyte predominant HL and was therefore excluded.
The overall response rate was 92%. Nineteen patients had a complete response, 5 had a partial response, and 2 had stable disease.
The median duration of response was about 9.1 months (range, 2.8 to 20.9+ months).
The median progression-free survival was 10.5 months (range, 2.6+ to 22.3+ months), and the median overall survival had not been reached at the time of analysis (range, 4.6+ to 24.9+ months).
“While we observed promising responses,” Dr Forero-Torres said, “the next step is to evaluate this drug in combination with additional chemotherapy or immunotherapies that might allow us to prolong the response without relapse.” ![]()
Readmissions due to infection after HSCT

Photo courtesy of the CDC
SAN DIEGO—A retrospective study has provided insight into hospital readmissions related to opportunistic infection following hematopoietic stem cell transplant (HSCT).
Of the roughly 4200 HSCT recipients studied, 26% were readmitted to the hospital due to opportunistic infection.
About 1 in 3 infection-related readmissions were due to double-stranded DNA (dsDNA) viral infections, and cytomegalovirus (CMV) infections were the most common.
Nearly half of the dsDNA viral infections occurred within the first month of HSCT discharge.
These findings were presented at ICAAC/ICC 2015 (poster T-1360). The study was sponsored by Chimerix, Inc.
Investigators searched the Premier hospital database for patients who underwent HSCT between January 2009 and September 2013. The team identified 4393 patients with a mean age of 50.4 years. Most were adults (91.2%), most were male (57.9%), and most received an autologous HSCT (63.2%).
About 42% (n=1841) of patients had a diagnostic code for opportunistic infection in their HSCT discharge records. Overall, 7.3% (n=319) of patients had dsDNA virus infections, including 13.4% (n=216) of patients who received an allogeneic HSCT.
One hundred and fifty-seven patients died during HSCT hospitalization, leaving 4236 patients evaluable for readmission analysis.
In all, 37.7% (n=1595) of the surviving patients were readmitted to the hospital for any reason during the 12 months after HSCT discharge. And 65.6% of the readmissions occurred within the first 3 months of HSCT discharge.
Readmissions were most frequently related to opportunistic infections (25.8%, n=1091), followed by graft-versus-host disease (13.7%, n=579), renal impairment (11.1%, n=470), and neutropenia (10.0%, n=422).
The investigators noted that patients may have had multiple readmissions or readmission with multiple diagnoses.
Of the hospital readmissions related to opportunistic infections, 32.0% (n=349) were related to dsDNA virus infections. This included CMV (65.9%, n=230), BK virus (13.8%, n=48), adenovirus (5.2%, n=18), and other dsDNA virus infections (32.7%, n=114).
Patients may have experienced more than one viral infection, so the number of hospital readmissions related to each dsDNA virus was not mutually exclusive.
Readmission within the first month of HSCT discharge occurred in 41.8% of patients with any dsDNA virus infection, 49.6% with CMV infection, and 56.3% with BK virus infection. More than half (55.6%) of readmissions related to adenovirus infection occurred within the first 3 months of HSCT discharge.
Taking these results together, the investigators concluded that hospital readmissions related to opportunistic infections were relatively common among HSCT recipients. So strategies that minimize the risks of these infections might have significant clinical and economic advantages. ![]()
mAb gets priority review as maintenance in CLL

Photo by Linda Bartlett
The US Food and Drug Administration (FDA) has granted priority review for an application for ofatumumab (Arzerra) as maintenance therapy in
patients with relapsed chronic lymphocytic leukemia (CLL).
The FDA grants priority review to investigational therapies that, if approved, may offer significant improvements in the treatment, prevention, or diagnosis of a serious condition.
The designation shortens the review period from 10 months to 6 months.
Ofatumumab is a human monoclonal antibody (mAb) designed to target CD20 on the surface of CLL cells and normal B lymphocytes.
The mAb is already FDA-approved to treat patients with CLL that is refractory to fludarabine and alemtuzumab. Ofatumumab is also approved for use in combination with chlorambucil to treat previously untreated patients with CLL for whom fludarabine-based therapy is considered inappropriate.
The FDA said it aims to complete its review of the application for ofatumumab as maintenance therapy in relapsed CLL by January 21, 2016.
PROLONG trial
The application for ofatumumab as maintenance is based on interim results from the phase 3 PROLONG (OMB112517) trial, which were presented at ASH 2014.
In this trial, researchers compared ofatumumab maintenance to no further treatment in patients with a complete or partial response after second-
or third-line treatment for CLL.
Interim results suggested that ofatumumab significantly improves progression-free survival but not overall survival.
The median progression-free survival was about 29 months in patients who received ofatumumab and about 15 months for patients who did not receive
maintenance (P<0.0001).
There was no significant difference in the median overall survival, which was not reached in either treatment arm.
Ofatumumab development
Ofatumumab is approved in more than 50 countries worldwide as monotherapy for CLL patients who are refractory to fludarabine and alemtuzumab.
In the European Union, ofatumumab is approved for use in combination with chlorambucil or bendamustine to treat CLL patients who have not received prior therapy and who are not eligible for fludarabine-based therapy.
Ofatumumab is not approved anywhere in the world as maintenance therapy for relapsed CLL. The drug is being developed by Genmab and Novartis. ![]()
CDK inhibitor active against lymphoma too
HOUSTON—Preclinical data suggest the second-generation cyclin-dependent kinase (CDK) inhibitor CYC065 is active against lymphomas as well as leukemias.
Previous research showed that CYC065 can fight acute myeloid leukemia (AML) in vitro and in vivo.
New research shows that CYC065 can decrease cell viability in a range of B-cell lymphoma cell lines, and the drug synergizes with both venetoclax and cytarabine.
Sheelagh Frame, PhD, and her colleagues presented these results at the SOHO 2015 Annual Meeting (poster 213). All of the investigators involved in the research are employees of Cyclacel Ltd., the company developing CYC065.
The investigators analyzed the anticancer activity of CYC065 in a range of cell lines and found that CYC065 induced apoptosis by inhibiting the expression of CDK9-dependent oncogenic transcripts, including Mcl-1, c-Myc, Hoxa9, and Meis1.
Results in AML
Experiments in the AML-MLL cell line MOLM-13 showed that short pulses of CYC065 (6 hours), rather than continuous treatment, were sufficient to achieve maximal cytotoxicity.
CYC065 induced apoptosis, in a dose-dependent manner, in other AML cell lines as well, including EOL-1 (MLL-PTD), MV4-11 (MLL-AF4, FLT3-ITD, and trisomy chr 8), HL60 (Myc amplified), and Kasumi-1.
The investigators noted that AML cell lines with MLL rearrangements were especially sensitive to CYC065, and the reliance of AML on Mcl-1 confers sensitivity to CYC065.
They also found evidence to suggest that Bak and Bcl-xL levels may be predictive of CYC065 response in AML. Cell lines that were less sensitive to treatment had high levels of Bcl-xL and negligible levels of Bak.
B-cell lymphomas
In B-cell lymphoma cell lines, the investigators observed a dose-dependent reduction in cell viability after CYC065 treatment (8-hour pulses).
CYC065 proved most effective in cell lines without genomic alterations associated with poor prognosis (HT and U-698-M) and in cell lines with Myc rearrangements (SU-DHL-8 and WILL-1).
The drug also decreased cell viability—but to a lesser degree—in cell lines with Bcl-2 rearrangements (SU-DHL-4 and U2932) and in double-hit lymphoma cell lines (MAVER-1, RI-1, SC-1, and SU-DHL-10).
The investigators therefore theorized that combining CYC065 with a Bcl-2 inhibitor might prove more effective in these cell lines.
CYC065 in combination
CYC065 synergized with the Bcl-2 inhibitor venetoclax in all B-cell lymphoma cell lines tested. The drugs were “strongly synergistic” in U2932 and RI-1 cell lines but simply “synergistic” in SU-CHL-4 and MAVER-1 cell lines.
CYC065 also synergized with cytarabine to fight AML. The combination proved synergistic at a range of doses in the HL60 and MV4-11 cell lines.
Considering these results together, the investigators concluded that CYC065 has shown potential for treating a range of leukemias and lymphomas with unmet clinical need, including MLL-rearranged leukemia and Myc-driven lymphoma.
And the drug might prove effective in combination with standard cytotoxic agents or agents targeting apoptotic regulators. ![]()