User login
Monitoring microbiome may help reduce infection in AML

Photo by Rhoda Baer
SAN DIEGO—Monitoring the microbiome during chemotherapy might help reduce infections in leukemia patients, according to research presented at ICAAC/ICC 2015.
The researchers studied buccal and fecal samples from patients with acute myeloid leukemia (AML) who were undergoing induction chemotherapy.
This revealed that decreased microbial diversity was associated with an increased risk of infection.
Jessica Galloway-Peña, PhD, of The University of Texas MD Anderson Cancer Center in Houston, and her colleagues described this work in a poster presentation at the meeting (poster B-993).
The team analyzed samples from 34 AML patients. All of the patients received prophylactic antimicrobials, and 91% received systemic antibiotics. The patients received an average of 5.4 different antibiotics for an average duration of 6.5 days.
The researchers collected buccal and fecal specimens from the patients every 96 hours over the course of induction chemotherapy. This yielded 276 buccal and 202 fecal samples—an average of 8 oral and 6 stool samples per patient.
The team used 16S rRNA V4 region sequencing to assign bacterial taxa and calculate α- and β-diversities. They had a total of 16,082,550 high-quality reads.
Analyzing these data, the researchers found that decreased microbial diversity, both at baseline and throughout induction, was associated with an increased risk of infection.
“We found the baseline microbial diversities from stool samples were significantly lower in patients that developed infections during chemotherapy compared to those that did not [P=0.006],” Dr Galloway-Peña said.
She and her colleagues also found that, overall, there was a significant decrease in oral (P=0.006) and intestinal (P<0.001) microbial diversity over the course of chemotherapy, although not all patients experienced decreases. There was a linear correlation between oral and stool microbiome changes (P=0.004).
In addition, over the course of induction, there was a significant increase (P=0.02) in the rates of bacterial domination (>30% of the microbiome dominated by 1 organism) by common causes of bacteremia, such as Streptococcus, Bacteriodes, Rothia, and Staphylococcus.
However, if patients were able to maintain a healthy microbiome overall or if they experienced an increase in microbial diversity over the induction course, they remained infection-free in the 90 days after induction.
Dr Galloway-Peña and her colleagues also assessed the role common antibiotics play in microbial diversity. And they found that carbapenems significantly decreased diversity.
There was a significant difference in oral and stool diversity when patients received carbapenems for at least 72 hours and when they did not (P=0.03). But there was no significant difference for piperacillin-tazobactam (P=1.0) or cefepime (P=0.48).
“This study shows that, in the future, doctors could use microbiome sampling in order to predict the chance of infectious complications during chemotherapy and that monitoring of a patient’s microbiome during induction chemotherapy could also predict their risk for microbial-related illness during subsequent treatments,” Dr Galloway-Peña said.
In addition, monitoring the microbiome could potentially mitigate the overuse of antimicrobials by allowing physicians to stratify patients according to their risk of developing an infection. ![]()
Insights from the 5-year follow-up of CTL019 in CLL

Photo courtesy of the
University of Pennsylvania
NEW YORK—The 5-year follow-up of the phase 1 trial of CTL019 in relapsed or refractory chronic lymphoblastic leukemia (CLL) is allowing investigators to define more clearly who will respond to chimeric antigen receptor (CAR) T cells directed against CD19.
One thing investigators have determined is that persistence of the CARs is essential for long-term responses.
In the first 2 patients who achieved a complete remission (CR), CAR T cells persisted for more than 4 years. In addition, no patient in CR has relapsed to date.
Of the 14 patients enrolled in the trial, 4 (28%) achieved a CR, 4 (28%) achieved a partial response, and 6 (43%) had no response, for an overall response rate of 57%.
These results were recently published in Science Translational Medicine.
Carl June, MD, of the University of Pennsylvania in Philadelphia, shared some insights into the research with attendees at the inaugural CRI-CIMT-EATI-AACR International Cancer Immunotherapy Conference.
Dr June explained that CTL019 is a CD19-directed single chain variable fragment with a 4-1BB signaling module that transduces T cells with a lentiviral vector. The technology was developed at the University of Pennsylvania and subsequently licensed to Novartis.
In the phase 1 trial of CTL019 in CLL, patients who achieved complete remission have very high levels of CARs—100% of the circulating T cells—but the non-responders don’t. The CARs engrafted in non-responders but did not proliferate.
“So the biomarker correlate of success is persistence and proliferation, in CLL at least,” Dr June said.
The investigators performed IGH next-generation sequencing and found no detectable CLL clones in the complete responders, including 1 patient at 3.5 years and another at 4 years post-infusion.
“There was no clinically evident disease in these patients,” Dr June said, “and so the responses are durable.”
The team also believes that at least a subset of the cells remains functional because the patients still had B-cell aplasia.
The investigators have not observed a CD19 loss in any CLL patient who responded.
“Patients who have gone into remission stay in remission,” Dr June added.
Kinetics of delayed CR
Dr June discussed in detail Patient 10, whose response was somewhat different from the other complete responders. Patient 10 achieved a CR, but the response was delayed. It took 51 days after infusion, compared to about 10 days in the other complete responders.
Patient 10 was initially scored as a failure at the 28-day evaluation. Eventually, he had marked improvement, and, by a year, he was in CR.
He required hospitalization for tumor lysis syndrome and treatment with tocilizumab for cytokine release syndrome.
Patient 10 had a single cell that investigators surmise could have been responsible for the tumor elimination.
“In fact, on day 28, when he still had tumor, his CARs were polyclonal,” Dr June said. “So we stained and isolated his CARs by sorting, and, at time of tumor elimination, he had descendants of 1 CAR.”
Nevertheless, Patient 10’s response is durable. He is now 81 years old and remains engrafted with CAR19 cells.
Investigators hypothesize that the kinetics and CAR proliferation were so different in Patient 10 because Tet2 was disrupted by the integration of the CAR into the intronic region.
“What we don’t know is whether Tet2 was a passenger or a driver here,” Dr June observed. “Did it actually aid the function of the CAR cells or was it just a marker?”
He noted that Tet2 has been shown in acute myeloid leukemia to increase stem cell renewal, “and it may well have done that in this patient.” ![]()
Study reveals mechanism of multidrug resistance in malaria

Image by Peter H. Seeberger
Researchers say they have identified a mechanism of multidrug resistance in malaria that represents a major threat to antimalarial drug policy.
The team exposed a strain of malaria parasites to artemisinin (the base compound for standard therapy) long-term and found the parasites developed widespread resistance to most other antimalarial drugs.
The group also discovered that this type of resistance cannot be detected by current assays.
Françoise Benoit-Vical, PhD, of Université de Toulouse in France, and his colleagues described this work in Emerging Infectious Diseases.
The researchers set out to study resistance mechanisms in Plasmodium falciparum parasites. So they exposed the parasites to artemisinin in vitro for 5 years.
Parasites that survived in the presence of artemisinin developed resistance to most other artemisinin-based or non-artemisinin-based antimalarial therapies, including partner molecules present in combination therapies used in endemic areas.
These parasites did not exhibit any known mutation in resistance genes. However, the researchers found the parasites could circumvent the toxic effect of the drugs by quiescence.
The parasites were able to suspend their development during exposure to antimalarial agents. As soon as they were no longer subjected to antimalarial therapy, they “woke up” and began to proliferate again.
The researchers also found that multidrug resistance based on this quiescence phenomenon cannot be detected by tests currently used to analyze parasitic resistance.
“In vitro tests carried out using the patient’s blood predict high sensitivity and, therefore, the treatment’s effectiveness, while parasites are resistant because they are quiescent,” Dr Benoit-Vical said.
“As such, it is essential to conduct research with relevant and appropriate tests in the field if the multi[drug]-resistant phenomenon that we identified in vitro is also present, in order to design therapeutic strategies accordingly.” ![]()
Optimizing investment in US research

Photo by Daniel Sone
A new report suggests a need to change regulations for federally funded research in the US.
According to the report, the current regulatory burden is diminishing the effectiveness of the US scientific enterprise and lowering the return on
the federal investment in research by directing investigators’ time away from research and toward administrative matters.
The report, Optimizing the Nation’s Investment in Academic Research: A New Regulatory Framework for the 21st Century: Part 1 (2015), was
compiled by the National Academies of Sciences, Engineering, and Medicine.
“Federal regulations and reporting requirements, which began as a way to exercise responsible oversight, have increased dramatically in recent
decades and are now unduly encumbering the very research enterprise they were intended to facilitate,” said Larry Faulkner, chair of the committee that conducted the study and wrote the report, and president emeritus of the University of Texas, Austin.
“A significant amount of investigators’ time is now spent complying with regulations, taking valuable time from research, teaching, and scholarship.”
The report lists specific actions the government and research institutions should take to reduce the regulatory burden.
New framework needed
The report says a new framework is needed to approach regulation in a holistic, rather than piecemeal, way. Regulatory requirements should be harmonized across funding agencies, and we need a more effective and efficient partnership between funding agencies and research institutions.
Congress should create a Research Policy Board to serve as a public-private forum for discussions related to regulation of federally funded research programs. The board should be a government-enabled, private-sector entity that will foster more effective conception, development, and synchronization of research policies.
The board should be formally connected to government through a new associate director position at the White House Office of Science and Technology Policy (OSTP) and through the Office of Information and Regulatory Affairs at the White House Office of Management and Budget (OMB).
Strengthening the research partnership also requires that universities demand the highest standards in institutional and individual behavior, foster a culture of integrity, and mete out appropriate sanctions when behavior deviates from ethical and professional norms, the report says.
The Research Policy Board should collaborate with research institutions to develop a policy that holds universities accountable, sanctioning institutions that fail to enforce standards.
The report also recommends a number of specific actions—a sample of which are listed below—that are intended to improve the efficiency of federal regulation and reduce duplication.
Congress should:
- Work with OMB to conduct a review of agency research grant proposal documents for the purpose of developing a uniform format to be used by all funding agencies
- Work with OSTP and research institutions to develop a single financial conflict-of-interest policy to be used by all research funding agencies
- Task a single agency with overseeing and unifying efforts to develop a central database of investigators and their professional output
- Direct agencies to align and harmonize their regulations and definitions concerning the protection of human subjects
- Instruct OSTP to convene representatives from federal agencies that fund animal research and from the research community to assess and report back to Congress on the feasibility and usefulness of a unified federal approach to policies and regulations pertaining to the care and use of research animals.
The White House OMB should:
- Require that research funding agencies use a uniform format for research progress reporting
- Amend the new Uniform Guidance to improve the efficiency and consistency of procurement standards, financial reporting, and cost accounting.
Federal agencies should:
- Limit research proposals to the minimum information necessary to permit peer evaluation of the merit of the scientific questions being asked, the feasibility of answering those questions, and the ability of the investigator to carry out that research. Any supplementary information—internal review board approval, conflict-of-interest disclosures, detailed budgets, etc.—should be provided “just in time,” after the research proposal is deemed likely to be funded
- Reduce and streamline reporting, assurances, and verifications. Agencies should also develop a central repository to house assurances.
Universities should:
- Conduct a review of institutional policies developed to comply with federal regulations of research to determine whether the institution itself has created excessive or unnecessary self-imposed burden
- Revise self-imposed burdensome institutional policies that go beyond those necessary and sufficient to comply with federal, state, and local requirements.
The release of the report completes the first phase of the committee’s study, which was expedited at the request of Congress.
The committee will now continue its assessment and issue a spring 2016 addendum report addressing issues it has been unable to address in the first phase. ![]()
Taxonomy of Seven‐Day Readmissions
Unplanned hospital readmissions are regarded as a core measure of quality of care and may comprise a large avoidable cause of healthcare expenditures.[1, 2, 3, 4, 5] An estimated 20% of Medicare patients who are discharged from a hospital are readmitted within 30 days.[1, 6] This has led the Centers for Medicare & Medicaid Services and other payers to reduce reimbursements for unplanned 30‐day hospital readmissions.
Efforts to decrease readmission rates have been hampered by ineffective risk prediction models, and strategies to reduce readmissions have found limited success.[7] Understanding the mechanism of readmissions is necessary for accurate prediction and prevention. This can be achieved only through analysis of patient data and medical narratives obtained from patient interviews or detailed chart reviews.[8] Studies attempting to identify mechanisms of readmission using narrative chart reviews have been limited by small sample size, highly selected patient samples, and poor interobserver agreement.[8, 9, 10]
Our objective in this study was to identify specific mechanisms and risk factors of unplanned readmissions from the medicine service of a large urban hospital by reviewing medical charts for each case. Given the inverse relationship between time since discharge from the initial admission and the probability of an avoidable readmission,[8] we focused our review on 7‐day readmissions.
METHODS
Setting
The study took place within Bellevue Hospital Center, an 800‐bed teaching hospital that serves a culturally and racially diverse inner‐city population in New York City. Bellevue is 1 of 11 acute‐care facilities managed by Health and Hospitals Corporation. The Bellevue inpatient medicine service is staffed by board‐certified general internists (180 beds), oncologists (20 beds), and pulmonologists (20 beds), who function as hospitalists in supervision of housestaff and physicians. Their efforts are supported by case managers and social workers who meet every weekday with physicians and nurses to plan discharges as multidisciplinary teams. Weekend support is minimal, consisting of an on‐call social worker to assist with urgent matters only. Upon discharge, patients are referred directly to 1 or more of Bellevue's outpatient clinics or to their own primary care providers outside Bellevue. There is a single electronic medical record for Bellevue, which spans the full range of care provided in the outpatient clinics, emergency department, and inpatient service.
Patients
Eligible patients were discharged from the Bellevue medical service between July 1, 2010 and July 1, 2011, and readmitted to any service at Bellevue within 7 days. During the study period, there were 8421 discharges. Discharges included transfers to other hospitals or rehabilitation centers, and excluded patients who died during hospitalization. Of these, 6781 were not readmitted, 1581 were readmitted within 30 days (18.8%), and 549 were readmitted within 7 days (6.5%). From the latter group, 20 consecutive cases were excluded after use in an exploratory pilot study, 84 consecutive cases were excluded after use in a formal pilot study, leaving 445 cases, from which 400 cases were randomly selected via terminal digit of the medical record number. We selected 400 chart reviews as a reasonable sample size to provide a 95% confidence interval, with a margin of error less than 4.9% for any of the proportions of the 5 readmission categories. Of these, 65 were determined to be planned readmissions (eg, for elective chemotherapy). The remaining 335 unplanned 7‐day readmissions served as the subjects of this review. The study was approved by the institutional review board of New York University School of Medicine.
Reviewers
Three of the authors of this paper (Drs. Janjigian, Bails, and Link) were actively practicing board‐certified internal medicine physicians with 7, 19, and 26 years, respectively, of postresidency clinical experience during the review period of this study. Every case was reviewed by 2 investigators. One author (Drs. Janjigian) reviewed readmissions from the first 6 months of the calendar year, the second (Dr. Bails) reviewed readmissions from the last 6 months, and the third (Dr. Link) reviewed all 335 readmissions.
Data Collection
Using the electronic medical record, each readmission was reviewed with the intent to identify the sequence of events leading up to the readmission, most commonly achieved by analyzing the discharge summary from the initial admission and the admission note from the second admission. Further chart review was completed as necessary to establish the clearest narrative and to classify the readmission into 1 of 5 categories based on the cause. Narratives are defined here as the sequence of events leading to the readmission as determined by chart review and not by patient interviews. Narratives were recorded for each case to assist with understanding how each author determined the classification, and were used when disagreements required group consensus. Time spent on individual chart reviews varied widely, from 1 to 30 minutes, depending on the complexity of each case. For example, an against medical advice (AMA) discharge could be immediately identified in the medical record, whereas a determination that an incomplete workup was conducted would require reviewing the admission note from the readmission, the discharge summary from the index admission, review of progress and consult notes, and even vital signs, labs, and radiology.
An algorithm for classifying contributory causes of readmission into 1 of 5 categories was created from narratives compiled from a pilot of 84, 7‐day readmissions to Bellevue during the previous year. Six readmitted patients were interviewed by a study author during this pilot phase. These narratives were determined by consensus of the authors to provide no additional relevant information from that obtained through chart review alone. The 5 categories are identified in Figure 1 as follows:
- Second admission was not medically necessary.
- Second admission followed an elopement (patient left without knowledge of the hospital staff) or discharge AMA during the first admission.
- Second admission was caused by a deficiency in the discharge process of the first admission, attributable to the hospital system or providers.
- Second admission was caused by a factor attributable to the patient including substance use or nonadherence to the treatment plan from the first admission.
- Second admission was related to a complication of the primary disease or its treatment or an unrelated condition that could not reasonably have been predicted or prevented by a competent physician meeting the standard of care.
Categories 3, 4, and 5 were further divided into more specific subcategories as shown in Figure 1.
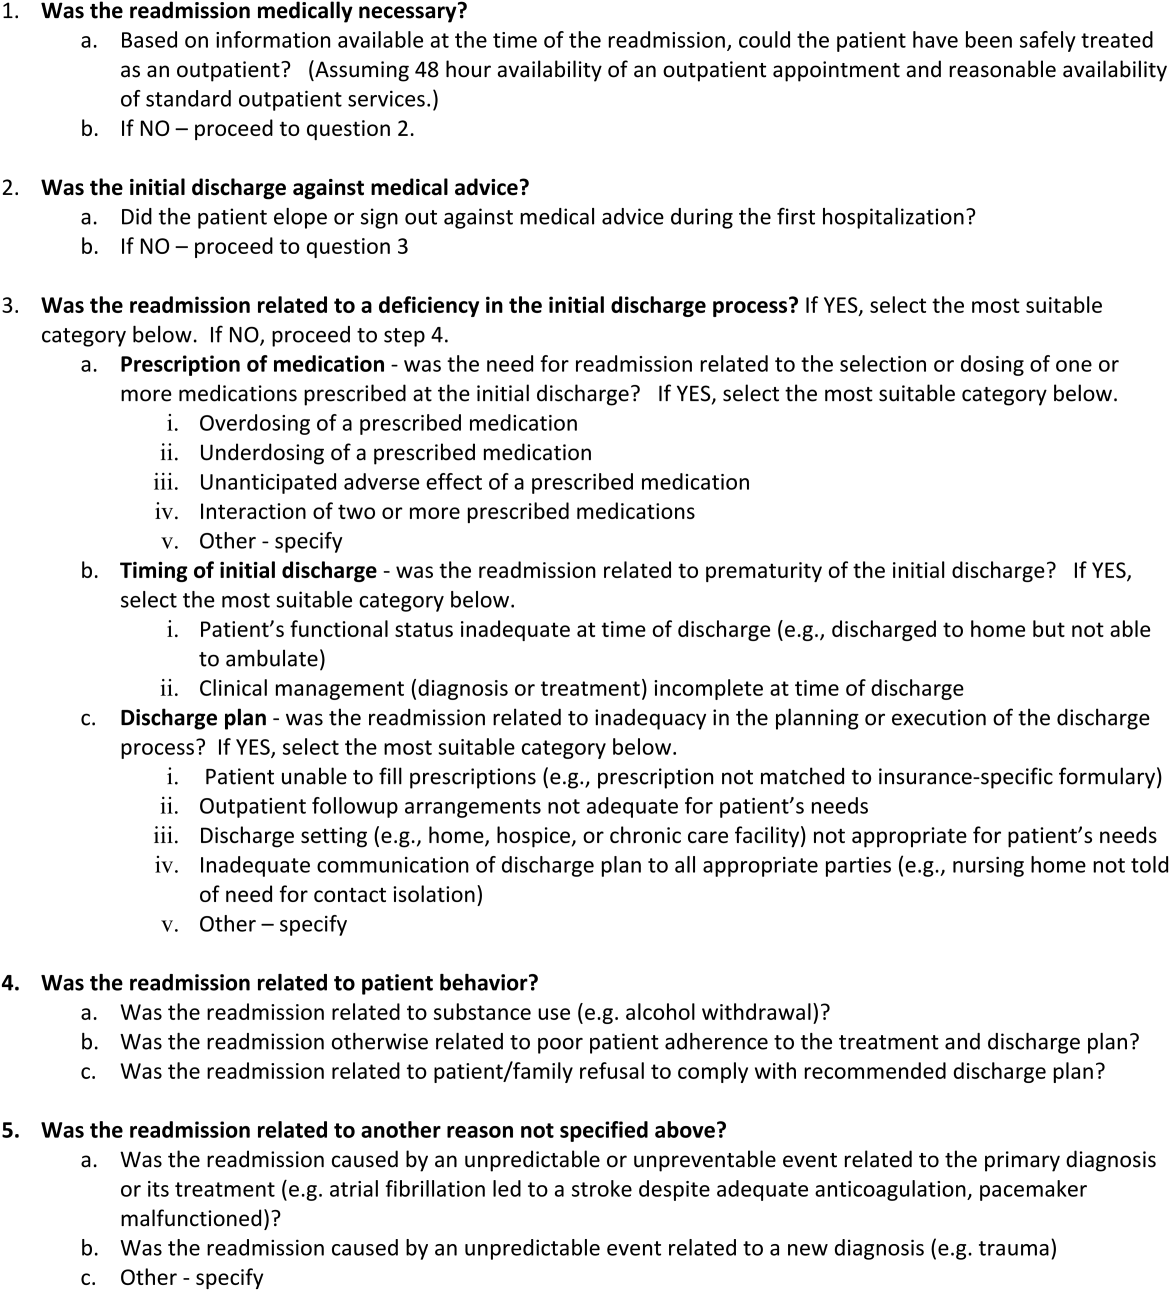
Each readmission was assigned a single category from the algorithm using a stepwise process in which a higher‐order cause excluded consideration of a downstream category. For example, if the second admission was not medically necessary (category 1), an incorrect decision to readmit the patient was considered the primary cause of the readmission, and no consideration was given to categories 2 through 5. In this manner, each patient was assigned to a single category. We considered readmissions attributable to provider error (categories 1 and 3) to be avoidable. Examples of readmissions in each category with narratives are shown in the Supporting Information, Appendix 1, in the online version of this article. Discrepancies in classification were resolved by consensus of all authors.
Statistical Analysis
Unweighted kappa values were measured to assess agreement between authors in the assignment of the major category among the 5 choices in the algorithm. [2] tests were used to compare categorical variables between 2 groups (readmitted vs not readmitted) or between several groups (5 categories of readmissions), whereas Kruskal‐Wallis tests were used for continuous variables.
Only the first readmission was used in analysis of patient characteristics when multiple readmissions occurred for an individual patient. Unique patients were used for analysis of nonreadmitted patients. The generalized estimating equation method was used to adjust for correlations between multiple readmissions within patients.
RESULTS
During this period, 270 patients accounted for 335 readmissions. Characteristics of patients readmitted within 7 days are shown in Table 1 and compared with those of patients who were not readmitted during the same study period. Patients who were readmitted were more likely to have had a longer length of stay during the first admission.
| Characteristic | Not Readmitted, n=6,781 | Readmitted, n=270 | P Value |
|---|---|---|---|
| |||
| Male gender (% of category) | 4,224 (62.3%) | 180 (66.7%) | 0.15 |
| Mean age, y (SD) | 56.1 (16.3) | 55.1 (16.3) | 0.65 |
| Median initial LOS [interquartile range] | 3 [2, 6] | 4 [2, 9] | 0.002 |
| Mean days between admissions (SD) | NA | 3.8 (2.1) | NA |
| AMA discharge (% of category) | 413 (6.1%) | 20 (7.4%) | 0.38 |
Results of categorization of readmission are shown in Table 2. Readmissions related to the discharge process (category 3) were further divided into subcategories (Table 3). Category 5 (unpredictable/unpreventable complication of primary diagnosis or unrelated event) constituted the highest percentage of readmissions at 46%, followed by category 4 (patient behavior) at 19%, category 3 (discharge process deficiency) at 17%, category 2 (AMA) at 12%, and category 1 (unnecessary admission) at 7%. Readmissions designated as preventable (categories 1 and 3) accounted for 24% of all readmissions. Readmissions due to patient factors (categories 2 and 4) accounted for 31% of all readmissions. Notably, 21% of all readmissions were due to patients who eloped or left AMA during the first discharge or who returned because of substance abuse during the interim (categories 2 and 4a). Among the preventable readmissions, the most commonly designated cause of readmission was a perceived premature discharge (category 3b2), accounting for 6% of all readmissions.
| Category 1: Second Admission Not Medically Necessary | Category 2: First Admission AMA | Category 3: Deficiency in the Discharge Process | Category 4: Patient Behavior | Category 5: Unpredictable Complication of Primary or Alternate Diagnosis | P Value* | |
|---|---|---|---|---|---|---|
| ||||||
| Total (%) | 22 (6.6%) | 39 (11.6%) | 56 (16.7%) | 63 (18.8%) | 155 (46.3%) | |
| Male (%) | 11 (50.0%) | 29 (74.4%) | 38 (67.9%) | 54 (85.7%) | 91 (58.7%) | 0.005 |
| Mean age, y (SD) | 61.8 (13.7) | 48.1 (13.2) | 58.6 (14.4) | 53.3 (11.8) | 55.1 (17.7) | 0.004 |
| Median LOS [IQR] | 2.5 [2.0, 7.0] | 2.0 [1.0, 6.0] | 5.0 [2.0, 8.5] | 4.0 [2.0, 6.0] | 5.0 [2.0, 10.0] | 0.03 |
| Mean days between admissions (SD) | 3.8 (2.2) | 3.1 (2.2) | 3.3 (2.0) | 3.8 (2.1) | 4.1 (2.1) | 0.27 |
| Category | Description | No. | % of Total |
|---|---|---|---|
| 3a1 | Overdosing of a prescribed medication | 3 | 0.9 |
| 3a2 | Underdosing of a prescribed medication | 5 | 1.5 |
| 3a3 | Adverse medication effect | 2 | 0.6 |
| 3b1 | Inadequate functional status | 3 | 0.9 |
| 3b2 | Premature discharge | 20 | 6.0 |
| 3c1 | Patient unable to fill prescriptions | 9 | 2.7 |
| 3c2 | Follow‐up arrangements inadequate | 6 | 1.8 |
| 3c3 | Discharge setting not appropriate | 5 | 1.5 |
| 3c4 | Inadequate communication of plan to receiving facility | 2 | 0.6 |
| 3c5 | Other | 1 | 0.3 |
| 4a | Patient behaviorsubstance use | 30 | 9 |
| 4b | Patient behavioradherence to discharge plan | 30 | 9 |
| 4c | Patient behaviorrefusal of discharge plan | 3 | 0.9 |
| 5a | Disease complication | 103 | 30.7 |
| 5b | Unrelated condition | 52 | 15.5 |
Variance was statistically significant across major categories for gender, mean age, and median length of stay. The interobserver level of agreement across the 5 major categories was substantial among both pairs of reviewers (Table 4).
| Pair of Reviewers | No. of Readmissions Reviewed | No. of Agreements (%) | Unweighted Kappa |
|---|---|---|---|
| Dr. LinkDr. Bails | 135 | 113 (83.7) | 0.78 |
| Dr. LinkDr. Janjigian | 200 | 163 (81.5) | 0.72 |
The 46 patients who had more than 1, 7‐day readmission during this study period were responsible for 106 readmissions. The majority of this group were readmitted twice (78%), with a range of 2 to 5 readmissions. Within this group, 24% were considered preventable readmissions (8 from category 1, 17 from category 3), and 76% were considered not preventable (10 from category 2, 27 from category 4, and 44 from category 5).
DISCUSSION
The purpose of this retrospective review was to identify causes of unplanned 7‐day readmissions after discharge from the medical service of a large urban teaching hospital. Rather than focus on risk factors for readmissions, which other studies have done, we reviewed charts of readmitted patients using a novel categorization algorithm to group patients into common mechanisms that elucidate why a particular patient was readmitted. By examining the chart in detail, we were able to identify etiologies of readmission that are potentially avoidable.
Some authors have questioned the use of readmissions as a measurement of the quality of care a hospital provides due to the high proportion of unavoidable readmissions in a given sample.[8, 10] We hoped to identify systems errors that could be targets of quality improvement initiatives, and therefore chose to focus entirely on 7‐day readmissions as these have been shown to be more preventable than 30‐day readmissions.[8] We had the ability to review any aspect of the medical chart (eg, vitals or labs on discharge, any clinical note), which provided the highest probability of discovering a systems error. Despite these efforts to identify preventable errors, we identified the most common mechanism of readmission as an unpredictable or unpreventable event related to the primary diagnosis or its treatment from the initial admission (category 5a, 30.7% of total readmissions). Review of examples from this category elucidates how an unpredictable readmission could occur within such a short time frame (see Supporting Information, Appendix 1, in the online version of this article). The 7‐day window precluded identification of clinic access barriers, thereby eliminating from analysis 1 mechanism for preventable readmissions.
Nonetheless, our study demonstrates room for improvement in provider behavior and hospital systems related to the discharge process. Nearly a quarter of all readmissions and the majority of preventable readmissions were related to systems issues, such as timing and coordination of the first discharge, and lack of medical necessity for the second admission (see Supporting Information, Appendix 1, in the online version of this article). Prior studies found that shorter length of stay was associated with increased preventable readmissions, a finding that our study does not support.[10, 11] We suspect that patients in this group had longer lengths of stay during the index hospitalization due to complexity of medical illness, limited social support network, or lack of insurance, among other factors, that exposed flaws in systems processes and provider judgment. The mechanisms of readmission related to discharge planning that we identified in this study, including comprehensiveness of care, coordination of care, and medication administration, all represent potential opportunities for intervention.
Of note, there was a high percentage of readmissions attributable to patient behaviors, such as AMA discharges, substance abuse following discharge, and nonadherence to the treatment plan. These factors are likely over‐represented in the Bellevue patient population compared to that of private hospital settings and no doubt exacerbate the readmission rates in urban hospitals treating patients with a high degree of social and behavioral health needs. Although patient‐related factors such as AMA discharges and substance abuse are potentially addressable, our reviewers felt that these were not preventable based on current knowledge and standards of care.
Studies that have attempted to classify readmissions as potentially avoidable have not shown good interobserver agreement when more than 1 reviewer was involved.[9, 10] Additionally, there is not a validated tool available to classify types of readmissions. By using a pilot sample of 84 cases to develop the model, confirming the accuracy of the chart by personally interviewing a sample of readmitted patients for comparison, and by employing experienced inpatient attending physicians to perform the reviews, we were able to develop an algorithm that achieved substantial reliability in assigning each readmission into 1 of 5 distinct categories.
Our literature search revealed only a single study that attempted to classify readmissions in a similar manner. Readmissions within 6 months at 9 Veterans Affairs hospitals were classified into causal categories of systems, provider, and patient etiology.[9] Overall, 34% of readmissions were deemed to be preventable compared to 24% in our study. Most readmissions (68%) were due to a worsening of a clinical condition, 4.5% were attributed to the admitting provider having too low a threshold to justify admission, and 2.7% were due to the patient not abstaining from drugs or alcohol. Though the study design and patient population differed from our own, the similarities in methods and results lend validity to the results and conclusions of our study.
Another limitation of our study is that readmissions to other hospitals were not included. In this respect, our estimate of the rate of readmission was an understatement of the true value. Nonetheless, the categorization of causes for readmission was not likely to be affected by the site of the second admission. Another limitation of this study was the small number of subjects reviewed relative to other studies that analyzed demographics and risk factors in large databases of readmissions.[12] However, the depth of the present review provides an understanding of the sequence of events leading to the readmission and permits development of strategies to prevent their occurrence.
We identified mechanisms of readmissions that can lay the groundwork for future interventions and safely reduce readmissions rates at little cost. To reduce admissions that may not be medically necessary, the narratives presented in the supplementary appendix suggest that improvement in communication between the admitting provider for the readmission and a provider familiar with the patient could have led to avoidance of the readmission. Similarly, enhanced communication to receiving nursing facilities would decrease the chances of the patient being immediately sent back as occurred multiple times in our cohort. Formal mandatory assessment of functional status for vulnerable patients would identify patients who may not be fully ready for discharge.
In conclusion, we found through detailed chart review of patients readmitted within 7 days to an urban teaching hospital that the majority of readmissions were not avoidable and were due to unpredictable complications of the primary diagnosis from the index hospitalization or a condition unrelated to the initial stay. This conclusion, in concurrence with those of other studies,[8, 10] questions the value of a readmission as a valid metric of quality though supports further improvements in hospital systems to reduce preventable readmissions.
Disclosure
Nothing to report.
- , , . Rehospitalizations among patients in the Medicare fee‐for‐service program. N Engl J Med. 2009;360(14):1418–1428.
- , . The rate and cost of hospital readmissions for preventable conditions. Med Care Res Rev. 2004;61(2):225–240.
- Centers for Medicare and Medicaid Services. 9th scope of work version #080108‐0. Available at: http://www.cms.gov/Medicare/Quality‐Initiatives‐Patient‐Assessment‐Instruments/QualityImprovementOrgs/downloads/9thSOWBaseContract_C_08‐01‐2008_2_.pdf. Accessed April 10, 2014.
- , . Hospital readmissions in the Medicare population. N Engl J Med. 1984;311(21):1349–1353.
- U.S. Department of Health 155(8):520–528.
- , , , et al. Incidence of potentially avoidable urgent readmissions and their relation to all‐cause urgent readmissions. CMAJ. 2011;183(14):E1067–E1072.
- , , , et al. Classifying general medicine readmissions. Are they preventable? Veterans Affairs Cooperative Studies in Health Services Group on Primary Care and Hospital Readmissions. J Gen Intern Med. 1996;11(10):597–607.
- , , , . Hospitalists assess the causes of early hospital readmissions. J Hosp Med. 2011;6(7):383–388.
- , , . Early readmissions to the department of medicine as a screening tool for monitoring quality of care problems. Medicine. 2008;87(5):294–300.
- , , , et al. Incidence and predictors of all and preventable adverse drug reactions in frail elderly persons after hospital stay. J Gerontol A Biol Sci Med Sci. 2006;61(5):511–515.
Unplanned hospital readmissions are regarded as a core measure of quality of care and may comprise a large avoidable cause of healthcare expenditures.[1, 2, 3, 4, 5] An estimated 20% of Medicare patients who are discharged from a hospital are readmitted within 30 days.[1, 6] This has led the Centers for Medicare & Medicaid Services and other payers to reduce reimbursements for unplanned 30‐day hospital readmissions.
Efforts to decrease readmission rates have been hampered by ineffective risk prediction models, and strategies to reduce readmissions have found limited success.[7] Understanding the mechanism of readmissions is necessary for accurate prediction and prevention. This can be achieved only through analysis of patient data and medical narratives obtained from patient interviews or detailed chart reviews.[8] Studies attempting to identify mechanisms of readmission using narrative chart reviews have been limited by small sample size, highly selected patient samples, and poor interobserver agreement.[8, 9, 10]
Our objective in this study was to identify specific mechanisms and risk factors of unplanned readmissions from the medicine service of a large urban hospital by reviewing medical charts for each case. Given the inverse relationship between time since discharge from the initial admission and the probability of an avoidable readmission,[8] we focused our review on 7‐day readmissions.
METHODS
Setting
The study took place within Bellevue Hospital Center, an 800‐bed teaching hospital that serves a culturally and racially diverse inner‐city population in New York City. Bellevue is 1 of 11 acute‐care facilities managed by Health and Hospitals Corporation. The Bellevue inpatient medicine service is staffed by board‐certified general internists (180 beds), oncologists (20 beds), and pulmonologists (20 beds), who function as hospitalists in supervision of housestaff and physicians. Their efforts are supported by case managers and social workers who meet every weekday with physicians and nurses to plan discharges as multidisciplinary teams. Weekend support is minimal, consisting of an on‐call social worker to assist with urgent matters only. Upon discharge, patients are referred directly to 1 or more of Bellevue's outpatient clinics or to their own primary care providers outside Bellevue. There is a single electronic medical record for Bellevue, which spans the full range of care provided in the outpatient clinics, emergency department, and inpatient service.
Patients
Eligible patients were discharged from the Bellevue medical service between July 1, 2010 and July 1, 2011, and readmitted to any service at Bellevue within 7 days. During the study period, there were 8421 discharges. Discharges included transfers to other hospitals or rehabilitation centers, and excluded patients who died during hospitalization. Of these, 6781 were not readmitted, 1581 were readmitted within 30 days (18.8%), and 549 were readmitted within 7 days (6.5%). From the latter group, 20 consecutive cases were excluded after use in an exploratory pilot study, 84 consecutive cases were excluded after use in a formal pilot study, leaving 445 cases, from which 400 cases were randomly selected via terminal digit of the medical record number. We selected 400 chart reviews as a reasonable sample size to provide a 95% confidence interval, with a margin of error less than 4.9% for any of the proportions of the 5 readmission categories. Of these, 65 were determined to be planned readmissions (eg, for elective chemotherapy). The remaining 335 unplanned 7‐day readmissions served as the subjects of this review. The study was approved by the institutional review board of New York University School of Medicine.
Reviewers
Three of the authors of this paper (Drs. Janjigian, Bails, and Link) were actively practicing board‐certified internal medicine physicians with 7, 19, and 26 years, respectively, of postresidency clinical experience during the review period of this study. Every case was reviewed by 2 investigators. One author (Drs. Janjigian) reviewed readmissions from the first 6 months of the calendar year, the second (Dr. Bails) reviewed readmissions from the last 6 months, and the third (Dr. Link) reviewed all 335 readmissions.
Data Collection
Using the electronic medical record, each readmission was reviewed with the intent to identify the sequence of events leading up to the readmission, most commonly achieved by analyzing the discharge summary from the initial admission and the admission note from the second admission. Further chart review was completed as necessary to establish the clearest narrative and to classify the readmission into 1 of 5 categories based on the cause. Narratives are defined here as the sequence of events leading to the readmission as determined by chart review and not by patient interviews. Narratives were recorded for each case to assist with understanding how each author determined the classification, and were used when disagreements required group consensus. Time spent on individual chart reviews varied widely, from 1 to 30 minutes, depending on the complexity of each case. For example, an against medical advice (AMA) discharge could be immediately identified in the medical record, whereas a determination that an incomplete workup was conducted would require reviewing the admission note from the readmission, the discharge summary from the index admission, review of progress and consult notes, and even vital signs, labs, and radiology.
An algorithm for classifying contributory causes of readmission into 1 of 5 categories was created from narratives compiled from a pilot of 84, 7‐day readmissions to Bellevue during the previous year. Six readmitted patients were interviewed by a study author during this pilot phase. These narratives were determined by consensus of the authors to provide no additional relevant information from that obtained through chart review alone. The 5 categories are identified in Figure 1 as follows:
- Second admission was not medically necessary.
- Second admission followed an elopement (patient left without knowledge of the hospital staff) or discharge AMA during the first admission.
- Second admission was caused by a deficiency in the discharge process of the first admission, attributable to the hospital system or providers.
- Second admission was caused by a factor attributable to the patient including substance use or nonadherence to the treatment plan from the first admission.
- Second admission was related to a complication of the primary disease or its treatment or an unrelated condition that could not reasonably have been predicted or prevented by a competent physician meeting the standard of care.
Categories 3, 4, and 5 were further divided into more specific subcategories as shown in Figure 1.
Each readmission was assigned a single category from the algorithm using a stepwise process in which a higher‐order cause excluded consideration of a downstream category. For example, if the second admission was not medically necessary (category 1), an incorrect decision to readmit the patient was considered the primary cause of the readmission, and no consideration was given to categories 2 through 5. In this manner, each patient was assigned to a single category. We considered readmissions attributable to provider error (categories 1 and 3) to be avoidable. Examples of readmissions in each category with narratives are shown in the Supporting Information, Appendix 1, in the online version of this article. Discrepancies in classification were resolved by consensus of all authors.
Statistical Analysis
Unweighted kappa values were measured to assess agreement between authors in the assignment of the major category among the 5 choices in the algorithm. [2] tests were used to compare categorical variables between 2 groups (readmitted vs not readmitted) or between several groups (5 categories of readmissions), whereas Kruskal‐Wallis tests were used for continuous variables.
Only the first readmission was used in analysis of patient characteristics when multiple readmissions occurred for an individual patient. Unique patients were used for analysis of nonreadmitted patients. The generalized estimating equation method was used to adjust for correlations between multiple readmissions within patients.
RESULTS
During this period, 270 patients accounted for 335 readmissions. Characteristics of patients readmitted within 7 days are shown in Table 1 and compared with those of patients who were not readmitted during the same study period. Patients who were readmitted were more likely to have had a longer length of stay during the first admission.
| Characteristic | Not Readmitted, n=6,781 | Readmitted, n=270 | P Value |
|---|---|---|---|
| |||
| Male gender (% of category) | 4,224 (62.3%) | 180 (66.7%) | 0.15 |
| Mean age, y (SD) | 56.1 (16.3) | 55.1 (16.3) | 0.65 |
| Median initial LOS [interquartile range] | 3 [2, 6] | 4 [2, 9] | 0.002 |
| Mean days between admissions (SD) | NA | 3.8 (2.1) | NA |
| AMA discharge (% of category) | 413 (6.1%) | 20 (7.4%) | 0.38 |
Results of categorization of readmission are shown in Table 2. Readmissions related to the discharge process (category 3) were further divided into subcategories (Table 3). Category 5 (unpredictable/unpreventable complication of primary diagnosis or unrelated event) constituted the highest percentage of readmissions at 46%, followed by category 4 (patient behavior) at 19%, category 3 (discharge process deficiency) at 17%, category 2 (AMA) at 12%, and category 1 (unnecessary admission) at 7%. Readmissions designated as preventable (categories 1 and 3) accounted for 24% of all readmissions. Readmissions due to patient factors (categories 2 and 4) accounted for 31% of all readmissions. Notably, 21% of all readmissions were due to patients who eloped or left AMA during the first discharge or who returned because of substance abuse during the interim (categories 2 and 4a). Among the preventable readmissions, the most commonly designated cause of readmission was a perceived premature discharge (category 3b2), accounting for 6% of all readmissions.
| Category 1: Second Admission Not Medically Necessary | Category 2: First Admission AMA | Category 3: Deficiency in the Discharge Process | Category 4: Patient Behavior | Category 5: Unpredictable Complication of Primary or Alternate Diagnosis | P Value* | |
|---|---|---|---|---|---|---|
| ||||||
| Total (%) | 22 (6.6%) | 39 (11.6%) | 56 (16.7%) | 63 (18.8%) | 155 (46.3%) | |
| Male (%) | 11 (50.0%) | 29 (74.4%) | 38 (67.9%) | 54 (85.7%) | 91 (58.7%) | 0.005 |
| Mean age, y (SD) | 61.8 (13.7) | 48.1 (13.2) | 58.6 (14.4) | 53.3 (11.8) | 55.1 (17.7) | 0.004 |
| Median LOS [IQR] | 2.5 [2.0, 7.0] | 2.0 [1.0, 6.0] | 5.0 [2.0, 8.5] | 4.0 [2.0, 6.0] | 5.0 [2.0, 10.0] | 0.03 |
| Mean days between admissions (SD) | 3.8 (2.2) | 3.1 (2.2) | 3.3 (2.0) | 3.8 (2.1) | 4.1 (2.1) | 0.27 |
| Category | Description | No. | % of Total |
|---|---|---|---|
| 3a1 | Overdosing of a prescribed medication | 3 | 0.9 |
| 3a2 | Underdosing of a prescribed medication | 5 | 1.5 |
| 3a3 | Adverse medication effect | 2 | 0.6 |
| 3b1 | Inadequate functional status | 3 | 0.9 |
| 3b2 | Premature discharge | 20 | 6.0 |
| 3c1 | Patient unable to fill prescriptions | 9 | 2.7 |
| 3c2 | Follow‐up arrangements inadequate | 6 | 1.8 |
| 3c3 | Discharge setting not appropriate | 5 | 1.5 |
| 3c4 | Inadequate communication of plan to receiving facility | 2 | 0.6 |
| 3c5 | Other | 1 | 0.3 |
| 4a | Patient behaviorsubstance use | 30 | 9 |
| 4b | Patient behavioradherence to discharge plan | 30 | 9 |
| 4c | Patient behaviorrefusal of discharge plan | 3 | 0.9 |
| 5a | Disease complication | 103 | 30.7 |
| 5b | Unrelated condition | 52 | 15.5 |
Variance was statistically significant across major categories for gender, mean age, and median length of stay. The interobserver level of agreement across the 5 major categories was substantial among both pairs of reviewers (Table 4).
| Pair of Reviewers | No. of Readmissions Reviewed | No. of Agreements (%) | Unweighted Kappa |
|---|---|---|---|
| Dr. LinkDr. Bails | 135 | 113 (83.7) | 0.78 |
| Dr. LinkDr. Janjigian | 200 | 163 (81.5) | 0.72 |
The 46 patients who had more than 1, 7‐day readmission during this study period were responsible for 106 readmissions. The majority of this group were readmitted twice (78%), with a range of 2 to 5 readmissions. Within this group, 24% were considered preventable readmissions (8 from category 1, 17 from category 3), and 76% were considered not preventable (10 from category 2, 27 from category 4, and 44 from category 5).
DISCUSSION
The purpose of this retrospective review was to identify causes of unplanned 7‐day readmissions after discharge from the medical service of a large urban teaching hospital. Rather than focus on risk factors for readmissions, which other studies have done, we reviewed charts of readmitted patients using a novel categorization algorithm to group patients into common mechanisms that elucidate why a particular patient was readmitted. By examining the chart in detail, we were able to identify etiologies of readmission that are potentially avoidable.
Some authors have questioned the use of readmissions as a measurement of the quality of care a hospital provides due to the high proportion of unavoidable readmissions in a given sample.[8, 10] We hoped to identify systems errors that could be targets of quality improvement initiatives, and therefore chose to focus entirely on 7‐day readmissions as these have been shown to be more preventable than 30‐day readmissions.[8] We had the ability to review any aspect of the medical chart (eg, vitals or labs on discharge, any clinical note), which provided the highest probability of discovering a systems error. Despite these efforts to identify preventable errors, we identified the most common mechanism of readmission as an unpredictable or unpreventable event related to the primary diagnosis or its treatment from the initial admission (category 5a, 30.7% of total readmissions). Review of examples from this category elucidates how an unpredictable readmission could occur within such a short time frame (see Supporting Information, Appendix 1, in the online version of this article). The 7‐day window precluded identification of clinic access barriers, thereby eliminating from analysis 1 mechanism for preventable readmissions.
Nonetheless, our study demonstrates room for improvement in provider behavior and hospital systems related to the discharge process. Nearly a quarter of all readmissions and the majority of preventable readmissions were related to systems issues, such as timing and coordination of the first discharge, and lack of medical necessity for the second admission (see Supporting Information, Appendix 1, in the online version of this article). Prior studies found that shorter length of stay was associated with increased preventable readmissions, a finding that our study does not support.[10, 11] We suspect that patients in this group had longer lengths of stay during the index hospitalization due to complexity of medical illness, limited social support network, or lack of insurance, among other factors, that exposed flaws in systems processes and provider judgment. The mechanisms of readmission related to discharge planning that we identified in this study, including comprehensiveness of care, coordination of care, and medication administration, all represent potential opportunities for intervention.
Of note, there was a high percentage of readmissions attributable to patient behaviors, such as AMA discharges, substance abuse following discharge, and nonadherence to the treatment plan. These factors are likely over‐represented in the Bellevue patient population compared to that of private hospital settings and no doubt exacerbate the readmission rates in urban hospitals treating patients with a high degree of social and behavioral health needs. Although patient‐related factors such as AMA discharges and substance abuse are potentially addressable, our reviewers felt that these were not preventable based on current knowledge and standards of care.
Studies that have attempted to classify readmissions as potentially avoidable have not shown good interobserver agreement when more than 1 reviewer was involved.[9, 10] Additionally, there is not a validated tool available to classify types of readmissions. By using a pilot sample of 84 cases to develop the model, confirming the accuracy of the chart by personally interviewing a sample of readmitted patients for comparison, and by employing experienced inpatient attending physicians to perform the reviews, we were able to develop an algorithm that achieved substantial reliability in assigning each readmission into 1 of 5 distinct categories.
Our literature search revealed only a single study that attempted to classify readmissions in a similar manner. Readmissions within 6 months at 9 Veterans Affairs hospitals were classified into causal categories of systems, provider, and patient etiology.[9] Overall, 34% of readmissions were deemed to be preventable compared to 24% in our study. Most readmissions (68%) were due to a worsening of a clinical condition, 4.5% were attributed to the admitting provider having too low a threshold to justify admission, and 2.7% were due to the patient not abstaining from drugs or alcohol. Though the study design and patient population differed from our own, the similarities in methods and results lend validity to the results and conclusions of our study.
Another limitation of our study is that readmissions to other hospitals were not included. In this respect, our estimate of the rate of readmission was an understatement of the true value. Nonetheless, the categorization of causes for readmission was not likely to be affected by the site of the second admission. Another limitation of this study was the small number of subjects reviewed relative to other studies that analyzed demographics and risk factors in large databases of readmissions.[12] However, the depth of the present review provides an understanding of the sequence of events leading to the readmission and permits development of strategies to prevent their occurrence.
We identified mechanisms of readmissions that can lay the groundwork for future interventions and safely reduce readmissions rates at little cost. To reduce admissions that may not be medically necessary, the narratives presented in the supplementary appendix suggest that improvement in communication between the admitting provider for the readmission and a provider familiar with the patient could have led to avoidance of the readmission. Similarly, enhanced communication to receiving nursing facilities would decrease the chances of the patient being immediately sent back as occurred multiple times in our cohort. Formal mandatory assessment of functional status for vulnerable patients would identify patients who may not be fully ready for discharge.
In conclusion, we found through detailed chart review of patients readmitted within 7 days to an urban teaching hospital that the majority of readmissions were not avoidable and were due to unpredictable complications of the primary diagnosis from the index hospitalization or a condition unrelated to the initial stay. This conclusion, in concurrence with those of other studies,[8, 10] questions the value of a readmission as a valid metric of quality though supports further improvements in hospital systems to reduce preventable readmissions.
Disclosure
Nothing to report.
- , , . Rehospitalizations among patients in the Medicare fee‐for‐service program. N Engl J Med. 2009;360(14):1418–1428.
- , . The rate and cost of hospital readmissions for preventable conditions. Med Care Res Rev. 2004;61(2):225–240.
- Centers for Medicare and Medicaid Services. 9th scope of work version #080108‐0. Available at: http://www.cms.gov/Medicare/Quality‐Initiatives‐Patient‐Assessment‐Instruments/QualityImprovementOrgs/downloads/9thSOWBaseContract_C_08‐01‐2008_2_.pdf. Accessed April 10, 2014.
- , . Hospital readmissions in the Medicare population. N Engl J Med. 1984;311(21):1349–1353.
- U.S. Department of Health 155(8):520–528.
- , , , et al. Incidence of potentially avoidable urgent readmissions and their relation to all‐cause urgent readmissions. CMAJ. 2011;183(14):E1067–E1072.
- , , , et al. Classifying general medicine readmissions. Are they preventable? Veterans Affairs Cooperative Studies in Health Services Group on Primary Care and Hospital Readmissions. J Gen Intern Med. 1996;11(10):597–607.
- , , , . Hospitalists assess the causes of early hospital readmissions. J Hosp Med. 2011;6(7):383–388.
- , , . Early readmissions to the department of medicine as a screening tool for monitoring quality of care problems. Medicine. 2008;87(5):294–300.
- , , , et al. Incidence and predictors of all and preventable adverse drug reactions in frail elderly persons after hospital stay. J Gerontol A Biol Sci Med Sci. 2006;61(5):511–515.
© 2015 Society of Hospital Medicine

Guidelines for AD management differ among health groups
Numerous differences exist between dermatology groups on treatment for atopic dermatitis (AD), report Girish C. Mohan and Dr. Peter A. Lio.
A clinical review of AD management guidelines from seven international dermatology organizations found that, although basic guidelines for first-line topical and systemic treatment are similar, “notable differences” were found on guidelines for adjunctive therapies such as diluted bleach baths, vitamin D, and environmental modifications.
“The juxtaposition of different guidelines can enhance individualization of treatment for a patient with AD by drawing from different disciplines with varying traditions and perspectives,” the investigators said in the report.
Read the full review in JAMA Dermatology.
ABIM-ACCME Collaboration Helps Hospitalists Earn Credit for Continuing Medical Education
Earning credit for continuing medical education (CME) is a little easier for hospitalists and other physicians.
A collaboration between the American Board of Internal Medicine (ABIM) and the Accreditation Council for Continuing Medical Education (ACCME) will enable physicians who are engaged in lifelong learning to use those activities toward completion of requirements for ABIM’s Maintenance of Certification (MOC) program.
The collaboration expands physicians’ options to receive MOC credit and helps CME providers to “offer more lifelong learning options with MOC credit to internists and subspecialties,” according to an ABIM announcement.
The ABIM-ACCME collaboration exempts CME providers from applying for ABIM approval for each MOC activity. Instead, CME providers can use a shared system to record information about CME and ABIM MOC activities.
“I think the ABIM wanted to recognize this CME as fulfilling the spirit of MOC, but up until now, it was really hard to ensure that the ‘CME’ was meaningful and not tainted by third-party sponsorship,” writes ABIM Council member and former SHM President Jeffrey Wiese, MD, MHM, in an email to The Hospitalist. “This collaboration enables physicians to get MOC credit for the CME that they are acquiring and, importantly, ensures that the CME that counts toward MOC meets the standards of the ABIM without having to go through an extensive approval process.”
Hospitalists also have the option to use the Focused Practice in Hospital Medicine exam, but not all do. Therefore, the streamlined network for reporting activity means that hospitalists will see a real benefit.
“There haven’t been a lot of modules built for hospital medicine like there have been for ambulatory medicine or the subspecialties,” Dr. Wiese adds. “Hospitalists have struggled to find medical knowledge modules that gave MOC credit and [that] fit with what they were doing in their practice. This collaboration solves that, as it opens a door for many CME activities that will satisfy both MOC credit and speak to the practice of hospital medicine.”
Visit our website for more information on continuing medical education in hospital medicine.
Short-Course Antimicrobial Therapy Outcomes for Intra-Abdominal Infection
Clinical question: Does a short, fixed duration of antibiotic therapy for complicated intra-abdominal infections lead to equivalent outcomes and less antibiotic exposure than the traditional approach?
Background: Published guidelines recommend appropriate antimicrobial agents for intra-abdominal infections, but the optimal duration of therapy remains unclear. Most practitioners continue to treat for 10–14 days and until all physiologic evidence of the systemic inflammatory response syndrome (SIRS) has resolved. More recently, small studies have suggested that a shorter course may lead to equivalent outcomes with decreased antibiotic exposure.
Study design: Open-label, multicenter, randomized control trial.
Setting: Twenty-three sites throughout the U.S. and Canada.
Synopsis: In the short-course group, 257 patients were randomized to receive antimicrobial therapy for four full days after their index source-control procedure; 260 patients in the control group received antimicrobial therapy until two days after resolution of the physiological abnormalities related to SIRS. The median duration of therapy was 4.0 days (interquartile range [IQR] 4.0–5.0) for the experimental group and 8.0 days (IQR 5.0–10.0) in the control group (95% CI, -4.7 to -3.3; P<0.001).
There was no significant difference in surgical site infection, recurrent intra-abdominal infection, or death between the experimental and control groups (21.8% vs. 22.3%, 95% CI, -7.0 to 8.0; P=0.92). In the experimental group, 47 patients did not adhere to the protocol, and all of those patients received a longer antimicrobial treatment course than specified in the protocol.
This trial excluded patients without adequate source control and included a small number of immunocompromised hosts. The rate of nonadherence to the protocol was high, at 18% of patients in the experimental group. The calculated sample size to assert equivalence between groups was not achieved, although the results are suggestive of equivalence.
Bottom line: A shorter course of antimicrobial therapy for complicated intra-abdominal infections might lead to equivalent outcomes with less antibiotic exposure compared with current practice; however, it is challenging for providers to stop antimicrobial therapy while patients continue to show physiologic evidence of SIRS.
Citation: Sawyer RG, Claridge JA, Nathens AB, et al. Trial of short-course antimicrobial therapy for intraabdominal infection. NEJM. 2015;372(21):1996–2005.
Visit our website for more reviews of HM-focused research.
Damage control laparotomy an option for nontrauma secondary peritonitis
LAS VEGAS – Damage control laparotomy is a safe and reliable approach to the surgical management of patients with severe nontrauma secondary peritonitis who require bowel resection, according a review of 182 cases.
For example, the deferred ostomy rate was 16.7% among 72 patients who underwent damage control laparotomy (DCL), which was significantly lower than the primary ostomy rate of 53.6% in 110 patients who underwent a definitive surgical procedure (DSP), Dr. Maria P. Garcia-Garcia reported at the annual meeting of the American Association for the Surgery of Trauma.

Further, the fistula rate was lower among 60 DCL patients who underwent delayed anastomosis, compared with 51 DSP patients who underwent primary anastomosis (26.7% vs. 37.2%), and the mortality rate was lower in the DCL vs. DSP patients (16.7% vs. 24.5%). These differences did not meet statistical significance due to the sample size. Deaths in the DCL group all occurred in those who underwent delayed anastomosis; deaths in the DSP group occurred in 14 ostomy patients and 13 anastomosis patients, said Dr. Garcia-Garcia of Fundacion Valle del Lili, Cali, Colombia.
Disease severity, as measured by APACHE II scores, was similar in the two groups (mean of about 17 for each group). Septic shock was present in 37% at the time of admission. Mean hospital length of stay and mean intensive care unit length of stay did not differ significantly between the groups, nor did the systemic complication rate, or the rates of multiple organ failure and acute respiratory distress syndrome.
Small-bowel perforation occurred in 77 (42.3%), and colon perforation occurred in 105 (57.7%).
The patients included teens and adults aged 16 years or older (mean of 60.3 years) with severe nontrauma secondary peritonitis (NSPT) who were undergoing bowel resection after enteric perforations between 2003 and 2013. The DSP patients underwent either primary anastomosis or primary ostomy, and the DCL patients underwent segmental bowel resection, temporary abdominal closure, and subsequent delayed anastomosis or deferred ostomy.
DCL is a recognized strategy for managing bowel injuries in trauma patients. It was developed in response to the poor outcomes associated with attempting definitive repair, but evidence regarding the role and timing of anastomosis in DCL in NTSP – a condition associated with high morbidity and a 30% in-hospital mortality rate – is lacking, Dr. Garcia-Garcia said, noting that the current findings suggest it is the preferred approach.
“When a definite surgical repair is chosen, there is a 50/50 chance of performing anastomosis or ostomy. However, when a damage control abbreviated laparotomy is performed, there is a high bowel reconstruction success rate of about 80%. Therefore, damage control abbreviated laparotomy is a reliable and safe option in critically ill nontrauma secondary peritonitis patients. At the end of the day it’s your choice: Would you rather leave your patient with an ostomy or tube, or would you give your patient a chance of successful reconstruction without an ostomy?” she said.
Dr. Garcia-Garcia reported having no disclosures.
LAS VEGAS – Damage control laparotomy is a safe and reliable approach to the surgical management of patients with severe nontrauma secondary peritonitis who require bowel resection, according a review of 182 cases.
For example, the deferred ostomy rate was 16.7% among 72 patients who underwent damage control laparotomy (DCL), which was significantly lower than the primary ostomy rate of 53.6% in 110 patients who underwent a definitive surgical procedure (DSP), Dr. Maria P. Garcia-Garcia reported at the annual meeting of the American Association for the Surgery of Trauma.
Further, the fistula rate was lower among 60 DCL patients who underwent delayed anastomosis, compared with 51 DSP patients who underwent primary anastomosis (26.7% vs. 37.2%), and the mortality rate was lower in the DCL vs. DSP patients (16.7% vs. 24.5%). These differences did not meet statistical significance due to the sample size. Deaths in the DCL group all occurred in those who underwent delayed anastomosis; deaths in the DSP group occurred in 14 ostomy patients and 13 anastomosis patients, said Dr. Garcia-Garcia of Fundacion Valle del Lili, Cali, Colombia.
Disease severity, as measured by APACHE II scores, was similar in the two groups (mean of about 17 for each group). Septic shock was present in 37% at the time of admission. Mean hospital length of stay and mean intensive care unit length of stay did not differ significantly between the groups, nor did the systemic complication rate, or the rates of multiple organ failure and acute respiratory distress syndrome.
Small-bowel perforation occurred in 77 (42.3%), and colon perforation occurred in 105 (57.7%).
The patients included teens and adults aged 16 years or older (mean of 60.3 years) with severe nontrauma secondary peritonitis (NSPT) who were undergoing bowel resection after enteric perforations between 2003 and 2013. The DSP patients underwent either primary anastomosis or primary ostomy, and the DCL patients underwent segmental bowel resection, temporary abdominal closure, and subsequent delayed anastomosis or deferred ostomy.
DCL is a recognized strategy for managing bowel injuries in trauma patients. It was developed in response to the poor outcomes associated with attempting definitive repair, but evidence regarding the role and timing of anastomosis in DCL in NTSP – a condition associated with high morbidity and a 30% in-hospital mortality rate – is lacking, Dr. Garcia-Garcia said, noting that the current findings suggest it is the preferred approach.
“When a definite surgical repair is chosen, there is a 50/50 chance of performing anastomosis or ostomy. However, when a damage control abbreviated laparotomy is performed, there is a high bowel reconstruction success rate of about 80%. Therefore, damage control abbreviated laparotomy is a reliable and safe option in critically ill nontrauma secondary peritonitis patients. At the end of the day it’s your choice: Would you rather leave your patient with an ostomy or tube, or would you give your patient a chance of successful reconstruction without an ostomy?” she said.
Dr. Garcia-Garcia reported having no disclosures.
AT THE AAST ANNUAL MEETING
Key clinical point: Damage control laparotomy is a safe and reliable approach to the surgical management of patients with severe nontrauma secondary peritonitis who require bowel resection, according a review of 182 cases.
Major finding: The ostomy rate was 16.7% vs. 53.6% with DCL vs. DSP.
Data source: A review of 182 cases.
Disclosures: Dr. Garcia-Garcia reported having no disclosures.

Vulvar intraepithelial neoplasia: Changing terms and therapy trends
Vulvar intraepithelial neoplasia is a premalignant lesion of the vulva frequently encountered by gynecologic providers. There has been an increase in the incidence of VIN in younger women in recent decades thought be to be secondary to human papillomavirus infection, cigarette smoking, and sexual behavior (J Reprod Med. 2000 Aug;45[8]:613-5).
Data from the Surveillance Epidemiology and End Results (SEER) database were significant for a 411% increase in the incidence of in situ carcinoma and a 20% increase in invasive vulvar carcinoma from 1973 to 2000 (Obstet Gynecol. 2006 May;107[5]:1018-22). In addition, younger age groups are seeing an increase of in situ disease until age 49. Vulvar cancer however, continues to be a disease of older age.
Terminology
Previously, the term vulvar intraepithelial neoplasia followed the cervical intraepithelial neoplasia (CIN) designation in the 1960s. Conventions for grading these lesions have changed over time. Most recently, in 2004, the International Society for the Study of Vulvar Disease (ISSVD), composed of dermatologists, pathologists, and gynecologists, agreed to change the classification of squamous VIN from the previous VIN 1-3 classification system. The committee described VIN in two forms, “usual type” and “differentiated type” (J Reprod Med 2005;50:807-10).

In making this transition, it was recognized that VIN 1 is not in fact an oncogenic lesion and is now solely referred to as condyloma acuminatum. Grade 2 and 3 are now collectively referred to as VIN. These changes made by the ISSVD reflect the current literature on grading of VIN. In addition to VIN 1 not having any progression to malignancy, it is a diagnosis that is difficult to reproduce and may, at times, reflect reactive changes or other dermatosis. VIN 2 and 3 are not discriminated from each other in a reproducible manner and clinically have no reason for individual distinction (J Low Genit Tract Dis. 2006 Jul;10[3]:161-9).
VIN, usual type is the most common intraepithelial lesion and is historically referred to as classic VIN or Bowen’s disease. This type is associated with HPV infection and includes the formerly described warty type, basaloid type, and mixed type. The carcinogenic subtypes of HPV, 16, 18, 31, and 33 are the most common HPV subtypes responsible. It should be noted, however, that diagnosis is morphological and not based on HPV testing. Usual type is also traditionally thought to be more closely associated with risk factors such as smoking and immunocompromised states.
VIN, differentiated type is not associated with the HPV virus and is frequently found in older women. This lesion is often associated with other dermatologic conditions such as lichen sclerosis and lichen simplex chronicus. Diagnosis is also made by histology with abnormal cells being confined to the parabasal and basal portion of the rete pegs. This type also finds genetic alterations that are seen in invasive squamous cell carcinoma (Appl Immunohistochem Mol Morphol 2001;9:150-63). Differentiated type is thought to be a precursor for HPV-negative keratinizing squamous cell carcinoma of the vulva (Am J Surg Pathol. 2000 Mar;24[3]:429-41).

As awareness of this distinct form of VIN increases and more is learned about the precursors of HPV-negative squamous cell carcinoma, physicians are encouraged to closely follow up hyperplastic lesions and lichen sclerosis with biopsies and excision. The diagnosis of differentiated VIN is rarely made at present; however, this distinction by the ISSVD may improve the ability of clinicians and pathologists to recognize this HPV-negative precursor before squamous cell carcinoma is present.
The Lower Anogenital Squamous Terminology project of the College of American Pathology and the American Society for Colposcopy and Cervical Pathology advocates for more consistent terminology across lower anogenital tract lesions. This terminology applies only to HPV-related lesions (usual type) and considers the VIN 1 or condyloma accuminatum to be a low-grade lesion (LSIL), and VIN 2-3 or usual type to be high-grade lesions (HSIL) (Int J Gynecol Pathol. 2013 Jan;32[1]:76-115).
Many clinicians and pathologists have not adopted this most recent terminology; however, there is evidence that the ISSVD classification is the most clinically relevant.
Diagnosis
The majority of patients with any VIN will present with complaints of vulvar pruritus. However, women can also present with pain, burning, or dysuria, or can have an asymptomatic lesion found on pelvic exam. There are no recommended screening strategies to diagnose early VIN. Cytologic testing is complicated by the keratinization of the vulva, making this an unreliable diagnostic assessment.
On physical exam, VIN can have a heterogeneous presentation including papules, plaques, color variations, or ulcer. Differentiated type is thought to have a more defined appearance that frequently develops in the setting of other vulvar dermatosis. These are distinct, solitary lesions that are commonly raised, can have an overlying scale, and have ill-defined borders. A distinct lesion with ulceration or erosion is concerning for invasion.

Diagnosis is ultimately made by biopsy. Physicians should have a low threshold to biopsy any suspicious lesions or those unresponsive to therapy. Colposcopy is a frequent adjunct to the physical exam. Acetic acid 3%-5% soaked gauze is allowed to rest on the vulva for several minutes prior to observation with a colposcope or hand-held magnifying glass. Colposcopic findings are usually those of focal “white” epithelium. Vascular changes seen on the cervix (punctuation and mosaicism) are rarely seen on the vulva.
The entire anogenital region shares the same susceptibility to the HPV virus, thus squamous intraepithelial lesions are frequently multifocal. Physicians should have a heightened awareness of other lesions, such as cervical, vaginal, or anal, when managing a patient with VIN (Gynecol Oncol. 1995 Feb;56[2]:276-9). Appropriate cervical screening should be strictly adhered to and a thorough exam done at the time of vulvar colposcopy or exam.
Treatment
The goals of treatment include preventing carcinoma and improving symptoms while maintaining function and preserving anatomy. Treatment options for both types of VIN include excision, ablation, or medical therapy pending an evaluation of concurrent risk factors.
Premalignant disease was traditionally treated surgically. While surgical excision is still the mainstay of therapy, less aggressive techniques and medical therapy are more readily utilized. The goal of surgical excision for VIN is both diagnostic and therapeutic. When an excision for high-grade dysplasia is done (formerly VIN 3), detection of occult carcinoma was found in up to 3.2% in one large review (Gynecol Oncol. 2005;97:645-51).
Using a wide local excision to completely remove lesions with a pathologically clear margin reduces a patient’s risk of recurrence for disease compared to those excisions with positive margins (Obstet Gynecol. 1998;92:962-6). It is therefore critical that physicians carefully counsel patients who desire conservative therapy for VIN.
With any treatment, however, patients and physicians should be aware of the risk of recurrence; for vulvectomy, partial vulvectomy, local excision, and laser ablation, recurrences were seen at rates of 19%, 18%, 22%, and 23%, respectively, in a review of 3,322 patients (Gynecol Oncol. 2005;97:645-51).
CO2 laser ablation has been used for single lesions as well as multifocal or confluent disease. Many physicians advocate for its use in patients with multifocal lesions as well as those with disease around the clitoris or anus, where excisional therapy is less desirable as laser therapy results in less scarring.
A 2015 Cochrane Database Review of medical therapy for high-grade dysplasia (usual-type VIN, VIN 2/3, or high-grade VIN) found that topical imiquimod can be used as a safe and effective option for high-grade VIN. Physicians should, however, be aware of unfavorable side effects that may require dose reductions. Cidofovir may be an alternative to imiquimod pending more evidence on long-term response and progression (Cochrane Database Syst Rev. 2015 Aug 18;8:CD007924). Topical 5-fluorouracil has fallen out of favor for VIN given its significant chemical desquamation, however response rates are thought to be favorable if tolerated.
As the use of VIN terminology solidifies and information emerges on medical therapy to treat VIN, it is critical that physicians remain current when counseling and providing treatment recommendations for vulvar intraepithelial neoplasia.
Dr. Gehrig is professor and director of gynecologic oncology at the University of North Carolina at Chapel Hill. Dr. Clarke-Pearson is the chair and the Robert A. Ross Distinguished Professor of Obstetrics and Gynecology and professor in the division of gynecologic oncology at the university. Dr. Sullivan is a fellow in the division of gynecologic oncology at the university. They reported having no relevant financial disclosures. Email them at [email protected].
Vulvar intraepithelial neoplasia is a premalignant lesion of the vulva frequently encountered by gynecologic providers. There has been an increase in the incidence of VIN in younger women in recent decades thought be to be secondary to human papillomavirus infection, cigarette smoking, and sexual behavior (J Reprod Med. 2000 Aug;45[8]:613-5).
Data from the Surveillance Epidemiology and End Results (SEER) database were significant for a 411% increase in the incidence of in situ carcinoma and a 20% increase in invasive vulvar carcinoma from 1973 to 2000 (Obstet Gynecol. 2006 May;107[5]:1018-22). In addition, younger age groups are seeing an increase of in situ disease until age 49. Vulvar cancer however, continues to be a disease of older age.
Terminology
Previously, the term vulvar intraepithelial neoplasia followed the cervical intraepithelial neoplasia (CIN) designation in the 1960s. Conventions for grading these lesions have changed over time. Most recently, in 2004, the International Society for the Study of Vulvar Disease (ISSVD), composed of dermatologists, pathologists, and gynecologists, agreed to change the classification of squamous VIN from the previous VIN 1-3 classification system. The committee described VIN in two forms, “usual type” and “differentiated type” (J Reprod Med 2005;50:807-10).
In making this transition, it was recognized that VIN 1 is not in fact an oncogenic lesion and is now solely referred to as condyloma acuminatum. Grade 2 and 3 are now collectively referred to as VIN. These changes made by the ISSVD reflect the current literature on grading of VIN. In addition to VIN 1 not having any progression to malignancy, it is a diagnosis that is difficult to reproduce and may, at times, reflect reactive changes or other dermatosis. VIN 2 and 3 are not discriminated from each other in a reproducible manner and clinically have no reason for individual distinction (J Low Genit Tract Dis. 2006 Jul;10[3]:161-9).
VIN, usual type is the most common intraepithelial lesion and is historically referred to as classic VIN or Bowen’s disease. This type is associated with HPV infection and includes the formerly described warty type, basaloid type, and mixed type. The carcinogenic subtypes of HPV, 16, 18, 31, and 33 are the most common HPV subtypes responsible. It should be noted, however, that diagnosis is morphological and not based on HPV testing. Usual type is also traditionally thought to be more closely associated with risk factors such as smoking and immunocompromised states.
VIN, differentiated type is not associated with the HPV virus and is frequently found in older women. This lesion is often associated with other dermatologic conditions such as lichen sclerosis and lichen simplex chronicus. Diagnosis is also made by histology with abnormal cells being confined to the parabasal and basal portion of the rete pegs. This type also finds genetic alterations that are seen in invasive squamous cell carcinoma (Appl Immunohistochem Mol Morphol 2001;9:150-63). Differentiated type is thought to be a precursor for HPV-negative keratinizing squamous cell carcinoma of the vulva (Am J Surg Pathol. 2000 Mar;24[3]:429-41).
As awareness of this distinct form of VIN increases and more is learned about the precursors of HPV-negative squamous cell carcinoma, physicians are encouraged to closely follow up hyperplastic lesions and lichen sclerosis with biopsies and excision. The diagnosis of differentiated VIN is rarely made at present; however, this distinction by the ISSVD may improve the ability of clinicians and pathologists to recognize this HPV-negative precursor before squamous cell carcinoma is present.
The Lower Anogenital Squamous Terminology project of the College of American Pathology and the American Society for Colposcopy and Cervical Pathology advocates for more consistent terminology across lower anogenital tract lesions. This terminology applies only to HPV-related lesions (usual type) and considers the VIN 1 or condyloma accuminatum to be a low-grade lesion (LSIL), and VIN 2-3 or usual type to be high-grade lesions (HSIL) (Int J Gynecol Pathol. 2013 Jan;32[1]:76-115).
Many clinicians and pathologists have not adopted this most recent terminology; however, there is evidence that the ISSVD classification is the most clinically relevant.
Diagnosis
The majority of patients with any VIN will present with complaints of vulvar pruritus. However, women can also present with pain, burning, or dysuria, or can have an asymptomatic lesion found on pelvic exam. There are no recommended screening strategies to diagnose early VIN. Cytologic testing is complicated by the keratinization of the vulva, making this an unreliable diagnostic assessment.
On physical exam, VIN can have a heterogeneous presentation including papules, plaques, color variations, or ulcer. Differentiated type is thought to have a more defined appearance that frequently develops in the setting of other vulvar dermatosis. These are distinct, solitary lesions that are commonly raised, can have an overlying scale, and have ill-defined borders. A distinct lesion with ulceration or erosion is concerning for invasion.
Diagnosis is ultimately made by biopsy. Physicians should have a low threshold to biopsy any suspicious lesions or those unresponsive to therapy. Colposcopy is a frequent adjunct to the physical exam. Acetic acid 3%-5% soaked gauze is allowed to rest on the vulva for several minutes prior to observation with a colposcope or hand-held magnifying glass. Colposcopic findings are usually those of focal “white” epithelium. Vascular changes seen on the cervix (punctuation and mosaicism) are rarely seen on the vulva.
The entire anogenital region shares the same susceptibility to the HPV virus, thus squamous intraepithelial lesions are frequently multifocal. Physicians should have a heightened awareness of other lesions, such as cervical, vaginal, or anal, when managing a patient with VIN (Gynecol Oncol. 1995 Feb;56[2]:276-9). Appropriate cervical screening should be strictly adhered to and a thorough exam done at the time of vulvar colposcopy or exam.
Treatment
The goals of treatment include preventing carcinoma and improving symptoms while maintaining function and preserving anatomy. Treatment options for both types of VIN include excision, ablation, or medical therapy pending an evaluation of concurrent risk factors.
Premalignant disease was traditionally treated surgically. While surgical excision is still the mainstay of therapy, less aggressive techniques and medical therapy are more readily utilized. The goal of surgical excision for VIN is both diagnostic and therapeutic. When an excision for high-grade dysplasia is done (formerly VIN 3), detection of occult carcinoma was found in up to 3.2% in one large review (Gynecol Oncol. 2005;97:645-51).
Using a wide local excision to completely remove lesions with a pathologically clear margin reduces a patient’s risk of recurrence for disease compared to those excisions with positive margins (Obstet Gynecol. 1998;92:962-6). It is therefore critical that physicians carefully counsel patients who desire conservative therapy for VIN.
With any treatment, however, patients and physicians should be aware of the risk of recurrence; for vulvectomy, partial vulvectomy, local excision, and laser ablation, recurrences were seen at rates of 19%, 18%, 22%, and 23%, respectively, in a review of 3,322 patients (Gynecol Oncol. 2005;97:645-51).
CO2 laser ablation has been used for single lesions as well as multifocal or confluent disease. Many physicians advocate for its use in patients with multifocal lesions as well as those with disease around the clitoris or anus, where excisional therapy is less desirable as laser therapy results in less scarring.
A 2015 Cochrane Database Review of medical therapy for high-grade dysplasia (usual-type VIN, VIN 2/3, or high-grade VIN) found that topical imiquimod can be used as a safe and effective option for high-grade VIN. Physicians should, however, be aware of unfavorable side effects that may require dose reductions. Cidofovir may be an alternative to imiquimod pending more evidence on long-term response and progression (Cochrane Database Syst Rev. 2015 Aug 18;8:CD007924). Topical 5-fluorouracil has fallen out of favor for VIN given its significant chemical desquamation, however response rates are thought to be favorable if tolerated.
As the use of VIN terminology solidifies and information emerges on medical therapy to treat VIN, it is critical that physicians remain current when counseling and providing treatment recommendations for vulvar intraepithelial neoplasia.
Dr. Gehrig is professor and director of gynecologic oncology at the University of North Carolina at Chapel Hill. Dr. Clarke-Pearson is the chair and the Robert A. Ross Distinguished Professor of Obstetrics and Gynecology and professor in the division of gynecologic oncology at the university. Dr. Sullivan is a fellow in the division of gynecologic oncology at the university. They reported having no relevant financial disclosures. Email them at [email protected].