User login
Clinical Outcomes of Minimally Invasive Versus Open TLIF: A Propensity-Matched Cohort Study
Transforaminal lumbar interbody fusion (TLIF) has become an increasingly popular method of lumbar fusion, since its introduction by Harms and Rolinger in 1982.1 The procedure allows for a circumferential fusion through a posterior-only approach, with improved sagittal alignment2 and minimal risk for iatrogenic nerve injury. In the past decade, a minimally invasive surgical method of TLIF (MIS TLIF) has been introduced3-5 and involves neural decompression and interbody fusion through a tubular retractor, and percutaneous placement of pedicle-screw instrumentation. This technique uses muscle dilation rather than large-scale detachment of muscle. Proponents of the MIS technique have postulated that decreased muscle damage would lead to better short-term, and possibly long-term, clinical outcomes, because of less iatrogenic soft-tissue damage.
Studies that have compared results of MIS TLIF with open TLIF have shown improved perioperative outcomes, but most have shown similar intermediate-term clinical outcomes.6 In the short term, multiple studies demonstrate that MIS TLIF is associated with decreased blood loss, less postoperative pain and narcotic requirements, and shorter hospital length of stay.7-13 However, changes in pain score and disease-specific and generic health-related quality of life measures have been similar for the 2 procedures, beyond 6 months postoperatively.10,13-15 These studies have generally involved retrospective reviews of unmatched patient groups, with small sample sizes and significant heterogeneity in surgical indications and case complexity. In our study, we compared intermediate-term clinical outcomes of MIS TLIF with open TLIF, using propensity matching to optimize baseline similarity of the groups.
Methods
This retrospective study was conducted after receiving approval from the Institutional Review Board. Surgical and clinical databases of 2 centers from 2008 to 2012 were reviewed for eligible subjects. Cases in 2007 were excluded because this was the year that MIS was introduced as a new technique in the practice. Inclusion criteria consisted of patients who underwent 1- to 2-level MIS TLIF and had complete baseline, 1- and 2-year postoperative outcome measures. Patients who had surgery for trauma, tumor, or osteomyelitis were excluded. Outcome measures collected and reviewed in this study included the Oswestry Disability Index (ODI),16,17 the Medical Outcomes Study Short-Form 36 (SF-36),18 and numeric rating scales for back and leg pain (0-100 scale).19 The Physical Composite Summary (PCS) and Mental Composite Summary of the SF-36 were reviewed separately. We recorded the following patient demographic data: age, gender, American Society of Anesthesiologists (ASA) grade, body mass index, indication for surgery, workers’ compensation, and smoking status. Surgical data included number of levels fused, operative time, estimated blood loss, and length of hospital stay.
Propensity-scoring technique20,21 was used to match the MIS TLIF patients to a control group of patients who underwent TLIF using an open approach (open TLIF), matching for multiple characteristics to produce 2 similar comparison groups. Propensity matching was performed to control for bias. In controlling for known confounders or biases, propensity matching, in theory, should also control for unknown confounders. Gender, age, body mass index, smoking status, indication for fusion, as well as preoperative ODI, SF-36 PCS, SF-36 Mental Composite Summary, and pain scores were used to generate a control open TLIF group.
MIS TLIF Surgical Technique
Patients in the MIS TLIF group underwent neural decompression and interbody fusion through a tubular retractor system (METRx, Medtronic Inc.), followed by percutaneous pedicle-screw fixation under fluoroscopic guidance (Sextant, Medtronic Inc.). After successful induction of general endotracheal anesthesia, patients were positioned prone on a radiolucent table. Posteroanterior (PA) and lateral fluoroscopic images were used to localize 2 paramedian incisions, approximately 3-cm to 5-cm lateral to midline, over the pedicles of interest. Modified Jamshidi needles (Medtronic Inc.) were used to cannulate the pedicles under PA, posterior-oblique, PA, and lateral fluoroscopic guidance. The pedicles were tapped with a cannulated tap. Pedicle screws and rods were introduced on the side contralateral to the TLIF and were used as needed to maintain intradiscal distraction during the TLIF portion of the procedure.
Decompression and TLIF were carried out on the side of the patient’s radicular pain or bilaterally, according to the surgeon’s discretion. A K-wire was advanced to the facet joint complex, after which sequential dilators were used to dilate through the muscles to establish an intramuscular corridor to the facet. A 26-mm fixed tubular retractor was docked over the facet and locked in place, using a post attached to the operating room table. Neural decompression was obtained by removal of the entire facet-joint complex and lamina to the base of the spinous process, using a combination of high-speed drills and Kerrison rongeurs. The ligamentum flavum was completely resected. The superior articular process of the caudal vertebra was removed all the way to the pedicle below. Ball-tipped probes were used to confirm that traversing and exiting nerve roots were completely free. An annulotomy was performed, and all disc material was removed from the disc through a combination of rotating shavers, serrated curettes, endplate scrapers, and rasps. Bone graft was placed anterior and contralateral to the interbody cage. (Bone grafts included autogenous iliac crest, local bone obtained from the decompression, recombinant human bone morphogenetic protein 2, or allograft demineralized bone matrix at the surgeon’s discretion.) After placement of the interbody cage, the ipsilateral pedicle-screw instrumentation was put over the remaining guide wires and compression applied across the construct to lock the interbody cage and restore lordosis. Wounds were closed without drains.
Open TLIF Surgical Technique
In patients undergoing open TLIF, a midline incision was made over the vertebrae of interest, and paraspinal muscles were subperiosteally dissected to the tips of the transverse processes. The appropriate level was confirmed with intraoperative radiograph. Pedicle screws were placed free-hand using anatomic landmarks, and appropriate placement was confirmed with intraoperative radiograph and evoked electromyography stimulation. Laminectomy and facetectomy were performed, and the disc was entered on the side of the facetectomy. After thorough disc-space preparation, bone graft and an interbody cage were placed, rods inserted, and compression carried out. A supplemental posterolateral fusion was also performed after decortication of the transverse processes and cartilaginous surface of the contralateral facet. Layered wound closure was performed over drains.
Analysis
Statistical analysis was carried out using SPSS Statistics version 17.0 (IBM) with significance set at the P < .01 level. A small, conservative P-value threshold was used to minimize type II error that resulted from the multiple comparisons performed. Student t test was used to determine any significant differences between continuous demographic variables, and to compare preoperative and postoperative outcome measure scores within and between study groups. Fisher’s exact test was used to compare categorical variables between the 2 groups.
Results
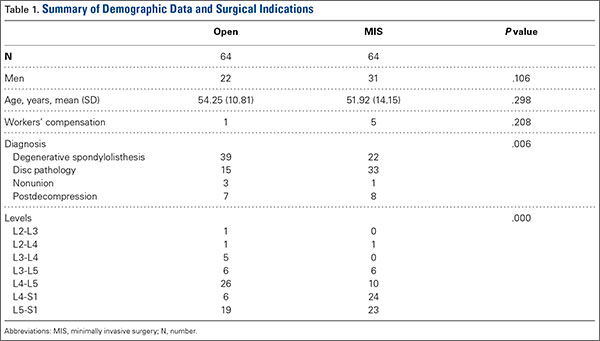
The MIS TLIF group consisted of 64 patients (average age, 52 years), and included 22 patients with degenerative spondylolisthesis, 33 with disc pathology, 8 with postdecompression, and 1 non-union patient. The open TLIF group consisted of 64 patients (average age, 54 years), and included 39 degenerative spondylolisthesis, 15 disc pathology, 7 postdecompression, and 3 nonunion patients (Table 1). All 64 open and 19 MIS cases were from a spine practice with 6 surgeons, and 45 MIS cases came from a spine practice with 2 surgeons. There was also an unequal distribution of the specific levels fused between the open and MIS groups.
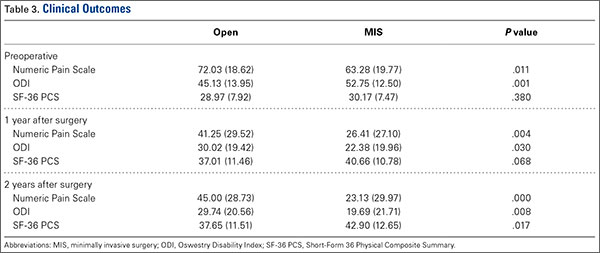
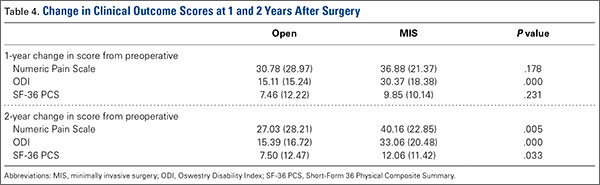
Although the operative time was similar in both groups, the MIS TLIF group had a statistically significantly lower blood loss compared with the open TLIF group (Table 2). Both MIS TLIF and open TLIF lead to significant improvements in pain, ODI, and SF-36 PCS (P < .01) (Table 3). At 1 year, both groups had similar improvements in pain (36.9 vs 30.8, P = .178) and SF-36 PCS (9.9 vs 7.5, P = .231), but the MIS TLIF group had a statistically significantly greater improvement in ODI compared with the open TLIF group (30.4 vs 15.1, P < .000). At 2 years, both groups had similar improvements in SF-36 PCS (12.1 vs 7.5, P = .033), but the MIS TLIF group had a statistically significantly greater improvement in pain (40.2 vs 27.0, P = .005) and ODI (33.1 vs 15.4, P < .000) compared with the open TLIF group (Table 4).
![]()
Discussion
The current study compared intermediate-term clinical outcomes of MIS TLIF to open TLIF. We used propensity matching to identify a control group of open TLIFs that were comparable to the MIS TLIF group across a variety of covariates that are known to influence the results of lumbar fusion. This created comparison groups that were as closely matched at baseline as possible. We found that, at 2-year follow-up, MIS TLIF patients had less pain and less low-back pain–related disability as measured by ODI. There was also a trend toward better generic health-related quality of life in the MIS TLIF group.
These data suggest that the decreased soft-tissue trauma of the minimally invasive surgical technique, which leads to improved perioperative parameters in the short term, may also lead to some advantages that translate to improved intermediate-term clinical outcomes. Traditional lumbar fusion procedures have shown excellent clinical results when used for accepted clinical indications.22 However, the procedure requires extensive dissection of the paraspinal muscles, which causes significant muscle damage as evidenced by muscle breakdown products that can be detected in the bloodstream postoperatively.23,24 The lateral dissection also transects the dorsal ramus of the segmental nerves, which innervate the paraspinal muscles, leading to significant scarring and atrophy on postoperative imaging studies.23 Some authors have used the term “fusion disease” to describe the constellation of soft-tissue degradation seen after open lumbar fusion.5
An MIS version of the TLIF procedure that was described in 20033 avoids much of this iatrogenic soft-tissue trauma. It involves intramuscular dilation to approach the spine and to carry out neural decompression and interbody fusion, in conjunction with percutaneous pedicle-screw instrumentation. Proponents of this technique point to diminished iatrogenic soft-tissue and muscle damage as an advantage. Multiple studies have, in fact, confirmed improved short-term perioperative parameters, such as less blood loss, lower narcotic requirements, and decreased length-of-hospital stay.25 Economic analyses have also shown lower direct and indirect costs with the MIS technique.26
Several studies have compared patient-reported outcome measures of MIS and open TLIF, and the results have been mixed. Most of these studies have shown similar improvement in clinical outcomes between the 2 procedures, but the MIS technique demonstrated short-term perioperative advantages, such as lower blood loss, less narcotic requirements, and shorter length of stay.7-15 The authors of these studies conclude that the MIS technique can provide similar long-term results with lower short-term morbidity when compared with open TLIF. In contrast, some studies have shown better short- and intermediate-term clinical outcomes with the MIS technique.23,27-29 As a whole, the literature comparing the 2 procedures consists of mostly small retrospective studies with nonrandomized patient samples, heterogeneous surgical indications, and differing surgical techniques, making it difficult to draw conclusions.
The current study suggests that MIS TLIF may lead to improved clinical results at 2-year follow-up, compared with open TLIF. Our study used propensity-score matching to minimize the effects of nonrandom assignment of subjects to MIS TLIF or open TLIF. A limitation of observational studies is that bias in assignment of subjects to treatment groups can lead to overestimation or underestimation of the effect of the treatment itself. Propensity-score matching attempts to reduce this bias by accounting for several covariates that predict whether a subject will receive a certain treatment. These covariates are used in a logistic regression to produce a propensity score, which can be used to match subjects to controls across multiple dimensions, thus ensuring groups are as comparable as possible at baseline.
Our study still has several limitations. Sample size is relatively small, and follow-up is still only intermediate, at 2 years. There was unequal distribution of specific levels of surgery. Because patients were not blinded to the treatment they received, it is possible that patient perception of receiving a newer, less-invasive treatment method may influence their subjective improvement. The study sample was drawn from 2 different centers, with one center providing mostly MIS cases and the other providing mostly open cases. Because of this, undetected differences in how patients were selected for surgery could also affect outcomes. Any latent confounding variables, which are not identified a priori, will not be accounted for in the matching process. Only a prospective, randomized study with large numbers can control for observed and unobserved confounding patient characteristics.
In summary, our study shows that MIS TLIF is associated with improved low back pain and low back–related disability at 2 years compared with open TLIF. Other studies comparing the 2 techniques have come to different conclusions regarding whether the short-term benefits of MIS TLIF translate into long-term differences in clinical outcome. This study adds to this evidence and suggests there may be longer term advantages to the MIS approach, but prospective randomized trials are needed to confirm this finding and determine the true magnitude of these differences.
1. Harms J, Rolinger H. A one-stager procedure in operative treatment of spondylolisthesis: dorsal traction-reposition and anterior fusion (author’s transl). Z Orthop Ihre Grenzgeb. 1982;120(3):343-347.
2. Jagannathan J, Sansur CA, Oskouian RJ Jr, Fu KM, Shaffrey CI. Radiographic restoration of lumbar alignment after transforaminal lumbar interbody fusion. Neurosurgery. 2009;64(5):955-963.
3. Foley KT, Holly LT, Schwender JD. Minimally invasive lumbar fusion. Spine. 2003;28(15 suppl):S26-S35.
4. Rouben D, Casnellie M, Ferguson M. Long-term durability of minimally invasive posterior transforaminal lumbar interbody fusion: a clinical and radiographic follow-up. J Spinal Disord Tech. 2011;24(5):288-296.
5. Schwender JD, Holly LT, Rouben DP, Foley KT. Minimally invasive transforaminal lumbar interbody fusion (TLIF): technical feasibility and initial results. J Spinal Disord Tech. 2005;18(suppl):S1-S6.
6. Goldstein CL, Macwan K, Sundararajan K, Rampersaud YR. Comparative outcomes of minimally invasive surgery for posterior lumbar fusion: a systematic review. Clin Orthop Relat Res. 2014;472(6):1727-1737.
7. Adogwa O, Parker SL, Bydon A, Cheng J, McGirt MJ. Comparative effectiveness of minimally invasive versus open transforaminal lumbar interbody fusion: 2-year assessment of narcotic use, return to work, disability, and quality of life. J Spinal Disord Tech. 2011;24(8):479-484.
8. Ghahreman A, Ferch RD, Rao PJ, Bogduk N. Minimal access versus open posterior lumbar interbody fusion in the treatment of spondylolisthesis. Neurosurgery. 2010;66(2):296-304.
9. Park Y, Ha JW. Comparison of one-level posterior lumbar interbody fusion performed with a minimally invasive approach or a traditional open approach. Spine. 2007;32(5):537-543.
10. Saetia K, Phankhongsab A, Kuansongtham V, Paiboonsirijit S. Comparison between minimally invasive and open transforaminal lumbar interbody fusion. J Med Assoc Thai. 2013;96(1):41-46.
11. Schizas C, Tzinieris N, Tsiridis E, Kosmopoulos V. Minimally invasive versus open transforaminal lumbar interbody fusion: evaluating initial experience. Int Ortop. 2009;33(6):1683-1688.
12. Wang J, Zhou Y, Zhang ZF, Li CQ, Zheng WJ, Liu J. Comparison of one-level minimally invasive and open transforaminal lumbar interbody fusion in degenerative and isthmic spondylolisthesis grades 1 and 2. Eur Spine J. 2010;19(1):1780-1784.
13. Lee KH, Yue WM, Yeo W, Soeharno H, Tan SB. Clinical and radiological outcomes of open versus minimally invasive transforaminal lumbar interbody fusion. Eur Spine J. 2012;21(11):2265-2270.
14. Peng CW, Yue WM, Poh SY, Yeo W, Tan SB. Clinical and radiological outcomes of minimally invasive versus open transforaminal lumbar interbody fusion. Spine. 2009;34(13):1385-1389.
15. Seng C, Siddiqui MA, Wong KP, et al. Five-year outcomes of minimally invasive versus open transforaminal lumbar interbody fusion: a matched-pair comparison study. Spine. 2013;38(23):2049-2055.
16. Fairbank JC, Pynsent PB. The Oswestry Disability Index. Spine. 2000;25(22):2940-2953.
17. Fairbank JC, Couper J, Davies JB, O’Brien JP. The Oswestry low back pain disability questionnaire. Physiotherapy. 1980;66(8):271-273.
18. Ware JE, Kosinski M, Keller SK. SF-36 Physical and Mental Health Summary Scales: A User’s Manual. Boston, MA: The Health Institute, 1994.
19. McCaffery M, Beebe A. Pain: Clinical Manual for Nursing Practice. Baltimore, MD: V.V. Mosby Company, 1993.
20. D’Agostino RB Jr. Propensity score methods for bias reduction in the comparison of a treatment to a non-randomized control group. Stat Med. 1998;17(19):2265-2281.
21. Rosenbaum PR. Model-based direct adjustment. J Am Stat Assn. 1987;82:387-394.
22. Glassman SD, Carreon LY, Djurasovic M, et al. Lumbar fusion outcomes stratified by specific diagnostic indication. Spine J. 2009;9(1):13-21.
23. Fan S, Hu Z, Zhao F, Zhao X, Huang Y, Fang X. Multifidus muscle changes and clinical effects of one-level posterior lumbar interbody fusion: minimally invasive procedure versus conventional open approach. Eur Spine J. 2010;19(2):316-324.
24. Kawaguchi Y, Matsui H, Tsuji H. Back muscle injury after posterior lumbar spine surgery. A histologic and enzymatic analysis. Spine. 1996;21(8):941-944.
25. Sun ZJ, Li WJ, Zhao Y, Qui GX. Comparing minimally invasive and open transforaminal lumbar interbody fusion for treatment of degenerative lumbar disease: a meta-analysis. Chin Med J. 2013;126(2):3962-3971.
26. Parker SL, Mendenhall SK, Shau DN, et al. Minimally invasive versus open transforaminal lumbar interbody fusion for degenerative spondylolisthesis: comparative effectiveness and cost-utility analysis. World Neurosurg. 2014;82(1-2):230-238.
27. Kotani Y, Abumi K, Ito M, Sudo H, Abe Y, Minami A. Mid-term clinical results of minimally invasive decompression and posterolateral fusion with percutaneous pedicle screws versus conventional approach for degenerative spondylolisthesis with spinal stenosis. Eur Spine J. 2012;21(6):1171-1177.
28. Pelton MA, Phillips FM, Singh K. A comparison of perioperative costs and outcomes in patients with and without worker’s compensation claims treated with MIS or open TLIF. Spine. 2012;37(22):1914-1919.
29. Wong AP, Smith ZA, Stadler JA 3rd, et al. Minimally invasive transforaminal lumbar interbody fusion (MI-TLIF). Surgical technique, long-term 4 year prospective outcomes and complications compared with an open TLIF cohort. Neurosurg Clin N Am. 2014;25(2):279-304.
Transforaminal lumbar interbody fusion (TLIF) has become an increasingly popular method of lumbar fusion, since its introduction by Harms and Rolinger in 1982.1 The procedure allows for a circumferential fusion through a posterior-only approach, with improved sagittal alignment2 and minimal risk for iatrogenic nerve injury. In the past decade, a minimally invasive surgical method of TLIF (MIS TLIF) has been introduced3-5 and involves neural decompression and interbody fusion through a tubular retractor, and percutaneous placement of pedicle-screw instrumentation. This technique uses muscle dilation rather than large-scale detachment of muscle. Proponents of the MIS technique have postulated that decreased muscle damage would lead to better short-term, and possibly long-term, clinical outcomes, because of less iatrogenic soft-tissue damage.
Studies that have compared results of MIS TLIF with open TLIF have shown improved perioperative outcomes, but most have shown similar intermediate-term clinical outcomes.6 In the short term, multiple studies demonstrate that MIS TLIF is associated with decreased blood loss, less postoperative pain and narcotic requirements, and shorter hospital length of stay.7-13 However, changes in pain score and disease-specific and generic health-related quality of life measures have been similar for the 2 procedures, beyond 6 months postoperatively.10,13-15 These studies have generally involved retrospective reviews of unmatched patient groups, with small sample sizes and significant heterogeneity in surgical indications and case complexity. In our study, we compared intermediate-term clinical outcomes of MIS TLIF with open TLIF, using propensity matching to optimize baseline similarity of the groups.
Methods
This retrospective study was conducted after receiving approval from the Institutional Review Board. Surgical and clinical databases of 2 centers from 2008 to 2012 were reviewed for eligible subjects. Cases in 2007 were excluded because this was the year that MIS was introduced as a new technique in the practice. Inclusion criteria consisted of patients who underwent 1- to 2-level MIS TLIF and had complete baseline, 1- and 2-year postoperative outcome measures. Patients who had surgery for trauma, tumor, or osteomyelitis were excluded. Outcome measures collected and reviewed in this study included the Oswestry Disability Index (ODI),16,17 the Medical Outcomes Study Short-Form 36 (SF-36),18 and numeric rating scales for back and leg pain (0-100 scale).19 The Physical Composite Summary (PCS) and Mental Composite Summary of the SF-36 were reviewed separately. We recorded the following patient demographic data: age, gender, American Society of Anesthesiologists (ASA) grade, body mass index, indication for surgery, workers’ compensation, and smoking status. Surgical data included number of levels fused, operative time, estimated blood loss, and length of hospital stay.
Propensity-scoring technique20,21 was used to match the MIS TLIF patients to a control group of patients who underwent TLIF using an open approach (open TLIF), matching for multiple characteristics to produce 2 similar comparison groups. Propensity matching was performed to control for bias. In controlling for known confounders or biases, propensity matching, in theory, should also control for unknown confounders. Gender, age, body mass index, smoking status, indication for fusion, as well as preoperative ODI, SF-36 PCS, SF-36 Mental Composite Summary, and pain scores were used to generate a control open TLIF group.
MIS TLIF Surgical Technique
Patients in the MIS TLIF group underwent neural decompression and interbody fusion through a tubular retractor system (METRx, Medtronic Inc.), followed by percutaneous pedicle-screw fixation under fluoroscopic guidance (Sextant, Medtronic Inc.). After successful induction of general endotracheal anesthesia, patients were positioned prone on a radiolucent table. Posteroanterior (PA) and lateral fluoroscopic images were used to localize 2 paramedian incisions, approximately 3-cm to 5-cm lateral to midline, over the pedicles of interest. Modified Jamshidi needles (Medtronic Inc.) were used to cannulate the pedicles under PA, posterior-oblique, PA, and lateral fluoroscopic guidance. The pedicles were tapped with a cannulated tap. Pedicle screws and rods were introduced on the side contralateral to the TLIF and were used as needed to maintain intradiscal distraction during the TLIF portion of the procedure.
Decompression and TLIF were carried out on the side of the patient’s radicular pain or bilaterally, according to the surgeon’s discretion. A K-wire was advanced to the facet joint complex, after which sequential dilators were used to dilate through the muscles to establish an intramuscular corridor to the facet. A 26-mm fixed tubular retractor was docked over the facet and locked in place, using a post attached to the operating room table. Neural decompression was obtained by removal of the entire facet-joint complex and lamina to the base of the spinous process, using a combination of high-speed drills and Kerrison rongeurs. The ligamentum flavum was completely resected. The superior articular process of the caudal vertebra was removed all the way to the pedicle below. Ball-tipped probes were used to confirm that traversing and exiting nerve roots were completely free. An annulotomy was performed, and all disc material was removed from the disc through a combination of rotating shavers, serrated curettes, endplate scrapers, and rasps. Bone graft was placed anterior and contralateral to the interbody cage. (Bone grafts included autogenous iliac crest, local bone obtained from the decompression, recombinant human bone morphogenetic protein 2, or allograft demineralized bone matrix at the surgeon’s discretion.) After placement of the interbody cage, the ipsilateral pedicle-screw instrumentation was put over the remaining guide wires and compression applied across the construct to lock the interbody cage and restore lordosis. Wounds were closed without drains.
Open TLIF Surgical Technique
In patients undergoing open TLIF, a midline incision was made over the vertebrae of interest, and paraspinal muscles were subperiosteally dissected to the tips of the transverse processes. The appropriate level was confirmed with intraoperative radiograph. Pedicle screws were placed free-hand using anatomic landmarks, and appropriate placement was confirmed with intraoperative radiograph and evoked electromyography stimulation. Laminectomy and facetectomy were performed, and the disc was entered on the side of the facetectomy. After thorough disc-space preparation, bone graft and an interbody cage were placed, rods inserted, and compression carried out. A supplemental posterolateral fusion was also performed after decortication of the transverse processes and cartilaginous surface of the contralateral facet. Layered wound closure was performed over drains.
Analysis
Statistical analysis was carried out using SPSS Statistics version 17.0 (IBM) with significance set at the P < .01 level. A small, conservative P-value threshold was used to minimize type II error that resulted from the multiple comparisons performed. Student t test was used to determine any significant differences between continuous demographic variables, and to compare preoperative and postoperative outcome measure scores within and between study groups. Fisher’s exact test was used to compare categorical variables between the 2 groups.
Results
The MIS TLIF group consisted of 64 patients (average age, 52 years), and included 22 patients with degenerative spondylolisthesis, 33 with disc pathology, 8 with postdecompression, and 1 non-union patient. The open TLIF group consisted of 64 patients (average age, 54 years), and included 39 degenerative spondylolisthesis, 15 disc pathology, 7 postdecompression, and 3 nonunion patients (Table 1). All 64 open and 19 MIS cases were from a spine practice with 6 surgeons, and 45 MIS cases came from a spine practice with 2 surgeons. There was also an unequal distribution of the specific levels fused between the open and MIS groups.
Although the operative time was similar in both groups, the MIS TLIF group had a statistically significantly lower blood loss compared with the open TLIF group (Table 2). Both MIS TLIF and open TLIF lead to significant improvements in pain, ODI, and SF-36 PCS (P < .01) (Table 3). At 1 year, both groups had similar improvements in pain (36.9 vs 30.8, P = .178) and SF-36 PCS (9.9 vs 7.5, P = .231), but the MIS TLIF group had a statistically significantly greater improvement in ODI compared with the open TLIF group (30.4 vs 15.1, P < .000). At 2 years, both groups had similar improvements in SF-36 PCS (12.1 vs 7.5, P = .033), but the MIS TLIF group had a statistically significantly greater improvement in pain (40.2 vs 27.0, P = .005) and ODI (33.1 vs 15.4, P < .000) compared with the open TLIF group (Table 4).
![]()
Discussion
The current study compared intermediate-term clinical outcomes of MIS TLIF to open TLIF. We used propensity matching to identify a control group of open TLIFs that were comparable to the MIS TLIF group across a variety of covariates that are known to influence the results of lumbar fusion. This created comparison groups that were as closely matched at baseline as possible. We found that, at 2-year follow-up, MIS TLIF patients had less pain and less low-back pain–related disability as measured by ODI. There was also a trend toward better generic health-related quality of life in the MIS TLIF group.
These data suggest that the decreased soft-tissue trauma of the minimally invasive surgical technique, which leads to improved perioperative parameters in the short term, may also lead to some advantages that translate to improved intermediate-term clinical outcomes. Traditional lumbar fusion procedures have shown excellent clinical results when used for accepted clinical indications.22 However, the procedure requires extensive dissection of the paraspinal muscles, which causes significant muscle damage as evidenced by muscle breakdown products that can be detected in the bloodstream postoperatively.23,24 The lateral dissection also transects the dorsal ramus of the segmental nerves, which innervate the paraspinal muscles, leading to significant scarring and atrophy on postoperative imaging studies.23 Some authors have used the term “fusion disease” to describe the constellation of soft-tissue degradation seen after open lumbar fusion.5
An MIS version of the TLIF procedure that was described in 20033 avoids much of this iatrogenic soft-tissue trauma. It involves intramuscular dilation to approach the spine and to carry out neural decompression and interbody fusion, in conjunction with percutaneous pedicle-screw instrumentation. Proponents of this technique point to diminished iatrogenic soft-tissue and muscle damage as an advantage. Multiple studies have, in fact, confirmed improved short-term perioperative parameters, such as less blood loss, lower narcotic requirements, and decreased length-of-hospital stay.25 Economic analyses have also shown lower direct and indirect costs with the MIS technique.26
Several studies have compared patient-reported outcome measures of MIS and open TLIF, and the results have been mixed. Most of these studies have shown similar improvement in clinical outcomes between the 2 procedures, but the MIS technique demonstrated short-term perioperative advantages, such as lower blood loss, less narcotic requirements, and shorter length of stay.7-15 The authors of these studies conclude that the MIS technique can provide similar long-term results with lower short-term morbidity when compared with open TLIF. In contrast, some studies have shown better short- and intermediate-term clinical outcomes with the MIS technique.23,27-29 As a whole, the literature comparing the 2 procedures consists of mostly small retrospective studies with nonrandomized patient samples, heterogeneous surgical indications, and differing surgical techniques, making it difficult to draw conclusions.
The current study suggests that MIS TLIF may lead to improved clinical results at 2-year follow-up, compared with open TLIF. Our study used propensity-score matching to minimize the effects of nonrandom assignment of subjects to MIS TLIF or open TLIF. A limitation of observational studies is that bias in assignment of subjects to treatment groups can lead to overestimation or underestimation of the effect of the treatment itself. Propensity-score matching attempts to reduce this bias by accounting for several covariates that predict whether a subject will receive a certain treatment. These covariates are used in a logistic regression to produce a propensity score, which can be used to match subjects to controls across multiple dimensions, thus ensuring groups are as comparable as possible at baseline.
Our study still has several limitations. Sample size is relatively small, and follow-up is still only intermediate, at 2 years. There was unequal distribution of specific levels of surgery. Because patients were not blinded to the treatment they received, it is possible that patient perception of receiving a newer, less-invasive treatment method may influence their subjective improvement. The study sample was drawn from 2 different centers, with one center providing mostly MIS cases and the other providing mostly open cases. Because of this, undetected differences in how patients were selected for surgery could also affect outcomes. Any latent confounding variables, which are not identified a priori, will not be accounted for in the matching process. Only a prospective, randomized study with large numbers can control for observed and unobserved confounding patient characteristics.
In summary, our study shows that MIS TLIF is associated with improved low back pain and low back–related disability at 2 years compared with open TLIF. Other studies comparing the 2 techniques have come to different conclusions regarding whether the short-term benefits of MIS TLIF translate into long-term differences in clinical outcome. This study adds to this evidence and suggests there may be longer term advantages to the MIS approach, but prospective randomized trials are needed to confirm this finding and determine the true magnitude of these differences.
1. Harms J, Rolinger H. A one-stager procedure in operative treatment of spondylolisthesis: dorsal traction-reposition and anterior fusion (author’s transl). Z Orthop Ihre Grenzgeb. 1982;120(3):343-347.
2. Jagannathan J, Sansur CA, Oskouian RJ Jr, Fu KM, Shaffrey CI. Radiographic restoration of lumbar alignment after transforaminal lumbar interbody fusion. Neurosurgery. 2009;64(5):955-963.
3. Foley KT, Holly LT, Schwender JD. Minimally invasive lumbar fusion. Spine. 2003;28(15 suppl):S26-S35.
4. Rouben D, Casnellie M, Ferguson M. Long-term durability of minimally invasive posterior transforaminal lumbar interbody fusion: a clinical and radiographic follow-up. J Spinal Disord Tech. 2011;24(5):288-296.
5. Schwender JD, Holly LT, Rouben DP, Foley KT. Minimally invasive transforaminal lumbar interbody fusion (TLIF): technical feasibility and initial results. J Spinal Disord Tech. 2005;18(suppl):S1-S6.
6. Goldstein CL, Macwan K, Sundararajan K, Rampersaud YR. Comparative outcomes of minimally invasive surgery for posterior lumbar fusion: a systematic review. Clin Orthop Relat Res. 2014;472(6):1727-1737.
7. Adogwa O, Parker SL, Bydon A, Cheng J, McGirt MJ. Comparative effectiveness of minimally invasive versus open transforaminal lumbar interbody fusion: 2-year assessment of narcotic use, return to work, disability, and quality of life. J Spinal Disord Tech. 2011;24(8):479-484.
8. Ghahreman A, Ferch RD, Rao PJ, Bogduk N. Minimal access versus open posterior lumbar interbody fusion in the treatment of spondylolisthesis. Neurosurgery. 2010;66(2):296-304.
9. Park Y, Ha JW. Comparison of one-level posterior lumbar interbody fusion performed with a minimally invasive approach or a traditional open approach. Spine. 2007;32(5):537-543.
10. Saetia K, Phankhongsab A, Kuansongtham V, Paiboonsirijit S. Comparison between minimally invasive and open transforaminal lumbar interbody fusion. J Med Assoc Thai. 2013;96(1):41-46.
11. Schizas C, Tzinieris N, Tsiridis E, Kosmopoulos V. Minimally invasive versus open transforaminal lumbar interbody fusion: evaluating initial experience. Int Ortop. 2009;33(6):1683-1688.
12. Wang J, Zhou Y, Zhang ZF, Li CQ, Zheng WJ, Liu J. Comparison of one-level minimally invasive and open transforaminal lumbar interbody fusion in degenerative and isthmic spondylolisthesis grades 1 and 2. Eur Spine J. 2010;19(1):1780-1784.
13. Lee KH, Yue WM, Yeo W, Soeharno H, Tan SB. Clinical and radiological outcomes of open versus minimally invasive transforaminal lumbar interbody fusion. Eur Spine J. 2012;21(11):2265-2270.
14. Peng CW, Yue WM, Poh SY, Yeo W, Tan SB. Clinical and radiological outcomes of minimally invasive versus open transforaminal lumbar interbody fusion. Spine. 2009;34(13):1385-1389.
15. Seng C, Siddiqui MA, Wong KP, et al. Five-year outcomes of minimally invasive versus open transforaminal lumbar interbody fusion: a matched-pair comparison study. Spine. 2013;38(23):2049-2055.
16. Fairbank JC, Pynsent PB. The Oswestry Disability Index. Spine. 2000;25(22):2940-2953.
17. Fairbank JC, Couper J, Davies JB, O’Brien JP. The Oswestry low back pain disability questionnaire. Physiotherapy. 1980;66(8):271-273.
18. Ware JE, Kosinski M, Keller SK. SF-36 Physical and Mental Health Summary Scales: A User’s Manual. Boston, MA: The Health Institute, 1994.
19. McCaffery M, Beebe A. Pain: Clinical Manual for Nursing Practice. Baltimore, MD: V.V. Mosby Company, 1993.
20. D’Agostino RB Jr. Propensity score methods for bias reduction in the comparison of a treatment to a non-randomized control group. Stat Med. 1998;17(19):2265-2281.
21. Rosenbaum PR. Model-based direct adjustment. J Am Stat Assn. 1987;82:387-394.
22. Glassman SD, Carreon LY, Djurasovic M, et al. Lumbar fusion outcomes stratified by specific diagnostic indication. Spine J. 2009;9(1):13-21.
23. Fan S, Hu Z, Zhao F, Zhao X, Huang Y, Fang X. Multifidus muscle changes and clinical effects of one-level posterior lumbar interbody fusion: minimally invasive procedure versus conventional open approach. Eur Spine J. 2010;19(2):316-324.
24. Kawaguchi Y, Matsui H, Tsuji H. Back muscle injury after posterior lumbar spine surgery. A histologic and enzymatic analysis. Spine. 1996;21(8):941-944.
25. Sun ZJ, Li WJ, Zhao Y, Qui GX. Comparing minimally invasive and open transforaminal lumbar interbody fusion for treatment of degenerative lumbar disease: a meta-analysis. Chin Med J. 2013;126(2):3962-3971.
26. Parker SL, Mendenhall SK, Shau DN, et al. Minimally invasive versus open transforaminal lumbar interbody fusion for degenerative spondylolisthesis: comparative effectiveness and cost-utility analysis. World Neurosurg. 2014;82(1-2):230-238.
27. Kotani Y, Abumi K, Ito M, Sudo H, Abe Y, Minami A. Mid-term clinical results of minimally invasive decompression and posterolateral fusion with percutaneous pedicle screws versus conventional approach for degenerative spondylolisthesis with spinal stenosis. Eur Spine J. 2012;21(6):1171-1177.
28. Pelton MA, Phillips FM, Singh K. A comparison of perioperative costs and outcomes in patients with and without worker’s compensation claims treated with MIS or open TLIF. Spine. 2012;37(22):1914-1919.
29. Wong AP, Smith ZA, Stadler JA 3rd, et al. Minimally invasive transforaminal lumbar interbody fusion (MI-TLIF). Surgical technique, long-term 4 year prospective outcomes and complications compared with an open TLIF cohort. Neurosurg Clin N Am. 2014;25(2):279-304.
Operative Versus Nonoperative Treatment of Jones Fractures: A Decision Analysis Model
The optimal management strategy for acute fractures of the metadiaphyseal fifth metatarsal (Jones fractures) is controversial. Patients can be successfully treated nonoperatively with non-weight-bearing and immobilization in a short leg cast1-7 or operatively with placement of an intramedullary screw.8-10 The primary advantage of nonoperative treatment is avoiding the risks and discomfort of surgery; disadvantages include the need for prolonged immobilization and protected weight-bearing as well as a decreased union rate.8,9 Advantages of operative treatment include accelerated functional recovery and an improved union rate; disadvantages include exposure to the risks, inconvenience, and discomfort of surgery. Clear, definitive evidence for guiding treatment is not available in the orthopedic literature, and treatment strategies vary substantially according to surgeon and patient preference.
Expected-value decision analysis, a research tool that helps guide decision-making in situations of uncertainty, has been effectively applied to other areas of uncertainty in the orthopedic literature.11-14 Borrowed from gaming theory, the technique involves creating a decision tree to define the clinical problem, determining outcome probabilities and utilities, performing a fold-back analysis to determine the optimal decision-making strategy, and performing a sensitivity analysis to model the effect of varying outcome probabilities and utilities on decision-making. Decision analysis may therefore allow the clinician and the patient to optimize decision-making based on best available evidence and patient preferences. It also helps determine the most important factors affecting management strategies and the decision-making process, which may not always be intuitive.
In the present study, we used expected-value decision analysis to determine the optimal management strategy, operative or nonoperative, for acute Jones fracture. We also explored factors with the most influence on the model and identified important questions for future research.
Materials and Methods
Institutional review board approval was obtained for this study. Analysis was performed with Treeage Pro statistical software (Treeage Software).
Outcome Probabilities
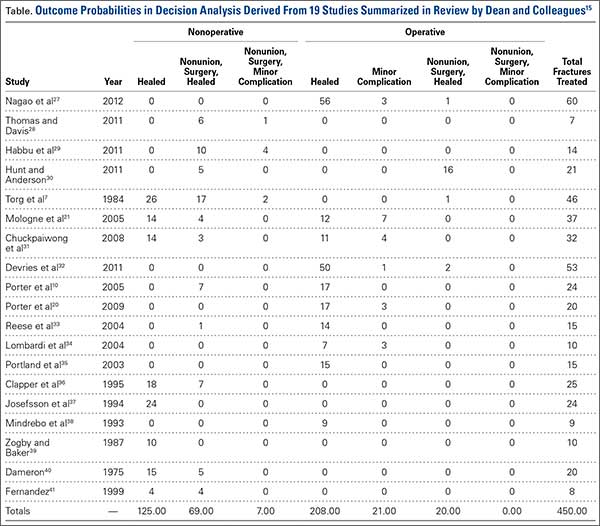
Outcome probabilities were determined by reviewing the literature for articles on Jones fractures. This body of literature was summarized in a comprehensive review by Dean and colleagues15, who extracted data from 19 studies: 1 randomized controlled trial, 1 prospective case series, and 17 retrospective case series.15 We used data from these studies to determine outcome probabilities (Table).
Outcome Utilities
Utilities represent patient preferences for various disease states. Outcome utility values were obtained from 32 adults (25 women, 7 men) with no history of foot injury. Mean age was 32.4 years (range, 20-69 years). The questionnaire presented scenarios for the different outcomes and asked patients to rate these outcomes on a scale ranging from 0 (worst possible outcome) to 10 (best possible outcome). The Sports subscale of the Foot and Ankle Ability Measure (FAAM) 16 was used to quantify patient activity level.
Decision Tree and Fold-Back Analysis
A decision tree was constructed with 1 decision node, 4 chance nodes, and 7 terminal nodes (Figure 1). The decision tree demonstrates 2 different strategies for managing a Jones fracture. The decision node divides the tree into 2 branches: initial operative or nonoperative treatment. Both branches are followed by various chance nodes, each terminating in a discrete clinical outcome. Per convention, utility data were placed to the right of the terminal nodes, and probability data were placed under the terminal nodes.
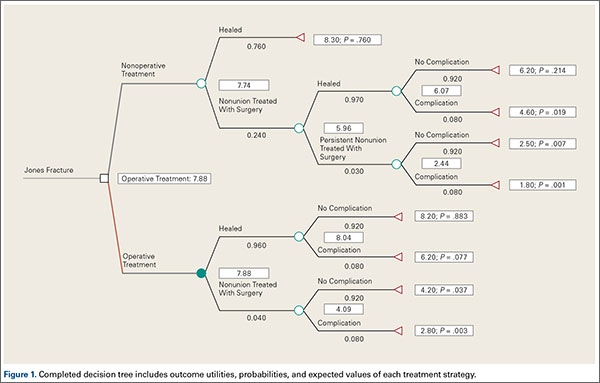
Fold-back analysis was performed to identify the optimal strategy. Fold-back analysis involves multiplying each outcome utility by its associated probability, thereby providing an “expected value” for each clinical endpoint. Then, the expected values for each endpoint can be summed for a given management strategy, and the ultimate expected values of the different strategies can be compared. The management strategy associated with the highest expected value is optimal for the given outcome utilities and probabilities.
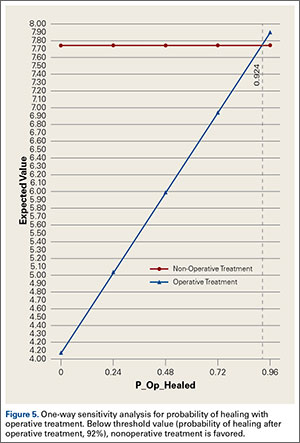
Sensitivity Analysis
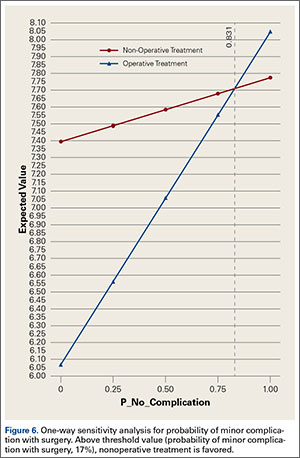
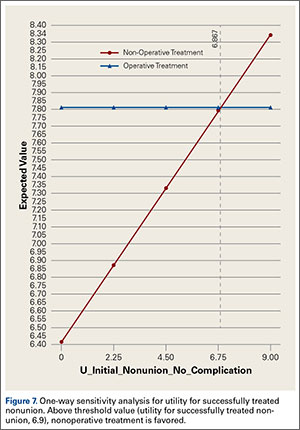
One-way sensitivity analysis was performed to model the effect on decision-making of changing the values for utility for uncomplicated surgery, utility for healing with nonoperative treatment, utility for uncomplicated treatment of nonunion, likelihood of healing with nonoperative treatment, likelihood of healing with surgery, and likelihood of minor complication with surgery. These were the variables found to affect the decision-making strategy within their clinically plausible ranges.
Results
Outcome Probabilities and Utilities
Outcome probabilities and utilities are illustrated in Figure 1. By convention, probabilities appear below the corresponding branches of the decision tree, and utilities appear at the end of each branch. Mean (SD) FAAM Sports subscale score was 84.6 (27.4). This subscale is scored as a percentage from 0% to 100%, with higher scores indicating a higher level of physical function.
Decision Analysis
The expected value for nonoperative treatment was 7.74, and the expected value for intramedullary screw fixation was 7.88 (Figure 1). Therefore, operative treatment was identified as the optimal treatment strategy.
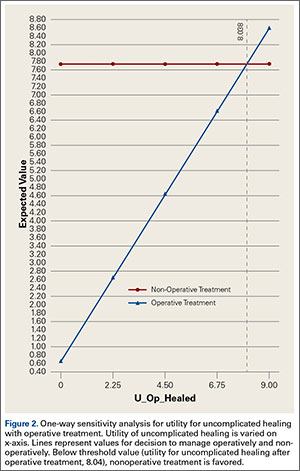
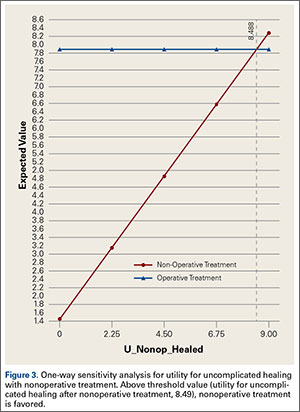
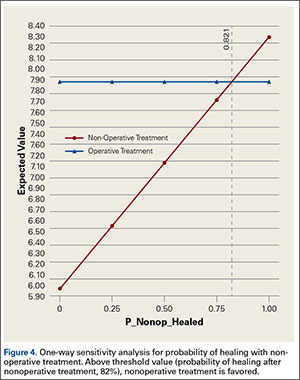
Sensitivity analyses revealed that the optimal decision making strategy was very sensitive to small changes in several variables. Nonoperative treatment becomes the preferred strategy when the utility value for uncomplicated surgery falls below 8.04 (Figure 2), when the utility for healing with nonoperative treatment rises above 8.49 (Figure 3), when the likelihood of healing with nonoperative treatment rises above 82% (Figure 4), or when the probability of healing after surgery falls below 92% (Figure 5). Nonoperative treatment is also favored when the probability of minor complication with surgery is above 17% (Figure 6) and when utility for a successfully treated nonunion is higher than 6.9 (Figure 7).
Discussion
Optimal management of a metadiaphyseal fracture of the fifth metatarsal (Jones fracture) remains controversial. The decision between initial operative or nonoperative treatment lends itself to expected-value decision analysis because of well-defined treatment options and relatively discrete outcomes. The principal advantages of nonoperative treatment are that it allows the patient to avoid the risks and discomfort of surgery, and the principal advantages of operative treatment are that it maximizes the chance of fracture union and may accelerate functional recovery.
Our decision analysis determined that operative fixation is the optimal decision path, given the outcome probabilities derived from the literature and the utilities obtained from surveys. This finding is in accordance with several expert opinions in foot and ankle fracture surgery.17,18 However, the expected values of the operative and nonoperative treatment strategies differed by only 0.3 on a 10-point scale. Such similar expected values in our model are not surprising given the controversy surrounding clinical decision making in the treatment of these fractures.19
In addition, our analysis identified the important variables in the decision-making process. Patients averse to surgery, patients not averse to successful nonoperative treatment, and patients who view successful nonunion surgery after initial nonoperative treatment as a relatively positive outcome may be best treated nonoperatively. These findings emphasize the importance of patient preferences and shared decision-making. Higher rates of healing with nonoperative treatment, lower rates of healing with surgery, and higher complication rates with surgery also favor nonoperative management. It would therefore be valuable to identify risk factors for nonunion with nonoperative treatment and to identify the technical details of surgery that maximize rates of healing and minimize the risk of complications.
The limitations of decision analysis involve the methods by which probabilities and utilities are obtained. In general, the most accurate, stable, and robust estimates of outcome probabilities are derived from a meta-analytic synthesis of randomized clinical trials, the highest level of clinical evidence. In our model, data were extracted primarily from level IV studies; only 1 level III study20 and 1 level II study21 were available for analysis. Thus, as is the case with many foot and ankle disorders22, the information on treatment of Jones fractures is very limited in its level of clinical evidence.
Determination of outcome utility also has limitations. Utility is a subjective value that an individual places on a specific outcome. This can be very difficult to quantify. In general, the most robust estimates of patient-derived utilities are derived from complex qualitative methods, such as the standard reference gamble or time trade-offs, in which patients are asked to gamble or choose between health states usually referenced to death. In this study, we determined patient-derived utility values from a direct scaling method using a Likert scale because of the complexity of the standard reference gamble and the difficulty of referencing to death for metatarsal fracture. Although use of a direct scale to determine utility values is less rigorous than the standard reference gamble, this technique has been corroborated methodologically,23 is advantageous in terms of feasibility and reliability,24 and has been successfully used in other orthopedic decision analysis models.12,25,26 In our estimation, generally active patients without a history of foot pathology constituted a sample of convenience but also were representative of individuals at risk for Jones fracture. Although specific scenarios were presented, the patients who completed the questionnaire may not have had deep insights into the subtleties and implications of the various disease states and treatments. Regardless of how outcome probabilities and utilities are determined, they are considered point estimates in decision analysis, and sensitivity analyses are therefore performed to assess how decision making changes over a range of values.
Conclusion
The results of this study may help optimize the process of deciding between operative and nonoperative treatment for Jones fracture. For a given patient, the optimal strategy depends not only on the probabilities of the various outcomes but also on personal preference. Thus, there may not be one right answer for all patients. Patients who value a higher chance of fracture healing with initial treatment or an earlier return to sports are best treated operatively, whereas patients who are risk-averse and place a high value on fracture healing without surgery should be managed nonoperatively. We therefore advocate a model of shared medical decision-making in which the physician and the patient are jointly involved, considering both outcome probabilities and patient preferences. Ongoing research efforts should focus on predictors of nonunion with nonoperative treatment.
1. Dameron TB Jr. Fractures of the proximal fifth metatarsal: selecting the best treatment option. J Am Acad Orthop Surg. 1995;3(2):110-114.
2. Fetzer GB, Wright RW. Metatarsal shaft fractures and fractures of the proximal fifth metatarsal. Clin Sports Med. 2006;25(1):139-150, x.
3. Konkel KF, Menger AG, Retzlaff SA. Nonoperative treatment of fifth metatarsal fractures in an orthopaedic suburban private multispeciality practice. Foot Ankle Int. 2005;26(9):704-707.
4. Lawrence SJ, Botte MJ. Jones’ fractures and related fractures of the proximal fifth metatarsal. Foot Ankle. 1993;14(6):358-365.
5. Nunley JA. Fractures of the base of the fifth metatarsal: the Jones fracture. Orthop Clin North Am. 2001;32(1):171-180.
6. Quill GE Jr. Fractures of the proximal fifth metatarsal. Orthop Clin North Am. 1995;26(2):353-361.
7. Torg JS, Balduini FC, Zelko RR, Pavlov H, Peff TC, Das M. Fractures of the base of the fifth metatarsal distal to the tuberosity. Classification and guidelines for non-surgical and surgical management. J Bone Joint Surg Am. 1984;66(2):209-214.
8. DeLee JC, Evans JP, Julian J. Stress fracture of the fifth metatarsal. Am J Sports Med. 1983;11(5):349-353.
9. Kavanaugh JH, Brower TD, Mann RV. The Jones fracture revisited. J Bone Joint Surg Am. 1978;60(6):776-782.
10. Porter DA, Duncan M, Meyer SJ. Fifth metatarsal Jones fracture fixation with a 4.5-mm cannulated stainless steel screw in the competitive and recreational athlete: a clinical and radiographic evaluation. Am J Sports Med. 2005;33(5):726-733.
11. Aleem IS, Jalal H, Sheikh AA, Bhandari M. Clinical decision analysis: Incorporating the evidence with patient p. Patient Prefer Adherence. 2009;3:21-24.
12. Bishop J, Ring D. Management of radial nerve palsy associated with humeral shaft fracture: a decision analysis model. J Hand Surg Am. 2009;34(6):991-996.e1.
13. Chen NC, Shauver MJ, Chung KC. A primer on use of decision analysis methodology in hand surgery. J Hand Surg Am. 2009;34(6):983-990.
14. Kocher MS, Henley MB. It is money that matters: decision analysis and cost-effectiveness analysis. Clin Orthop Relat Res. 2003(413):106-116.
15. Dean BJ, Kothari A, Uppal H, Kankate R. The jones fracture classification, management, outcome, and complications: a systematic review. Foot Ankle Spec. 2012;5(4):256-259.
16. Martin RL, Irrgang JJ, Burdett RG, Conti SF, Van Swearingen JM. Evidence of validity for the Foot and Ankle Ability Measure (FAAM). Foot Ankle Int. 2005;26(11):968-983.
17. Roche AJ, Calder JD. Treatment and return to sport following a Jones fracture of the fifth metatarsal: a systematic review. Knee Surg Sports Traumatol Arthrosc. 2013;21(6):1307-1315.
18. Zwitser EW, Breederveld RS. Fractures of the fifth metatarsal; diagnosis and treatment. Injury. 2010;41(6):555-562.
19. McBryde AM Jr. The complicated Jones fracture, including revision and malalignment. Foot Ankle Clin. 2009;14(2):151-168.
20. Porter DA, Rund AM, Dobslaw R, Duncan M. Comparison of 4.5- and 5.5-mm cannulated stainless steel screws for fifth metatarsal Jones fracture fixation. Foot Ankle Int. 2009;30(1):27-33.
21. Mologne TS, Lundeen JM, Clapper MF, O’Brien TJ. Early screw fixation versus casting in the treatment of acute Jones fractures. Am J Sports Med. 2005;33(7):970-975.
22. Hunt KJ, Hurwit D. Use of patient-reported outcome measures in foot and ankle research. J Bone Joint Surg Am. 2013;95(16):e118(1-9).
23. Stiggelbout AM, Eijkemans MJ, Kiebert GM, Kievit J, Leer JW, De Haes HJ. The ‘utility’ of the visual analog scale in medical decision making and technology assessment. Is it an alternative to the time trade-off? International journal of technology assessment in health care. Spring. 1996;12(2):291-298.
24. Parkin D, Devlin N. Is there a case for using visual analogue scale valuations in cost-utility analysis? Health Econ. 2006;15(7):653-664.
25. Bishop JA, Crall TS, Kocher MS. Operative versus nonoperative treatment after primary traumatic anterior glenohumeral dislocation: expected-value decision analysis. J Shoulder Elbow Surg. 2011;20(7):1087-1094.
26. Kocher MS, Bishop J, Marshall R, Briggs KK, Hawkins RJ. Operative versus nonoperative management of acute Achilles tendon rupture: expected-value decision analysis. Am J Sports Med. 2002;30(6):783-790.
27. Nagao M, Saita Y, Kameda S, et al. Headless compression screw fixation of jones fractures: an outcomes study in Japanese athletes. Am J Sports Med. 2012;40(11):2578-2582.
28. Thomas JL, Davis BC. Treatment of Jones fracture nonunion with isolated intramedullary screw fixation. J Foot Ankle Surg. 2011;50(5):566-568.
29. Habbu RA, Marsh RS, Anderson JG, Bohay DR. Closed intramedullary screw fixation for nonunion of fifth metatarsal Jones fracture. Foot Ankle Int. 2011;32(6):603-608.
30. Hunt KJ, Anderson RB. Treatment of Jones fracture nonunions and refractures in the elite athlete: outcomes of intramedullary screw fixation with bone grafting. Am J Sports Med. 2011;39(9):1948-1954.
31. Chuckpaiwong B, Queen RM, Easley ME, Nunley JA. Distinguishing Jones and proximal diaphyseal fractures of the fifth metatarsal. Clin Orthop Relat Res. 2008;466(8):1966-1970.
32. DeVries JG, Cuttica DJ, Hyer CF. Cannulated screw fixation of Jones fifth metatarsal fractures: a comparison of titanium and stainless steel screw fixation. J Foot Ankle Surg. 2011;50(2):207-212.
33. Reese K, Litsky A, Kaeding C, Pedroza A, Shah N. Cannulated screw fixation of Jones fractures: a clinical and biomechanical study. Am J Sports Med. 2004;32(7):1736-1742.
34. Lombardi CM, Connolly FG, Silhanek AD. The use of external fixation for treatment of the acute Jones fracture: a retrospective review of 10 cases. J Foot Ankle Surg. 2004;43(3):173-178.
35. Portland G, Kelikian A, Kodros S. Acute surgical management of Jones’ fractures. Foot Ankle Int. 2003;24(11):829-833.
36. Clapper MF, O’Brien TJ, Lyons PM. Fractures of the fifth metatarsal. Analysis of a fracture registry. Clin Orthop Relat Res. 1995(315):238-241.
37. Josefsson PO, Karlsson M, Redlund-Johnell I, Wendeberg B. Closed treatment of Jones fracture. Good results in 40 cases after 11-26 years. Orthop Scand. 1994;65(5):545-547.
38. Mindrebo N, Shelbourne KD, Van Meter CD, Rettig AC. Outpatient percutaneous screw fixation of the acute Jones fracture. Am J Sports Med. 1993;21(5):720-723.
39. Zogby RG, Baker BE. A review of nonoperative treatment of Jones’ fracture. Am J Sports Med. 1987;15(4):304-307.
40. Dameron TB Jr. Fractures and anatomical variations of the proximal portion of the fifth metatarsal. J Bone Joint Surg Am. 1975;57(6):788-792.
41. Fernandez Fairen M, Guillen J, Busto JM, Roura J. Fractures of the fifth metatarsal in basketball players. Knee Surg Sports Traumatol Arthrosc. 1999;7(6):373-377.
The optimal management strategy for acute fractures of the metadiaphyseal fifth metatarsal (Jones fractures) is controversial. Patients can be successfully treated nonoperatively with non-weight-bearing and immobilization in a short leg cast1-7 or operatively with placement of an intramedullary screw.8-10 The primary advantage of nonoperative treatment is avoiding the risks and discomfort of surgery; disadvantages include the need for prolonged immobilization and protected weight-bearing as well as a decreased union rate.8,9 Advantages of operative treatment include accelerated functional recovery and an improved union rate; disadvantages include exposure to the risks, inconvenience, and discomfort of surgery. Clear, definitive evidence for guiding treatment is not available in the orthopedic literature, and treatment strategies vary substantially according to surgeon and patient preference.
Expected-value decision analysis, a research tool that helps guide decision-making in situations of uncertainty, has been effectively applied to other areas of uncertainty in the orthopedic literature.11-14 Borrowed from gaming theory, the technique involves creating a decision tree to define the clinical problem, determining outcome probabilities and utilities, performing a fold-back analysis to determine the optimal decision-making strategy, and performing a sensitivity analysis to model the effect of varying outcome probabilities and utilities on decision-making. Decision analysis may therefore allow the clinician and the patient to optimize decision-making based on best available evidence and patient preferences. It also helps determine the most important factors affecting management strategies and the decision-making process, which may not always be intuitive.
In the present study, we used expected-value decision analysis to determine the optimal management strategy, operative or nonoperative, for acute Jones fracture. We also explored factors with the most influence on the model and identified important questions for future research.
Materials and Methods
Institutional review board approval was obtained for this study. Analysis was performed with Treeage Pro statistical software (Treeage Software).
Outcome Probabilities
Outcome probabilities were determined by reviewing the literature for articles on Jones fractures. This body of literature was summarized in a comprehensive review by Dean and colleagues15, who extracted data from 19 studies: 1 randomized controlled trial, 1 prospective case series, and 17 retrospective case series.15 We used data from these studies to determine outcome probabilities (Table).
Outcome Utilities
Utilities represent patient preferences for various disease states. Outcome utility values were obtained from 32 adults (25 women, 7 men) with no history of foot injury. Mean age was 32.4 years (range, 20-69 years). The questionnaire presented scenarios for the different outcomes and asked patients to rate these outcomes on a scale ranging from 0 (worst possible outcome) to 10 (best possible outcome). The Sports subscale of the Foot and Ankle Ability Measure (FAAM) 16 was used to quantify patient activity level.
Decision Tree and Fold-Back Analysis
A decision tree was constructed with 1 decision node, 4 chance nodes, and 7 terminal nodes (Figure 1). The decision tree demonstrates 2 different strategies for managing a Jones fracture. The decision node divides the tree into 2 branches: initial operative or nonoperative treatment. Both branches are followed by various chance nodes, each terminating in a discrete clinical outcome. Per convention, utility data were placed to the right of the terminal nodes, and probability data were placed under the terminal nodes.
Fold-back analysis was performed to identify the optimal strategy. Fold-back analysis involves multiplying each outcome utility by its associated probability, thereby providing an “expected value” for each clinical endpoint. Then, the expected values for each endpoint can be summed for a given management strategy, and the ultimate expected values of the different strategies can be compared. The management strategy associated with the highest expected value is optimal for the given outcome utilities and probabilities.
Sensitivity Analysis
One-way sensitivity analysis was performed to model the effect on decision-making of changing the values for utility for uncomplicated surgery, utility for healing with nonoperative treatment, utility for uncomplicated treatment of nonunion, likelihood of healing with nonoperative treatment, likelihood of healing with surgery, and likelihood of minor complication with surgery. These were the variables found to affect the decision-making strategy within their clinically plausible ranges.
Results
Outcome Probabilities and Utilities
Outcome probabilities and utilities are illustrated in Figure 1. By convention, probabilities appear below the corresponding branches of the decision tree, and utilities appear at the end of each branch. Mean (SD) FAAM Sports subscale score was 84.6 (27.4). This subscale is scored as a percentage from 0% to 100%, with higher scores indicating a higher level of physical function.
Decision Analysis
The expected value for nonoperative treatment was 7.74, and the expected value for intramedullary screw fixation was 7.88 (Figure 1). Therefore, operative treatment was identified as the optimal treatment strategy.
Sensitivity analyses revealed that the optimal decision making strategy was very sensitive to small changes in several variables. Nonoperative treatment becomes the preferred strategy when the utility value for uncomplicated surgery falls below 8.04 (Figure 2), when the utility for healing with nonoperative treatment rises above 8.49 (Figure 3), when the likelihood of healing with nonoperative treatment rises above 82% (Figure 4), or when the probability of healing after surgery falls below 92% (Figure 5). Nonoperative treatment is also favored when the probability of minor complication with surgery is above 17% (Figure 6) and when utility for a successfully treated nonunion is higher than 6.9 (Figure 7).
Discussion
Optimal management of a metadiaphyseal fracture of the fifth metatarsal (Jones fracture) remains controversial. The decision between initial operative or nonoperative treatment lends itself to expected-value decision analysis because of well-defined treatment options and relatively discrete outcomes. The principal advantages of nonoperative treatment are that it allows the patient to avoid the risks and discomfort of surgery, and the principal advantages of operative treatment are that it maximizes the chance of fracture union and may accelerate functional recovery.
Our decision analysis determined that operative fixation is the optimal decision path, given the outcome probabilities derived from the literature and the utilities obtained from surveys. This finding is in accordance with several expert opinions in foot and ankle fracture surgery.17,18 However, the expected values of the operative and nonoperative treatment strategies differed by only 0.3 on a 10-point scale. Such similar expected values in our model are not surprising given the controversy surrounding clinical decision making in the treatment of these fractures.19
In addition, our analysis identified the important variables in the decision-making process. Patients averse to surgery, patients not averse to successful nonoperative treatment, and patients who view successful nonunion surgery after initial nonoperative treatment as a relatively positive outcome may be best treated nonoperatively. These findings emphasize the importance of patient preferences and shared decision-making. Higher rates of healing with nonoperative treatment, lower rates of healing with surgery, and higher complication rates with surgery also favor nonoperative management. It would therefore be valuable to identify risk factors for nonunion with nonoperative treatment and to identify the technical details of surgery that maximize rates of healing and minimize the risk of complications.
The limitations of decision analysis involve the methods by which probabilities and utilities are obtained. In general, the most accurate, stable, and robust estimates of outcome probabilities are derived from a meta-analytic synthesis of randomized clinical trials, the highest level of clinical evidence. In our model, data were extracted primarily from level IV studies; only 1 level III study20 and 1 level II study21 were available for analysis. Thus, as is the case with many foot and ankle disorders22, the information on treatment of Jones fractures is very limited in its level of clinical evidence.
Determination of outcome utility also has limitations. Utility is a subjective value that an individual places on a specific outcome. This can be very difficult to quantify. In general, the most robust estimates of patient-derived utilities are derived from complex qualitative methods, such as the standard reference gamble or time trade-offs, in which patients are asked to gamble or choose between health states usually referenced to death. In this study, we determined patient-derived utility values from a direct scaling method using a Likert scale because of the complexity of the standard reference gamble and the difficulty of referencing to death for metatarsal fracture. Although use of a direct scale to determine utility values is less rigorous than the standard reference gamble, this technique has been corroborated methodologically,23 is advantageous in terms of feasibility and reliability,24 and has been successfully used in other orthopedic decision analysis models.12,25,26 In our estimation, generally active patients without a history of foot pathology constituted a sample of convenience but also were representative of individuals at risk for Jones fracture. Although specific scenarios were presented, the patients who completed the questionnaire may not have had deep insights into the subtleties and implications of the various disease states and treatments. Regardless of how outcome probabilities and utilities are determined, they are considered point estimates in decision analysis, and sensitivity analyses are therefore performed to assess how decision making changes over a range of values.
Conclusion
The results of this study may help optimize the process of deciding between operative and nonoperative treatment for Jones fracture. For a given patient, the optimal strategy depends not only on the probabilities of the various outcomes but also on personal preference. Thus, there may not be one right answer for all patients. Patients who value a higher chance of fracture healing with initial treatment or an earlier return to sports are best treated operatively, whereas patients who are risk-averse and place a high value on fracture healing without surgery should be managed nonoperatively. We therefore advocate a model of shared medical decision-making in which the physician and the patient are jointly involved, considering both outcome probabilities and patient preferences. Ongoing research efforts should focus on predictors of nonunion with nonoperative treatment.
1. Dameron TB Jr. Fractures of the proximal fifth metatarsal: selecting the best treatment option. J Am Acad Orthop Surg. 1995;3(2):110-114.
2. Fetzer GB, Wright RW. Metatarsal shaft fractures and fractures of the proximal fifth metatarsal. Clin Sports Med. 2006;25(1):139-150, x.
3. Konkel KF, Menger AG, Retzlaff SA. Nonoperative treatment of fifth metatarsal fractures in an orthopaedic suburban private multispeciality practice. Foot Ankle Int. 2005;26(9):704-707.
4. Lawrence SJ, Botte MJ. Jones’ fractures and related fractures of the proximal fifth metatarsal. Foot Ankle. 1993;14(6):358-365.
5. Nunley JA. Fractures of the base of the fifth metatarsal: the Jones fracture. Orthop Clin North Am. 2001;32(1):171-180.
6. Quill GE Jr. Fractures of the proximal fifth metatarsal. Orthop Clin North Am. 1995;26(2):353-361.
7. Torg JS, Balduini FC, Zelko RR, Pavlov H, Peff TC, Das M. Fractures of the base of the fifth metatarsal distal to the tuberosity. Classification and guidelines for non-surgical and surgical management. J Bone Joint Surg Am. 1984;66(2):209-214.
8. DeLee JC, Evans JP, Julian J. Stress fracture of the fifth metatarsal. Am J Sports Med. 1983;11(5):349-353.
9. Kavanaugh JH, Brower TD, Mann RV. The Jones fracture revisited. J Bone Joint Surg Am. 1978;60(6):776-782.
10. Porter DA, Duncan M, Meyer SJ. Fifth metatarsal Jones fracture fixation with a 4.5-mm cannulated stainless steel screw in the competitive and recreational athlete: a clinical and radiographic evaluation. Am J Sports Med. 2005;33(5):726-733.
11. Aleem IS, Jalal H, Sheikh AA, Bhandari M. Clinical decision analysis: Incorporating the evidence with patient p. Patient Prefer Adherence. 2009;3:21-24.
12. Bishop J, Ring D. Management of radial nerve palsy associated with humeral shaft fracture: a decision analysis model. J Hand Surg Am. 2009;34(6):991-996.e1.
13. Chen NC, Shauver MJ, Chung KC. A primer on use of decision analysis methodology in hand surgery. J Hand Surg Am. 2009;34(6):983-990.
14. Kocher MS, Henley MB. It is money that matters: decision analysis and cost-effectiveness analysis. Clin Orthop Relat Res. 2003(413):106-116.
15. Dean BJ, Kothari A, Uppal H, Kankate R. The jones fracture classification, management, outcome, and complications: a systematic review. Foot Ankle Spec. 2012;5(4):256-259.
16. Martin RL, Irrgang JJ, Burdett RG, Conti SF, Van Swearingen JM. Evidence of validity for the Foot and Ankle Ability Measure (FAAM). Foot Ankle Int. 2005;26(11):968-983.
17. Roche AJ, Calder JD. Treatment and return to sport following a Jones fracture of the fifth metatarsal: a systematic review. Knee Surg Sports Traumatol Arthrosc. 2013;21(6):1307-1315.
18. Zwitser EW, Breederveld RS. Fractures of the fifth metatarsal; diagnosis and treatment. Injury. 2010;41(6):555-562.
19. McBryde AM Jr. The complicated Jones fracture, including revision and malalignment. Foot Ankle Clin. 2009;14(2):151-168.
20. Porter DA, Rund AM, Dobslaw R, Duncan M. Comparison of 4.5- and 5.5-mm cannulated stainless steel screws for fifth metatarsal Jones fracture fixation. Foot Ankle Int. 2009;30(1):27-33.
21. Mologne TS, Lundeen JM, Clapper MF, O’Brien TJ. Early screw fixation versus casting in the treatment of acute Jones fractures. Am J Sports Med. 2005;33(7):970-975.
22. Hunt KJ, Hurwit D. Use of patient-reported outcome measures in foot and ankle research. J Bone Joint Surg Am. 2013;95(16):e118(1-9).
23. Stiggelbout AM, Eijkemans MJ, Kiebert GM, Kievit J, Leer JW, De Haes HJ. The ‘utility’ of the visual analog scale in medical decision making and technology assessment. Is it an alternative to the time trade-off? International journal of technology assessment in health care. Spring. 1996;12(2):291-298.
24. Parkin D, Devlin N. Is there a case for using visual analogue scale valuations in cost-utility analysis? Health Econ. 2006;15(7):653-664.
25. Bishop JA, Crall TS, Kocher MS. Operative versus nonoperative treatment after primary traumatic anterior glenohumeral dislocation: expected-value decision analysis. J Shoulder Elbow Surg. 2011;20(7):1087-1094.
26. Kocher MS, Bishop J, Marshall R, Briggs KK, Hawkins RJ. Operative versus nonoperative management of acute Achilles tendon rupture: expected-value decision analysis. Am J Sports Med. 2002;30(6):783-790.
27. Nagao M, Saita Y, Kameda S, et al. Headless compression screw fixation of jones fractures: an outcomes study in Japanese athletes. Am J Sports Med. 2012;40(11):2578-2582.
28. Thomas JL, Davis BC. Treatment of Jones fracture nonunion with isolated intramedullary screw fixation. J Foot Ankle Surg. 2011;50(5):566-568.
29. Habbu RA, Marsh RS, Anderson JG, Bohay DR. Closed intramedullary screw fixation for nonunion of fifth metatarsal Jones fracture. Foot Ankle Int. 2011;32(6):603-608.
30. Hunt KJ, Anderson RB. Treatment of Jones fracture nonunions and refractures in the elite athlete: outcomes of intramedullary screw fixation with bone grafting. Am J Sports Med. 2011;39(9):1948-1954.
31. Chuckpaiwong B, Queen RM, Easley ME, Nunley JA. Distinguishing Jones and proximal diaphyseal fractures of the fifth metatarsal. Clin Orthop Relat Res. 2008;466(8):1966-1970.
32. DeVries JG, Cuttica DJ, Hyer CF. Cannulated screw fixation of Jones fifth metatarsal fractures: a comparison of titanium and stainless steel screw fixation. J Foot Ankle Surg. 2011;50(2):207-212.
33. Reese K, Litsky A, Kaeding C, Pedroza A, Shah N. Cannulated screw fixation of Jones fractures: a clinical and biomechanical study. Am J Sports Med. 2004;32(7):1736-1742.
34. Lombardi CM, Connolly FG, Silhanek AD. The use of external fixation for treatment of the acute Jones fracture: a retrospective review of 10 cases. J Foot Ankle Surg. 2004;43(3):173-178.
35. Portland G, Kelikian A, Kodros S. Acute surgical management of Jones’ fractures. Foot Ankle Int. 2003;24(11):829-833.
36. Clapper MF, O’Brien TJ, Lyons PM. Fractures of the fifth metatarsal. Analysis of a fracture registry. Clin Orthop Relat Res. 1995(315):238-241.
37. Josefsson PO, Karlsson M, Redlund-Johnell I, Wendeberg B. Closed treatment of Jones fracture. Good results in 40 cases after 11-26 years. Orthop Scand. 1994;65(5):545-547.
38. Mindrebo N, Shelbourne KD, Van Meter CD, Rettig AC. Outpatient percutaneous screw fixation of the acute Jones fracture. Am J Sports Med. 1993;21(5):720-723.
39. Zogby RG, Baker BE. A review of nonoperative treatment of Jones’ fracture. Am J Sports Med. 1987;15(4):304-307.
40. Dameron TB Jr. Fractures and anatomical variations of the proximal portion of the fifth metatarsal. J Bone Joint Surg Am. 1975;57(6):788-792.
41. Fernandez Fairen M, Guillen J, Busto JM, Roura J. Fractures of the fifth metatarsal in basketball players. Knee Surg Sports Traumatol Arthrosc. 1999;7(6):373-377.
Neurocognitive Deficits and Cerebral Desaturation During Shoulder Arthroscopy With Patient in Beach-Chair Position: A Review of the Current Literature
The beach-chair position (BCP) is commonly used for both arthroscopic and open shoulder surgery. This technique positions the shoulder in an anatomical upright position, facilitating shoulder access and visualization.1 Compared with the lateral decubitus position, the BCP also improves airway access, reduces bleeding, and lessens the risk for brachial plexus injury.2
Despite the advantages of using the BCP, there have been multiple reports of catastrophic neurologic complications, including severe brain damage and death, in relatively healthy patients without any known risk factors.3-6 The definitive etiology of these complications remains unclear, but it has been hypothesized that BCP use may be an independent risk factor for cerebrovascular ischemia,1,5-16 as the upright position can cause hypotension leading to increased risk for cerebral hypoperfusion.7-11,17 Reducing cerebral perfusion pressure below critical thresholds may result in permanent neurologic injury.4-6,14 Therefore, monitoring of cerebral perfusion and optimization of intraoperative cerebral oxygenation have been recommended to help avoid potential neurologic complications. However, a direct relationship between intraoperative cerebral desaturation events (CDEs) and postoperative neurocognitive deficits has not been definitively established.1,9-12
To put into perspective the importance of detecting and preventing CDEs and neurologic complications, we can consider the incidence of fatal pulmonary embolism associated with total joint arthroplasty. Although the incidence is very low, about 0.1% to 2.0%, some form of venous thromboembolism prophylaxis is the standard of care for helping prevent this serious complication. Similarly, catastrophic neurologic complications of upright shoulder arthroscopy are very rare, but it is still important to consider measures that help minimize them.
We reviewed the literature for the incidence of postoperative neurocognitive deficits, number of reported neurocognitive complications, and incidence of intraoperative CDEs in patients who underwent arthroscopic shoulder surgery in the BCP.
Methods
Dr. Salazar and Dr. Hazel independently searched the Medline, Cochrane, and Embase databases for case series, prospective studies, and cohort studies that reported neurocognitive complications associated with the BCP and the incidence of intraoperative CDEs. The authors used beach chair, desaturation, near infrared spectroscopy, and shoulder as medical subject headings (MeSH). In addition, bibliographies of retrieved articles were checked for studies that the search terms may have missed. Eighty-one publications were identified and reviewed for possible inclusion.
Next, the same 2 authors reviewed the titles and abstracts for relevance and determined which articles had potential to contribute to the study. Only English-language publications were considered for inclusion. To review the incidence of postoperative neurocognitive deficits, we included only those studies with more than 25 patients, documentation of postoperative complications, and arthroscopic shoulder surgery performed with the patient in the seated, semi-upright, or BCP. Only studies with at least 25 patients were used in order to increase the power and improve the level of evidence. To review reported cases of neurocognitive complications, we included all relevant case reports and case series. To review the incidence of intraoperative CDEs and investigate their relationship with postoperative neurocognitive deficits, we included studies that reported on use of intraoperative cerebral perfusion monitoring. Modalities used in these studies included near infrared spectroscopy, electroencephalography, and invasive blood pressure monitoring calculated at the brain level. Studies were excluded if they did not involve arthroscopic shoulder surgery or were not conducted with human subjects.
Information recorded for each study included general information such as author and publication year, type of study, number of patients enrolled, type of intraoperative monitoring, anesthesia protocol, number of patients with CDEs, and number of patients with neurocognitive complications after surgery.
Results
Our search identified 81 publications for potential inclusion. Our first aim was to identify the overall incidence of reported neurocognitive deficits after arthroscopic shoulder surgery with the patient in the BCP. We identified 10 studies (Table 1) that met the inclusion criteria. Among the 24,701 patients in these 10 studies, there was only 1 reported case of neurocognitive deficit after surgery, in a mixed prospective-retrospective study of 15,014 cases by Rohrbaugh and colleagues.18 The deficit they reported was an ischemic cerebral vascular accident. The 0.0067% incidence in their study demonstrates how rare the complication is. Two large retrospective studies (Ns = 4169 and 5177 patients) found no postoperative neurocognitive complications.19,20 Only 3 studies performed formal postoperative cognitive testing. Salazar and colleagues21 used the Repeatable Battery for the Assessment of Neuropsychological Status before and after surgery, and Gillespie and colleagues8 and Lee and colleagues10 used the Mini–Mental State Examination before and after surgery. Total incidence of reported neurocognitive deficits from our review was 0.004% (1/24,701).
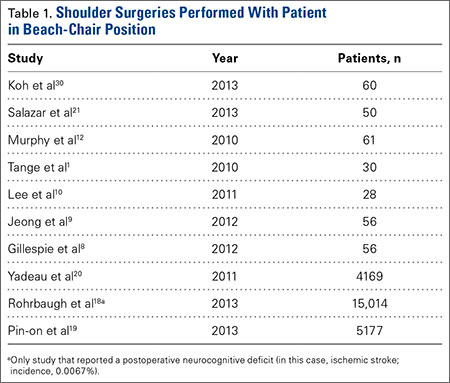
Our second aim was to review all reported cases of neurocognitive complications after arthroscopic shoulder surgery with the patient in the BCP. We identified 4 publications that fit our inclusion criteria (Table 2). Pohl and Cullen6 described 4 cases of ischemic brain injury after arthroscopic shoulder surgery with the patient in the BCP. Age range was 47 to 57 years. Specific intraoperative cerebral monitoring was not used. However, these patients had several episodes of intraoperative hypotension (systolic blood pressures, 80-90 mm Hg), measured with a traditional blood pressure cuff on the arm. In general, these patients had minimal cerebrovascular risk factors and no known preexisting cerebrovascular disease. Drummond and colleagues22 described an ischemic stroke in a 50-year-old man after arthroscopic subacromial decompression and open rotator cuff repair that resulted in unresolved right hemiplegia. Subsequent diagnostic investigation revealed an asymmetry of the circle of Willis resulting in limited flow to the left anterior and middle cerebral artery distributions. Bhatti and Enneking3 reported the case of a 64-year-old man who lost vision in the right eye immediately after arthroscopic rotator cuff repair. His vision improved spontaneously the next morning and continued to improve over the next 6 months—he regained 20/20 vision with some residual optic neuropathy.
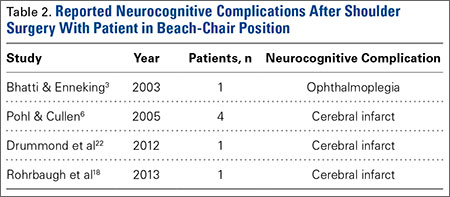
Our third aim was to determine the incidence of intraoperative CDEs during arthroscopic shoulder surgery with the patient in the BCP. Incidence of CDEs varied widely among the 7 studies reviewed (Table 3). Minimum incidence of intraoperative CDE was 0% in a cohort of 30 patients,1 and maximum incidence was 80% in a study of 61 patients,12 all of whom underwent elective arthroscopic shoulder surgery in the BCP. Although there was wide variability in CDE incidence, the studies were consistent with respect to their definition of a CDE. Most authors used a decrease in regional cerebral tissue oxygen saturation of 20% or more from baseline, or an absolute value up to 55%, to define a CDE. None of the 7 studies reviewed reported a clinically significant adverse neurocognitive event.
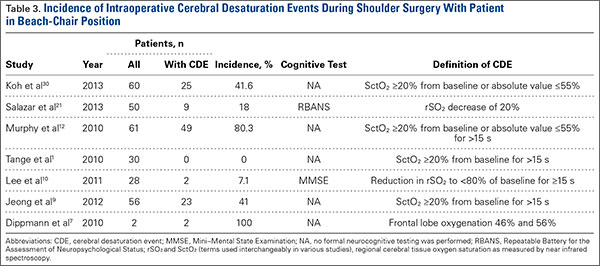
Discussion
Of concern, there have been several surveys, case reports, and small case series of previously healthy patients who had no known risk factors, underwent arthroscopic shoulder surgery in the BCP, and developed unanticipated postoperative neurologic complications.4-6,14 Beach-chair positioning during surgical procedures has been implicated as a contributing factor leading to cerebral hypoperfusion with potential for cerebral ischemia.1,12,23 These changes in cerebral perfusion pressure are thought to be the major determinant of poor neurologic outcomes. Such reports have exposed the potential need for heightened vigilance, alternative anesthesia techniques, and improved monitoring, though the exact etiology of the central nervous system injuries in this patient population is incompletely understood and is likely multifactorial. Therefore, in this study we wanted to determine the incidence of postoperative neurocognitive deficits and review all reported cases of neurocognitive complications in patients who have undergone arthroscopic shoulder surgery in the BCP. In addition, we wanted to define the incidence of intraoperative CDEs and investigate their relationship with postoperative neurocognitive complications.
According to our review, the incidence of postoperative neurocognitive complications after surgery in the BCP is 0.004% (1/24,701). However, this finding is based only on what has been reported; the true incidence is not known. It is also important to note that the incidence of neurocognitive deficits after many other types of surgery is not known and that surgery itself may be a risk factor for postoperative neurocognitive deficits.24 In their retrospective review of 15,014 patients who underwent arthroscopic shoulder surgery in the BCP at a single institution over an 11-year period, Rohrbaugh and colleagues18 found an overall postoperative complication rate of 0.37% and a 0.0067% incidence of neurocognitive deficits. One patient in the series was given a diagnosis of ischemic stroke on the basis of neurologic deficits that occurred 24 hours after surgery. Yadeau and colleagues20 found no postoperative neurocognitive complications in a mixed prospective-retrospective study of 4169 patients—3000 identified retrospectively, 1169 prospectively—who underwent arthroscopic shoulder surgery in the BCP at an ambulatory surgery center. Pin-on and colleagues19 reported on a series of 5177 orthopedic and neurosurgical patients who underwent surgery in the BCP. In those who had arthroscopic shoulder surgery, intraoperative systolic blood pressures obtained from an arterial line referenced to heart level decreased a mean (SD) of 14.4% (12.7%), whereas in those whose pressures were obtained from a noninvasive blood pressure cuff referenced to heart level decreased 19.3% (12.6%). However, the authors reported no incidence of postoperative stroke or neurologic deficits.
Although uncommon, perioperative cerebral ischemic accidents are potentially devastating for patients, their families, and the health care professionals involved. These events have tremendous economic, social, professional, and medicolegal implications, with perioperative stroke being particularly morbid. Perioperative stroke has a mortality rate of 60%, versus 15% to 46% for stroke in general.25,26 In 2005, Pohl and Cullen6 published a landmark article on a series of 4 relatively healthy middle-aged patients who were at low risk for stroke but had catastrophic neurocognitive complications (including 1 death) after arthroscopic shoulder surgery in the BCP. Bhatti and Enneking3 described a case of acute postoperative vision loss and ophthalmoplegia attributed to intraoperative hypotension leading to ischemia in a patient who underwent an elective shoulder arthroscopic procedure in the BCP. These reports prompted multiple investigations into the physiologic hemodynamic changes associated with surgery in the BCP and the treatment strategies used to improve patient safety.
In the normal physiologic state, the sympathetic nervous system is activated when a person assumes the seated position. The result is increased systemic vascular resistance and heart rate alterations to maintain cardiac output and mean arterial pressure. In anesthetized patients, this response is blunted by the vasodilatory effects of intravenous and volatile anesthetics. Multiple studies have demonstrated substantial hemodynamic changes in both awake and anesthetized patients during the maneuver from the supine position to the seated position1,27,28; these changes include diminished cardiac index, stroke volume, and arterial pressure.17 The data underscore the need for attentiveness and accurate monitoring of cerebral perfusion when the transition is made from the supine position to the BCP, particularly in the early phase of surgery and in high-risk patients.
Knowledge of these hemodynamic changes has led several authors to recommend additional intraoperative monitoring of cerebral perfusion. Monitoring techniques have included use of invasive blood pressure monitoring adjusted to brain level, cerebral oximetry using near infrared spectroscopy, and electroencephalography. However, the clinical relevance of intraoperative CDEs in isolation is not well understood.1,6,7,23 In addition, cost and availability of additional advanced monitoring likely factor into why it is not more commonly used. For this patient population, the severity, frequency, and duration of desaturation that causes cerebral ischemia and the relationship with postoperative neurocognitive deficits remain undefined.
The incidence of CDEs in patients being monitored with near infrared spectroscopy while undergoing elective arthroscopic shoulder surgery in the BCP varies widely, from 0% to 80% (mean, 41%).1,4,7,10,12,21 Magnitude and duration of cerebral ischemia required to produce neurocognitive dysfunction in this patient population remain unidentified as well. In conscious patients, a 20% reduction in frontal lobe oxygenation is associated with clinical manifestations of cerebral hypoperfusion, such as syncope.15,29 As none of the patients in the studies we reviewed experienced any sort of deficit, we cannot definitively state there is a correlation between CDE occurrence and neurocognitive deficit.
One limitation of our investigation is that it was a systemic review, and thus there was substantial heterogeneity in the methods and designs of the studies included in the analysis. Among the different series, there was variability in multiple aspects of the study design, including type of anesthetic, patient inclusion criteria, type of surgery, type of intraoperative cerebral perfusion monitoring, and type of neurocognitive testing. As a result, comparing the groups was difficult, and the generalizability of our findings may be limited. In addition, it is difficult to accurately establish incidence and comprehensively review these events because of the paucity of literature.
Conclusion
Neurocognitive complications after shoulder arthroscopy with the patient in the BCP are extremely rare but potentially devastating events that can affect healthy patients with no preexisting cerebrovascular risk factors. Our review indicated the incidence of permanent neurologic deficit after arthroscopy in the BCP may be as low as 0.004%. The exact etiology of such complications is not clear. Basic science research and large prospective studies are needed to identify the clinically relevant thresholds of magnitude, duration, and frequency of intraoperative CDEs in order to establish their relationship with postoperative neurocognitive complications. Such large studies may also elucidate modifiable patient-specific risk factors and establish the most sensitive, safe, and cost-effective intraoperative monitoring tools. Current literature suggests that accurate intraoperative monitoring of cerebral perfusion, alternatives to general anesthesia, and prudent use of intraoperative blood pressure control may improve patient safety.
1. Tange K, Kinoshita H, Minonishi T, et al. Cerebral oxygenation in the beach chair position before and during general anesthesia. Minerva Anestesiol. 2010;76(7):485-490.
2. Skyhar MJ, Altchek DW, Warren RF, Wickiewicz TL, O’Brien SJ. Shoulder arthroscopy with the patient in the beach-chair position. Arthroscopy. 1988;4(4):256-259.
3. Bhatti MT, Enneking FK. Visual loss and ophthalmoplegia after shoulder surgery. Anesth Analg. 2003;96(3):899-902.
4. Friedman DJ, Parnes NZ, Zimmer Z, Higgins LD, Warner JJ. Prevalence of cerebrovascular events during shoulder surgery and association with patient position. Orthopedics. 2009;32(4).
5. Papadonikolakis A, Wiesler ER, Olympio MA, Poehling GG. Avoiding catastrophic complications of stroke and death related to shoulder surgery in the sitting position. Arthroscopy. 2008;24(4):481-482.
6. Pohl A, Cullen DJ. Cerebral ischemia during shoulder surgery in the upright position: a case series. J Clin Anesth. 2005;17(6):463-469.
7. Dippmann C, Winge S, Nielsen HB. Severe cerebral desaturation during shoulder arthroscopy in the beach-chair position. Arthroscopy. 2010;26(9 suppl):S148-S150.
8. Gillespie R, Shishani Y, Streit J, et al. The safety of controlled hypotension for shoulder arthroscopy in the beach-chair position. J Bone Joint Surg Am. 2012;94(14):1284-1290.
9. Jeong H, Lee SH, Jang EA, Chung SS, Lee J, Yoo KY. Haemodynamics and cerebral oxygenation during arthroscopic shoulder surgery in beach chair position under general anaesthesia. Acta Anaesthesiol Scand. 2012;56(7):872-879.
10. Lee JH, Min KT, Chun YM, Kim EJ, Choi SH. Effects of beach-chair position and induced hypotension on cerebral oxygen saturation in patients undergoing arthroscopic shoulder surgery. Arthroscopy. 2011;27(7):889-894.
11. Moerman AT, De Hert SG, Jacobs TF, De Wilde LF, Wouters PF. Cerebral oxygen desaturation during beach chair position. Eur J Anaesthesiol. 2012;29(2):82-87.
12. Murphy GS, Szokol JW, Marymont JH, et al. Cerebral oxygen desaturation events assessed by near-infrared spectroscopy during shoulder arthroscopy in the beach chair and lateral decubitus positions. Anesth Analg. 2010;111(2):496-505.
13. Peruto CM, Ciccotti MG, Cohen SB. Shoulder arthroscopy positioning: lateral decubitus versus beach chair. Arthroscopy. 2009;25(8):891-896.
14. Rains DD, Rooke GA, Wahl CJ. Pathomechanisms and complications related to patient positioning and anesthesia during shoulder arthroscopy. Arthroscopy. 2011;27(4):532-541.
15. Samra SK, Dy EA, Welch K, Dorje P, Zelenock GB, Stanley JC. Evaluation of a cerebral oximeter as a monitor of cerebral ischemia during carotid endarterectomy. Anesthesiology. 2000;93(4):964-970.
16. Smythe PR, Samra SK. Monitors of cerebral oxygenation. Anesthesiol Clin North Am. 2002;20(2):293-313.
17. Smith JJ, Porth CM, Erickson M. Hemodynamic response to the upright posture. J Clin Pharmacol. 1994;34(5):375-386.
18. Rohrbaugh M, Kentor ML, Orebaugh SL, Williams B. Outcomes of shoulder surgery in the sitting position with interscalene nerve block: a single-center series. Reg Anesth Pain Med. 2013;38(1):28-33.
19. Pin-on P, Schroeder D, Munis J. The hemodynamic management of 5177 neurosurgical and orthopedic patients who underwent surgery in the sitting or “beach chair” position without incidence of adverse neurologic events. Anesth Analg. 2013;116(6):1317-1324.
20. Yadeau JT, Casciano M, Liu SS, et al. Stroke, regional anesthesia in the sitting position, and hypotension: a review of 4169 ambulatory surgery patients. Reg Anesth Pain Med. 2011;36(5):430-435.
21. Salazar D, Sears BW, Aghdasi B, et al. Cerebral desaturation events during shoulder arthroscopy in the beach chair position: patient risk factors and neurocognitive effects. J Shoulder Elbow Surg. 2013;22(9):1228-1235.
22. Drummond JC, Lee RR, Howell JP Jr. Focal cerebral ischemia after surgery in the “beach chair” position: the role of a congenital variation of circle of Willis anatomy. Anesth Analg. 2012;114(6):1301-1303.
23. Fischer GW, Torrillo TM, Weiner MM, Rosenblatt MA. The use of cerebral oximetry as a monitor of the adequacy of cerebral perfusion in a patient undergoing shoulder surgery in the beach chair position. Pain Pract. 2009;9(4):304-307.
24. Wong GY, Warner DO, Schroeder DR, et al. Risk of surgery and anesthesia for ischemic stroke. Anesthesiology. 2000;92(2):425-432.
25. Knapp RB, Topkins MJ, Artusio JF Jr. The cerebrovascular accident and coronary occlusion in anesthesia. JAMA. 1962;182:332-334.
26. Landercasper J, Merz BJ, Cogbill TH, et al. Perioperative stroke risk in 173 consecutive patients with a past history of stroke. Arch Surg. 1990;125(8):986-989.
27. Fuchs G, Schwarz G, Kulier A, Litscher G. The influence of positioning on spectroscopic measurements of brain oxygenation. J Neurosurg Anesthesiol. 2000;12(2):75-80.
28. Lovell AT, Owen-Reece H, Elwell CE, Smith M, Goldstone JC. Continuous measurement of cerebral oxygenation by near infrared spectroscopy during induction of anesthesia. Anesth Analg. 1999;88(3):554-558.
29. Madsen PL, Secher NH. Near-infrared oximetry of the brain. Prog Neurobiol. 1999;58(6):541-560.
30. Koh JL, Levin SD, Chehab EL, Murphy GS. Neer award 2012: cerebral oxygenation in the beach chair position: a prospective study on the effect of general anesthesia compared with regional anesthesia and sedation. J Shoulder Elbow Surg. 2013;22:1325-1331.
The beach-chair position (BCP) is commonly used for both arthroscopic and open shoulder surgery. This technique positions the shoulder in an anatomical upright position, facilitating shoulder access and visualization.1 Compared with the lateral decubitus position, the BCP also improves airway access, reduces bleeding, and lessens the risk for brachial plexus injury.2
Despite the advantages of using the BCP, there have been multiple reports of catastrophic neurologic complications, including severe brain damage and death, in relatively healthy patients without any known risk factors.3-6 The definitive etiology of these complications remains unclear, but it has been hypothesized that BCP use may be an independent risk factor for cerebrovascular ischemia,1,5-16 as the upright position can cause hypotension leading to increased risk for cerebral hypoperfusion.7-11,17 Reducing cerebral perfusion pressure below critical thresholds may result in permanent neurologic injury.4-6,14 Therefore, monitoring of cerebral perfusion and optimization of intraoperative cerebral oxygenation have been recommended to help avoid potential neurologic complications. However, a direct relationship between intraoperative cerebral desaturation events (CDEs) and postoperative neurocognitive deficits has not been definitively established.1,9-12
To put into perspective the importance of detecting and preventing CDEs and neurologic complications, we can consider the incidence of fatal pulmonary embolism associated with total joint arthroplasty. Although the incidence is very low, about 0.1% to 2.0%, some form of venous thromboembolism prophylaxis is the standard of care for helping prevent this serious complication. Similarly, catastrophic neurologic complications of upright shoulder arthroscopy are very rare, but it is still important to consider measures that help minimize them.
We reviewed the literature for the incidence of postoperative neurocognitive deficits, number of reported neurocognitive complications, and incidence of intraoperative CDEs in patients who underwent arthroscopic shoulder surgery in the BCP.
Methods
Dr. Salazar and Dr. Hazel independently searched the Medline, Cochrane, and Embase databases for case series, prospective studies, and cohort studies that reported neurocognitive complications associated with the BCP and the incidence of intraoperative CDEs. The authors used beach chair, desaturation, near infrared spectroscopy, and shoulder as medical subject headings (MeSH). In addition, bibliographies of retrieved articles were checked for studies that the search terms may have missed. Eighty-one publications were identified and reviewed for possible inclusion.
Next, the same 2 authors reviewed the titles and abstracts for relevance and determined which articles had potential to contribute to the study. Only English-language publications were considered for inclusion. To review the incidence of postoperative neurocognitive deficits, we included only those studies with more than 25 patients, documentation of postoperative complications, and arthroscopic shoulder surgery performed with the patient in the seated, semi-upright, or BCP. Only studies with at least 25 patients were used in order to increase the power and improve the level of evidence. To review reported cases of neurocognitive complications, we included all relevant case reports and case series. To review the incidence of intraoperative CDEs and investigate their relationship with postoperative neurocognitive deficits, we included studies that reported on use of intraoperative cerebral perfusion monitoring. Modalities used in these studies included near infrared spectroscopy, electroencephalography, and invasive blood pressure monitoring calculated at the brain level. Studies were excluded if they did not involve arthroscopic shoulder surgery or were not conducted with human subjects.
Information recorded for each study included general information such as author and publication year, type of study, number of patients enrolled, type of intraoperative monitoring, anesthesia protocol, number of patients with CDEs, and number of patients with neurocognitive complications after surgery.
Results
Our search identified 81 publications for potential inclusion. Our first aim was to identify the overall incidence of reported neurocognitive deficits after arthroscopic shoulder surgery with the patient in the BCP. We identified 10 studies (Table 1) that met the inclusion criteria. Among the 24,701 patients in these 10 studies, there was only 1 reported case of neurocognitive deficit after surgery, in a mixed prospective-retrospective study of 15,014 cases by Rohrbaugh and colleagues.18 The deficit they reported was an ischemic cerebral vascular accident. The 0.0067% incidence in their study demonstrates how rare the complication is. Two large retrospective studies (Ns = 4169 and 5177 patients) found no postoperative neurocognitive complications.19,20 Only 3 studies performed formal postoperative cognitive testing. Salazar and colleagues21 used the Repeatable Battery for the Assessment of Neuropsychological Status before and after surgery, and Gillespie and colleagues8 and Lee and colleagues10 used the Mini–Mental State Examination before and after surgery. Total incidence of reported neurocognitive deficits from our review was 0.004% (1/24,701).
Our second aim was to review all reported cases of neurocognitive complications after arthroscopic shoulder surgery with the patient in the BCP. We identified 4 publications that fit our inclusion criteria (Table 2). Pohl and Cullen6 described 4 cases of ischemic brain injury after arthroscopic shoulder surgery with the patient in the BCP. Age range was 47 to 57 years. Specific intraoperative cerebral monitoring was not used. However, these patients had several episodes of intraoperative hypotension (systolic blood pressures, 80-90 mm Hg), measured with a traditional blood pressure cuff on the arm. In general, these patients had minimal cerebrovascular risk factors and no known preexisting cerebrovascular disease. Drummond and colleagues22 described an ischemic stroke in a 50-year-old man after arthroscopic subacromial decompression and open rotator cuff repair that resulted in unresolved right hemiplegia. Subsequent diagnostic investigation revealed an asymmetry of the circle of Willis resulting in limited flow to the left anterior and middle cerebral artery distributions. Bhatti and Enneking3 reported the case of a 64-year-old man who lost vision in the right eye immediately after arthroscopic rotator cuff repair. His vision improved spontaneously the next morning and continued to improve over the next 6 months—he regained 20/20 vision with some residual optic neuropathy.
Our third aim was to determine the incidence of intraoperative CDEs during arthroscopic shoulder surgery with the patient in the BCP. Incidence of CDEs varied widely among the 7 studies reviewed (Table 3). Minimum incidence of intraoperative CDE was 0% in a cohort of 30 patients,1 and maximum incidence was 80% in a study of 61 patients,12 all of whom underwent elective arthroscopic shoulder surgery in the BCP. Although there was wide variability in CDE incidence, the studies were consistent with respect to their definition of a CDE. Most authors used a decrease in regional cerebral tissue oxygen saturation of 20% or more from baseline, or an absolute value up to 55%, to define a CDE. None of the 7 studies reviewed reported a clinically significant adverse neurocognitive event.
Discussion
Of concern, there have been several surveys, case reports, and small case series of previously healthy patients who had no known risk factors, underwent arthroscopic shoulder surgery in the BCP, and developed unanticipated postoperative neurologic complications.4-6,14 Beach-chair positioning during surgical procedures has been implicated as a contributing factor leading to cerebral hypoperfusion with potential for cerebral ischemia.1,12,23 These changes in cerebral perfusion pressure are thought to be the major determinant of poor neurologic outcomes. Such reports have exposed the potential need for heightened vigilance, alternative anesthesia techniques, and improved monitoring, though the exact etiology of the central nervous system injuries in this patient population is incompletely understood and is likely multifactorial. Therefore, in this study we wanted to determine the incidence of postoperative neurocognitive deficits and review all reported cases of neurocognitive complications in patients who have undergone arthroscopic shoulder surgery in the BCP. In addition, we wanted to define the incidence of intraoperative CDEs and investigate their relationship with postoperative neurocognitive complications.
According to our review, the incidence of postoperative neurocognitive complications after surgery in the BCP is 0.004% (1/24,701). However, this finding is based only on what has been reported; the true incidence is not known. It is also important to note that the incidence of neurocognitive deficits after many other types of surgery is not known and that surgery itself may be a risk factor for postoperative neurocognitive deficits.24 In their retrospective review of 15,014 patients who underwent arthroscopic shoulder surgery in the BCP at a single institution over an 11-year period, Rohrbaugh and colleagues18 found an overall postoperative complication rate of 0.37% and a 0.0067% incidence of neurocognitive deficits. One patient in the series was given a diagnosis of ischemic stroke on the basis of neurologic deficits that occurred 24 hours after surgery. Yadeau and colleagues20 found no postoperative neurocognitive complications in a mixed prospective-retrospective study of 4169 patients—3000 identified retrospectively, 1169 prospectively—who underwent arthroscopic shoulder surgery in the BCP at an ambulatory surgery center. Pin-on and colleagues19 reported on a series of 5177 orthopedic and neurosurgical patients who underwent surgery in the BCP. In those who had arthroscopic shoulder surgery, intraoperative systolic blood pressures obtained from an arterial line referenced to heart level decreased a mean (SD) of 14.4% (12.7%), whereas in those whose pressures were obtained from a noninvasive blood pressure cuff referenced to heart level decreased 19.3% (12.6%). However, the authors reported no incidence of postoperative stroke or neurologic deficits.
Although uncommon, perioperative cerebral ischemic accidents are potentially devastating for patients, their families, and the health care professionals involved. These events have tremendous economic, social, professional, and medicolegal implications, with perioperative stroke being particularly morbid. Perioperative stroke has a mortality rate of 60%, versus 15% to 46% for stroke in general.25,26 In 2005, Pohl and Cullen6 published a landmark article on a series of 4 relatively healthy middle-aged patients who were at low risk for stroke but had catastrophic neurocognitive complications (including 1 death) after arthroscopic shoulder surgery in the BCP. Bhatti and Enneking3 described a case of acute postoperative vision loss and ophthalmoplegia attributed to intraoperative hypotension leading to ischemia in a patient who underwent an elective shoulder arthroscopic procedure in the BCP. These reports prompted multiple investigations into the physiologic hemodynamic changes associated with surgery in the BCP and the treatment strategies used to improve patient safety.
In the normal physiologic state, the sympathetic nervous system is activated when a person assumes the seated position. The result is increased systemic vascular resistance and heart rate alterations to maintain cardiac output and mean arterial pressure. In anesthetized patients, this response is blunted by the vasodilatory effects of intravenous and volatile anesthetics. Multiple studies have demonstrated substantial hemodynamic changes in both awake and anesthetized patients during the maneuver from the supine position to the seated position1,27,28; these changes include diminished cardiac index, stroke volume, and arterial pressure.17 The data underscore the need for attentiveness and accurate monitoring of cerebral perfusion when the transition is made from the supine position to the BCP, particularly in the early phase of surgery and in high-risk patients.
Knowledge of these hemodynamic changes has led several authors to recommend additional intraoperative monitoring of cerebral perfusion. Monitoring techniques have included use of invasive blood pressure monitoring adjusted to brain level, cerebral oximetry using near infrared spectroscopy, and electroencephalography. However, the clinical relevance of intraoperative CDEs in isolation is not well understood.1,6,7,23 In addition, cost and availability of additional advanced monitoring likely factor into why it is not more commonly used. For this patient population, the severity, frequency, and duration of desaturation that causes cerebral ischemia and the relationship with postoperative neurocognitive deficits remain undefined.
The incidence of CDEs in patients being monitored with near infrared spectroscopy while undergoing elective arthroscopic shoulder surgery in the BCP varies widely, from 0% to 80% (mean, 41%).1,4,7,10,12,21 Magnitude and duration of cerebral ischemia required to produce neurocognitive dysfunction in this patient population remain unidentified as well. In conscious patients, a 20% reduction in frontal lobe oxygenation is associated with clinical manifestations of cerebral hypoperfusion, such as syncope.15,29 As none of the patients in the studies we reviewed experienced any sort of deficit, we cannot definitively state there is a correlation between CDE occurrence and neurocognitive deficit.
One limitation of our investigation is that it was a systemic review, and thus there was substantial heterogeneity in the methods and designs of the studies included in the analysis. Among the different series, there was variability in multiple aspects of the study design, including type of anesthetic, patient inclusion criteria, type of surgery, type of intraoperative cerebral perfusion monitoring, and type of neurocognitive testing. As a result, comparing the groups was difficult, and the generalizability of our findings may be limited. In addition, it is difficult to accurately establish incidence and comprehensively review these events because of the paucity of literature.
Conclusion
Neurocognitive complications after shoulder arthroscopy with the patient in the BCP are extremely rare but potentially devastating events that can affect healthy patients with no preexisting cerebrovascular risk factors. Our review indicated the incidence of permanent neurologic deficit after arthroscopy in the BCP may be as low as 0.004%. The exact etiology of such complications is not clear. Basic science research and large prospective studies are needed to identify the clinically relevant thresholds of magnitude, duration, and frequency of intraoperative CDEs in order to establish their relationship with postoperative neurocognitive complications. Such large studies may also elucidate modifiable patient-specific risk factors and establish the most sensitive, safe, and cost-effective intraoperative monitoring tools. Current literature suggests that accurate intraoperative monitoring of cerebral perfusion, alternatives to general anesthesia, and prudent use of intraoperative blood pressure control may improve patient safety.
1. Tange K, Kinoshita H, Minonishi T, et al. Cerebral oxygenation in the beach chair position before and during general anesthesia. Minerva Anestesiol. 2010;76(7):485-490.
2. Skyhar MJ, Altchek DW, Warren RF, Wickiewicz TL, O’Brien SJ. Shoulder arthroscopy with the patient in the beach-chair position. Arthroscopy. 1988;4(4):256-259.
3. Bhatti MT, Enneking FK. Visual loss and ophthalmoplegia after shoulder surgery. Anesth Analg. 2003;96(3):899-902.
4. Friedman DJ, Parnes NZ, Zimmer Z, Higgins LD, Warner JJ. Prevalence of cerebrovascular events during shoulder surgery and association with patient position. Orthopedics. 2009;32(4).
5. Papadonikolakis A, Wiesler ER, Olympio MA, Poehling GG. Avoiding catastrophic complications of stroke and death related to shoulder surgery in the sitting position. Arthroscopy. 2008;24(4):481-482.
6. Pohl A, Cullen DJ. Cerebral ischemia during shoulder surgery in the upright position: a case series. J Clin Anesth. 2005;17(6):463-469.
7. Dippmann C, Winge S, Nielsen HB. Severe cerebral desaturation during shoulder arthroscopy in the beach-chair position. Arthroscopy. 2010;26(9 suppl):S148-S150.
8. Gillespie R, Shishani Y, Streit J, et al. The safety of controlled hypotension for shoulder arthroscopy in the beach-chair position. J Bone Joint Surg Am. 2012;94(14):1284-1290.
9. Jeong H, Lee SH, Jang EA, Chung SS, Lee J, Yoo KY. Haemodynamics and cerebral oxygenation during arthroscopic shoulder surgery in beach chair position under general anaesthesia. Acta Anaesthesiol Scand. 2012;56(7):872-879.
10. Lee JH, Min KT, Chun YM, Kim EJ, Choi SH. Effects of beach-chair position and induced hypotension on cerebral oxygen saturation in patients undergoing arthroscopic shoulder surgery. Arthroscopy. 2011;27(7):889-894.
11. Moerman AT, De Hert SG, Jacobs TF, De Wilde LF, Wouters PF. Cerebral oxygen desaturation during beach chair position. Eur J Anaesthesiol. 2012;29(2):82-87.
12. Murphy GS, Szokol JW, Marymont JH, et al. Cerebral oxygen desaturation events assessed by near-infrared spectroscopy during shoulder arthroscopy in the beach chair and lateral decubitus positions. Anesth Analg. 2010;111(2):496-505.
13. Peruto CM, Ciccotti MG, Cohen SB. Shoulder arthroscopy positioning: lateral decubitus versus beach chair. Arthroscopy. 2009;25(8):891-896.
14. Rains DD, Rooke GA, Wahl CJ. Pathomechanisms and complications related to patient positioning and anesthesia during shoulder arthroscopy. Arthroscopy. 2011;27(4):532-541.
15. Samra SK, Dy EA, Welch K, Dorje P, Zelenock GB, Stanley JC. Evaluation of a cerebral oximeter as a monitor of cerebral ischemia during carotid endarterectomy. Anesthesiology. 2000;93(4):964-970.
16. Smythe PR, Samra SK. Monitors of cerebral oxygenation. Anesthesiol Clin North Am. 2002;20(2):293-313.
17. Smith JJ, Porth CM, Erickson M. Hemodynamic response to the upright posture. J Clin Pharmacol. 1994;34(5):375-386.
18. Rohrbaugh M, Kentor ML, Orebaugh SL, Williams B. Outcomes of shoulder surgery in the sitting position with interscalene nerve block: a single-center series. Reg Anesth Pain Med. 2013;38(1):28-33.
19. Pin-on P, Schroeder D, Munis J. The hemodynamic management of 5177 neurosurgical and orthopedic patients who underwent surgery in the sitting or “beach chair” position without incidence of adverse neurologic events. Anesth Analg. 2013;116(6):1317-1324.
20. Yadeau JT, Casciano M, Liu SS, et al. Stroke, regional anesthesia in the sitting position, and hypotension: a review of 4169 ambulatory surgery patients. Reg Anesth Pain Med. 2011;36(5):430-435.
21. Salazar D, Sears BW, Aghdasi B, et al. Cerebral desaturation events during shoulder arthroscopy in the beach chair position: patient risk factors and neurocognitive effects. J Shoulder Elbow Surg. 2013;22(9):1228-1235.
22. Drummond JC, Lee RR, Howell JP Jr. Focal cerebral ischemia after surgery in the “beach chair” position: the role of a congenital variation of circle of Willis anatomy. Anesth Analg. 2012;114(6):1301-1303.
23. Fischer GW, Torrillo TM, Weiner MM, Rosenblatt MA. The use of cerebral oximetry as a monitor of the adequacy of cerebral perfusion in a patient undergoing shoulder surgery in the beach chair position. Pain Pract. 2009;9(4):304-307.
24. Wong GY, Warner DO, Schroeder DR, et al. Risk of surgery and anesthesia for ischemic stroke. Anesthesiology. 2000;92(2):425-432.
25. Knapp RB, Topkins MJ, Artusio JF Jr. The cerebrovascular accident and coronary occlusion in anesthesia. JAMA. 1962;182:332-334.
26. Landercasper J, Merz BJ, Cogbill TH, et al. Perioperative stroke risk in 173 consecutive patients with a past history of stroke. Arch Surg. 1990;125(8):986-989.
27. Fuchs G, Schwarz G, Kulier A, Litscher G. The influence of positioning on spectroscopic measurements of brain oxygenation. J Neurosurg Anesthesiol. 2000;12(2):75-80.
28. Lovell AT, Owen-Reece H, Elwell CE, Smith M, Goldstone JC. Continuous measurement of cerebral oxygenation by near infrared spectroscopy during induction of anesthesia. Anesth Analg. 1999;88(3):554-558.
29. Madsen PL, Secher NH. Near-infrared oximetry of the brain. Prog Neurobiol. 1999;58(6):541-560.
30. Koh JL, Levin SD, Chehab EL, Murphy GS. Neer award 2012: cerebral oxygenation in the beach chair position: a prospective study on the effect of general anesthesia compared with regional anesthesia and sedation. J Shoulder Elbow Surg. 2013;22:1325-1331.
MRI assessment of pulmonary vein stenosis predicts outcomes
A retrospective analysis of children who underwent pulmonary vein stenosis repair with preoperative computed tomography and magnetic resonance imaging from 1990 to 2012 showed that smaller upstream or downstream total cross-sectional area indexed (TCSAi) for body surface area led to poorer survival.
The study of 31 patients at a single institution also indicated that early survival seemed especially poor for patients with a greater number of stenotic veins and upstream pulmonary vein (PV) involvement. The study was published in the March issue of the Journal of Thoracic and Cardiovascular Surgery.
Dr. Mauro Lo Rito and his colleagues at The Hospital for Sick Children, Toronto, retrospectively assessed the 31 patients out of 145 who underwent surgical repair who had had preoperative CT and MRI imaging. Complete sutureless repair was done in 18 (58%), single-side sutureless repair in 12 (39%), and pericardial patch reconstruction in 1 (3%). The mean follow-up was 4.3 years; the median patient age at time of operation was 226 days. Stenosis was bilateral in 45% of patients and unilateral in 55 (J Thorac Cardiovasc Surg. 2016;151:657-66).
In-hospital mortality was 9.7%, with an overall survival of 75%, 69%, and 64% at 1, 3, and 5 years, respectively. Univariate analysis showed that a younger age at operation, lower body surface area, smaller upstream TCSAi, and greater number of PV with stenosis/occlusion were associated with an increased risk of death.
Multivariate analysis showed that smaller upstream TCSAi for body surface area (P = .030) and greater number of stenotic PVs (P = .007) were associated with poor early (less than 1 year) survival. There was a nonsignificant tendency for smaller downstream TCSAi to be associated with poor late survival (greater than 1 year). None of the different PV morphologies were found to influence survival, according to Dr. Lo Rito and his colleagues.
Among the 28 hospital survivors, restenosis occurred in 10 patients, 7 of whom did not undergo further surgery (3 of these were alive at last follow-up and 4 died secondary to disease progression). Of the 3 patients who underwent subsequent intervention, 2 were alive at last follow-up.
“Risk stratification for patients with PV stenosis is currently challenging because of the variability in the anatomic configuration and the unknown relationship between these anatomic variants and survival. Our study demonstrates that by using cross-sectional areas, pulmonary vein cross-sectional area indexed to body surface area (PVCSAi) and TCSAi and tabulating the number of stenotic PVs, we can identify high-risk subsets of patients with high predicted mortality.” Dr. Lo Rito and his colleagues stated.
“The upstream total cross-sectional area and the number of stenotic PVs influence early survival and can be used to guide counseling. Smaller downstream cross-sectional area influences late survival, and those patients should be monitored with close follow-up. This methodology could aid in risk stratification for future clinical trials of pharmacologic agents designed to target upstream pulmonary vasculopathy,” the investigators concluded.
The authors reported that they had no conflicts of interest.
A webcast of the original presentation of these results at the 95th American Association for Thoracic Surgery Annual Meeting is available online (http://webcast.aats.org/2015/Video/Tuesday/04-28-15_6A_1615_Lo_Rito.mp4).
“The Toronto group has contributed significantly to our knowledge and management of pulmonary vein stenosis during the past decade. This article by Dr. Lo Rito and coworkers continues that contribution by reinforcing the values of MRI in imaging PVs before intervention and providing a valuable “hint” that preoperative PV size measurements are related to outcome,” Dr. William M. DeCampli wrote in his invited commentary (J Thorac Cardiovasc Surg. 2016;1510:667-8).
“The task of definitively demonstrating this relationship is daunting for any single institution, however, because 1) PVS is relatively rare, 2) MRI and computed tomography are relatively recently used diagnostic modalities, and 3) MRI is not easily used in an important subset of the cohort, small infants.” This limited the study to a small number of covariates,” noted Dr. DeCampli, and prevented the researchers from taking into account a myriad of additional covariates commonly associated with survival in complex congenital heart disease.

|
Dr. William M. DeCampli |
Such covariates included in a sufficiently large model could significantly alter the observed odds ratios otherwise calculated for the included variables in this study, he added, citing a study of PVS by Boston Children’s Hospital (J Thorac Cardiovasc Surg. 2015;150:911-7), which found a different set of covariates associated with death; in that case, age younger than 6 months at operation, weight less than 3 kg at operation, and lesser preoperative right ventricular systolic pressure.
“The challenges in studying PVS encountered by these two high-volume, research-oriented programs leads us to suggest that PVS should be studied in a different way. Perhaps it is time to consider a multi-institutional, mixed or inception cohort registry for PVS. The spring 2015 Society of Thoracic Surgeons Congenital Heart Database report lists 506 cases of PVS repair as the primary procedure between January 2011 and December 2014. If a study were to enroll just one-third of these subjects it would accrue more than 40 subjects per year. Five years hence with an anticipated 50-80 events (deaths), it would be possible to carry out more robust risk-hazard analyses,” Dr. DeCampli suggested.
Dr. DeCampli is a congenital heart surgeon at the department of clinical sciences, University of Central Florida, and the Heart Center at Arnold Palmer Hospital for Children, both in Orlando. He reported having no conflicts.
“The Toronto group has contributed significantly to our knowledge and management of pulmonary vein stenosis during the past decade. This article by Dr. Lo Rito and coworkers continues that contribution by reinforcing the values of MRI in imaging PVs before intervention and providing a valuable “hint” that preoperative PV size measurements are related to outcome,” Dr. William M. DeCampli wrote in his invited commentary (J Thorac Cardiovasc Surg. 2016;1510:667-8).
“The task of definitively demonstrating this relationship is daunting for any single institution, however, because 1) PVS is relatively rare, 2) MRI and computed tomography are relatively recently used diagnostic modalities, and 3) MRI is not easily used in an important subset of the cohort, small infants.” This limited the study to a small number of covariates,” noted Dr. DeCampli, and prevented the researchers from taking into account a myriad of additional covariates commonly associated with survival in complex congenital heart disease.
|
|
Dr. William M. DeCampli |
Such covariates included in a sufficiently large model could significantly alter the observed odds ratios otherwise calculated for the included variables in this study, he added, citing a study of PVS by Boston Children’s Hospital (J Thorac Cardiovasc Surg. 2015;150:911-7), which found a different set of covariates associated with death; in that case, age younger than 6 months at operation, weight less than 3 kg at operation, and lesser preoperative right ventricular systolic pressure.
“The challenges in studying PVS encountered by these two high-volume, research-oriented programs leads us to suggest that PVS should be studied in a different way. Perhaps it is time to consider a multi-institutional, mixed or inception cohort registry for PVS. The spring 2015 Society of Thoracic Surgeons Congenital Heart Database report lists 506 cases of PVS repair as the primary procedure between January 2011 and December 2014. If a study were to enroll just one-third of these subjects it would accrue more than 40 subjects per year. Five years hence with an anticipated 50-80 events (deaths), it would be possible to carry out more robust risk-hazard analyses,” Dr. DeCampli suggested.
Dr. DeCampli is a congenital heart surgeon at the department of clinical sciences, University of Central Florida, and the Heart Center at Arnold Palmer Hospital for Children, both in Orlando. He reported having no conflicts.
A retrospective analysis of children who underwent pulmonary vein stenosis repair with preoperative computed tomography and magnetic resonance imaging from 1990 to 2012 showed that smaller upstream or downstream total cross-sectional area indexed (TCSAi) for body surface area led to poorer survival.
The study of 31 patients at a single institution also indicated that early survival seemed especially poor for patients with a greater number of stenotic veins and upstream pulmonary vein (PV) involvement. The study was published in the March issue of the Journal of Thoracic and Cardiovascular Surgery.
Dr. Mauro Lo Rito and his colleagues at The Hospital for Sick Children, Toronto, retrospectively assessed the 31 patients out of 145 who underwent surgical repair who had had preoperative CT and MRI imaging. Complete sutureless repair was done in 18 (58%), single-side sutureless repair in 12 (39%), and pericardial patch reconstruction in 1 (3%). The mean follow-up was 4.3 years; the median patient age at time of operation was 226 days. Stenosis was bilateral in 45% of patients and unilateral in 55 (J Thorac Cardiovasc Surg. 2016;151:657-66).
In-hospital mortality was 9.7%, with an overall survival of 75%, 69%, and 64% at 1, 3, and 5 years, respectively. Univariate analysis showed that a younger age at operation, lower body surface area, smaller upstream TCSAi, and greater number of PV with stenosis/occlusion were associated with an increased risk of death.
Multivariate analysis showed that smaller upstream TCSAi for body surface area (P = .030) and greater number of stenotic PVs (P = .007) were associated with poor early (less than 1 year) survival. There was a nonsignificant tendency for smaller downstream TCSAi to be associated with poor late survival (greater than 1 year). None of the different PV morphologies were found to influence survival, according to Dr. Lo Rito and his colleagues.
Among the 28 hospital survivors, restenosis occurred in 10 patients, 7 of whom did not undergo further surgery (3 of these were alive at last follow-up and 4 died secondary to disease progression). Of the 3 patients who underwent subsequent intervention, 2 were alive at last follow-up.
“Risk stratification for patients with PV stenosis is currently challenging because of the variability in the anatomic configuration and the unknown relationship between these anatomic variants and survival. Our study demonstrates that by using cross-sectional areas, pulmonary vein cross-sectional area indexed to body surface area (PVCSAi) and TCSAi and tabulating the number of stenotic PVs, we can identify high-risk subsets of patients with high predicted mortality.” Dr. Lo Rito and his colleagues stated.
“The upstream total cross-sectional area and the number of stenotic PVs influence early survival and can be used to guide counseling. Smaller downstream cross-sectional area influences late survival, and those patients should be monitored with close follow-up. This methodology could aid in risk stratification for future clinical trials of pharmacologic agents designed to target upstream pulmonary vasculopathy,” the investigators concluded.
The authors reported that they had no conflicts of interest.
A webcast of the original presentation of these results at the 95th American Association for Thoracic Surgery Annual Meeting is available online (http://webcast.aats.org/2015/Video/Tuesday/04-28-15_6A_1615_Lo_Rito.mp4).
FROM JOURNAL OF THORACIC AND CARDIOVASCULAR SURGERY
Key clinical point: Survival after pulmonary vein stenosis repair was adversely affected by smaller upstream cross-sectional area indexed to body surface area.
Major finding: Smaller upstream total cross-sectional area indexed for body surface area (P = .30) and greater number of stenotic pulmonary veins (P = .007) were associated with increased early risk of death.
Data source: Researchers reviewed the outcomes of 31/145 patients who underwent surgical repair of pulmonary stenosis who had preoperative computed tomography and magnetic resonance imaging between 1990 and 2012.
Disclosures: The authors reported that they had no conflicts of interest.

ISC: Carotid surgery, stenting offer patients balanced alternatives
LOS ANGELES – The equipoise between carotid stenting and endarterectomy received a further boost in 10-year results from the landmark Carotid Revascularization Endarterectomy versus Stenting Trial (CREST) that compared the two options head-to-head.
Reported the day after results from another big trial that pitted carotid stenting against surgery, the Asymptomatic Carotid Trial (ACT I), the new long-term results from the CREST study mean that deciding among the options relies largely on patient preference although individual clinical characteristics might favor one approach or the other, experts said.

The big remaining unknown and wild card is whether doing no procedural intervention at all and relying entirely on optimal, contemporary medical treatment works just as well as endarterectomy or carotid stenting. The role for stand-alone medical therapy against carotid surgery or stenting (on top of medical therapy) is currently undergoing a formal, direct comparison in the randomized Carotid Revascularization and Medical Management for Asymptomatic Carotid Stenosis Trial (CREST-2).
Taking the 5-year outcome results from ACT I and the 10-year outcome results from CREST both into account, “we now have a lot of evidence that both carotid stenting and surgery are safe and durable. The results support both options” for either patients with symptomatic carotid artery stenosis or asymptomatic patients with carotid stenosis as extensive as in the patients enrolled in these trials, said Dr. Thomas G. Brott at the International Stroke Conference.
“In routine practice, we lay out the options of endarterectomy, carotid stenting, or no intervention with just medical treatment to patients and let them decide,” noted Dr. Brott, professor of neurology and director of research at the Mayo Clinic in Jacksonville, Fla.
CREST randomized 2,502 symptomatic or asymptomatic patients with significant carotid stenosis during 2000-2008 at 117 U.S. and Canadian centers. From this group, 1,607 consented and were available for long-term follow-up, done at a median of 7.4 years and as long as 10 years after follow-up.
The study’s primary, long-term endpoint was stroke, MI, or death during the periprocedural period (30 days after treatment or 36 days after enrollment depending on when the procedural intervention occurred) plus the rate of ipsilateral stroke during up to 10 years of follow-up. This combined endpoint occurred in 10% of the patients who underwent endarterectomy and in 12% of those who had stenting, a difference that was not statistically significant, Dr. Brott reported. Concurrent with his presentation at the meeting, sponsored by the American Heart Association, the results also were published online (N Engl J Med. 2016 Feb 18. doi: 10.1056/NEJMoa1505215).
The results included a secondary endpoint that showed a significant benefit for endarterectomy. The tally of periprocedural strokes or deaths plus ipsilateral strokes during 10-year follow-up was 8% for the surgical group and 11% for those who received a stent, a 37% excess hazard with stenting.
Dr. Brott attributed this secondary difference between the two arms of the study to a statistically significant excess of stroke or death during the periprocedural period in the patients treated by stenting, and more specifically an excess of strokes. The rate of total periprocedural strokes was 4% with stenting and 2% with endarterectomy, a statistically significant difference. Although an embolic protection device was used “when feasible” during stenting, this protection can be fallible, Dr. Brott noted. In contrast, the results from the ACT I trial showed no statistically significant difference in the rate of periprocedural total strokes between the stented and endarterectomy patients.
Dr. Brott had no relevant disclosures. The CREST trial received partial funding from Abbott Vascular.
On Twitter @mitchelzoler
The 10-year CREST results are good news for patients with carotid disease because they show the durability of both interventions we can offer patients. Having these data and the results from ACT I allows physicians to have an informed discussion with patients about their treatment options. I also hope that with these results from both trials, reimbursement will cease to be a deciding factor and that both surgery and stenting will be on a level playing field for insurance coverage.
Although on a population level stenting and surgery appear to produce comparable results, individual patient characteristics can make one option more appropriate. These include the morphology of a patient’s carotid arteries and stenotic lesions that can make stenting a technical challenge, and a patient’s medical condition and comorbidities which could put them at higher risk for general anesthesia and surgery. Also, a big concern for many patients is how long they will require hospitalization.
|
Dr. Mark J. Alberts |
A major unresolved question now about treating carotid disease is whether medical treatment alone is an equally good third alternative for asymptomatic patients. We are in a relatively new era of medical therapy, with more options for smoking cessation, better and more diverse drugs for blood pressure and hyperglycemia control, and wider use of high-dose statins. Some patients are eager to avoid any intervention and already opt for medical management only, but only after CREST-2 is completed will we know whether they will truly fare as well as patients who have a procedure performed.
Another issue that needs to be considered when extrapolating the results from CREST and ACT I to routine practice is that the surgeons and interventionalists who performed the procedures in these trials were highly selected and experienced. One cannot assume that the results in these trials will be replicated by any surgeon or interventionalist in the community. I suggest that patients investigate the track record of their community hospitals and operators by consulting the performance information that is increasingly posted on the Internet.
Dr. Mark J. Alberts is professor of neurology and medical director of the neurology service at the University of Texas Southwestern Medical Center in Dallas. He had no disclosures. He made these comments in an interview.
The 10-year CREST results are good news for patients with carotid disease because they show the durability of both interventions we can offer patients. Having these data and the results from ACT I allows physicians to have an informed discussion with patients about their treatment options. I also hope that with these results from both trials, reimbursement will cease to be a deciding factor and that both surgery and stenting will be on a level playing field for insurance coverage.
Although on a population level stenting and surgery appear to produce comparable results, individual patient characteristics can make one option more appropriate. These include the morphology of a patient’s carotid arteries and stenotic lesions that can make stenting a technical challenge, and a patient’s medical condition and comorbidities which could put them at higher risk for general anesthesia and surgery. Also, a big concern for many patients is how long they will require hospitalization.
|
|
Dr. Mark J. Alberts |
A major unresolved question now about treating carotid disease is whether medical treatment alone is an equally good third alternative for asymptomatic patients. We are in a relatively new era of medical therapy, with more options for smoking cessation, better and more diverse drugs for blood pressure and hyperglycemia control, and wider use of high-dose statins. Some patients are eager to avoid any intervention and already opt for medical management only, but only after CREST-2 is completed will we know whether they will truly fare as well as patients who have a procedure performed.
Another issue that needs to be considered when extrapolating the results from CREST and ACT I to routine practice is that the surgeons and interventionalists who performed the procedures in these trials were highly selected and experienced. One cannot assume that the results in these trials will be replicated by any surgeon or interventionalist in the community. I suggest that patients investigate the track record of their community hospitals and operators by consulting the performance information that is increasingly posted on the Internet.
Dr. Mark J. Alberts is professor of neurology and medical director of the neurology service at the University of Texas Southwestern Medical Center in Dallas. He had no disclosures. He made these comments in an interview.
LOS ANGELES – The equipoise between carotid stenting and endarterectomy received a further boost in 10-year results from the landmark Carotid Revascularization Endarterectomy versus Stenting Trial (CREST) that compared the two options head-to-head.
Reported the day after results from another big trial that pitted carotid stenting against surgery, the Asymptomatic Carotid Trial (ACT I), the new long-term results from the CREST study mean that deciding among the options relies largely on patient preference although individual clinical characteristics might favor one approach or the other, experts said.
The big remaining unknown and wild card is whether doing no procedural intervention at all and relying entirely on optimal, contemporary medical treatment works just as well as endarterectomy or carotid stenting. The role for stand-alone medical therapy against carotid surgery or stenting (on top of medical therapy) is currently undergoing a formal, direct comparison in the randomized Carotid Revascularization and Medical Management for Asymptomatic Carotid Stenosis Trial (CREST-2).
Taking the 5-year outcome results from ACT I and the 10-year outcome results from CREST both into account, “we now have a lot of evidence that both carotid stenting and surgery are safe and durable. The results support both options” for either patients with symptomatic carotid artery stenosis or asymptomatic patients with carotid stenosis as extensive as in the patients enrolled in these trials, said Dr. Thomas G. Brott at the International Stroke Conference.
“In routine practice, we lay out the options of endarterectomy, carotid stenting, or no intervention with just medical treatment to patients and let them decide,” noted Dr. Brott, professor of neurology and director of research at the Mayo Clinic in Jacksonville, Fla.
CREST randomized 2,502 symptomatic or asymptomatic patients with significant carotid stenosis during 2000-2008 at 117 U.S. and Canadian centers. From this group, 1,607 consented and were available for long-term follow-up, done at a median of 7.4 years and as long as 10 years after follow-up.
The study’s primary, long-term endpoint was stroke, MI, or death during the periprocedural period (30 days after treatment or 36 days after enrollment depending on when the procedural intervention occurred) plus the rate of ipsilateral stroke during up to 10 years of follow-up. This combined endpoint occurred in 10% of the patients who underwent endarterectomy and in 12% of those who had stenting, a difference that was not statistically significant, Dr. Brott reported. Concurrent with his presentation at the meeting, sponsored by the American Heart Association, the results also were published online (N Engl J Med. 2016 Feb 18. doi: 10.1056/NEJMoa1505215).
The results included a secondary endpoint that showed a significant benefit for endarterectomy. The tally of periprocedural strokes or deaths plus ipsilateral strokes during 10-year follow-up was 8% for the surgical group and 11% for those who received a stent, a 37% excess hazard with stenting.
Dr. Brott attributed this secondary difference between the two arms of the study to a statistically significant excess of stroke or death during the periprocedural period in the patients treated by stenting, and more specifically an excess of strokes. The rate of total periprocedural strokes was 4% with stenting and 2% with endarterectomy, a statistically significant difference. Although an embolic protection device was used “when feasible” during stenting, this protection can be fallible, Dr. Brott noted. In contrast, the results from the ACT I trial showed no statistically significant difference in the rate of periprocedural total strokes between the stented and endarterectomy patients.
Dr. Brott had no relevant disclosures. The CREST trial received partial funding from Abbott Vascular.
On Twitter @mitchelzoler
AT THE INTERNATIONAL STROKE CONFERENCE
Key clinical point: Long-term follow-up of the CREST trial out to 10 years showed no statistically significant difference between endarterectomy or carotid stenting for patients with carotid artery stenosis.
Major finding: The primary, long-term endpoint occurred in 10% of endarterectomy patients and 12% of stented patients, a nonsignificant difference.
Data source: The CREST trial, which followed 1,607 patients for up to 10 years after their randomized intervention.
Disclosures: Dr. Brott had no relevant disclosures. The CREST trial received partial funding from Abbott Vascular.
Cosmetic Corner: Dermatologists Weigh in on Facial Sunscreens
To improve patient care and outcomes, leading dermatologists offered their recommendations on facial sunscreens. Consideration must be given to:
- Anthelios SX
La Roche-Posay Laboratoire Dermatologique
"This medium-weight facial moisturizing cream with broad-spectrum sunscreen seems to be a widely accepted option for daily patient use, and I use it myself.”
—Lorraine L. Rosamilia, MD, State College, Pennsylvania
- Anthelios 50
La Roche-Posay Laboratoire Dermatologique
Recommended by Gary Goldenberg, MD, New York, New York
- Elizabeth Arden Pro Triple Protection Factor SPF 50
Elizabeth Arden, Inc.
“This is a tinted, chemical-free SPF 50 sunscreen that looks, feels, and smells like its made by a cosmetic company that understands what people want in a skin care product. Additionally, it has several antioxidants and DNA repair enzyme. So not only is it protecting the skin from UV damage, but it’s trying to reverse some of that damage as well.”
—Mark G. Rubin, MD, Beverly Hills, California
- EltaMD UV Clear Broad-Spectrum SPF 46
EltaMD
“This sunscreen has an elegant feel upon application and leaves little residue, making it a nice product for daily facial application.”
—Neil Fernandes, MD, Phoenix, Arizona
- Neutrogena Age Shield Face Lotion Sunscreen
Johnson & Johnson Consumer Inc
“This sunscreen has broad UV spectrum coverage that blocks against harmful UVA and UVB rays. It has the added benefit of having antioxidants that may slow and reverse photoaging.”
—Shari Lipner, MD, PhD, New York, New York
- Sheer Physical UV Defense SPF 50
SkinCeuticals
“It is very lightweight, especially for a physical block, and is noncomedogenic and sheer but still provides broad-spectrum coverage with both titanium dioxide and zinc oxide. There is a tinted version as well that I often recommend for women.”
—Monica Schadlow, MD, New York, New York
Cutis invites readers to send us their recommendations. Hand creams, scar treatments, and body scrubs will be featured in upcoming editions of Cosmetic Corner. Please e-mail your recommendation(s) to the Editorial Office.
Disclaimer: Opinions expressed herein do not necessarily reflect those of Cutis or Frontline Medical Communications Inc. and shall not be used for product endorsement purposes. Any reference made to a specific commercial product does not indicate or imply that Cutis or Frontline Medical Communications Inc. endorses, recommends, or favors the product mentioned. No guarantee is given to the effects of recommended products.

Epidemiology and Impact of Knee Injuries in Major and Minor League Baseball Players
Injuries among professional baseball players have been on the rise for several years.1,2 From 1989 to 1999, the number of disabled list (DL) reports increased 38% (266 to 367 annual reports),1 and a similar increase in injury rates was noted from the 2002 to the 2008 seasons (37%).2 These injuries have important implications for future injury risk and time away from play. Identifying these injuries and determining correlates and risk factors is important for targeted prevention efforts.
Several studies have explored the prevalence of upper extremity injuries in professional and collegiate baseball players;2-4 however, detailed epidemiology of knee injuries in Major League Baseball (MLB) and Minor League Baseball (MiLB) players is lacking. Much more is known about the prevalence, treatment, and outcomes of knee injuries in other professional sporting organizations, such as the National Basketball Association (NBA), National Football League (NFL), and National Hockey League (NHL).4-12 A recent meta-analysis exploring injuries in professional athletes found that studies on lower extremity injuries comprised approximately 12% of the literature reporting injuries in MLB players.4 In other professional leagues, publications on lower extremity injuries comprise approximately 56% of the sports medicine literature in the NFL, 54% in the NBA, and 62% in the NHL.4 Since few studies have investigated lower extremity injuries among professional baseball players, there is an opportunity for additional research to guide evidence-based prevention strategies.
A better understanding of the nature of these injuries is one of the first steps towards developing targeted injury prevention programs and treatment algorithms. The study of injury epidemiology among professional baseball players has been aided by the creation of an injury tracking system initiated by the MLB, its minor league affiliates, and the Major League Baseball Players Association.5,13,14 This surveillance system allows for the tracking of medical histories and injuries to players as they move across major and minor league organizations. Similar systems have been utilized in the National Collegiate Athletic Association and other professional sports organizations.3,15-17 A unique advantage of the MLB surveillance system is the required participation of all major and minor league teams, which allows for investigation of the entire population of players rather than simply a sample of players from select teams. This system has propelled an effort to identify injury patterns as a means of developing appropriate targets for potential preventative measures.5
The purpose of this descriptive epidemiologic study is to better understand the distribution and characteristics of knee injuries in these elite athletes by reporting on all knee injuries occurring over a span of 4 seasons (2011-2014). Additionally, this study seeks to characterize the impact of these injuries by analyzing the time required for return to play and the treatments rendered (surgical and nonsurgical).
Materials and Methods
After approval from the Johns Hopkins Bloomberg School of Public Health Institutional Review Board, detailed data regarding knee injuries in both MLB and MiLB baseball players were extracted from the de-identified MLB Health and Injury Tracking System (HITS). The HITS database is a centralized database that contains data on injuries from an electronic medical record (EMR). All players provided consent to have their data included in this EMR. HITS system captures injuries reported by the athletic trainers for all professional baseball players from 30 MLB clubs and their 230 minor league affiliates. Additional details on this population of professional baseball players have been published elsewhere.5 Only injuries that result in time out of play (≥1 day missed) are included in the database, and they are logged with basic information such as region of the body, diagnosis, date, player position, activity leading to injury, and general treatment. Any injury that affects participation in any aspect of baseball-related activity (eg, game, practice, warm-up, conditioning, weight training) is captured in HITS.
All baseball-related knee injuries occurring during the 2011-2014 seasons that resulted in time out of sport were included in the study. These injuries were identified based on the Sports Medicine Diagnostic Coding System (SMDCS) to capture injuries by diagnostic groups.18 Knee injuries were included if they occurred during spring training, regular season, or postseason play. Offseason injuries were not included. Injury events that were classified as “season-ending” were not included in the analysis of days missed because many of these players may not have been cleared to play until the beginning of the following season. To determine the proportion of knee injuries during the study period, all injuries were included for comparative purposes (subdivided based on 30 anatomic regions or types).
For each knee injury, a number of variables were analyzed, including diagnosis, level of play (MLB vs. MiLB), age, player position at the time of injury (pitcher, catcher, infield, outfield, base runner, or batter), field location where the injury occurred (home plate, pitcher’s mound, infield, outfield, foul territory or bullpen, or other), mechanism of injury, days missed, and treatment rendered (conservative vs surgical). The classification used to describe the mechanism of injury consisted of contact with ball, contact with ground, contact with another player, contact with another object, or noncontact.
Statistical Analysis Epidemiologic data are presented with descriptive statistics such as mean, median, frequency, and percentage where appropriate. When comparing player age, days missed, and surgical vs nonsurgical treatment between MLB and MiLB players, t-tests and tests for difference in proportions were applied as appropriate. Statistical significance was established for P values < .05.
The distribution of days missed for the variables considered was often skewed to the right (ie, days missed mostly concentrated on the low to moderate number of days, with fewer values in the much higher days missed range), even after excluding the season-ending injuries; hence the mean (or average) days missed was often larger than the median days missed. Reporting the median would allow for a robust estimate of the expected number of days missed, but would down weight those instances when knee injuries result in much longer missed days, as reflected by the mean. Because of the importance of the days missed measure for professional baseball, both the mean and median are presented.
In order to estimate exposure, the average number of players per team per game was calculated based on analysis of regular season game participation via box scores. This average number over a season, multiplied by the number of team games at each professional level of baseball, was used as an estimate of athlete exposures in order to provide rates comparable to those of other injury surveillance systems. Injury rates were reported as injuries per 1000 athlete-exposures (AE) for those knee injuries that occurred during the regular season. It should be noted that the number of regular season knee injuries and the subsequent AE rates are based on injuries that were deemed work-related during the regular season. This does not necessarily only include injuries occurring during the course of a game, but injuries in game preparation as well. Due to the variations in spring training games and fluctuating rosters, an exposure rate could not be calculated for spring training knee injuries.
RESULTS
Overall Summary
Of the 30 general body regions/systems included in the HITS database, injuries to the knee were the fifth most common reason for days missed in all of professional baseball from 2011-2014 (Table 1). Injuries to the knee represented 6.5% of the nearly 34,000 injuries sustained during the study period. Knee injuries were the fifth most common reason for time out of play for players in both the MiLB and MLB.
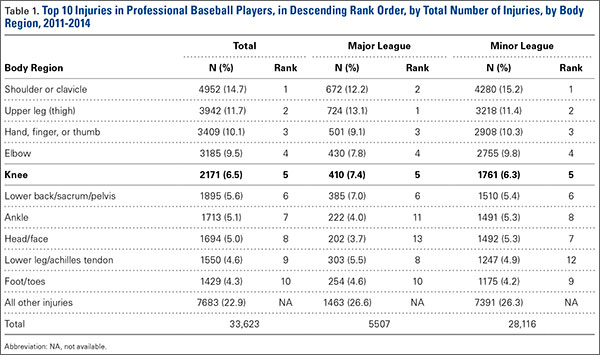
A total of 2171 isolated knee injuries resulted in time out of sport for professional baseball players (Table 2). Of these, 410 (19%) occurred in MLB players and 1761 (81%) occurred in MiLB players. MLB players were older than MiLB players at the time of injury (29.5 vs 22.8 years, respectively). Overall mean number of days missed was 16.2 days per knee injury, with MLB players missing an approximately 7 days more per injury than MiLB athletes (21.8 vs. 14.9 days respectively; P = .001).Over the course of the 4 seasons, a total of 30,449 days were missed due to knee injuries in professional baseball, giving an average rate of 7612 days lost per season. Surgery was performed for 263 (12.1%) of the 2171 knee injuries, with a greater proportion of MLB players requiring surgery than MiLB players (17.3% vs 10.9%) (P < .001). With respect to number of days missed per injury, 26% of knee injuries in the minor leagues resulted in greater than 30 days missed, while this number rose to 32% for knee injuries in MLB players (Table 3).
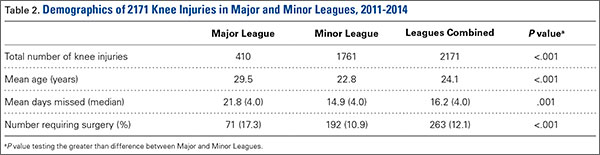
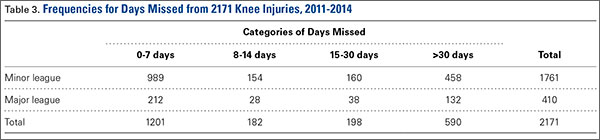
For regular season games, it was estimated that there were 1,197,738 MiLB and 276,608 MLB AE, respectively, over the course of the 4 seasons (2011-2014). The overall knee injury rate across both the MiLB and MLB was 1.2 per 1000 AE, based on the subset of 308 and 1473 regular season knee injuries in MiLB and MLB, respectively. The rate of knee injury was similar and not significantly different between the MiLB and MLB (1.2 per 1000 AE in the MiLB and 1.1 per 1000 AE in the MLB).
Characteristics of Injuries
When considering the position of the player during injury, defensive players were most frequently injured (n = 742, 56.5%), with pitchers (n = 227, 17.3%), infielders (n =193, 14.7%), outfielders (n = 193, 14.7%), and catchers (n = 129, 9.8%) sustaining injuries in decreasing frequency. Injuries while on offense (n = 571, 43.5%) were most frequent in base runners (n = 320, 24.4%) followed by batters (n = 251, 19.1%) (Table 4). Injuries while on defense occurring in infielders and catchers resulted in the longest period of time away from play (average of 22.4 and 20.8 days missed, respectively), while those occurring in batters resulted in the least average days missed (8.9 days).
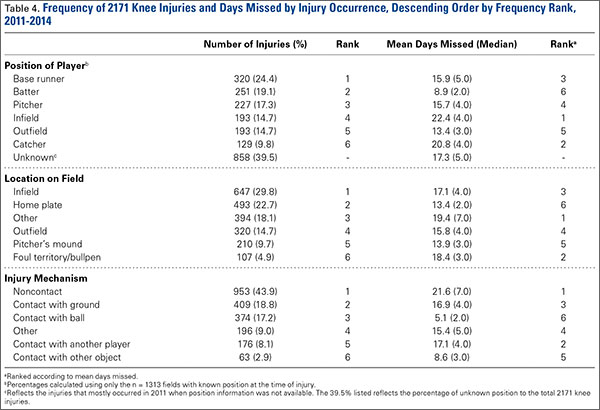
The most common field location for knee injuries to occur was the infield, which was responsible for n = 647 (29.8%) of the total knee injuries (Table 4). This was followed by home plate (n = 493, 22.7%), other locations outside those specified (n = 394, 18.1%), outfield (n = 320, 14.7%), pitcher’s mound (n = 210, 9.7%), and foul territory or the bullpen (n = 107, 4.9%). Of the knee injuries with a specified location, those occurring in foul territory or the bullpen resulted in the highest mean days missed (18.4), while those occurring at home plate resulted in the least mean days missed (13.4 days).
When analyzed by mechanism of injury, noncontact injuries (n = 953, 43.9%) were more common than being hit with the ball (n = 374, 17.2%), striking the ground (n = 409, 18.8%), other mechanisms not listed (n = 196, 9%), contact with another player (n = 176, 8.1%), or contact with other objects (n = 63, 2.9%) (Table 4). Noncontact injuries and player to player collisions resulted in the greatest number of missed days (21.6 and 17.1 days, respectively) while being struck by the ball resulted in the least mean days missed (5.1).
Of the n = 493 knee injuries occurring at home plate, n = 212 (43%) occurred to the batter, n = 100 (20%) to the catcher, n = 34 (6.9%) to base runners, and n = 7 (1.4%) to pitchers (Table 5). The majority of knee injuries in the infield occurred to base runners (n = 283, 43.7%). Player-to-player collisions at home plate were responsible for 51 (2.3%) knee injuries, while 163 (24%) were noncontact injuries and 376 (56%) were the result of a player being hit by the ball (Table 5).
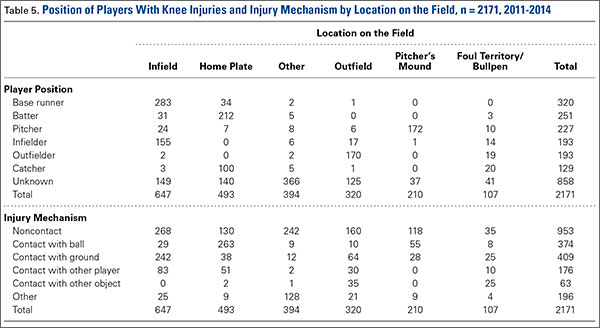
Injury Diagnosis
By diagnosis, the most common knee injuries observed were contusions or hematomas (n = 662, 30.5%), other injuries (n = 415, 19.1%), sprains or ligament injuries (n = 380, 17.5%), tendinopathies or bursitis (n = 367, 16.9%), and meniscal or cartilage injury (n = 200, 9.2%) (Table 6). Injuries resulting in the greatest mean number of days missed included meniscal or cartilage injuries (44 days), sprains or ligament injuries (30 days), or dislocations (22 days).
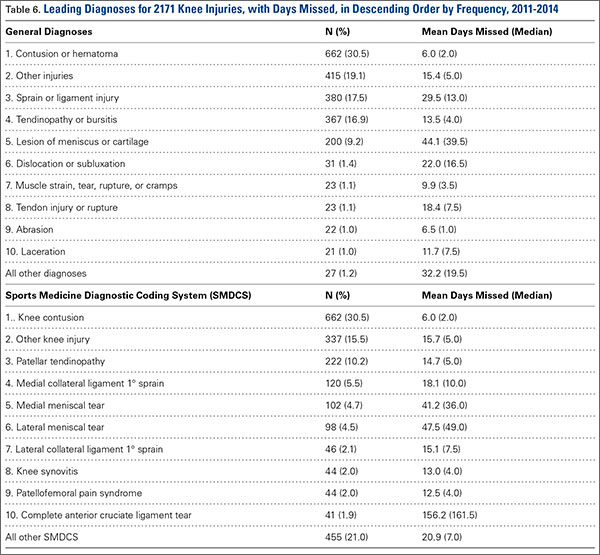
Based on specific SMDCS descriptors, the most frequent knee injuries reported were contusion (n = 662, 30.5%), patella tendinopathy (n = 222, 10.2%), and meniscal tears (n = 200, 9.2%) (Table 6). Complete anterior cruciate ligament tears, although infrequent, were responsible for the greatest mean days missed (156.2 days). This was followed by lateral meniscus tears (47.5 days) and medial meniscus tears (41.2 days). Knee contusions, although very common, resulted in the least number of days missed (6.0 days).
Discussion
Although much is known about knee injuries in other professional athletic leagues, little is known about knee injuries in professional baseball players.2-4 The majority of epidemiologic studies regarding baseball players at any level emphasizes the study of shoulder and elbow injuries.3,4,19 Since the implementation of the electronic medical record and the HITS database in professional baseball, there has been increased effort to document injuries that have received less attention in the existing literature. Understanding the epidemiology of these injuries is important for the development of targeted prevention efforts.
Prior studies of injuries in professional baseball relied on data captured by the publicly available DL. Posner and colleagues2 provide one of the most comprehensive reports on MLB injuries in a report utilizing DL assignment data over a period of 7 seasons.They demonstrated that knee injuries were responsible for 7.7% (12.5% for fielders and 3.7% for pitchers) of assignments to the DL. The current study utilized a comprehensive surveillance and builds on this existing knowledge. The present study found similar trends to Posner and colleagues2 in that knee injuries were responsible for 6.5% of injuries in professional baseball players that resulted in missed games. From the 2002 season to the 2008 season, knee injuries were the fifth most common reason MLB players were placed on the DL,2 and the current study indicates that they remain the fifth most common reason for missed time from play based on the HITS data. Since the prevalence of these injuries have remained constant since the 2002 season, efforts to better understand these injuries are warranted in order to identify strategies to prevent them. These analyses have generated important data towards achieving this understanding.
As with most injuries in professional sports, goals for treatment are aimed at maximizing patient function and performance while minimizing time out of play. For the 2011-2014 professional baseball seasons, a total of 2171 players sustained knee injuries and missed an average of 16.2 days per injury. Knee injuries were responsible for a total of 7612 days of missed work for MLB and MiLB players per season (30,449 days over the 4-season study period). This is equivalent to a total of 20.9 years of players’ time lost in professional baseball per season over the last 4 years. The implications of this amount of time away from sport are significant, and further study should be targeted at prevention of these injuries and optimizing return to play times.
When attempting to reduce the burden of knee injuries in professional baseball, it may prove beneficial to first understand how the injuries occur, where on the field, and who is at greatest risk. From 2011 to 2014, nearly 44% of knee injuries occurred by noncontact mechanisms. Among all locations on the field where knee injuries occurred, those occurring in the infield were responsible for the greatest mean days missed. The players who seem to be at greatest risk for knee injuries appear to be base runners. These data suggest the need for prevention efforts targeting base runners and infield players, as well as players in MiLB, where the largest number of injuries occurred.
Recently, playing rules implemented by MLB after consultation with players have focused on reducing the number of player-to-player collisions at home plate in an attempt to decrease the injury burden to catchers and base runners.20 This present analysis suggests that this rule change may also reduce the occurrence of knee injuries, as player collisions at home plate were responsible for a total of 51 knee injuries during the study period. The impact of this rule change on injury rates should also be explored. Interestingly, of the 51 knees injuries occurring due to contact at home plate, 23 occurred in 2011, and only 2 occurred in 2014—the first year of the new rule. Additional areas that resulted in high numbers of knee injuries were player-to-player contact in the infield and player contact with the ground in the infield.
Attempting to reduce injury burden and time out of play related to knee injuries in professional baseball players will likely prove to be a difficult task. In order to generate meaningful improvement, a comprehensive approach that involves players, management, trainers, therapists, and physicians will likely be required. As the first report of the epidemiology of knee injuries in professional baseball players, this study is one important step in that process. The strengths of this study are its comprehensive nature that analyzes injuries from an entire population of players on more than 200 teams over a 3-year period. Also, this research is strengthened by its focus on one particular region of the body that has received limited attention in the empirical literature, but represents a significant source of lost time during the baseball season.
There are some limitations to this study. As with any injury surveillance system, there is the possibility that not all cases were captured. Additionally, since the surveillance system is based on data from multiple teams, data entry discrepancy is possible; however, the presence of dropdown boxes and systematic definitions for injuries reduces this risk. Finally, this study did not investigate the various treatments for knee injuries beyond whether or not the injury required surgery. Since this was the first comprehensive exploration of knee injuries in professional baseball, future studies are needed to explore additional facets including outcomes related to treatment, return to play, and performance.
Conclusion
Knee injuries represent 6.5% of all injuries in professional baseball, occurring at a rate of 1.3 per 1000 AE. The burden of these injuries is significant for professional baseball players. This study fills a critical gap in sports injury research by contributing to the knowledge about the effect of knee injuries in professional baseball. It also provides an important foundation for future epidemiologic inquiry to identify modifiable risk factors and interventions that may reduce the impact of these injuries in athletes.
1. Conte S, Requa RK, Garrick JG. Disability days in major league baseball. Am J Sports Med. 2001;29(4):431-436.
2. Posner M, Cameron KL, Wolf JM, Belmont PJ Jr, Owens BD. Epidemiology of Major League Baseball injuries. Am J Sports Med. 2011;39(8):1676-1680.
3. Dick R, Sauers EL, Agel J, et al. Descriptive epidemiology of collegiate men’s baseball injuries: National Collegiate Athletic Association Injury Surveillance System, 1988-1989 through 2003-2004. J Athletic Training. 2007;42(2):183-193.
4. Makhni EC, Buza JA, Byram I, Ahmad CS. Sports reporting: A comprehensive review of the medical literature regarding North American professional sports. Phys Sportsmed. 2014;42(2):154-162.
5. Ahmad CS, Dick RW, Snell E, et al. Major and Minor League Baseball hamstring injuries: epidemiologic findings from the Major League Baseball Injury Surveillance System. Am J Sports Med. 2014;42(6):1464-1470.
6. Aune KT, Andrews JR, Dugas JR, Cain EL Jr. Return to play after partial lateral meniscectomy in National Football League Athletes. Am J Sports Med. 2014;42(8):1865-1872.
7. Brophy RH, Gill CS, Lyman S, Barnes RP, Rodeo SA, Warren RF. Effect of anterior cruciate ligament reconstruction and meniscectomy on length of career in National Football League athletes: a case control study. Am J Sports Med. 2009;37(11):2102-2107.
8. Brophy RH, Rodeo SA, Barnes RP, Powell JW, Warren RF. Knee articular cartilage injuries in the National Football League: epidemiology and treatment approach by team physicians. J Knee Surg. 2009;22(4):331-338.
9. Cerynik DL, Lewullis GE, Joves BC, Palmer MP, Tom JA. Outcomes of microfracture in professional basketball players. Knee Surg Sports Traumatol Arthrosc. 2009;17(9):1135-1139.
10. Hershman EB, Anderson R, Bergfeld JA, et al; National Football League Injury and Safety Panel. An analysis of specific lower extremity injury rates on grass and FieldTurf playing surfaces in National Football League Games: 2000-2009 seasons. Am J Sports Med. 2012;40(10):2200-2205.
11. Namdari S, Baldwin K, Anakwenze O, Park MJ, Huffman GR, Sennett BJ. Results and performance after microfracture in National Basketball Association athletes. Am J Sports Med. 2009;37(5):943-948.
12. Yeh PC, Starkey C, Lombardo S, Vitti G, Kharrazi FD. Epidemiology of isolated meniscal injury and its effect on performance in athletes from the National Basketball Association. Am J Sports Med. 2012;40(3):589-594.
13. Pollack KM, D’Angelo J, Green G, et al. Developing and implementing major league baseball’s health and injury tracking system. Am J Epidem. (accepted), 2016.
14. Green GA, Pollack KM, D’Angelo J, et al. Mild traumatic brain injury in major and Minor League Baseball players. Am J Sports Med. 2015;43(5):1118-1126.
15. Dick R, Agel J, Marshall SW. National Collegiate Athletic Association Injury Surveillance System commentaries: introduction and methods. J Athletic Training. 2007;42(2):173-182.
16. Pellman EJ, Viano DC, Casson IR, Arfken C, Feuer H. Concussion in professional football players returning to the same game—part 7. Neurosurg. 2005;56(1):79-90.
17. Stevens ST, Lassonde M, De Beaumont L, Keenan JP. The effect of visors on head and facial injury in national hockey league players. J Sci Med Sport. 2006;9(3):238-242.
18. Meeuwisse WH, Wiley JP. The sport medicine diagnostic coding system. Clin J Sport Med. 2007;17(3):205-207.
19. Mcfarland EG, Wasik M. Epidemiology of collegiate baseball injuries. Clin J Sport Med. 1998;8(1):10-13.
20. Hagen P. New rule on home-plate collisions put into effect. Major League Baseball website. http://m.mlb.com/news/article/68267610/mlb-institutes-new-rule-on-home-plate-collisions. Accessed December 5, 2014.
Injuries among professional baseball players have been on the rise for several years.1,2 From 1989 to 1999, the number of disabled list (DL) reports increased 38% (266 to 367 annual reports),1 and a similar increase in injury rates was noted from the 2002 to the 2008 seasons (37%).2 These injuries have important implications for future injury risk and time away from play. Identifying these injuries and determining correlates and risk factors is important for targeted prevention efforts.
Several studies have explored the prevalence of upper extremity injuries in professional and collegiate baseball players;2-4 however, detailed epidemiology of knee injuries in Major League Baseball (MLB) and Minor League Baseball (MiLB) players is lacking. Much more is known about the prevalence, treatment, and outcomes of knee injuries in other professional sporting organizations, such as the National Basketball Association (NBA), National Football League (NFL), and National Hockey League (NHL).4-12 A recent meta-analysis exploring injuries in professional athletes found that studies on lower extremity injuries comprised approximately 12% of the literature reporting injuries in MLB players.4 In other professional leagues, publications on lower extremity injuries comprise approximately 56% of the sports medicine literature in the NFL, 54% in the NBA, and 62% in the NHL.4 Since few studies have investigated lower extremity injuries among professional baseball players, there is an opportunity for additional research to guide evidence-based prevention strategies.
A better understanding of the nature of these injuries is one of the first steps towards developing targeted injury prevention programs and treatment algorithms. The study of injury epidemiology among professional baseball players has been aided by the creation of an injury tracking system initiated by the MLB, its minor league affiliates, and the Major League Baseball Players Association.5,13,14 This surveillance system allows for the tracking of medical histories and injuries to players as they move across major and minor league organizations. Similar systems have been utilized in the National Collegiate Athletic Association and other professional sports organizations.3,15-17 A unique advantage of the MLB surveillance system is the required participation of all major and minor league teams, which allows for investigation of the entire population of players rather than simply a sample of players from select teams. This system has propelled an effort to identify injury patterns as a means of developing appropriate targets for potential preventative measures.5
The purpose of this descriptive epidemiologic study is to better understand the distribution and characteristics of knee injuries in these elite athletes by reporting on all knee injuries occurring over a span of 4 seasons (2011-2014). Additionally, this study seeks to characterize the impact of these injuries by analyzing the time required for return to play and the treatments rendered (surgical and nonsurgical).
Materials and Methods
After approval from the Johns Hopkins Bloomberg School of Public Health Institutional Review Board, detailed data regarding knee injuries in both MLB and MiLB baseball players were extracted from the de-identified MLB Health and Injury Tracking System (HITS). The HITS database is a centralized database that contains data on injuries from an electronic medical record (EMR). All players provided consent to have their data included in this EMR. HITS system captures injuries reported by the athletic trainers for all professional baseball players from 30 MLB clubs and their 230 minor league affiliates. Additional details on this population of professional baseball players have been published elsewhere.5 Only injuries that result in time out of play (≥1 day missed) are included in the database, and they are logged with basic information such as region of the body, diagnosis, date, player position, activity leading to injury, and general treatment. Any injury that affects participation in any aspect of baseball-related activity (eg, game, practice, warm-up, conditioning, weight training) is captured in HITS.
All baseball-related knee injuries occurring during the 2011-2014 seasons that resulted in time out of sport were included in the study. These injuries were identified based on the Sports Medicine Diagnostic Coding System (SMDCS) to capture injuries by diagnostic groups.18 Knee injuries were included if they occurred during spring training, regular season, or postseason play. Offseason injuries were not included. Injury events that were classified as “season-ending” were not included in the analysis of days missed because many of these players may not have been cleared to play until the beginning of the following season. To determine the proportion of knee injuries during the study period, all injuries were included for comparative purposes (subdivided based on 30 anatomic regions or types).
For each knee injury, a number of variables were analyzed, including diagnosis, level of play (MLB vs. MiLB), age, player position at the time of injury (pitcher, catcher, infield, outfield, base runner, or batter), field location where the injury occurred (home plate, pitcher’s mound, infield, outfield, foul territory or bullpen, or other), mechanism of injury, days missed, and treatment rendered (conservative vs surgical). The classification used to describe the mechanism of injury consisted of contact with ball, contact with ground, contact with another player, contact with another object, or noncontact.
Statistical Analysis Epidemiologic data are presented with descriptive statistics such as mean, median, frequency, and percentage where appropriate. When comparing player age, days missed, and surgical vs nonsurgical treatment between MLB and MiLB players, t-tests and tests for difference in proportions were applied as appropriate. Statistical significance was established for P values < .05.
The distribution of days missed for the variables considered was often skewed to the right (ie, days missed mostly concentrated on the low to moderate number of days, with fewer values in the much higher days missed range), even after excluding the season-ending injuries; hence the mean (or average) days missed was often larger than the median days missed. Reporting the median would allow for a robust estimate of the expected number of days missed, but would down weight those instances when knee injuries result in much longer missed days, as reflected by the mean. Because of the importance of the days missed measure for professional baseball, both the mean and median are presented.
In order to estimate exposure, the average number of players per team per game was calculated based on analysis of regular season game participation via box scores. This average number over a season, multiplied by the number of team games at each professional level of baseball, was used as an estimate of athlete exposures in order to provide rates comparable to those of other injury surveillance systems. Injury rates were reported as injuries per 1000 athlete-exposures (AE) for those knee injuries that occurred during the regular season. It should be noted that the number of regular season knee injuries and the subsequent AE rates are based on injuries that were deemed work-related during the regular season. This does not necessarily only include injuries occurring during the course of a game, but injuries in game preparation as well. Due to the variations in spring training games and fluctuating rosters, an exposure rate could not be calculated for spring training knee injuries.
RESULTS
Overall Summary
Of the 30 general body regions/systems included in the HITS database, injuries to the knee were the fifth most common reason for days missed in all of professional baseball from 2011-2014 (Table 1). Injuries to the knee represented 6.5% of the nearly 34,000 injuries sustained during the study period. Knee injuries were the fifth most common reason for time out of play for players in both the MiLB and MLB.
A total of 2171 isolated knee injuries resulted in time out of sport for professional baseball players (Table 2). Of these, 410 (19%) occurred in MLB players and 1761 (81%) occurred in MiLB players. MLB players were older than MiLB players at the time of injury (29.5 vs 22.8 years, respectively). Overall mean number of days missed was 16.2 days per knee injury, with MLB players missing an approximately 7 days more per injury than MiLB athletes (21.8 vs. 14.9 days respectively; P = .001).Over the course of the 4 seasons, a total of 30,449 days were missed due to knee injuries in professional baseball, giving an average rate of 7612 days lost per season. Surgery was performed for 263 (12.1%) of the 2171 knee injuries, with a greater proportion of MLB players requiring surgery than MiLB players (17.3% vs 10.9%) (P < .001). With respect to number of days missed per injury, 26% of knee injuries in the minor leagues resulted in greater than 30 days missed, while this number rose to 32% for knee injuries in MLB players (Table 3).
For regular season games, it was estimated that there were 1,197,738 MiLB and 276,608 MLB AE, respectively, over the course of the 4 seasons (2011-2014). The overall knee injury rate across both the MiLB and MLB was 1.2 per 1000 AE, based on the subset of 308 and 1473 regular season knee injuries in MiLB and MLB, respectively. The rate of knee injury was similar and not significantly different between the MiLB and MLB (1.2 per 1000 AE in the MiLB and 1.1 per 1000 AE in the MLB).
Characteristics of Injuries
When considering the position of the player during injury, defensive players were most frequently injured (n = 742, 56.5%), with pitchers (n = 227, 17.3%), infielders (n =193, 14.7%), outfielders (n = 193, 14.7%), and catchers (n = 129, 9.8%) sustaining injuries in decreasing frequency. Injuries while on offense (n = 571, 43.5%) were most frequent in base runners (n = 320, 24.4%) followed by batters (n = 251, 19.1%) (Table 4). Injuries while on defense occurring in infielders and catchers resulted in the longest period of time away from play (average of 22.4 and 20.8 days missed, respectively), while those occurring in batters resulted in the least average days missed (8.9 days).
The most common field location for knee injuries to occur was the infield, which was responsible for n = 647 (29.8%) of the total knee injuries (Table 4). This was followed by home plate (n = 493, 22.7%), other locations outside those specified (n = 394, 18.1%), outfield (n = 320, 14.7%), pitcher’s mound (n = 210, 9.7%), and foul territory or the bullpen (n = 107, 4.9%). Of the knee injuries with a specified location, those occurring in foul territory or the bullpen resulted in the highest mean days missed (18.4), while those occurring at home plate resulted in the least mean days missed (13.4 days).
When analyzed by mechanism of injury, noncontact injuries (n = 953, 43.9%) were more common than being hit with the ball (n = 374, 17.2%), striking the ground (n = 409, 18.8%), other mechanisms not listed (n = 196, 9%), contact with another player (n = 176, 8.1%), or contact with other objects (n = 63, 2.9%) (Table 4). Noncontact injuries and player to player collisions resulted in the greatest number of missed days (21.6 and 17.1 days, respectively) while being struck by the ball resulted in the least mean days missed (5.1).
Of the n = 493 knee injuries occurring at home plate, n = 212 (43%) occurred to the batter, n = 100 (20%) to the catcher, n = 34 (6.9%) to base runners, and n = 7 (1.4%) to pitchers (Table 5). The majority of knee injuries in the infield occurred to base runners (n = 283, 43.7%). Player-to-player collisions at home plate were responsible for 51 (2.3%) knee injuries, while 163 (24%) were noncontact injuries and 376 (56%) were the result of a player being hit by the ball (Table 5).
Injury Diagnosis
By diagnosis, the most common knee injuries observed were contusions or hematomas (n = 662, 30.5%), other injuries (n = 415, 19.1%), sprains or ligament injuries (n = 380, 17.5%), tendinopathies or bursitis (n = 367, 16.9%), and meniscal or cartilage injury (n = 200, 9.2%) (Table 6). Injuries resulting in the greatest mean number of days missed included meniscal or cartilage injuries (44 days), sprains or ligament injuries (30 days), or dislocations (22 days).
Based on specific SMDCS descriptors, the most frequent knee injuries reported were contusion (n = 662, 30.5%), patella tendinopathy (n = 222, 10.2%), and meniscal tears (n = 200, 9.2%) (Table 6). Complete anterior cruciate ligament tears, although infrequent, were responsible for the greatest mean days missed (156.2 days). This was followed by lateral meniscus tears (47.5 days) and medial meniscus tears (41.2 days). Knee contusions, although very common, resulted in the least number of days missed (6.0 days).
Discussion
Although much is known about knee injuries in other professional athletic leagues, little is known about knee injuries in professional baseball players.2-4 The majority of epidemiologic studies regarding baseball players at any level emphasizes the study of shoulder and elbow injuries.3,4,19 Since the implementation of the electronic medical record and the HITS database in professional baseball, there has been increased effort to document injuries that have received less attention in the existing literature. Understanding the epidemiology of these injuries is important for the development of targeted prevention efforts.
Prior studies of injuries in professional baseball relied on data captured by the publicly available DL. Posner and colleagues2 provide one of the most comprehensive reports on MLB injuries in a report utilizing DL assignment data over a period of 7 seasons.They demonstrated that knee injuries were responsible for 7.7% (12.5% for fielders and 3.7% for pitchers) of assignments to the DL. The current study utilized a comprehensive surveillance and builds on this existing knowledge. The present study found similar trends to Posner and colleagues2 in that knee injuries were responsible for 6.5% of injuries in professional baseball players that resulted in missed games. From the 2002 season to the 2008 season, knee injuries were the fifth most common reason MLB players were placed on the DL,2 and the current study indicates that they remain the fifth most common reason for missed time from play based on the HITS data. Since the prevalence of these injuries have remained constant since the 2002 season, efforts to better understand these injuries are warranted in order to identify strategies to prevent them. These analyses have generated important data towards achieving this understanding.
As with most injuries in professional sports, goals for treatment are aimed at maximizing patient function and performance while minimizing time out of play. For the 2011-2014 professional baseball seasons, a total of 2171 players sustained knee injuries and missed an average of 16.2 days per injury. Knee injuries were responsible for a total of 7612 days of missed work for MLB and MiLB players per season (30,449 days over the 4-season study period). This is equivalent to a total of 20.9 years of players’ time lost in professional baseball per season over the last 4 years. The implications of this amount of time away from sport are significant, and further study should be targeted at prevention of these injuries and optimizing return to play times.
When attempting to reduce the burden of knee injuries in professional baseball, it may prove beneficial to first understand how the injuries occur, where on the field, and who is at greatest risk. From 2011 to 2014, nearly 44% of knee injuries occurred by noncontact mechanisms. Among all locations on the field where knee injuries occurred, those occurring in the infield were responsible for the greatest mean days missed. The players who seem to be at greatest risk for knee injuries appear to be base runners. These data suggest the need for prevention efforts targeting base runners and infield players, as well as players in MiLB, where the largest number of injuries occurred.
Recently, playing rules implemented by MLB after consultation with players have focused on reducing the number of player-to-player collisions at home plate in an attempt to decrease the injury burden to catchers and base runners.20 This present analysis suggests that this rule change may also reduce the occurrence of knee injuries, as player collisions at home plate were responsible for a total of 51 knee injuries during the study period. The impact of this rule change on injury rates should also be explored. Interestingly, of the 51 knees injuries occurring due to contact at home plate, 23 occurred in 2011, and only 2 occurred in 2014—the first year of the new rule. Additional areas that resulted in high numbers of knee injuries were player-to-player contact in the infield and player contact with the ground in the infield.
Attempting to reduce injury burden and time out of play related to knee injuries in professional baseball players will likely prove to be a difficult task. In order to generate meaningful improvement, a comprehensive approach that involves players, management, trainers, therapists, and physicians will likely be required. As the first report of the epidemiology of knee injuries in professional baseball players, this study is one important step in that process. The strengths of this study are its comprehensive nature that analyzes injuries from an entire population of players on more than 200 teams over a 3-year period. Also, this research is strengthened by its focus on one particular region of the body that has received limited attention in the empirical literature, but represents a significant source of lost time during the baseball season.
There are some limitations to this study. As with any injury surveillance system, there is the possibility that not all cases were captured. Additionally, since the surveillance system is based on data from multiple teams, data entry discrepancy is possible; however, the presence of dropdown boxes and systematic definitions for injuries reduces this risk. Finally, this study did not investigate the various treatments for knee injuries beyond whether or not the injury required surgery. Since this was the first comprehensive exploration of knee injuries in professional baseball, future studies are needed to explore additional facets including outcomes related to treatment, return to play, and performance.
Conclusion
Knee injuries represent 6.5% of all injuries in professional baseball, occurring at a rate of 1.3 per 1000 AE. The burden of these injuries is significant for professional baseball players. This study fills a critical gap in sports injury research by contributing to the knowledge about the effect of knee injuries in professional baseball. It also provides an important foundation for future epidemiologic inquiry to identify modifiable risk factors and interventions that may reduce the impact of these injuries in athletes.
1. Conte S, Requa RK, Garrick JG. Disability days in major league baseball. Am J Sports Med. 2001;29(4):431-436.
2. Posner M, Cameron KL, Wolf JM, Belmont PJ Jr, Owens BD. Epidemiology of Major League Baseball injuries. Am J Sports Med. 2011;39(8):1676-1680.
3. Dick R, Sauers EL, Agel J, et al. Descriptive epidemiology of collegiate men’s baseball injuries: National Collegiate Athletic Association Injury Surveillance System, 1988-1989 through 2003-2004. J Athletic Training. 2007;42(2):183-193.
4. Makhni EC, Buza JA, Byram I, Ahmad CS. Sports reporting: A comprehensive review of the medical literature regarding North American professional sports. Phys Sportsmed. 2014;42(2):154-162.
5. Ahmad CS, Dick RW, Snell E, et al. Major and Minor League Baseball hamstring injuries: epidemiologic findings from the Major League Baseball Injury Surveillance System. Am J Sports Med. 2014;42(6):1464-1470.
6. Aune KT, Andrews JR, Dugas JR, Cain EL Jr. Return to play after partial lateral meniscectomy in National Football League Athletes. Am J Sports Med. 2014;42(8):1865-1872.
7. Brophy RH, Gill CS, Lyman S, Barnes RP, Rodeo SA, Warren RF. Effect of anterior cruciate ligament reconstruction and meniscectomy on length of career in National Football League athletes: a case control study. Am J Sports Med. 2009;37(11):2102-2107.
8. Brophy RH, Rodeo SA, Barnes RP, Powell JW, Warren RF. Knee articular cartilage injuries in the National Football League: epidemiology and treatment approach by team physicians. J Knee Surg. 2009;22(4):331-338.
9. Cerynik DL, Lewullis GE, Joves BC, Palmer MP, Tom JA. Outcomes of microfracture in professional basketball players. Knee Surg Sports Traumatol Arthrosc. 2009;17(9):1135-1139.
10. Hershman EB, Anderson R, Bergfeld JA, et al; National Football League Injury and Safety Panel. An analysis of specific lower extremity injury rates on grass and FieldTurf playing surfaces in National Football League Games: 2000-2009 seasons. Am J Sports Med. 2012;40(10):2200-2205.
11. Namdari S, Baldwin K, Anakwenze O, Park MJ, Huffman GR, Sennett BJ. Results and performance after microfracture in National Basketball Association athletes. Am J Sports Med. 2009;37(5):943-948.
12. Yeh PC, Starkey C, Lombardo S, Vitti G, Kharrazi FD. Epidemiology of isolated meniscal injury and its effect on performance in athletes from the National Basketball Association. Am J Sports Med. 2012;40(3):589-594.
13. Pollack KM, D’Angelo J, Green G, et al. Developing and implementing major league baseball’s health and injury tracking system. Am J Epidem. (accepted), 2016.
14. Green GA, Pollack KM, D’Angelo J, et al. Mild traumatic brain injury in major and Minor League Baseball players. Am J Sports Med. 2015;43(5):1118-1126.
15. Dick R, Agel J, Marshall SW. National Collegiate Athletic Association Injury Surveillance System commentaries: introduction and methods. J Athletic Training. 2007;42(2):173-182.
16. Pellman EJ, Viano DC, Casson IR, Arfken C, Feuer H. Concussion in professional football players returning to the same game—part 7. Neurosurg. 2005;56(1):79-90.
17. Stevens ST, Lassonde M, De Beaumont L, Keenan JP. The effect of visors on head and facial injury in national hockey league players. J Sci Med Sport. 2006;9(3):238-242.
18. Meeuwisse WH, Wiley JP. The sport medicine diagnostic coding system. Clin J Sport Med. 2007;17(3):205-207.
19. Mcfarland EG, Wasik M. Epidemiology of collegiate baseball injuries. Clin J Sport Med. 1998;8(1):10-13.
20. Hagen P. New rule on home-plate collisions put into effect. Major League Baseball website. http://m.mlb.com/news/article/68267610/mlb-institutes-new-rule-on-home-plate-collisions. Accessed December 5, 2014.
VIDEO: Stenting in asymptomatic patients noninferior to endarterectomy at 5 years
LOS ANGELES – In asymptomatic patients under 80 years old, carotid stenting and endarterectomy perform equally as well for severe carotid stenosis out to 5 years, according to a randomized trial published online in the New England Journal of Medicine.
Overall, 1,032 patients were stented, and 343 had endarterectomies in the trial, called Asymptomatic Carotid Trial I (ACT I). If stenting didn’t look safe on postrandomization angiography, patients were given the option of medical management or crossover into the surgical group. The subjects all had bifurcation carotid stenosis blocking at least 70% of the lumen. None were at high risk for surgical complications. “Asymptomatic” meant they hadn’t had a stroke, transient ischemic attack, or amaurosis fugax in the 6 months before enrollment. Stenting and endarterectomy were done by physicians and centers well experienced in the techniques (N Engl J Med. 2016 Feb 17. doi: 10.1056/NEJMoa1515706).
At 1 year, stenting was noninferior to endarterectomy for the primary composite endpoint of death, stroke, or myocardial infarction within 30 days after the procedure or ipsilateral stroke within 1 year; the event rate was 3.8% among stent patients and 3.4% among endarterectomy patients (P = .01 for noninferiority, with a noninferiority margin of 3 percentage points).
The cumulative 5-year stroke-free survival rate was 93.1% in the stenting group and 94.7% in the endarterectomy group (P = .44).
For now, the results mean that sometimes choosing between carotid endarterectomy or stenting (or medical management) has as much to do with patient and physician preference as medical science, raising the difficult question of how to choose. In a video interview at the International Stroke Conference, investigator Dr. Lawrence Wechsler, professor of neurology/neurosurgery and chair of the department of neurology at the University of Pittsburgh, shared his thoughts on that and the other implications of the study. The work was funded by Abbott Vascular.
The video associated with this article is no longer available on this site. Please view all of our videos on the MDedge YouTube channel
AT The INTERNATIONAL STROKE CONFERENCE

Acute Serpiginous Rash
The Diagnosis: Cutaneous Larva Migrans
Three punch biopsies were obtained. Spongiotic dermatitis with eosinophils was seen. There was a single specimen of tissue that showed a possible intraepidermal larva with a tract in the epidermis. The differential diagnosis included allergic contact dermatitis and arthropod bite eruption, among others, but clinical correlation made cutaneous larva migrans (CLM) the likely diagnosis.
The patient was treated empirically with albendazole 400 mg once daily for 3 days. In addition, he was prescribed triamcinolone for symptomatic relief and remained asymptomatic for 8 weeks at which time he presented again to the dermatology clinic with a similar rash in the same distribution. He was treated with a repeat course of albendazole and further educated on the etiology of the infection. The patient has not exhibited a recurrence after treatment of the second episode of CLM.
Cutaneous larva migrans is a dermatosis of the skin caused by the larvae of parasitic nematodes from the hookworm family, most commonly Ancylostoma caninum and Ancylostoma braziliense.1,2 These hookworms thrive in warm moist climates and are most frequently found in tropical coastal regions. They normally inhabit the intestines of animals such as dogs and cats and are transmitted to soil and sand via feces. Humans become accidental hosts through contact with the contaminated sand or soil3; however, the larvae are unable to penetrate deeper than the upper dermis of the skin in humans, subsequently limiting the infection. Because humans are accidental hosts, the larvae are unable to complete their life cycle and larval death occurs within weeks to months after the initial infection3; thus treatment may be unnecessary unless complications arise.
Cutaneous larva migrans is most commonly observed in travelers or inhabitants of tropical coastal regions but can occur anywhere in the world.1 Clinically, CLM presents as an enlarging, intensely pruritic, erythematous linear or serpiginous tract,3 most commonly on the hands, feet, abdomen, and buttocks.1 Complications may include allergic reactions, secondary bacterial infections, and hookworm folliculitis.4 Although rare, migration to the intestinal tract5 and/or hematological spread with Löffler syndrome has been described.6 Although this dermatological disease has been well described in the medical literature, it is not well recognized by Western physicians and is consequently either not diagnosed or misdiagnosed, leading to delays in treatment.4 Although the infection is usually self-limiting without treatment, the risk for prolonged active disease may occur, with 1 reported case lasting up to 18 months.4,5 The first indicator of CLM is intense pruritus localized to the site of infection.4 As the larvae migrate or creep, they create a lesion that may appear edematous with vesiculobullous lesions that are either serpiginous or linear.4 The differential diagnosis may include fungal infection, bacterial infection, and atypical herpes simplex infections; however, the key finding in CLM is the presence of undulating tracts localized to the borders of the lesion.2 Patients may report experiencing a stinging sensation prior to the formation of the erythematous scaly papule,5 which is attributed to the initial penetration of the larva into the skin. This development, accompanied with a history of travel to tropical or subtropical regions, should elicit CLM as a likely diagnosis. Because hookworms are a type of helminth, they likely elicit an eosinophilic immune response and thus peripheral eosinophilia may be present.5
Effective treatment of CLM is accomplished with oral albendazole 400 mg once daily for 3 to 7 days.2,7 Alternatively, oral ivermectin, topical thiabendazole, and cryosurgery can be used,2 though albendazole currently is the preferred treatment of CLM.7
- Hotez PJ, Brooker S, Bethony JM, et al. Hookworm infection. N Engl J Med. 2004;351:799-807.
- Roest MA, Ratnavel R. Cutaneous larva migrans contracted in England: a reminder. Clin Exp Dermatol. 2001;26:389-390.
- Blackwell V, Vega-Lopez F. Cutaneous larva migrans: clinical features and management of 44 cases presenting in the returning traveller. Br J Dermatol. 2001;145:434-437.
- Hochedez P, Caumes E. Hookworm-related cutaneous larva migrans. J Travel Med. 2007;14:326-333.
- Bravo F, Sanchez MR. New and re-emerging cutaneous infectious diseases in Latin America and other geographic areas. Dermatol Clin. 2003;21:655-668, viii.
- Guill MA, Odom RB. Larva migrans complicated by Loeffler’s syndrome. Arch Dermatol. 1978;114:1525-1526.
- Caumes E. Treatment of cutaneous larva migrans. Clin Infect Dis. 2000;30:811-814.
The Diagnosis: Cutaneous Larva Migrans
Three punch biopsies were obtained. Spongiotic dermatitis with eosinophils was seen. There was a single specimen of tissue that showed a possible intraepidermal larva with a tract in the epidermis. The differential diagnosis included allergic contact dermatitis and arthropod bite eruption, among others, but clinical correlation made cutaneous larva migrans (CLM) the likely diagnosis.
The patient was treated empirically with albendazole 400 mg once daily for 3 days. In addition, he was prescribed triamcinolone for symptomatic relief and remained asymptomatic for 8 weeks at which time he presented again to the dermatology clinic with a similar rash in the same distribution. He was treated with a repeat course of albendazole and further educated on the etiology of the infection. The patient has not exhibited a recurrence after treatment of the second episode of CLM.
Cutaneous larva migrans is a dermatosis of the skin caused by the larvae of parasitic nematodes from the hookworm family, most commonly Ancylostoma caninum and Ancylostoma braziliense.1,2 These hookworms thrive in warm moist climates and are most frequently found in tropical coastal regions. They normally inhabit the intestines of animals such as dogs and cats and are transmitted to soil and sand via feces. Humans become accidental hosts through contact with the contaminated sand or soil3; however, the larvae are unable to penetrate deeper than the upper dermis of the skin in humans, subsequently limiting the infection. Because humans are accidental hosts, the larvae are unable to complete their life cycle and larval death occurs within weeks to months after the initial infection3; thus treatment may be unnecessary unless complications arise.
Cutaneous larva migrans is most commonly observed in travelers or inhabitants of tropical coastal regions but can occur anywhere in the world.1 Clinically, CLM presents as an enlarging, intensely pruritic, erythematous linear or serpiginous tract,3 most commonly on the hands, feet, abdomen, and buttocks.1 Complications may include allergic reactions, secondary bacterial infections, and hookworm folliculitis.4 Although rare, migration to the intestinal tract5 and/or hematological spread with Löffler syndrome has been described.6 Although this dermatological disease has been well described in the medical literature, it is not well recognized by Western physicians and is consequently either not diagnosed or misdiagnosed, leading to delays in treatment.4 Although the infection is usually self-limiting without treatment, the risk for prolonged active disease may occur, with 1 reported case lasting up to 18 months.4,5 The first indicator of CLM is intense pruritus localized to the site of infection.4 As the larvae migrate or creep, they create a lesion that may appear edematous with vesiculobullous lesions that are either serpiginous or linear.4 The differential diagnosis may include fungal infection, bacterial infection, and atypical herpes simplex infections; however, the key finding in CLM is the presence of undulating tracts localized to the borders of the lesion.2 Patients may report experiencing a stinging sensation prior to the formation of the erythematous scaly papule,5 which is attributed to the initial penetration of the larva into the skin. This development, accompanied with a history of travel to tropical or subtropical regions, should elicit CLM as a likely diagnosis. Because hookworms are a type of helminth, they likely elicit an eosinophilic immune response and thus peripheral eosinophilia may be present.5
Effective treatment of CLM is accomplished with oral albendazole 400 mg once daily for 3 to 7 days.2,7 Alternatively, oral ivermectin, topical thiabendazole, and cryosurgery can be used,2 though albendazole currently is the preferred treatment of CLM.7
- Hotez PJ, Brooker S, Bethony JM, et al. Hookworm infection. N Engl J Med. 2004;351:799-807.
- Roest MA, Ratnavel R. Cutaneous larva migrans contracted in England: a reminder. Clin Exp Dermatol. 2001;26:389-390.
- Blackwell V, Vega-Lopez F. Cutaneous larva migrans: clinical features and management of 44 cases presenting in the returning traveller. Br J Dermatol. 2001;145:434-437.
- Hochedez P, Caumes E. Hookworm-related cutaneous larva migrans. J Travel Med. 2007;14:326-333.
- Bravo F, Sanchez MR. New and re-emerging cutaneous infectious diseases in Latin America and other geographic areas. Dermatol Clin. 2003;21:655-668, viii.
- Guill MA, Odom RB. Larva migrans complicated by Loeffler’s syndrome. Arch Dermatol. 1978;114:1525-1526.
- Caumes E. Treatment of cutaneous larva migrans. Clin Infect Dis. 2000;30:811-814.
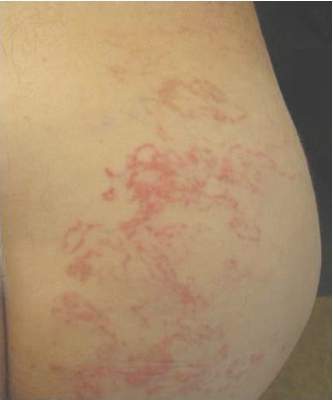
A 62-year-old man presented to the dermatology clinic with a severely pruritic and painful rash of 1 week’s duration. The rash began as an erythematous papule on the right buttock but had spread in a serpiginous manner to the groin and left buttock. The patient stated that he could see the rash spreading in a serpiginous manner over a matter of hours. The patient’s medical history was unremarkable and a review of symptoms was otherwise negative. Physical examination revealed an erythematous serpiginous eruption that was most prominent on the right buttock but extended to the left buttock and down the right leg. He also exhibited several erythematous papules with excoriations in that region.

Ovarian Decline May Be Associated With Disability in Women With MS
NEW ORLEANS—Levels of anti-Mullerian hormone, a marker of the perimenopausal period, are associated with total gray matter volume and disability in patients with multiple sclerosis (MS), independent of chronological age and disease duration, according to data presented at the ACTRIMS 2016 Forum. The study also indicates that women with MS have no reduction in follicular reserve, compared with healthy women, and therefore have normal fertility.
Women with MS tend to have a more benign initial course than men with MS do, but the former often transition to secondary progressive disease near the time of menopause. To date, research has not clarified whether ovarian decline contributes to the accumulation of disability in women with MS.
Jennifer S. Graves, MD, PhD, a neurologist at the University of California, San Francisco Medical Center, and colleagues initiated a study to determine whether ovarian decline, as measured by levels of anti-Mullerian hormone, is associated with clinical disability or brain atrophy in women with MS. They examined 412 women with MS (mean age, 42.6) and 180 healthy controls (mean age, 44) from a longitudinal research cohort that had as many as 10 years of clinical and MRI follow-up. The investigators measured anti-Mullerian hormone levels in batch using a highly sensitive enzyme-linked immunosorbent assay on plasma samples from baseline, year 3, year 5, and years 8 to 10. They analyzed the data with logistic, linear, and mixed-model regression techniques, with adjustments for age, disease duration, smoking, race, ethnicity, vitamin D level, disease modifying therapy, birth control, and hormone replacement therapy as appropriate.

Jennifer S. Graves, MD, PhD
Dr. Graves and colleagues found that in models controlling for age, anti-Mullerian hormone levels were similar in women with MS and healthy controls. In a multivariable model of women with MS, including rigorous adjustments for age and disease duration, ovarian reserve (per twofold decrease in anti-Mullerian hormone pg/mL) was associated with total normalized gray matter volume (β = -3.29 mm3) and MS Functional Composite z-scores (β = -0.060) at baseline. After adjustment for age, white matter volumes were also associated with anti-Mullerian hormone levels (β = -2.64 mm3) at baseline, but the association did not remain statistically significant after additional adjustments (β = -1.49 mm3).
Having undetectable levels of anti-Mullerian hormone (28% of subjects) was associated with 0.60-point higher Expanded Disability Status Scale score. In a multivariable random-intercept-random-slope model using all observations over time, a twofold decrease in anti-Mullerian hormone (pg/mL) was associated with a 1.85-mm3 decrease in gray matter volume over the follow-up period. The researchers' longitudinal analyses of participants' clinical outcomes is ongoing.
NEW ORLEANS—Levels of anti-Mullerian hormone, a marker of the perimenopausal period, are associated with total gray matter volume and disability in patients with multiple sclerosis (MS), independent of chronological age and disease duration, according to data presented at the ACTRIMS 2016 Forum. The study also indicates that women with MS have no reduction in follicular reserve, compared with healthy women, and therefore have normal fertility.
Women with MS tend to have a more benign initial course than men with MS do, but the former often transition to secondary progressive disease near the time of menopause. To date, research has not clarified whether ovarian decline contributes to the accumulation of disability in women with MS.
Jennifer S. Graves, MD, PhD, a neurologist at the University of California, San Francisco Medical Center, and colleagues initiated a study to determine whether ovarian decline, as measured by levels of anti-Mullerian hormone, is associated with clinical disability or brain atrophy in women with MS. They examined 412 women with MS (mean age, 42.6) and 180 healthy controls (mean age, 44) from a longitudinal research cohort that had as many as 10 years of clinical and MRI follow-up. The investigators measured anti-Mullerian hormone levels in batch using a highly sensitive enzyme-linked immunosorbent assay on plasma samples from baseline, year 3, year 5, and years 8 to 10. They analyzed the data with logistic, linear, and mixed-model regression techniques, with adjustments for age, disease duration, smoking, race, ethnicity, vitamin D level, disease modifying therapy, birth control, and hormone replacement therapy as appropriate.
Jennifer S. Graves, MD, PhD
Dr. Graves and colleagues found that in models controlling for age, anti-Mullerian hormone levels were similar in women with MS and healthy controls. In a multivariable model of women with MS, including rigorous adjustments for age and disease duration, ovarian reserve (per twofold decrease in anti-Mullerian hormone pg/mL) was associated with total normalized gray matter volume (β = -3.29 mm3) and MS Functional Composite z-scores (β = -0.060) at baseline. After adjustment for age, white matter volumes were also associated with anti-Mullerian hormone levels (β = -2.64 mm3) at baseline, but the association did not remain statistically significant after additional adjustments (β = -1.49 mm3).
Having undetectable levels of anti-Mullerian hormone (28% of subjects) was associated with 0.60-point higher Expanded Disability Status Scale score. In a multivariable random-intercept-random-slope model using all observations over time, a twofold decrease in anti-Mullerian hormone (pg/mL) was associated with a 1.85-mm3 decrease in gray matter volume over the follow-up period. The researchers' longitudinal analyses of participants' clinical outcomes is ongoing.
