User login
Does Fatigue Worsen Spasticity in Patients With MS?
NEW ORLEANS—Contrary to researchers’ hypothesis, fatigue did not result in worsening of spasticity in patients with multiple sclerosis (MS), resulting instead in a nonsignificant decrease. “Clinically, this suggests that the worsening of gait seen over time in persons with MS may be due to reasons other than spasticity,” reported Herbert Karpatkin, PT, DSc, NCS, MSCS, an Assistant Professor at Hunter College in New York, NY, and colleagues at the ACTRIMS 2016 Forum.

Herbert Karpatkin, PT, DSc, NCS, MSCS
Disturbance of gait is known to occur in approximately 80% of patients with MS. Fatigue and spasticity are among the most common and debilitating symptoms in this patient population and both have been known to worsen with physical performance. Anecdotal reports claim that spasticity is associated with worsening fatigue, but the literature provides little information regarding this relationship.
Dr. Karpatkin and colleagues sought to determine whether, as they hypothecized, increases in fatigue in patients with MS result in increases in lower extremity spasticity. If correct, this would mean that physical therapists who perform gait-training activities in patients with MS would need to take the interaction between fatigue and spasticity into account as a factor that may impact outcomes and help determine an appropriate course of treatment.
A convenience sample of 16 ambulatory subjects with MS was recruited from New York City physical therapy practices that specialize in MS. Demographic and subject characteristics including MS type, years since diagnosis, age, gender, Expanded Disability Status Scale (EDSS) score, medications, and use of assistive devices were recorded and analyzed. The Fatigue Severity Scale (FSS), the MS Impact Scale–29 (MSIS–29), and the MS Severity Scale–88 (MSSS–88) were completed for baseline analysis.
Subjects were randomized into walking and resting groups. All subjects received spasticity testing using the Modified Ashworth Scale (MAS). Subjects in the walking group then underwent a six-minute walk to induce fatigue, while subjects in the resting group lay supine for six minutes to minimize fatigue. Immediately following either six-minute condition, MAS testing was repeated. This was performed on three separate trials during a five-day period, followed by a two-week detraining period. Subjects then crossed over to the opposite condition. Fatigue was measured using the Visual Analog Scale of Fatigue (VAS–F) before and after each six-minute condition.
Sixteen subjects (mean EDSS, 3.59) completed the study. Mean MAS scores decreased nonsignificantly following the six-minute walk from 1.054 to 0.827. MAS scores also decreased nonsignificantly in the nonfatigued condition from 0.841 to 0.839. Mean VAS–F scores increased 29.5 mm following the six-minute walk, indicating that MAS testing was performed in a fatigued condition.
NEW ORLEANS—Contrary to researchers’ hypothesis, fatigue did not result in worsening of spasticity in patients with multiple sclerosis (MS), resulting instead in a nonsignificant decrease. “Clinically, this suggests that the worsening of gait seen over time in persons with MS may be due to reasons other than spasticity,” reported Herbert Karpatkin, PT, DSc, NCS, MSCS, an Assistant Professor at Hunter College in New York, NY, and colleagues at the ACTRIMS 2016 Forum.
Herbert Karpatkin, PT, DSc, NCS, MSCS
Disturbance of gait is known to occur in approximately 80% of patients with MS. Fatigue and spasticity are among the most common and debilitating symptoms in this patient population and both have been known to worsen with physical performance. Anecdotal reports claim that spasticity is associated with worsening fatigue, but the literature provides little information regarding this relationship.
Dr. Karpatkin and colleagues sought to determine whether, as they hypothecized, increases in fatigue in patients with MS result in increases in lower extremity spasticity. If correct, this would mean that physical therapists who perform gait-training activities in patients with MS would need to take the interaction between fatigue and spasticity into account as a factor that may impact outcomes and help determine an appropriate course of treatment.
A convenience sample of 16 ambulatory subjects with MS was recruited from New York City physical therapy practices that specialize in MS. Demographic and subject characteristics including MS type, years since diagnosis, age, gender, Expanded Disability Status Scale (EDSS) score, medications, and use of assistive devices were recorded and analyzed. The Fatigue Severity Scale (FSS), the MS Impact Scale–29 (MSIS–29), and the MS Severity Scale–88 (MSSS–88) were completed for baseline analysis.
Subjects were randomized into walking and resting groups. All subjects received spasticity testing using the Modified Ashworth Scale (MAS). Subjects in the walking group then underwent a six-minute walk to induce fatigue, while subjects in the resting group lay supine for six minutes to minimize fatigue. Immediately following either six-minute condition, MAS testing was repeated. This was performed on three separate trials during a five-day period, followed by a two-week detraining period. Subjects then crossed over to the opposite condition. Fatigue was measured using the Visual Analog Scale of Fatigue (VAS–F) before and after each six-minute condition.
Sixteen subjects (mean EDSS, 3.59) completed the study. Mean MAS scores decreased nonsignificantly following the six-minute walk from 1.054 to 0.827. MAS scores also decreased nonsignificantly in the nonfatigued condition from 0.841 to 0.839. Mean VAS–F scores increased 29.5 mm following the six-minute walk, indicating that MAS testing was performed in a fatigued condition.

Name Recognition, Personalization Key to Patient Experience
Editor’s note: “Everything We Say and Do” is an informational series developed by SHM’s Patient Experience Committee to provide readers with thoughtful and actionable communication tactics that have great potential to positively impact patients’ experience of care. Each article will focus on how the contributor applies one ormore of the “key communication” tactics in practice to maintain provider accountability for “Everything we say and do that affects our patients’ thoughts, feelings and well-being.”
What I Say and Do
I address patients by their preferred name and introduce myself with my full name.

Why I Do It
I have been surprised by how little discussion I have seen regarding how we address our patients. All the literature I have seen tells us that patients generally prefer first names, yet most doctors use last names. They also want us to introduce ourselves with our first and last name.
I have really found that using a first name personalizes the encounter a lot more than the formal Mr. or Mrs. Jones. Take, for example, “I am sorry you are still in pain, Mr. Jones,” versus, “I am sorry you are still in pain, Bill.”
Or for a family meeting regarding end of life: “What would Mrs. Jones want from us at this point in her life?” versus “What would Jenny want from us at this point in her life?”
I know that, for me personally, I feel treated more like an individual when someone uses my first name versus my last. This may seem like a small point, but I think it can truly improve communication and connectedness.
How I Do It
About four years ago, I began starting every encounter by addressing my patients by their first and last name. I then ask them what they would prefer to be called. Every patient has responded with either their first name or with a preferred nickname.
I always introduce myself as Dr. Rob Hoffman. About 90% of patients call me Dr. Hoffman, and the rest call me Rob. I used to be taken aback by being called Rob but eventually realized how egocentric that was. What should I care what my patient calls me? TH
Dr. Hoffman is a clinical associate professor and medical director for patient relations at the University of Wisconsin Hospital and Clinics and University of Wisconsin School of Medicine and Public Health in Madison.
Table 1.

Editor’s note: “Everything We Say and Do” is an informational series developed by SHM’s Patient Experience Committee to provide readers with thoughtful and actionable communication tactics that have great potential to positively impact patients’ experience of care. Each article will focus on how the contributor applies one ormore of the “key communication” tactics in practice to maintain provider accountability for “Everything we say and do that affects our patients’ thoughts, feelings and well-being.”
What I Say and Do
I address patients by their preferred name and introduce myself with my full name.
Why I Do It
I have been surprised by how little discussion I have seen regarding how we address our patients. All the literature I have seen tells us that patients generally prefer first names, yet most doctors use last names. They also want us to introduce ourselves with our first and last name.
I have really found that using a first name personalizes the encounter a lot more than the formal Mr. or Mrs. Jones. Take, for example, “I am sorry you are still in pain, Mr. Jones,” versus, “I am sorry you are still in pain, Bill.”
Or for a family meeting regarding end of life: “What would Mrs. Jones want from us at this point in her life?” versus “What would Jenny want from us at this point in her life?”
I know that, for me personally, I feel treated more like an individual when someone uses my first name versus my last. This may seem like a small point, but I think it can truly improve communication and connectedness.
How I Do It
About four years ago, I began starting every encounter by addressing my patients by their first and last name. I then ask them what they would prefer to be called. Every patient has responded with either their first name or with a preferred nickname.
I always introduce myself as Dr. Rob Hoffman. About 90% of patients call me Dr. Hoffman, and the rest call me Rob. I used to be taken aback by being called Rob but eventually realized how egocentric that was. What should I care what my patient calls me? TH
Dr. Hoffman is a clinical associate professor and medical director for patient relations at the University of Wisconsin Hospital and Clinics and University of Wisconsin School of Medicine and Public Health in Madison.
Table 1.
Only Two Strategies Offer some Effectiveness in Preventing Contrast-induced CIN
NEW YORK (Reuters Health) - Only two strategies offer some effectiveness in preventing contrast-induced nephropathy (CIN), according to a systematic review and meta-analysis of 86 randomized, controlled trials.
Those are use of N-acetylcysteine (NAc) in patients receiving low-osmolar contrast media (LOCM), and statins plus NAc.
The reported incidence of CIN, defined as an increase in serum creatinine levels >25% or 44.2 mmol/L (0.5 mg/dL) within three days of IV administration of contrast media, ranges from 7% to 11% and adds an average $10,345 to a CIN-related hospital stay. There is no clear consensus about the most effective intervention to prevent or reduce CIN.
Dr. Rathan M. Subramaniam and colleagues from Johns Hopkins University in Baltimore compared five strategies for preventing CIN in their systematic review and meta-analysis: IV NAc plus saline versus IV saline alone; IV sodium bicarbonate versus IV saline; NAc plus IV saline versus IV sodium bicarbonate; statins with or without NAc versus IV saline; and ascorbic acid versus NAc or IV saline.
In the NAc studies, all of which had low strength of evidence, NAc had a clinically important benefit in reducing CIN risk only when LOCM were used.
Low-dose NAc had a borderline clinically important effect on preventing CIN, whereas high-dose NAc had a statistically significant (but clinically unimportant) effect on reducing CIN risk (with low strength of evidence).
Similarly, statins when added to NAc showed a clinically important reduction in CIN risk, although with low strength of evidence.
IV sodium bicarbonate (versus IV saline), NAc (versus IV sodium bicarbonate), and ascorbic acid (versus other strategies) showed no statistically significant, clinically important benefit in reducing CIN risk, according to the report onine February 1 in Annals of Internal Medicine online.
"The studies span over two decades, and there may have been changes in the practice of CIN prevention, such as increased screening, variation in definition of acute kidney injury, and variation in hydration, over time," the researchers noted. "Such changes could contribute to differences in outcomes."
"This comprehensive review highlights the generally low strength of evidence on interventions for preventing CIN while indicating that the greatest reduction in CIN risk has been achieved with low-dose N-acetylcysteine in patients receiving LOCM or with statins plus N-acetylcysteine," they concluded.
In a related article, the group from Johns Hopkins University found no differences in CIN risk among the different types of LOCM. Iodixanol had a slightly lower risk of CIN than LOCM did, but the difference was not clinically important.
Dr. Guillaume Mahe from CHU de Rennes, Rennes, France recently reviewed remote ischemic preconditioning, another proposed method for preventing CIN (http://bit.ly/23EU40a). He told Reuters Health by email, "It seems of interest to use N-acetylcysteine, which is a low cost drug. Statins might be also a good option. This is another interesting effect of the statins, which is unknown by most physicians."
Even more important, Dr. Mahe said, is to "be sure that the patients need a computed tomography angiography with contrast media."
He expressed surprise that the authors did not assess the role of remote ischemic preconditioning in their review.
Dr. Subramaniam did not respond to a request for comments. The Agency for Healthcare Research and Quality funded both studies.
Product approved to treat hemophilia A in EU

The European Commission has approved a full-length recombinant factor VIII product for the treatment and prevention of bleeding in hemophilia A patients of all ages.
The product, Kovaltry (formerly BAY 81-8973), will be marketed for this indication in the 28 member countries of the European Union, as well as Iceland, Liechtenstein, and Norway.
The approval of Kovaltry is based on results from the LEOPOLD trials—3 multinational trials of patients with severe hemophilia A.
The trials were supported by Bayer HealthCare AG, the company developing Kovaltry.
LEOPOLD I
LEOPOLD I is an open-label, cross-over, phase 3 study of males, ages 12 to 65, with severe hemophilia A. Sixty-two patients were assigned to either 2- or 3-times-weekly dosing with Kovaltry, based on each patient’s phenotype, prior bleeding history, and other factors.
The median annualized bleeding rate (ABR) was 1.0 for all the patients who received Kovaltry prophylaxis, 1.0 for patients who received twice-weekly prophylaxis, and 2.0 for patients who received thrice-weekly prophylaxis.
LEOPOLD II
LEOPOLD II is a randomized, cross-over, open-label trial conducted in males ages 12 to 65. In this phase 3 study, 80 subjects were randomized to receive Kovaltry as a low-dose prophylaxis regimen (n=28) twice per week, high-dose prophylaxis (n=31) 3 times a week, or on-demand treatment (n=21).
The median ABR was significantly lower in patients who received either prophylactic regimen than those who received on-demand treatment—2.0 and 60.0, respectively (P<0.0001). The median ABR was 4.0 for patients who received twice-weekly prophylaxis and 2.0 for patients who received thrice-weekly prophylaxis.
LEOPOLD Kids
LEOPOLD Kids is an open-label, non-randomized, phase 3 study designed to evaluate Kovaltry in children age 12 and younger. The study is divided into 2 parts. Part A enrolled only previously treated children, and part B, which is ongoing, includes only untreated children.
For part A, 51 children received Kovaltry twice a week, 3 times a week, or every other day (according to investigator decision) for at least 50 exposure days. The median ABR within 48 hours of prophylactic injection was 0, and the median ABR independent of the time of injection was 1.9.
Safety results
For all 3 trials, 193 patients were evaluable for safety. Adverse reactions were defined as treatment-emergent adverse events with at least a reasonable suspected causal relationship to Kovaltry.
The researchers said the frequency, type, and severity of adverse reactions in children were similar to those observed in adults and adolescents.
The adverse reactions included headache (7.3%), pyrexia (4.1%), pruritus (3.1%), injection site reactions (2.6%), insomnia (2.6%), rash (2.6%), abdominal pain (2.1%), dyspepsia (2.1%), abdominal discomfort (1.6%), lymphadenopathy (1%), dizziness (1%), allergic dermatitis (1%), heart palpitations (1%), sinus tachycardia (1%), chest discomfort (1%), hypersensitivity (0.5%), dysgeusia (0.5%), urticaria (0.5%), and flushing (0.5%).
None of the patients developed factor VIII inhibitors. ![]()
Antiplatelet agent approved for long-term use

Photo courtesy of the CDC
The European Commission has approved use of the antiplatelet agent ticagrelor (Brilique) at a 60 mg dose to treat patients beyond the first year after a heart attack who are at high risk of developing a further atherothrombotic event.
The treatment may be used as continuation therapy after an initial 1-year treatment with 90 mg ticagrelor plus aspirin or after a year of other dual antiplatelet therapy.
This approval is applicable to all 28 European Union (EU) member countries plus Iceland, Norway, and Liechtenstein.
Ticagrelor at a 90 mg dose is already approved in the EU for the prevention of atherothrombotic events in adults with acute coronary syndrome (ACS). In the management of ACS, the recommended maintenance dose of ticagrelor is 90 mg twice daily during the first year after an ACS event.
Now, after the first year, patients with a history of heart attack can continue to be treated with ticagrelor at 60 mg twice daily, which should be taken with a daily maintenance dose of aspirin at 75 mg to 150 mg.
Trial results
The latest EU approval of ticagrelor was based on results from the PEGASUS TIMI-54 study. This trial, which involved more than 21,000 patients, was presented at the American College of Cardiology Congress in March 2015 and simultaneously published in NEJM.
Investigators compared ticagrelor (at 60 mg or 90 mg) plus low-dose aspirin to placebo plus low-dose aspirin in patients who had experienced a heart attack 1 to 3 years prior to study enrollment.
The primary efficacy endpoint was a composite of cardiovascular death, myocardial infarction, or stroke.
The investigators found that patients in either ticagrelor arm were significantly less likely to achieve this endpoint than placebo-treated patients.
At 3 years, the proportion of patients meeting the primary endpoint was 7.85% in the 90 mg group, 7.77% in the 60 mg group, and 9.04% in the placebo group (P=0.008 for 90 mg vs placebo and P=0.004 for 60 mg vs placebo).
Patients receiving ticagrelor also had a significantly higher incidence of major bleeding and dyspnea. The rate of TIMI major bleeding was 2.60% in the 90 mg group, 2.30% in the 60 mg group, and 1.06% in the placebo group (P<0.001 for each ticagrelor dose vs placebo).
The rate of dyspnea was 18.93% in the 90 mg group, 15.84% in 60 mg group, and 6.38% in the placebo group (P<0.001 for both comparisons). The rate of dyspnea leading to treatment discontinuation was 6.5%, 4.55%, and 0.79%, respectively (P<0.001 for both comparisons).
Ticagrelor has been approved in more than 100 countries. The drug is under development by AstraZeneca.![]()
How an anticancer drug fights lymphoid malignancies

Photo by Cameron Wells,
Walter and Eliza Hall
Institute of Medical Research
Research published in Cell Reports helps explain how the anticancer agent Nutlin3a fights lymphoma and other hematologic malignancies.
Nutlin3a is known to activate the tumor suppressor p53, but it hasn’t been clear exactly which p53 target genes are essential for the drug’s therapeutic activity.
The new research revealed that PUMA-mediated apoptosis—not p21-mediated cell-cycle arrest or senescence—is responsible for Nutlin3a’s therapeutic activity in lymphoid malignancies.
“By understanding how nutlins are killing cancer cells, we can begin to formulate their best possible use, including choosing the best partner drugs to combine the nutlins with,” said study author Andreas Strasser, PhD, of the Walter and Eliza Hall Institute of Medical Research in Parkville, Victoria, Australia.
With this study, Dr Strasser and his colleagues first found that Nutlin3a activates p53 target gene expression and causes cell-cycle arrest and apoptosis in non-transformed mouse lymphoid cells in vitro.
The team then showed that Nutlin3a-mediated killing of these cells requires PUMA but not p21. In vivo, loss of PUMA protected non-transformed mouse lymphoid cells against Nutlin3a-induced killing. Loss of p21 did not provide the same protection.
Next, the researchers found that malignant Eµ-Myc lymphoma cells were much more sensitive to Nutlin3a than were non-transformed lymphoid cells. In vitro experiments with Eµ-Myc lymphoma cells showed that Nutlin3a promotes p53 accumulation and downstream effector pathway activation.
As in previous experiments, PUMA (not p21) proved critical for Nutlin3a-induced killing of Eµ-Myc lymphoma cells in vitro. And loss of PUMA (but not p21) impaired the regression of Eµ-Myc lymphomas induced by Nutlin3a in vivo.
Finally, the researchers found that PUMA contributed to Nutlin3a-induced apoptosis in myeloid leukemia, multiple myeloma, and Burkitt lymphoma cell lines.
The team noted that, because PUMA, a pro-apoptotic BH3-only protein, is critical for the therapeutic impact of Nutlin3a, it may be possible to boost the drug’s efficacy by combining it with BH3 mimetic drugs such as navitoclax or venetoclax. ![]()
Drug may still be viable as CMV prophylaxis
![]()
Photo by Chad McNeeley
HONOLULU—Despite disappointing results in a phase 3 trial, investigators believe the oral nucleotide analog brincidofovir may still be viable as cytomegalovirus (CMV) prophylaxis in patients undergoing hematopoietic stem cell transplant (HSCT).
As reported last December, brincidofovir did not meet the primary endpoint of the phase 3 SUPPRESS trial, which was to prevent clinically significant CMV infection at week 24 after HSCT.
However, trial investigators said the drug did prevent CMV through week 14, which was the end of the treatment period.
The team believes they have an explanation for these findings, which were presented at the 2016 BMT Tandem Meetings (abstract 5). The trial was supported by Chimerix, the company developing brincidofovir.
The SUPPRESS trial included 452 subjects at high risk for CMV who were randomized to receive brincidofovir or placebo twice weekly for up to 14 weeks following allogeneic HSCT. They were then followed for 10 weeks after treatment.
Baseline characteristics were similar between the treatment arms, although there were more males in the placebo arm than the brincidofovir arm—66% and 54%, respectively. The median age was 56 in the brincidofovir arm and 54 in the placebo arm (overall range, 18-77).
Key results
The primary endpoint was assessed at week 24. At that time, the proportion of patients with clinically significant CMV infection was similar in the brincidofovir and placebo arms—51% and 52%, respectively.
However, the investigators did note that brincidofovir exhibited an antiviral effect during the trial. At the end of the on-treatment period at week 14, patients who received brincidofovir had fewer clinically significant CMV infections than patients in the placebo group—24% and 38%, respectively (P=0.002).
The investigators said the failure to meet the primary endpoint at week 24 appears to be associated with CMV events in the post-treatment period among subjects on the brincidofovir arm, driven by higher use of corticosteroids and other immunosuppressive therapies for the treatment of presumptive graft-versus-host disease (GVHD).
Diarrhea can be a symptom of GVHD in the gut and is also a known side effect of brincidofovir that can be managed by a temporary dose interruption, as described in the safety monitoring and management plan (SMMP) developed during the phase 2 trial of the drug (then known as CMX001).
In the SUPPRESS trial, diarrhea in brincidofovir-treated patients was more frequent and often presumed to be gut GVHD. So patients were treated with corticosteroids rather than undergoing temporary treatment interruption according to the SMMP. Among patients who were managed according to the SMMP, the investigators observed significantly fewer CMV infections (P=0.03) and lower mortality (P<0.001).
There was an 8-fold increase in the use of corticosteroids through week 14 in the brincidofovir arm compared to the placebo arm. The median cumulative dose of prednisone-equivalent corticosteroids was 26 mg/kg and 3 mg/kg, respectively.
The use of corticosteroids and other immunosuppressive therapies for the treatment of GVHD is known to increase the risk of infections, including CMV infections that occur when patients discontinue antiviral therapy.
Among patients who either underwent T-cell depletion or received alemtuzumab/ATG to decrease the risk of GVHD, those who were randomized to receive brincidofovir showed a lower incidence of CMV when compared to placebo, at a rate consistent with what was observed in the phase 2 study.
Additional endpoints
Brincidofovir did not prevent infection with non-CMV DNA viruses, such as BK virus.
And there was no significant difference between the treatment arms with regard to all-cause mortality. The rate was 15.5% in the brincidofovir arm and 10.1% in the placebo arm (P=0.12).
The investigators said the numerical differences in mortality appear to be driven by higher use of corticosteroids and other immunosuppressive therapies in the subjects who received brincidofovir.
The rate of treatment-emergent adverse events (AEs) was 100% in the brincidofovir arm and 98% in the placebo arm. The rate of grade 3 or higher AEs was 67% and 38%, respectively. The rate of serious AEs was 57% and 38%, respectively.
The rate of AEs leading to treatment discontinuation was 26% and 7%, respectively. And the rate of AEs leading to treatment change or interruption was 45% and 15%, respectively.
The most common AEs in the brincidofovir arm were diarrhea (61%), acute GVHD (57%), abdominal pain (34%), nausea (31%), vomiting (24%), peripheral edema (17%), hyperglycemia (16%), hypokalemia (16%), hypomagnesemia (13%), and ALT elevation (11%). There was no evidence of bone marrow toxicity, kidney toxicity, or viral resistance to brincidofovir.
Brincidofovir development
Chimerix said it will discuss the SUPPRESS data in full with the US Food and Drug Administration and other regulators, including the benefit-to-risk profile in specific subpopulations, as well as the current adenovirus and smallpox data, to determine next steps for the brincidofovir clinical programs.
The development of an intravenous (IV) formulation of brincidofovir is progressing toward clinical testing and has the potential to avoid the gastrointestinal side effects of orally administered brincidofovir.
Preclinical studies of IV brincidofovir have shown a lower risk of gastrointestinal effects based on maintained body weight during dosing and no evidence of injury in preliminary review of the gastrointestinal tract.
If human studies continue to support these findings, IV dosing during the first few weeks after transplant when patients are recovering from conditioning chemotherapy could be explored, with oral brincidofovir therapy available as patients are discharged home.
As there is no preventive therapy approved for CMV in HSCT recipients, Chimerix said it is committed to moving brincidofovir forward in this indication. Plans for brincidofovir in HSCT recipients will be the subject of further discussions with regulators. ![]()
PCP Visits to Hospitalized Patients
Transitions in care are vulnerable periods. As patients are transferred between settings of care (such as from hospital back to the community), communication between healthcare providers is vital for care continuity.[1] A significant number of preventable adverse events may be related to ineffective communication between care providers.[1, 2, 3] The advent of specialized care, such as the introduction of hospitalists in acute care settings, has created an environment in which a patient's most responsible physician can often change multiple times as they move through the healthcare system.[4] Although there are many benefits to this type of concentrated care, the increase in care transitions may result in breakdowns in communication that may then be linked to risks in patient safety and suboptimal patient outcomes.[5, 6, 7, 8]
Improved continuity of care has been demonstrated to enhance patient safety during care transitions.[7] Efforts to develop continuity of care interventions are largely focused on care‐provider continuity, improved facilitation of communication, care planning, and increasing involvement of primary care physicians during follow‐up to hospitalizations and specialist visits.[9, 10] Such continuity of care efforts may provide a moderate benefit, but there remains room for improvement.[10, 11]
One dimension of continuity of care that has received limited attention is the potential impact of primary care physicians hospital visits to their hospitalized patients in a supportive‐care role.[12] In these situations, the primary care physician is neither the most responsible physician nor are they involved directly in their patient's hospital care. However, visiting their patient implies that they are aware of the hospitalization, thereby facilitating the potential for communication between care providers. Primary care physicians can also provide valuable contextual and relevant information as well as be involved in the discharge process. To identify the extent to which primary care physicians visit hospitalized patients and to measure the potential impact of primary care physician supportive visits on future outcomes, we used population‐level data to determine the frequency of supportive‐care visits by primary care physicians to hospitalized patients and to identify the association between these visits, patient outcomes, and health services utilization.
METHODS
Overview
We applied a retrospective cohort design utilizing linked population‐based administrative databases in the province of Ontario, Canada to examine outcome differences between patients who received a supportive‐care in‐hospital visit by their primary care physician compared to those who did not.
Databases
We assembled the cohort from linked and encrypted population‐based healthcare administrative databases. Data were derived from information on patients and physicians from the Ontario Health Insurance Plan, the Canadian Census, the Canadian Institute of Health Information Hospital Discharge Abstract Database, Registered Persons Databases, National Ambulatory Care Reporting System, Corporate Provider Database, Client Agency Program Enrolment, and Home Care Database. These databases have been validated and widely used in numerous studies.[13, 14, 15] All adults aged18 years who were discharged from the hospital in Ontario, Canada between January 1, 2008 and December 31, 2009 were included. Patients transferred to nursing homes or other acute care facilities following discharge, including rehabilitation centers, were excluded because they may have different readmission patterns. Among remaining hospitalized patients, only those with an identifiable primary care physician in the community were included. The patientprimary care physician pairings were identified using validated algorithms based on historical physician billing information.[16] This approach, adapted from previous studies, maximized the comparability among the study groups.[17, 18] In addition to having an historical relationship with the patients, primary care physicians had to have a history of conducting in‐hospital supportive visits (i.e., visits to at least 2 hospital patients within the previous year) for the patientprimary care physician pair to be included. This criterion was included to increase the likelihood that we were capturing a usual physician practice behavior and not a single circumstantial visit by a primary care physician. The history of supportive visits was also identified with physician billing data using a specific fee code.
Exposure
The exposure of interest was an in‐hospital visit in a supportive‐care role by the primary care physician during a patient's hospitalization and was obtained from physician fee codes. The fee paid for a visit during the study period was less than $20 CND.
Outcome Measures
Two different composite outcome measures were examined. The primary outcome was a composite of an emergent hospital readmission, death, or emergency department visit (without hospital admission). A composite measure was utilized to account for all outcomes simultaneously and thus be representative of the overall patient experience.[19] This approach has been applied in several studies examining continuity of care.[19, 20, 21] The secondary outcome examined processes of care. It was a composite evaluating ambulatory health services use postdischarge, specifically the number of primary care physician office visits and formal (ie, paid for by the universal provincial health plan) home‐care services. Home‐care services included both visits for nursing care as well as formal social support such as personal care. All outcome measures were assessed at 30 and 90 days following hospital discharge to assess for short and medium range outcomes.[22]
Patient Characteristics
Patient demographics including age, sex, low income (defined as individual income below $16,018 [CND] or couples income below $24,175 [CND]), living in a rural region, and the number of previous visits with primary care physicians were described from the available data. Readmission risk from the initial hospitalization was calculated based on the LACE score.[23] The LACE score is a validated measure of 30‐day readmission risk based on healthcare administrative data that account for (L) length of stay, (A) acute admission, (C) comorbid disease burden, and number of (E) emergency department visits in previous 6 months.[23] The LACE score ranges from 0 to 19, which correspond to a probability of readmissions of 2% to 43.7%, respectively. We considered individuals to have a high risk of readmission with a LACE score 10, which corresponds to a probability of readmission of 12.2%.[23]
Statistical Analyses
Descriptive statistics were used to compare patient characteristics among those with a primary care physician supportive‐care visit to those without. Logistic regression modeling was conducted to examine the impact of primary care physician visits on outcomes. The results reported here reflect the selection of adjusting for the confounders of age, sex, a history of primary care physician visits, low income, rurality, and the LACE score.
Ethics
The project analysis was conducted at the Institute for Clinical Evaluative Sciences (ICES) in Toronto, Ontario and was approved by the Sunnybrook Health Sciences Centre Research Ethics Board.
RESULTS
Overview
There were 11,316 primary care physicians identified as practicing in Ontario during the study period, of which 3236 had a history of conducting regular in‐hospital visits to 2 or more patients. The final patient cohort consisted of 164,059 hospitalized patients; 19,614 patients received a visit from their primary care physician, whereas 144,445 did not (Figure 1).

The hospitalized patients who received a visit from their primary care physician were significantly different than the patients who did not receive an in‐hospital visit (Table 1). Notably, patients who received a visit by their primary care physician had longer lengths of hospital stay (9.7 days vs 6.8 days, P<0.001). As well, a greater proportion had a high 30‐day readmission risk (LACE score10: 39.4% vs 29.9%, P<0.001) (Table 1).[21]
| Variablea | With PCP Visit (N=19,614) | Without PCP Visit (N=144,445) |
|---|---|---|
| ||
| Age, meanSD | 68.3716.85 | 65.7318.54 |
| Sex, no. of males | 9,393 (47.9%) | 67,030 (46.4%) |
| Low income | 3,937 (20.1%) | 30,157 (20.9%) |
| Individuals living in rural regions, no. | 1,951 (9.9%) | 25,731 (17.8%) |
| PCP visits in previous 6 months, meanSD | 4.764.47 | 4.174.28 |
| Length of stay, d, meanSD | 9.7217.40 | 6.7913.17 |
| Acute emergent visits, no. | 19,138 (97.6%) | 136,374 (94.4%) |
| Charlson score, meanSD | 1.061.60 | 0.921.49 |
| ED visits in previous 6 months, meanSD | 0.951.48 | 1.091.98 |
| LACE score, meanSDc | 9.022.88 | 8.103.02 |
| High risk for readmission (LACE score10), no. (%)c | 7,721 (39.4%) | 43,126 (29.9%) |
Patients who received an in‐hospital visit by their primary care physician were significantly different from those who did not (Table 2). They were older (68.4 years vs 65.7 years), and had a higher risk of readmission (LACE score of 9 vs 8). As well, proportionally fewer patients who received a visit were from rural regions than in the comparator group (9.9% of patients visited were from rural regions vs 17.8% of patients who did not receive a visit) (Table 2).
| Variable | Patients Who Received an In‐hospital Visit (N=19,614) | Patients Who Did Not Receive an In‐hospital Visit (N=144,445) | P Value |
|---|---|---|---|
| |||
| Primary outcome of emergency department visit, hospital readmission, or death | |||
| 30 days postdischarge, no. (%) | |||
| Readmission | 1,742 (8.9%) | 11,212 (7.8%) | <0.001 |
| ED visit | 2,039 (10.4%) | 16,823 (11.6%) | <0.001 |
| Death | 727 (3.7%) | 4,688 (3.2%) | <0.001 |
| Composite endpointa | 4,227 (21.6%) | 30,848 (21.4%) | 0.533 |
| 90 days postdischarge | |||
| Readmission | 2,791 (14.2%) | 18,257 (12.6%) | <0.001 |
| ED visit | 3,652 (18.6%) | 29,590 (20.5%) | <0.001 |
| Death | 1,507 (7.7%) | 9,821 (6.8%) | <0.001 |
| Composite endpointa | 7,125 (36.3%) | 52,245 (36.2%) | 0.668 |
| Secondary outcome of PCP office visits and home‐care services | |||
| 30 days postdischarge | |||
| Community PCP visits, meanSD | 3.85.1 | 3.14.6 | <0.001 |
| PCP visit, no. (%) | 15,732 (80.2%) | 108,266 (75%) | <0.001 |
| Home‐care services, no. (%) | 6,197 (31.6%) | 38,745 (26.8%) | <0.001 |
| Composite endpoint, no. (%)b | 16,851 (85.9%) | 117, 290 (81.2%) | <0.001 |
| 90 days postdischarge | |||
| Community PCP visits, meanSD | 8.210.1 | 6.99.3 | <0.001 |
| PCP visit, no. (%) | 18,112 (92.3%) | 128, 806 (89.2%) | <0.001 |
| Home‐care services, no. (%) | 7,256 (37.0%) | 45,675 (31.6%) | <0.001 |
| Composite endpoint, no. (%)b | 18, 504 (94.3%) | 132, 448 (91.7%) | <0.001 |
Individual Outcomes
Patients who received an in‐hospital visit by their primary care physician were also more likely to be readmitted within 30 days of discharge (8.9% vs 7.8%, P<0.001) and within 90 days of discharge (14.2% vs 12.6%, P<0.001). Additionally, patients who were visited by their primary care physician while hospitalized were more likely to die within 30 days postdischarge than those who did not receive an in‐hospital visit (3.7% vs 3.2%, P<0.001) and similarly by 90 days postdischarge (7.7% vs 6.8%, P<0.001) (Table 2).
Patients who received an in‐hospital visit were less likely to visit the emergency department at 30 days (10.4% vs 11.6%, P<0.001) and at 90 days (18.6% vs 20.5%, P<0.001) compared to patients who did not receive an in‐hospital visit (Table 2).
The patients who received in‐hospital visits by their primary care physician had a greater average number of primary care physician visits in the community at 30 days (3.8 vs 3.1, P<0.001) and 90 days (8.2 vs 6.9, P<0.001) (Table 2). Additionally, a higher proportion of patients who received an in‐hospital visit accessed home‐care services at 30 days postdischarge (31.6% vs 26.8%, P<0.001) and 90 days postdischarge (37.0% vs 31.6%, P<0.001) (Table 2).
Primary Outcome
There was no difference in proportion of patients who experienced the composite endpoint at 30 days (4227 [21.6%] vs 30,848 [21.4%], P>0.5) or 90 days (7125 [36.3%] vs 52,245 [36.2%], P>0.6) for patients who received an in‐hospital visit by their primary care physician compared to those who did not. The unadjusted model found no statistically significant difference between the 2 groups upon a primary care physician visit (odds ratio [OR]: 1.01; 95% confidence interval [CI]: 0.98‐1.04). However, once adjusting for differences in the groups for patient factors such as age, sex, location and health status, patients who received an in‐hospital visit by their primary care physician had lower adjusted risk for the composite outcome at 30 days postdischarge (adjusted OR [aOR]: 0.92; 95% CI: 0.89‐0.96) and 90 days postdischarge (aOR: 0.90; 95% CI: 0.87‐0.92) (Table 3). Estimates for each individual component of the composite outcome revealed significantly lower risk for ED visit and death but similar risk for readmission at both 30 days and 90 days after hospital discharge for patients who received and in‐hospital visit from their primary care physician and those who did not (Table 3).
| Variable | Unadjusted Odds Ratio (95% CI) | Adjusted Odds Ratio (95% CI)a |
|---|---|---|
| ||
| Primary outcome of emergency department visit, hospital readmission, or death | ||
| 30 days postdischarge | ||
| Readmission | 1.16 (1.10‐1.22) | 1.03 (0.97‐1.08) |
| ED visit | 0.88 (0.84‐0.92) | 0.88 (0.84‐0.92) |
| Death | 1.15 (1.06‐1.24) | 0.88 (0.81‐0.96) |
| Composite endpointb | 1.01 (0.98‐1.05) | 0.92 (0.89‐0.96) |
| 90 days postdischarge | ||
| Readmission | 1.15 (1.10‐1.20) | 1.00 (0.96‐1.04) |
| ED visit | 0.89 (0.86‐0.92) | 0.89 (0.86‐0.93) |
| Death | 1.14 (1.08‐1.21) | 0.87 (0.82‐0.93) |
| Composite endpointb | 1.01 (0.98‐1.04) | 0.90 (0.87‐0.92) |
| Secondary outcome of PCP office visits and home‐care services | ||
| 30 days postdischarge | ||
| Community PCP visits | 1.35 (1.31‐1.41) | 1.21 (1.16‐1.25) |
| Home‐care services | 1.26 (1.22‐1.30) | 1.05 (1.01‐1.09) |
| Composite endpointc | 1.41 (1.34‐1.47) | 1.16 (1.11‐1.21) |
| 90 days postdischarge | ||
| Community PCP visits | 1.46 (1.39‐1.55) | 1.25 (1.18‐1.33) |
| Home‐care services | 1.27 (1.23‐1.31) | 1.05 (1.01‐1.08) |
| Composite endpointc | 1.51 (1.42‐1.61) | 1.19 (1.12‐1.27) |
Secondary Outcome
Patients who received an in‐hospital visit by their primary care physician were more likely to experience the composite outcome of home‐care services and community primary care physician visits at 30 postdischarge (16,851 [85.9%] vs 117,290 [81.2%], P<0.001) and 90 days postdischarge (18,504 [94.3%] vs 132,448 [91.7%], P<0.001) compared to patients who did not receive an in‐hospital visit (Table 3). Once accounting for patient variables such as age, sex, location, and health status, patients who received an in‐hospital visit by their primary care physician had a higher adjusted risk for the composite outcome at 30 days postdischarge (aOR: 1.16; 95% CI: 1.11‐1.21) and 90 days postdischarge (aOR: 1.19; 95% CI: 1.12‐1.27) (Table 3).
DISCUSSION
Our population‐based study of primary care physicians is among the first to examine outcomes of patients whose primary care physicians have a history of providing supportive visits to hospitalized patients. After controlling for risk differences in patients at hospital discharge, we found that a primary care physician visit to a patient in the hospital was associated with a lower adjusted risk for the composite outcome of death, emergent hospital readmission, or emergency department visit at 30 and 90 days postdischarge compared to hospitalized patients who did not receive a visit by their primary care physician. We found this to be driven by patients having a lower risk of emergency department visits and death, whereas there was a similar risk of hospital readmission. We also found that visited patients were more likely to access home‐care services and have more primary care physician visits in the community following discharge.
The unadjusted model differs substantially from the adjusted model. On the surface this is an apparent paradox where the unadjusted results suggest an association with potential harm or no difference with a supportive visit. Conversely, the adjusted model suggests a reduction in harms. The differences between the unadjusted and adjusted model is driven by changes in the point estimates for readmission and death rates at both 30 and 90 day postdischarge. Prior to adjustment, it appears as if a primary care physician visit is associated with a significant increase of death; however, upon adjustment, it is associated with a significant reduction in death. Interestingly, this is a different effect than that observed with the secondary analysis, where the adjusted analyses demonstrate a more modest (but still positive) effect of supportive‐care visits. This observed change is likely due to differences in the patient groups. We can speculate that this may be an observed phenomenon of primary care physicians opting to visit their sicker patients, as perhaps it should be; however, further research is required to fully understand the real drivers of a supportive visit.
Our results are consistent with an earlier study that identified that a minority number of primary care physicians visit their hospitalized patients.[24] As well, findings from a randomized controlled trial of 364 patients over 60 years old identified a limited impact of primary care physician visits on patient outcomes but noted enhanced access to community health services.[12] Our work highlights the potential impact of primary care physician visits, which could, in theory, be leveraged and be an important role that primary care physicians can play in planning postdischarge care and improving the quality of care following hospitalization.
Our research study did not examine the impact of in‐hospital primary care physician visits on patient satisfaction directly. However, it has been demonstrated that patients have a strong desire for their primary care physician to be involved in their hospital care and their preference is for direct contact, with face‐to‐face visits compared to telephone or other communication.[25] This choice is important because dissatisfaction with services is associated with a loss of patient confidence in care quality and decreased adherence.[26] Also, primary care physicians acknowledge that information exchange is lacking when their patients are discharged, and that improving this aspect of a patient's care transition is important.[20] Research into discharge summaries as a tool to fill the communication gap has noted some success, yet there remains uncertainty regarding the type of information that should be included in a discharge summary, the time frame in which primary care physicians actually receive the summaries, and the accuracy of the information provided.[20, 27]
Our use of population‐based administrative data sources make the findings of our research generalizable to other similarly designed healthcare systems where a primary care physician may visit their hospitalized patients in a supportive‐care role. We were interested in a complex patientphysician interaction with a number of potential confounding factors, and our use of a composite measure represents the broad outcomes from this contact. Our cohort methodology was designed to isolate the exposure of interest while maximizing uniformity between the 2 study groups on other characteristics. Additionally a number of potential confounding factors were considered in an effort to isolate the effect of the primary care physician in‐hospital visit such as age, comorbid disease, and risk of hospital readmission.[12] The findings of our work support that of earlier research, but on a broader and more generalizable scale.[12]
There were notable differences between the intervention and control patient populations in the proportion of patients from rural regions who receive a supportive visit. This may be due to systemic differences between rural and nonrural regions with regard to access to care and ease of visit by primary care physicians. Alternatively, observed differences may be due to limitations of our study design in that some rural environments rely on primary care physicians to be involved in hospital care for the region. As such, they may actually be visiting their patients in a manner that was not captured as a supportive‐care visit. This is an important area that should be pursued in the future.
We acknowledge there are limits to our research findings. First, the nature of administrative data introduces challenges to causal inferences. As such, we are careful to describe associations and not draw causative links as there may be additional variables influencing outcomes including the patientphysician relationship, the location of the hospital relative to the physician practice and/or home, the time of the primary care physician visit, primary care physician hospital privileges for supportive‐care visits, and the number of other patients the primary care physician had in the same hospital at the same time. A second limitation is the use of the selected outcomes, which may not be direct measures of care quality.[28] However, the selected outcomes have been shown to be good quality measures in other work relevant to health policy.[8, 20, 21, 29] Third, the use of a composite outcome may over‐ or underestimate an exposure's impact.[19] Our composite outcome might have been dominated by some of its components. These observations may reflect the reality of primary care physicians visiting their sicker patients, or may be an attribute of the relatively short length of follow‐up of the study design. Fourth, we cannot determine whether there were additional interventions in place that assisted the continuity of care for primary care physician visits.[20, 27] However, this research included a broad range of hospitals throughout a large province where there were no system‐level quality interventions applied during this time. Fifth, our readmission rate may appear lower than other studies. However, our analysis is population based and not limited in focus to seniors.[30] As well, our posthospitalization death rates are similar to others, and the readmission rates are comparable to other Canadian studies.[31] Sixth, patients at higher risk for adverse outcomes may be identified as requiring more communication with their primary care physicians and we may not have fully captured this risk in our adjustment models, thereby underestimating the effect of exposure.[27] Further, primary care physicians may be involved in major medical decisions such as transitions to palliative care. A supportive‐care visit that facilitated these transitions and its ensuing outcomes may not have been included in our analysis. Seventh, our inherent assumption is that more care, such as posthospital primary care visits and home visits, denotes better care. This may not always be the case.[32] Eighth, physicians may find it difficult to visit their patient in the hospital, even when asked.[12] Finally, our findings are contingent on a system that supports primary care physicians being aware of their patients who become hospitalized. This is not only incumbent on any individual (eg, hospitalist) but a system where all providers work cohesively and seamlessly. On balance, however, these limitations do not overshadow our study's findings and conclusions.
Visits by primary care physicians to hospitalized patients are a longstanding tradition. The practice likely varies according to regional, patient, and individual physician characteristics.[16, 17, 18, 25] However, reimbursement codes for these services are present in a number of international healthcare systems' physician fee schedules with fairly modest remuneration amounts. The fairly nominal fee of less than $20 CND for a supportive‐care visit is similar to other systems and does not constitute a strong financial incentive to encourage this practice. The fee likely compensates the primary care physician for some of their time but comes with an opportunity cost to other aspects of their practice. Thus, results may differ in other environments or if the fee were higher, thereby incenting more primary care physicians to conduct visits. Indeed, the entire program for supportive hospital visits cost approximately $2.5 million CND per year for the 13 million people in the province of Ontario. Future work in this area could address the overall value and cost‐effectiveness of any potential fee changes. Still, it highlights the generalizability of our findings to other health systems and the ease in assessing the effect of the practice.
Overall, our findings underscore the importance and relevance for the practice of supportive‐care visits in its association with patient outcomes and health services utilization, which may prove to be an important key factor to improve quality healthcare. Our results suggest that an in‐hospital visit by a primary care physician may improve patient outcomes and increase subsequent support in the community. An in‐hospital supportive visit may be an additional method by which primary care physicians, and healthcare systems as a whole, strive to achieve the best care for patients.
Acknowledgements
Michael Manno, an analyst with the Institute of Clinical Evaluative Sciences (ICES) at the time of this study, assisted with the analyses.
Disclosures: This study was supported by the Institute for Clinical Evaluative Sciences (ICES), which is funded by an annual grant from the Ontario Ministry of Health and Long‐Term Care (MOHLTC). The opinions, results, and conclusions reported in this article are those of the authors and are independent from the funding sources. No endorsement by the ICES or the Ontario MOHLTC is intended or should be inferred. No researcher or persons involved in this study had any declared or otherwise known conflicts of interest. Stacey Brener received funding from a Canadian Institutes of Health Research (CIHR) Master's award in the area of primary care; the Ontario Graduate Student in Science and Technology award, an award from the CIHR Women's College Hospital Interdisciplinary Capacity Enhancement Team, and team grant OTG‐88591 from the CIHR. Susan Bronskill is supported by a CIHR New Investigator Award in the Area of Aging. Chaim Bell is supported by a CIHR/Canadian Patient Safety Institute Chair in Patient Safety and Continuity of Care. These funding agencies had no role in the design and conduct of the study; collection, management, analysis, or interpretation of the data; or preparation, review, or approval of the manuscript. The corresponding author had full access to all of the data in the study and takes responsibility for the integrity of the data and the accuracy of the data analysis. The authors report no conflicts of interest.
- , , , . Continuity of care and patient outcomes after hospital discharge. J Gen Intern Med. 2004;19(6):624–631.
- , , , et al. Incidence of adverse events and negligence in hospitalized patients: results of the Harvard Medical Practice Study I. 1991. Qual Saf Health Care. 2004;13(2):145–151; discussion 51–52.
- , , , , . The incidence and severity of adverse events affecting patients after discharge from the hospital. Ann Intern Med. 2003;138(3):161–167.
- The College of Family Physicians of Canada. Family physicians caring for hospital inpatients. Available at: http://www.cfpc.ca/uploadedFiles/Resources/Resource_Items/FPs20Inpt20Hosp20Care_En.pdf. Published October 2003. Accessed August 15, 2015.
- , , . Is volume related to outcome in health care?. A systematic review and methodologic critique of the literature. Ann Intern Med. 2002;137(6):511–520.
- , , , , , . Outcomes of care by hospitalists, general internists, and family physicians. N Engl J Med. 2007;357(25):2589–2600.
- , , , . Maintaining continuity of care: a look at the quality of communication between Ontario emergency departments and community physicians. CJEM. 2005;7(3):155–161.
- , , , et al. The independent association of provider and information continuity on outcomes after hospital discharge: implications for hospitalists. J Hosp Med. 2010;5(7):398–405.
- , , , , , . Patient‐reported care coordination: associations with primary care continuity and specialty care use. Ann Fam Med. 2011;9(4):323–329.
- , . The Wellness Planner: empowerment, quality of life, and continuity of care in mental illness. Arch Psychiatr Nurs. 2011;25(4):284–293.
- , , , et al. Evaluation of the impact of interdisciplinarity in cancer care. BMC Health Serv Res. 2011;11:144.
- , , , , . Can GP input into discharge planning result in better outcomes for the frail aged: results from a randomized controlled trial. Fam Pract. 1999;16(3):289–293.
- , , , et al. Association of ICU or hospital admission with unintentional discontinuation of medications for chronic diseases. JAMA. 2011;306(8):840–847.
- , , , , , . Potentially unintended discontinuation of long‐term medication use after elective surgical procedures. Arch Intern Med. 2006;166(22):2525–2531.
- , , , , , , . Canadian Institute for Health Information Discharge Abstract Database: A Validation Study. Toronto: Institute for Clinical Evaluative Sciences; 2006. Available at: http://www.ices.on.ca/Publications/Atlases‐and‐Reports/2006/Canadian‐Institute‐for‐Health‐Information. Accessed August 15, 2015.
- , , , . Primary care physician workforce and Medicare beneficiaries' health outcomes. JAMA. 2011;305(20):2096–2104.
- , , , . Assigning ambulatory patients and their physicians to hospitals: a method for obtaining population‐based provider performance measurements. Health Serv Res. 2007;42(1 pt 1):45–62.
- , , , , , . Administrative data algorithms can describe ambulatory physician utilization. Health Serv Res. 2007;42(4):1783–1796.
- , , , et al. Validity of composite end points in clinical trials. BMJ. 2005;330(7491):594–596.
- , , , , , . Deficits in communication and information transfer between hospital‐based and primary care physicians: implications for patient safety and continuity of care. JAMA. 2007;297(8):831–841.
- , , , , , . Predicting readmission to the psychiatric hospital in a managed care environment: implications for quality indicators. Am J Psychiatry. 1997;154(3):337–340.
- , . The validity of readmission rate as a marker of the quality of hospital care, and a recommendation for its definition. N Z Med J. 2009;122(1289):63–70.
- , , , et al. Derivation and validation of an index to predict early death or unplanned readmission after discharge from hospital to the community. CMAJ. 2010;182(6):551–557.
- , , , et al. Information exchange among physicians caring for the same patient in the community. CMAJ. 2008;179(10):1013–1018.
- . Supply of physicians' services in Ontario. Hosp Q. 1999;3(2):17.
- , , , , . Evaluation of outreach clinics held by specialists in general practice in England. J Epidemiol Community Health. 2000;54(2):149–156.
- , , , et al. Association of communication between hospital‐based physicians and primary care providers with patient outcomes. J Gen Intern Med. 2009;24(3):381–386.
- , , , et al. Relationship between hospital readmission and mortality rates for patients hospitalized with acute myocardial infarction, heart failure, or pneumonia. JAMA. 2013;309(6):587–593.
- , . A conceptual framework for the study of early readmission as an indicator of quality of care. Soc Sci Med. 1996;43(11):1533–1541.
- , , . Rehospitalizations among patients in the Medicare fee‐for‐service program. N Engl J Med. 2009;360(14):1418–1428.
- , , , et al. Effect of a postdischarge virtual ward on readmission or death for high‐risk patients: a randomized clinical trial. JAMA. 2014;312(13):1305–1312.
- , . Less is more: how less health care can result in better health. Arch Intern Med. 2010;170(9):749–750.
Transitions in care are vulnerable periods. As patients are transferred between settings of care (such as from hospital back to the community), communication between healthcare providers is vital for care continuity.[1] A significant number of preventable adverse events may be related to ineffective communication between care providers.[1, 2, 3] The advent of specialized care, such as the introduction of hospitalists in acute care settings, has created an environment in which a patient's most responsible physician can often change multiple times as they move through the healthcare system.[4] Although there are many benefits to this type of concentrated care, the increase in care transitions may result in breakdowns in communication that may then be linked to risks in patient safety and suboptimal patient outcomes.[5, 6, 7, 8]
Improved continuity of care has been demonstrated to enhance patient safety during care transitions.[7] Efforts to develop continuity of care interventions are largely focused on care‐provider continuity, improved facilitation of communication, care planning, and increasing involvement of primary care physicians during follow‐up to hospitalizations and specialist visits.[9, 10] Such continuity of care efforts may provide a moderate benefit, but there remains room for improvement.[10, 11]
One dimension of continuity of care that has received limited attention is the potential impact of primary care physicians hospital visits to their hospitalized patients in a supportive‐care role.[12] In these situations, the primary care physician is neither the most responsible physician nor are they involved directly in their patient's hospital care. However, visiting their patient implies that they are aware of the hospitalization, thereby facilitating the potential for communication between care providers. Primary care physicians can also provide valuable contextual and relevant information as well as be involved in the discharge process. To identify the extent to which primary care physicians visit hospitalized patients and to measure the potential impact of primary care physician supportive visits on future outcomes, we used population‐level data to determine the frequency of supportive‐care visits by primary care physicians to hospitalized patients and to identify the association between these visits, patient outcomes, and health services utilization.
METHODS
Overview
We applied a retrospective cohort design utilizing linked population‐based administrative databases in the province of Ontario, Canada to examine outcome differences between patients who received a supportive‐care in‐hospital visit by their primary care physician compared to those who did not.
Databases
We assembled the cohort from linked and encrypted population‐based healthcare administrative databases. Data were derived from information on patients and physicians from the Ontario Health Insurance Plan, the Canadian Census, the Canadian Institute of Health Information Hospital Discharge Abstract Database, Registered Persons Databases, National Ambulatory Care Reporting System, Corporate Provider Database, Client Agency Program Enrolment, and Home Care Database. These databases have been validated and widely used in numerous studies.[13, 14, 15] All adults aged18 years who were discharged from the hospital in Ontario, Canada between January 1, 2008 and December 31, 2009 were included. Patients transferred to nursing homes or other acute care facilities following discharge, including rehabilitation centers, were excluded because they may have different readmission patterns. Among remaining hospitalized patients, only those with an identifiable primary care physician in the community were included. The patientprimary care physician pairings were identified using validated algorithms based on historical physician billing information.[16] This approach, adapted from previous studies, maximized the comparability among the study groups.[17, 18] In addition to having an historical relationship with the patients, primary care physicians had to have a history of conducting in‐hospital supportive visits (i.e., visits to at least 2 hospital patients within the previous year) for the patientprimary care physician pair to be included. This criterion was included to increase the likelihood that we were capturing a usual physician practice behavior and not a single circumstantial visit by a primary care physician. The history of supportive visits was also identified with physician billing data using a specific fee code.
Exposure
The exposure of interest was an in‐hospital visit in a supportive‐care role by the primary care physician during a patient's hospitalization and was obtained from physician fee codes. The fee paid for a visit during the study period was less than $20 CND.
Outcome Measures
Two different composite outcome measures were examined. The primary outcome was a composite of an emergent hospital readmission, death, or emergency department visit (without hospital admission). A composite measure was utilized to account for all outcomes simultaneously and thus be representative of the overall patient experience.[19] This approach has been applied in several studies examining continuity of care.[19, 20, 21] The secondary outcome examined processes of care. It was a composite evaluating ambulatory health services use postdischarge, specifically the number of primary care physician office visits and formal (ie, paid for by the universal provincial health plan) home‐care services. Home‐care services included both visits for nursing care as well as formal social support such as personal care. All outcome measures were assessed at 30 and 90 days following hospital discharge to assess for short and medium range outcomes.[22]
Patient Characteristics
Patient demographics including age, sex, low income (defined as individual income below $16,018 [CND] or couples income below $24,175 [CND]), living in a rural region, and the number of previous visits with primary care physicians were described from the available data. Readmission risk from the initial hospitalization was calculated based on the LACE score.[23] The LACE score is a validated measure of 30‐day readmission risk based on healthcare administrative data that account for (L) length of stay, (A) acute admission, (C) comorbid disease burden, and number of (E) emergency department visits in previous 6 months.[23] The LACE score ranges from 0 to 19, which correspond to a probability of readmissions of 2% to 43.7%, respectively. We considered individuals to have a high risk of readmission with a LACE score 10, which corresponds to a probability of readmission of 12.2%.[23]
Statistical Analyses
Descriptive statistics were used to compare patient characteristics among those with a primary care physician supportive‐care visit to those without. Logistic regression modeling was conducted to examine the impact of primary care physician visits on outcomes. The results reported here reflect the selection of adjusting for the confounders of age, sex, a history of primary care physician visits, low income, rurality, and the LACE score.
Ethics
The project analysis was conducted at the Institute for Clinical Evaluative Sciences (ICES) in Toronto, Ontario and was approved by the Sunnybrook Health Sciences Centre Research Ethics Board.
RESULTS
Overview
There were 11,316 primary care physicians identified as practicing in Ontario during the study period, of which 3236 had a history of conducting regular in‐hospital visits to 2 or more patients. The final patient cohort consisted of 164,059 hospitalized patients; 19,614 patients received a visit from their primary care physician, whereas 144,445 did not (Figure 1).
The hospitalized patients who received a visit from their primary care physician were significantly different than the patients who did not receive an in‐hospital visit (Table 1). Notably, patients who received a visit by their primary care physician had longer lengths of hospital stay (9.7 days vs 6.8 days, P<0.001). As well, a greater proportion had a high 30‐day readmission risk (LACE score10: 39.4% vs 29.9%, P<0.001) (Table 1).[21]
| Variablea | With PCP Visit (N=19,614) | Without PCP Visit (N=144,445) |
|---|---|---|
| ||
| Age, meanSD | 68.3716.85 | 65.7318.54 |
| Sex, no. of males | 9,393 (47.9%) | 67,030 (46.4%) |
| Low income | 3,937 (20.1%) | 30,157 (20.9%) |
| Individuals living in rural regions, no. | 1,951 (9.9%) | 25,731 (17.8%) |
| PCP visits in previous 6 months, meanSD | 4.764.47 | 4.174.28 |
| Length of stay, d, meanSD | 9.7217.40 | 6.7913.17 |
| Acute emergent visits, no. | 19,138 (97.6%) | 136,374 (94.4%) |
| Charlson score, meanSD | 1.061.60 | 0.921.49 |
| ED visits in previous 6 months, meanSD | 0.951.48 | 1.091.98 |
| LACE score, meanSDc | 9.022.88 | 8.103.02 |
| High risk for readmission (LACE score10), no. (%)c | 7,721 (39.4%) | 43,126 (29.9%) |
Patients who received an in‐hospital visit by their primary care physician were significantly different from those who did not (Table 2). They were older (68.4 years vs 65.7 years), and had a higher risk of readmission (LACE score of 9 vs 8). As well, proportionally fewer patients who received a visit were from rural regions than in the comparator group (9.9% of patients visited were from rural regions vs 17.8% of patients who did not receive a visit) (Table 2).
| Variable | Patients Who Received an In‐hospital Visit (N=19,614) | Patients Who Did Not Receive an In‐hospital Visit (N=144,445) | P Value |
|---|---|---|---|
| |||
| Primary outcome of emergency department visit, hospital readmission, or death | |||
| 30 days postdischarge, no. (%) | |||
| Readmission | 1,742 (8.9%) | 11,212 (7.8%) | <0.001 |
| ED visit | 2,039 (10.4%) | 16,823 (11.6%) | <0.001 |
| Death | 727 (3.7%) | 4,688 (3.2%) | <0.001 |
| Composite endpointa | 4,227 (21.6%) | 30,848 (21.4%) | 0.533 |
| 90 days postdischarge | |||
| Readmission | 2,791 (14.2%) | 18,257 (12.6%) | <0.001 |
| ED visit | 3,652 (18.6%) | 29,590 (20.5%) | <0.001 |
| Death | 1,507 (7.7%) | 9,821 (6.8%) | <0.001 |
| Composite endpointa | 7,125 (36.3%) | 52,245 (36.2%) | 0.668 |
| Secondary outcome of PCP office visits and home‐care services | |||
| 30 days postdischarge | |||
| Community PCP visits, meanSD | 3.85.1 | 3.14.6 | <0.001 |
| PCP visit, no. (%) | 15,732 (80.2%) | 108,266 (75%) | <0.001 |
| Home‐care services, no. (%) | 6,197 (31.6%) | 38,745 (26.8%) | <0.001 |
| Composite endpoint, no. (%)b | 16,851 (85.9%) | 117, 290 (81.2%) | <0.001 |
| 90 days postdischarge | |||
| Community PCP visits, meanSD | 8.210.1 | 6.99.3 | <0.001 |
| PCP visit, no. (%) | 18,112 (92.3%) | 128, 806 (89.2%) | <0.001 |
| Home‐care services, no. (%) | 7,256 (37.0%) | 45,675 (31.6%) | <0.001 |
| Composite endpoint, no. (%)b | 18, 504 (94.3%) | 132, 448 (91.7%) | <0.001 |
Individual Outcomes
Patients who received an in‐hospital visit by their primary care physician were also more likely to be readmitted within 30 days of discharge (8.9% vs 7.8%, P<0.001) and within 90 days of discharge (14.2% vs 12.6%, P<0.001). Additionally, patients who were visited by their primary care physician while hospitalized were more likely to die within 30 days postdischarge than those who did not receive an in‐hospital visit (3.7% vs 3.2%, P<0.001) and similarly by 90 days postdischarge (7.7% vs 6.8%, P<0.001) (Table 2).
Patients who received an in‐hospital visit were less likely to visit the emergency department at 30 days (10.4% vs 11.6%, P<0.001) and at 90 days (18.6% vs 20.5%, P<0.001) compared to patients who did not receive an in‐hospital visit (Table 2).
The patients who received in‐hospital visits by their primary care physician had a greater average number of primary care physician visits in the community at 30 days (3.8 vs 3.1, P<0.001) and 90 days (8.2 vs 6.9, P<0.001) (Table 2). Additionally, a higher proportion of patients who received an in‐hospital visit accessed home‐care services at 30 days postdischarge (31.6% vs 26.8%, P<0.001) and 90 days postdischarge (37.0% vs 31.6%, P<0.001) (Table 2).
Primary Outcome
There was no difference in proportion of patients who experienced the composite endpoint at 30 days (4227 [21.6%] vs 30,848 [21.4%], P>0.5) or 90 days (7125 [36.3%] vs 52,245 [36.2%], P>0.6) for patients who received an in‐hospital visit by their primary care physician compared to those who did not. The unadjusted model found no statistically significant difference between the 2 groups upon a primary care physician visit (odds ratio [OR]: 1.01; 95% confidence interval [CI]: 0.98‐1.04). However, once adjusting for differences in the groups for patient factors such as age, sex, location and health status, patients who received an in‐hospital visit by their primary care physician had lower adjusted risk for the composite outcome at 30 days postdischarge (adjusted OR [aOR]: 0.92; 95% CI: 0.89‐0.96) and 90 days postdischarge (aOR: 0.90; 95% CI: 0.87‐0.92) (Table 3). Estimates for each individual component of the composite outcome revealed significantly lower risk for ED visit and death but similar risk for readmission at both 30 days and 90 days after hospital discharge for patients who received and in‐hospital visit from their primary care physician and those who did not (Table 3).
| Variable | Unadjusted Odds Ratio (95% CI) | Adjusted Odds Ratio (95% CI)a |
|---|---|---|
| ||
| Primary outcome of emergency department visit, hospital readmission, or death | ||
| 30 days postdischarge | ||
| Readmission | 1.16 (1.10‐1.22) | 1.03 (0.97‐1.08) |
| ED visit | 0.88 (0.84‐0.92) | 0.88 (0.84‐0.92) |
| Death | 1.15 (1.06‐1.24) | 0.88 (0.81‐0.96) |
| Composite endpointb | 1.01 (0.98‐1.05) | 0.92 (0.89‐0.96) |
| 90 days postdischarge | ||
| Readmission | 1.15 (1.10‐1.20) | 1.00 (0.96‐1.04) |
| ED visit | 0.89 (0.86‐0.92) | 0.89 (0.86‐0.93) |
| Death | 1.14 (1.08‐1.21) | 0.87 (0.82‐0.93) |
| Composite endpointb | 1.01 (0.98‐1.04) | 0.90 (0.87‐0.92) |
| Secondary outcome of PCP office visits and home‐care services | ||
| 30 days postdischarge | ||
| Community PCP visits | 1.35 (1.31‐1.41) | 1.21 (1.16‐1.25) |
| Home‐care services | 1.26 (1.22‐1.30) | 1.05 (1.01‐1.09) |
| Composite endpointc | 1.41 (1.34‐1.47) | 1.16 (1.11‐1.21) |
| 90 days postdischarge | ||
| Community PCP visits | 1.46 (1.39‐1.55) | 1.25 (1.18‐1.33) |
| Home‐care services | 1.27 (1.23‐1.31) | 1.05 (1.01‐1.08) |
| Composite endpointc | 1.51 (1.42‐1.61) | 1.19 (1.12‐1.27) |
Secondary Outcome
Patients who received an in‐hospital visit by their primary care physician were more likely to experience the composite outcome of home‐care services and community primary care physician visits at 30 postdischarge (16,851 [85.9%] vs 117,290 [81.2%], P<0.001) and 90 days postdischarge (18,504 [94.3%] vs 132,448 [91.7%], P<0.001) compared to patients who did not receive an in‐hospital visit (Table 3). Once accounting for patient variables such as age, sex, location, and health status, patients who received an in‐hospital visit by their primary care physician had a higher adjusted risk for the composite outcome at 30 days postdischarge (aOR: 1.16; 95% CI: 1.11‐1.21) and 90 days postdischarge (aOR: 1.19; 95% CI: 1.12‐1.27) (Table 3).
DISCUSSION
Our population‐based study of primary care physicians is among the first to examine outcomes of patients whose primary care physicians have a history of providing supportive visits to hospitalized patients. After controlling for risk differences in patients at hospital discharge, we found that a primary care physician visit to a patient in the hospital was associated with a lower adjusted risk for the composite outcome of death, emergent hospital readmission, or emergency department visit at 30 and 90 days postdischarge compared to hospitalized patients who did not receive a visit by their primary care physician. We found this to be driven by patients having a lower risk of emergency department visits and death, whereas there was a similar risk of hospital readmission. We also found that visited patients were more likely to access home‐care services and have more primary care physician visits in the community following discharge.
The unadjusted model differs substantially from the adjusted model. On the surface this is an apparent paradox where the unadjusted results suggest an association with potential harm or no difference with a supportive visit. Conversely, the adjusted model suggests a reduction in harms. The differences between the unadjusted and adjusted model is driven by changes in the point estimates for readmission and death rates at both 30 and 90 day postdischarge. Prior to adjustment, it appears as if a primary care physician visit is associated with a significant increase of death; however, upon adjustment, it is associated with a significant reduction in death. Interestingly, this is a different effect than that observed with the secondary analysis, where the adjusted analyses demonstrate a more modest (but still positive) effect of supportive‐care visits. This observed change is likely due to differences in the patient groups. We can speculate that this may be an observed phenomenon of primary care physicians opting to visit their sicker patients, as perhaps it should be; however, further research is required to fully understand the real drivers of a supportive visit.
Our results are consistent with an earlier study that identified that a minority number of primary care physicians visit their hospitalized patients.[24] As well, findings from a randomized controlled trial of 364 patients over 60 years old identified a limited impact of primary care physician visits on patient outcomes but noted enhanced access to community health services.[12] Our work highlights the potential impact of primary care physician visits, which could, in theory, be leveraged and be an important role that primary care physicians can play in planning postdischarge care and improving the quality of care following hospitalization.
Our research study did not examine the impact of in‐hospital primary care physician visits on patient satisfaction directly. However, it has been demonstrated that patients have a strong desire for their primary care physician to be involved in their hospital care and their preference is for direct contact, with face‐to‐face visits compared to telephone or other communication.[25] This choice is important because dissatisfaction with services is associated with a loss of patient confidence in care quality and decreased adherence.[26] Also, primary care physicians acknowledge that information exchange is lacking when their patients are discharged, and that improving this aspect of a patient's care transition is important.[20] Research into discharge summaries as a tool to fill the communication gap has noted some success, yet there remains uncertainty regarding the type of information that should be included in a discharge summary, the time frame in which primary care physicians actually receive the summaries, and the accuracy of the information provided.[20, 27]
Our use of population‐based administrative data sources make the findings of our research generalizable to other similarly designed healthcare systems where a primary care physician may visit their hospitalized patients in a supportive‐care role. We were interested in a complex patientphysician interaction with a number of potential confounding factors, and our use of a composite measure represents the broad outcomes from this contact. Our cohort methodology was designed to isolate the exposure of interest while maximizing uniformity between the 2 study groups on other characteristics. Additionally a number of potential confounding factors were considered in an effort to isolate the effect of the primary care physician in‐hospital visit such as age, comorbid disease, and risk of hospital readmission.[12] The findings of our work support that of earlier research, but on a broader and more generalizable scale.[12]
There were notable differences between the intervention and control patient populations in the proportion of patients from rural regions who receive a supportive visit. This may be due to systemic differences between rural and nonrural regions with regard to access to care and ease of visit by primary care physicians. Alternatively, observed differences may be due to limitations of our study design in that some rural environments rely on primary care physicians to be involved in hospital care for the region. As such, they may actually be visiting their patients in a manner that was not captured as a supportive‐care visit. This is an important area that should be pursued in the future.
We acknowledge there are limits to our research findings. First, the nature of administrative data introduces challenges to causal inferences. As such, we are careful to describe associations and not draw causative links as there may be additional variables influencing outcomes including the patientphysician relationship, the location of the hospital relative to the physician practice and/or home, the time of the primary care physician visit, primary care physician hospital privileges for supportive‐care visits, and the number of other patients the primary care physician had in the same hospital at the same time. A second limitation is the use of the selected outcomes, which may not be direct measures of care quality.[28] However, the selected outcomes have been shown to be good quality measures in other work relevant to health policy.[8, 20, 21, 29] Third, the use of a composite outcome may over‐ or underestimate an exposure's impact.[19] Our composite outcome might have been dominated by some of its components. These observations may reflect the reality of primary care physicians visiting their sicker patients, or may be an attribute of the relatively short length of follow‐up of the study design. Fourth, we cannot determine whether there were additional interventions in place that assisted the continuity of care for primary care physician visits.[20, 27] However, this research included a broad range of hospitals throughout a large province where there were no system‐level quality interventions applied during this time. Fifth, our readmission rate may appear lower than other studies. However, our analysis is population based and not limited in focus to seniors.[30] As well, our posthospitalization death rates are similar to others, and the readmission rates are comparable to other Canadian studies.[31] Sixth, patients at higher risk for adverse outcomes may be identified as requiring more communication with their primary care physicians and we may not have fully captured this risk in our adjustment models, thereby underestimating the effect of exposure.[27] Further, primary care physicians may be involved in major medical decisions such as transitions to palliative care. A supportive‐care visit that facilitated these transitions and its ensuing outcomes may not have been included in our analysis. Seventh, our inherent assumption is that more care, such as posthospital primary care visits and home visits, denotes better care. This may not always be the case.[32] Eighth, physicians may find it difficult to visit their patient in the hospital, even when asked.[12] Finally, our findings are contingent on a system that supports primary care physicians being aware of their patients who become hospitalized. This is not only incumbent on any individual (eg, hospitalist) but a system where all providers work cohesively and seamlessly. On balance, however, these limitations do not overshadow our study's findings and conclusions.
Visits by primary care physicians to hospitalized patients are a longstanding tradition. The practice likely varies according to regional, patient, and individual physician characteristics.[16, 17, 18, 25] However, reimbursement codes for these services are present in a number of international healthcare systems' physician fee schedules with fairly modest remuneration amounts. The fairly nominal fee of less than $20 CND for a supportive‐care visit is similar to other systems and does not constitute a strong financial incentive to encourage this practice. The fee likely compensates the primary care physician for some of their time but comes with an opportunity cost to other aspects of their practice. Thus, results may differ in other environments or if the fee were higher, thereby incenting more primary care physicians to conduct visits. Indeed, the entire program for supportive hospital visits cost approximately $2.5 million CND per year for the 13 million people in the province of Ontario. Future work in this area could address the overall value and cost‐effectiveness of any potential fee changes. Still, it highlights the generalizability of our findings to other health systems and the ease in assessing the effect of the practice.
Overall, our findings underscore the importance and relevance for the practice of supportive‐care visits in its association with patient outcomes and health services utilization, which may prove to be an important key factor to improve quality healthcare. Our results suggest that an in‐hospital visit by a primary care physician may improve patient outcomes and increase subsequent support in the community. An in‐hospital supportive visit may be an additional method by which primary care physicians, and healthcare systems as a whole, strive to achieve the best care for patients.
Acknowledgements
Michael Manno, an analyst with the Institute of Clinical Evaluative Sciences (ICES) at the time of this study, assisted with the analyses.
Disclosures: This study was supported by the Institute for Clinical Evaluative Sciences (ICES), which is funded by an annual grant from the Ontario Ministry of Health and Long‐Term Care (MOHLTC). The opinions, results, and conclusions reported in this article are those of the authors and are independent from the funding sources. No endorsement by the ICES or the Ontario MOHLTC is intended or should be inferred. No researcher or persons involved in this study had any declared or otherwise known conflicts of interest. Stacey Brener received funding from a Canadian Institutes of Health Research (CIHR) Master's award in the area of primary care; the Ontario Graduate Student in Science and Technology award, an award from the CIHR Women's College Hospital Interdisciplinary Capacity Enhancement Team, and team grant OTG‐88591 from the CIHR. Susan Bronskill is supported by a CIHR New Investigator Award in the Area of Aging. Chaim Bell is supported by a CIHR/Canadian Patient Safety Institute Chair in Patient Safety and Continuity of Care. These funding agencies had no role in the design and conduct of the study; collection, management, analysis, or interpretation of the data; or preparation, review, or approval of the manuscript. The corresponding author had full access to all of the data in the study and takes responsibility for the integrity of the data and the accuracy of the data analysis. The authors report no conflicts of interest.
- , , , . Continuity of care and patient outcomes after hospital discharge. J Gen Intern Med. 2004;19(6):624–631.
- , , , et al. Incidence of adverse events and negligence in hospitalized patients: results of the Harvard Medical Practice Study I. 1991. Qual Saf Health Care. 2004;13(2):145–151; discussion 51–52.
- , , , , . The incidence and severity of adverse events affecting patients after discharge from the hospital. Ann Intern Med. 2003;138(3):161–167.
- The College of Family Physicians of Canada. Family physicians caring for hospital inpatients. Available at: http://www.cfpc.ca/uploadedFiles/Resources/Resource_Items/FPs20Inpt20Hosp20Care_En.pdf. Published October 2003. Accessed August 15, 2015.
- , , . Is volume related to outcome in health care?. A systematic review and methodologic critique of the literature. Ann Intern Med. 2002;137(6):511–520.
- , , , , , . Outcomes of care by hospitalists, general internists, and family physicians. N Engl J Med. 2007;357(25):2589–2600.
- , , , . Maintaining continuity of care: a look at the quality of communication between Ontario emergency departments and community physicians. CJEM. 2005;7(3):155–161.
- , , , et al. The independent association of provider and information continuity on outcomes after hospital discharge: implications for hospitalists. J Hosp Med. 2010;5(7):398–405.
- , , , , , . Patient‐reported care coordination: associations with primary care continuity and specialty care use. Ann Fam Med. 2011;9(4):323–329.
- , . The Wellness Planner: empowerment, quality of life, and continuity of care in mental illness. Arch Psychiatr Nurs. 2011;25(4):284–293.
- , , , et al. Evaluation of the impact of interdisciplinarity in cancer care. BMC Health Serv Res. 2011;11:144.
- , , , , . Can GP input into discharge planning result in better outcomes for the frail aged: results from a randomized controlled trial. Fam Pract. 1999;16(3):289–293.
- , , , et al. Association of ICU or hospital admission with unintentional discontinuation of medications for chronic diseases. JAMA. 2011;306(8):840–847.
- , , , , , . Potentially unintended discontinuation of long‐term medication use after elective surgical procedures. Arch Intern Med. 2006;166(22):2525–2531.
- , , , , , , . Canadian Institute for Health Information Discharge Abstract Database: A Validation Study. Toronto: Institute for Clinical Evaluative Sciences; 2006. Available at: http://www.ices.on.ca/Publications/Atlases‐and‐Reports/2006/Canadian‐Institute‐for‐Health‐Information. Accessed August 15, 2015.
- , , , . Primary care physician workforce and Medicare beneficiaries' health outcomes. JAMA. 2011;305(20):2096–2104.
- , , , . Assigning ambulatory patients and their physicians to hospitals: a method for obtaining population‐based provider performance measurements. Health Serv Res. 2007;42(1 pt 1):45–62.
- , , , , , . Administrative data algorithms can describe ambulatory physician utilization. Health Serv Res. 2007;42(4):1783–1796.
- , , , et al. Validity of composite end points in clinical trials. BMJ. 2005;330(7491):594–596.
- , , , , , . Deficits in communication and information transfer between hospital‐based and primary care physicians: implications for patient safety and continuity of care. JAMA. 2007;297(8):831–841.
- , , , , , . Predicting readmission to the psychiatric hospital in a managed care environment: implications for quality indicators. Am J Psychiatry. 1997;154(3):337–340.
- , . The validity of readmission rate as a marker of the quality of hospital care, and a recommendation for its definition. N Z Med J. 2009;122(1289):63–70.
- , , , et al. Derivation and validation of an index to predict early death or unplanned readmission after discharge from hospital to the community. CMAJ. 2010;182(6):551–557.
- , , , et al. Information exchange among physicians caring for the same patient in the community. CMAJ. 2008;179(10):1013–1018.
- . Supply of physicians' services in Ontario. Hosp Q. 1999;3(2):17.
- , , , , . Evaluation of outreach clinics held by specialists in general practice in England. J Epidemiol Community Health. 2000;54(2):149–156.
- , , , et al. Association of communication between hospital‐based physicians and primary care providers with patient outcomes. J Gen Intern Med. 2009;24(3):381–386.
- , , , et al. Relationship between hospital readmission and mortality rates for patients hospitalized with acute myocardial infarction, heart failure, or pneumonia. JAMA. 2013;309(6):587–593.
- , . A conceptual framework for the study of early readmission as an indicator of quality of care. Soc Sci Med. 1996;43(11):1533–1541.
- , , . Rehospitalizations among patients in the Medicare fee‐for‐service program. N Engl J Med. 2009;360(14):1418–1428.
- , , , et al. Effect of a postdischarge virtual ward on readmission or death for high‐risk patients: a randomized clinical trial. JAMA. 2014;312(13):1305–1312.
- , . Less is more: how less health care can result in better health. Arch Intern Med. 2010;170(9):749–750.
© 2016 Society of Hospital Medicine
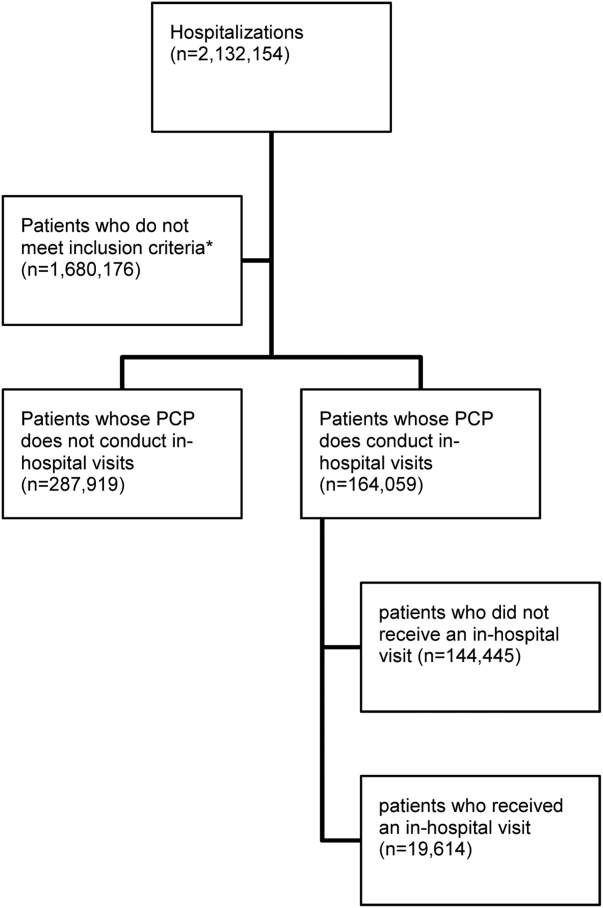
Timely Discharge Communication
In July 2003, as a fresh intern, I was introduced to care transitions and our tool for information transfer at hospital dischargethe fax machine. After writing our discharge order and discharge prescriptions, the team would compose the discharge summary and transmit the document via fax. I asked my resident where these faxes were going, because they were all sent to the same number in the hospital. Humorously, he did not know. Summaries were completed within days, or sometimes weeks, of discharge and faxed to a mysterious destination for filing and presumably for dissemination to outside providers. The message was clear to me that discharge summaries were not very useful or important, and they were definitely not seen as a critical part of the care‐transition process.
This attitude toward the discharge summary is not surprising. Historically, when physicians cared for their patients prior to, during, and after hospitalization, the goal of the discharge summary was to document patients' care for hospital records. It was not critical as a communication tool unless a patient was being transferred to another healthcare facility and a new care team. However, that all changed with decreasing hospital length of stay, the contemporaneous rise in postacute care discharges, the rise of the hospitalist care model, and the resulting transition of care from hospitalist to outpatient physician. Clear, rapid completion and communication of discharge summaries became essential for safe transitions in care.
The lack of focus on the discharge summary as a communication tool is reflected in regulations and standards of accreditation bodies. In 1986, the Medicare Condition of Participation required that inpatient records be completed within 30 days of discharge. Despite all of the changes in healthcare, the 30‐day requirement for discharge summary completion has persisted, often as a medical staff requirement. Similarly, The Joint Commission requires that discharge summaries include 6 components (reason for hospitalization, findings, treatment provided, discharge condition, instructions, and physician signature) but does not provide a timeframe. As a result of this lack of emphasis on timely completion of discharge summaries, studies have shown that although summaries usually include core elements, they are not completed in a timely fashion. Consequently, most postdischarge visits occur without the benefit of a discharge summary.[1] The most complex patients, who ideally are seen within a few days of discharge, are the least likely to have received the discharge summary at the first postdischarge visit.
Although it seems intuitively obvious that more timely communication of discharge summaries should lead to better outcomes, especially lower readmission rates, few studies have examined this issue, and the findings have not been consistent.[2, 3, 4, 5] Is it possible that physicians and other members of the healthcare team often communicate with each other through telephone calls and text messaging, especially about the sickest patients? If so, timely discharge summaries could have a small marginal effect on outcomes. Therefore, the study in this issue of the Journal of Hospital Medicine by Hoyer and colleagues is a welcome addition to the literature.[6] They found that discharge summary completion 3 or more days after discharge was associated with an adjusted odds ratio of 1.09, and the odds ratio increased with every additional 3‐day delay in completion.
It is possible that the analysis by Hoyer et al. underestimated the benefit of timely discharge summaries. To achieve full benefit, the discharge summary must be completed, accurately delivered, read by the receiving provider, and used at the first follow‐up visit. Their claims‐based analysis did not contains these latter elements, which would bias their results toward the null hypothesis. Future studies should examine how receipt of a summary, as opposed to transmission, is associated with postdischarge outcomes.
In subgroup analyses, no associations between discharge summary timeliness and readmissions were found for patients cared for on the gynecology‐obstetrics and surgical sciences services. Although caution is always needed when interpreting subgroup analyses, it is possible that the lack of association is attributable to the relatively acute conditions of many patients on these services, the relative provider continuity that persists in surgical disciplines, or whether these disciplines use other means of communication more frequently (eg, postdischarge phone calls among providers), mitigating the impact of the written discharge summary. Additional studies are needed to examine these issues. In addition, studies should examine how community or social factors might attenuate the benefit of timely communication, and explore the effect of discharge summaries on outcomes for patients admitted to an observation level of care, which is increasingly common and for which discharge summaries are less likely to be required.
The findings of the study by Hoyer et al. support proposed federal legislationthe Improving Medicare Post‐Acute Care Transformation Act of 2014. The proposed rule for discharge planning would change the Medicare Conditions of Participation to require transmission of discharge information, including the discharge summary, within 48 hours of discharge (
Fortunately, the work of preparing and transmitting the discharge summary is already part of the physician workflow, albeit often delayed. This traditional means of communication could even remain unchanged in form, if the order of the workflow could be altered in terms of timeliness, and no additional work would be created. With the hospitalization fresher in memory at the time of discharge, work might even be reduced. This efficiency presents a reasonable and immediately actionable appeal to providers.
The challenge to providers and systems remains to refine the quality and efficiency of communication and to move health communication into the 21st century. Tremendous potential exists for interactive communication among providers at discharge, which will not only build the quality of information delivered, but possibly also the qualitative experience of communication, building relationships in our increasingly complex and fragmented delivery networks. This may be a disappointment to the manufacturers of fax machines, but it will be a welcome improvement for caregivers and patients.
Disclosure
Nothing to report.
- , , , , , . Deficits in communication and information transfer between hospital‐based and primary care physicians: implications for patient safety and continuity of care. JAMA. 2007;297(8):831–841.
- , , , . Redefining and redesigning hospital discharge to enhance patient care: a randomized controlled study. J Gen Intern Med. 2008;23(8):1228–1233.
- , , , et al. A reengineered hospital discharge program to decrease rehospitalization: a randomized trial. Ann Intern Med. 2009;150(3):178–187.
- , , , et al. Reduction of 30‐day postdischarge hospital readmission or emergency department (ED) visit rates in high‐risk elderly medical patients through delivery of a targeted care bundle. J Hosp Med. 2009;4(4):211–218.
- , , , et al. Association of discharge summary quality with readmission risk for patients hospitalized with heart failure exacerbation. Circ Cardiovasc Qual Outcomes. 2015;8(1):109–111.
- , , , , . Association between days‐to‐complete inpatient discharge summaries with all‐payer hospital readmissions in Maryland. J Hosp Med. 2016;11(00):000–000.
- Revisions to requirements for discharge planning for hospitals, critical access hospitals, and home health agencies. Fed Regist. 2015;80(212):68126–68155.
In July 2003, as a fresh intern, I was introduced to care transitions and our tool for information transfer at hospital dischargethe fax machine. After writing our discharge order and discharge prescriptions, the team would compose the discharge summary and transmit the document via fax. I asked my resident where these faxes were going, because they were all sent to the same number in the hospital. Humorously, he did not know. Summaries were completed within days, or sometimes weeks, of discharge and faxed to a mysterious destination for filing and presumably for dissemination to outside providers. The message was clear to me that discharge summaries were not very useful or important, and they were definitely not seen as a critical part of the care‐transition process.
This attitude toward the discharge summary is not surprising. Historically, when physicians cared for their patients prior to, during, and after hospitalization, the goal of the discharge summary was to document patients' care for hospital records. It was not critical as a communication tool unless a patient was being transferred to another healthcare facility and a new care team. However, that all changed with decreasing hospital length of stay, the contemporaneous rise in postacute care discharges, the rise of the hospitalist care model, and the resulting transition of care from hospitalist to outpatient physician. Clear, rapid completion and communication of discharge summaries became essential for safe transitions in care.
The lack of focus on the discharge summary as a communication tool is reflected in regulations and standards of accreditation bodies. In 1986, the Medicare Condition of Participation required that inpatient records be completed within 30 days of discharge. Despite all of the changes in healthcare, the 30‐day requirement for discharge summary completion has persisted, often as a medical staff requirement. Similarly, The Joint Commission requires that discharge summaries include 6 components (reason for hospitalization, findings, treatment provided, discharge condition, instructions, and physician signature) but does not provide a timeframe. As a result of this lack of emphasis on timely completion of discharge summaries, studies have shown that although summaries usually include core elements, they are not completed in a timely fashion. Consequently, most postdischarge visits occur without the benefit of a discharge summary.[1] The most complex patients, who ideally are seen within a few days of discharge, are the least likely to have received the discharge summary at the first postdischarge visit.
Although it seems intuitively obvious that more timely communication of discharge summaries should lead to better outcomes, especially lower readmission rates, few studies have examined this issue, and the findings have not been consistent.[2, 3, 4, 5] Is it possible that physicians and other members of the healthcare team often communicate with each other through telephone calls and text messaging, especially about the sickest patients? If so, timely discharge summaries could have a small marginal effect on outcomes. Therefore, the study in this issue of the Journal of Hospital Medicine by Hoyer and colleagues is a welcome addition to the literature.[6] They found that discharge summary completion 3 or more days after discharge was associated with an adjusted odds ratio of 1.09, and the odds ratio increased with every additional 3‐day delay in completion.
It is possible that the analysis by Hoyer et al. underestimated the benefit of timely discharge summaries. To achieve full benefit, the discharge summary must be completed, accurately delivered, read by the receiving provider, and used at the first follow‐up visit. Their claims‐based analysis did not contains these latter elements, which would bias their results toward the null hypothesis. Future studies should examine how receipt of a summary, as opposed to transmission, is associated with postdischarge outcomes.
In subgroup analyses, no associations between discharge summary timeliness and readmissions were found for patients cared for on the gynecology‐obstetrics and surgical sciences services. Although caution is always needed when interpreting subgroup analyses, it is possible that the lack of association is attributable to the relatively acute conditions of many patients on these services, the relative provider continuity that persists in surgical disciplines, or whether these disciplines use other means of communication more frequently (eg, postdischarge phone calls among providers), mitigating the impact of the written discharge summary. Additional studies are needed to examine these issues. In addition, studies should examine how community or social factors might attenuate the benefit of timely communication, and explore the effect of discharge summaries on outcomes for patients admitted to an observation level of care, which is increasingly common and for which discharge summaries are less likely to be required.
The findings of the study by Hoyer et al. support proposed federal legislationthe Improving Medicare Post‐Acute Care Transformation Act of 2014. The proposed rule for discharge planning would change the Medicare Conditions of Participation to require transmission of discharge information, including the discharge summary, within 48 hours of discharge (
Fortunately, the work of preparing and transmitting the discharge summary is already part of the physician workflow, albeit often delayed. This traditional means of communication could even remain unchanged in form, if the order of the workflow could be altered in terms of timeliness, and no additional work would be created. With the hospitalization fresher in memory at the time of discharge, work might even be reduced. This efficiency presents a reasonable and immediately actionable appeal to providers.
The challenge to providers and systems remains to refine the quality and efficiency of communication and to move health communication into the 21st century. Tremendous potential exists for interactive communication among providers at discharge, which will not only build the quality of information delivered, but possibly also the qualitative experience of communication, building relationships in our increasingly complex and fragmented delivery networks. This may be a disappointment to the manufacturers of fax machines, but it will be a welcome improvement for caregivers and patients.
Disclosure
Nothing to report.
- , , , , , . Deficits in communication and information transfer between hospital‐based and primary care physicians: implications for patient safety and continuity of care. JAMA. 2007;297(8):831–841.
- , , , . Redefining and redesigning hospital discharge to enhance patient care: a randomized controlled study. J Gen Intern Med. 2008;23(8):1228–1233.
- , , , et al. A reengineered hospital discharge program to decrease rehospitalization: a randomized trial. Ann Intern Med. 2009;150(3):178–187.
- , , , et al. Reduction of 30‐day postdischarge hospital readmission or emergency department (ED) visit rates in high‐risk elderly medical patients through delivery of a targeted care bundle. J Hosp Med. 2009;4(4):211–218.
- , , , et al. Association of discharge summary quality with readmission risk for patients hospitalized with heart failure exacerbation. Circ Cardiovasc Qual Outcomes. 2015;8(1):109–111.
- , , , , . Association between days‐to‐complete inpatient discharge summaries with all‐payer hospital readmissions in Maryland. J Hosp Med. 2016;11(00):000–000.
- Revisions to requirements for discharge planning for hospitals, critical access hospitals, and home health agencies. Fed Regist. 2015;80(212):68126–68155.
Discharge Summaries and Readmissions
Across the continuum of care, the discharge summary is a critical tool for communication among care providers.[1] In the United States, the Joint Commission policies mandate that all hospital providers complete a discharge summary for patients with specific components to foster effective communication with future providers.[2] Because outpatient providers and emergency physicians rely on clinical information in the discharge summary to ensure appropriate postdischarge continuity of care, timely documentation is potentially an essential aspect of readmission reduction initiatives.[3, 4, 5] Prior reports indicate that poor discharge documentation of follow‐up plan‐of‐care increases the risk of hospitalization, whereas structured instructions, patient education, and direct communications with primary care physicians (PCPs) reduce repeat hospital visits.[6, 7, 8, 9] However, the current literature is limited in its narrow focus on the contents of discharge summaries, considered only same‐hospital readmissions, or considered readmissions within 3 months of discharge.[10, 11, 12, 13] Moreover, some prior research has suggested no association between discharge summary timeliness with readmission,[12, 13, 14] whereas another study did find a relationship,[15] hence the need to study this further is important. Filling this gap in knowledge could provide an avenue to track and improve quality of patient care, as delays in discharge summaries have been linked with pot‐discharge adverse outcomes and patient safety concerns.[15, 16, 17, 18] Because readmissions often occur soon after discharge, having timely discharge summaries may be particularly important to outcomes.[19, 20]
This research began under the framework of evaluating a bundle of care coordination strategies that were implemented at the Johns Hopkins Health System. These strategies were informed by the early Centers for Medicare and Medicaid Services (CMS) demonstration projects and other best practices that have been documented in the literature to improve utilization and improve communication during transitions of care.[21, 22, 23, 24, 25] Later they were augmented through a contract with the Center of Medicare and Medicaid Innovation to improve access to healthcare services and improve patient outcomes through improved care coordination processes. One of the domains our institution has increased efforts to improve is in provider handoffs. Toward that goal, we have worked to disentangle the effects of different factors of provider‐to‐provider communication that may influence readmissions.[26] For example, effective written provider handoffs in the form of accurate and timely discharge summaries was considered a key care coordination component of this program, but there was institutional resistance to endorsing an expectation that discharge summary turnaround should be shortened. To build a case for this concept, we sought to test the hypothesis that, at our hospital, longer time to complete hospital discharge summaries was associated with increased readmission rates. Unique to this analysis is that, in the state of Maryland, there is statewide reporting of readmissions, so we were able to account for intra‐ and interhospital readmissions for an all‐payer population. The authors anticipated that findings from this study would help inform discharge quality‐improvement initiatives and reemphasize the importance of timely discharge documentation across all disciplines as part of quality patient care.
METHODS
Study Population and Setting
We conducted a single‐center, retrospective cohort study of 87,994 consecutive patients discharged from Johns Hopkins Hospital, which is a 1000‐bed, tertiary academic medical center in Baltimore, Maryland between January 1, 2013 and December 31, 2014. One thousand ninety‐three (1.2%) of the records on days to complete the discharge summary were missing and were excluded from the analysis.
Data Source and Covariates
Data were derived from several sources. The Johns Hopkins Hospital data mart financial database, used for mandatory reporting to the State of Maryland, provided the following patient data: age, gender, race/ethnicity, payer (Medicare, Medicaid, and other) as a proxy for socioeconomic status,[27] hospital service prior to discharge (gynecologyobstetrics, medicine, neurosciences, oncology, pediatrics, and surgical sciences), hospital length of stay (LOS) prior to discharge, Agency for Healthcare Research and Quality (AHRQ) Comorbidity Index (which is an update to the original Elixhauser methodology[28]), and all‐payerrefined diagnosis‐related group (APRDRG) and severity of illness (SOI) combinations (a tool to group patients into clinically comparable disease and SOI categories expected to use similar resources and experience similar outcomes). The Health Services Cost Review Commission (HSCRC) in Maryland provided the observed readmission rate in Maryland for each APRDRG‐SOI combination and served as an expected readmission rate. This risk stratification methodology is similar to the approach used in previous studies.[26, 29] Discharge summary turnaround time was obtained from institutional administrative databases used to track compliance with discharge summary completion. Discharge location (home, facility, home with homecare or hospice, or other) was obtained from Curaspan databases (Curaspan Health Group, Inc., Newton, MA).
Primary Outcome: 30‐Day Readmission
The primary outcome was unplanned rehospitalizations to an acute care hospital in Maryland within 30 days of discharge from Johns Hopkins Hospital. This was as defined by the Maryland HSCRC using an algorithm to exclude readmissions that were likely to be scheduled, as defined by the index admission diagnosis and readmission diagnosis; this algorithm is updated based on the CMS all‐cause readmission algorithm.[30, 31]
Primary Exposure: Days to Complete the Discharge Summary
Discharge summary completion time was defined as the date when the discharge attending physician electronically signs the discharge summary. At our institution, an auto‐fax system sends documents (eg, discharge summaries, clinic notes) to linked providers (eg, primary care providers) shortly after midnight from the day the document is signed by an attending physician. During the period of the project, the policy for discharge summaries at the Johns Hopkins Hospital went from requiring them to be completed within 30 days to 14 days, and we were hoping to use our analyses to inform decision makers why this was important. To emphasize the need for timely completion of discharge summaries, we dichotomized the number of days to complete the discharge summary into >3 versus 3 days (20th percentile cutoff) and modeled it as a continuous variable (per 3‐day increase in days to complete the discharge summary).
Statistical Analysis
To evaluate differences in patient characteristics by readmission status, analysis of variance and 2 tests were used for continuous and dichotomous variables, respectively. Logistic regression was used to evaluate the association between days to complete the discharge summary >3 days and readmission status, adjusting for potentially confounding variables. Before inclusion in the logistic regression model, we confirmed a lack of multicollinearity in the multivariable regression model using variance inflation factors. We evaluated residual versus predicted value plots and residual versus fitted value plots with a locally weighted scatterplot smoothing line. In a sensitivity analysis we evaluated the association between readmission status and different cutoffs (>8 days, 50th percentile; and >14 days, 70% percentile). In a separate analysis, we used interaction terms to test whether the association between the association between days to complete the discharge summary >3 days and hospital readmission varied by the covariates in the analysis (age, sex, race, payer, hospital service, discharge location, LOS, APRDRG‐SOI expected readmission rate, and AHRQ Comorbidity Index). We observed a significant interaction between 30‐day readmission and days to complete the discharge summary >3 days by hospital service. Hence, we separately calculated the adjusted mean readmission rates separately for each hospital service using the least squared means method for the multivariable logistic regression analysis and adjusting for the previously mentioned covariates. In a separate analysis, we used linear regression to evaluate the association between LOS and days to complete the discharge summary, adjusting for potentially confounding variables. Statistical significance was defined as a 2‐sided P < 0.05. Data were analyzed with R (version 2.15.0; R Foundation for Statistical Computing, Vienna, Austria;
RESULTS
Readmitted Patients
In the study period, 14,248 out of 87,994 (16.2%) consecutive eligible patients were readmitted to a hospital in Maryland from patients discharged from Johns Hopkins Hospital between January 1, 2013 and December 31, 2014. A total of 11,027 (77.4%) of the readmissions were back to Johns Hopkins Hospital. Table 1 compares characteristics of readmitted versus nonreadmitted patients, with the following variables being significantly different between these patient groups: age, gender, healthcare payer, hospital service, discharge location, length of stay expected readmission rate, AHRQ Comorbidity Index, and days to complete inpatient discharge summary.
| Characteristics | All Patients, N = 87,994 | Not Readmitted, N = 73,746 | Readmitted, N = 14,248 | P Value |
|---|---|---|---|---|
| ||||
| Age, y | 42.1 (25.1) | 41.3 (25.4) | 46.4 (23.1) | <0.001 |
| Male | 43,210 (49.1%) | 35,851 (48.6%) | 7,359 (51.6%) | <0.001 |
| Race | <0.001 | |||
| Caucasian | 45,705 (51.9%) | 3,8661 (52.4%) | 7,044 (49.4%) | |
| African American | 32,777 (37.2%) | 2,6841 (36.4%) | 5,936 (41.7%) | |
| Other | 9,512 (10.8%) | 8,244 (11.2%) | 1,268 (8.9%) | |
| Payer | <0.001 | |||
| Medicare | 22,345 (25.4%) | 17,614 (23.9%) | 4,731 (33.2%) | |
| Medicaid | 24,080 (27.4%) | 20,100 (27.3%) | 3,980 (27.9%) | |
| Other | 41,569 (47.2%) | 36,032 (48.9%) | 5,537 (38.9%) | |
| Hospital service | <0.001 | |||
| Gynecologyobstetrics | 9,299 (10.6%) | 8,829 (12.0%) | 470 (3.3%) | |
| Medicine | 26,036 (29.6%) | 20,069 (27.2%) | 5,967 (41.9%) | |
| Neurosciences | 8,269 (9.4%) | 7,331 (9.9%) | 938 (6.6%) | |
| Oncology | 5,222 (5.9%) | 3,898 (5.3%) | 1,324 (9.3%) | |
| Pediatrics | 17,029 (19.4%) | 14,684 (19.9%) | 2,345 (16.5%) | |
| Surgical sciences | 22,139 (25.2%) | 18,935 (25.7%) | 3,204 (22.5%) | |
| Discharge location | <0.001 | |||
| Home | 65,478 (74.4%) | 56,359 (76.4%) | 9,119 (64.0%) | |
| Home with homecare or hospice | 9,524 (10.8%) | 7,440 (10.1%) | 2,084 (14.6%) | |
| Facility (SNF, rehabilitation facility) | 5,398 (6.1%) | 4,131 (5.6%) | 1,267 (8.9%) | |
| Other | 7,594 (8.6%) | 5,816 (7.9%) | 1,778 (12.5%) | |
| Length of stay, d | 5.5 (8.6) | 5.1 (7.8) | 7.5 (11.6) | <0.001 |
| APRDRG‐SOI Expected Readmission Rate, % | 14.4 (9.5) | 13.3 (9.2) | 20.1 (9.0) | <0.001 |
| AHRQ Comorbidity Index (1 point) | 2.5 (1.4) | 2.4 (1.4) | 3.0 (1.8) | <0.001 |
| Discharge summary completed >3 days | 66,242 (75.3%) | 55,329 (75.0%) | 10,913 (76.6%) | <0.001 |
Association Between Days to Complete the Discharge Summary and Readmission
After hospital discharge, median (IQR) number of days to complete discharge summaries was 8 (416) days. After hospital discharge, median (IQR) number of days to complete discharge summaries and the number of days from discharge to readmission was 8 (416) and 11 (519) days, respectively (P < 0.001). Six thousand one hundred one patients (42.8%) were readmitted before their discharge summary was completed. The median (IQR) days to complete discharge summaries by hospital service in order from shortest to longest was: oncology, 6 (212) days; surgical sciences, 6 (312) days; pediatrics, 7 (315) days; gynecologyobstetrics, 8 (415) days; medicine, 9 (420) days; neurosciences, 12 (621) days.
When we divided the number of days to complete the discharge summary into deciles (02, 2.13, 3.14, 4.16, 6.18, 8.210, 10.114, 14.119, 19.130, >30), a longer number of days to complete discharge summaries had higher unadjusted and adjusted readmission rates (Figure 1). In unadjusted analysis, Table 2 shows that older age, male sex, African American race, oncological versus medicine hospital service, discharge location, longer LOS, higher APRDRG‐SOI expected readmission rate, and higher AHRQ Comorbidity Index were associated with readmission. Days to complete the discharge summary >3 days versus 3 days was associated with a higher readmission rate, with an unadjusted odds ratio (OR) and 95% confidence interval (CI) of 1.09 (95% CI: 1.04 to 1.13, P < 0.001).
| Characteristic | Bivariable Analysis* | Multivariable Analysis* | ||
|---|---|---|---|---|
| OR (95% CI) | P Value | OR (95% CI) | P Value | |
| ||||
| Age, 10 y | 1.09 (1.08 to 1.09) | <0.001 | 0.97 (0.95 to 0.98) | <0.001 |
| Male | 1.13 (1.09 to 1.17) | <0.001 | 1.01 (0.97 to 1.05) | 0.76 |
| Race | ||||
| Caucasian | Referent | Referent | ||
| African American | 1.21 (1.17 to 1.26) | <0.001 | 1.01 (0.96 to 1.05) | 0.74 |
| Other | 0.84 (0.79 to 0.90) | <0.001 | 0.92 (0.86 to 0.98) | 0.01 |
| Payer | ||||
| Medicare | Referent | Referent | ||
| Medicaid | 0.74 (0.70 to 0.77) | <0.001 | 1.03 (0.97 to 1.09) | 0.42 |
| Other | 0.57 (0.55 to 0.60) | <0.001 | 0.86 (0.82 to 0.91) | <0.001 |
| Hospital service | ||||
| Medicine | Referent | Referent | ||
| Gynecologyobstetrics | 0.18 (0.16 to 0.20) | <0.001 | 0.50 (0.45 to 0.56) | <0.001 |
| Neurosciences | 0.43 (0.40 to 0.46) | <0.001 | 0.76 (0.70 to 0.82) | <0.001 |
| Oncology | 1.14 (1.07 to 1.22) | <0.001 | 1.18 (1.10 to 1.28) | <0.001 |
| Pediatrics | 0.54 (0.51 to 0.57) | <0.001 | 0.77 (0.71 to 0.83) | <0.001 |
| Surgical sciences | 0.57 (0.54 to 0.60) | <0.001 | 0.92 (0.87 to 0.97) | 0.002 |
| Discharge location | ||||
| Home | Referent | |||
| Facility (SNF, rehabilitation facility) | 1.90 (1.77 to 2.03) | <0.001 | 1.11 (1.02 to 1.19) | 0.009 |
| Home with homecare or hospice | 1.73 (1.64 to 1.83) | <0.001 | 1.26 (1.19 to 1.34) | <0.001 |
| Other | 1.89 (1.78 to 2.00) | <0.001 | 1.25 (1.18 to 1.34) | <0.001 |
| Length of stay, d | 1.03 (1.02 to 1.03) | <0.001 | 1.00 (1.00 to 1.01) | <0.001 |
| APRDRG‐SOI expected readmission rate, % | 1.08 (1.07 to 1.08) | <0.001 | 1.06 (1.06 to 1.06) | <0.001 |
| AHRQ Comorbidity Index (1 point) | 1.27 (1.26 to 1.28) | <0.001 | 1.11 (1.09 to 1.12) | <0.001 |
| Discharge summary completed >3 days | 1.09 (1.04 to 1.14) | <0.001 | 1.09 (1.05 to 1.14) | <0.001 |

Multivariable and Secondary Analyses
In adjusted analysis (Table 2), patients discharged from an oncologic service relative to a medicine hospital service (OR: 1.19, 95% CI: 1.10 to 1.28, P < 0.001), patients discharged to a facility, home with homecare or hospice, or other location compared to home (facility OR: 1.11, 95% CI: 1.02 to 1.19, P = 0.009; home with homecare or hospice OR: 1.26, 95% CI: 1.19 to 1.34, P < 0.001; other OR: 1.25, 95% CI: 1.18 to 1.34, P < 0.001), patients with longer LOS (OR: 1.11 per day, 95% CI: 1.10 to 1.12, P < 0.001), patients with a higher expected readmission rates (OR: 1.01 per percent, 95% CI: 1.00 to 1.01, P < 0.001), and patients with a higher AHRQ comorbidity index (OR: 1.06 per 1 point, 95% CI: 1.06 to 1.06, P < 0.001) had higher 30‐day readmission rates. Overall, days to complete the discharge summary >3 days versus 3 days was associated with a higher readmission rate (OR: 1.09, 95% CI: 1.05 to 1.14, P < 0.001).
In a sensitivity analysis, discharge summary completion >8 days (median) versus 8 days was associated with higher unadjusted readmission rate (OR: 1.11, 95% CI: 1.07 to 1.15, P < 0.001) and a higher adjusted readmission rate (OR: 1.06, 95% CI: 1.02 to 1.10, P < 0.001). Discharge summary completion >14 days (70th percentile) versus 14 days was also associated with higher unadjusted readmission rate (OR: 1.15, 95% CI: 1.08 to 1.21, P < 0.001) and a higher adjusted readmission rate (OR: 1.09, 95% CI: 1.02 to 1.16, P = 0.008). The association between days to complete the discharge summary >3 days and readmissions was found to vary significantly by hospital service (P = 0.03). For comparing days to complete the discharge summary >3 versus 3 days, Table 3 shows that neurosciences, pediatrics, oncology, and medicine hospital services were associated with significantly increased adjusted mean readmission rates. Additionally, when days to complete the discharge summary was modeled as a continuous variable, we found that for every 3 days the odds of readmission increased by 1% (OR: 1.01, 95% CI: 1.00 to 1.01, P < 0.001).
| Days to Complete Discharge Summary by Hospital Service | Adjusted Mean Readmission Rate (95% CI)* | P Value |
|---|---|---|
| ||
| Gynecologyobstetrics | 0.30 | |
| 03 days, n = 1,792 | 5.4 (4.1 to 6.7) | |
| >3 days, n = 7,507 | 6.0 (4.9 to 7.0) | |
| Medicine | 0.04 | |
| 03 days, n = 6,137 | 21.1 (20.0 to 22.3) | |
| >3 days, n = 19,899 | 22.4 (21.6 to 23.2) | |
| Neurosciences | 0.02 | |
| 03 days, n = 1,116 | 10.1 (8.2 to 12.1) | |
| >3 days, n = 7,153 | 12.5 (11.6 to 13.5) | |
| Oncology | 0.01 | |
| 03 days, n = 1,885 | 25.0 (22.6 to 27.4) | |
| >3 days, n = 3,337 | 28.2 (26.6 to 30.2) | |
| Pediatrics | 0.001 | |
| 03 days, n = 4,561 | 9.5 (6.9 to 12.2) | |
| >3 days, n = 12,468 | 11.4 (8.9 to 13.9) | |
| Surgical sciences | 0.89 | |
| 03 days, n = 6,261 | 15.2 (14.2 to 16.1) | |
| >3 days, n = 15,878 | 15.1 (14.4 to 15.8) | |
In an unadjusted analysis, we found that the relationship between LOS and days to complete the discharge summary was not significant ( coefficient and 95% CI:, 0.01, 0.02 to 0.00, P = 0.20). However, we found a small but significant relationship in our multivariable analysis, such that each hospitalization day was associated with a 0.01 (95% CI: 0.00 to 0.02, P = 0.03) increase in days to complete the discharge summary.
DISCUSSION
In this single‐center retrospective analysis, the number of days to complete the discharge summary was significantly associated with readmissions after hospitalization. This association was independent of age, gender, comorbidity index, payer, discharge location, length of hospital stay, expected readmission rate based on diagnosis and severity of illness, and all hospital services. The odds of readmission for patients with delayed discharge summaries was small but significant. This is important in the current landscape of readmissions, particularly for institutions who are challenged to reduce readmission rates, and a small relative difference in readmissions may be the difference between getting penalized or not. In the context of prior studies, the results highlight the role of timely discharge summary as an under‐recognized metric, which may be a valid litmus test for care coordination. The findings also emphasize the potential of early summaries to expedite communication and to help facilitate quality of patient care. Hence, the study results extend the literature examining the relationship of delay in discharge summary with unfavorable patient outcomes.[15, 32]
In contrast to prior reports with limited focus on same‐hospital readmissions,[18, 33, 34, 35] readmissions beyond 30 days,[12] or focused on a specific patient population,[13, 36] this study evaluates both intra‐ and interhospital 30‐day readmissions in Maryland in an all‐payer, multi‐institution, diverse patient population. Additionally, prior research is conflicting with respect to whether timely discharges summaries are significantly associated with increased hospital readmissions.[12, 13, 14, 15] Although it is not surprising that inadequate care during hospitalization could result in readmissions, the role of discharge summaries remain underappreciated. Having a timely discharge summary may not always prevent readmissions, but our study showed that 43% of readmission occurred before the discharge summary completion. Not having a completed discharge summary at the time of readmission may have been a driver for the positive association between timely completion and 30‐day readmission we observed. This study highlights that delay in the discharge summary could be a marker of poor transitions of care, because suboptimal dissemination of critical information to care providers may result in discontinuity of patient care posthospitalization.
A plausible mechanism of the association between discharge summary delays and readmissions could be the provision of collateral information, which may potentially alter the threshold for readmissions. For example, in the emergency room/emergency department (ER/ED) setting, discharge summaries may help with preventable readmissions. For patients who present repeatedly with the same complaint, timely summaries to ER/ED providers may help reframe the patient complaints, such as patient has concern X, which was previously identified to be related to diagnosis Y. As others have shown, the content of discharge summaries, format, and accessibility (electronic vs paper chart), as well as timely distribution of summaries, are key factors that impact quality outcomes.[2, 12, 15, 37, 38] By detailing prior hospital information (ie, discharge medications, prior presentations, tests completed), summaries could help prevent errors in medication dosing, reduce unnecessary testing, and help facilitate admission triage. Summaries may have information regarding a new diagnosis such as the results of an endoscopic evaluation that revealed the source of occult gastrointestinal bleeding, which could help contextualize a complaint of repeat melena and redirect goals of care. Discussions of goals of care in the discharge summary may guide primary providers in continued care management plans.
Our study findings underscore a positive correlation between late discharge summaries and readmissions. However, the extent that this is a causal relationship is unclear; the association of delay in days to complete the discharge summary with readmission may be an epiphenomenon related to processes related to quality of clinical care. For example, delays in discharge summary completion could be a marker of other system issues, such as a stressed work environment. It is possible that providers who fail to complete timely discharge summaries may also fail to do other important functions related to transitions of care and care coordination. However, even if this is so, timely discharge summaries could become a focal point for discussion for optimization of care transitions. A discharge summary could be delayed because the patient has already been readmitted before the summary was distributed, thus making that original summary less relevant. Delays could also be a reflection of the data complexity for patients with longer hospital stays. This is supported by the small but significant relationship between LOS and days to complete the discharge summary in this study. Lastly, delays in discharge summary completion may also be a proxy of provider communication and can reflect the culture of communication at the institution.
Although unplanned hospital readmission is an important outcome, many readmissions may be related to other factors such as disease progression, rather than late summaries or the lack of postdischarge communication. For instance, prior reports did not find any association between the PCP seeing the discharge summaries or direct communications with the PCP and 30‐day clinical outcomes for readmission and death.[26, 39] However, these studies were limited in their use of self‐reported handoffs, did not measure quality of information transfer, and failed to capture a broader audience beyond the PCP, such as ED physicians or specialists.
Our results suggest that the relationship between days to complete discharge summaries and 30‐day readmissions may vary depending on whether the hospitalization is primarily surgical/procedural versus medical treatment. A recent study found that most readmissions after surgery were associated with new complications related to the procedure and not exacerbation of prior index hospitalization complications.[40] Hence, treatment for common causes of hospital readmissions after surgical or gynecological procedures, such as wound infections, acute anemia, ileus, or dehydration, may not necessarily require a completed discharge summary for appropriate management. However, we caution extending this finding to clinical practice before further studies are conducted on specific procedures and in different clinical settings.
Results from this study also support institutional policies that specify the need for practitioners to complete discharge summaries contemporaneously, such as at the time of discharge or within a couple of days. Unlike other forms of communication that are optional, discharge summaries are required, so we recommend that practitioners be held accountable for short turnaround times. For example, providers could be graded and rated on timely completions of discharge summaries, among other performance variables. Anecdotally at our institutions, we have heard from practitioners that it takes less time to complete them when you do them on the day of discharge, because the hospitalization course is fresher in their mind and they have to wade through less information in the medical record to complete an accurate discharge summary. To this point, a barrier to on‐time completion is that providers may have misconceptions about what is really vital information to convey to the next provider. In agreement with past research and in the era of the electronic medical record system, we recommend that the discharge summary should be a quick synthesis of key findings that incorporates only the important elements, such as why the patient was hospitalized, what were key findings and key responses to therapy, what is pending at the time of discharge, what medications the patient is currently taking, and what are the follow‐up plans, rather than a lengthy expose of all the findings.[13, 36, 41, 42]
Lastly, our study results should be taken in the context of its limitations. As a single‐center study, findings may lack generalizability. In particular, the results may not generalize to hospitals that lack access to statewide reporting. We were also not able to assess readmission for patients who may have been readmitted to a hospital outside of Maryland. Although we adjusted for pertinent variables such as age, gender, healthcare payer, hospital service, comorbidity index, discharge location, LOS, and expected readmission rates, there may be other relevant confounders that we failed to capture or measure optimally. Median days to complete the discharge summary in this study was 8 days, which is longer than practices at other institutions, and may also limit this study's generalizability.[15, 36, 42] However, prior research supports our findings,[15] and a systematic review found that only 29% and 52% of discharge summaries were completed by 2 weeks and 4 weeks, respectively.[9] Finally, as noted above and perhaps most important, it is possible that discharge summary turnaround time does not in itself causally impact readmissions, but rather reflects an underlying commitment of the inpatient team to effectively coordinate care following hospital discharge.
CONCLUSION
In sum, this study delineates an underappreciated but important relationship of timely discharge summary completion and readmission outcomes. The discharge summary may be a relevant metric reflecting quality of patient care. Healthcare providers may begin to target timely discharge summaries as a potential focal point of quality‐improvement projects with the goal to facilitate better patient outcomes.
Disclosures
The authors certify that no party having a direct interest in the results of the research supporting this article has or will confer a benefit on us or on any organization with which we are associated, and, if applicable, the authors certify that all financial and material support for this research (eg, Centers for Medicare and Medicaid Services, National Institutes of Health, or National Health Service grants) and work are clearly identified. This study was supported by funding opportunity, number CMS‐1C1‐12‐0001, from the Centers for Medicare and Medicaid Services and Center for Medicare and Medicaid Innovation. Its contents are solely the responsibility of the authors and do not necessarily represent the official views of the Department of Health and Human Services or any of its agencies.
- , , , et al. Development and sustainability of an inpatient‐to‐outpatient discharge handoff tool: a quality improvement project. Jt Comm J Qual Patient Saf. 2014;40(5):219–227.
- , , , , , . Documentation of mandated discharge summary components in transitions from acute to subacute care. In: Henriksen K, Battles JB, Keyes MA, et al., eds. Advances in Patient Safety: New Directions and Alternative Approaches. Vol. 2. Culture and Redesign. Rockville, MD: Agency for Healthcare Research and Quality; 2008.
- , , , . Better transitions: improving comprehension of discharge instructions. Front Health Serv Manage. 2009;25(3):11–32.
- , , , . Structured discharge education improves early outcome in orthopedic patients. Int J Orthop Trauma Nurs. 2010;14(2):66–74.
- , , , et al. Hospital discharge documentation and risk of rehospitalisation. BMJ Qual Saf. 2011;20(9):773–778.
- , , . The hospital discharge: a review of a high risk care transition with highlights of a reengineered discharge process. J Patient Saf. 2007;3(2):97–106.
- , , , , . Interventions to reduce 30‐day rehospitalization: a systematic review. Ann Intern Med. 2011;155(8):520–528.
- , , , , , . Effect of hospital follow‐up appointment on clinical event outcomes and mortality. Arch Intern Med. 2010;170(11):955–960.
- , , , , , . Deficits in communication and information transfer between hospital‐based and primary care physicians: implications for patient safety and continuity of care. JAMA. 2007;297(8):831–841.
- , , , , . Provider characteristics, clinical‐work processes and their relationship to discharge summary quality for sub‐acute care patients. J Gen Intern Med. 2012;27(1):78–84.
- , , , et al. Contemporary evidence about hospital strategies for reducing 30‐day readmissions: a national study. J Am Coll Cardiol. 2012;60(7):607–614.
- , , , . Effect of discharge summary availability during post‐discharge visits on hospital readmission. J Gen Intern Med. 2002;17(3):186–192.
- , , , et al. Association of discharge summary quality with readmission risk for patients hospitalized with heart failure exacerbation. Circ Cardiovasc Qual Outcomes. 2015;8(1):109–111.
- , , , et al. The independent association of provider and information continuity on outcomes after hospital discharge: implications for hospitalists. J Hosp Med. 2010;5(7):398–405.
- , , , , . Timeliness in discharge summary dissemination is associated with patients' clinical outcomes. J Eval Clin Pract. 2013;19(1):76–79.
- , , , et al. Communication and information deficits in patients discharged to rehabilitation facilities: an evaluation of five acute care hospitals. J Hosp Med. 2009;4(8):E28–E33.
- , , . Preventing readmissions through comprehensive discharge planning. Prof Case Manag. 2013;18(2):56–63; quiz 64–65.
- , , , et al. Effect of a postdischarge virtual ward on readmission or death for high‐risk patients: a randomized clinical trial. JAMA. 2014;312(13):1305–1312..
- , , . Risk factors for early unplanned hospital readmission in the elderly. J Gen Intern Med. 1991;6(3):223–228.
- , , , , . Differences between early and late readmissions among patients: a cohort study. Ann Intern Med. 2015;162(11):741–749.
- , , , et al. Post‐acute care payment reform demonstration report to congress supplement‐interim report. Centers for Medicare 14(3):1–14; quiz 88–89.
- , , , et al. Comprehensive discharge planning and home follow‐up of hospitalized elders: a randomized clinical trial. JAMA. 1999;281(7):613–620.
- , , , . Posthospital care transitions: patterns, complications, and risk identification. Health Serv Res. 2004;39(5):1449–1465.
- , , , et al. Transitions of care consensus policy statement: American College of Physicians, Society of General Internal Medicine, Society of Hospital Medicine, American Geriatrics Society, American College of Emergency Physicians, and Society for Academic Emergency Medicine. J Hosp Med. 2009;4(6):364–370.
- , , , et al. Association of self‐reported hospital discharge handoffs with 30‐day readmissions. JAMA Intern Med. 2013;173(8):624–629.
- , . Socioeconomic disparities in health: pathways and policies. Health Aff (Millwood). 2002;21(2):60–76.
- , , , . Comorbidity measures for use with administrative data. Med Care. 1998;36(1):8–27.
- , , , , , . Functional status impairment is associated with unplanned readmissions. Arch Phys Med Rehabil. 2013;94(10):1951–1958.
- Centers for Medicare 35(10):1044–1059.
- , , , et al. Understanding and execution of discharge instructions. Am J Med Qual. 2013;28(5):383–391.
- , , , , . Beyond the hospital gates: elucidating the interactive association of social support, depressive symptoms, and physical function with 30‐day readmissions. Am J Phys Med Rehabil. 2015;94(7):555–567.
- , , , et al. Improving the discharge process by embedding a discharge facilitator in a resident team. J Hosp Med. 2011;6(9):494–500.
- , , , et al. Hospital variation in quality of discharge summaries for patients hospitalized with heart failure exacerbation. Circ Cardiovasc Qual Outcomes. 2015;8(1):77–86
- , , , . Addressing the business of discharge: building a case for an electronic discharge summary. J Hosp Med. 2011;6(1):37–42.
- , , , , . Joint commission requirements for discharge instructions in patients with heart failure: is understanding important for preventing readmissions? J Card Fail. 2014;20(9):641–649.
- , , , et al. Association of communication between hospital‐based physicians and primary care providers with patient outcomes. J Gen Intern Med. 2009;24(3):381–386.
- , , , et al. Underlying reasons associated with hospital readmission following surgery in the united states. JAMA. 2015;313(5):483–495.
- , , , , . Assessing quality and efficiency of discharge summaries. Am J Med Qual. 2005;20(6):337–343.
- , , , et al. Comprehensive quality of discharge summaries at an academic medical center. J Hosp Med. 2013;8(8):436–443.
Across the continuum of care, the discharge summary is a critical tool for communication among care providers.[1] In the United States, the Joint Commission policies mandate that all hospital providers complete a discharge summary for patients with specific components to foster effective communication with future providers.[2] Because outpatient providers and emergency physicians rely on clinical information in the discharge summary to ensure appropriate postdischarge continuity of care, timely documentation is potentially an essential aspect of readmission reduction initiatives.[3, 4, 5] Prior reports indicate that poor discharge documentation of follow‐up plan‐of‐care increases the risk of hospitalization, whereas structured instructions, patient education, and direct communications with primary care physicians (PCPs) reduce repeat hospital visits.[6, 7, 8, 9] However, the current literature is limited in its narrow focus on the contents of discharge summaries, considered only same‐hospital readmissions, or considered readmissions within 3 months of discharge.[10, 11, 12, 13] Moreover, some prior research has suggested no association between discharge summary timeliness with readmission,[12, 13, 14] whereas another study did find a relationship,[15] hence the need to study this further is important. Filling this gap in knowledge could provide an avenue to track and improve quality of patient care, as delays in discharge summaries have been linked with pot‐discharge adverse outcomes and patient safety concerns.[15, 16, 17, 18] Because readmissions often occur soon after discharge, having timely discharge summaries may be particularly important to outcomes.[19, 20]
This research began under the framework of evaluating a bundle of care coordination strategies that were implemented at the Johns Hopkins Health System. These strategies were informed by the early Centers for Medicare and Medicaid Services (CMS) demonstration projects and other best practices that have been documented in the literature to improve utilization and improve communication during transitions of care.[21, 22, 23, 24, 25] Later they were augmented through a contract with the Center of Medicare and Medicaid Innovation to improve access to healthcare services and improve patient outcomes through improved care coordination processes. One of the domains our institution has increased efforts to improve is in provider handoffs. Toward that goal, we have worked to disentangle the effects of different factors of provider‐to‐provider communication that may influence readmissions.[26] For example, effective written provider handoffs in the form of accurate and timely discharge summaries was considered a key care coordination component of this program, but there was institutional resistance to endorsing an expectation that discharge summary turnaround should be shortened. To build a case for this concept, we sought to test the hypothesis that, at our hospital, longer time to complete hospital discharge summaries was associated with increased readmission rates. Unique to this analysis is that, in the state of Maryland, there is statewide reporting of readmissions, so we were able to account for intra‐ and interhospital readmissions for an all‐payer population. The authors anticipated that findings from this study would help inform discharge quality‐improvement initiatives and reemphasize the importance of timely discharge documentation across all disciplines as part of quality patient care.
METHODS
Study Population and Setting
We conducted a single‐center, retrospective cohort study of 87,994 consecutive patients discharged from Johns Hopkins Hospital, which is a 1000‐bed, tertiary academic medical center in Baltimore, Maryland between January 1, 2013 and December 31, 2014. One thousand ninety‐three (1.2%) of the records on days to complete the discharge summary were missing and were excluded from the analysis.
Data Source and Covariates
Data were derived from several sources. The Johns Hopkins Hospital data mart financial database, used for mandatory reporting to the State of Maryland, provided the following patient data: age, gender, race/ethnicity, payer (Medicare, Medicaid, and other) as a proxy for socioeconomic status,[27] hospital service prior to discharge (gynecologyobstetrics, medicine, neurosciences, oncology, pediatrics, and surgical sciences), hospital length of stay (LOS) prior to discharge, Agency for Healthcare Research and Quality (AHRQ) Comorbidity Index (which is an update to the original Elixhauser methodology[28]), and all‐payerrefined diagnosis‐related group (APRDRG) and severity of illness (SOI) combinations (a tool to group patients into clinically comparable disease and SOI categories expected to use similar resources and experience similar outcomes). The Health Services Cost Review Commission (HSCRC) in Maryland provided the observed readmission rate in Maryland for each APRDRG‐SOI combination and served as an expected readmission rate. This risk stratification methodology is similar to the approach used in previous studies.[26, 29] Discharge summary turnaround time was obtained from institutional administrative databases used to track compliance with discharge summary completion. Discharge location (home, facility, home with homecare or hospice, or other) was obtained from Curaspan databases (Curaspan Health Group, Inc., Newton, MA).
Primary Outcome: 30‐Day Readmission
The primary outcome was unplanned rehospitalizations to an acute care hospital in Maryland within 30 days of discharge from Johns Hopkins Hospital. This was as defined by the Maryland HSCRC using an algorithm to exclude readmissions that were likely to be scheduled, as defined by the index admission diagnosis and readmission diagnosis; this algorithm is updated based on the CMS all‐cause readmission algorithm.[30, 31]
Primary Exposure: Days to Complete the Discharge Summary
Discharge summary completion time was defined as the date when the discharge attending physician electronically signs the discharge summary. At our institution, an auto‐fax system sends documents (eg, discharge summaries, clinic notes) to linked providers (eg, primary care providers) shortly after midnight from the day the document is signed by an attending physician. During the period of the project, the policy for discharge summaries at the Johns Hopkins Hospital went from requiring them to be completed within 30 days to 14 days, and we were hoping to use our analyses to inform decision makers why this was important. To emphasize the need for timely completion of discharge summaries, we dichotomized the number of days to complete the discharge summary into >3 versus 3 days (20th percentile cutoff) and modeled it as a continuous variable (per 3‐day increase in days to complete the discharge summary).
Statistical Analysis
To evaluate differences in patient characteristics by readmission status, analysis of variance and 2 tests were used for continuous and dichotomous variables, respectively. Logistic regression was used to evaluate the association between days to complete the discharge summary >3 days and readmission status, adjusting for potentially confounding variables. Before inclusion in the logistic regression model, we confirmed a lack of multicollinearity in the multivariable regression model using variance inflation factors. We evaluated residual versus predicted value plots and residual versus fitted value plots with a locally weighted scatterplot smoothing line. In a sensitivity analysis we evaluated the association between readmission status and different cutoffs (>8 days, 50th percentile; and >14 days, 70% percentile). In a separate analysis, we used interaction terms to test whether the association between the association between days to complete the discharge summary >3 days and hospital readmission varied by the covariates in the analysis (age, sex, race, payer, hospital service, discharge location, LOS, APRDRG‐SOI expected readmission rate, and AHRQ Comorbidity Index). We observed a significant interaction between 30‐day readmission and days to complete the discharge summary >3 days by hospital service. Hence, we separately calculated the adjusted mean readmission rates separately for each hospital service using the least squared means method for the multivariable logistic regression analysis and adjusting for the previously mentioned covariates. In a separate analysis, we used linear regression to evaluate the association between LOS and days to complete the discharge summary, adjusting for potentially confounding variables. Statistical significance was defined as a 2‐sided P < 0.05. Data were analyzed with R (version 2.15.0; R Foundation for Statistical Computing, Vienna, Austria;
RESULTS
Readmitted Patients
In the study period, 14,248 out of 87,994 (16.2%) consecutive eligible patients were readmitted to a hospital in Maryland from patients discharged from Johns Hopkins Hospital between January 1, 2013 and December 31, 2014. A total of 11,027 (77.4%) of the readmissions were back to Johns Hopkins Hospital. Table 1 compares characteristics of readmitted versus nonreadmitted patients, with the following variables being significantly different between these patient groups: age, gender, healthcare payer, hospital service, discharge location, length of stay expected readmission rate, AHRQ Comorbidity Index, and days to complete inpatient discharge summary.
| Characteristics | All Patients, N = 87,994 | Not Readmitted, N = 73,746 | Readmitted, N = 14,248 | P Value |
|---|---|---|---|---|
| ||||
| Age, y | 42.1 (25.1) | 41.3 (25.4) | 46.4 (23.1) | <0.001 |
| Male | 43,210 (49.1%) | 35,851 (48.6%) | 7,359 (51.6%) | <0.001 |
| Race | <0.001 | |||
| Caucasian | 45,705 (51.9%) | 3,8661 (52.4%) | 7,044 (49.4%) | |
| African American | 32,777 (37.2%) | 2,6841 (36.4%) | 5,936 (41.7%) | |
| Other | 9,512 (10.8%) | 8,244 (11.2%) | 1,268 (8.9%) | |
| Payer | <0.001 | |||
| Medicare | 22,345 (25.4%) | 17,614 (23.9%) | 4,731 (33.2%) | |
| Medicaid | 24,080 (27.4%) | 20,100 (27.3%) | 3,980 (27.9%) | |
| Other | 41,569 (47.2%) | 36,032 (48.9%) | 5,537 (38.9%) | |
| Hospital service | <0.001 | |||
| Gynecologyobstetrics | 9,299 (10.6%) | 8,829 (12.0%) | 470 (3.3%) | |
| Medicine | 26,036 (29.6%) | 20,069 (27.2%) | 5,967 (41.9%) | |
| Neurosciences | 8,269 (9.4%) | 7,331 (9.9%) | 938 (6.6%) | |
| Oncology | 5,222 (5.9%) | 3,898 (5.3%) | 1,324 (9.3%) | |
| Pediatrics | 17,029 (19.4%) | 14,684 (19.9%) | 2,345 (16.5%) | |
| Surgical sciences | 22,139 (25.2%) | 18,935 (25.7%) | 3,204 (22.5%) | |
| Discharge location | <0.001 | |||
| Home | 65,478 (74.4%) | 56,359 (76.4%) | 9,119 (64.0%) | |
| Home with homecare or hospice | 9,524 (10.8%) | 7,440 (10.1%) | 2,084 (14.6%) | |
| Facility (SNF, rehabilitation facility) | 5,398 (6.1%) | 4,131 (5.6%) | 1,267 (8.9%) | |
| Other | 7,594 (8.6%) | 5,816 (7.9%) | 1,778 (12.5%) | |
| Length of stay, d | 5.5 (8.6) | 5.1 (7.8) | 7.5 (11.6) | <0.001 |
| APRDRG‐SOI Expected Readmission Rate, % | 14.4 (9.5) | 13.3 (9.2) | 20.1 (9.0) | <0.001 |
| AHRQ Comorbidity Index (1 point) | 2.5 (1.4) | 2.4 (1.4) | 3.0 (1.8) | <0.001 |
| Discharge summary completed >3 days | 66,242 (75.3%) | 55,329 (75.0%) | 10,913 (76.6%) | <0.001 |
Association Between Days to Complete the Discharge Summary and Readmission
After hospital discharge, median (IQR) number of days to complete discharge summaries was 8 (416) days. After hospital discharge, median (IQR) number of days to complete discharge summaries and the number of days from discharge to readmission was 8 (416) and 11 (519) days, respectively (P < 0.001). Six thousand one hundred one patients (42.8%) were readmitted before their discharge summary was completed. The median (IQR) days to complete discharge summaries by hospital service in order from shortest to longest was: oncology, 6 (212) days; surgical sciences, 6 (312) days; pediatrics, 7 (315) days; gynecologyobstetrics, 8 (415) days; medicine, 9 (420) days; neurosciences, 12 (621) days.
When we divided the number of days to complete the discharge summary into deciles (02, 2.13, 3.14, 4.16, 6.18, 8.210, 10.114, 14.119, 19.130, >30), a longer number of days to complete discharge summaries had higher unadjusted and adjusted readmission rates (Figure 1). In unadjusted analysis, Table 2 shows that older age, male sex, African American race, oncological versus medicine hospital service, discharge location, longer LOS, higher APRDRG‐SOI expected readmission rate, and higher AHRQ Comorbidity Index were associated with readmission. Days to complete the discharge summary >3 days versus 3 days was associated with a higher readmission rate, with an unadjusted odds ratio (OR) and 95% confidence interval (CI) of 1.09 (95% CI: 1.04 to 1.13, P < 0.001).
| Characteristic | Bivariable Analysis* | Multivariable Analysis* | ||
|---|---|---|---|---|
| OR (95% CI) | P Value | OR (95% CI) | P Value | |
| ||||
| Age, 10 y | 1.09 (1.08 to 1.09) | <0.001 | 0.97 (0.95 to 0.98) | <0.001 |
| Male | 1.13 (1.09 to 1.17) | <0.001 | 1.01 (0.97 to 1.05) | 0.76 |
| Race | ||||
| Caucasian | Referent | Referent | ||
| African American | 1.21 (1.17 to 1.26) | <0.001 | 1.01 (0.96 to 1.05) | 0.74 |
| Other | 0.84 (0.79 to 0.90) | <0.001 | 0.92 (0.86 to 0.98) | 0.01 |
| Payer | ||||
| Medicare | Referent | Referent | ||
| Medicaid | 0.74 (0.70 to 0.77) | <0.001 | 1.03 (0.97 to 1.09) | 0.42 |
| Other | 0.57 (0.55 to 0.60) | <0.001 | 0.86 (0.82 to 0.91) | <0.001 |
| Hospital service | ||||
| Medicine | Referent | Referent | ||
| Gynecologyobstetrics | 0.18 (0.16 to 0.20) | <0.001 | 0.50 (0.45 to 0.56) | <0.001 |
| Neurosciences | 0.43 (0.40 to 0.46) | <0.001 | 0.76 (0.70 to 0.82) | <0.001 |
| Oncology | 1.14 (1.07 to 1.22) | <0.001 | 1.18 (1.10 to 1.28) | <0.001 |
| Pediatrics | 0.54 (0.51 to 0.57) | <0.001 | 0.77 (0.71 to 0.83) | <0.001 |
| Surgical sciences | 0.57 (0.54 to 0.60) | <0.001 | 0.92 (0.87 to 0.97) | 0.002 |
| Discharge location | ||||
| Home | Referent | |||
| Facility (SNF, rehabilitation facility) | 1.90 (1.77 to 2.03) | <0.001 | 1.11 (1.02 to 1.19) | 0.009 |
| Home with homecare or hospice | 1.73 (1.64 to 1.83) | <0.001 | 1.26 (1.19 to 1.34) | <0.001 |
| Other | 1.89 (1.78 to 2.00) | <0.001 | 1.25 (1.18 to 1.34) | <0.001 |
| Length of stay, d | 1.03 (1.02 to 1.03) | <0.001 | 1.00 (1.00 to 1.01) | <0.001 |
| APRDRG‐SOI expected readmission rate, % | 1.08 (1.07 to 1.08) | <0.001 | 1.06 (1.06 to 1.06) | <0.001 |
| AHRQ Comorbidity Index (1 point) | 1.27 (1.26 to 1.28) | <0.001 | 1.11 (1.09 to 1.12) | <0.001 |
| Discharge summary completed >3 days | 1.09 (1.04 to 1.14) | <0.001 | 1.09 (1.05 to 1.14) | <0.001 |
Multivariable and Secondary Analyses
In adjusted analysis (Table 2), patients discharged from an oncologic service relative to a medicine hospital service (OR: 1.19, 95% CI: 1.10 to 1.28, P < 0.001), patients discharged to a facility, home with homecare or hospice, or other location compared to home (facility OR: 1.11, 95% CI: 1.02 to 1.19, P = 0.009; home with homecare or hospice OR: 1.26, 95% CI: 1.19 to 1.34, P < 0.001; other OR: 1.25, 95% CI: 1.18 to 1.34, P < 0.001), patients with longer LOS (OR: 1.11 per day, 95% CI: 1.10 to 1.12, P < 0.001), patients with a higher expected readmission rates (OR: 1.01 per percent, 95% CI: 1.00 to 1.01, P < 0.001), and patients with a higher AHRQ comorbidity index (OR: 1.06 per 1 point, 95% CI: 1.06 to 1.06, P < 0.001) had higher 30‐day readmission rates. Overall, days to complete the discharge summary >3 days versus 3 days was associated with a higher readmission rate (OR: 1.09, 95% CI: 1.05 to 1.14, P < 0.001).
In a sensitivity analysis, discharge summary completion >8 days (median) versus 8 days was associated with higher unadjusted readmission rate (OR: 1.11, 95% CI: 1.07 to 1.15, P < 0.001) and a higher adjusted readmission rate (OR: 1.06, 95% CI: 1.02 to 1.10, P < 0.001). Discharge summary completion >14 days (70th percentile) versus 14 days was also associated with higher unadjusted readmission rate (OR: 1.15, 95% CI: 1.08 to 1.21, P < 0.001) and a higher adjusted readmission rate (OR: 1.09, 95% CI: 1.02 to 1.16, P = 0.008). The association between days to complete the discharge summary >3 days and readmissions was found to vary significantly by hospital service (P = 0.03). For comparing days to complete the discharge summary >3 versus 3 days, Table 3 shows that neurosciences, pediatrics, oncology, and medicine hospital services were associated with significantly increased adjusted mean readmission rates. Additionally, when days to complete the discharge summary was modeled as a continuous variable, we found that for every 3 days the odds of readmission increased by 1% (OR: 1.01, 95% CI: 1.00 to 1.01, P < 0.001).
| Days to Complete Discharge Summary by Hospital Service | Adjusted Mean Readmission Rate (95% CI)* | P Value |
|---|---|---|
| ||
| Gynecologyobstetrics | 0.30 | |
| 03 days, n = 1,792 | 5.4 (4.1 to 6.7) | |
| >3 days, n = 7,507 | 6.0 (4.9 to 7.0) | |
| Medicine | 0.04 | |
| 03 days, n = 6,137 | 21.1 (20.0 to 22.3) | |
| >3 days, n = 19,899 | 22.4 (21.6 to 23.2) | |
| Neurosciences | 0.02 | |
| 03 days, n = 1,116 | 10.1 (8.2 to 12.1) | |
| >3 days, n = 7,153 | 12.5 (11.6 to 13.5) | |
| Oncology | 0.01 | |
| 03 days, n = 1,885 | 25.0 (22.6 to 27.4) | |
| >3 days, n = 3,337 | 28.2 (26.6 to 30.2) | |
| Pediatrics | 0.001 | |
| 03 days, n = 4,561 | 9.5 (6.9 to 12.2) | |
| >3 days, n = 12,468 | 11.4 (8.9 to 13.9) | |
| Surgical sciences | 0.89 | |
| 03 days, n = 6,261 | 15.2 (14.2 to 16.1) | |
| >3 days, n = 15,878 | 15.1 (14.4 to 15.8) | |
In an unadjusted analysis, we found that the relationship between LOS and days to complete the discharge summary was not significant ( coefficient and 95% CI:, 0.01, 0.02 to 0.00, P = 0.20). However, we found a small but significant relationship in our multivariable analysis, such that each hospitalization day was associated with a 0.01 (95% CI: 0.00 to 0.02, P = 0.03) increase in days to complete the discharge summary.
DISCUSSION
In this single‐center retrospective analysis, the number of days to complete the discharge summary was significantly associated with readmissions after hospitalization. This association was independent of age, gender, comorbidity index, payer, discharge location, length of hospital stay, expected readmission rate based on diagnosis and severity of illness, and all hospital services. The odds of readmission for patients with delayed discharge summaries was small but significant. This is important in the current landscape of readmissions, particularly for institutions who are challenged to reduce readmission rates, and a small relative difference in readmissions may be the difference between getting penalized or not. In the context of prior studies, the results highlight the role of timely discharge summary as an under‐recognized metric, which may be a valid litmus test for care coordination. The findings also emphasize the potential of early summaries to expedite communication and to help facilitate quality of patient care. Hence, the study results extend the literature examining the relationship of delay in discharge summary with unfavorable patient outcomes.[15, 32]
In contrast to prior reports with limited focus on same‐hospital readmissions,[18, 33, 34, 35] readmissions beyond 30 days,[12] or focused on a specific patient population,[13, 36] this study evaluates both intra‐ and interhospital 30‐day readmissions in Maryland in an all‐payer, multi‐institution, diverse patient population. Additionally, prior research is conflicting with respect to whether timely discharges summaries are significantly associated with increased hospital readmissions.[12, 13, 14, 15] Although it is not surprising that inadequate care during hospitalization could result in readmissions, the role of discharge summaries remain underappreciated. Having a timely discharge summary may not always prevent readmissions, but our study showed that 43% of readmission occurred before the discharge summary completion. Not having a completed discharge summary at the time of readmission may have been a driver for the positive association between timely completion and 30‐day readmission we observed. This study highlights that delay in the discharge summary could be a marker of poor transitions of care, because suboptimal dissemination of critical information to care providers may result in discontinuity of patient care posthospitalization.
A plausible mechanism of the association between discharge summary delays and readmissions could be the provision of collateral information, which may potentially alter the threshold for readmissions. For example, in the emergency room/emergency department (ER/ED) setting, discharge summaries may help with preventable readmissions. For patients who present repeatedly with the same complaint, timely summaries to ER/ED providers may help reframe the patient complaints, such as patient has concern X, which was previously identified to be related to diagnosis Y. As others have shown, the content of discharge summaries, format, and accessibility (electronic vs paper chart), as well as timely distribution of summaries, are key factors that impact quality outcomes.[2, 12, 15, 37, 38] By detailing prior hospital information (ie, discharge medications, prior presentations, tests completed), summaries could help prevent errors in medication dosing, reduce unnecessary testing, and help facilitate admission triage. Summaries may have information regarding a new diagnosis such as the results of an endoscopic evaluation that revealed the source of occult gastrointestinal bleeding, which could help contextualize a complaint of repeat melena and redirect goals of care. Discussions of goals of care in the discharge summary may guide primary providers in continued care management plans.
Our study findings underscore a positive correlation between late discharge summaries and readmissions. However, the extent that this is a causal relationship is unclear; the association of delay in days to complete the discharge summary with readmission may be an epiphenomenon related to processes related to quality of clinical care. For example, delays in discharge summary completion could be a marker of other system issues, such as a stressed work environment. It is possible that providers who fail to complete timely discharge summaries may also fail to do other important functions related to transitions of care and care coordination. However, even if this is so, timely discharge summaries could become a focal point for discussion for optimization of care transitions. A discharge summary could be delayed because the patient has already been readmitted before the summary was distributed, thus making that original summary less relevant. Delays could also be a reflection of the data complexity for patients with longer hospital stays. This is supported by the small but significant relationship between LOS and days to complete the discharge summary in this study. Lastly, delays in discharge summary completion may also be a proxy of provider communication and can reflect the culture of communication at the institution.
Although unplanned hospital readmission is an important outcome, many readmissions may be related to other factors such as disease progression, rather than late summaries or the lack of postdischarge communication. For instance, prior reports did not find any association between the PCP seeing the discharge summaries or direct communications with the PCP and 30‐day clinical outcomes for readmission and death.[26, 39] However, these studies were limited in their use of self‐reported handoffs, did not measure quality of information transfer, and failed to capture a broader audience beyond the PCP, such as ED physicians or specialists.
Our results suggest that the relationship between days to complete discharge summaries and 30‐day readmissions may vary depending on whether the hospitalization is primarily surgical/procedural versus medical treatment. A recent study found that most readmissions after surgery were associated with new complications related to the procedure and not exacerbation of prior index hospitalization complications.[40] Hence, treatment for common causes of hospital readmissions after surgical or gynecological procedures, such as wound infections, acute anemia, ileus, or dehydration, may not necessarily require a completed discharge summary for appropriate management. However, we caution extending this finding to clinical practice before further studies are conducted on specific procedures and in different clinical settings.
Results from this study also support institutional policies that specify the need for practitioners to complete discharge summaries contemporaneously, such as at the time of discharge or within a couple of days. Unlike other forms of communication that are optional, discharge summaries are required, so we recommend that practitioners be held accountable for short turnaround times. For example, providers could be graded and rated on timely completions of discharge summaries, among other performance variables. Anecdotally at our institutions, we have heard from practitioners that it takes less time to complete them when you do them on the day of discharge, because the hospitalization course is fresher in their mind and they have to wade through less information in the medical record to complete an accurate discharge summary. To this point, a barrier to on‐time completion is that providers may have misconceptions about what is really vital information to convey to the next provider. In agreement with past research and in the era of the electronic medical record system, we recommend that the discharge summary should be a quick synthesis of key findings that incorporates only the important elements, such as why the patient was hospitalized, what were key findings and key responses to therapy, what is pending at the time of discharge, what medications the patient is currently taking, and what are the follow‐up plans, rather than a lengthy expose of all the findings.[13, 36, 41, 42]
Lastly, our study results should be taken in the context of its limitations. As a single‐center study, findings may lack generalizability. In particular, the results may not generalize to hospitals that lack access to statewide reporting. We were also not able to assess readmission for patients who may have been readmitted to a hospital outside of Maryland. Although we adjusted for pertinent variables such as age, gender, healthcare payer, hospital service, comorbidity index, discharge location, LOS, and expected readmission rates, there may be other relevant confounders that we failed to capture or measure optimally. Median days to complete the discharge summary in this study was 8 days, which is longer than practices at other institutions, and may also limit this study's generalizability.[15, 36, 42] However, prior research supports our findings,[15] and a systematic review found that only 29% and 52% of discharge summaries were completed by 2 weeks and 4 weeks, respectively.[9] Finally, as noted above and perhaps most important, it is possible that discharge summary turnaround time does not in itself causally impact readmissions, but rather reflects an underlying commitment of the inpatient team to effectively coordinate care following hospital discharge.
CONCLUSION
In sum, this study delineates an underappreciated but important relationship of timely discharge summary completion and readmission outcomes. The discharge summary may be a relevant metric reflecting quality of patient care. Healthcare providers may begin to target timely discharge summaries as a potential focal point of quality‐improvement projects with the goal to facilitate better patient outcomes.
Disclosures
The authors certify that no party having a direct interest in the results of the research supporting this article has or will confer a benefit on us or on any organization with which we are associated, and, if applicable, the authors certify that all financial and material support for this research (eg, Centers for Medicare and Medicaid Services, National Institutes of Health, or National Health Service grants) and work are clearly identified. This study was supported by funding opportunity, number CMS‐1C1‐12‐0001, from the Centers for Medicare and Medicaid Services and Center for Medicare and Medicaid Innovation. Its contents are solely the responsibility of the authors and do not necessarily represent the official views of the Department of Health and Human Services or any of its agencies.
- , , , et al. Development and sustainability of an inpatient‐to‐outpatient discharge handoff tool: a quality improvement project. Jt Comm J Qual Patient Saf. 2014;40(5):219–227.
- , , , , , . Documentation of mandated discharge summary components in transitions from acute to subacute care. In: Henriksen K, Battles JB, Keyes MA, et al., eds. Advances in Patient Safety: New Directions and Alternative Approaches. Vol. 2. Culture and Redesign. Rockville, MD: Agency for Healthcare Research and Quality; 2008.
- , , , . Better transitions: improving comprehension of discharge instructions. Front Health Serv Manage. 2009;25(3):11–32.
- , , , . Structured discharge education improves early outcome in orthopedic patients. Int J Orthop Trauma Nurs. 2010;14(2):66–74.
- , , , et al. Hospital discharge documentation and risk of rehospitalisation. BMJ Qual Saf. 2011;20(9):773–778.
- , , . The hospital discharge: a review of a high risk care transition with highlights of a reengineered discharge process. J Patient Saf. 2007;3(2):97–106.
- , , , , . Interventions to reduce 30‐day rehospitalization: a systematic review. Ann Intern Med. 2011;155(8):520–528.
- , , , , , . Effect of hospital follow‐up appointment on clinical event outcomes and mortality. Arch Intern Med. 2010;170(11):955–960.
- , , , , , . Deficits in communication and information transfer between hospital‐based and primary care physicians: implications for patient safety and continuity of care. JAMA. 2007;297(8):831–841.
- , , , , . Provider characteristics, clinical‐work processes and their relationship to discharge summary quality for sub‐acute care patients. J Gen Intern Med. 2012;27(1):78–84.
- , , , et al. Contemporary evidence about hospital strategies for reducing 30‐day readmissions: a national study. J Am Coll Cardiol. 2012;60(7):607–614.
- , , , . Effect of discharge summary availability during post‐discharge visits on hospital readmission. J Gen Intern Med. 2002;17(3):186–192.
- , , , et al. Association of discharge summary quality with readmission risk for patients hospitalized with heart failure exacerbation. Circ Cardiovasc Qual Outcomes. 2015;8(1):109–111.
- , , , et al. The independent association of provider and information continuity on outcomes after hospital discharge: implications for hospitalists. J Hosp Med. 2010;5(7):398–405.
- , , , , . Timeliness in discharge summary dissemination is associated with patients' clinical outcomes. J Eval Clin Pract. 2013;19(1):76–79.
- , , , et al. Communication and information deficits in patients discharged to rehabilitation facilities: an evaluation of five acute care hospitals. J Hosp Med. 2009;4(8):E28–E33.
- , , . Preventing readmissions through comprehensive discharge planning. Prof Case Manag. 2013;18(2):56–63; quiz 64–65.
- , , , et al. Effect of a postdischarge virtual ward on readmission or death for high‐risk patients: a randomized clinical trial. JAMA. 2014;312(13):1305–1312..
- , , . Risk factors for early unplanned hospital readmission in the elderly. J Gen Intern Med. 1991;6(3):223–228.
- , , , , . Differences between early and late readmissions among patients: a cohort study. Ann Intern Med. 2015;162(11):741–749.
- , , , et al. Post‐acute care payment reform demonstration report to congress supplement‐interim report. Centers for Medicare 14(3):1–14; quiz 88–89.
- , , , et al. Comprehensive discharge planning and home follow‐up of hospitalized elders: a randomized clinical trial. JAMA. 1999;281(7):613–620.
- , , , . Posthospital care transitions: patterns, complications, and risk identification. Health Serv Res. 2004;39(5):1449–1465.
- , , , et al. Transitions of care consensus policy statement: American College of Physicians, Society of General Internal Medicine, Society of Hospital Medicine, American Geriatrics Society, American College of Emergency Physicians, and Society for Academic Emergency Medicine. J Hosp Med. 2009;4(6):364–370.
- , , , et al. Association of self‐reported hospital discharge handoffs with 30‐day readmissions. JAMA Intern Med. 2013;173(8):624–629.
- , . Socioeconomic disparities in health: pathways and policies. Health Aff (Millwood). 2002;21(2):60–76.
- , , , . Comorbidity measures for use with administrative data. Med Care. 1998;36(1):8–27.
- , , , , , . Functional status impairment is associated with unplanned readmissions. Arch Phys Med Rehabil. 2013;94(10):1951–1958.
- Centers for Medicare 35(10):1044–1059.
- , , , et al. Understanding and execution of discharge instructions. Am J Med Qual. 2013;28(5):383–391.
- , , , , . Beyond the hospital gates: elucidating the interactive association of social support, depressive symptoms, and physical function with 30‐day readmissions. Am J Phys Med Rehabil. 2015;94(7):555–567.
- , , , et al. Improving the discharge process by embedding a discharge facilitator in a resident team. J Hosp Med. 2011;6(9):494–500.
- , , , et al. Hospital variation in quality of discharge summaries for patients hospitalized with heart failure exacerbation. Circ Cardiovasc Qual Outcomes. 2015;8(1):77–86
- , , , . Addressing the business of discharge: building a case for an electronic discharge summary. J Hosp Med. 2011;6(1):37–42.
- , , , , . Joint commission requirements for discharge instructions in patients with heart failure: is understanding important for preventing readmissions? J Card Fail. 2014;20(9):641–649.
- , , , et al. Association of communication between hospital‐based physicians and primary care providers with patient outcomes. J Gen Intern Med. 2009;24(3):381–386.
- , , , et al. Underlying reasons associated with hospital readmission following surgery in the united states. JAMA. 2015;313(5):483–495.
- , , , , . Assessing quality and efficiency of discharge summaries. Am J Med Qual. 2005;20(6):337–343.
- , , , et al. Comprehensive quality of discharge summaries at an academic medical center. J Hosp Med. 2013;8(8):436–443.
© 2016 Society of Hospital Medicine