User login
Loss of pulmonary vascular distensibility precedes PH
Loss of distensibility of the pulmonary vasculature may be a marker that allows earlier detection of impending pulmonary hypertension, based on hemodynamic data from the medical records of 90 patients across the spectrum of pulmonary vascular disease.
Normal pulmonary circulation is distensible, allowing distension and recruitment of the pulmonary vasculature during exertion that in turn reduces pulmonary vascular resistance. Loss of this distensibility increases resistance and thus pulmonary arterial pressure, and is a characteristic of mild pulmonary vascular disease. Such disease is a precursor of full-blown pulmonary hypertension (PH), which “is a relatively late hemodynamic event in the evolution of pulmonary vascular disease,” said Dr. Edmund M. T. Lau of Université Paris-Sud, and his associates.
The percentage change in vascular diameter per mm Hg increase in distending pressure has been proposed for estimating the distensibility of resistive pulmonary vessels. This “distensibility value” has been assessed in animal studies and in healthy human subjects, but has not yet been assessed as a possible marker of mild pulmonary vascular disease or PH.
The researchers assessed this distensibility value in 31 patients with PH, 33 with mild pulmonary vascular disease but no PH as yet, and 26 control subjects with no pulmonary vascular disease. The data were obtained from the medical records of these patients, who had undergone right-sided heart catheterization, both at rest and during exercise, over a 6-year period.
The percentage change in vascular diameter per mm Hg increase in distending pressure was “strikingly reduced” (0.45%/mm Hg) in the mild pulmonary vascular disease group compared with the control group (1.4%/mm Hg). As expected, the group with PH had the lowest distensibility value, at 0.25%/mm Hg.
Using a cutoff value of 0.76%/mm Hg allowed the researchers to distinguish control subjects from patients with mild disease with a sensitivity of 88% and a specificity of 100%. “To our knowledge, this is the first study to validate the fit of [this] model in subjects with pulmonary vascular disease and to demonstrate that [percentage change in vascular diameter per mm Hg increase in distending pressure] is dramatically reduced in patients who have mild pulmonary vascular disease without manifest PH.
“Taken together, our findings suggest that vascular distensibility is markedly attenuated prior to the development of PH and that [this value] may serve as a useful vascular index in the setting of early disease detection,” Dr. Lau and his associates said (CHEST 2016;149:353-61).
The distensibility value calculated for this study’s control group (1.4%/mm Hg) was slightly lower than that reported in the literature for normal, healthy subjects and in vitro animal vessels (2%/mm Hg). That is likely because the control participants were older than the subjects in previous studies, and vascular distensibility is known to decrease with increasing age, the researchers said.
They added that it might be useful to calculate the distensibility value when patients suspected of having pulmonary vascular disease undergo invasive pulmonary hemodynamic evaluations. “It would be of particular interest to assess [it] in populations at a high risk of developing PH, such as carriers of the BMPR2 mutation and patients with systemic sclerosis.”
Obviously, estimating the distensibility value using noninvasive evaluation would be preferable, the researchers noted. Preliminary studies of healthy control subjects and carriers of the BMPR2 mutation undergoing stress ECG testing have shown that calculating the distensibility value is feasible using Doppler echocardiography data, they added.
This study was supported by Fonds de Dotation Recherche en Santé Respiratoire, Fondation du Souffle, and the INSERM–University of Sydney Exchange Grant. Dr. Lau reported having no relevant financial disclosures; his associates reported ties to Actelion, Aires, Bayer, Bristol-Myers Squibb, GlaxoSmithKline, Novartis, Pfizer, and United Therapeutics Corporation.
These findings have the potential to completely revamp screening for pulmonary vascular disease, but first they must be validated in further research.
It will also be important to determine whether, as the authors suggest, a noninvasive method to determine vascular distensibility can be developed, perhaps using stress echocardiography or stress cardiac magnetic resonance testing. Only then can this measure – the percentage change in vascular diameter per mm Hg increase in distending pressure – translate from the realm of novel research into real-world clinical practice.
Dr. Richa Agarwal is in the department of medicine at Temple University, Philadelphia, and at the Cardiovascular Institute at Allegheny General Hospital, Pittsburgh. Dr. Mardi Gomberg-Maitland is in the department of medicine at the University of Chicago. Dr. Agarwal reported having no relevant financial disclosures; Dr. Gomberg-Maitland reported ties to Actelion, Bayer, GeNo, Gilead, Medtronic, Novartis, Lung Biotechnology, Reata, Bellerophon, United Therapeutics, Medscape, and ABComm. Dr. Agarwal and Dr. Gomberg-Maitland made these remarks in an editorial accompanying Dr. Lau’s report (Chest 2016;149:295-7).
Loss of distensibility of the pulmonary vasculature may be a marker that allows earlier detection of impending pulmonary hypertension, based on hemodynamic data from the medical records of 90 patients across the spectrum of pulmonary vascular disease.
Normal pulmonary circulation is distensible, allowing distension and recruitment of the pulmonary vasculature during exertion that in turn reduces pulmonary vascular resistance. Loss of this distensibility increases resistance and thus pulmonary arterial pressure, and is a characteristic of mild pulmonary vascular disease. Such disease is a precursor of full-blown pulmonary hypertension (PH), which “is a relatively late hemodynamic event in the evolution of pulmonary vascular disease,” said Dr. Edmund M. T. Lau of Université Paris-Sud, and his associates.
The percentage change in vascular diameter per mm Hg increase in distending pressure has been proposed for estimating the distensibility of resistive pulmonary vessels. This “distensibility value” has been assessed in animal studies and in healthy human subjects, but has not yet been assessed as a possible marker of mild pulmonary vascular disease or PH.
The researchers assessed this distensibility value in 31 patients with PH, 33 with mild pulmonary vascular disease but no PH as yet, and 26 control subjects with no pulmonary vascular disease. The data were obtained from the medical records of these patients, who had undergone right-sided heart catheterization, both at rest and during exercise, over a 6-year period.
The percentage change in vascular diameter per mm Hg increase in distending pressure was “strikingly reduced” (0.45%/mm Hg) in the mild pulmonary vascular disease group compared with the control group (1.4%/mm Hg). As expected, the group with PH had the lowest distensibility value, at 0.25%/mm Hg.
Using a cutoff value of 0.76%/mm Hg allowed the researchers to distinguish control subjects from patients with mild disease with a sensitivity of 88% and a specificity of 100%. “To our knowledge, this is the first study to validate the fit of [this] model in subjects with pulmonary vascular disease and to demonstrate that [percentage change in vascular diameter per mm Hg increase in distending pressure] is dramatically reduced in patients who have mild pulmonary vascular disease without manifest PH.
“Taken together, our findings suggest that vascular distensibility is markedly attenuated prior to the development of PH and that [this value] may serve as a useful vascular index in the setting of early disease detection,” Dr. Lau and his associates said (CHEST 2016;149:353-61).
The distensibility value calculated for this study’s control group (1.4%/mm Hg) was slightly lower than that reported in the literature for normal, healthy subjects and in vitro animal vessels (2%/mm Hg). That is likely because the control participants were older than the subjects in previous studies, and vascular distensibility is known to decrease with increasing age, the researchers said.
They added that it might be useful to calculate the distensibility value when patients suspected of having pulmonary vascular disease undergo invasive pulmonary hemodynamic evaluations. “It would be of particular interest to assess [it] in populations at a high risk of developing PH, such as carriers of the BMPR2 mutation and patients with systemic sclerosis.”
Obviously, estimating the distensibility value using noninvasive evaluation would be preferable, the researchers noted. Preliminary studies of healthy control subjects and carriers of the BMPR2 mutation undergoing stress ECG testing have shown that calculating the distensibility value is feasible using Doppler echocardiography data, they added.
This study was supported by Fonds de Dotation Recherche en Santé Respiratoire, Fondation du Souffle, and the INSERM–University of Sydney Exchange Grant. Dr. Lau reported having no relevant financial disclosures; his associates reported ties to Actelion, Aires, Bayer, Bristol-Myers Squibb, GlaxoSmithKline, Novartis, Pfizer, and United Therapeutics Corporation.
FROM CHEST
Key clinical point: Loss of distensibility of the pulmonary vasculature precedes the development of pulmonary hypertension and may serve as a marker allowing earlier detection of the disorder.
Major finding: During exercise, the percentage change in vascular diameter per mm Hg increase in distending pressure was “strikingly reduced” (0.45%/mm Hg) in the mild pulmonary vascular disease group compared with the control group (1.4%/mm Hg).
Data source: A retrospective single-center comparison of pulmonary vascular distensibility in 31 patients with PH, 33 with mild pulmonary vascular disease but no PH as yet, and 26 control subjects.
Disclosures: This study was supported by Fonds de Dotation Recherche en Santé Respiratoire, Fondation du Souffle, and the INSERM–University of Sydney Exchange Grant. Dr. Lau reported having no relevant financial disclosures; his associates reported ties to Actelion, Aires, Bayer, Bristol-Myers Squibb, GlaxoSmithKline, Novartis, Pfizer, and United Therapeutics Corporation.
Disability Insurance: What Dermatology Residents Need to Know
Several older physicians have emphasized to me the importance of choosing an excellent disability insurance policy during residency. However, choosing the right policy can be a difficult task. The policy definitions are complicated, and there is a lot of fine print. To understand this confusing topic, start with answers to these 3 questions: What is my most valuable asset? When is the best point in my career to purchase disability insurance? What would I do if I were no longer able to perform the material and substantial duties of my occupation as a dermatologist?
A Resident’s Assets
In the world of disability insurance, your most valuable assets are your education and your ability to earn an income in the future.1,2 A resident’s ability to earn an income in the future reflects a massive investment of time, cost of education, and postponed accruement of wealth due to time spent in training. Any negative impact on your health (eg, back injury, vision loss, hand injury) can jeopardize these assets. Purchasing disability insurance while still in dermatology residency will protect this investment; it also will ensure that you obtain a policy while you are still healthy.1,2
Choosing a Policy
Disability insurance comes in 2 main forms: individual or group. Individual insurance may be slightly more expensive but may offer better coverage than group insurance. Group insurance often is offered through a large medical association such as the American Academy of Dermatology. Group insurance may be less expensive but often has more limits to coverage. A definite must-have in a disability insurance policy is one that has guaranteed renewal and is noncancellable.1-3
Interestingly, women are considered a higher risk for disability, and many insurance policies will charge a higher monthly rate for women than men because women are slightly more likely than men to develop a disability, and women are more likely to develop a disability that prevents them from being able to work.4 Some insurance companies do offer a unisex policy, which does not discriminate.
When choosing a policy, you want to carefully read the vendor’s definition of disability. The best definition of the term disability is going to be one that includes phrases such as “unable to perform the material and substantial duties of your [own] occupation . . . even if you are gainfully employed in another occupation.”1-3,5,6 This definition of disability is the least restrictive and would allow you to receive full benefits even if you are able to work in another capacity or occupation.1-3,5,6 The benefit period of the policy also is something to choose carefully. It is recommended to choose a benefit period that extends to at least 65 years of age.1-3,5 It is important to remember that the devil is in the details; for example, some disability insurance policies with more restrictive definitions will not pay you benefits if you are working in another capacity (eg, a physician who develops an injury that prohibits working with patients and then chooses to work in another capacity).
Some policies will only pay benefits if you become totally disabled. Shy away from these more restrictive policies; instead, look for a policy that has a liberal definition of what constitutes disability and allows you the option to add in a future purchase option rider. It is important that your policy includes a future purchase option rider, which means that as your income increases you have the option to purchase an increase in your disability coverage.1-3,5 Look for a policy that allows you to be insured without penalizing you for preexisting conditions; during residency is one of the few times some policy vendors will do it, as they assume residents are generally young and healthy.1-3,5,7
Final Thoughts
When you choose your policy, read the details carefully. Finally, remember that other physicians in the community are available as resources; they can be a wealth of information on different policies. There are many websites available to read more on this topic. Often, your training institution will offer a disability policy for the duration of your residency. Many residents choose to purchase their postresidency policies while in their third or fourth year of training. Take the time to choose a good policy now; you will be glad you did.
- Relvas M. Must-know disability insurance policy features. MR Insurance Consultants website. https://www.mr-disability-insurance.com/Policy-Information.php. Accessed January 25, 2016.
- Keller L. Disability insurance: what you need to know before you buy. Dermatology Resident Roundup. 2003:4-5.
- Dahle JM, Relvas MR. 4 critical steps in purchasing resident disability insurance. Physician’s Money Digest website. http://www.hcplive.com/physicians-money-digest/personal-finance/dahle-4-critical-steps-in-purchasing-resident-disability-insurance. Published March 22, 2014. Accessed January 25, 2016.
- Schneider L, Quist-Newens M. Women and the risk of disability. insights from a landmark study by the State Farm Center for women and financial services at The American College. The American College of Financial Services web site. http://womenscenter.theamericancollege.edu/uploads/documents/Women-and-the-Risk-of-Disability-Study-5-4-12-v1a.pdf. Published May 7, 2012. Accessed February 16, 2016.
- Hill J. Consider buying disability insurance during residency.” Medical Economics website. http://medicaleconomics.modernmedicine.com/medical-economics/news/modernmedicine/modern-medicine-now/consider-buying-disability-insurance-durin. Published August 10, 2011. Accessed January 25, 2016.
- Walters C. What is own occupation disability insurance? Policy Genius. https://www.policygenius.com/blog/own-occupation-disability-insurance/. Published October 20, 2014. Accessed February 12, 2016.
- The five big money items you should do as a resident. The White Coat Investor website. http://whitecoatinvestor.com/the-five-big-money-items-you-should-do-as-a-resident/. Published July 7, 2011. Accessed January 25, 2016.
Several older physicians have emphasized to me the importance of choosing an excellent disability insurance policy during residency. However, choosing the right policy can be a difficult task. The policy definitions are complicated, and there is a lot of fine print. To understand this confusing topic, start with answers to these 3 questions: What is my most valuable asset? When is the best point in my career to purchase disability insurance? What would I do if I were no longer able to perform the material and substantial duties of my occupation as a dermatologist?
A Resident’s Assets
In the world of disability insurance, your most valuable assets are your education and your ability to earn an income in the future.1,2 A resident’s ability to earn an income in the future reflects a massive investment of time, cost of education, and postponed accruement of wealth due to time spent in training. Any negative impact on your health (eg, back injury, vision loss, hand injury) can jeopardize these assets. Purchasing disability insurance while still in dermatology residency will protect this investment; it also will ensure that you obtain a policy while you are still healthy.1,2
Choosing a Policy
Disability insurance comes in 2 main forms: individual or group. Individual insurance may be slightly more expensive but may offer better coverage than group insurance. Group insurance often is offered through a large medical association such as the American Academy of Dermatology. Group insurance may be less expensive but often has more limits to coverage. A definite must-have in a disability insurance policy is one that has guaranteed renewal and is noncancellable.1-3
Interestingly, women are considered a higher risk for disability, and many insurance policies will charge a higher monthly rate for women than men because women are slightly more likely than men to develop a disability, and women are more likely to develop a disability that prevents them from being able to work.4 Some insurance companies do offer a unisex policy, which does not discriminate.
When choosing a policy, you want to carefully read the vendor’s definition of disability. The best definition of the term disability is going to be one that includes phrases such as “unable to perform the material and substantial duties of your [own] occupation . . . even if you are gainfully employed in another occupation.”1-3,5,6 This definition of disability is the least restrictive and would allow you to receive full benefits even if you are able to work in another capacity or occupation.1-3,5,6 The benefit period of the policy also is something to choose carefully. It is recommended to choose a benefit period that extends to at least 65 years of age.1-3,5 It is important to remember that the devil is in the details; for example, some disability insurance policies with more restrictive definitions will not pay you benefits if you are working in another capacity (eg, a physician who develops an injury that prohibits working with patients and then chooses to work in another capacity).
Some policies will only pay benefits if you become totally disabled. Shy away from these more restrictive policies; instead, look for a policy that has a liberal definition of what constitutes disability and allows you the option to add in a future purchase option rider. It is important that your policy includes a future purchase option rider, which means that as your income increases you have the option to purchase an increase in your disability coverage.1-3,5 Look for a policy that allows you to be insured without penalizing you for preexisting conditions; during residency is one of the few times some policy vendors will do it, as they assume residents are generally young and healthy.1-3,5,7
Final Thoughts
When you choose your policy, read the details carefully. Finally, remember that other physicians in the community are available as resources; they can be a wealth of information on different policies. There are many websites available to read more on this topic. Often, your training institution will offer a disability policy for the duration of your residency. Many residents choose to purchase their postresidency policies while in their third or fourth year of training. Take the time to choose a good policy now; you will be glad you did.
- Relvas M. Must-know disability insurance policy features. MR Insurance Consultants website. https://www.mr-disability-insurance.com/Policy-Information.php. Accessed January 25, 2016.
- Keller L. Disability insurance: what you need to know before you buy. Dermatology Resident Roundup. 2003:4-5.
- Dahle JM, Relvas MR. 4 critical steps in purchasing resident disability insurance. Physician’s Money Digest website. http://www.hcplive.com/physicians-money-digest/personal-finance/dahle-4-critical-steps-in-purchasing-resident-disability-insurance. Published March 22, 2014. Accessed January 25, 2016.
- Schneider L, Quist-Newens M. Women and the risk of disability. insights from a landmark study by the State Farm Center for women and financial services at The American College. The American College of Financial Services web site. http://womenscenter.theamericancollege.edu/uploads/documents/Women-and-the-Risk-of-Disability-Study-5-4-12-v1a.pdf. Published May 7, 2012. Accessed February 16, 2016.
- Hill J. Consider buying disability insurance during residency.” Medical Economics website. http://medicaleconomics.modernmedicine.com/medical-economics/news/modernmedicine/modern-medicine-now/consider-buying-disability-insurance-durin. Published August 10, 2011. Accessed January 25, 2016.
- Walters C. What is own occupation disability insurance? Policy Genius. https://www.policygenius.com/blog/own-occupation-disability-insurance/. Published October 20, 2014. Accessed February 12, 2016.
- The five big money items you should do as a resident. The White Coat Investor website. http://whitecoatinvestor.com/the-five-big-money-items-you-should-do-as-a-resident/. Published July 7, 2011. Accessed January 25, 2016.

No survival benefit with prehospital transfusions
SAN ANTONIO – Prehospital blood transfusions during air medical transport did not improve 24-hour or in-hospital mortality at Vanderbilt University Medical Center, Nashville.
Investigators there reviewed 5,581 patients transported by helicopter to Vanderbilt from the scene of injury from the period of 2007-2013; they excluded patients who died on the helipad or in the ED. Average flight time was 48 minutes; 231 patients (4%) received prehospital blood transfusions (PBT) of up to two units of O negative packed red blood cells, which is all that the helicopters carried. The decision to transfuse was up to helicopter personnel who were advised to transfuse hemodynamically unstable patients and those who had lost more than a half liter of blood.

Vanderbilt reviewed its data because although PBT has become widespread in air medical transport, results from military and civilian studies are mixed. “A lot of evidence indicates that early, aggressive resuscitation with blood products improves survival once patients arrive at the hospital. It makes sense that starting the process early would improve outcomes, but relatively little is known about the prehospital environment,” said investigator and general surgery resident Dr. Benjamin Miller.
PBT didn’t seem to help at Vanderbilt. On multivariable regression, in-flight transfusion did not improve 24-hour mortality (OR 1.22; 95% CI 0.61-2.44) or overall in-hospital mortality (OR 1.20; 95% CI 0.55-1.79). It was the same story when 195 transfused patients were matched to 195 who were not transfused, based on mechanism of injury, scene vital signs, injury severity, travel duration, and other measures. Even with matching, PBT did not improve 24-hour mortality (OR 1.04; 95% CI 0.54-1.98) or overall mortality (OR 1.05; 95% CI 0.56-1.96).
There was a trend for improved 24-hour survival with transfusion when injury severity scores were below 20, but it wasn’t statistically significant, perhaps because few of the less injured patients died.
“Our results show no effect of PBT on 24-hour and overall in-hospital mortality. It’s puzzling to us because it’s counterintuitive to the damage control resuscitation strategy,” Dr. Miller said at the annual scientific assembly of the Eastern Association for the Surgery of Trauma.
The findings aren’t robust enough for Vanderbilt to cancel PBT, but they do suggest possible areas for improvement.
Maybe “one or two units of blood are not enough for patients who are severely injured and rapidly exsanguinating, or [maybe] fresh frozen plasma or platelets are needed. Maybe the trigger for transfusion is too low, or too high. It’s time from a prospective study,” Dr. Miller said.
Vanderbilt doesn’t use tranexamic acid to control trauma bleeding. The study didn’t capture volume of crystalloid infused, serum markers of shock, or coagulation study results.
Subjects were in their late 30s, on average, and 70% were men. Transfusions were more likely in younger patients and those with penetrating injuries, poorer at-scene vital signs and Glasgow coma scores, more severe injuries, and lower hematocrits. With the exception of younger age, those factors were also associated with death.
The investigators had no disclosures.
SAN ANTONIO – Prehospital blood transfusions during air medical transport did not improve 24-hour or in-hospital mortality at Vanderbilt University Medical Center, Nashville.
Investigators there reviewed 5,581 patients transported by helicopter to Vanderbilt from the scene of injury from the period of 2007-2013; they excluded patients who died on the helipad or in the ED. Average flight time was 48 minutes; 231 patients (4%) received prehospital blood transfusions (PBT) of up to two units of O negative packed red blood cells, which is all that the helicopters carried. The decision to transfuse was up to helicopter personnel who were advised to transfuse hemodynamically unstable patients and those who had lost more than a half liter of blood.
Vanderbilt reviewed its data because although PBT has become widespread in air medical transport, results from military and civilian studies are mixed. “A lot of evidence indicates that early, aggressive resuscitation with blood products improves survival once patients arrive at the hospital. It makes sense that starting the process early would improve outcomes, but relatively little is known about the prehospital environment,” said investigator and general surgery resident Dr. Benjamin Miller.
PBT didn’t seem to help at Vanderbilt. On multivariable regression, in-flight transfusion did not improve 24-hour mortality (OR 1.22; 95% CI 0.61-2.44) or overall in-hospital mortality (OR 1.20; 95% CI 0.55-1.79). It was the same story when 195 transfused patients were matched to 195 who were not transfused, based on mechanism of injury, scene vital signs, injury severity, travel duration, and other measures. Even with matching, PBT did not improve 24-hour mortality (OR 1.04; 95% CI 0.54-1.98) or overall mortality (OR 1.05; 95% CI 0.56-1.96).
There was a trend for improved 24-hour survival with transfusion when injury severity scores were below 20, but it wasn’t statistically significant, perhaps because few of the less injured patients died.
“Our results show no effect of PBT on 24-hour and overall in-hospital mortality. It’s puzzling to us because it’s counterintuitive to the damage control resuscitation strategy,” Dr. Miller said at the annual scientific assembly of the Eastern Association for the Surgery of Trauma.
The findings aren’t robust enough for Vanderbilt to cancel PBT, but they do suggest possible areas for improvement.
Maybe “one or two units of blood are not enough for patients who are severely injured and rapidly exsanguinating, or [maybe] fresh frozen plasma or platelets are needed. Maybe the trigger for transfusion is too low, or too high. It’s time from a prospective study,” Dr. Miller said.
Vanderbilt doesn’t use tranexamic acid to control trauma bleeding. The study didn’t capture volume of crystalloid infused, serum markers of shock, or coagulation study results.
Subjects were in their late 30s, on average, and 70% were men. Transfusions were more likely in younger patients and those with penetrating injuries, poorer at-scene vital signs and Glasgow coma scores, more severe injuries, and lower hematocrits. With the exception of younger age, those factors were also associated with death.
The investigators had no disclosures.
AT The EAST SCIENTIFIC ASSEMBLY
Key clinical point: Air transport teams may need to carry more than two units of packed red blood cells.
Major finding: On multivariable regression, in-flight transfusion did not improve 24-hour survival (OR 1.22; 95% CI 0.61-2.44) or overall mortality (OR 1.20; 95% CI 0.55-1.79).
Data source: Retrospective cohort involving 5,581 trauma patients.
Disclosures: The investigators had no disclosures.

Woman Loses Weight, Gains Skin Problem
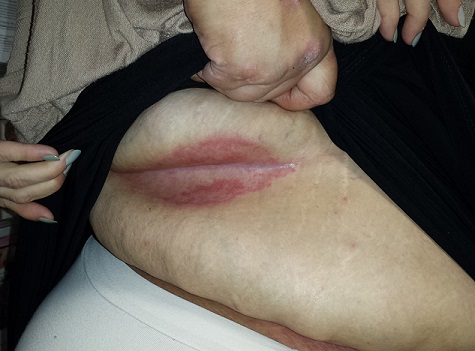
Since early summer, a 51-year-old woman has had an itchy rash on her trunk. It manifested after she intentionally lost more than 200 lb, which resulted in deeper and more pronounced skinfolds. The same skinfolds are repeatedly involved in flares of the rash, which is worse on particularly hot days. She was diagnosed with “yeast infection” but the problem failed to respond to oral fluconazole and topical nystatin.
The patient has multiple health problems, including diabetes, chronic anxiety, and hypertension.

EXAMINATION
There is a deep, linear, concave fold in the skin of the right flank, the long axis of which is transversely oriented. Within this fold, a fiery red rash is seen; its margins exactly match the outline of skin-on-skin contact. The surface of the affected skin is macerated and wet looking. There is neither tenderness nor increased warmth on palpation.
What is the diagnosis?
DISCUSSION
This phenomenon is called intertrigo, and it’s a subject of much confusion. This is especially true in primary care, where almost any intertriginous rash is labeled “yeast infection” and treated with anti-yeast medications that fail as monotherapy. In fact, true yeast infections in or on the skin are quite unusual.
Here is what happens when skin is held on skin: Moisture can accumulate, temperature rises, and skin becomes macerated and starts to break down. Organisms already present on the skin begin to multiply and can contribute to the inflammatory burden. Any pre-existing skin disease (eg, seborrhea, eczema or psoriasis) can flare under these conditions, further breaking down the epidermal barrier. With the right mix of these and other factors (severe obesity, diabetes, immunosuppression, hot weather), yeast can play a bigger role in the problem—but it is usually a minor factor.
Intertrigo is common under the breasts, in the axillae, and in abdominal panniculi. It can also be seen, as in this case, in large folds on the trunk, or even on the legs. Most cases of diaper rash involve at least a component of intertrigo.
The factors that predispose to intertrigo tend to be chronic, making the problem chronic as well. The patient and family (if appropriate) need to understand this, as well as the seasonal effects (the condition will be worse in warm months but improve in winter).
Treatment should be directed at reducing moisture in the area. This can be achieved by opening it up to air as much as possible, using aluminum acetate solution soaks to dry out the skin, placing strips of cotton or linen cloth to separate skinfolds, or applying antiperspirants or talcum-based powder.
For acute treatment, class 4 or 5 steroid creams can be used for short periods. An OTC topical anti-yeast cream, such as clotrimazole or miconazole, can be added.
The onset of such a rash, without obvious predisposing factors, should prompt consideration of other items in the differential. These include cutaneous T-cell lymphoma, Paget’s disease, or zinc deficiency–related conditions. More common lookalikes include contact or irritant dermatitis.
TAKE-HOME LEARNING POINTS
• As its name suggests, intertrigo is a condition affecting the intertriginous areas (eg, skin folds); common locations are under breasts or in the axillae, groin, or panniculi.
• Though yeast organisms can play a role in the development of intertrigo, treatment with anti-yeast products as monotherapy rarely work.
• Instead, management of intertrigo must be directed at the causative factors: heat, sweat, and friction.
• Intertrigo is difficult to treat, in large part because the major causative factors (weight, heat, sweat) are hard to change.
Since early summer, a 51-year-old woman has had an itchy rash on her trunk. It manifested after she intentionally lost more than 200 lb, which resulted in deeper and more pronounced skinfolds. The same skinfolds are repeatedly involved in flares of the rash, which is worse on particularly hot days. She was diagnosed with “yeast infection” but the problem failed to respond to oral fluconazole and topical nystatin.
The patient has multiple health problems, including diabetes, chronic anxiety, and hypertension.
EXAMINATION
There is a deep, linear, concave fold in the skin of the right flank, the long axis of which is transversely oriented. Within this fold, a fiery red rash is seen; its margins exactly match the outline of skin-on-skin contact. The surface of the affected skin is macerated and wet looking. There is neither tenderness nor increased warmth on palpation.
What is the diagnosis?
DISCUSSION
This phenomenon is called intertrigo, and it’s a subject of much confusion. This is especially true in primary care, where almost any intertriginous rash is labeled “yeast infection” and treated with anti-yeast medications that fail as monotherapy. In fact, true yeast infections in or on the skin are quite unusual.
Here is what happens when skin is held on skin: Moisture can accumulate, temperature rises, and skin becomes macerated and starts to break down. Organisms already present on the skin begin to multiply and can contribute to the inflammatory burden. Any pre-existing skin disease (eg, seborrhea, eczema or psoriasis) can flare under these conditions, further breaking down the epidermal barrier. With the right mix of these and other factors (severe obesity, diabetes, immunosuppression, hot weather), yeast can play a bigger role in the problem—but it is usually a minor factor.
Intertrigo is common under the breasts, in the axillae, and in abdominal panniculi. It can also be seen, as in this case, in large folds on the trunk, or even on the legs. Most cases of diaper rash involve at least a component of intertrigo.
The factors that predispose to intertrigo tend to be chronic, making the problem chronic as well. The patient and family (if appropriate) need to understand this, as well as the seasonal effects (the condition will be worse in warm months but improve in winter).
Treatment should be directed at reducing moisture in the area. This can be achieved by opening it up to air as much as possible, using aluminum acetate solution soaks to dry out the skin, placing strips of cotton or linen cloth to separate skinfolds, or applying antiperspirants or talcum-based powder.
For acute treatment, class 4 or 5 steroid creams can be used for short periods. An OTC topical anti-yeast cream, such as clotrimazole or miconazole, can be added.
The onset of such a rash, without obvious predisposing factors, should prompt consideration of other items in the differential. These include cutaneous T-cell lymphoma, Paget’s disease, or zinc deficiency–related conditions. More common lookalikes include contact or irritant dermatitis.
TAKE-HOME LEARNING POINTS
• As its name suggests, intertrigo is a condition affecting the intertriginous areas (eg, skin folds); common locations are under breasts or in the axillae, groin, or panniculi.
• Though yeast organisms can play a role in the development of intertrigo, treatment with anti-yeast products as monotherapy rarely work.
• Instead, management of intertrigo must be directed at the causative factors: heat, sweat, and friction.
• Intertrigo is difficult to treat, in large part because the major causative factors (weight, heat, sweat) are hard to change.
5 Tips to Finding a Good Locum Tenens Company
Over the past five years, I have worked as a locum tenens hospitalist with more than 12 different locum tenens companies. I have learned a lot through this process. At one point, I even considered starting my own locum tenens company because of the frustrations I was feeling about the inefficiencies of many of these companies. I would like to help those of you either already practicing as a locum tenens physician or considering practicing through this process to make it as painless as possible.
Here are my tips to be aware of when choosing a locum tenens company to work with.
- Bigger isn’t necessarily better. There are a few companies that advertise a lot. I’m sure you are all very well aware of them. They send out many emails, call numerous times, and somehow have a banner on every website you visit. These companies tend to have large overhead costs. These costs mean that your hourly rate may be lower. Smaller companies are sometimes less efficient, but as long as you make sure your expectations are heard, they will often give you a rate that the bigger companies cannot afford.
- State your terms. As physicians, we are often not the most business savvy. Remember that locum tenens companies exist because there is a shortage of hospitalists in some areas. We need to be able to state certain terms; if you don’t like something, then make sure you add that into your contract. For example, patient safety should always come first; make sure you establish a cap for the number of patients you are willing to see per day.
- Be protective of your CV. Remember that locum tenens companies profit when you work, so they will want to hand out your CV to as many hospitals as possible. While they make it sound like it is in your best interest, it may not be. If a company presents you to a hospital, most of the time the contract you sign with them states that they “own” your presentation for two years. This means that if you do not like the locum tenens company or if another company is offering you more for the same hospital, you have to work with the company that presented you first. Make sure you have a written agreement between you and your locum tenens company with regard to presentations stating which hospitals the locum tenens company can present you to, with a follow-up response from the locum tenens company stating when they presented you.
- Your recruiter is your best advocate. Make sure you get along. Make sure you have very good communication with your recruiter, who is the one who will be doing all of your scheduling and negotiating. If you do not have a good relationship, move on to a new recruiter or to a new company.
- Have fun! Working as a locum tenens physician, in my opinion, is the best of everything combined. There are very few jobs where you can decide when you want to work, dictate your terms, and get paid well doing something you love. Locum tenens takes a little bit of getting used to; when you have it figured out, it is empowering and enjoyable. TH
Geeta Arora, MD, is board certified in internal medicine and integrative holistic medicine.
Medicare Patient Outcomes of Inpatient Laparoscopic Cholecystectomy Varies Among Hospitals
NEW YORK (Reuters Health) - Outcomes of inpatient laparoscopic cholecystectomy in Medicare patients vary widely among hospitals, and most adverse outcomes occur well after patients have been discharged, new findings show.
While the overall adverse outcome rate was 20.7%, risk-adjusted adverse outcomes ranged from 10% in the best-performing decile of hospitals to 32.1% for the worst-performing decile, Dr. Donald E. Fry of MPA Healthcare Solutions in Chicago and colleagues found.
"These differences indicate that a significant number of readmissions and overall adverse outcomes of care after laparoscopic cholecystectomy are potentially preventable," Dr. Fry and his team state in their report, online February 1 in the Annals of Surgery.
Risk-adjusted measurement of care has typically been limited to inpatient events and 30-day mortality rates, they note, but declines in mortality rates, shorter patient stays and a shift toward ambulatory procedures have made this measurement more difficult.
"Surgery for gallbladder disease has experienced one of the most dramatic transitions from extended inpatient care to outpatient or limited inpatient care," they write.
To compare outcomes among hospitals, Dr. Fry and his team looked at Medicare data for 2010-2012 including both inpatient and 90-day post-discharge adverse outcomes for inpatient laparoscopic cholecystectomy.
They created a developmental database including more than 73,000 patients to construct predictive models for adverse outcomes, and a database of more than 83,000 patients treated at 1,570 hospitals, each with 20 or more qualifying cases and 4.5 or more predicted total adverse outcomes, to compare performance.
A total of 509 patients (0.6%) died in the hospital, 5,761 (6.9%) had prolonged length of stay, 1,154 (1.4%) died within 90 days of discharge without being readmitted, and 12,038 (14.5%) were readmitted at least once in the 90 days after discharge.
Gastrointestinal, infectious and cardiovascular events were the most common readmission causes.
"Strategies for improvement begin with hospitals and surgeons knowing what the results of their care happen to be," Dr. Fry told Reuters Health by email. "Since many readmissions and Emergency Department visits of post-discharge surgical cases occur at hospitals other than the facility of the index
hospitalization, the actual results of care may not be appreciated by the providers."
He added: "Improvement strategies need to focus on the reasons patients were readmitted. Better pain management will reduce readmissions for constipation, abdominal distention, nausea and vomiting. Increased contact by clinicians with their patients after discharge can identify early evidence of
pulmonary problems or potential urinary tract infection. Earlier recognition of evolving issues can provide interventions that avoid readmissions. Better overall strategies to avoid cardiac events and hypovolemia that may play in central nervous system events and renal failure should be of benefit."
Dr. Fry and his colleagues are now investigating whether similar differences in outcomes occur with other types of surgical procedures, as well as the frequency of and reasons for post-discharge emergency room visits.
"A final message for surgeons in this research is that Medicare has begun an initiative into bundled payments," Dr. Fry said. "Surgeons and hospitals need to establish better trackingmethods for post-discharge patients so that they know the results of care and so that they can develop focused strategies for better outcomes. There will be a substantial financial penalty for those who cannot adapt to the new payment model that CMS is implementing."
Histone levels may predict thrombocytopenia

Image by Eric Smith
Measuring circulating histones may help physicians predict the onset of thrombocytopenia or allow them to monitor the condition in patients who are critically ill, according to researchers.
They noted that histones induce profound thrombocytopenia in mice and are associated with organ injury when released after extensive cell damage in patients who are critically ill.
So the team decided to examine the association between circulating histones and thrombocytopenia in patients in the intensive care unit (ICU).
Cheng-Hock Toh, MD, of the University of Liverpool in the UK, and his colleagues conducted this research and reported the results in a letter to JAMA.
The researchers analyzed 56 patients with thrombocytopenia and 56 controls with normal platelet counts who were admitted to the ICU at Royal Liverpool University Hospital between June 2013 and January 2014.
Thrombocytopenia was defined as a platelet count less than 150 × 103/µL, a 25% or greater decrease in platelet count, or both within the first 96 hours of ICU admission.
The researchers noted that, at approximately 30 µg/mL, histones bind platelets and cause platelet aggregation, which results in profound thrombocytopenia in mice.
So the team used this as a cutoff to stratify thrombocytopenic patients. A “high” level of histones was 30 µg/mL or greater, and a “low” level was below 30 µg/mL.
The researchers detected circulating histones in 51 of the thrombocytopenic patients and 31 controls—91% and 55%, respectively (P<0.001). Histone levels were 2.5- to 5.5-fold higher in thrombocytopenic patients than in controls.
Thrombocytopenic patients with high histone levels at ICU admission had significantly lower platelet counts and a significantly higher percentage of decrease in platelet counts at 24 hours (P=0.02 and P=0.04, respectively) and 48 hours (P=0.003 and P=0.005, respectively) after admission.
High admission histone levels were associated with moderate to severe thrombocytopenia and the development of clinically important thrombocytopenia (P<0.001).
A 30 µg/mL histone concentration was able to predict thrombocytopenia with 76% sensitivity and 91% specificity. The positive predictive value was 79.4%, and the negative predictive value was 89.2%. ![]()
Adjunct T-cell therapy granted orphan designation
The US Food and Drug Administration (FDA) has granted orphan drug designation for BPX-501, an adjunct T-cell therapy.
The designation is for the combination of BPX-501 genetically modified T cells and the activator agent rimiducid as replacement T-cell therapy for the treatment of immunodeficiency and graft-versus-host disease (GVHD) after allogeneic hematopoietic stem cell transplant (HSCT).
BPX-501 consists of genetically modified donor T cells incorporating the CaspaCIDe safety switch, which is designed to eliminate cells in the event of toxicity.
The CaspaCIDe switch consists of the CID-binding domain coupled to the signaling domain of caspase-9, an enzyme that is part of the apoptotic pathway. Infusion of rimiducid is designed to trigger activation of this domain of caspase-9 (iCasp9), which leads to selective apoptosis of the CaspaCIDe-containing cells.
This technology is intended to provide a safety net to eliminate BPX-501 alloreactive T cells if severe GVHD occurs, ostensibly enabling physicians to more safely perform haploidentical HSCTs by adding back the BPX-501 genetically engineered T cells to speed immune reconstitution and provide control over viral infections.
Following an allogeneic HSCT, a lack of sufficient mature T cells constitutes immune deficiency that can contribute to infections, viral reactivation, and relapse.
The ability to correct this immune deficiency by adding back mature donor T cells, without raising the risk of uncontrollable GVHD, has the potential to change the risk profile of allogeneic transplant, according to Bellicum Pharmaceuticals, the company developing BPX-501.
BPX-501 is being evaluated in multiple phase 1/2 trials in adults and pediatric patients with leukemias, lymphomas, and genetic blood diseases in the US and Europe.
About orphan designation
The FDA’s Office of Orphan Products Development grants orphan designation to drugs and biologics intended to treat, diagnose, or prevent rare diseases and disorders that affect fewer than 200,000 people in the US.
Orphan designation qualifies a company for various development incentives, including tax credits for qualified clinical testing and marketing exclusivity for a period of 7 years. ![]()
MSC product may treat refractory aGVHD

HONOLULU—A mesenchymal stem cell (MSC) product has shown promise for treating children with steroid-refractory acute graft-versus-host disease (aGVHD), according to researchers.
The product, remestemcel-L (MSC-100-IV, formerly Prochymal), produced an overall response rate of 65% by 28 days after treatment.
And patients who responded to remestemcel-L had significantly better survival at day 100 than patients who did not respond.
Joanne Kurtzberg, MD, of Duke University Medical Center in Durham, North Carolina, presented these data at the 2016 BMT Tandem Meetings (abstract 54). The study was sponsored by Mesoblast, the company developing remestemcel-L.
“There is a critical and urgent need for an effective and well-tolerated treatment for the very ill children who develop [GVHD] after a bone marrow transplant,” Dr Kurtzberg said. “While, historically, there is a high mortality rate associated with this complication, we are now seeing the majority of children who receive Mesoblast’s cell therapy respond and survive.”
For this study, Dr Kurtzberg and her colleagues assessed 241 children treated in Mesoblast’s Expanded Access Program, which was conducted at 50 sites in North American and Europe from 2007 to 2014.
Forty-five percent of the children received a bone marrow transplant, 31% received cord blood, and 45% had a mismatched transplant. Their median age was 9.6 (range, 2 months-18 years), 61% were male, and 60% were Caucasian.
All of the patients had steroid-refractory aGVHD. Thirty percent had grade C GVHD, 50% had grade D, 50% had multi-organ disease, and 79% were classified as “high-risk” disease.
Treatment
All 241 children received remestemcel-L, which consists of bone-marrow derived and culture-expanded human MSCs. The initial treatment was 2 million MSCs/kg twice a week for 4 weeks, at least 3 days apart.
Continued treatment consisted of 2 million MSCs/kg once a week for 4 weeks if patients achieved a partial or mixed response (improvement in one organ with deterioration in another organ) at the day-28 assessment.
The patients received a total of 2434 infusions. The median number of infusions was 11 (range, 1-24), and the median duration of treatment was 46 days (range, 1-186). Eighty-one percent (123/152) of eligible patients with a partial or mixed response at day 28 received continued therapy of 1 infusion a week for 4 weeks.
Results
Fifty-seven percent of patients (n=138) had at least 1 serious adverse event. About 5% (n=11) were considered treatment-related, and 1.7% (n=4) led to study discontinuation. There was 1 infusion reaction.
Thirty-four percent of patients (n=81) died through day 100, and 2.5% (n=6) experienced a relapse of their underlying disease.
At day 28 after treatment, the overall response rate was 65%, with a complete response rate of 14% and partial response rate of 51%. Responses were observed for all aGVHD grades and did not differ by baseline organ involvement.
When remestemcel-L was used as front-line therapy following steroid failure, the response rate was 81%. In patients with gastrointestinal and liver disease, the overall response rates were 65% and 62%, respectively.
Children who achieved a response at day 28 had significantly improved survival, compared to those who did not—82% and 39%, respectively (P<0.0001).
Extending therapy beyond day 28 in children who had a mixed response at day 28 resulted in significantly improved survival as well. Survival was 72% for these patients, compared to 18% for patients with a mixed response who did not receive additional therapy (P=0.003).
Mesoblast is now conducting a 60-patient, open label, phase 3 trial using remestemcel-L as front-line therapy in children with steroid-refractory aGVHD. ![]()
Poverty tied to early relapse in kids with ALL

Photo by Logan Tuttle
A new study suggests children with acute lymphoblastic leukemia (ALL) are more likely to suffer early relapse if they live in high-poverty areas.
All of the children studied received the same treatment, and the rates of relapse were similar regardless of poverty level.
But early relapse was more common among children from poorer areas. These children also had a lower rate of 5-year overall survival, but the difference was not significant.
Kira Bona, MD, of Dana-Farber Cancer Institute in Boston, Massachusetts, and her colleagues reported these results in Pediatric Blood & Cancer.
The team examined outcomes for 575 children, ages 1 to 18, with newly diagnosed ALL who were treated on Dana-Farber Cancer Institute ALL Consortium Protocols at 7 major academic medical centers in the US between 2000 and 2010.
Using US Census Bureau criteria, the investigators defined high-poverty areas as zip codes where 20% or more of residents have incomes below the federal poverty level. For a family of 4, this translates to an annual income of $24,250 or less.
Dr Bona and her colleagues found the overall rates of relapse were similar between children from low-poverty areas and those from high-poverty areas.
However, the timing of relapse differed significantly. Ninety-two percent of children from high-poverty areas who relapsed suffered early relapse (less than 36 months after first achieving complete remission), while 48% of the other children who relapsed did so early (P=0.008).
The 5-year overall survival was 85% for children from high-poverty areas and 92% for children from low-poverty areas. This difference is statistically significant when considered on its own (P=0.02) but not when the analysis is adjusted for other factors (P=0.07).
Still, the investigators said this suggests a possible disparity in survival.
“These children are getting the same best possible care at well-resourced institutions from highly trained clinicians, and we’re still seeing disparities,” Dr Bona said. “In trying to improve cure rates, we, as a field, have focused almost exclusively on biology. If we want to move forward, we also have to look at social determinants.”
Next steps
Dr Bona and her colleagues are undertaking further research designed to delve deeper into the relationship between socioeconomic status and outcomes and to allow for the development of poverty-targeted interventions.
As part of a prospective trial for children with ALL, the researchers will investigate associations between disease outcomes and the socioeconomic status of patients’ families, using a targetable measure of socioeconomic status called material hardship (food, housing, and/or energy insecurity).
The researchers will also investigate possible mechanisms underlying the relationship between socioeconomic status and early relapse, including adherence to oral chemotherapy and delays or dose reductions in chemotherapy due to a child’s underlying health.
In another study, investigators will conduct in-depth interviews with patients’ families, probing their knowledge and experience to pinpoint factors that might explain the disparity in outcomes and identify factors that can be targeted with interventions.
“Doing these next 2 studies is incredibly important,” Dr Bona said. “This study told us that simply providing the current best treatment regimen is not good enough if our goal is to cure every child with cancer.”
“At the same time that we develop new drugs and new treatment protocols, we need to address social determinants of health. Findings from these next studies will help us develop specific interventions to address disparities in outcomes. That’s an amazing opportunity.” ![]()