User login
Acute decompensated heart failure (ADHF) accounts for over a million hospitalizations per year, with a reported all‐cause mortality rate 11.7% and all‐cause readmission rate 22.5% at 30 days after initial hospitalization.[1]
Risk stratification for accurate identification of ADHF patients at high risk for readmission and mortality may enable clinicians to undertake timely interventions: triage to appropriate level of care and resource allocation for postdischarge care. Further risk stratification may allow the care team to plan and implement a personalized care plan. Several clinical and laboratory variables have been proposed for identification of patients with ADHF who are at increased risk for adverse clinical outcomes. Despite advances in the risk stratification of patients with ADHF, the accurate prediction of individuals at high risk for readmissions and mortality is challenging. Cardiac troponin T (cTnT) and I (cTnI) are highly sensitive and specific biomarkers that are widely used for the risk stratification of patients with acute myocardial infarction and stable heart failure.[2]
In this systematic review and meta‐analysis, we evaluate circulating cardiac troponin in determining risk for increased length of stay (LOS), hospital readmission, and mortality among patients admitted with ADHF.
METHODS
Data Sources and Searches
This systematic review and meta‐analysis was conducted in accordance with the established methods[3] and Preferred Reporting Items for Systematic Review and Meta‐Analysis (PRISMA) guidelines.[4] Risk of bias was evaluated using the Newcastle‐Ottawa Scale for cohort studies.[5] We performed a comprehensive search of several databases from each database's earliest inception to March 2015 without language restrictions. The databases included MEDLINE In‐Process & Other Non‐Indexed Citations, MEDLINE, Embase, Cochrane Central Register of Controlled Trials, Cochrane Database of Systematic Reviews, and Scopus. We conducted a manual search for bibliography of pertinent reviews for relevant citations that our electronic searches might have missed. The actual strategy is available from the corresponding author.
Study Selection
Eligibility criteria included: (1) randomized or nonrandomized clinical trials involving adults hospitalized with ADHF, (2) comparator groups stratified by cardiac troponin (cTn) level as defined by individual study investigators, and (3) studies reporting 1 or more of the following clinical outcomes: (1) in‐hospital mortality, (2) hospital LOS, (3) major adverse events during hospitalization (defined as persistent dyspnea,[6] worsening of heart failure,[6, 7, 8, 9] worsening of renal function [creatinine 0.3 mg/dL],[8] or recurrent myocardial ischemia[9] after hospitalization for ADHF), (4) postdischarge readmission, (5) postdischarge mortality rate, and (6) the composite of readmission and mortality. We excluded studies incorporating patients with (1) stable heart failure, (2) acute myocarditis, (3) chemotherapy‐induced cardiomyopathy, (4) postsurgical heart failure, (5) transplanted heart, (6) left ventricular assist device, and (7) hemodialysis.
We incorporated the description of ADHF from national registry for defining ADHF.[10] The lower limit of detection of cTn level in healthy subjects is assay dependent, each with a different cutoff value. To improve uniformity of expression in the present meta‐analysis, we arbitrarily stratified groups by the level of cTn: (1) undetected cTn (cTnT 0.01; cTnI 0.012 g/L), (2) detectable cTn (cTnT 0.010.03; cTnI 0.0120.03 g/L), and (3) elevated cTn (cTnT >0.03; cTnI >0.034 g/L).
Data Extraction and Risk of Bias Assessment
From the results of the initial search, 2 investigators (M.Y. and A.D.A), working independently, reviewed articles for eligibility on the basis of titles and abstracts. Studies that satisfied the inclusion and exclusion criteria were retrieved for full‐text review. Disagreements were resolved by consensus after discussion among investigators, and retained conflicts were adjudicated by a third investigator.
We extracted the following data from each study: type of study, number of participants, age, gender, type of cTn assayed and cut point, comorbidities, length of follow‐up, and outcome measure. Prevalence of detectable or elevated cTn, measure of association with clinical outcomes (hazard ratio [HR], odds ratio [OR], or relative risk) were also abstracted. When HR or OR were not reported for an outcome, based on other provided data, we estimated HR using previously validated methods.[11]
Data Synthesis and Analysis
Studies were stratified by cTn cutoff point and length of follow‐up. To reduce heterogeneity, studies reporting clinical outcomes at multiple time periods after the index hospitalization were grouped in three categories: (1) studies with short‐term follow up (06 months), (2) studies with intermediate‐term follow‐up (up to 1 year), and (3) studies with long‐term follow‐up (up to 3.5 years). We used the DerSimonian and Laird random effects model to combine OR or HR reported by individual studies. The consistency of the results of the studies was assessed by I2 statistics, with values >40% considered as indicators of heterogeneity. We evaluated statistically for publication bias if a sufficient number of studies was available, because such evaluation is unreliable when20 studies are included in a particular analysis.[12]
Sensitivity analyses were performed to investigate the robustness of results to a few assumptions. Analyses were repeated excluding studies reporting unadjusted relative effect measures to assess whether confounding had a large effect on overall results. Similarly, analysis was repeated omitting studies reporting detectable cTn as opposed to elevated cTn level to assess whether these studies influence overall results. All statistical analyses were conducted using Stata 14.0 (StataCorp, College Station, TX).
Quality and Risk of Bias Assessment
The Newcastle‐Ottawa scale was used to assess the quality and risk of bias in cohort studies as suggested by the Cochrane Collaboration.[13] For the assessment of risk of bias, a study was awarded a maximum of 1 star for each of the 7 items from 2 domains: (1) selection of cohort (representativeness of the exposed cohort, selection of the nonexposed cohort, ascertainment of exposure, and demonstration that the outcome of interest was not present at the start of the study) and (2) outcome (assessment of outcome, was the follow‐up long enough, adequacy of the follow‐up of the cohort), and a maximum of 2 stars for comparability of the cohort (comparability on the basis of design and analysis) (Table 1).
| Source | Year | Selection | Compatibility | Outcome | Quality | ||||||
|---|---|---|---|---|---|---|---|---|---|---|---|
| S1 | S2 | S3 | S4 | C1 | C2 | O1 | O2 | O3 | |||
| |||||||||||
| Del Carlo et al.[31] | 2009 | * | * | * | * | * | 5 | ||||
| Felker et al.[6] | 2012 | * | * | * | * | * | 5 | ||||
| Gattis et al.[7] | 2004 | * | * | * | * | * | * | * | 7 | ||
| Guisado Espartero et al.[32] | 2014 | * | * | * | * | * | * | 6 | |||
| Ishii et al.[21] | 2002 | * | * | * | * | * | 5 | ||||
| Kuwabara et al.[22] | 2007 | * | * | * | * | * | 5 | ||||
| La Vecchia et al.[23] | 2000 | * | * | * | * | * | * | * | 7 | ||
| La Corvoisie et al.[17] | 2014 | * | * | * | * | * | * | * | 7 | ||
| Manzano‐Fernandez et al.[33] | 2009 | * | * | * | * | * | 5 | ||||
| Metra et al.[24] | 2007 | * | * | * | * | * | 5 | ||||
| Nakamura et al.[36] | 2014 | * | * | * | * | * | * | * | * | 8 | |
| O'Connor et al.[8] | 2011 | * | * | * | * | * | * | * | * | 8 | |
| Oliveira et al.[34] | 2010 | * | * | * | * | * | * | * | * | 8 | |
| Parissis et al.[20] | 2011 | * | * | * | * | * | * | * | 7 | ||
| Parissis et al.[25] | 2013 | * | * | * | * | * | * | * | * | 8 | |
| Pascual‐Figal et al.[37] | 2012 | * | * | * | * | * | * | 6 | |||
| Peacock et al.[15] | 2008 | * | * | * | * | * | * | * | * | * | 9 |
| Perna et al.[18] | 2005 | * | * | * | * | * | * | * | 7 | ||
| Perna et al.[19] | 2002 | * | * | * | * | * | * | 6 | |||
| Perna et al.[26] | 2012 | * | * | * | * | * | * | 6 | |||
| Rudiger et al.[27] | 2005 | * | * | * | * | * | * | 6 | |||
| Shah et al.[16] | 2007 | * | * | * | * | 4 | |||||
| Wallenborn et al.[28] | 2013 | * | * | * | * | * | * | * | 7 | ||
| Xue et al.[29] | 2011 | * | * | * | * | * | * | * | 7 | ||
| You et al.[35] | 2007 | * | * | * | * | * | * | * | * | * | 9 |
| Zairis et al.[30] | 2010 | * | * | * | * | * | * | * | 7 | ||
RESULTS
Search Results
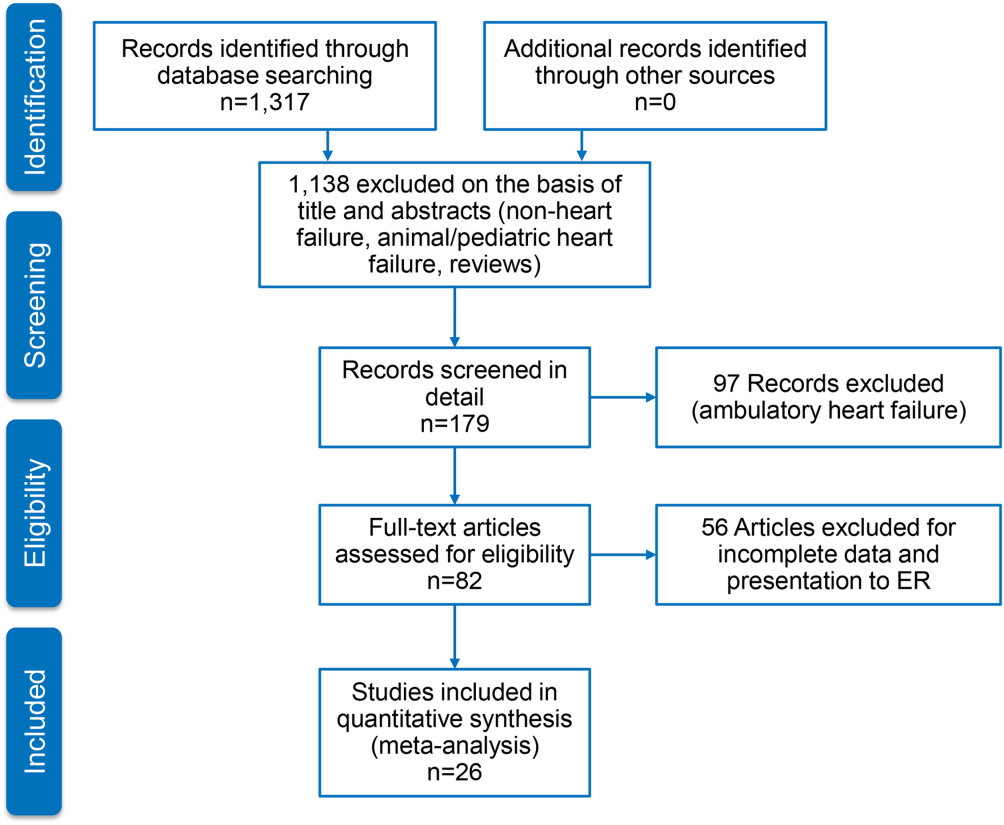
Figure 1 represents the PRISMA flow diagram for literature search and selection process to identify eligible studies for inclusion.

Characteristics of Included Studies
We identified 26 studies, which were all observational cohorts with postdischarge median follow‐up from 30 days to 472 days. Table 2 summarizes the study characteristics. Studies were heterogeneous with regard to prevalence of elevated cTn, cTn assay, and length of follow‐up. Thirteen were single‐center and 5 were multicenter studies, 4 were substudies of large multicenter phase III clinical trials, and 4 were registries. Except for one abstracts, all studies were peer‐reviewed publications. Sample size ranged from 34 to 69,259 patients.
| Source | Year | Design | Patient Population | CAD | HF Type | LVEF, Mean % | Clinical Outcomes | |||
|---|---|---|---|---|---|---|---|---|---|---|
| No. of Patients | Age, y | Men, % | Follow‐up | Endpoints | ||||||
| ||||||||||
| Del Carlo et al.[31] | 2009 | Single | 70 | 54 16 | 69 | 26 | HFrEF | 31 8 | 262 (3393) days | Readmission, mortality |
| Felker et al.[6] | 2012 | Substudy | 808 | 67 | 70 | 61 | Both | 25 | Hosp, 30 days, 6 months | MAE, LOS, readmission, mortality |
| Gattis et al.[7] | 2004 | Substudy | 133 | NR | NR | NR | NR | NR | Hosp | MAE, mortality |
| Guisado Espartero et al.[32] | 2014 | Registry | 406 | 77 (7678) | 42 | 25 | Both | 50 (4456) | 1 year | Readmission, mortality |
| Ishii et al.[21] | 2002 | Single | 98 | 69 9 | 52 | 45 | NR | 42 17 | Hosp, 60 days, >1 year | Readmission, mortality |
| Kuwabara et al.[22] | 2007 | Single | 52 | 72 12 | 59 | 27 | NR | 47 16 | 143 (13540) days | Readmission, mortality |
| La Vecchia et al.[23] | 2000 | Single | 34 | 60 (2885) | 79 | 38 | HFrEF | NR | 90 days | Mortality |
| La Corvoisie et al.[17] | 2014 | Multicenter | 397 | NR | NR | NR | NR | Hosp | Mortality | |
| Manzano‐Fernandez et al.[33] | 2009 | Single | 138 | 74 (67801) | 54 | 35 | NR | NR | 261 (161449) days | Readmission, mortality |
| Metra et al.[24] | 2007 | Single | 116 | NR | NR | NR | NR | NR | 184 (7444) days | Readmission, mortality |
| Nakamura et al.[36] | 2014 | Single | 444 | NR | 63 | 15 | NR | NR | 472 (2001,200) days | Mortality |
| O'Connor et al.[8] | 2011 | Substudy | 288 | 73 (6577) | 59 | 74 | NR | NR | Hosp, 60 days | MAE, readmission, mortality |
| Oliveira et al.[34] | 2010 | Multicenter | 79 | NR | 61 | 18 | HFrEF | 27 | 8 months | MAE, readmission, mortality |
| Parissis et al.[20] | 2011 | Multicenter | 837 | NR | 48 | 20 | HFpEF | NR | Hosp | Mortality |
| Parissis et al.[25] | 2013 | Single | 113 | 73 11 | 68 | 46 | NR | 36 11 | 174 (94728) days | Mortality |
| Pascual‐Figal et al.[37] | 2012 | Single | 202 | 74 (6780) | 55 | 34 | Both | 49 (3260) | 406 (204728) days | Mortality |
| Peacock et al.[15] | 2008 | Registry | 69,259 | 74 14 | 45 | 56 | Both | 34 | Hosp | LOS, mortality |
| Perna et al.[18] | 2005 | Single | 184 | 64 13 | 60 | 38 | Both | NR | Hosp, 3 years | Readmission, mortality |
| Perna et al.[19] | 2002 | Single | 84 | 65 14 | 62 | 55 | NR | NR | Hosp, 1 year | Readmission, mortality |
| Perna et al.[26] | 2012 | Single | 500 | 73 12 | 53 | 38 | HFpEF | 53 11 | 6 months | Readmission, mortality |
| Rudiger et al.[27] | 2005 | Multicenter | 312 | 73 12 | 56 | 70 | Both | NR | 30 days, 1 year | Mortality |
| Shah et al.[16] | 2007 | Substudy | 141 | NR | NR | NR | HFrEF | NR | Hosp, 6 months | LOS, readmission, mortality |
| Wallenborn et al.[28] | 2013 | Registry | 879 | 69 12 | 72 | 50 | NR | 30 8 | 06 months, 618 months | Mortality |
| Xue et al.[29] | 2011 | Single | 144 | 68 13 | 98 | 62 | Both | 43 18 | 90 days | Readmission, mortality |
| You et al.[35] | 2007 | Registry | 2,025 | 76 11 | 50 | 55 | Both | NR | 1 year | Mortality |
| Zairis et al.[30] | 2010 | Multicenter | 577 | 74 8 | 68 | 77 | HFrEF | 23 5 | 31 days | Mortality |
Table 3 stratifies the characteristics of study populations by cTn status. The studies included 77,297 participants hospitalized for ADHF, of whom 7176 (9.3%) had detectable or elevated cTn level. Twenty‐five studies reported data on type of cTn measured (cTnI, cTnT, or both) and reported cutoff values for detectable or elevated cTn (Table 3). The percentages of patients who had detectable or elevated cTn varied widely across the studies (6.2%68%). Most studies utilized standard assays, and the cutoff point for cTn level was chosen arbitrary by study investigators or derived from receiver operating characteristic curve analysis. cTn level is assay dependent. For instance, the 99th centile upper reference limit (URL) is 0.014 ng/mL for cTnT with the Roche high‐sensitivity cTnT assay, and 0.04 ng/mL with the Siemens cTnI‐ultra assay. Few studies of the present meta‐analysis incorporated a cTn cutoff point that defined acute myocardial infarction.[14] Nine studies used a lower threshold cTn level (cTnT >0.01>0.03; cTnI >0.03) for stratification into comparator groups.
| Source | Year | No. of Patients | No. cTn+ (%) | cTn Cutoff | Age | Male | Atrial Fibrillation | CAD | ||
|---|---|---|---|---|---|---|---|---|---|---|
| Tn+ | Tn | Tn+ (%) | No. (%) | Tn+ (%) | Tn+ (%) | |||||
| ||||||||||
| Del Carlo et al.[31] | 2009 | 70 | 12 (17) | cTnT 0.10 | NR | NR | NR | 13 (19) | NR | NR |
| Felker et al.[6] | 2012 | 808 | 404 (50) | cTnT 0.034 | 69 | 65 | 364 (54) | 334 (41) | 170 (42) | 243 (60) |
| Gattis et al.[7] | 2004 | 133 | 91 (68) | cTnT 1.0 | 70 (6180) | 77 (6282) | 46 (50) | NR | NR | NR |
| Guisado Espartero et al.[32] | 2014 | 406 | 241 (60) | cTnT 0.02 | NR | NR | 116 (48) | 236 (58) | 136 (56) | 74 (31) |
| Ishii et al.[21] | 2002 | 98 | NR | cTnT 0.1 | NR | NR | NR | NR | NR | NR |
| Kuwabara et al.[22] | 2007 | 52 | 31 (60) | NR | NR | NR | 31 (59) | 23 (44) | NR | NR |
| La Vecchia et al.[23] | 2000 | 34 | 10 (29) | cTnI 0.4 | 56 13 | 62 12 | 100 | 19 (56) | 5 (50) | 3 (30) |
| La Corvoisie et al.[17] | 2014 | 397 | NR | cTnI0.15 | NR | NR | NR | NR | NR | NR |
| Manzano‐Fernandez et al.[33] | 2009 | 138 | NR | cTnT 0.011 | NR | NR | NR | NR | NR | NR |
| Metra et al.[24] | 2007 | 116 | 41 (38) | cTnT 0.01 | NR | NR | NR | NR | NR | 33 (61) |
| Nakamura et al.[36] | 2014 | 444 | 224 (51) | cTnT 0.028 | 67 14 | 66 14 | 133 (60) | 160 (36) | 72 (32) | 35 (16) |
| O'Connor et al.[8] | 2011 | 288 | 97 (34) | cTnT 0.03 | 71 | 72 | 67 (69) | NR | NR | NR |
| Oliveira et al.[34] | 2010 | 79 | 37 (47) | ctnT 0.02 | 57 18 | 54 17 | 26 (70) | NR | NR | 6 (16) |
| Parissis et al.[20] | 2011 | 837 | 184 (22) | cTnT >0.01 | NR | NR | NR | NR | NR | NR |
| Parissis et al.[25] | 2013 | 113 | 37 (33) | cTnT 0.077 | 74 8 | 72 12 | 22 (59) | 36 (32) | 12 (32) | 18 (49) |
| Pascual‐Figal et al.[37] | 2012 | 202 | NR | cTnT >0.02 | NR | NR | NR | 109 (54) | NR | NR |
| Peacock et al.[15] | 2008 | 69,259 | 4,240 (6.2) | cTnI 1.0; cTnT 0.1 | 73 14 | 73 14 | 2,035 (48) | 207 (30) | 975 (23) | 2,586 (58) |
| Perna et al.[18] | 2005 | 184 | 58 (31) | cTnT 0.1 | 64 13 | 65 13 | 37 (64) | NR | NR | 30 (52) |
| Perna et al.[19] | 2002 | 84 | 46 (55) | cTnT 0.1 | 68 11 | 61 16 | 27 (59) | NR | NR | 33 (72) |
| Perna et al.[26] | 2012 | 500 | 220 (44) | cTnT 0.02 | 74 10 | 72 14 | 125 (59) | 177 (35) | 70 (32) | 110 (50) |
| Rudiger et al.[27] | 2005 | 312 | 88 (28) | cTnT 0.1 | NR | NR | NR | NR | NR | NR |
| Shah et al.[16] | 2007 | 141 | NR | cTnI per 0.1 | NR | NR | NR | NR | NR | NR |
| Wallenborn et al.[28] | 2013 | 879 | 332 (37) | cTnT 0.06 | NR | NR | NR | NR | NR | NR (50) |
| Xue et al.[29] | 2011 | 144 | NR | cTnI 0.023 | NR | NR | NR | NR | NR | NR |
| You et al.[35] | 2007 | 2,025 | 669 (34) | cTnI >0.5 | 77 11 | 75 11 | 364 (53) | NR | NR | 417 (60) |
| Zairis et al.[30] | 2010 | 577 | 114 (20) | cTnI 0.42 | NR | NR | NR | 295 (51) | NR | 443 (77) |
Twenty‐five studies reported performance of cTn as a dichotomized variable. A few studies, additionally, examined clinical outcome in patients grouped by tertiles by cTn and determined the dose‐response relationship using cTn as a continuous variable. The measure of association between cTn and clinical outcome was reported as HR or OR by 16 studies. The remaining 6 studies reported the number of clinical events in the groups by cTn level and therefore provided unadjusted estimates. The results of all meta‐analyses are depicted in Figure 2.

In‐hospital Clinical Outcomes
Three studies examined the association between cTn level and LOS.[6, 15, 16] One study (n = 808) found increased LOS among patients with elevated cTn.[6] Another study (n = 141), which tested the cTn level as a continuous variable, reported no statistically significant association between cTn level and LOS.[16] A large, multicenter ADHF registry (Acute Decompensated Heart Failure National Registry), which reported elevated cTn as a predictor of LOS (mean stay 6.6 vs 5.5 days; P 0.001) but did not provide binary data (OR, confidence interval [CI]), was therefore excluded from the meta‐analysis.[15] The pooled HRs from 2 studies revealed a significant increase in LOS in the cohort with elevated cTn (OR: 1.05, 95% CI: 1.01‐1.10, P = 0.06, I2 = 59.5.0%, n = 949). Six studies assessed in‐hospital mortality,[15, 17, 18, 19, 20, 21] and the meta‐analysis showed a significant increase in the risk of death with no significant heterogeneity (OR: 2.57, 95% CI: 2.27‐2.91, P = 0.744, I2 = 0.0%, n = 69,524). Similarly, 4 clinical studies[6, 7, 8, 9] found detectable or elevated cTn as a predictor of worsened composite clinical outcomes of death and major cardiovascular events (OR: 1.33, 95% CI: 1.03‐1.71, P = 0.473, I2 = 0.0%, n = 1,313).
Short‐term (0 to 6 Months) Clinical Outcomes
Short‐term clinical outcome was assessed in 13 studies.[6, 8, 16, 21, 22, 23, 24, 25, 26, 27, 28, 29, 30] Nine studies addressed mortality,[6, 16, 23, 24, 25, 26, 27, 28, 30] 2 studies readmission,[16, 26] and 7 studies a composite of readmission and mortality during 6 months postdischarge.[6, 8, 21, 22, 24, 26, 29] The meta‐analysis showed increased mortality without significant heterogeneity (OR: 2.11, 95% CI: 1.43‐3.12, P = 0.000, I2 8.5%, 9 studies, n = 3471) and an increase in the composite of readmission and mortality with significant heterogeneity (OR: 2.81, 95%CI: 1.60‐4.92, P = 0.000, I2 89.1%, 7 studies, n = 2028) among ADHF patients with detectable or elevated cTn. The association between cTn level and readmission rate over 6 months post‐discharge did not reach statistical significance (OR: 1.00, 95% CI: 0.37‐2.74, P = 0.034, I2 77.9%, 2 studies, n = 641).
Intermediate‐term (Up to 12 Months) Clinical Outcomes
Intermediate‐term (during the 12 months postdischarge) clinical outcome was assessed in seven studies.[18, 24, 31, 32, 33, 34, 35] Five studies reported an association between cTn level and mortality.[18, 24, 32, 34, 35] The meta‐analysis demonstrated an increase in mortality with significant heterogeneity (OR: 2.21, 95% CI: 1.46‐3.35, P = 0.048, I2 58.4%, 5 studies, n = 2801). The pooled HRs of 2 studies examining the association between cTn and readmission rate[18, 32] did not yield statistical significance (OR: 1.55, 95% CI: 0.96‐2.52, P = 0.233, I2 29.6%, 2 studies, n = 590). A meta‐analysis of 5 studies that assessed an association between cTn and outcome[18, 24, 31, 32, 33] showed a significant increase in the risk of composite of readmission and mortality without significant heterogeneity (OR: 2.30, 95% CI: 1.78‐2.99, P = 0.666, I2 0.0%, 5 studies, n = 905) among patients with a detectable or elevated cTn.
Long‐term (>1 Year) Clinical Outcomes
Long‐term clinical outcome was assessed in 7 studies.[18, 19, 21, 24, 28, 36, 37] The meta‐analysis of 6 studies[18, 19, 21, 28, 36, 37] demonstrated an increase in mortality without significant heterogeneity (OR: 3.69, 95% CI: 2.64‐5.18, P = 0.696, I2 0.0%, 6 studies, n = 1891) among ADHF patients with a detectable or elevated cTn. Likewise, a composite of readmission rate and mortality was also increased (OR: 3.49, 95% CI: 2.08‐5.84, P = 0.070, I2 57.5%, 4 studies, n = 448) in a meta‐analysis of 4 studies.[18, 21, 24, 37] The meta‐analysis of 4 studies[18, 19, 24, 37] that assessed the association between cTn level and readmission rate over long‐term follow‐up showed no significant association (OR: 2.60, 95% CI: 0.80‐8.44, P = 0.000, I2 99.9 %, 4 studies, n = 576).
Confidence in the Estimates
Following the Grading of Recommendations Assessment, Development, and Evaluation approach to evaluate the confidence in the estimates from a systematic review and meta‐analysis[38] (ie, certainty or strength of evidence), we found that the association of a detectable or elevated troponin with mortality and readmission is moderate. This is due to a large effect (ie, relative association measure >2.0) demonstrated in observational studies. The confidence in the estimate of association with hospital LOS is low (smaller magnitude of effect). Analyses of in‐hospital outcomes were not associated with statistical heterogeneity, whereas several posthospital analyses had statistically significant heterogeneity.
DISCUSSION
We conducted a systematic review and meta‐analysis of published studies to assess the association between level of cTn and clinical outcomes including LOS, in‐hospital mortality, and short‐, intermediate‐, and long‐term readmission and death following index hospitalization for ADHF. The results of our meta‐analysis showed that compared with negative or not‐elevated cTn, detectable or elevated cTn was associated with increased LOS and higher rates of in‐hospital death among patients with ADHF. In addition, mortality and composite of mortality and readmission at short‐, intermediate‐ or long‐term after index hospitalization were greater in ADHF patients with a detectable or elevated cTn, as compared with those without elevated cTn, with significant heterogeneity across the studies. Finally, relatively fewer studies examined the association between cTn and readmission rate at multiple time periods after index hospitalization for ADHF, and these associations did not reach statistical significance.
In a review of 67,924 patients with ADHF from the US National Registry, which was limited in assessing inpatient mortality, Peacock et al. reported that a positive cardiac troponin test was associated with higher in‐hospital mortality, independently of other predictive variables.[15] We confirmed this observation in the present meta‐analysis, which also incorporated the study by Peacock et al. Furthermore, our data extended the findings of Peacock et al. to postdischarge readmission and death. The association between cTn and clinical outcomes was adjusted to multiple confounders across most studies included in the present meta‐analysis. Few studies in the present meta‐analysis showed a continuous and graded relationship between cTn level and clinical outcomes in patients with ADHF.[15, 35] Findings of previous studies showed that ADHF patients with persistently elevated cTn, measured at multiple time points during or following hospitalization, had worse clinical outcomes than did patients without similar elevation in cTn.[24, 29] Conversely, a decline in cTnT levels on serial measurements was associated with lower rates of adverse clinical outcomes, potentially through alleviation in ongoing myocardial injury.[39] Additionally, elevated cTn in ambulatory heart failure patients predicted incident hospitalization for acute decompensation.[40] Acute myocardial injury reflected by elevated cTn can be hypothesized to promote ventricular remodeling and thereby heart failure progression and consequent adverse clinical outcomes. Consistent with this hypothesis, a rise in cTn was observed in conjunction with elevated biological markers that characterize extracellular matrix remodeling in patients with heart failure during the acute and postacute phase.[41, 42]cTn is released in blood in direct proportion to myocardial injury.[43] A rise or fall in cTn with 1 value at or above the 99th centile URL in conjunction with clinical evidence of myocardial injury defines acute myocardial infarction.[14] Although patients with chronic stable heart failure often have chronically elevated cTn, those with ADHF may demonstrate an acute rise in cTn, with values reaching above the 99th percentile of URL in the absence of acute myocardial infarction.[15, 44] The pathophysiology of elevated cTn in ADHF is probably multifactorial.[14, 45, 46] The prevalence of elevated cTn in ADHF varied with assay sensitivity and the cutoff point chosen. For instance, in an analysis of >105,000 patients with ADHF, the prevalence of elevated cTn was increased from 6.2% with higher (cTnI >1.0 ng/mL or cTnT >0.1 ng/mL) to 75% with a lower cutoff point for cTn levels (cTnI >0.4 ng/mL and cTnT >0.01 ng/mL).[15]
In the general population with no established coronary artery disease, the prevalence of elevated cTn is contingent on sensitivity of the assay, age, and gender.[47, 48, 49, 50] Elevated cTn, beyond conventional risk factors, identifies a subgroup of individuals from the general population who are at high risk for incident heart failure and death.[51] Furthermore, elevated cTn is an independent predictor of short‐ and long‐term cardiovascular events in patients presenting to an emergency department (ED) for ADHF.[52, 53] In 2 large Canadian registries, an elevated cTn was associated with increased risk of death and cardiovascular readmissions at 30 days after ED visit.[53]
A number of recent studies have identified numerous other biomarkers as independent prognostic indicators in patients with heart failure. cTn, when combined with other biomarkers reflecting different dimensions of heart failure pathophysiology such as brain natriuretic peptide (BNP)/N‐terminal pro‐brain natriuretic peptide, soluble ST2, or cystatin C, enhanced the model's predictive utility beyond individual markers. For instance, patients with elevated cTn who also have increased BNP (840 pg/mL) had in‐hospital mortality of 10.2%, which was significantly greater than the 4.4% in patients with elevated BNP without detectable cTn.[54] Additionally, elevated cTn along with elevated pro‐brain natriuretic peptide and cystatin C has been reported to offer incremental prognostic information in patient with ADHF.[33]
The present systematic review and meta‐analysis is the most comprehensive to date and incorporated many observational cohorts with heterogeneous and unselected patient population. The studies have used various commercially available assays for the measurement of cTnT and cTnI. Therefore, findings of this meta‐analysis are applicable to a wider heart failure patient population. This review has several limitations. The association of elevated cTn and clinical outcome is likely affected by several confounders. Although we used adjusted estimates when possible, we did not have individual participant data. Due to the small number of included studies in each analysis, we could not explore heterogeneity causes using subgroup analysis or metaregression. For the same reasons, we could not statistically evaluate publication bias, which is likely in the setting of observational studies. The meta‐analysis is mainly driven by a few large studies.
In summary, in a broad spectrum of patients with ADHF, a detectable or elevated cTn is an independent predictor of major adverse clinical events not only during acute‐phase hospitalization but also after stabilization during the postdischarge phase. cTn is a widely available and inexpensive biomarker that provides important prognostic information and is likely to have important implications for in‐patient care and postdischarge surveillance of patients hospitalized for ADHF.
Disclosures
The authors certify that they have no affiliations with or involvement in any organization or entity with any financial interest (such as honoraria; educational grants; participation in speakers' bureaus; membership, employment, consultancies, stock ownership, or other equity interest; and expert testimony or patent‐licensing arrangements), or nonfinancial interest (such as personal or professional relationships, affiliations, knowledge, or beliefs) in the subject matter or materials discussed in this article.
- Centers for Medicare 98:1778–1786.
- , , , et al. Meta‐analysis of observational studies in epidemiology: A proposal for reporting. Meta‐analysis of observational studies in epidemiology (moose) group. JAMA. 2000;283:2008–2012.
- , , , et al. The PRISMA statement for reporting systematic reviews and meta‐analyses of studies that evaluate healthcare interventions: explanation and elaboration. BMJ. 2009;339:b2700.
- . Critical evaluation of the Newcastle‐Ottawa Scale for the assessment of the quality of nonrandomized studies in meta‐analyses. Eur J Epidemiol. 2010;25:603–605.
- , , , et al. Troponin I in acute decompensated heart failure: Insights from the ascend‐hf study. Eur J Heart Fail. 2012;14:1257–1264.
- , , , , , . Usefulness of an elevated troponin‐I in predicting clinical events in patients admitted with acute heart failure and acute coronary syndrome (from the RITZ‐4 trial). Am J Cardiol. 2004;93:1436–1437.
- , , , et al. Impact of serial troponin release on outcomes in patients with acute heart failure: analysis from the protect pilot study. Circulation. 2011;4:724–732.
- , , , et al. Ongoing myocardial injury in stable severe heart failure: value of cardiac troponin t monitoring for high‐risk patient identification. Circulation. 2004;110:2376–2382.
- , , , et al. Characteristics and outcomes of patients hospitalized for heart failure in the united states: rationale, design, and preliminary observations from the first 100,000 cases in the Acute Decompensated Heart Failure National Registry (ADHERE). Am Heart J. 2005;149:209–216.
- , , . Extracting summary statistics to perform meta‐analyses of the published literature for survival endpoints. Stat Med. 1998;17:2815–2834.
- , , , , . The case of the misleading funnel plot. BMJ. 2006;333:597–600.
- , , , et al. The Newcastle‐Ottawa Scale (NOS) for assessing the quality of nonrandomised studies in meta‐analyses. Available at: http://www.ohri.ca/programs/clinical_epidemiology/oxford.asp. accessed July 3, 2015.
- , , , et al. Third universal definition of myocardial infarction. J Am Coll Cardiol. 2012;60:1581–1598.
- , , , et al.; ADHERE Investigators. Cardiac troponin and outcome in acute heart failure. N Engl J Med. 2008;358:2117–2126.
- , , , et al. Rapid assay brain natriuretic peptide and troponin I in patients hospitalized with decompensated heart failure (from the Evaluation Study of Congestive Heart Failure and Pulmonary Artery Catheterization Effectiveness trial). Am J Cardiol. 2007;100:1427–1433.
- , , , et al. Functional status and co‐morbidities are associated with in‐hospital mortality among older patients with acute decompensated heart failure: a multicentre prospective cohort study. Age Ageing. 2015;44(2):225–231.
- , , , et al. Minor myocardial damage detected by troponin T is a powerful predictor of long‐term prognosis in patients with acute decompensated heart failure. Int J Cardiol. 2005;99:253–261.
- , , , et al. Cardiac troponin T levels are associated with poor short‐ and long‐term prognosis in patients with acute cardiogenic pulmonary edema. Am Heart J. 2002;143:814–820.
- , , , et al. Clinical characteristics and predictors of in‐hospital mortality in acute heart failure with preserved left ventricular ejection fraction. Am J Cardiol. 2011;107:79–84.
- , , , et al. Risk stratification using a combination of cardiac troponin t and brain natriuretic peptide in patients hospitalized for worsening chronic heart failure. Am J Cardiol. 2002;89:691–695.
- , , , , et al. Persistently increased serum concentrations of cardiac troponin in patients with acutely decompensated heart failure are predictive of adverse outcomes. Circ J. 2007;71:1047–1051.
- , , , et al. Cardiac troponin I as diagnostic and prognostic marker in severe heart failure. J Heart Lung Transplant. 2000;19:644–652.
- , , , et al. The role of plasma biomarkers in acute heart failure. Serial changes and independent prognostic value of NT‐proBNP and cardiac troponin‐T. Eur J Heart Fail. 2007;9:776–786.
- , , , et al. Prognostic value of high sensitivity troponin T in patients with acutely decompensated heart failure and non‐detectable conventional troponin T levels. Int J Cardiol. 2013;168:3609–3612.
- , , , et al. Minor myocardial damage is a prevalent condition in patients with acute heart failure syndromes and preserved systolic function with long‐term prognostic implications: CIAST‐HF (Collaborative Italo‐Argentinean Study on cardiac Troponin T in Heart Failure) study. J Card Fail. 2012;18:822–830.
- , , , et al. Acute heart failure: clinical presentation, one‐year mortality and prognostic factors. Eur J Heart Fail. 2005;7:662–670.
- , , , et al. High‐sensitive troponin I after acute cardiac decompensation‐distribution of baseline values and prognostic significance. Paper presented at: Heart Failure Congress 2013; May 25–28, 2013; Lisbon, Portugal.
- , , , . Serial changes in high‐sensitive troponin I predict outcome in patients with decompensated heart failure. Eur J Heart Fail. 2011;13:37–42.
- , , , et al. Multimarker strategy for the prediction of 31 days cardiac death in patients with acutely decompensated chronic heart failure. Int J Cardiol. 2010;141:284–290.
- , , , , , . Cardiac troponin t for risk stratification in decompensated chronic heart failure. [in Portuguese]. Arq Bras Cardiol. 2009;92(5):404–412.
- , , , et al. Troponin T in acute heart failure: clinical implications and prognosis in the Spanish National Registry on Heart Failure. Eur J Intern Med. 2014;25:739–744.
- , , , et al. Complementary prognostic value of cystatin C, N‐terminal pro‐B‐type natriuretic Peptide and cardiac troponin T in patients with acute heart failure. Am J Cardiol. 2009;103:1753–1759.
- , , . Single cardiac troponin t measurement predicts risk for adverse outcome in decompensated heart failure. Arq Bras Cardiol. 2010;94(4):495–501.
- , , , , . Relation between cardiac troponin i and mortality in acute decompensated heart failure. Am Heart J. 2007;153:462–470.
- , , , et al. High‐sensitivity cardiac troponin t predicts non‐cardiac mortality in heart failure. Circ J. 2014;78:890–895.
- , , , et al. Highly sensitive troponin t for risk stratification of acutely destabilized heart failure. Am Heart J. 2012;163(6):1002–1010.
- , , , et al. How to read a systematic review and meta‐analysis and apply the results to patient care: Users' guides to the medical literature. JAMA. 2014;312:171–179.
- , , , et al. Serial biomarker measurements in ambulatory patients with chronic heart failure: the importance of change over time. Circulation. 2007;116:249–257.
- , , , et al. Prognostic value of very low plasma concentrations of troponin T in patients with stable chronic heart failure. Circulation. 2007;116:1242–1249.
- , , , et al. Episodes of acute heart failure syndrome are associated with increased levels of troponin and extracellular matrix markers. Circ Heart Fail. 2010;3:44–50.
- , , , et al. Cardiac microinjury measured by troponin T predicts collagen metabolism in adults aged >=65 years with heart failure. Circ Heart Fail. 2012;5:406–413.
- . Pathobiology of troponin elevations: so elevations occur with myocardial ischemia as well as necrosis? J Am Coll Cardiol. 2011;57:2406–2408.
- , , . Prognostic value of cardiac troponin in chronic stable heart failure: a systematic review. Heart. 2012;98:1778–1786.
- , , , et al. Vascular endothelial dysfunction and mortality risk in patients with chronic heart failure. Circulation. 2005;111:310–314.
- , , , , . Preload induces troponin I degradation independently of myocardial ischemia. Circulation. 2001;103:2035–2037.
- , , ,et al. Prevalence and determinants of troponin T elevation in the general population. Circulation. 2006;113:1958–1965.
- , , , et al. Cardiac troponin‐I and risk of heart failure: a community‐based cohort study. Eur Heart J. 2009;30:773–781.
- , , , et al. Age‐ and sex‐dependent upper reference limits for the high‐sensitivity cardiac troponin t assay. J Am Coll Cardiol. 2014;63:1441–1448.
- , , , et al. Defining high‐sensitivity cardiac troponin concentrations in the community. Clin Chem. 2013;59:1099–1107.
- , , , et al. Association of serial measures of cardiac troponin T using a sensitive assay with incident heart failure and cardiovascular mortality in older adults. JAMA. 2010;304:2494–2502.
- , , , et al. Sensitive cardiac troponin in the diagnosis and risk stratification of acute heart failure. J Intern Med. 2012;271:598–607.
- , , , et al. Outcomes and care of patients with acute heart failure syndromes and cardiac troponin elevation. Circulation. 2013;6:193–202.
- , , , et al.; ADHERE Scientific Advisory Committee and Investigators. Usefulness of B‐type natriuretic peptide and cardiac troponin levels to predict in‐hospital mortality from ADHERE. Am J Cardiol. 2008;101:231–237.
Acute decompensated heart failure (ADHF) accounts for over a million hospitalizations per year, with a reported all‐cause mortality rate 11.7% and all‐cause readmission rate 22.5% at 30 days after initial hospitalization.[1]
Risk stratification for accurate identification of ADHF patients at high risk for readmission and mortality may enable clinicians to undertake timely interventions: triage to appropriate level of care and resource allocation for postdischarge care. Further risk stratification may allow the care team to plan and implement a personalized care plan. Several clinical and laboratory variables have been proposed for identification of patients with ADHF who are at increased risk for adverse clinical outcomes. Despite advances in the risk stratification of patients with ADHF, the accurate prediction of individuals at high risk for readmissions and mortality is challenging. Cardiac troponin T (cTnT) and I (cTnI) are highly sensitive and specific biomarkers that are widely used for the risk stratification of patients with acute myocardial infarction and stable heart failure.[2]
In this systematic review and meta‐analysis, we evaluate circulating cardiac troponin in determining risk for increased length of stay (LOS), hospital readmission, and mortality among patients admitted with ADHF.
METHODS
Data Sources and Searches
This systematic review and meta‐analysis was conducted in accordance with the established methods[3] and Preferred Reporting Items for Systematic Review and Meta‐Analysis (PRISMA) guidelines.[4] Risk of bias was evaluated using the Newcastle‐Ottawa Scale for cohort studies.[5] We performed a comprehensive search of several databases from each database's earliest inception to March 2015 without language restrictions. The databases included MEDLINE In‐Process & Other Non‐Indexed Citations, MEDLINE, Embase, Cochrane Central Register of Controlled Trials, Cochrane Database of Systematic Reviews, and Scopus. We conducted a manual search for bibliography of pertinent reviews for relevant citations that our electronic searches might have missed. The actual strategy is available from the corresponding author.
Study Selection
Eligibility criteria included: (1) randomized or nonrandomized clinical trials involving adults hospitalized with ADHF, (2) comparator groups stratified by cardiac troponin (cTn) level as defined by individual study investigators, and (3) studies reporting 1 or more of the following clinical outcomes: (1) in‐hospital mortality, (2) hospital LOS, (3) major adverse events during hospitalization (defined as persistent dyspnea,[6] worsening of heart failure,[6, 7, 8, 9] worsening of renal function [creatinine 0.3 mg/dL],[8] or recurrent myocardial ischemia[9] after hospitalization for ADHF), (4) postdischarge readmission, (5) postdischarge mortality rate, and (6) the composite of readmission and mortality. We excluded studies incorporating patients with (1) stable heart failure, (2) acute myocarditis, (3) chemotherapy‐induced cardiomyopathy, (4) postsurgical heart failure, (5) transplanted heart, (6) left ventricular assist device, and (7) hemodialysis.
We incorporated the description of ADHF from national registry for defining ADHF.[10] The lower limit of detection of cTn level in healthy subjects is assay dependent, each with a different cutoff value. To improve uniformity of expression in the present meta‐analysis, we arbitrarily stratified groups by the level of cTn: (1) undetected cTn (cTnT 0.01; cTnI 0.012 g/L), (2) detectable cTn (cTnT 0.010.03; cTnI 0.0120.03 g/L), and (3) elevated cTn (cTnT >0.03; cTnI >0.034 g/L).
Data Extraction and Risk of Bias Assessment
From the results of the initial search, 2 investigators (M.Y. and A.D.A), working independently, reviewed articles for eligibility on the basis of titles and abstracts. Studies that satisfied the inclusion and exclusion criteria were retrieved for full‐text review. Disagreements were resolved by consensus after discussion among investigators, and retained conflicts were adjudicated by a third investigator.
We extracted the following data from each study: type of study, number of participants, age, gender, type of cTn assayed and cut point, comorbidities, length of follow‐up, and outcome measure. Prevalence of detectable or elevated cTn, measure of association with clinical outcomes (hazard ratio [HR], odds ratio [OR], or relative risk) were also abstracted. When HR or OR were not reported for an outcome, based on other provided data, we estimated HR using previously validated methods.[11]
Data Synthesis and Analysis
Studies were stratified by cTn cutoff point and length of follow‐up. To reduce heterogeneity, studies reporting clinical outcomes at multiple time periods after the index hospitalization were grouped in three categories: (1) studies with short‐term follow up (06 months), (2) studies with intermediate‐term follow‐up (up to 1 year), and (3) studies with long‐term follow‐up (up to 3.5 years). We used the DerSimonian and Laird random effects model to combine OR or HR reported by individual studies. The consistency of the results of the studies was assessed by I2 statistics, with values >40% considered as indicators of heterogeneity. We evaluated statistically for publication bias if a sufficient number of studies was available, because such evaluation is unreliable when20 studies are included in a particular analysis.[12]
Sensitivity analyses were performed to investigate the robustness of results to a few assumptions. Analyses were repeated excluding studies reporting unadjusted relative effect measures to assess whether confounding had a large effect on overall results. Similarly, analysis was repeated omitting studies reporting detectable cTn as opposed to elevated cTn level to assess whether these studies influence overall results. All statistical analyses were conducted using Stata 14.0 (StataCorp, College Station, TX).
Quality and Risk of Bias Assessment
The Newcastle‐Ottawa scale was used to assess the quality and risk of bias in cohort studies as suggested by the Cochrane Collaboration.[13] For the assessment of risk of bias, a study was awarded a maximum of 1 star for each of the 7 items from 2 domains: (1) selection of cohort (representativeness of the exposed cohort, selection of the nonexposed cohort, ascertainment of exposure, and demonstration that the outcome of interest was not present at the start of the study) and (2) outcome (assessment of outcome, was the follow‐up long enough, adequacy of the follow‐up of the cohort), and a maximum of 2 stars for comparability of the cohort (comparability on the basis of design and analysis) (Table 1).
| Source | Year | Selection | Compatibility | Outcome | Quality | ||||||
|---|---|---|---|---|---|---|---|---|---|---|---|
| S1 | S2 | S3 | S4 | C1 | C2 | O1 | O2 | O3 | |||
| |||||||||||
| Del Carlo et al.[31] | 2009 | * | * | * | * | * | 5 | ||||
| Felker et al.[6] | 2012 | * | * | * | * | * | 5 | ||||
| Gattis et al.[7] | 2004 | * | * | * | * | * | * | * | 7 | ||
| Guisado Espartero et al.[32] | 2014 | * | * | * | * | * | * | 6 | |||
| Ishii et al.[21] | 2002 | * | * | * | * | * | 5 | ||||
| Kuwabara et al.[22] | 2007 | * | * | * | * | * | 5 | ||||
| La Vecchia et al.[23] | 2000 | * | * | * | * | * | * | * | 7 | ||
| La Corvoisie et al.[17] | 2014 | * | * | * | * | * | * | * | 7 | ||
| Manzano‐Fernandez et al.[33] | 2009 | * | * | * | * | * | 5 | ||||
| Metra et al.[24] | 2007 | * | * | * | * | * | 5 | ||||
| Nakamura et al.[36] | 2014 | * | * | * | * | * | * | * | * | 8 | |
| O'Connor et al.[8] | 2011 | * | * | * | * | * | * | * | * | 8 | |
| Oliveira et al.[34] | 2010 | * | * | * | * | * | * | * | * | 8 | |
| Parissis et al.[20] | 2011 | * | * | * | * | * | * | * | 7 | ||
| Parissis et al.[25] | 2013 | * | * | * | * | * | * | * | * | 8 | |
| Pascual‐Figal et al.[37] | 2012 | * | * | * | * | * | * | 6 | |||
| Peacock et al.[15] | 2008 | * | * | * | * | * | * | * | * | * | 9 |
| Perna et al.[18] | 2005 | * | * | * | * | * | * | * | 7 | ||
| Perna et al.[19] | 2002 | * | * | * | * | * | * | 6 | |||
| Perna et al.[26] | 2012 | * | * | * | * | * | * | 6 | |||
| Rudiger et al.[27] | 2005 | * | * | * | * | * | * | 6 | |||
| Shah et al.[16] | 2007 | * | * | * | * | 4 | |||||
| Wallenborn et al.[28] | 2013 | * | * | * | * | * | * | * | 7 | ||
| Xue et al.[29] | 2011 | * | * | * | * | * | * | * | 7 | ||
| You et al.[35] | 2007 | * | * | * | * | * | * | * | * | * | 9 |
| Zairis et al.[30] | 2010 | * | * | * | * | * | * | * | 7 | ||
RESULTS
Search Results
Figure 1 represents the PRISMA flow diagram for literature search and selection process to identify eligible studies for inclusion.
Characteristics of Included Studies
We identified 26 studies, which were all observational cohorts with postdischarge median follow‐up from 30 days to 472 days. Table 2 summarizes the study characteristics. Studies were heterogeneous with regard to prevalence of elevated cTn, cTn assay, and length of follow‐up. Thirteen were single‐center and 5 were multicenter studies, 4 were substudies of large multicenter phase III clinical trials, and 4 were registries. Except for one abstracts, all studies were peer‐reviewed publications. Sample size ranged from 34 to 69,259 patients.
| Source | Year | Design | Patient Population | CAD | HF Type | LVEF, Mean % | Clinical Outcomes | |||
|---|---|---|---|---|---|---|---|---|---|---|
| No. of Patients | Age, y | Men, % | Follow‐up | Endpoints | ||||||
| ||||||||||
| Del Carlo et al.[31] | 2009 | Single | 70 | 54 16 | 69 | 26 | HFrEF | 31 8 | 262 (3393) days | Readmission, mortality |
| Felker et al.[6] | 2012 | Substudy | 808 | 67 | 70 | 61 | Both | 25 | Hosp, 30 days, 6 months | MAE, LOS, readmission, mortality |
| Gattis et al.[7] | 2004 | Substudy | 133 | NR | NR | NR | NR | NR | Hosp | MAE, mortality |
| Guisado Espartero et al.[32] | 2014 | Registry | 406 | 77 (7678) | 42 | 25 | Both | 50 (4456) | 1 year | Readmission, mortality |
| Ishii et al.[21] | 2002 | Single | 98 | 69 9 | 52 | 45 | NR | 42 17 | Hosp, 60 days, >1 year | Readmission, mortality |
| Kuwabara et al.[22] | 2007 | Single | 52 | 72 12 | 59 | 27 | NR | 47 16 | 143 (13540) days | Readmission, mortality |
| La Vecchia et al.[23] | 2000 | Single | 34 | 60 (2885) | 79 | 38 | HFrEF | NR | 90 days | Mortality |
| La Corvoisie et al.[17] | 2014 | Multicenter | 397 | NR | NR | NR | NR | Hosp | Mortality | |
| Manzano‐Fernandez et al.[33] | 2009 | Single | 138 | 74 (67801) | 54 | 35 | NR | NR | 261 (161449) days | Readmission, mortality |
| Metra et al.[24] | 2007 | Single | 116 | NR | NR | NR | NR | NR | 184 (7444) days | Readmission, mortality |
| Nakamura et al.[36] | 2014 | Single | 444 | NR | 63 | 15 | NR | NR | 472 (2001,200) days | Mortality |
| O'Connor et al.[8] | 2011 | Substudy | 288 | 73 (6577) | 59 | 74 | NR | NR | Hosp, 60 days | MAE, readmission, mortality |
| Oliveira et al.[34] | 2010 | Multicenter | 79 | NR | 61 | 18 | HFrEF | 27 | 8 months | MAE, readmission, mortality |
| Parissis et al.[20] | 2011 | Multicenter | 837 | NR | 48 | 20 | HFpEF | NR | Hosp | Mortality |
| Parissis et al.[25] | 2013 | Single | 113 | 73 11 | 68 | 46 | NR | 36 11 | 174 (94728) days | Mortality |
| Pascual‐Figal et al.[37] | 2012 | Single | 202 | 74 (6780) | 55 | 34 | Both | 49 (3260) | 406 (204728) days | Mortality |
| Peacock et al.[15] | 2008 | Registry | 69,259 | 74 14 | 45 | 56 | Both | 34 | Hosp | LOS, mortality |
| Perna et al.[18] | 2005 | Single | 184 | 64 13 | 60 | 38 | Both | NR | Hosp, 3 years | Readmission, mortality |
| Perna et al.[19] | 2002 | Single | 84 | 65 14 | 62 | 55 | NR | NR | Hosp, 1 year | Readmission, mortality |
| Perna et al.[26] | 2012 | Single | 500 | 73 12 | 53 | 38 | HFpEF | 53 11 | 6 months | Readmission, mortality |
| Rudiger et al.[27] | 2005 | Multicenter | 312 | 73 12 | 56 | 70 | Both | NR | 30 days, 1 year | Mortality |
| Shah et al.[16] | 2007 | Substudy | 141 | NR | NR | NR | HFrEF | NR | Hosp, 6 months | LOS, readmission, mortality |
| Wallenborn et al.[28] | 2013 | Registry | 879 | 69 12 | 72 | 50 | NR | 30 8 | 06 months, 618 months | Mortality |
| Xue et al.[29] | 2011 | Single | 144 | 68 13 | 98 | 62 | Both | 43 18 | 90 days | Readmission, mortality |
| You et al.[35] | 2007 | Registry | 2,025 | 76 11 | 50 | 55 | Both | NR | 1 year | Mortality |
| Zairis et al.[30] | 2010 | Multicenter | 577 | 74 8 | 68 | 77 | HFrEF | 23 5 | 31 days | Mortality |
Table 3 stratifies the characteristics of study populations by cTn status. The studies included 77,297 participants hospitalized for ADHF, of whom 7176 (9.3%) had detectable or elevated cTn level. Twenty‐five studies reported data on type of cTn measured (cTnI, cTnT, or both) and reported cutoff values for detectable or elevated cTn (Table 3). The percentages of patients who had detectable or elevated cTn varied widely across the studies (6.2%68%). Most studies utilized standard assays, and the cutoff point for cTn level was chosen arbitrary by study investigators or derived from receiver operating characteristic curve analysis. cTn level is assay dependent. For instance, the 99th centile upper reference limit (URL) is 0.014 ng/mL for cTnT with the Roche high‐sensitivity cTnT assay, and 0.04 ng/mL with the Siemens cTnI‐ultra assay. Few studies of the present meta‐analysis incorporated a cTn cutoff point that defined acute myocardial infarction.[14] Nine studies used a lower threshold cTn level (cTnT >0.01>0.03; cTnI >0.03) for stratification into comparator groups.
| Source | Year | No. of Patients | No. cTn+ (%) | cTn Cutoff | Age | Male | Atrial Fibrillation | CAD | ||
|---|---|---|---|---|---|---|---|---|---|---|
| Tn+ | Tn | Tn+ (%) | No. (%) | Tn+ (%) | Tn+ (%) | |||||
| ||||||||||
| Del Carlo et al.[31] | 2009 | 70 | 12 (17) | cTnT 0.10 | NR | NR | NR | 13 (19) | NR | NR |
| Felker et al.[6] | 2012 | 808 | 404 (50) | cTnT 0.034 | 69 | 65 | 364 (54) | 334 (41) | 170 (42) | 243 (60) |
| Gattis et al.[7] | 2004 | 133 | 91 (68) | cTnT 1.0 | 70 (6180) | 77 (6282) | 46 (50) | NR | NR | NR |
| Guisado Espartero et al.[32] | 2014 | 406 | 241 (60) | cTnT 0.02 | NR | NR | 116 (48) | 236 (58) | 136 (56) | 74 (31) |
| Ishii et al.[21] | 2002 | 98 | NR | cTnT 0.1 | NR | NR | NR | NR | NR | NR |
| Kuwabara et al.[22] | 2007 | 52 | 31 (60) | NR | NR | NR | 31 (59) | 23 (44) | NR | NR |
| La Vecchia et al.[23] | 2000 | 34 | 10 (29) | cTnI 0.4 | 56 13 | 62 12 | 100 | 19 (56) | 5 (50) | 3 (30) |
| La Corvoisie et al.[17] | 2014 | 397 | NR | cTnI0.15 | NR | NR | NR | NR | NR | NR |
| Manzano‐Fernandez et al.[33] | 2009 | 138 | NR | cTnT 0.011 | NR | NR | NR | NR | NR | NR |
| Metra et al.[24] | 2007 | 116 | 41 (38) | cTnT 0.01 | NR | NR | NR | NR | NR | 33 (61) |
| Nakamura et al.[36] | 2014 | 444 | 224 (51) | cTnT 0.028 | 67 14 | 66 14 | 133 (60) | 160 (36) | 72 (32) | 35 (16) |
| O'Connor et al.[8] | 2011 | 288 | 97 (34) | cTnT 0.03 | 71 | 72 | 67 (69) | NR | NR | NR |
| Oliveira et al.[34] | 2010 | 79 | 37 (47) | ctnT 0.02 | 57 18 | 54 17 | 26 (70) | NR | NR | 6 (16) |
| Parissis et al.[20] | 2011 | 837 | 184 (22) | cTnT >0.01 | NR | NR | NR | NR | NR | NR |
| Parissis et al.[25] | 2013 | 113 | 37 (33) | cTnT 0.077 | 74 8 | 72 12 | 22 (59) | 36 (32) | 12 (32) | 18 (49) |
| Pascual‐Figal et al.[37] | 2012 | 202 | NR | cTnT >0.02 | NR | NR | NR | 109 (54) | NR | NR |
| Peacock et al.[15] | 2008 | 69,259 | 4,240 (6.2) | cTnI 1.0; cTnT 0.1 | 73 14 | 73 14 | 2,035 (48) | 207 (30) | 975 (23) | 2,586 (58) |
| Perna et al.[18] | 2005 | 184 | 58 (31) | cTnT 0.1 | 64 13 | 65 13 | 37 (64) | NR | NR | 30 (52) |
| Perna et al.[19] | 2002 | 84 | 46 (55) | cTnT 0.1 | 68 11 | 61 16 | 27 (59) | NR | NR | 33 (72) |
| Perna et al.[26] | 2012 | 500 | 220 (44) | cTnT 0.02 | 74 10 | 72 14 | 125 (59) | 177 (35) | 70 (32) | 110 (50) |
| Rudiger et al.[27] | 2005 | 312 | 88 (28) | cTnT 0.1 | NR | NR | NR | NR | NR | NR |
| Shah et al.[16] | 2007 | 141 | NR | cTnI per 0.1 | NR | NR | NR | NR | NR | NR |
| Wallenborn et al.[28] | 2013 | 879 | 332 (37) | cTnT 0.06 | NR | NR | NR | NR | NR | NR (50) |
| Xue et al.[29] | 2011 | 144 | NR | cTnI 0.023 | NR | NR | NR | NR | NR | NR |
| You et al.[35] | 2007 | 2,025 | 669 (34) | cTnI >0.5 | 77 11 | 75 11 | 364 (53) | NR | NR | 417 (60) |
| Zairis et al.[30] | 2010 | 577 | 114 (20) | cTnI 0.42 | NR | NR | NR | 295 (51) | NR | 443 (77) |
Twenty‐five studies reported performance of cTn as a dichotomized variable. A few studies, additionally, examined clinical outcome in patients grouped by tertiles by cTn and determined the dose‐response relationship using cTn as a continuous variable. The measure of association between cTn and clinical outcome was reported as HR or OR by 16 studies. The remaining 6 studies reported the number of clinical events in the groups by cTn level and therefore provided unadjusted estimates. The results of all meta‐analyses are depicted in Figure 2.
In‐hospital Clinical Outcomes
Three studies examined the association between cTn level and LOS.[6, 15, 16] One study (n = 808) found increased LOS among patients with elevated cTn.[6] Another study (n = 141), which tested the cTn level as a continuous variable, reported no statistically significant association between cTn level and LOS.[16] A large, multicenter ADHF registry (Acute Decompensated Heart Failure National Registry), which reported elevated cTn as a predictor of LOS (mean stay 6.6 vs 5.5 days; P 0.001) but did not provide binary data (OR, confidence interval [CI]), was therefore excluded from the meta‐analysis.[15] The pooled HRs from 2 studies revealed a significant increase in LOS in the cohort with elevated cTn (OR: 1.05, 95% CI: 1.01‐1.10, P = 0.06, I2 = 59.5.0%, n = 949). Six studies assessed in‐hospital mortality,[15, 17, 18, 19, 20, 21] and the meta‐analysis showed a significant increase in the risk of death with no significant heterogeneity (OR: 2.57, 95% CI: 2.27‐2.91, P = 0.744, I2 = 0.0%, n = 69,524). Similarly, 4 clinical studies[6, 7, 8, 9] found detectable or elevated cTn as a predictor of worsened composite clinical outcomes of death and major cardiovascular events (OR: 1.33, 95% CI: 1.03‐1.71, P = 0.473, I2 = 0.0%, n = 1,313).
Short‐term (0 to 6 Months) Clinical Outcomes
Short‐term clinical outcome was assessed in 13 studies.[6, 8, 16, 21, 22, 23, 24, 25, 26, 27, 28, 29, 30] Nine studies addressed mortality,[6, 16, 23, 24, 25, 26, 27, 28, 30] 2 studies readmission,[16, 26] and 7 studies a composite of readmission and mortality during 6 months postdischarge.[6, 8, 21, 22, 24, 26, 29] The meta‐analysis showed increased mortality without significant heterogeneity (OR: 2.11, 95% CI: 1.43‐3.12, P = 0.000, I2 8.5%, 9 studies, n = 3471) and an increase in the composite of readmission and mortality with significant heterogeneity (OR: 2.81, 95%CI: 1.60‐4.92, P = 0.000, I2 89.1%, 7 studies, n = 2028) among ADHF patients with detectable or elevated cTn. The association between cTn level and readmission rate over 6 months post‐discharge did not reach statistical significance (OR: 1.00, 95% CI: 0.37‐2.74, P = 0.034, I2 77.9%, 2 studies, n = 641).
Intermediate‐term (Up to 12 Months) Clinical Outcomes
Intermediate‐term (during the 12 months postdischarge) clinical outcome was assessed in seven studies.[18, 24, 31, 32, 33, 34, 35] Five studies reported an association between cTn level and mortality.[18, 24, 32, 34, 35] The meta‐analysis demonstrated an increase in mortality with significant heterogeneity (OR: 2.21, 95% CI: 1.46‐3.35, P = 0.048, I2 58.4%, 5 studies, n = 2801). The pooled HRs of 2 studies examining the association between cTn and readmission rate[18, 32] did not yield statistical significance (OR: 1.55, 95% CI: 0.96‐2.52, P = 0.233, I2 29.6%, 2 studies, n = 590). A meta‐analysis of 5 studies that assessed an association between cTn and outcome[18, 24, 31, 32, 33] showed a significant increase in the risk of composite of readmission and mortality without significant heterogeneity (OR: 2.30, 95% CI: 1.78‐2.99, P = 0.666, I2 0.0%, 5 studies, n = 905) among patients with a detectable or elevated cTn.
Long‐term (>1 Year) Clinical Outcomes
Long‐term clinical outcome was assessed in 7 studies.[18, 19, 21, 24, 28, 36, 37] The meta‐analysis of 6 studies[18, 19, 21, 28, 36, 37] demonstrated an increase in mortality without significant heterogeneity (OR: 3.69, 95% CI: 2.64‐5.18, P = 0.696, I2 0.0%, 6 studies, n = 1891) among ADHF patients with a detectable or elevated cTn. Likewise, a composite of readmission rate and mortality was also increased (OR: 3.49, 95% CI: 2.08‐5.84, P = 0.070, I2 57.5%, 4 studies, n = 448) in a meta‐analysis of 4 studies.[18, 21, 24, 37] The meta‐analysis of 4 studies[18, 19, 24, 37] that assessed the association between cTn level and readmission rate over long‐term follow‐up showed no significant association (OR: 2.60, 95% CI: 0.80‐8.44, P = 0.000, I2 99.9 %, 4 studies, n = 576).
Confidence in the Estimates
Following the Grading of Recommendations Assessment, Development, and Evaluation approach to evaluate the confidence in the estimates from a systematic review and meta‐analysis[38] (ie, certainty or strength of evidence), we found that the association of a detectable or elevated troponin with mortality and readmission is moderate. This is due to a large effect (ie, relative association measure >2.0) demonstrated in observational studies. The confidence in the estimate of association with hospital LOS is low (smaller magnitude of effect). Analyses of in‐hospital outcomes were not associated with statistical heterogeneity, whereas several posthospital analyses had statistically significant heterogeneity.
DISCUSSION
We conducted a systematic review and meta‐analysis of published studies to assess the association between level of cTn and clinical outcomes including LOS, in‐hospital mortality, and short‐, intermediate‐, and long‐term readmission and death following index hospitalization for ADHF. The results of our meta‐analysis showed that compared with negative or not‐elevated cTn, detectable or elevated cTn was associated with increased LOS and higher rates of in‐hospital death among patients with ADHF. In addition, mortality and composite of mortality and readmission at short‐, intermediate‐ or long‐term after index hospitalization were greater in ADHF patients with a detectable or elevated cTn, as compared with those without elevated cTn, with significant heterogeneity across the studies. Finally, relatively fewer studies examined the association between cTn and readmission rate at multiple time periods after index hospitalization for ADHF, and these associations did not reach statistical significance.
In a review of 67,924 patients with ADHF from the US National Registry, which was limited in assessing inpatient mortality, Peacock et al. reported that a positive cardiac troponin test was associated with higher in‐hospital mortality, independently of other predictive variables.[15] We confirmed this observation in the present meta‐analysis, which also incorporated the study by Peacock et al. Furthermore, our data extended the findings of Peacock et al. to postdischarge readmission and death. The association between cTn and clinical outcomes was adjusted to multiple confounders across most studies included in the present meta‐analysis. Few studies in the present meta‐analysis showed a continuous and graded relationship between cTn level and clinical outcomes in patients with ADHF.[15, 35] Findings of previous studies showed that ADHF patients with persistently elevated cTn, measured at multiple time points during or following hospitalization, had worse clinical outcomes than did patients without similar elevation in cTn.[24, 29] Conversely, a decline in cTnT levels on serial measurements was associated with lower rates of adverse clinical outcomes, potentially through alleviation in ongoing myocardial injury.[39] Additionally, elevated cTn in ambulatory heart failure patients predicted incident hospitalization for acute decompensation.[40] Acute myocardial injury reflected by elevated cTn can be hypothesized to promote ventricular remodeling and thereby heart failure progression and consequent adverse clinical outcomes. Consistent with this hypothesis, a rise in cTn was observed in conjunction with elevated biological markers that characterize extracellular matrix remodeling in patients with heart failure during the acute and postacute phase.[41, 42]cTn is released in blood in direct proportion to myocardial injury.[43] A rise or fall in cTn with 1 value at or above the 99th centile URL in conjunction with clinical evidence of myocardial injury defines acute myocardial infarction.[14] Although patients with chronic stable heart failure often have chronically elevated cTn, those with ADHF may demonstrate an acute rise in cTn, with values reaching above the 99th percentile of URL in the absence of acute myocardial infarction.[15, 44] The pathophysiology of elevated cTn in ADHF is probably multifactorial.[14, 45, 46] The prevalence of elevated cTn in ADHF varied with assay sensitivity and the cutoff point chosen. For instance, in an analysis of >105,000 patients with ADHF, the prevalence of elevated cTn was increased from 6.2% with higher (cTnI >1.0 ng/mL or cTnT >0.1 ng/mL) to 75% with a lower cutoff point for cTn levels (cTnI >0.4 ng/mL and cTnT >0.01 ng/mL).[15]
In the general population with no established coronary artery disease, the prevalence of elevated cTn is contingent on sensitivity of the assay, age, and gender.[47, 48, 49, 50] Elevated cTn, beyond conventional risk factors, identifies a subgroup of individuals from the general population who are at high risk for incident heart failure and death.[51] Furthermore, elevated cTn is an independent predictor of short‐ and long‐term cardiovascular events in patients presenting to an emergency department (ED) for ADHF.[52, 53] In 2 large Canadian registries, an elevated cTn was associated with increased risk of death and cardiovascular readmissions at 30 days after ED visit.[53]
A number of recent studies have identified numerous other biomarkers as independent prognostic indicators in patients with heart failure. cTn, when combined with other biomarkers reflecting different dimensions of heart failure pathophysiology such as brain natriuretic peptide (BNP)/N‐terminal pro‐brain natriuretic peptide, soluble ST2, or cystatin C, enhanced the model's predictive utility beyond individual markers. For instance, patients with elevated cTn who also have increased BNP (840 pg/mL) had in‐hospital mortality of 10.2%, which was significantly greater than the 4.4% in patients with elevated BNP without detectable cTn.[54] Additionally, elevated cTn along with elevated pro‐brain natriuretic peptide and cystatin C has been reported to offer incremental prognostic information in patient with ADHF.[33]
The present systematic review and meta‐analysis is the most comprehensive to date and incorporated many observational cohorts with heterogeneous and unselected patient population. The studies have used various commercially available assays for the measurement of cTnT and cTnI. Therefore, findings of this meta‐analysis are applicable to a wider heart failure patient population. This review has several limitations. The association of elevated cTn and clinical outcome is likely affected by several confounders. Although we used adjusted estimates when possible, we did not have individual participant data. Due to the small number of included studies in each analysis, we could not explore heterogeneity causes using subgroup analysis or metaregression. For the same reasons, we could not statistically evaluate publication bias, which is likely in the setting of observational studies. The meta‐analysis is mainly driven by a few large studies.
In summary, in a broad spectrum of patients with ADHF, a detectable or elevated cTn is an independent predictor of major adverse clinical events not only during acute‐phase hospitalization but also after stabilization during the postdischarge phase. cTn is a widely available and inexpensive biomarker that provides important prognostic information and is likely to have important implications for in‐patient care and postdischarge surveillance of patients hospitalized for ADHF.
Disclosures
The authors certify that they have no affiliations with or involvement in any organization or entity with any financial interest (such as honoraria; educational grants; participation in speakers' bureaus; membership, employment, consultancies, stock ownership, or other equity interest; and expert testimony or patent‐licensing arrangements), or nonfinancial interest (such as personal or professional relationships, affiliations, knowledge, or beliefs) in the subject matter or materials discussed in this article.
- Centers for Medicare 98:1778–1786.
- , , , et al. Meta‐analysis of observational studies in epidemiology: A proposal for reporting. Meta‐analysis of observational studies in epidemiology (moose) group. JAMA. 2000;283:2008–2012.
- , , , et al. The PRISMA statement for reporting systematic reviews and meta‐analyses of studies that evaluate healthcare interventions: explanation and elaboration. BMJ. 2009;339:b2700.
- . Critical evaluation of the Newcastle‐Ottawa Scale for the assessment of the quality of nonrandomized studies in meta‐analyses. Eur J Epidemiol. 2010;25:603–605.
- , , , et al. Troponin I in acute decompensated heart failure: Insights from the ascend‐hf study. Eur J Heart Fail. 2012;14:1257–1264.
- , , , , , . Usefulness of an elevated troponin‐I in predicting clinical events in patients admitted with acute heart failure and acute coronary syndrome (from the RITZ‐4 trial). Am J Cardiol. 2004;93:1436–1437.
- , , , et al. Impact of serial troponin release on outcomes in patients with acute heart failure: analysis from the protect pilot study. Circulation. 2011;4:724–732.
- , , , et al. Ongoing myocardial injury in stable severe heart failure: value of cardiac troponin t monitoring for high‐risk patient identification. Circulation. 2004;110:2376–2382.
- , , , et al. Characteristics and outcomes of patients hospitalized for heart failure in the united states: rationale, design, and preliminary observations from the first 100,000 cases in the Acute Decompensated Heart Failure National Registry (ADHERE). Am Heart J. 2005;149:209–216.
- , , . Extracting summary statistics to perform meta‐analyses of the published literature for survival endpoints. Stat Med. 1998;17:2815–2834.
- , , , , . The case of the misleading funnel plot. BMJ. 2006;333:597–600.
- , , , et al. The Newcastle‐Ottawa Scale (NOS) for assessing the quality of nonrandomised studies in meta‐analyses. Available at: http://www.ohri.ca/programs/clinical_epidemiology/oxford.asp. accessed July 3, 2015.
- , , , et al. Third universal definition of myocardial infarction. J Am Coll Cardiol. 2012;60:1581–1598.
- , , , et al.; ADHERE Investigators. Cardiac troponin and outcome in acute heart failure. N Engl J Med. 2008;358:2117–2126.
- , , , et al. Rapid assay brain natriuretic peptide and troponin I in patients hospitalized with decompensated heart failure (from the Evaluation Study of Congestive Heart Failure and Pulmonary Artery Catheterization Effectiveness trial). Am J Cardiol. 2007;100:1427–1433.
- , , , et al. Functional status and co‐morbidities are associated with in‐hospital mortality among older patients with acute decompensated heart failure: a multicentre prospective cohort study. Age Ageing. 2015;44(2):225–231.
- , , , et al. Minor myocardial damage detected by troponin T is a powerful predictor of long‐term prognosis in patients with acute decompensated heart failure. Int J Cardiol. 2005;99:253–261.
- , , , et al. Cardiac troponin T levels are associated with poor short‐ and long‐term prognosis in patients with acute cardiogenic pulmonary edema. Am Heart J. 2002;143:814–820.
- , , , et al. Clinical characteristics and predictors of in‐hospital mortality in acute heart failure with preserved left ventricular ejection fraction. Am J Cardiol. 2011;107:79–84.
- , , , et al. Risk stratification using a combination of cardiac troponin t and brain natriuretic peptide in patients hospitalized for worsening chronic heart failure. Am J Cardiol. 2002;89:691–695.
- , , , , et al. Persistently increased serum concentrations of cardiac troponin in patients with acutely decompensated heart failure are predictive of adverse outcomes. Circ J. 2007;71:1047–1051.
- , , , et al. Cardiac troponin I as diagnostic and prognostic marker in severe heart failure. J Heart Lung Transplant. 2000;19:644–652.
- , , , et al. The role of plasma biomarkers in acute heart failure. Serial changes and independent prognostic value of NT‐proBNP and cardiac troponin‐T. Eur J Heart Fail. 2007;9:776–786.
- , , , et al. Prognostic value of high sensitivity troponin T in patients with acutely decompensated heart failure and non‐detectable conventional troponin T levels. Int J Cardiol. 2013;168:3609–3612.
- , , , et al. Minor myocardial damage is a prevalent condition in patients with acute heart failure syndromes and preserved systolic function with long‐term prognostic implications: CIAST‐HF (Collaborative Italo‐Argentinean Study on cardiac Troponin T in Heart Failure) study. J Card Fail. 2012;18:822–830.
- , , , et al. Acute heart failure: clinical presentation, one‐year mortality and prognostic factors. Eur J Heart Fail. 2005;7:662–670.
- , , , et al. High‐sensitive troponin I after acute cardiac decompensation‐distribution of baseline values and prognostic significance. Paper presented at: Heart Failure Congress 2013; May 25–28, 2013; Lisbon, Portugal.
- , , , . Serial changes in high‐sensitive troponin I predict outcome in patients with decompensated heart failure. Eur J Heart Fail. 2011;13:37–42.
- , , , et al. Multimarker strategy for the prediction of 31 days cardiac death in patients with acutely decompensated chronic heart failure. Int J Cardiol. 2010;141:284–290.
- , , , , , . Cardiac troponin t for risk stratification in decompensated chronic heart failure. [in Portuguese]. Arq Bras Cardiol. 2009;92(5):404–412.
- , , , et al. Troponin T in acute heart failure: clinical implications and prognosis in the Spanish National Registry on Heart Failure. Eur J Intern Med. 2014;25:739–744.
- , , , et al. Complementary prognostic value of cystatin C, N‐terminal pro‐B‐type natriuretic Peptide and cardiac troponin T in patients with acute heart failure. Am J Cardiol. 2009;103:1753–1759.
- , , . Single cardiac troponin t measurement predicts risk for adverse outcome in decompensated heart failure. Arq Bras Cardiol. 2010;94(4):495–501.
- , , , , . Relation between cardiac troponin i and mortality in acute decompensated heart failure. Am Heart J. 2007;153:462–470.
- , , , et al. High‐sensitivity cardiac troponin t predicts non‐cardiac mortality in heart failure. Circ J. 2014;78:890–895.
- , , , et al. Highly sensitive troponin t for risk stratification of acutely destabilized heart failure. Am Heart J. 2012;163(6):1002–1010.
- , , , et al. How to read a systematic review and meta‐analysis and apply the results to patient care: Users' guides to the medical literature. JAMA. 2014;312:171–179.
- , , , et al. Serial biomarker measurements in ambulatory patients with chronic heart failure: the importance of change over time. Circulation. 2007;116:249–257.
- , , , et al. Prognostic value of very low plasma concentrations of troponin T in patients with stable chronic heart failure. Circulation. 2007;116:1242–1249.
- , , , et al. Episodes of acute heart failure syndrome are associated with increased levels of troponin and extracellular matrix markers. Circ Heart Fail. 2010;3:44–50.
- , , , et al. Cardiac microinjury measured by troponin T predicts collagen metabolism in adults aged >=65 years with heart failure. Circ Heart Fail. 2012;5:406–413.
- . Pathobiology of troponin elevations: so elevations occur with myocardial ischemia as well as necrosis? J Am Coll Cardiol. 2011;57:2406–2408.
- , , . Prognostic value of cardiac troponin in chronic stable heart failure: a systematic review. Heart. 2012;98:1778–1786.
- , , , et al. Vascular endothelial dysfunction and mortality risk in patients with chronic heart failure. Circulation. 2005;111:310–314.
- , , , , . Preload induces troponin I degradation independently of myocardial ischemia. Circulation. 2001;103:2035–2037.
- , , ,et al. Prevalence and determinants of troponin T elevation in the general population. Circulation. 2006;113:1958–1965.
- , , , et al. Cardiac troponin‐I and risk of heart failure: a community‐based cohort study. Eur Heart J. 2009;30:773–781.
- , , , et al. Age‐ and sex‐dependent upper reference limits for the high‐sensitivity cardiac troponin t assay. J Am Coll Cardiol. 2014;63:1441–1448.
- , , , et al. Defining high‐sensitivity cardiac troponin concentrations in the community. Clin Chem. 2013;59:1099–1107.
- , , , et al. Association of serial measures of cardiac troponin T using a sensitive assay with incident heart failure and cardiovascular mortality in older adults. JAMA. 2010;304:2494–2502.
- , , , et al. Sensitive cardiac troponin in the diagnosis and risk stratification of acute heart failure. J Intern Med. 2012;271:598–607.
- , , , et al. Outcomes and care of patients with acute heart failure syndromes and cardiac troponin elevation. Circulation. 2013;6:193–202.
- , , , et al.; ADHERE Scientific Advisory Committee and Investigators. Usefulness of B‐type natriuretic peptide and cardiac troponin levels to predict in‐hospital mortality from ADHERE. Am J Cardiol. 2008;101:231–237.