User login
Discordance Between Patient and Provider
Patient‐centered care has been recognized by the Institute of Medicine as an essential aim of the US healthcare system.[1] A fundamental component of patient‐centered care is to engage patients and caregivers in establishing preferences, needs, values, and overall goals regarding their care.[1] Prior studies have shown that delivering high‐quality patient‐centered care is associated with improved health outcomes, and in some cases, reduced costs.[2, 3, 4, 5, 6, 7] Payors, including the Centers for Medicare and Medicaid Services under the Hospital Value‐Based Purchasing program, are increasingly tying payments to measures of patient experience.[8, 9] As more emphasis is placed on public reporting of these patient‐reported outcomes, healthcare organizations are investing in efforts to engage patients and caregivers, including efforts at establishing patients' preferences for care.[10]
In the acute care setting, a prerequisite for high‐quality patient‐centered care is identifying a patient's primary goal for recovery and then delivering care consistent with that goal.[11, 12, 13] Haberle et al. previously validated patients' most common goals for recovery in the hospital setting into 7 broad categories: (1) be cured, (2) live longer, (3) improve or maintain health, (4) be comfortable, (5) accomplish a particular life goal, (6) provide support for a family member, or (7) other.[13] When providers' understanding of these recovery goals are not concordant with the patient's stated goals, patients may receive care inconsistent with their preferences; it is not uncommon for patients to receive aggressive curative treatments (eg, cardiopulmonary resuscitation) when they have expressed otherwise.[14] On the other hand, when patient goals and priorities are clearly established, patients may have better outcomes.[15] For example, earlier conversations about patient goals and priorities in serious illness can lead to realistic expectations of treatment, enhanced goal‐concordant care, improved quality of life, higher patient satisfaction, more and earlier hospice care, fewer hospitalizations, better patient and family coping, reduced burden of decision making for families, and improved bereavement outcomes.[16, 17, 18]
Although previous studies have suggested poor patient‐physician concordance with regard to the patient's plan of care,[19, 20, 21, 22, 23, 24] there are limited data regarding providers' understanding of the patient's primary recovery goal during hospitalization. The purpose of this study was to identify the patients' Haberle goal, and then determine the degree of concordance among patients and key hospital providers regarding this goal.
METHODS
Study Setting
The Partners Human Research Committee approved the study. The study was conducted on an oncology and medical intensive care unit (MICU) at a major academic medical center in Boston, Massachusetts. The oncology unit was comprised of 2 non‐localized medical teams caring for patients admitted to that unit. The MICU was comprised of a single localized medical team. Medical teams working on these units consisted of a first responder (eg, intern or a physician assistant [PA]), medical residents, and an attending physician. Both units had dedicated nursing staff.
Study Participants
All adult patients (>17 years of age) admitted to the oncology and MICU units during the study period (November 2013 through May 2014) were eligible. These units were chosen because these patients are typically complex and have multiple medical comorbidities longer lengths of stay, and many procedures and tests. In addition, a standard method for asking patients to identify a primary recovery goal for hospitalization aligned well with ongoing institutional efforts to engage these patients in goals of care discussions.
Research assistants identified all patients admitted to each study unit for at least 48 hours and approached them in a random order with a daily target of 2 to 3 patients. Only patients who demonstrated capacity (determined by medical team), or had a legally designated healthcare proxy (who spoke English and was available to participate on their behalf) were included. Research assistants then approached the patient's nurse and a physician provider (defined for this study as housestaff physician, PA, or attending) from the primary medical team to participate in the interview (within 24 hours of patient's interview). We excluded eligible patients who did not have capacity or an available caregiver or declined to participate.
Data Collection Instrument and Interviews
Research assistants administered a validated questionnaire developed by Haberle et al. to participants after 48 hours into the patient's admission to provide time to establish mutual understanding of the diagnosis and prognosis.[13] We asked patients (or the designated healthcare proxy) to select their single, most important Haberle goal (see above). Specifically, as in the original validation study,[13] patients or proxies were asked the following question: Please tell me your most important goal of care for this hospitalization. If they did not understand this question, we asked a follow‐up question: What are you expecting will be accomplished during this hospitalization? Within 24 hours of the patient/proxy interview, we independently asked the patient's nurse and physician to select what they thought was the patient's most important goal for recovery using the same questionnaire, adapted for providers. In each case, all participants were blinded to the responses of others.
Measures
We measured the frequency that each participant (patient/proxy, nurse, and physician) selected a specific Haberle recovery goal across all patients. We measured the rate of pairwise concordance by recovery goal for each participant dyad (patient/proxy‐nurse, patient/proxy‐physician, and nurse‐physician). Finally, we calculated the frequency of cases for which all 3 participants selected the same recovery goal.
Statistical Analyses
Descriptive statistics were used to report patient demographic data. The frequencies of selected responses were calculated and reported as percentages for each type of participant. The differences in rate of responses for each Haberle goal were compared across each participant group using 2 analysis. We then performed 2‐way Kappa statistical tests to measure inter‐rater agreement for each dyad.
RESULTS
Of 1436 patients (882 oncology, 554 MICU) hospitalized during the study period, 341(156 oncology, 185 MICU) were admitted for 48 hours. Of 914 potentially eligible patients (617 oncology, 297 MICU), 191 (112 oncology and 79 MICU) were approached to participate based on our sampling strategy; of these, 8 (2 oncology and 6 MICU) did not have capacity (and no proxy was available) and 2 (1 oncology and 1 MICU) declined. Of the remaining 181 patients (109 oncology and 72 MICU), we obtained a completed questionnaire from all 3 interviewees on 109 (60.2% response rate).
Of the 109 study patients, 52 (47.7%) and 57 (52.3%) were admitted to the oncology and medical intensive care units, respectively (Table 1). Patients were predominantly middle aged, Caucasian, English‐speaking, and college‐educated. Healthcare proxies were frequently interviewed on behalf of patients in the MICU. Housestaff physicians were more often interviewed in the MICU, and PAs were interviewed only on oncology units. Compared to patient responders, nonresponders tended to be male and were admitted to oncology units (see Supporting Table 1 in the online version of this article).
| Characteristics | All Patients | Admitted to Medical Intensive Care Units | Admitted to Oncology Units |
|---|---|---|---|
| |||
| Total, no. (%) | 109 (100%) | 57 (52.3%) | 52 (47.7%) |
| Gender, no. (%) | |||
| Male | 55 (50.5%) | 28 (49.1%) | 26 (50.0%) |
| Female | 54 (49.5%) | 29 (50.9%) | 26 (50.0%) |
| Age, y, mean SD | 59.4 14 | 59.7 15 | 59.1 13 |
| Median | 61 | 61 | 60 |
| Range | 2188 | 2188 | 2285 |
| Race, no. (%) | |||
| White | 103 (94.5%) | 53 (93.0%) | 50 (96.2%) |
| Other | 6 (5.5%) | 4 (7.0%) | 2 (3.8%) |
| Language, no. (%) | |||
| English | 106 (97.2%) | 56 (98.1%) | 50 (96.2%) |
| Other | 3 (2.8%) | 1 (1.9%) | 2 (3.8%) |
| Education level, no. (%) | |||
| Less than high school | 30 (27.5%) | 17 (29.8%) | 13 (25.0%) |
| High school diploma | 27 (24.5%) | 18 (31.6%) | 9 (17.3%) |
| Some college or beyond | 52 (47.7%) | 22 (38.6%) | 30 (57.7%) |
| Patient or caregiver interviewed, no. (%) | |||
| Patient | 68 (62.4%) | 27 (47.4%) | 48 (92.3%) |
| Caregiver | 41 (37.6%) | 30 (52.6%) | 4 (7.7%) |
| Nurse interviewed, no. (unique) | 109 (75) | 57 (42) | 52 (33) |
| Physician provider interviewed, no. (%); no. unique | |||
| Attending | 27 (24.8%); 20 | 15 (26.3%); 10 | 12 (23.1%); 10 |
| Housestaff | 48 (44.0%); 39 | 42 (73.7%); 33 | 6 (11.5%); 6 |
| Physician assistant | 34 (31.2%); 25 | 0 (0%); 0 | 34 (65.4%); 25 |
The frequencies of selected Haberle recovery goals by participant type across all patients are listed in Table 2. Patients (or proxies) most often selected be cured (46.8%). Assigned nurses and physicians more commonly selected improve or maintain health (38.5% and 46.8%, respectively). Be comfortable was selected by nurses and physicians more frequently than by patients (16.5%, 16.5%, and 8.3%, respectively). The rate of responses for each Haberle goal was significantly different across all respondent groups (P 0.0001). The frequencies of selected Haberle goals were not significantly different between patients or proxies (P = 0.67), or for patients admitted to the MICU compared to oncology units (P = 0.64).
| Haberle Recovery Goal | Patient/Caregiver, no. (%), n = 109 | Physician Provider, no. (%), n = 109* | Nurse, no. (%), n = 109 |
|---|---|---|---|
| |||
| Be cured | 51 (46.8%) | 20 (18.3%) | 20 (18.3%) |
| Be comfortable | 9 (8.3%) | 18 (16.5%) | 18 (16.5%) |
| Improve or maintain health | 32 (29.4%) | 42 (38.5%) | 51 (46.8%) |
| Live longer | 14 (12.8%) | 21 (19.3%) | 12 (11%) |
| Accomplish personal goal | 2 (1.8%) | 0 (0%) | 3 (2.8%) |
| Provide support for family | 1 (0.9%) | 1 (0.9%) | 1 (0.9%) |
| Other | 0 (0%) | 7 (6.4%) | 4 (3.7%) |
Inter‐rater agreement was poor to slight for the 3 participant dyads (kappa 0.09 [0.03‐0.19], 0.19 [0.08‐0.30], and 0.20 [0.08‐0.32] for patient‐physician, patient‐nurse, and nurse‐physician, respectively). The 3 participants selected the identical recovery goal in 22 (20.2%) cases, and each selected a distinct recovery goal in 32 (29.4%) cases. Pairwise concordance between nurses and physicians was 39.4%. There were no significant differences in agreement between patients admitted to the MICU compared to oncology units (P = 0.09).
DISCUSSION
We observed poor to slight concordance among patients and key hospital providers with regard to identifying the patient's primary recovery goal during acute hospitalization. The majority of patients (or proxies), chose be cured, whereas the majority of hospital providers chose improve or maintain health. Patients were twice as likely to select be cured and half as likely to choose be comfortable compared to nurses or physicians. Strikingly, the patient (or proxy), nurse, and physician identified the same recovery goal in just 20% of cases. These findings were similar for patients admitted to either the MICU or oncology units or when healthcare proxies participated on behalf of the patient (eg, when incapacitated in the MICU).
There are many reasons why hospital providers may not correctly identify the patients' primary recovery goals. First, we do not routinely ask patients to identify recovery goals upon admission in a structured and standardized manner. In fact, clinicians often do not elicit patients' needs, concerns, and expectations regarding their care in general.[25] Second, even when recovery goals are elicited at admission, they may not be communicated effectively to all members of the care team. This could be due to geographically non‐localized teams (although we did not observe a statistically significant difference between regionalized MICU and nonregionalized oncology care units), frequent provider‐to‐provider handoffs, and siloed electronic communication (eg, email, alphanumeric pages) regarding goals of care that inevitably leaves out key providers.[26] Third, healthcare proxies who are involved in decision making on the patient's behalf may not always be available to meet with the care team in person; consequently, their input may not be considered in a timely manner or reliably communicated to all members of the care team. We observed a large discrepancy in how often patients chose be cured compared to their hospital providers. This could be explained by clinicians' unwillingness to disclose bad news or divulge accurate prognostic information that causes patients to feel depressed or lose hope, particularly for those patients with the worst prognoses.[16, 27, 28] Patients may lack sophisticated knowledge of their conditions for a variety of reasons, including low health literacy, at times choosing to hope for the best even when it is not realistic. Additionally, there may be more subtle differences in what patients and hospital providers consider the primary recovery goal in context of the main reason for hospitalization and underlying medical illness. For example, a patient with metastatic lung cancer hospitalized with recurrent postobstructive pneumonia may choose be cured as his/her primary recovery goal (thinking of the pneumonia), whereas physicians may choose improve/maintain health or comfort (thinking of the cancer). We also cannot exclude the possibility that sometimes when patients state be cured and clinicians state improve health as the primary goal, that they are really saying the same thing in different ways. However, these are 2 different constructs (cure may not be possible for many patients) that may deserve an explicit discussion for patients to have realistic expectations for their health following hospitalization.
In short, our results underscore the importance of having an open and honest dialog with patients and caregivers throughout hospitalization, and the need to provide education about the potential futility of excessive care in situations where appropriate. Simply following patients' goals without discussing their feasibility and the consequences of aggressive treatments may result in unnecessary morbidity and misuse of healthcare resources. Once goals are clearly established, communicated, and refined in hospitalized patients with serious illness, there is much reason to believe that ongoing conversation will favorably impact outcomes.[29]
We found few studies that rigorously quantified the rate of concordance of hospital recovery goals among patients and key hospital providers; however, studies that measured overall plan of care agreement have demonstrated suboptimal concordance.[20, 30, 31] Shin et al. found significant underestimation of cancer patients' needs and poor concordance between patients and oncologists in assessing perceived needs of supportive care.[20] It is also notable that nurses and physicians had low levels of concordance in our study. O'Leary and colleagues found that nurses and physicians did not reliably communicate and often did not agree on the plan of care for hospitalized patients.[30] Although geographic regionalization of care teams and multidisciplinary rounds can improve the likelihood that key members of the care team are on the same page with regard to the plan of care, there is still much room for improvement.[26, 32, 33, 34] For example, although nurses and physicians in our study independently selected individual recovery goals with similar frequencies (Table 2), we observed suboptimal concordance between nurses and providers (36.8%) for specific patients, including on our regionalized care unit (MICU). This may be due to the reasons described above.
There are several implications of these findings. As payors continue to shift payments toward value‐based metrics, largely determined by patient experience and adequate advance care planning,[9] our findings suggest that more effort should be focused on delivering care consistent with patients' primary recovery goals. As a first step, healthcare organizations can focus on efforts to systematically identify and communicate recovery goals to all members of the care team, ensuring that patients' preferences, needs, and values are captured. In addition, as innovation in patient engagement and care delivery using Web‐based and mobile technology continues to grow,[35] using these tools to capture key goals for hospitalization and recovery can play an essential role. For example, as electronic health record vendors and institutions start to implement patient portals in the acute care setting, they should consider how to configure these tools to capture key goals for hospitalization and recovery, and then communicate them to the care team; preliminary work in this area is promising.[10]
Our study has several limitations to generalizability. First, the study was conducted on 2 services (MICU and oncology) at a single institution using a sampling strategy where research assistants enrolled 2 to 3 patients per day. Although the sampling was random, the availability of patients and proxies to be interviewed may have led to selection bias. Second, the sample size was small. Third, the patients who participated were predominantly white, English‐speaking, and well educated, possibly a consequence of our sampling strategy. However, this fact makes our findings more striking; although cultural and language barriers were generally not present in our study population, large discrepancies in goal concordance still existed. Fourth, in instances when patients were unable to participate themselves, we interviewed their healthcare proxy; therefore, it is possible that the proxies' responses did not reflect those of the patient. However, we note that concordance rates did not significantly differ between the 2 services despite the fact that the proportion of proxy interviews was much higher in the MICU. Similarly, we cannot exclude the possibility that patients altered their stated goals in the presence of proxies, but patients were given the option to be interviewed alone. Patients may also have misunderstood the timing of the goals (during this hospitalization as opposed to long term), although research assistants made every effort to clarify this during the interviews. Finally, our data‐collection instrument was previously validated in hospitalized general medicine patients and not oncology or MICU patients, and it has not been used to directly ask clinicians to identify patients' recovery goals. However, there is no reason to suspect that it could not be used for this purpose in critical care as well as noncritical care settings, as the survey was developed by a multidisciplinary team that included medical professionals and was validated by clinicians who successfully identified a single, very broad goal (eg, be cured) in each case.
CONCLUSION
We report poor to slight concordance among hospitalized patients and key hospital providers with regard to the main recovery goal. Future studies should assess whether patient satisfaction and experience is adversely impacted by patient‐provider discordance regarding key recovery goals. Additionally, institutions may consider future efforts to elicit and communicate patients' primary recovery goals more effectively to all members of the care team, and address discrepancies as soon as they are discovered.
Disclosures
This work was supported by a grant from the Gordon and Betty Moore Foundation (GBMF) (grant GBMF3914). GBMF had no role in the design or conduct of the study; collection, analysis, or interpretation of data; or preparation or review of the manuscript. The authors report no conflicts of interest.
- Institute of Medicine. Crossing the Quality Chasm: A New Health System for the 21st Century. Washington, DC: National Academy of Sciences; 2001.
- , , , , , . The effects of physician communications skills on patient satisfaction; recall, and adherence. J Chronic Dis. 1984;37(9–10):755–764.
- , , , et al. Observational study of effect of patient centredness and positive approach on outcomes of general practice consultations. BMJ. 2001;323(7318):908–911.
- . Reengineering hospital discharge: a protocol to improve patient safety, reduce costs, and boost patient satisfaction. Am J Med Qual. 2009;24(4):344–346.
- , , , , . Relationship between patient satisfaction with inpatient care and hospital readmission within 30 days. Am J Manag Care. 2011;17(1):41–48.
- , , , . Patients' perception of hospital care in the United States. N Engl J Med. 2008;359(18):1921–1931.
- , , . Enhanced support for shared decision making reduced costs of care for patients with preference‐sensitive conditions. Health Aff (Millwood). 2013;32(2):285–293.
- Centers for Medicare and Medicaid Services. Medicare program; hospital inpatient value‐based purchasing program. Final rule. Fed Regist. 2011;76(88):26490–26547.
- Centers for Medicare and Medicaid Services. CMS begins implementation of key payment legislation. Available at: https://www.cms.gov/Newsroom/MediaReleaseDatabase/Press‐releases/2015‐Press‐releases‐items/2015‐07‐08.html. Published July 8, 2015.
- , , , et al. A web‐based, patient‐centered toolkit to engage patients and caregivers in the acute care setting: a preliminary evaluation [published online August 2, 2015]. J Am Med Informatics Assoc. doi: 10.1093/jamia/ocv093.
- , , , et al. Effectiveness trial of an intensive communication structure for families of long‐stay ICU patients. Chest. 2010;138(6):1340–1348.
- , , , . Understanding goals of care statements and preferences among patients and their surrogates in the medical ICU. J Hosp Palliat Nurs. 2012;14(2):126–132.
- , , , . Goals of care among hospitalized patients: a validation study. Am J Hosp Palliat Care. 2011;28(5):335–341.
- , , , et al. Factors associated with use of cardiopulmonary resuscitation in seriously ill hospitalized adults. JAMA. 1999;282(24):2333–2339.
- , , , , . End‐of‐life discussions, goal attainment, and distress at the end of life: Predictors and outcomes of receipt of care consistent with preferences. J Clin Oncol. 2010;28(7):1203–1208.
- , . Reasons why physicians do not have discussions about poor prognosis, why it matters, and what can be improved. J Clin Oncol. 2012;30(22):2715–2717.
- , , , et al. Associations between end‐of‐life discussions, patient mental health, medical care near death, and caregiver bereavement adjustment. JAMA. 2008;300(14):1665–1673.
- , , , . Prior advance care planning is associated with less decisional conflict among surrogates for critically ill patients. Ann Am Thorac Soc. 2015;12(10):1528–1533.
- , , , et al. Hospitalized patients' understanding of their plan of care. Mayo Clin Proc. 2010;85(1):47–52.
- , , , et al. Discordance in perceived needs between patients and physicians in oncology practice: a nationwide survey in Korea. J Clin Oncol. 2011;29(33):4424–4429.
- , , , , , . Leveraging standards to support patient‐centric interdisciplinary plans of care. AMIA Annu Symp Proc. 2011;2011:356–363.
- , . Discordance between physician and patient self‐rated health and all‐cause mortality. Ochsner J. 2011;11(3):232–240.
- , , , , , . Determinants of discordance between patients and physicians in their assessment of lupus disease activity. J Rheumatol. 2003;30(9):1967–1976.
- , , , , , . Predictors of discordance between physicians' and patients' appraisals of health‐related quality of life in atrial fibrillation patients: Findings from the Angiotensin II Antagonist in Paroxysmal Atrial Fibrillation Trial. Am Heart J. 2013;166(3):589–596.
- , , , et al. Uncovering the blind spot of patient satisfaction: an international survey. BMJ Qual Saf. 2011;20(11):959–965.
- , , , , , . Improving teamwork: impact of structured interdisciplinary rounds on a hospitalist unit. J Hosp Med. 2011;6(2):88–93.
- , , , . Discrepancies between patient and physician estimates for the success of stem cell transplantation. JAMA. 2001;285(8):1034–1038.
- , , , , , . Optimistic expectations and survival after hematopoietic stem cell transplantation. Biol Blood Marrow Transplant. 2003;9(6):389–396.
- , , , et al. Development of the Serious Illness Care Program: a randomised controlled trial of a palliative care communication intervention. BMJ Open. 2015;5(10):e009032.
- , , , et al. Patterns of nurse‐physician communication and agreement on the plan of care. Qual Saf Health Care. 2010;19(3):195–199.
- , , , et al. Impact of localizing physicians to hospital units on nurse‐physician communication and agreement on the plan of care. J Gen Intern Med. 2009;24(11):1223–1227.
- , , , et al. Changes in medical errors after implementation of a handoff program. N Engl J Med. 2014;371(19):1803–1812.
- , , , et al. Reorganizing a hospital ward as an accountable care unit. J Hosp Med. 2015;10(1):36–40.
- , , , . Interdisciplinary teamwork in hospitals: a review and practical recommendations for improvement. J Hosp Med. 2012;7(1):48–54.
- , , , , . An evaluation of mobile health application tools. JMIR mHealth uHealth. 2014;2(2):e19.
Patient‐centered care has been recognized by the Institute of Medicine as an essential aim of the US healthcare system.[1] A fundamental component of patient‐centered care is to engage patients and caregivers in establishing preferences, needs, values, and overall goals regarding their care.[1] Prior studies have shown that delivering high‐quality patient‐centered care is associated with improved health outcomes, and in some cases, reduced costs.[2, 3, 4, 5, 6, 7] Payors, including the Centers for Medicare and Medicaid Services under the Hospital Value‐Based Purchasing program, are increasingly tying payments to measures of patient experience.[8, 9] As more emphasis is placed on public reporting of these patient‐reported outcomes, healthcare organizations are investing in efforts to engage patients and caregivers, including efforts at establishing patients' preferences for care.[10]
In the acute care setting, a prerequisite for high‐quality patient‐centered care is identifying a patient's primary goal for recovery and then delivering care consistent with that goal.[11, 12, 13] Haberle et al. previously validated patients' most common goals for recovery in the hospital setting into 7 broad categories: (1) be cured, (2) live longer, (3) improve or maintain health, (4) be comfortable, (5) accomplish a particular life goal, (6) provide support for a family member, or (7) other.[13] When providers' understanding of these recovery goals are not concordant with the patient's stated goals, patients may receive care inconsistent with their preferences; it is not uncommon for patients to receive aggressive curative treatments (eg, cardiopulmonary resuscitation) when they have expressed otherwise.[14] On the other hand, when patient goals and priorities are clearly established, patients may have better outcomes.[15] For example, earlier conversations about patient goals and priorities in serious illness can lead to realistic expectations of treatment, enhanced goal‐concordant care, improved quality of life, higher patient satisfaction, more and earlier hospice care, fewer hospitalizations, better patient and family coping, reduced burden of decision making for families, and improved bereavement outcomes.[16, 17, 18]
Although previous studies have suggested poor patient‐physician concordance with regard to the patient's plan of care,[19, 20, 21, 22, 23, 24] there are limited data regarding providers' understanding of the patient's primary recovery goal during hospitalization. The purpose of this study was to identify the patients' Haberle goal, and then determine the degree of concordance among patients and key hospital providers regarding this goal.
METHODS
Study Setting
The Partners Human Research Committee approved the study. The study was conducted on an oncology and medical intensive care unit (MICU) at a major academic medical center in Boston, Massachusetts. The oncology unit was comprised of 2 non‐localized medical teams caring for patients admitted to that unit. The MICU was comprised of a single localized medical team. Medical teams working on these units consisted of a first responder (eg, intern or a physician assistant [PA]), medical residents, and an attending physician. Both units had dedicated nursing staff.
Study Participants
All adult patients (>17 years of age) admitted to the oncology and MICU units during the study period (November 2013 through May 2014) were eligible. These units were chosen because these patients are typically complex and have multiple medical comorbidities longer lengths of stay, and many procedures and tests. In addition, a standard method for asking patients to identify a primary recovery goal for hospitalization aligned well with ongoing institutional efforts to engage these patients in goals of care discussions.
Research assistants identified all patients admitted to each study unit for at least 48 hours and approached them in a random order with a daily target of 2 to 3 patients. Only patients who demonstrated capacity (determined by medical team), or had a legally designated healthcare proxy (who spoke English and was available to participate on their behalf) were included. Research assistants then approached the patient's nurse and a physician provider (defined for this study as housestaff physician, PA, or attending) from the primary medical team to participate in the interview (within 24 hours of patient's interview). We excluded eligible patients who did not have capacity or an available caregiver or declined to participate.
Data Collection Instrument and Interviews
Research assistants administered a validated questionnaire developed by Haberle et al. to participants after 48 hours into the patient's admission to provide time to establish mutual understanding of the diagnosis and prognosis.[13] We asked patients (or the designated healthcare proxy) to select their single, most important Haberle goal (see above). Specifically, as in the original validation study,[13] patients or proxies were asked the following question: Please tell me your most important goal of care for this hospitalization. If they did not understand this question, we asked a follow‐up question: What are you expecting will be accomplished during this hospitalization? Within 24 hours of the patient/proxy interview, we independently asked the patient's nurse and physician to select what they thought was the patient's most important goal for recovery using the same questionnaire, adapted for providers. In each case, all participants were blinded to the responses of others.
Measures
We measured the frequency that each participant (patient/proxy, nurse, and physician) selected a specific Haberle recovery goal across all patients. We measured the rate of pairwise concordance by recovery goal for each participant dyad (patient/proxy‐nurse, patient/proxy‐physician, and nurse‐physician). Finally, we calculated the frequency of cases for which all 3 participants selected the same recovery goal.
Statistical Analyses
Descriptive statistics were used to report patient demographic data. The frequencies of selected responses were calculated and reported as percentages for each type of participant. The differences in rate of responses for each Haberle goal were compared across each participant group using 2 analysis. We then performed 2‐way Kappa statistical tests to measure inter‐rater agreement for each dyad.
RESULTS
Of 1436 patients (882 oncology, 554 MICU) hospitalized during the study period, 341(156 oncology, 185 MICU) were admitted for 48 hours. Of 914 potentially eligible patients (617 oncology, 297 MICU), 191 (112 oncology and 79 MICU) were approached to participate based on our sampling strategy; of these, 8 (2 oncology and 6 MICU) did not have capacity (and no proxy was available) and 2 (1 oncology and 1 MICU) declined. Of the remaining 181 patients (109 oncology and 72 MICU), we obtained a completed questionnaire from all 3 interviewees on 109 (60.2% response rate).
Of the 109 study patients, 52 (47.7%) and 57 (52.3%) were admitted to the oncology and medical intensive care units, respectively (Table 1). Patients were predominantly middle aged, Caucasian, English‐speaking, and college‐educated. Healthcare proxies were frequently interviewed on behalf of patients in the MICU. Housestaff physicians were more often interviewed in the MICU, and PAs were interviewed only on oncology units. Compared to patient responders, nonresponders tended to be male and were admitted to oncology units (see Supporting Table 1 in the online version of this article).
| Characteristics | All Patients | Admitted to Medical Intensive Care Units | Admitted to Oncology Units |
|---|---|---|---|
| |||
| Total, no. (%) | 109 (100%) | 57 (52.3%) | 52 (47.7%) |
| Gender, no. (%) | |||
| Male | 55 (50.5%) | 28 (49.1%) | 26 (50.0%) |
| Female | 54 (49.5%) | 29 (50.9%) | 26 (50.0%) |
| Age, y, mean SD | 59.4 14 | 59.7 15 | 59.1 13 |
| Median | 61 | 61 | 60 |
| Range | 2188 | 2188 | 2285 |
| Race, no. (%) | |||
| White | 103 (94.5%) | 53 (93.0%) | 50 (96.2%) |
| Other | 6 (5.5%) | 4 (7.0%) | 2 (3.8%) |
| Language, no. (%) | |||
| English | 106 (97.2%) | 56 (98.1%) | 50 (96.2%) |
| Other | 3 (2.8%) | 1 (1.9%) | 2 (3.8%) |
| Education level, no. (%) | |||
| Less than high school | 30 (27.5%) | 17 (29.8%) | 13 (25.0%) |
| High school diploma | 27 (24.5%) | 18 (31.6%) | 9 (17.3%) |
| Some college or beyond | 52 (47.7%) | 22 (38.6%) | 30 (57.7%) |
| Patient or caregiver interviewed, no. (%) | |||
| Patient | 68 (62.4%) | 27 (47.4%) | 48 (92.3%) |
| Caregiver | 41 (37.6%) | 30 (52.6%) | 4 (7.7%) |
| Nurse interviewed, no. (unique) | 109 (75) | 57 (42) | 52 (33) |
| Physician provider interviewed, no. (%); no. unique | |||
| Attending | 27 (24.8%); 20 | 15 (26.3%); 10 | 12 (23.1%); 10 |
| Housestaff | 48 (44.0%); 39 | 42 (73.7%); 33 | 6 (11.5%); 6 |
| Physician assistant | 34 (31.2%); 25 | 0 (0%); 0 | 34 (65.4%); 25 |
The frequencies of selected Haberle recovery goals by participant type across all patients are listed in Table 2. Patients (or proxies) most often selected be cured (46.8%). Assigned nurses and physicians more commonly selected improve or maintain health (38.5% and 46.8%, respectively). Be comfortable was selected by nurses and physicians more frequently than by patients (16.5%, 16.5%, and 8.3%, respectively). The rate of responses for each Haberle goal was significantly different across all respondent groups (P 0.0001). The frequencies of selected Haberle goals were not significantly different between patients or proxies (P = 0.67), or for patients admitted to the MICU compared to oncology units (P = 0.64).
| Haberle Recovery Goal | Patient/Caregiver, no. (%), n = 109 | Physician Provider, no. (%), n = 109* | Nurse, no. (%), n = 109 |
|---|---|---|---|
| |||
| Be cured | 51 (46.8%) | 20 (18.3%) | 20 (18.3%) |
| Be comfortable | 9 (8.3%) | 18 (16.5%) | 18 (16.5%) |
| Improve or maintain health | 32 (29.4%) | 42 (38.5%) | 51 (46.8%) |
| Live longer | 14 (12.8%) | 21 (19.3%) | 12 (11%) |
| Accomplish personal goal | 2 (1.8%) | 0 (0%) | 3 (2.8%) |
| Provide support for family | 1 (0.9%) | 1 (0.9%) | 1 (0.9%) |
| Other | 0 (0%) | 7 (6.4%) | 4 (3.7%) |
Inter‐rater agreement was poor to slight for the 3 participant dyads (kappa 0.09 [0.03‐0.19], 0.19 [0.08‐0.30], and 0.20 [0.08‐0.32] for patient‐physician, patient‐nurse, and nurse‐physician, respectively). The 3 participants selected the identical recovery goal in 22 (20.2%) cases, and each selected a distinct recovery goal in 32 (29.4%) cases. Pairwise concordance between nurses and physicians was 39.4%. There were no significant differences in agreement between patients admitted to the MICU compared to oncology units (P = 0.09).
DISCUSSION
We observed poor to slight concordance among patients and key hospital providers with regard to identifying the patient's primary recovery goal during acute hospitalization. The majority of patients (or proxies), chose be cured, whereas the majority of hospital providers chose improve or maintain health. Patients were twice as likely to select be cured and half as likely to choose be comfortable compared to nurses or physicians. Strikingly, the patient (or proxy), nurse, and physician identified the same recovery goal in just 20% of cases. These findings were similar for patients admitted to either the MICU or oncology units or when healthcare proxies participated on behalf of the patient (eg, when incapacitated in the MICU).
There are many reasons why hospital providers may not correctly identify the patients' primary recovery goals. First, we do not routinely ask patients to identify recovery goals upon admission in a structured and standardized manner. In fact, clinicians often do not elicit patients' needs, concerns, and expectations regarding their care in general.[25] Second, even when recovery goals are elicited at admission, they may not be communicated effectively to all members of the care team. This could be due to geographically non‐localized teams (although we did not observe a statistically significant difference between regionalized MICU and nonregionalized oncology care units), frequent provider‐to‐provider handoffs, and siloed electronic communication (eg, email, alphanumeric pages) regarding goals of care that inevitably leaves out key providers.[26] Third, healthcare proxies who are involved in decision making on the patient's behalf may not always be available to meet with the care team in person; consequently, their input may not be considered in a timely manner or reliably communicated to all members of the care team. We observed a large discrepancy in how often patients chose be cured compared to their hospital providers. This could be explained by clinicians' unwillingness to disclose bad news or divulge accurate prognostic information that causes patients to feel depressed or lose hope, particularly for those patients with the worst prognoses.[16, 27, 28] Patients may lack sophisticated knowledge of their conditions for a variety of reasons, including low health literacy, at times choosing to hope for the best even when it is not realistic. Additionally, there may be more subtle differences in what patients and hospital providers consider the primary recovery goal in context of the main reason for hospitalization and underlying medical illness. For example, a patient with metastatic lung cancer hospitalized with recurrent postobstructive pneumonia may choose be cured as his/her primary recovery goal (thinking of the pneumonia), whereas physicians may choose improve/maintain health or comfort (thinking of the cancer). We also cannot exclude the possibility that sometimes when patients state be cured and clinicians state improve health as the primary goal, that they are really saying the same thing in different ways. However, these are 2 different constructs (cure may not be possible for many patients) that may deserve an explicit discussion for patients to have realistic expectations for their health following hospitalization.
In short, our results underscore the importance of having an open and honest dialog with patients and caregivers throughout hospitalization, and the need to provide education about the potential futility of excessive care in situations where appropriate. Simply following patients' goals without discussing their feasibility and the consequences of aggressive treatments may result in unnecessary morbidity and misuse of healthcare resources. Once goals are clearly established, communicated, and refined in hospitalized patients with serious illness, there is much reason to believe that ongoing conversation will favorably impact outcomes.[29]
We found few studies that rigorously quantified the rate of concordance of hospital recovery goals among patients and key hospital providers; however, studies that measured overall plan of care agreement have demonstrated suboptimal concordance.[20, 30, 31] Shin et al. found significant underestimation of cancer patients' needs and poor concordance between patients and oncologists in assessing perceived needs of supportive care.[20] It is also notable that nurses and physicians had low levels of concordance in our study. O'Leary and colleagues found that nurses and physicians did not reliably communicate and often did not agree on the plan of care for hospitalized patients.[30] Although geographic regionalization of care teams and multidisciplinary rounds can improve the likelihood that key members of the care team are on the same page with regard to the plan of care, there is still much room for improvement.[26, 32, 33, 34] For example, although nurses and physicians in our study independently selected individual recovery goals with similar frequencies (Table 2), we observed suboptimal concordance between nurses and providers (36.8%) for specific patients, including on our regionalized care unit (MICU). This may be due to the reasons described above.
There are several implications of these findings. As payors continue to shift payments toward value‐based metrics, largely determined by patient experience and adequate advance care planning,[9] our findings suggest that more effort should be focused on delivering care consistent with patients' primary recovery goals. As a first step, healthcare organizations can focus on efforts to systematically identify and communicate recovery goals to all members of the care team, ensuring that patients' preferences, needs, and values are captured. In addition, as innovation in patient engagement and care delivery using Web‐based and mobile technology continues to grow,[35] using these tools to capture key goals for hospitalization and recovery can play an essential role. For example, as electronic health record vendors and institutions start to implement patient portals in the acute care setting, they should consider how to configure these tools to capture key goals for hospitalization and recovery, and then communicate them to the care team; preliminary work in this area is promising.[10]
Our study has several limitations to generalizability. First, the study was conducted on 2 services (MICU and oncology) at a single institution using a sampling strategy where research assistants enrolled 2 to 3 patients per day. Although the sampling was random, the availability of patients and proxies to be interviewed may have led to selection bias. Second, the sample size was small. Third, the patients who participated were predominantly white, English‐speaking, and well educated, possibly a consequence of our sampling strategy. However, this fact makes our findings more striking; although cultural and language barriers were generally not present in our study population, large discrepancies in goal concordance still existed. Fourth, in instances when patients were unable to participate themselves, we interviewed their healthcare proxy; therefore, it is possible that the proxies' responses did not reflect those of the patient. However, we note that concordance rates did not significantly differ between the 2 services despite the fact that the proportion of proxy interviews was much higher in the MICU. Similarly, we cannot exclude the possibility that patients altered their stated goals in the presence of proxies, but patients were given the option to be interviewed alone. Patients may also have misunderstood the timing of the goals (during this hospitalization as opposed to long term), although research assistants made every effort to clarify this during the interviews. Finally, our data‐collection instrument was previously validated in hospitalized general medicine patients and not oncology or MICU patients, and it has not been used to directly ask clinicians to identify patients' recovery goals. However, there is no reason to suspect that it could not be used for this purpose in critical care as well as noncritical care settings, as the survey was developed by a multidisciplinary team that included medical professionals and was validated by clinicians who successfully identified a single, very broad goal (eg, be cured) in each case.
CONCLUSION
We report poor to slight concordance among hospitalized patients and key hospital providers with regard to the main recovery goal. Future studies should assess whether patient satisfaction and experience is adversely impacted by patient‐provider discordance regarding key recovery goals. Additionally, institutions may consider future efforts to elicit and communicate patients' primary recovery goals more effectively to all members of the care team, and address discrepancies as soon as they are discovered.
Disclosures
This work was supported by a grant from the Gordon and Betty Moore Foundation (GBMF) (grant GBMF3914). GBMF had no role in the design or conduct of the study; collection, analysis, or interpretation of data; or preparation or review of the manuscript. The authors report no conflicts of interest.
Patient‐centered care has been recognized by the Institute of Medicine as an essential aim of the US healthcare system.[1] A fundamental component of patient‐centered care is to engage patients and caregivers in establishing preferences, needs, values, and overall goals regarding their care.[1] Prior studies have shown that delivering high‐quality patient‐centered care is associated with improved health outcomes, and in some cases, reduced costs.[2, 3, 4, 5, 6, 7] Payors, including the Centers for Medicare and Medicaid Services under the Hospital Value‐Based Purchasing program, are increasingly tying payments to measures of patient experience.[8, 9] As more emphasis is placed on public reporting of these patient‐reported outcomes, healthcare organizations are investing in efforts to engage patients and caregivers, including efforts at establishing patients' preferences for care.[10]
In the acute care setting, a prerequisite for high‐quality patient‐centered care is identifying a patient's primary goal for recovery and then delivering care consistent with that goal.[11, 12, 13] Haberle et al. previously validated patients' most common goals for recovery in the hospital setting into 7 broad categories: (1) be cured, (2) live longer, (3) improve or maintain health, (4) be comfortable, (5) accomplish a particular life goal, (6) provide support for a family member, or (7) other.[13] When providers' understanding of these recovery goals are not concordant with the patient's stated goals, patients may receive care inconsistent with their preferences; it is not uncommon for patients to receive aggressive curative treatments (eg, cardiopulmonary resuscitation) when they have expressed otherwise.[14] On the other hand, when patient goals and priorities are clearly established, patients may have better outcomes.[15] For example, earlier conversations about patient goals and priorities in serious illness can lead to realistic expectations of treatment, enhanced goal‐concordant care, improved quality of life, higher patient satisfaction, more and earlier hospice care, fewer hospitalizations, better patient and family coping, reduced burden of decision making for families, and improved bereavement outcomes.[16, 17, 18]
Although previous studies have suggested poor patient‐physician concordance with regard to the patient's plan of care,[19, 20, 21, 22, 23, 24] there are limited data regarding providers' understanding of the patient's primary recovery goal during hospitalization. The purpose of this study was to identify the patients' Haberle goal, and then determine the degree of concordance among patients and key hospital providers regarding this goal.
METHODS
Study Setting
The Partners Human Research Committee approved the study. The study was conducted on an oncology and medical intensive care unit (MICU) at a major academic medical center in Boston, Massachusetts. The oncology unit was comprised of 2 non‐localized medical teams caring for patients admitted to that unit. The MICU was comprised of a single localized medical team. Medical teams working on these units consisted of a first responder (eg, intern or a physician assistant [PA]), medical residents, and an attending physician. Both units had dedicated nursing staff.
Study Participants
All adult patients (>17 years of age) admitted to the oncology and MICU units during the study period (November 2013 through May 2014) were eligible. These units were chosen because these patients are typically complex and have multiple medical comorbidities longer lengths of stay, and many procedures and tests. In addition, a standard method for asking patients to identify a primary recovery goal for hospitalization aligned well with ongoing institutional efforts to engage these patients in goals of care discussions.
Research assistants identified all patients admitted to each study unit for at least 48 hours and approached them in a random order with a daily target of 2 to 3 patients. Only patients who demonstrated capacity (determined by medical team), or had a legally designated healthcare proxy (who spoke English and was available to participate on their behalf) were included. Research assistants then approached the patient's nurse and a physician provider (defined for this study as housestaff physician, PA, or attending) from the primary medical team to participate in the interview (within 24 hours of patient's interview). We excluded eligible patients who did not have capacity or an available caregiver or declined to participate.
Data Collection Instrument and Interviews
Research assistants administered a validated questionnaire developed by Haberle et al. to participants after 48 hours into the patient's admission to provide time to establish mutual understanding of the diagnosis and prognosis.[13] We asked patients (or the designated healthcare proxy) to select their single, most important Haberle goal (see above). Specifically, as in the original validation study,[13] patients or proxies were asked the following question: Please tell me your most important goal of care for this hospitalization. If they did not understand this question, we asked a follow‐up question: What are you expecting will be accomplished during this hospitalization? Within 24 hours of the patient/proxy interview, we independently asked the patient's nurse and physician to select what they thought was the patient's most important goal for recovery using the same questionnaire, adapted for providers. In each case, all participants were blinded to the responses of others.
Measures
We measured the frequency that each participant (patient/proxy, nurse, and physician) selected a specific Haberle recovery goal across all patients. We measured the rate of pairwise concordance by recovery goal for each participant dyad (patient/proxy‐nurse, patient/proxy‐physician, and nurse‐physician). Finally, we calculated the frequency of cases for which all 3 participants selected the same recovery goal.
Statistical Analyses
Descriptive statistics were used to report patient demographic data. The frequencies of selected responses were calculated and reported as percentages for each type of participant. The differences in rate of responses for each Haberle goal were compared across each participant group using 2 analysis. We then performed 2‐way Kappa statistical tests to measure inter‐rater agreement for each dyad.
RESULTS
Of 1436 patients (882 oncology, 554 MICU) hospitalized during the study period, 341(156 oncology, 185 MICU) were admitted for 48 hours. Of 914 potentially eligible patients (617 oncology, 297 MICU), 191 (112 oncology and 79 MICU) were approached to participate based on our sampling strategy; of these, 8 (2 oncology and 6 MICU) did not have capacity (and no proxy was available) and 2 (1 oncology and 1 MICU) declined. Of the remaining 181 patients (109 oncology and 72 MICU), we obtained a completed questionnaire from all 3 interviewees on 109 (60.2% response rate).
Of the 109 study patients, 52 (47.7%) and 57 (52.3%) were admitted to the oncology and medical intensive care units, respectively (Table 1). Patients were predominantly middle aged, Caucasian, English‐speaking, and college‐educated. Healthcare proxies were frequently interviewed on behalf of patients in the MICU. Housestaff physicians were more often interviewed in the MICU, and PAs were interviewed only on oncology units. Compared to patient responders, nonresponders tended to be male and were admitted to oncology units (see Supporting Table 1 in the online version of this article).
| Characteristics | All Patients | Admitted to Medical Intensive Care Units | Admitted to Oncology Units |
|---|---|---|---|
| |||
| Total, no. (%) | 109 (100%) | 57 (52.3%) | 52 (47.7%) |
| Gender, no. (%) | |||
| Male | 55 (50.5%) | 28 (49.1%) | 26 (50.0%) |
| Female | 54 (49.5%) | 29 (50.9%) | 26 (50.0%) |
| Age, y, mean SD | 59.4 14 | 59.7 15 | 59.1 13 |
| Median | 61 | 61 | 60 |
| Range | 2188 | 2188 | 2285 |
| Race, no. (%) | |||
| White | 103 (94.5%) | 53 (93.0%) | 50 (96.2%) |
| Other | 6 (5.5%) | 4 (7.0%) | 2 (3.8%) |
| Language, no. (%) | |||
| English | 106 (97.2%) | 56 (98.1%) | 50 (96.2%) |
| Other | 3 (2.8%) | 1 (1.9%) | 2 (3.8%) |
| Education level, no. (%) | |||
| Less than high school | 30 (27.5%) | 17 (29.8%) | 13 (25.0%) |
| High school diploma | 27 (24.5%) | 18 (31.6%) | 9 (17.3%) |
| Some college or beyond | 52 (47.7%) | 22 (38.6%) | 30 (57.7%) |
| Patient or caregiver interviewed, no. (%) | |||
| Patient | 68 (62.4%) | 27 (47.4%) | 48 (92.3%) |
| Caregiver | 41 (37.6%) | 30 (52.6%) | 4 (7.7%) |
| Nurse interviewed, no. (unique) | 109 (75) | 57 (42) | 52 (33) |
| Physician provider interviewed, no. (%); no. unique | |||
| Attending | 27 (24.8%); 20 | 15 (26.3%); 10 | 12 (23.1%); 10 |
| Housestaff | 48 (44.0%); 39 | 42 (73.7%); 33 | 6 (11.5%); 6 |
| Physician assistant | 34 (31.2%); 25 | 0 (0%); 0 | 34 (65.4%); 25 |
The frequencies of selected Haberle recovery goals by participant type across all patients are listed in Table 2. Patients (or proxies) most often selected be cured (46.8%). Assigned nurses and physicians more commonly selected improve or maintain health (38.5% and 46.8%, respectively). Be comfortable was selected by nurses and physicians more frequently than by patients (16.5%, 16.5%, and 8.3%, respectively). The rate of responses for each Haberle goal was significantly different across all respondent groups (P 0.0001). The frequencies of selected Haberle goals were not significantly different between patients or proxies (P = 0.67), or for patients admitted to the MICU compared to oncology units (P = 0.64).
| Haberle Recovery Goal | Patient/Caregiver, no. (%), n = 109 | Physician Provider, no. (%), n = 109* | Nurse, no. (%), n = 109 |
|---|---|---|---|
| |||
| Be cured | 51 (46.8%) | 20 (18.3%) | 20 (18.3%) |
| Be comfortable | 9 (8.3%) | 18 (16.5%) | 18 (16.5%) |
| Improve or maintain health | 32 (29.4%) | 42 (38.5%) | 51 (46.8%) |
| Live longer | 14 (12.8%) | 21 (19.3%) | 12 (11%) |
| Accomplish personal goal | 2 (1.8%) | 0 (0%) | 3 (2.8%) |
| Provide support for family | 1 (0.9%) | 1 (0.9%) | 1 (0.9%) |
| Other | 0 (0%) | 7 (6.4%) | 4 (3.7%) |
Inter‐rater agreement was poor to slight for the 3 participant dyads (kappa 0.09 [0.03‐0.19], 0.19 [0.08‐0.30], and 0.20 [0.08‐0.32] for patient‐physician, patient‐nurse, and nurse‐physician, respectively). The 3 participants selected the identical recovery goal in 22 (20.2%) cases, and each selected a distinct recovery goal in 32 (29.4%) cases. Pairwise concordance between nurses and physicians was 39.4%. There were no significant differences in agreement between patients admitted to the MICU compared to oncology units (P = 0.09).
DISCUSSION
We observed poor to slight concordance among patients and key hospital providers with regard to identifying the patient's primary recovery goal during acute hospitalization. The majority of patients (or proxies), chose be cured, whereas the majority of hospital providers chose improve or maintain health. Patients were twice as likely to select be cured and half as likely to choose be comfortable compared to nurses or physicians. Strikingly, the patient (or proxy), nurse, and physician identified the same recovery goal in just 20% of cases. These findings were similar for patients admitted to either the MICU or oncology units or when healthcare proxies participated on behalf of the patient (eg, when incapacitated in the MICU).
There are many reasons why hospital providers may not correctly identify the patients' primary recovery goals. First, we do not routinely ask patients to identify recovery goals upon admission in a structured and standardized manner. In fact, clinicians often do not elicit patients' needs, concerns, and expectations regarding their care in general.[25] Second, even when recovery goals are elicited at admission, they may not be communicated effectively to all members of the care team. This could be due to geographically non‐localized teams (although we did not observe a statistically significant difference between regionalized MICU and nonregionalized oncology care units), frequent provider‐to‐provider handoffs, and siloed electronic communication (eg, email, alphanumeric pages) regarding goals of care that inevitably leaves out key providers.[26] Third, healthcare proxies who are involved in decision making on the patient's behalf may not always be available to meet with the care team in person; consequently, their input may not be considered in a timely manner or reliably communicated to all members of the care team. We observed a large discrepancy in how often patients chose be cured compared to their hospital providers. This could be explained by clinicians' unwillingness to disclose bad news or divulge accurate prognostic information that causes patients to feel depressed or lose hope, particularly for those patients with the worst prognoses.[16, 27, 28] Patients may lack sophisticated knowledge of their conditions for a variety of reasons, including low health literacy, at times choosing to hope for the best even when it is not realistic. Additionally, there may be more subtle differences in what patients and hospital providers consider the primary recovery goal in context of the main reason for hospitalization and underlying medical illness. For example, a patient with metastatic lung cancer hospitalized with recurrent postobstructive pneumonia may choose be cured as his/her primary recovery goal (thinking of the pneumonia), whereas physicians may choose improve/maintain health or comfort (thinking of the cancer). We also cannot exclude the possibility that sometimes when patients state be cured and clinicians state improve health as the primary goal, that they are really saying the same thing in different ways. However, these are 2 different constructs (cure may not be possible for many patients) that may deserve an explicit discussion for patients to have realistic expectations for their health following hospitalization.
In short, our results underscore the importance of having an open and honest dialog with patients and caregivers throughout hospitalization, and the need to provide education about the potential futility of excessive care in situations where appropriate. Simply following patients' goals without discussing their feasibility and the consequences of aggressive treatments may result in unnecessary morbidity and misuse of healthcare resources. Once goals are clearly established, communicated, and refined in hospitalized patients with serious illness, there is much reason to believe that ongoing conversation will favorably impact outcomes.[29]
We found few studies that rigorously quantified the rate of concordance of hospital recovery goals among patients and key hospital providers; however, studies that measured overall plan of care agreement have demonstrated suboptimal concordance.[20, 30, 31] Shin et al. found significant underestimation of cancer patients' needs and poor concordance between patients and oncologists in assessing perceived needs of supportive care.[20] It is also notable that nurses and physicians had low levels of concordance in our study. O'Leary and colleagues found that nurses and physicians did not reliably communicate and often did not agree on the plan of care for hospitalized patients.[30] Although geographic regionalization of care teams and multidisciplinary rounds can improve the likelihood that key members of the care team are on the same page with regard to the plan of care, there is still much room for improvement.[26, 32, 33, 34] For example, although nurses and physicians in our study independently selected individual recovery goals with similar frequencies (Table 2), we observed suboptimal concordance between nurses and providers (36.8%) for specific patients, including on our regionalized care unit (MICU). This may be due to the reasons described above.
There are several implications of these findings. As payors continue to shift payments toward value‐based metrics, largely determined by patient experience and adequate advance care planning,[9] our findings suggest that more effort should be focused on delivering care consistent with patients' primary recovery goals. As a first step, healthcare organizations can focus on efforts to systematically identify and communicate recovery goals to all members of the care team, ensuring that patients' preferences, needs, and values are captured. In addition, as innovation in patient engagement and care delivery using Web‐based and mobile technology continues to grow,[35] using these tools to capture key goals for hospitalization and recovery can play an essential role. For example, as electronic health record vendors and institutions start to implement patient portals in the acute care setting, they should consider how to configure these tools to capture key goals for hospitalization and recovery, and then communicate them to the care team; preliminary work in this area is promising.[10]
Our study has several limitations to generalizability. First, the study was conducted on 2 services (MICU and oncology) at a single institution using a sampling strategy where research assistants enrolled 2 to 3 patients per day. Although the sampling was random, the availability of patients and proxies to be interviewed may have led to selection bias. Second, the sample size was small. Third, the patients who participated were predominantly white, English‐speaking, and well educated, possibly a consequence of our sampling strategy. However, this fact makes our findings more striking; although cultural and language barriers were generally not present in our study population, large discrepancies in goal concordance still existed. Fourth, in instances when patients were unable to participate themselves, we interviewed their healthcare proxy; therefore, it is possible that the proxies' responses did not reflect those of the patient. However, we note that concordance rates did not significantly differ between the 2 services despite the fact that the proportion of proxy interviews was much higher in the MICU. Similarly, we cannot exclude the possibility that patients altered their stated goals in the presence of proxies, but patients were given the option to be interviewed alone. Patients may also have misunderstood the timing of the goals (during this hospitalization as opposed to long term), although research assistants made every effort to clarify this during the interviews. Finally, our data‐collection instrument was previously validated in hospitalized general medicine patients and not oncology or MICU patients, and it has not been used to directly ask clinicians to identify patients' recovery goals. However, there is no reason to suspect that it could not be used for this purpose in critical care as well as noncritical care settings, as the survey was developed by a multidisciplinary team that included medical professionals and was validated by clinicians who successfully identified a single, very broad goal (eg, be cured) in each case.
CONCLUSION
We report poor to slight concordance among hospitalized patients and key hospital providers with regard to the main recovery goal. Future studies should assess whether patient satisfaction and experience is adversely impacted by patient‐provider discordance regarding key recovery goals. Additionally, institutions may consider future efforts to elicit and communicate patients' primary recovery goals more effectively to all members of the care team, and address discrepancies as soon as they are discovered.
Disclosures
This work was supported by a grant from the Gordon and Betty Moore Foundation (GBMF) (grant GBMF3914). GBMF had no role in the design or conduct of the study; collection, analysis, or interpretation of data; or preparation or review of the manuscript. The authors report no conflicts of interest.
- Institute of Medicine. Crossing the Quality Chasm: A New Health System for the 21st Century. Washington, DC: National Academy of Sciences; 2001.
- , , , , , . The effects of physician communications skills on patient satisfaction; recall, and adherence. J Chronic Dis. 1984;37(9–10):755–764.
- , , , et al. Observational study of effect of patient centredness and positive approach on outcomes of general practice consultations. BMJ. 2001;323(7318):908–911.
- . Reengineering hospital discharge: a protocol to improve patient safety, reduce costs, and boost patient satisfaction. Am J Med Qual. 2009;24(4):344–346.
- , , , , . Relationship between patient satisfaction with inpatient care and hospital readmission within 30 days. Am J Manag Care. 2011;17(1):41–48.
- , , , . Patients' perception of hospital care in the United States. N Engl J Med. 2008;359(18):1921–1931.
- , , . Enhanced support for shared decision making reduced costs of care for patients with preference‐sensitive conditions. Health Aff (Millwood). 2013;32(2):285–293.
- Centers for Medicare and Medicaid Services. Medicare program; hospital inpatient value‐based purchasing program. Final rule. Fed Regist. 2011;76(88):26490–26547.
- Centers for Medicare and Medicaid Services. CMS begins implementation of key payment legislation. Available at: https://www.cms.gov/Newsroom/MediaReleaseDatabase/Press‐releases/2015‐Press‐releases‐items/2015‐07‐08.html. Published July 8, 2015.
- , , , et al. A web‐based, patient‐centered toolkit to engage patients and caregivers in the acute care setting: a preliminary evaluation [published online August 2, 2015]. J Am Med Informatics Assoc. doi: 10.1093/jamia/ocv093.
- , , , et al. Effectiveness trial of an intensive communication structure for families of long‐stay ICU patients. Chest. 2010;138(6):1340–1348.
- , , , . Understanding goals of care statements and preferences among patients and their surrogates in the medical ICU. J Hosp Palliat Nurs. 2012;14(2):126–132.
- , , , . Goals of care among hospitalized patients: a validation study. Am J Hosp Palliat Care. 2011;28(5):335–341.
- , , , et al. Factors associated with use of cardiopulmonary resuscitation in seriously ill hospitalized adults. JAMA. 1999;282(24):2333–2339.
- , , , , . End‐of‐life discussions, goal attainment, and distress at the end of life: Predictors and outcomes of receipt of care consistent with preferences. J Clin Oncol. 2010;28(7):1203–1208.
- , . Reasons why physicians do not have discussions about poor prognosis, why it matters, and what can be improved. J Clin Oncol. 2012;30(22):2715–2717.
- , , , et al. Associations between end‐of‐life discussions, patient mental health, medical care near death, and caregiver bereavement adjustment. JAMA. 2008;300(14):1665–1673.
- , , , . Prior advance care planning is associated with less decisional conflict among surrogates for critically ill patients. Ann Am Thorac Soc. 2015;12(10):1528–1533.
- , , , et al. Hospitalized patients' understanding of their plan of care. Mayo Clin Proc. 2010;85(1):47–52.
- , , , et al. Discordance in perceived needs between patients and physicians in oncology practice: a nationwide survey in Korea. J Clin Oncol. 2011;29(33):4424–4429.
- , , , , , . Leveraging standards to support patient‐centric interdisciplinary plans of care. AMIA Annu Symp Proc. 2011;2011:356–363.
- , . Discordance between physician and patient self‐rated health and all‐cause mortality. Ochsner J. 2011;11(3):232–240.
- , , , , , . Determinants of discordance between patients and physicians in their assessment of lupus disease activity. J Rheumatol. 2003;30(9):1967–1976.
- , , , , , . Predictors of discordance between physicians' and patients' appraisals of health‐related quality of life in atrial fibrillation patients: Findings from the Angiotensin II Antagonist in Paroxysmal Atrial Fibrillation Trial. Am Heart J. 2013;166(3):589–596.
- , , , et al. Uncovering the blind spot of patient satisfaction: an international survey. BMJ Qual Saf. 2011;20(11):959–965.
- , , , , , . Improving teamwork: impact of structured interdisciplinary rounds on a hospitalist unit. J Hosp Med. 2011;6(2):88–93.
- , , , . Discrepancies between patient and physician estimates for the success of stem cell transplantation. JAMA. 2001;285(8):1034–1038.
- , , , , , . Optimistic expectations and survival after hematopoietic stem cell transplantation. Biol Blood Marrow Transplant. 2003;9(6):389–396.
- , , , et al. Development of the Serious Illness Care Program: a randomised controlled trial of a palliative care communication intervention. BMJ Open. 2015;5(10):e009032.
- , , , et al. Patterns of nurse‐physician communication and agreement on the plan of care. Qual Saf Health Care. 2010;19(3):195–199.
- , , , et al. Impact of localizing physicians to hospital units on nurse‐physician communication and agreement on the plan of care. J Gen Intern Med. 2009;24(11):1223–1227.
- , , , et al. Changes in medical errors after implementation of a handoff program. N Engl J Med. 2014;371(19):1803–1812.
- , , , et al. Reorganizing a hospital ward as an accountable care unit. J Hosp Med. 2015;10(1):36–40.
- , , , . Interdisciplinary teamwork in hospitals: a review and practical recommendations for improvement. J Hosp Med. 2012;7(1):48–54.
- , , , , . An evaluation of mobile health application tools. JMIR mHealth uHealth. 2014;2(2):e19.
- Institute of Medicine. Crossing the Quality Chasm: A New Health System for the 21st Century. Washington, DC: National Academy of Sciences; 2001.
- , , , , , . The effects of physician communications skills on patient satisfaction; recall, and adherence. J Chronic Dis. 1984;37(9–10):755–764.
- , , , et al. Observational study of effect of patient centredness and positive approach on outcomes of general practice consultations. BMJ. 2001;323(7318):908–911.
- . Reengineering hospital discharge: a protocol to improve patient safety, reduce costs, and boost patient satisfaction. Am J Med Qual. 2009;24(4):344–346.
- , , , , . Relationship between patient satisfaction with inpatient care and hospital readmission within 30 days. Am J Manag Care. 2011;17(1):41–48.
- , , , . Patients' perception of hospital care in the United States. N Engl J Med. 2008;359(18):1921–1931.
- , , . Enhanced support for shared decision making reduced costs of care for patients with preference‐sensitive conditions. Health Aff (Millwood). 2013;32(2):285–293.
- Centers for Medicare and Medicaid Services. Medicare program; hospital inpatient value‐based purchasing program. Final rule. Fed Regist. 2011;76(88):26490–26547.
- Centers for Medicare and Medicaid Services. CMS begins implementation of key payment legislation. Available at: https://www.cms.gov/Newsroom/MediaReleaseDatabase/Press‐releases/2015‐Press‐releases‐items/2015‐07‐08.html. Published July 8, 2015.
- , , , et al. A web‐based, patient‐centered toolkit to engage patients and caregivers in the acute care setting: a preliminary evaluation [published online August 2, 2015]. J Am Med Informatics Assoc. doi: 10.1093/jamia/ocv093.
- , , , et al. Effectiveness trial of an intensive communication structure for families of long‐stay ICU patients. Chest. 2010;138(6):1340–1348.
- , , , . Understanding goals of care statements and preferences among patients and their surrogates in the medical ICU. J Hosp Palliat Nurs. 2012;14(2):126–132.
- , , , . Goals of care among hospitalized patients: a validation study. Am J Hosp Palliat Care. 2011;28(5):335–341.
- , , , et al. Factors associated with use of cardiopulmonary resuscitation in seriously ill hospitalized adults. JAMA. 1999;282(24):2333–2339.
- , , , , . End‐of‐life discussions, goal attainment, and distress at the end of life: Predictors and outcomes of receipt of care consistent with preferences. J Clin Oncol. 2010;28(7):1203–1208.
- , . Reasons why physicians do not have discussions about poor prognosis, why it matters, and what can be improved. J Clin Oncol. 2012;30(22):2715–2717.
- , , , et al. Associations between end‐of‐life discussions, patient mental health, medical care near death, and caregiver bereavement adjustment. JAMA. 2008;300(14):1665–1673.
- , , , . Prior advance care planning is associated with less decisional conflict among surrogates for critically ill patients. Ann Am Thorac Soc. 2015;12(10):1528–1533.
- , , , et al. Hospitalized patients' understanding of their plan of care. Mayo Clin Proc. 2010;85(1):47–52.
- , , , et al. Discordance in perceived needs between patients and physicians in oncology practice: a nationwide survey in Korea. J Clin Oncol. 2011;29(33):4424–4429.
- , , , , , . Leveraging standards to support patient‐centric interdisciplinary plans of care. AMIA Annu Symp Proc. 2011;2011:356–363.
- , . Discordance between physician and patient self‐rated health and all‐cause mortality. Ochsner J. 2011;11(3):232–240.
- , , , , , . Determinants of discordance between patients and physicians in their assessment of lupus disease activity. J Rheumatol. 2003;30(9):1967–1976.
- , , , , , . Predictors of discordance between physicians' and patients' appraisals of health‐related quality of life in atrial fibrillation patients: Findings from the Angiotensin II Antagonist in Paroxysmal Atrial Fibrillation Trial. Am Heart J. 2013;166(3):589–596.
- , , , et al. Uncovering the blind spot of patient satisfaction: an international survey. BMJ Qual Saf. 2011;20(11):959–965.
- , , , , , . Improving teamwork: impact of structured interdisciplinary rounds on a hospitalist unit. J Hosp Med. 2011;6(2):88–93.
- , , , . Discrepancies between patient and physician estimates for the success of stem cell transplantation. JAMA. 2001;285(8):1034–1038.
- , , , , , . Optimistic expectations and survival after hematopoietic stem cell transplantation. Biol Blood Marrow Transplant. 2003;9(6):389–396.
- , , , et al. Development of the Serious Illness Care Program: a randomised controlled trial of a palliative care communication intervention. BMJ Open. 2015;5(10):e009032.
- , , , et al. Patterns of nurse‐physician communication and agreement on the plan of care. Qual Saf Health Care. 2010;19(3):195–199.
- , , , et al. Impact of localizing physicians to hospital units on nurse‐physician communication and agreement on the plan of care. J Gen Intern Med. 2009;24(11):1223–1227.
- , , , et al. Changes in medical errors after implementation of a handoff program. N Engl J Med. 2014;371(19):1803–1812.
- , , , et al. Reorganizing a hospital ward as an accountable care unit. J Hosp Med. 2015;10(1):36–40.
- , , , . Interdisciplinary teamwork in hospitals: a review and practical recommendations for improvement. J Hosp Med. 2012;7(1):48–54.
- , , , , . An evaluation of mobile health application tools. JMIR mHealth uHealth. 2014;2(2):e19.
Discharge Preparedness and Readmission
In recent years, US hospitals have focused on decreasing readmission rates, incented by reimbursement penalties to hospitals having excessive readmissions.[1] Gaps in the quality of care provided during transitions likely contribute to preventable readmissions.[2] One compelling quality assessment in this setting is measuring patients' discharge preparedness, using key dimensions such as understanding their instructions for medication use and follow‐up. Patient‐reported preparedness for discharge may also be useful to identify risk of readmission.
Several patient‐reported measures of preparedness for discharge exist, and herein we describe 2 measures of interest. First, the Brief‐PREPARED (B‐PREPARED) measure was derived from the longer PREPARED instrument (Prescriptions, Ready to re‐enter community, Education, Placement, Assurance of safety, Realistic expectations, Empowerment, Directed to appropriate services), which reflects the patient's perceived needs at discharge. In previous research, the B‐PREPARED measure predicted emergency department (ED) visits for patients who had been recently hospitalized and had a high risk for readmission.[3] Second, the Care Transitions Measure‐3 (CTM‐3) was developed by Coleman et al. as a patient‐reported measure to discriminate between patients who were more likely to have an ED visit or readmission from those who did not. CTM‐3 has also been used to evaluate hospitals' level of care coordination and for public reporting purposes.[4, 5, 6] It has been endorsed by the National Quality Forum and incorporated into the Hospital Consumer Assessment of Healthcare Providers and Systems (HCAHPS) survey provided to samples of recently hospitalized US patients.[7] However, recent evidence from an inpatient cohort of cardiovascular patients suggests the CTM‐3 overinflates care transition scores compared to the longer 15‐item CTM. In that cohort, the CTM‐3 could not differentiate between patients who did or did not have repeat ED visits or readmission.[8] Thus far, the B‐PREPARED and CTM‐3 measures have not been compared to one another directly.
In addition to the development of patient‐reported measures, hospitals increasingly employ administrative algorithms to predict likelihood of readmission.[9] A commonly used measure is the LACE index (Length of stay, Acuity, Comorbidity, and Emergency department use).[10] The LACE index predicted readmission and death within 30 days of discharge in a large cohort in Canada. In 2 retrospective studies of recently hospitalized patients in the United States, the LACE index's ability to discriminate between patients readmitted or not ranged from slightly better than chance to moderate (C statistic 0.56‐0.77).[11, 12]
It is unknown whether adding patient‐reported preparedness measures to commonly used readmission prediction scores increases the ability to predict readmission risk. We sought to determine whether the B‐PREPARED and CTM‐3 measures were predictive of readmission or death, as compared to the LACE index, in a large cohort of cardiovascular patients. In addition, we sought to determine the additional predictive and discriminative ability gained from administering the B‐PREPARED and CTM‐3 measures, while adjusting for the LACE index and other clinical factors. We hypothesized that: (1) higher preparedness scores on both measures would predict lower risk of readmission or death in a cohort of patients hospitalized with cardiac diagnoses; and (2) because it provides more specific and actionable information, the B‐PREPARED would discriminate readmission more accurately than CTM‐3, after controlling for clinical factors.
METHODS
Study Setting and Design
The Vanderbilt Inpatient Cohort Study (VICS) is a prospective study of patients admitted with cardiovascular disease to Vanderbilt University Hospital. The purpose of VICS is to investigate the impact of patient and social factors on postdischarge health outcomes such as quality of life, unplanned hospital utilization, and mortality. The rationale and design of VICS are detailed elsewhere.[13] Briefly, participants completed a baseline interview while hospitalized, and follow‐up phone calls were conducted within 2 to 9 days and at approximately 30 and 90 days postdischarge. During the first follow‐up call conducted by research assistants, we collected preparedness for discharge data utilizing the 2 measures described below. After the 90‐day phone call, we collected healthcare utilization since the index admission. The study was approved by the Vanderbilt University Institutional Review Board.
Patients
Eligibility screening shortly after admission identified patients with acute decompensated heart failure (ADHF) and/or an intermediate or high likelihood of acute coronary syndrome (ACS) per a physician's review of the clinical record. Exclusion criteria included: age 18 years, non‐English speaker, unstable psychiatric illness, delirium, low likelihood of follow‐up (eg, no reliable telephone number), on hospice, or otherwise too ill to complete an interview. To be included in these analyses, patients must have completed the preparedness for discharge measurements during the first follow‐up call. Patients who died before discharge or before completing the follow‐up call were excluded.
Preparedness for Discharge Measures (Patient‐Reported Data)
Preparedness for discharge was assessed using the 11‐item B‐PREPARED and the 3‐item CTM‐3.
The B‐PREPARED measures how prepared patients felt leaving the hospital with regard to: self‐care information for medications and activity, equipment/community services needed, and confidence in managing one's health after hospitalization. The B‐PREPARED measure has good internal consistency reliability (Cronbach's = 0.76) and has been validated in patients of varying age within a week of discharge. Preparedness is the sum of responses to all 11 questions, with a range of 0 to 22. Higher scores reflect increased preparedness for discharge.[3]
The CTM‐3 asks patients to rate how well their preferences were considered regarding transitional needs, as well as their understanding of postdischarge self‐management and the purpose of their medications, each on a 4‐point response scale (strongly disagree to strongly agree). The sum of the 3 responses quantifies the patient's perception of the quality of the care transition at discharge (Cronbach's = 0.86,[14] 0.92 in a cohort similar to ours[8]). Scores range from 3 to 12, with higher score indicating more preparedness. Then, the sum is transformed to a 0 to 100 scale.[15]
Clinical Readmission Risk Measures (Medical Record Data)
The LACE index, published by Van Walraven et al.,[10] takes into account 4 categories of clinical data: length of hospital stay, acuity of event, comorbidities, and ED visits in the prior 6 months. More specifically, a diagnostic code‐based, modified version of the Charlson Comorbidity Index was used to calculate the comorbidity score. These clinical criteria were obtained from an administrative database and weighted according to the methods used by Van Walraven et al. An overall score was calculated on a scale of 0 to 19, with higher scores indicating higher risk of readmission or death within 30 days.
From medical records, we also collected patients' demographic data including age, race, and gender, and diagnosis of ACS, ADHF, or both at hospital admission.
Outcome Measures
Healthcare utilization data were obtained from the index hospital as well as outside facilities. The electronic medical records from Vanderbilt University Hospital provided information about healthcare utilization at Vanderbilt 90 days after initial discharge. We also used Vanderbilt records to see if patients were transferred to Vanderbilt from other hospitals or if patients visited other hospitals before or after enrollment. We supplemented this with patient self‐report during the follow‐up telephone calls (at 30 and 90 days after initial discharge) so that any additional ED and hospital visits could be captured. Mortality data were collected from medical records, Social Security data, and family reports. The main outcome was time to first unplanned hospital readmission or death within 30 and 90 days of discharge.
Analysis
To describe our sample, we summarized categorical variables with percentages and continuous variables with percentiles. To test for evidence of unadjusted covariate‐outcome relationships, we used Pearson 2 and Wilcoxon rank sum tests for categorical and continuous covariates, respectively.
For the primary analyses we used Cox proportional hazard models to examine the independent associations between the prespecified predictors for patient‐reported preparedness and time to first unplanned readmission or death within 30 and 90 days of discharge. For each outcome (30‐ and 90‐day readmission or death), we fit marginal models separately for each of the B‐PREPARED, CTM‐3, and LACE scores. We then fit multivariable models that used both preparedness measures as well as age, gender, race, and diagnosis (ADHF and/or ACS), variables available to clinicians when patients are admitted. When fitting the multivariable models, we did not find strong evidence of nonlinear effects; therefore, only linear effects are reported. To facilitate comparison of effects, we scaled continuous variables by their interquartile range (IQR). The associated, exponentiated regression parameter estimates may therefore be interpreted as hazard ratios for readmission or death per IQR change in each predictor. In addition to parameter estimation, we computed the C index to evaluate capacity for the model to discriminate those who were and were not readmitted or died. All analyses were conducted in R version 3.1.2 (R Foundation for Statistical Computing, Vienna, Austria).
RESULTS
From the cohort of 1239 patients (Figure 1), 64%, 28%, and 7% of patients were hospitalized with ACS, ADHF, or both, respectively (Table 1). Nearly 45% of patients were female, 83% were white, and the median age was 61 years (IQR 5269). The median length of stay was 3 days (IQR 25). The median preparedness scores were high for both B‐PREPARED (21, IQR 1822) and CTM‐3 (77.8, IQR 66.7100). A total of 211 (17%) and 380 (31%) were readmitted or died within 30 and 90 days, respectively. The completion rate for the postdischarge phone calls was 88%.
| Death or Readmission Within 30 Days | Death or Readmission Within 90 Days | |||||
|---|---|---|---|---|---|---|
| Not Readmitted, N = 1028 | Death/Readmitted, N = 211 | P Value | Not Readmitted, N = 859 | Death/Readmitted, N = 380 | P Value | |
| ||||||
| Gender, male | 55.8% (574) | 53.1% (112) | 0.463* | 56.3% (484) | 53.2% (202) | 0.298* |
| Female | 44.2% (454) | 46.9% (99) | 43.7% (375) | 46.8% (178) | ||
| Race, white | 83.9% (860) | 80.6% (170) | 0.237* | 86.0% (737) | 77.3% (293) | 0.001* |
| Race, nonwhite | 16.1% (165) | 19.4% (41) | 14.0% (120) | 22.7% (86) | ||
| Diagnosis ACS | 68.0% (699) | 46.4% (98) | 0.001* | 72.9% (626) | 45.0% (171) | 0.001* |
| ADHF | 24.8% (255) | 46.0% (97) | 20.3% (174) | 46.8% (178) | ||
| Both | 7.2% (74) | 7.6% (16) | 6.9% (59) | 8.2% (31) | ||
| Age | 39.4:52:61:68:80 | 37.5:53.5:62:70:82 | 0.301 | 40:52:61:68:80 | 38:52:61 :70:82 | 0.651 |
| LOS | 1:2:3:5:10 | 1:3: 4:7.5:17 | 0.001 | 1:2:3:5:9 | 1:3:4:7:15 | 0.001 |
| CTM‐3 | 55.6:66.7: 77.8:100:100 | 55.6:66.7:77.8:100 :100 | 0.305 | 55.6:66.7:88.9:100:100 | 55.6:66.7:77.8:100 :100 | 0.080 |
| B‐PREPARED | 12:18:21:22.:22 | 10:17:20:22:22 | 0.066 | 12:18:21:22:22 | 10:17:20 :22:22 | 0.030 |
| LACE | 1:4: 7:10 :14 | 3.5:7:10:13:17 | 0.001 | 1:4:6: 9:14 | 3:7:10:13:16 | 0.001 |

B‐PREPARED and CTM‐3 were moderately correlated with one another (Spearman's = 0.40, P 0.001). In bivariate analyses (Table 1), the association between B‐PREPARED and readmission or death was significant at 90 days (P = 0.030) but not 30 days. The CTM‐3 showed no significant association with readmission or death at either time point. The LACE score was significantly associated with rates of readmission at 30 and 90 days (P 0.001).
Outcomes Within 30 Days of Discharge
When examining readmission or death within 30 days of discharge, simple unadjusted models 2 and 3 showed that the B‐PREPARED and LACE scores, respectively, were each significantly associated with time to first readmission or death (Table 2). Specifically, a 4‐point increase in the B‐PREPARED score was associated with a 16% decrease in the hazard of readmission or death (hazard ratio [HR] = 0.84, 95% confidence interval [CI]: 0.72 to 0.97). A 5‐point increase in the LACE score was associated with a 100% increase in the hazard of readmission or death (HR = 2.00, 95% CI: 1.72 to 2.32). In the multivariable model with both preparedness scores and diagnosis (model 4), the B‐PREPARED score (HR = 0.82, 95% CI: 0.70 to 0.97) was significantly associated with time to first readmission or death. In the full 30‐day model including B‐PREPARED, CTM‐3, LACE, age, gender, race, and diagnosis (model 5), only the LACE score (HR = 1.83, 95% CI: 1.54 to 2.18) was independently associated with time to readmission or death. Finally, the CTM‐3 did not predict 30‐day readmission or death in any of the models tested.
| Models | HR (95% CI)* | P Value | C Index |
|---|---|---|---|
| |||
| 1. CTM (per 10‐point change) | 0.95 (0.88 to 1.03) | 0.257 | 0.523 |
| 2. B‐PREPARED (per 4‐point change) | 0.84 (0.72 to 0.97) | 0.017 | 0.537 |
| 3. LACE (per 5‐point change) | 2.00 (1.72 to 2.32) | 0.001 | 0.679 |
| 4. CTM (per 10‐point change) | 1.00 (0.92 to 1.10) | 0.935 | 0.620 |
| B‐PREPARED (per 4‐point change) | 0.82 (0.70 to 0.97) | 0.019 | |
| ADHF only (vs ACS only) | 2.46 (1.86 to 3.26) | 0.001 | |
| ADHF and ACS (vs ACS only) | 1.42 (0.84 to 2.42) | 0.191 | |
| 5. CTM (per 10‐point change) | 1.02 (0.93 to 1.11) | 0.722 | 0.692 |
| B‐PREPARED (per 4 point change) | 0.87 (0.74 to 1.03) | 0.106 | |
| LACE (per 5‐point change) | 1.83 (1.54 to 2.18) | 0.001 | |
| ADHF only (vs ACS only) | 1.51 (1.10 to 2.08) | 0.010 | |
| ADHF and ACS (vs ACS only) | 0.90 (0.52 to 1.55) | 0.690 | |
| Age (per 10‐year change) | 1.02 (0.92 to 1.14) | 0.669 | |
| Female (vs male) | 1.11 (0.85 to 1.46) | 0.438 | |
| Nonwhite (vs white) | 0.92 (0.64 to 1.30) | 0.624 | |
Outcomes Within 90 Days of Discharge
At 90 days after discharge, again the separate unadjusted models 2 and 3 demonstrated that the B‐PREPARED and LACE scores, respectively, were each significantly associated with time to first readmission or death, whereas the CTM‐3 model only showed marginal significance (Table 3). In the multivariable model with both preparedness scores and diagnosis (model 4), results were similar to 30 days as the B‐PREPARED score was significantly associated with time to first readmission or death. Lastly, in the full model (model 5) at 90 days, again the LACE score was significantly associated with time to first readmission or death. In addition, B‐PREPARED scores were associated with a significant decrease in risk of readmission or death (HR = 0.88, 95% CI: 0.78 to 1.00); CTM‐3 scores were not independently associated with outcomes.
| Model | HR (95% CI)* | P Value | C Index |
|---|---|---|---|
| |||
| 1. CTM (per 10‐point change) | 0.94 (0.89 to 1.00) | 0.051 | 0.526 |
| 2. B‐PREPARED (per 4‐point change) | 0.84 (0.75 to 0.94) | 0.002 | 0.533 |
| 3. LACE (per 5‐point change) | 2.03 (1.82 to 2.27) | 0.001 | 0.683 |
| 4. CTM (per 10‐point change) | 0.99 (0.93 to 1.06) | 0.759 | 0.640 |
| B‐PREPARED (per 4‐point change) | 0.83 (0.74 to 0.94) | 0.003 | |
| ADHF only (vs ACS only) | 2.88 (2.33 to 3.56) | 0.001 | |
| ADHF and ACS (vs ACS only) | 1.62 (1.11 to 2.38) | 0.013 | |
| 5. CTM (per 10‐point change) | 1.00 (0.94 to 1.07) | 0.932 | 0.698 |
| B‐PREPARED (per 4‐point change) | 0.88 (0.78 to 1.00) | 0.043 | |
| LACE (per 5‐point change) | 1.76 (1.55 to 2.00) | 0.001 | |
| ADHF only (vs ACS only) | 1.76 (1.39 to 2.24) | 0.001 | |
| ADHF and ACS (vs ACS only) | 1.00 (0.67 to 1.50) | 0.980 | |
| Age (per 10‐year change) | 1.00 (0.93 to 1.09) | 0.894 | |
| Female (vs male) | 1.10 (0.90 to 1.35) | 0.341 | |
| Nonwhite (vs white) | 1.14 (0.89 to 1.47) | 0.288 | |
Tables 2 and 3 also display the C indices, or the discriminative ability of the models to differentiate whether or not a patient was readmitted or died. The range of the C index is 0.5 to 1, where values closer to 0.5 indicate random predictions and values closer to 1 indicate perfect prediction. At 30 days, the individual C indices for B‐PREPARED and CTM‐3 were only slightly better than chance (0.54 and 0.52, respectively) in their discriminative abilities. However, the C indices for the LACE score alone (0.68) and the multivariable model (0.69) including all 3 measures (ie, B‐PREPARED, CTM‐3, LACE), and clinical and demographic variables, had higher utility in discriminating patients who were readmitted/died or not. The 90‐day C indices were comparable in magnitude to those at 30 days.
DISCUSSION/CONCLUSION
In this cohort of patients hospitalized with cardiovascular disease, we compared 2 patient‐reported measures of preparedness for discharge, their association with time to death or readmission at 30 and 90 days, and their ability to discriminate patients who were or were not readmitted or died. Higher preparedness as measured by higher B‐PREPARED scores was associated with lower risk of readmission or death at 30 and 90 days after discharge in unadjusted models, and at 90 days in adjusted models. CTM‐3 was not associated with the outcome in any analyses. Lastly, the individual preparedness measures were not as strongly associated with readmission or death compared to the LACE readmission index alone.
How do our findings relate to the measurement of care transition quality? We consider 2 scenarios. First, if hospitals utilize the LACE index to predict readmission, then neither self‐reported measure of preparedness adds meaningfully to its predictive ability. However, hospital management may still find the B‐PREPARED and CTM‐3 useful as a means to direct care transition quality‐improvement efforts. These measures can instruct hospitals as to what areas their patients express the greatest difficulty or lack of preparedness and closely attend to patient needs with appropriate resources. Furthermore, the patient's perception of being prepared for discharge may be different than their actual preparedness. Their perceived preparedness may be affected by cognitive impairment, dissatisfaction with medical care, depression, lower health‐related quality of life, and lower educational attainment as demonstrated by Lau et al.[16] If a patient's perception of preparedness were low, it would behoove the clinician to investigate these other issues and address those that are mutable. Additionally, perceived preparedness may not correlate with the patient's understanding of their medical conditions, so it is imperative that clinicians provide prospective guidance about their probable postdischarge trajectory. If hospitals are not utilizing the LACE index, then perhaps using the B‐PREPARED, but not the CTM‐3, may be beneficial for predicting readmission.
How do our results fit with evidence from prior studies, and what do they mean in the context of care transitions quality? First, in the psychometric evaluation of the B‐PREPARED measure in a cohort of recently hospitalized patients, the mean score was 17.3, lower than the median of 21 in our cohort.[3] Numerous studies have utilized the CTM‐3 and the longer‐version CTM‐15. Though we cannot make a direct comparison, the median in our cohort (77.8) was on par with the means from other studies, which ranged from 63 to 82.[5, 17, 18, 19] Several studies also note ceiling effects with clusters of scores at the upper end of the scale, as did we. We conjecture that our cohort's preparedness scores may be higher because our institution has made concerted efforts to improve the discharge education for cardiovascular patients.
In a comparable patient population, the TRACE‐CORE (Transitions, Risks, and Actions in Coronary Events Center for Outcomes Research and Education) study is a cohort of more than 2200 patients with ACS who were administered the CTM‐15 within 1 month of discharge.[8] In that study, the median CTM‐15 score was 66.6, which is lower than our cohort. With regard to the predictive ability of the CTM‐3, they note that CTM‐3 scores did not differentiate between patients who were or were not readmitted or had emergency department visits. Our results support their concern that the CTM‐15 and by extension the CTM‐3, though adopted widely as part of HCAHPS, may not have sufficient ability to discriminate differences in patient outcomes or the quality of care transitions.
More recently, patient‐reported preparedness for discharge was assessed in a prospective cohort in Canada.[16] Lau et al. administered a single‐item measure of readiness at the time of discharge to general medicine patients, and found that lower readiness scores were also not associated with readmission or death at 30 days, when adjusted for the LACE index as we did.
We must acknowledge the limitations of our findings. First, our sample of recently discharged patients with cardiovascular disease is different than the community‐dwelling, underserved Americans hospitalized in the prior year, which served as the sample for reducing the CTM‐15 to 3 items.[5] This fact may explain why we did not find the CTM‐3 to be associated with readmission in our sample. Second, our analyses did not include extensive adjustment for patient‐related factors. Rather, our intention was to see how well the preparedness measures performed independently and compare their abilities to predict readmission, which is particularly relevant for clinicians who may not have all possible covariates in predicting readmission. Finally, because we limited the analyses to the patients who completed the B‐PREPARED and CTM‐3 measures (88% completion rate), we may not have data for: (1) very ill patients, who had a higher risk of readmission and least prepared, and were not able to answer the postdischarge phone call; and (2) very functional patients, who had a lower risk of readmission and were too busy to answer the postdischarge phone call. This may have limited the extremes in the spectrum of our sample.
Importantly, our study has several strengths. We report on the largest sample to date with results of both B‐PREPARED and CTM‐3. Moreover, we examined how these measures compared to a widely used readmission prediction tool, the LACE index. We had very high postdischarge phone call completion rates in the week following discharge. Furthermore, we had thorough assessment of readmission data through patient report, electronic medical record documentation, and collection of outside medical records.
Further research is needed to elucidate: (1) the ideal administration time of the patient‐reported measures of preparedness (before or after discharge), and (2) the challenges to the implementation of measures in healthcare systems. Remaining research questions center on the tradeoffs and barriers to implementing a longer measure like the 11‐item B‐PREPARED compared to a shorter measure like the CTM‐3. We do not know whether longer measures preclude their use by busy clinicians, though it provides more specific information about what patients feel they need at hospital discharge. Additionally, studies need to demonstrate the mutability of preparedness and the response of measures to interventions designed to improve the hospital discharge process.
In our sample of recently hospitalized cardiovascular patients, there was a statistically significant association between patient‐reported preparedness for discharged, as measured by B‐PREPARED, and readmissions/death at 30 and 90 days, but the magnitude of the association was very small. Furthermore, another patient‐reported preparedness measure, CTM‐3, was not associated with readmissions or death at either 30 or 90 days. Lastly, neither measure discriminated well between patients who were readmitted or not, and neither measure added meaningfully to the LACE index in terms of predicting 30‐ or 90‐day readmissions.
Disclosures
This study was supported by grant R01 HL109388 from the National Heart, Lung, and Blood Institute (Dr. Kripalani) and in part by grant UL1 RR024975‐01 from the National Center for Research Resources, and grant 2 UL1 TR000445‐06 from the National Center for Advancing Translational Sciences. Dr. Kripalani is a consultant to SAI Interactive and holds equity in Bioscape Digital, and is a consultant to and holds equity in PictureRx, LLC. Dr. Bell is supported by the National Institutes of Health (K23AG048347) and by the Eisenstein Women's Heart Fund. Dr. Vasilevskis is supported by the National Institutes of Health (K23AG040157) and the Geriatric Research, Education and Clinical Center. Dr. Mixon is a Veterans Affairs Health Services Research and Development Service Career Development awardee (12‐168) at the Nashville Department of Veterans Affairs. The content is solely the responsibility of the authors and does not necessarily represent the official views of the National Institutes of Health. The funding agency was not involved in the design and conduct of the study; collection, management, analysis, and interpretation of the data; and preparation, review, or approval of the manuscript. All authors had full access to all study data and had a significant role in writing the manuscript. The contents do not represent the views of the US Department of Veterans Affairs or the United States government. Dr. Kripalani is a consultant to and holds equity in PictureRx, LLC.
- Centers for Medicare 9(9):598–603.
- , , . Brief scale measuring patient preparedness for hospital discharge to home: psychometric properties. J Hosp Med. 2008;3(6):446–454.
- , , . Assessing the quality of preparation for posthospital care from the patient's perspective: the care transitions measure. Med Care. 2005;43(3):246–255.
- , , , . Assessing the quality of transitional care: further applications of the care transitions measure. Med Care. 2008;46(3):317–322.
- , , , , . The central role of performance measurement in improving the quality of transitional care. Home Health Care Serv Q. 2007;26(4):93–104.
- Centers for Medicare 3:e001053.
- , , , et al. Risk prediction models for hospital readmission: a systematic review. JAMA. 2011;306(15):1688–1698.
- , , , et al. Derivation and validation of an index to predict early death or unplanned readmission after discharge from hospital to the community. CMAJ. 2010;182(6):551–557.
- , , , et al. Using the LACE index to predict hospital readmissions in congestive heart failure patients. BMC Cardiovasc Disord. 2014;14:97.
- , , , . Validation of a predictive model to identify patients at high risk for hospital readmission. J Healthc Qual. 2016;38(1):34–41.
- , , , et al. Determinants of health after hospital discharge: rationale and design of the Vanderbilt Inpatient Cohort Study (VICS). BMC Health Serv Res. 2014;14:10.
- . CTM frequently asked questions. Available at: http://caretransitions.org/tools-and-resources/. Accessed January 22, 2016.
- . Instructions for scoring the CTM‐3. Available at: http://caretransitions.org/tools-and-resources/. Accessed January 22, 2016.
- , , , et al. Patient‐reported discharge readiness and 30‐day risk of readmission or death: a prospective cohort study. Am J Med. 2016;129:89–95.
- , , , , . Implementaiton of the Care Transitions Intervention: sustainability and lessons learned. Prof Case Manag. 2009;14(6):282–293.
- , , , . The care transitions innovation (C‐TraIn) for socioeconomically disadvantaged adults: results of a cluster randomized controlled trial. J Gen Intern Med. 2014;29(11):1460–1467.
- , , , et al. Telephone calls to patients after discharge from the hospital: an important part of transitions of care. Med Educ Online. 2015;29(20):26701.
In recent years, US hospitals have focused on decreasing readmission rates, incented by reimbursement penalties to hospitals having excessive readmissions.[1] Gaps in the quality of care provided during transitions likely contribute to preventable readmissions.[2] One compelling quality assessment in this setting is measuring patients' discharge preparedness, using key dimensions such as understanding their instructions for medication use and follow‐up. Patient‐reported preparedness for discharge may also be useful to identify risk of readmission.
Several patient‐reported measures of preparedness for discharge exist, and herein we describe 2 measures of interest. First, the Brief‐PREPARED (B‐PREPARED) measure was derived from the longer PREPARED instrument (Prescriptions, Ready to re‐enter community, Education, Placement, Assurance of safety, Realistic expectations, Empowerment, Directed to appropriate services), which reflects the patient's perceived needs at discharge. In previous research, the B‐PREPARED measure predicted emergency department (ED) visits for patients who had been recently hospitalized and had a high risk for readmission.[3] Second, the Care Transitions Measure‐3 (CTM‐3) was developed by Coleman et al. as a patient‐reported measure to discriminate between patients who were more likely to have an ED visit or readmission from those who did not. CTM‐3 has also been used to evaluate hospitals' level of care coordination and for public reporting purposes.[4, 5, 6] It has been endorsed by the National Quality Forum and incorporated into the Hospital Consumer Assessment of Healthcare Providers and Systems (HCAHPS) survey provided to samples of recently hospitalized US patients.[7] However, recent evidence from an inpatient cohort of cardiovascular patients suggests the CTM‐3 overinflates care transition scores compared to the longer 15‐item CTM. In that cohort, the CTM‐3 could not differentiate between patients who did or did not have repeat ED visits or readmission.[8] Thus far, the B‐PREPARED and CTM‐3 measures have not been compared to one another directly.
In addition to the development of patient‐reported measures, hospitals increasingly employ administrative algorithms to predict likelihood of readmission.[9] A commonly used measure is the LACE index (Length of stay, Acuity, Comorbidity, and Emergency department use).[10] The LACE index predicted readmission and death within 30 days of discharge in a large cohort in Canada. In 2 retrospective studies of recently hospitalized patients in the United States, the LACE index's ability to discriminate between patients readmitted or not ranged from slightly better than chance to moderate (C statistic 0.56‐0.77).[11, 12]
It is unknown whether adding patient‐reported preparedness measures to commonly used readmission prediction scores increases the ability to predict readmission risk. We sought to determine whether the B‐PREPARED and CTM‐3 measures were predictive of readmission or death, as compared to the LACE index, in a large cohort of cardiovascular patients. In addition, we sought to determine the additional predictive and discriminative ability gained from administering the B‐PREPARED and CTM‐3 measures, while adjusting for the LACE index and other clinical factors. We hypothesized that: (1) higher preparedness scores on both measures would predict lower risk of readmission or death in a cohort of patients hospitalized with cardiac diagnoses; and (2) because it provides more specific and actionable information, the B‐PREPARED would discriminate readmission more accurately than CTM‐3, after controlling for clinical factors.
METHODS
Study Setting and Design
The Vanderbilt Inpatient Cohort Study (VICS) is a prospective study of patients admitted with cardiovascular disease to Vanderbilt University Hospital. The purpose of VICS is to investigate the impact of patient and social factors on postdischarge health outcomes such as quality of life, unplanned hospital utilization, and mortality. The rationale and design of VICS are detailed elsewhere.[13] Briefly, participants completed a baseline interview while hospitalized, and follow‐up phone calls were conducted within 2 to 9 days and at approximately 30 and 90 days postdischarge. During the first follow‐up call conducted by research assistants, we collected preparedness for discharge data utilizing the 2 measures described below. After the 90‐day phone call, we collected healthcare utilization since the index admission. The study was approved by the Vanderbilt University Institutional Review Board.
Patients
Eligibility screening shortly after admission identified patients with acute decompensated heart failure (ADHF) and/or an intermediate or high likelihood of acute coronary syndrome (ACS) per a physician's review of the clinical record. Exclusion criteria included: age 18 years, non‐English speaker, unstable psychiatric illness, delirium, low likelihood of follow‐up (eg, no reliable telephone number), on hospice, or otherwise too ill to complete an interview. To be included in these analyses, patients must have completed the preparedness for discharge measurements during the first follow‐up call. Patients who died before discharge or before completing the follow‐up call were excluded.
Preparedness for Discharge Measures (Patient‐Reported Data)
Preparedness for discharge was assessed using the 11‐item B‐PREPARED and the 3‐item CTM‐3.
The B‐PREPARED measures how prepared patients felt leaving the hospital with regard to: self‐care information for medications and activity, equipment/community services needed, and confidence in managing one's health after hospitalization. The B‐PREPARED measure has good internal consistency reliability (Cronbach's = 0.76) and has been validated in patients of varying age within a week of discharge. Preparedness is the sum of responses to all 11 questions, with a range of 0 to 22. Higher scores reflect increased preparedness for discharge.[3]
The CTM‐3 asks patients to rate how well their preferences were considered regarding transitional needs, as well as their understanding of postdischarge self‐management and the purpose of their medications, each on a 4‐point response scale (strongly disagree to strongly agree). The sum of the 3 responses quantifies the patient's perception of the quality of the care transition at discharge (Cronbach's = 0.86,[14] 0.92 in a cohort similar to ours[8]). Scores range from 3 to 12, with higher score indicating more preparedness. Then, the sum is transformed to a 0 to 100 scale.[15]
Clinical Readmission Risk Measures (Medical Record Data)
The LACE index, published by Van Walraven et al.,[10] takes into account 4 categories of clinical data: length of hospital stay, acuity of event, comorbidities, and ED visits in the prior 6 months. More specifically, a diagnostic code‐based, modified version of the Charlson Comorbidity Index was used to calculate the comorbidity score. These clinical criteria were obtained from an administrative database and weighted according to the methods used by Van Walraven et al. An overall score was calculated on a scale of 0 to 19, with higher scores indicating higher risk of readmission or death within 30 days.
From medical records, we also collected patients' demographic data including age, race, and gender, and diagnosis of ACS, ADHF, or both at hospital admission.
Outcome Measures
Healthcare utilization data were obtained from the index hospital as well as outside facilities. The electronic medical records from Vanderbilt University Hospital provided information about healthcare utilization at Vanderbilt 90 days after initial discharge. We also used Vanderbilt records to see if patients were transferred to Vanderbilt from other hospitals or if patients visited other hospitals before or after enrollment. We supplemented this with patient self‐report during the follow‐up telephone calls (at 30 and 90 days after initial discharge) so that any additional ED and hospital visits could be captured. Mortality data were collected from medical records, Social Security data, and family reports. The main outcome was time to first unplanned hospital readmission or death within 30 and 90 days of discharge.
Analysis
To describe our sample, we summarized categorical variables with percentages and continuous variables with percentiles. To test for evidence of unadjusted covariate‐outcome relationships, we used Pearson 2 and Wilcoxon rank sum tests for categorical and continuous covariates, respectively.
For the primary analyses we used Cox proportional hazard models to examine the independent associations between the prespecified predictors for patient‐reported preparedness and time to first unplanned readmission or death within 30 and 90 days of discharge. For each outcome (30‐ and 90‐day readmission or death), we fit marginal models separately for each of the B‐PREPARED, CTM‐3, and LACE scores. We then fit multivariable models that used both preparedness measures as well as age, gender, race, and diagnosis (ADHF and/or ACS), variables available to clinicians when patients are admitted. When fitting the multivariable models, we did not find strong evidence of nonlinear effects; therefore, only linear effects are reported. To facilitate comparison of effects, we scaled continuous variables by their interquartile range (IQR). The associated, exponentiated regression parameter estimates may therefore be interpreted as hazard ratios for readmission or death per IQR change in each predictor. In addition to parameter estimation, we computed the C index to evaluate capacity for the model to discriminate those who were and were not readmitted or died. All analyses were conducted in R version 3.1.2 (R Foundation for Statistical Computing, Vienna, Austria).
RESULTS
From the cohort of 1239 patients (Figure 1), 64%, 28%, and 7% of patients were hospitalized with ACS, ADHF, or both, respectively (Table 1). Nearly 45% of patients were female, 83% were white, and the median age was 61 years (IQR 5269). The median length of stay was 3 days (IQR 25). The median preparedness scores were high for both B‐PREPARED (21, IQR 1822) and CTM‐3 (77.8, IQR 66.7100). A total of 211 (17%) and 380 (31%) were readmitted or died within 30 and 90 days, respectively. The completion rate for the postdischarge phone calls was 88%.
| Death or Readmission Within 30 Days | Death or Readmission Within 90 Days | |||||
|---|---|---|---|---|---|---|
| Not Readmitted, N = 1028 | Death/Readmitted, N = 211 | P Value | Not Readmitted, N = 859 | Death/Readmitted, N = 380 | P Value | |
| ||||||
| Gender, male | 55.8% (574) | 53.1% (112) | 0.463* | 56.3% (484) | 53.2% (202) | 0.298* |
| Female | 44.2% (454) | 46.9% (99) | 43.7% (375) | 46.8% (178) | ||
| Race, white | 83.9% (860) | 80.6% (170) | 0.237* | 86.0% (737) | 77.3% (293) | 0.001* |
| Race, nonwhite | 16.1% (165) | 19.4% (41) | 14.0% (120) | 22.7% (86) | ||
| Diagnosis ACS | 68.0% (699) | 46.4% (98) | 0.001* | 72.9% (626) | 45.0% (171) | 0.001* |
| ADHF | 24.8% (255) | 46.0% (97) | 20.3% (174) | 46.8% (178) | ||
| Both | 7.2% (74) | 7.6% (16) | 6.9% (59) | 8.2% (31) | ||
| Age | 39.4:52:61:68:80 | 37.5:53.5:62:70:82 | 0.301 | 40:52:61:68:80 | 38:52:61 :70:82 | 0.651 |
| LOS | 1:2:3:5:10 | 1:3: 4:7.5:17 | 0.001 | 1:2:3:5:9 | 1:3:4:7:15 | 0.001 |
| CTM‐3 | 55.6:66.7: 77.8:100:100 | 55.6:66.7:77.8:100 :100 | 0.305 | 55.6:66.7:88.9:100:100 | 55.6:66.7:77.8:100 :100 | 0.080 |
| B‐PREPARED | 12:18:21:22.:22 | 10:17:20:22:22 | 0.066 | 12:18:21:22:22 | 10:17:20 :22:22 | 0.030 |
| LACE | 1:4: 7:10 :14 | 3.5:7:10:13:17 | 0.001 | 1:4:6: 9:14 | 3:7:10:13:16 | 0.001 |
B‐PREPARED and CTM‐3 were moderately correlated with one another (Spearman's = 0.40, P 0.001). In bivariate analyses (Table 1), the association between B‐PREPARED and readmission or death was significant at 90 days (P = 0.030) but not 30 days. The CTM‐3 showed no significant association with readmission or death at either time point. The LACE score was significantly associated with rates of readmission at 30 and 90 days (P 0.001).
Outcomes Within 30 Days of Discharge
When examining readmission or death within 30 days of discharge, simple unadjusted models 2 and 3 showed that the B‐PREPARED and LACE scores, respectively, were each significantly associated with time to first readmission or death (Table 2). Specifically, a 4‐point increase in the B‐PREPARED score was associated with a 16% decrease in the hazard of readmission or death (hazard ratio [HR] = 0.84, 95% confidence interval [CI]: 0.72 to 0.97). A 5‐point increase in the LACE score was associated with a 100% increase in the hazard of readmission or death (HR = 2.00, 95% CI: 1.72 to 2.32). In the multivariable model with both preparedness scores and diagnosis (model 4), the B‐PREPARED score (HR = 0.82, 95% CI: 0.70 to 0.97) was significantly associated with time to first readmission or death. In the full 30‐day model including B‐PREPARED, CTM‐3, LACE, age, gender, race, and diagnosis (model 5), only the LACE score (HR = 1.83, 95% CI: 1.54 to 2.18) was independently associated with time to readmission or death. Finally, the CTM‐3 did not predict 30‐day readmission or death in any of the models tested.
| Models | HR (95% CI)* | P Value | C Index |
|---|---|---|---|
| |||
| 1. CTM (per 10‐point change) | 0.95 (0.88 to 1.03) | 0.257 | 0.523 |
| 2. B‐PREPARED (per 4‐point change) | 0.84 (0.72 to 0.97) | 0.017 | 0.537 |
| 3. LACE (per 5‐point change) | 2.00 (1.72 to 2.32) | 0.001 | 0.679 |
| 4. CTM (per 10‐point change) | 1.00 (0.92 to 1.10) | 0.935 | 0.620 |
| B‐PREPARED (per 4‐point change) | 0.82 (0.70 to 0.97) | 0.019 | |
| ADHF only (vs ACS only) | 2.46 (1.86 to 3.26) | 0.001 | |
| ADHF and ACS (vs ACS only) | 1.42 (0.84 to 2.42) | 0.191 | |
| 5. CTM (per 10‐point change) | 1.02 (0.93 to 1.11) | 0.722 | 0.692 |
| B‐PREPARED (per 4 point change) | 0.87 (0.74 to 1.03) | 0.106 | |
| LACE (per 5‐point change) | 1.83 (1.54 to 2.18) | 0.001 | |
| ADHF only (vs ACS only) | 1.51 (1.10 to 2.08) | 0.010 | |
| ADHF and ACS (vs ACS only) | 0.90 (0.52 to 1.55) | 0.690 | |
| Age (per 10‐year change) | 1.02 (0.92 to 1.14) | 0.669 | |
| Female (vs male) | 1.11 (0.85 to 1.46) | 0.438 | |
| Nonwhite (vs white) | 0.92 (0.64 to 1.30) | 0.624 | |
Outcomes Within 90 Days of Discharge
At 90 days after discharge, again the separate unadjusted models 2 and 3 demonstrated that the B‐PREPARED and LACE scores, respectively, were each significantly associated with time to first readmission or death, whereas the CTM‐3 model only showed marginal significance (Table 3). In the multivariable model with both preparedness scores and diagnosis (model 4), results were similar to 30 days as the B‐PREPARED score was significantly associated with time to first readmission or death. Lastly, in the full model (model 5) at 90 days, again the LACE score was significantly associated with time to first readmission or death. In addition, B‐PREPARED scores were associated with a significant decrease in risk of readmission or death (HR = 0.88, 95% CI: 0.78 to 1.00); CTM‐3 scores were not independently associated with outcomes.
| Model | HR (95% CI)* | P Value | C Index |
|---|---|---|---|
| |||
| 1. CTM (per 10‐point change) | 0.94 (0.89 to 1.00) | 0.051 | 0.526 |
| 2. B‐PREPARED (per 4‐point change) | 0.84 (0.75 to 0.94) | 0.002 | 0.533 |
| 3. LACE (per 5‐point change) | 2.03 (1.82 to 2.27) | 0.001 | 0.683 |
| 4. CTM (per 10‐point change) | 0.99 (0.93 to 1.06) | 0.759 | 0.640 |
| B‐PREPARED (per 4‐point change) | 0.83 (0.74 to 0.94) | 0.003 | |
| ADHF only (vs ACS only) | 2.88 (2.33 to 3.56) | 0.001 | |
| ADHF and ACS (vs ACS only) | 1.62 (1.11 to 2.38) | 0.013 | |
| 5. CTM (per 10‐point change) | 1.00 (0.94 to 1.07) | 0.932 | 0.698 |
| B‐PREPARED (per 4‐point change) | 0.88 (0.78 to 1.00) | 0.043 | |
| LACE (per 5‐point change) | 1.76 (1.55 to 2.00) | 0.001 | |
| ADHF only (vs ACS only) | 1.76 (1.39 to 2.24) | 0.001 | |
| ADHF and ACS (vs ACS only) | 1.00 (0.67 to 1.50) | 0.980 | |
| Age (per 10‐year change) | 1.00 (0.93 to 1.09) | 0.894 | |
| Female (vs male) | 1.10 (0.90 to 1.35) | 0.341 | |
| Nonwhite (vs white) | 1.14 (0.89 to 1.47) | 0.288 | |
Tables 2 and 3 also display the C indices, or the discriminative ability of the models to differentiate whether or not a patient was readmitted or died. The range of the C index is 0.5 to 1, where values closer to 0.5 indicate random predictions and values closer to 1 indicate perfect prediction. At 30 days, the individual C indices for B‐PREPARED and CTM‐3 were only slightly better than chance (0.54 and 0.52, respectively) in their discriminative abilities. However, the C indices for the LACE score alone (0.68) and the multivariable model (0.69) including all 3 measures (ie, B‐PREPARED, CTM‐3, LACE), and clinical and demographic variables, had higher utility in discriminating patients who were readmitted/died or not. The 90‐day C indices were comparable in magnitude to those at 30 days.
DISCUSSION/CONCLUSION
In this cohort of patients hospitalized with cardiovascular disease, we compared 2 patient‐reported measures of preparedness for discharge, their association with time to death or readmission at 30 and 90 days, and their ability to discriminate patients who were or were not readmitted or died. Higher preparedness as measured by higher B‐PREPARED scores was associated with lower risk of readmission or death at 30 and 90 days after discharge in unadjusted models, and at 90 days in adjusted models. CTM‐3 was not associated with the outcome in any analyses. Lastly, the individual preparedness measures were not as strongly associated with readmission or death compared to the LACE readmission index alone.
How do our findings relate to the measurement of care transition quality? We consider 2 scenarios. First, if hospitals utilize the LACE index to predict readmission, then neither self‐reported measure of preparedness adds meaningfully to its predictive ability. However, hospital management may still find the B‐PREPARED and CTM‐3 useful as a means to direct care transition quality‐improvement efforts. These measures can instruct hospitals as to what areas their patients express the greatest difficulty or lack of preparedness and closely attend to patient needs with appropriate resources. Furthermore, the patient's perception of being prepared for discharge may be different than their actual preparedness. Their perceived preparedness may be affected by cognitive impairment, dissatisfaction with medical care, depression, lower health‐related quality of life, and lower educational attainment as demonstrated by Lau et al.[16] If a patient's perception of preparedness were low, it would behoove the clinician to investigate these other issues and address those that are mutable. Additionally, perceived preparedness may not correlate with the patient's understanding of their medical conditions, so it is imperative that clinicians provide prospective guidance about their probable postdischarge trajectory. If hospitals are not utilizing the LACE index, then perhaps using the B‐PREPARED, but not the CTM‐3, may be beneficial for predicting readmission.
How do our results fit with evidence from prior studies, and what do they mean in the context of care transitions quality? First, in the psychometric evaluation of the B‐PREPARED measure in a cohort of recently hospitalized patients, the mean score was 17.3, lower than the median of 21 in our cohort.[3] Numerous studies have utilized the CTM‐3 and the longer‐version CTM‐15. Though we cannot make a direct comparison, the median in our cohort (77.8) was on par with the means from other studies, which ranged from 63 to 82.[5, 17, 18, 19] Several studies also note ceiling effects with clusters of scores at the upper end of the scale, as did we. We conjecture that our cohort's preparedness scores may be higher because our institution has made concerted efforts to improve the discharge education for cardiovascular patients.
In a comparable patient population, the TRACE‐CORE (Transitions, Risks, and Actions in Coronary Events Center for Outcomes Research and Education) study is a cohort of more than 2200 patients with ACS who were administered the CTM‐15 within 1 month of discharge.[8] In that study, the median CTM‐15 score was 66.6, which is lower than our cohort. With regard to the predictive ability of the CTM‐3, they note that CTM‐3 scores did not differentiate between patients who were or were not readmitted or had emergency department visits. Our results support their concern that the CTM‐15 and by extension the CTM‐3, though adopted widely as part of HCAHPS, may not have sufficient ability to discriminate differences in patient outcomes or the quality of care transitions.
More recently, patient‐reported preparedness for discharge was assessed in a prospective cohort in Canada.[16] Lau et al. administered a single‐item measure of readiness at the time of discharge to general medicine patients, and found that lower readiness scores were also not associated with readmission or death at 30 days, when adjusted for the LACE index as we did.
We must acknowledge the limitations of our findings. First, our sample of recently discharged patients with cardiovascular disease is different than the community‐dwelling, underserved Americans hospitalized in the prior year, which served as the sample for reducing the CTM‐15 to 3 items.[5] This fact may explain why we did not find the CTM‐3 to be associated with readmission in our sample. Second, our analyses did not include extensive adjustment for patient‐related factors. Rather, our intention was to see how well the preparedness measures performed independently and compare their abilities to predict readmission, which is particularly relevant for clinicians who may not have all possible covariates in predicting readmission. Finally, because we limited the analyses to the patients who completed the B‐PREPARED and CTM‐3 measures (88% completion rate), we may not have data for: (1) very ill patients, who had a higher risk of readmission and least prepared, and were not able to answer the postdischarge phone call; and (2) very functional patients, who had a lower risk of readmission and were too busy to answer the postdischarge phone call. This may have limited the extremes in the spectrum of our sample.
Importantly, our study has several strengths. We report on the largest sample to date with results of both B‐PREPARED and CTM‐3. Moreover, we examined how these measures compared to a widely used readmission prediction tool, the LACE index. We had very high postdischarge phone call completion rates in the week following discharge. Furthermore, we had thorough assessment of readmission data through patient report, electronic medical record documentation, and collection of outside medical records.
Further research is needed to elucidate: (1) the ideal administration time of the patient‐reported measures of preparedness (before or after discharge), and (2) the challenges to the implementation of measures in healthcare systems. Remaining research questions center on the tradeoffs and barriers to implementing a longer measure like the 11‐item B‐PREPARED compared to a shorter measure like the CTM‐3. We do not know whether longer measures preclude their use by busy clinicians, though it provides more specific information about what patients feel they need at hospital discharge. Additionally, studies need to demonstrate the mutability of preparedness and the response of measures to interventions designed to improve the hospital discharge process.
In our sample of recently hospitalized cardiovascular patients, there was a statistically significant association between patient‐reported preparedness for discharged, as measured by B‐PREPARED, and readmissions/death at 30 and 90 days, but the magnitude of the association was very small. Furthermore, another patient‐reported preparedness measure, CTM‐3, was not associated with readmissions or death at either 30 or 90 days. Lastly, neither measure discriminated well between patients who were readmitted or not, and neither measure added meaningfully to the LACE index in terms of predicting 30‐ or 90‐day readmissions.
Disclosures
This study was supported by grant R01 HL109388 from the National Heart, Lung, and Blood Institute (Dr. Kripalani) and in part by grant UL1 RR024975‐01 from the National Center for Research Resources, and grant 2 UL1 TR000445‐06 from the National Center for Advancing Translational Sciences. Dr. Kripalani is a consultant to SAI Interactive and holds equity in Bioscape Digital, and is a consultant to and holds equity in PictureRx, LLC. Dr. Bell is supported by the National Institutes of Health (K23AG048347) and by the Eisenstein Women's Heart Fund. Dr. Vasilevskis is supported by the National Institutes of Health (K23AG040157) and the Geriatric Research, Education and Clinical Center. Dr. Mixon is a Veterans Affairs Health Services Research and Development Service Career Development awardee (12‐168) at the Nashville Department of Veterans Affairs. The content is solely the responsibility of the authors and does not necessarily represent the official views of the National Institutes of Health. The funding agency was not involved in the design and conduct of the study; collection, management, analysis, and interpretation of the data; and preparation, review, or approval of the manuscript. All authors had full access to all study data and had a significant role in writing the manuscript. The contents do not represent the views of the US Department of Veterans Affairs or the United States government. Dr. Kripalani is a consultant to and holds equity in PictureRx, LLC.
In recent years, US hospitals have focused on decreasing readmission rates, incented by reimbursement penalties to hospitals having excessive readmissions.[1] Gaps in the quality of care provided during transitions likely contribute to preventable readmissions.[2] One compelling quality assessment in this setting is measuring patients' discharge preparedness, using key dimensions such as understanding their instructions for medication use and follow‐up. Patient‐reported preparedness for discharge may also be useful to identify risk of readmission.
Several patient‐reported measures of preparedness for discharge exist, and herein we describe 2 measures of interest. First, the Brief‐PREPARED (B‐PREPARED) measure was derived from the longer PREPARED instrument (Prescriptions, Ready to re‐enter community, Education, Placement, Assurance of safety, Realistic expectations, Empowerment, Directed to appropriate services), which reflects the patient's perceived needs at discharge. In previous research, the B‐PREPARED measure predicted emergency department (ED) visits for patients who had been recently hospitalized and had a high risk for readmission.[3] Second, the Care Transitions Measure‐3 (CTM‐3) was developed by Coleman et al. as a patient‐reported measure to discriminate between patients who were more likely to have an ED visit or readmission from those who did not. CTM‐3 has also been used to evaluate hospitals' level of care coordination and for public reporting purposes.[4, 5, 6] It has been endorsed by the National Quality Forum and incorporated into the Hospital Consumer Assessment of Healthcare Providers and Systems (HCAHPS) survey provided to samples of recently hospitalized US patients.[7] However, recent evidence from an inpatient cohort of cardiovascular patients suggests the CTM‐3 overinflates care transition scores compared to the longer 15‐item CTM. In that cohort, the CTM‐3 could not differentiate between patients who did or did not have repeat ED visits or readmission.[8] Thus far, the B‐PREPARED and CTM‐3 measures have not been compared to one another directly.
In addition to the development of patient‐reported measures, hospitals increasingly employ administrative algorithms to predict likelihood of readmission.[9] A commonly used measure is the LACE index (Length of stay, Acuity, Comorbidity, and Emergency department use).[10] The LACE index predicted readmission and death within 30 days of discharge in a large cohort in Canada. In 2 retrospective studies of recently hospitalized patients in the United States, the LACE index's ability to discriminate between patients readmitted or not ranged from slightly better than chance to moderate (C statistic 0.56‐0.77).[11, 12]
It is unknown whether adding patient‐reported preparedness measures to commonly used readmission prediction scores increases the ability to predict readmission risk. We sought to determine whether the B‐PREPARED and CTM‐3 measures were predictive of readmission or death, as compared to the LACE index, in a large cohort of cardiovascular patients. In addition, we sought to determine the additional predictive and discriminative ability gained from administering the B‐PREPARED and CTM‐3 measures, while adjusting for the LACE index and other clinical factors. We hypothesized that: (1) higher preparedness scores on both measures would predict lower risk of readmission or death in a cohort of patients hospitalized with cardiac diagnoses; and (2) because it provides more specific and actionable information, the B‐PREPARED would discriminate readmission more accurately than CTM‐3, after controlling for clinical factors.
METHODS
Study Setting and Design
The Vanderbilt Inpatient Cohort Study (VICS) is a prospective study of patients admitted with cardiovascular disease to Vanderbilt University Hospital. The purpose of VICS is to investigate the impact of patient and social factors on postdischarge health outcomes such as quality of life, unplanned hospital utilization, and mortality. The rationale and design of VICS are detailed elsewhere.[13] Briefly, participants completed a baseline interview while hospitalized, and follow‐up phone calls were conducted within 2 to 9 days and at approximately 30 and 90 days postdischarge. During the first follow‐up call conducted by research assistants, we collected preparedness for discharge data utilizing the 2 measures described below. After the 90‐day phone call, we collected healthcare utilization since the index admission. The study was approved by the Vanderbilt University Institutional Review Board.
Patients
Eligibility screening shortly after admission identified patients with acute decompensated heart failure (ADHF) and/or an intermediate or high likelihood of acute coronary syndrome (ACS) per a physician's review of the clinical record. Exclusion criteria included: age 18 years, non‐English speaker, unstable psychiatric illness, delirium, low likelihood of follow‐up (eg, no reliable telephone number), on hospice, or otherwise too ill to complete an interview. To be included in these analyses, patients must have completed the preparedness for discharge measurements during the first follow‐up call. Patients who died before discharge or before completing the follow‐up call were excluded.
Preparedness for Discharge Measures (Patient‐Reported Data)
Preparedness for discharge was assessed using the 11‐item B‐PREPARED and the 3‐item CTM‐3.
The B‐PREPARED measures how prepared patients felt leaving the hospital with regard to: self‐care information for medications and activity, equipment/community services needed, and confidence in managing one's health after hospitalization. The B‐PREPARED measure has good internal consistency reliability (Cronbach's = 0.76) and has been validated in patients of varying age within a week of discharge. Preparedness is the sum of responses to all 11 questions, with a range of 0 to 22. Higher scores reflect increased preparedness for discharge.[3]
The CTM‐3 asks patients to rate how well their preferences were considered regarding transitional needs, as well as their understanding of postdischarge self‐management and the purpose of their medications, each on a 4‐point response scale (strongly disagree to strongly agree). The sum of the 3 responses quantifies the patient's perception of the quality of the care transition at discharge (Cronbach's = 0.86,[14] 0.92 in a cohort similar to ours[8]). Scores range from 3 to 12, with higher score indicating more preparedness. Then, the sum is transformed to a 0 to 100 scale.[15]
Clinical Readmission Risk Measures (Medical Record Data)
The LACE index, published by Van Walraven et al.,[10] takes into account 4 categories of clinical data: length of hospital stay, acuity of event, comorbidities, and ED visits in the prior 6 months. More specifically, a diagnostic code‐based, modified version of the Charlson Comorbidity Index was used to calculate the comorbidity score. These clinical criteria were obtained from an administrative database and weighted according to the methods used by Van Walraven et al. An overall score was calculated on a scale of 0 to 19, with higher scores indicating higher risk of readmission or death within 30 days.
From medical records, we also collected patients' demographic data including age, race, and gender, and diagnosis of ACS, ADHF, or both at hospital admission.
Outcome Measures
Healthcare utilization data were obtained from the index hospital as well as outside facilities. The electronic medical records from Vanderbilt University Hospital provided information about healthcare utilization at Vanderbilt 90 days after initial discharge. We also used Vanderbilt records to see if patients were transferred to Vanderbilt from other hospitals or if patients visited other hospitals before or after enrollment. We supplemented this with patient self‐report during the follow‐up telephone calls (at 30 and 90 days after initial discharge) so that any additional ED and hospital visits could be captured. Mortality data were collected from medical records, Social Security data, and family reports. The main outcome was time to first unplanned hospital readmission or death within 30 and 90 days of discharge.
Analysis
To describe our sample, we summarized categorical variables with percentages and continuous variables with percentiles. To test for evidence of unadjusted covariate‐outcome relationships, we used Pearson 2 and Wilcoxon rank sum tests for categorical and continuous covariates, respectively.
For the primary analyses we used Cox proportional hazard models to examine the independent associations between the prespecified predictors for patient‐reported preparedness and time to first unplanned readmission or death within 30 and 90 days of discharge. For each outcome (30‐ and 90‐day readmission or death), we fit marginal models separately for each of the B‐PREPARED, CTM‐3, and LACE scores. We then fit multivariable models that used both preparedness measures as well as age, gender, race, and diagnosis (ADHF and/or ACS), variables available to clinicians when patients are admitted. When fitting the multivariable models, we did not find strong evidence of nonlinear effects; therefore, only linear effects are reported. To facilitate comparison of effects, we scaled continuous variables by their interquartile range (IQR). The associated, exponentiated regression parameter estimates may therefore be interpreted as hazard ratios for readmission or death per IQR change in each predictor. In addition to parameter estimation, we computed the C index to evaluate capacity for the model to discriminate those who were and were not readmitted or died. All analyses were conducted in R version 3.1.2 (R Foundation for Statistical Computing, Vienna, Austria).
RESULTS
From the cohort of 1239 patients (Figure 1), 64%, 28%, and 7% of patients were hospitalized with ACS, ADHF, or both, respectively (Table 1). Nearly 45% of patients were female, 83% were white, and the median age was 61 years (IQR 5269). The median length of stay was 3 days (IQR 25). The median preparedness scores were high for both B‐PREPARED (21, IQR 1822) and CTM‐3 (77.8, IQR 66.7100). A total of 211 (17%) and 380 (31%) were readmitted or died within 30 and 90 days, respectively. The completion rate for the postdischarge phone calls was 88%.
| Death or Readmission Within 30 Days | Death or Readmission Within 90 Days | |||||
|---|---|---|---|---|---|---|
| Not Readmitted, N = 1028 | Death/Readmitted, N = 211 | P Value | Not Readmitted, N = 859 | Death/Readmitted, N = 380 | P Value | |
| ||||||
| Gender, male | 55.8% (574) | 53.1% (112) | 0.463* | 56.3% (484) | 53.2% (202) | 0.298* |
| Female | 44.2% (454) | 46.9% (99) | 43.7% (375) | 46.8% (178) | ||
| Race, white | 83.9% (860) | 80.6% (170) | 0.237* | 86.0% (737) | 77.3% (293) | 0.001* |
| Race, nonwhite | 16.1% (165) | 19.4% (41) | 14.0% (120) | 22.7% (86) | ||
| Diagnosis ACS | 68.0% (699) | 46.4% (98) | 0.001* | 72.9% (626) | 45.0% (171) | 0.001* |
| ADHF | 24.8% (255) | 46.0% (97) | 20.3% (174) | 46.8% (178) | ||
| Both | 7.2% (74) | 7.6% (16) | 6.9% (59) | 8.2% (31) | ||
| Age | 39.4:52:61:68:80 | 37.5:53.5:62:70:82 | 0.301 | 40:52:61:68:80 | 38:52:61 :70:82 | 0.651 |
| LOS | 1:2:3:5:10 | 1:3: 4:7.5:17 | 0.001 | 1:2:3:5:9 | 1:3:4:7:15 | 0.001 |
| CTM‐3 | 55.6:66.7: 77.8:100:100 | 55.6:66.7:77.8:100 :100 | 0.305 | 55.6:66.7:88.9:100:100 | 55.6:66.7:77.8:100 :100 | 0.080 |
| B‐PREPARED | 12:18:21:22.:22 | 10:17:20:22:22 | 0.066 | 12:18:21:22:22 | 10:17:20 :22:22 | 0.030 |
| LACE | 1:4: 7:10 :14 | 3.5:7:10:13:17 | 0.001 | 1:4:6: 9:14 | 3:7:10:13:16 | 0.001 |
B‐PREPARED and CTM‐3 were moderately correlated with one another (Spearman's = 0.40, P 0.001). In bivariate analyses (Table 1), the association between B‐PREPARED and readmission or death was significant at 90 days (P = 0.030) but not 30 days. The CTM‐3 showed no significant association with readmission or death at either time point. The LACE score was significantly associated with rates of readmission at 30 and 90 days (P 0.001).
Outcomes Within 30 Days of Discharge
When examining readmission or death within 30 days of discharge, simple unadjusted models 2 and 3 showed that the B‐PREPARED and LACE scores, respectively, were each significantly associated with time to first readmission or death (Table 2). Specifically, a 4‐point increase in the B‐PREPARED score was associated with a 16% decrease in the hazard of readmission or death (hazard ratio [HR] = 0.84, 95% confidence interval [CI]: 0.72 to 0.97). A 5‐point increase in the LACE score was associated with a 100% increase in the hazard of readmission or death (HR = 2.00, 95% CI: 1.72 to 2.32). In the multivariable model with both preparedness scores and diagnosis (model 4), the B‐PREPARED score (HR = 0.82, 95% CI: 0.70 to 0.97) was significantly associated with time to first readmission or death. In the full 30‐day model including B‐PREPARED, CTM‐3, LACE, age, gender, race, and diagnosis (model 5), only the LACE score (HR = 1.83, 95% CI: 1.54 to 2.18) was independently associated with time to readmission or death. Finally, the CTM‐3 did not predict 30‐day readmission or death in any of the models tested.
| Models | HR (95% CI)* | P Value | C Index |
|---|---|---|---|
| |||
| 1. CTM (per 10‐point change) | 0.95 (0.88 to 1.03) | 0.257 | 0.523 |
| 2. B‐PREPARED (per 4‐point change) | 0.84 (0.72 to 0.97) | 0.017 | 0.537 |
| 3. LACE (per 5‐point change) | 2.00 (1.72 to 2.32) | 0.001 | 0.679 |
| 4. CTM (per 10‐point change) | 1.00 (0.92 to 1.10) | 0.935 | 0.620 |
| B‐PREPARED (per 4‐point change) | 0.82 (0.70 to 0.97) | 0.019 | |
| ADHF only (vs ACS only) | 2.46 (1.86 to 3.26) | 0.001 | |
| ADHF and ACS (vs ACS only) | 1.42 (0.84 to 2.42) | 0.191 | |
| 5. CTM (per 10‐point change) | 1.02 (0.93 to 1.11) | 0.722 | 0.692 |
| B‐PREPARED (per 4 point change) | 0.87 (0.74 to 1.03) | 0.106 | |
| LACE (per 5‐point change) | 1.83 (1.54 to 2.18) | 0.001 | |
| ADHF only (vs ACS only) | 1.51 (1.10 to 2.08) | 0.010 | |
| ADHF and ACS (vs ACS only) | 0.90 (0.52 to 1.55) | 0.690 | |
| Age (per 10‐year change) | 1.02 (0.92 to 1.14) | 0.669 | |
| Female (vs male) | 1.11 (0.85 to 1.46) | 0.438 | |
| Nonwhite (vs white) | 0.92 (0.64 to 1.30) | 0.624 | |
Outcomes Within 90 Days of Discharge
At 90 days after discharge, again the separate unadjusted models 2 and 3 demonstrated that the B‐PREPARED and LACE scores, respectively, were each significantly associated with time to first readmission or death, whereas the CTM‐3 model only showed marginal significance (Table 3). In the multivariable model with both preparedness scores and diagnosis (model 4), results were similar to 30 days as the B‐PREPARED score was significantly associated with time to first readmission or death. Lastly, in the full model (model 5) at 90 days, again the LACE score was significantly associated with time to first readmission or death. In addition, B‐PREPARED scores were associated with a significant decrease in risk of readmission or death (HR = 0.88, 95% CI: 0.78 to 1.00); CTM‐3 scores were not independently associated with outcomes.
| Model | HR (95% CI)* | P Value | C Index |
|---|---|---|---|
| |||
| 1. CTM (per 10‐point change) | 0.94 (0.89 to 1.00) | 0.051 | 0.526 |
| 2. B‐PREPARED (per 4‐point change) | 0.84 (0.75 to 0.94) | 0.002 | 0.533 |
| 3. LACE (per 5‐point change) | 2.03 (1.82 to 2.27) | 0.001 | 0.683 |
| 4. CTM (per 10‐point change) | 0.99 (0.93 to 1.06) | 0.759 | 0.640 |
| B‐PREPARED (per 4‐point change) | 0.83 (0.74 to 0.94) | 0.003 | |
| ADHF only (vs ACS only) | 2.88 (2.33 to 3.56) | 0.001 | |
| ADHF and ACS (vs ACS only) | 1.62 (1.11 to 2.38) | 0.013 | |
| 5. CTM (per 10‐point change) | 1.00 (0.94 to 1.07) | 0.932 | 0.698 |
| B‐PREPARED (per 4‐point change) | 0.88 (0.78 to 1.00) | 0.043 | |
| LACE (per 5‐point change) | 1.76 (1.55 to 2.00) | 0.001 | |
| ADHF only (vs ACS only) | 1.76 (1.39 to 2.24) | 0.001 | |
| ADHF and ACS (vs ACS only) | 1.00 (0.67 to 1.50) | 0.980 | |
| Age (per 10‐year change) | 1.00 (0.93 to 1.09) | 0.894 | |
| Female (vs male) | 1.10 (0.90 to 1.35) | 0.341 | |
| Nonwhite (vs white) | 1.14 (0.89 to 1.47) | 0.288 | |
Tables 2 and 3 also display the C indices, or the discriminative ability of the models to differentiate whether or not a patient was readmitted or died. The range of the C index is 0.5 to 1, where values closer to 0.5 indicate random predictions and values closer to 1 indicate perfect prediction. At 30 days, the individual C indices for B‐PREPARED and CTM‐3 were only slightly better than chance (0.54 and 0.52, respectively) in their discriminative abilities. However, the C indices for the LACE score alone (0.68) and the multivariable model (0.69) including all 3 measures (ie, B‐PREPARED, CTM‐3, LACE), and clinical and demographic variables, had higher utility in discriminating patients who were readmitted/died or not. The 90‐day C indices were comparable in magnitude to those at 30 days.
DISCUSSION/CONCLUSION
In this cohort of patients hospitalized with cardiovascular disease, we compared 2 patient‐reported measures of preparedness for discharge, their association with time to death or readmission at 30 and 90 days, and their ability to discriminate patients who were or were not readmitted or died. Higher preparedness as measured by higher B‐PREPARED scores was associated with lower risk of readmission or death at 30 and 90 days after discharge in unadjusted models, and at 90 days in adjusted models. CTM‐3 was not associated with the outcome in any analyses. Lastly, the individual preparedness measures were not as strongly associated with readmission or death compared to the LACE readmission index alone.
How do our findings relate to the measurement of care transition quality? We consider 2 scenarios. First, if hospitals utilize the LACE index to predict readmission, then neither self‐reported measure of preparedness adds meaningfully to its predictive ability. However, hospital management may still find the B‐PREPARED and CTM‐3 useful as a means to direct care transition quality‐improvement efforts. These measures can instruct hospitals as to what areas their patients express the greatest difficulty or lack of preparedness and closely attend to patient needs with appropriate resources. Furthermore, the patient's perception of being prepared for discharge may be different than their actual preparedness. Their perceived preparedness may be affected by cognitive impairment, dissatisfaction with medical care, depression, lower health‐related quality of life, and lower educational attainment as demonstrated by Lau et al.[16] If a patient's perception of preparedness were low, it would behoove the clinician to investigate these other issues and address those that are mutable. Additionally, perceived preparedness may not correlate with the patient's understanding of their medical conditions, so it is imperative that clinicians provide prospective guidance about their probable postdischarge trajectory. If hospitals are not utilizing the LACE index, then perhaps using the B‐PREPARED, but not the CTM‐3, may be beneficial for predicting readmission.
How do our results fit with evidence from prior studies, and what do they mean in the context of care transitions quality? First, in the psychometric evaluation of the B‐PREPARED measure in a cohort of recently hospitalized patients, the mean score was 17.3, lower than the median of 21 in our cohort.[3] Numerous studies have utilized the CTM‐3 and the longer‐version CTM‐15. Though we cannot make a direct comparison, the median in our cohort (77.8) was on par with the means from other studies, which ranged from 63 to 82.[5, 17, 18, 19] Several studies also note ceiling effects with clusters of scores at the upper end of the scale, as did we. We conjecture that our cohort's preparedness scores may be higher because our institution has made concerted efforts to improve the discharge education for cardiovascular patients.
In a comparable patient population, the TRACE‐CORE (Transitions, Risks, and Actions in Coronary Events Center for Outcomes Research and Education) study is a cohort of more than 2200 patients with ACS who were administered the CTM‐15 within 1 month of discharge.[8] In that study, the median CTM‐15 score was 66.6, which is lower than our cohort. With regard to the predictive ability of the CTM‐3, they note that CTM‐3 scores did not differentiate between patients who were or were not readmitted or had emergency department visits. Our results support their concern that the CTM‐15 and by extension the CTM‐3, though adopted widely as part of HCAHPS, may not have sufficient ability to discriminate differences in patient outcomes or the quality of care transitions.
More recently, patient‐reported preparedness for discharge was assessed in a prospective cohort in Canada.[16] Lau et al. administered a single‐item measure of readiness at the time of discharge to general medicine patients, and found that lower readiness scores were also not associated with readmission or death at 30 days, when adjusted for the LACE index as we did.
We must acknowledge the limitations of our findings. First, our sample of recently discharged patients with cardiovascular disease is different than the community‐dwelling, underserved Americans hospitalized in the prior year, which served as the sample for reducing the CTM‐15 to 3 items.[5] This fact may explain why we did not find the CTM‐3 to be associated with readmission in our sample. Second, our analyses did not include extensive adjustment for patient‐related factors. Rather, our intention was to see how well the preparedness measures performed independently and compare their abilities to predict readmission, which is particularly relevant for clinicians who may not have all possible covariates in predicting readmission. Finally, because we limited the analyses to the patients who completed the B‐PREPARED and CTM‐3 measures (88% completion rate), we may not have data for: (1) very ill patients, who had a higher risk of readmission and least prepared, and were not able to answer the postdischarge phone call; and (2) very functional patients, who had a lower risk of readmission and were too busy to answer the postdischarge phone call. This may have limited the extremes in the spectrum of our sample.
Importantly, our study has several strengths. We report on the largest sample to date with results of both B‐PREPARED and CTM‐3. Moreover, we examined how these measures compared to a widely used readmission prediction tool, the LACE index. We had very high postdischarge phone call completion rates in the week following discharge. Furthermore, we had thorough assessment of readmission data through patient report, electronic medical record documentation, and collection of outside medical records.
Further research is needed to elucidate: (1) the ideal administration time of the patient‐reported measures of preparedness (before or after discharge), and (2) the challenges to the implementation of measures in healthcare systems. Remaining research questions center on the tradeoffs and barriers to implementing a longer measure like the 11‐item B‐PREPARED compared to a shorter measure like the CTM‐3. We do not know whether longer measures preclude their use by busy clinicians, though it provides more specific information about what patients feel they need at hospital discharge. Additionally, studies need to demonstrate the mutability of preparedness and the response of measures to interventions designed to improve the hospital discharge process.
In our sample of recently hospitalized cardiovascular patients, there was a statistically significant association between patient‐reported preparedness for discharged, as measured by B‐PREPARED, and readmissions/death at 30 and 90 days, but the magnitude of the association was very small. Furthermore, another patient‐reported preparedness measure, CTM‐3, was not associated with readmissions or death at either 30 or 90 days. Lastly, neither measure discriminated well between patients who were readmitted or not, and neither measure added meaningfully to the LACE index in terms of predicting 30‐ or 90‐day readmissions.
Disclosures
This study was supported by grant R01 HL109388 from the National Heart, Lung, and Blood Institute (Dr. Kripalani) and in part by grant UL1 RR024975‐01 from the National Center for Research Resources, and grant 2 UL1 TR000445‐06 from the National Center for Advancing Translational Sciences. Dr. Kripalani is a consultant to SAI Interactive and holds equity in Bioscape Digital, and is a consultant to and holds equity in PictureRx, LLC. Dr. Bell is supported by the National Institutes of Health (K23AG048347) and by the Eisenstein Women's Heart Fund. Dr. Vasilevskis is supported by the National Institutes of Health (K23AG040157) and the Geriatric Research, Education and Clinical Center. Dr. Mixon is a Veterans Affairs Health Services Research and Development Service Career Development awardee (12‐168) at the Nashville Department of Veterans Affairs. The content is solely the responsibility of the authors and does not necessarily represent the official views of the National Institutes of Health. The funding agency was not involved in the design and conduct of the study; collection, management, analysis, and interpretation of the data; and preparation, review, or approval of the manuscript. All authors had full access to all study data and had a significant role in writing the manuscript. The contents do not represent the views of the US Department of Veterans Affairs or the United States government. Dr. Kripalani is a consultant to and holds equity in PictureRx, LLC.
- Centers for Medicare 9(9):598–603.
- , , . Brief scale measuring patient preparedness for hospital discharge to home: psychometric properties. J Hosp Med. 2008;3(6):446–454.
- , , . Assessing the quality of preparation for posthospital care from the patient's perspective: the care transitions measure. Med Care. 2005;43(3):246–255.
- , , , . Assessing the quality of transitional care: further applications of the care transitions measure. Med Care. 2008;46(3):317–322.
- , , , , . The central role of performance measurement in improving the quality of transitional care. Home Health Care Serv Q. 2007;26(4):93–104.
- Centers for Medicare 3:e001053.
- , , , et al. Risk prediction models for hospital readmission: a systematic review. JAMA. 2011;306(15):1688–1698.
- , , , et al. Derivation and validation of an index to predict early death or unplanned readmission after discharge from hospital to the community. CMAJ. 2010;182(6):551–557.
- , , , et al. Using the LACE index to predict hospital readmissions in congestive heart failure patients. BMC Cardiovasc Disord. 2014;14:97.
- , , , . Validation of a predictive model to identify patients at high risk for hospital readmission. J Healthc Qual. 2016;38(1):34–41.
- , , , et al. Determinants of health after hospital discharge: rationale and design of the Vanderbilt Inpatient Cohort Study (VICS). BMC Health Serv Res. 2014;14:10.
- . CTM frequently asked questions. Available at: http://caretransitions.org/tools-and-resources/. Accessed January 22, 2016.
- . Instructions for scoring the CTM‐3. Available at: http://caretransitions.org/tools-and-resources/. Accessed January 22, 2016.
- , , , et al. Patient‐reported discharge readiness and 30‐day risk of readmission or death: a prospective cohort study. Am J Med. 2016;129:89–95.
- , , , , . Implementaiton of the Care Transitions Intervention: sustainability and lessons learned. Prof Case Manag. 2009;14(6):282–293.
- , , , . The care transitions innovation (C‐TraIn) for socioeconomically disadvantaged adults: results of a cluster randomized controlled trial. J Gen Intern Med. 2014;29(11):1460–1467.
- , , , et al. Telephone calls to patients after discharge from the hospital: an important part of transitions of care. Med Educ Online. 2015;29(20):26701.
- Centers for Medicare 9(9):598–603.
- , , . Brief scale measuring patient preparedness for hospital discharge to home: psychometric properties. J Hosp Med. 2008;3(6):446–454.
- , , . Assessing the quality of preparation for posthospital care from the patient's perspective: the care transitions measure. Med Care. 2005;43(3):246–255.
- , , , . Assessing the quality of transitional care: further applications of the care transitions measure. Med Care. 2008;46(3):317–322.
- , , , , . The central role of performance measurement in improving the quality of transitional care. Home Health Care Serv Q. 2007;26(4):93–104.
- Centers for Medicare 3:e001053.
- , , , et al. Risk prediction models for hospital readmission: a systematic review. JAMA. 2011;306(15):1688–1698.
- , , , et al. Derivation and validation of an index to predict early death or unplanned readmission after discharge from hospital to the community. CMAJ. 2010;182(6):551–557.
- , , , et al. Using the LACE index to predict hospital readmissions in congestive heart failure patients. BMC Cardiovasc Disord. 2014;14:97.
- , , , . Validation of a predictive model to identify patients at high risk for hospital readmission. J Healthc Qual. 2016;38(1):34–41.
- , , , et al. Determinants of health after hospital discharge: rationale and design of the Vanderbilt Inpatient Cohort Study (VICS). BMC Health Serv Res. 2014;14:10.
- . CTM frequently asked questions. Available at: http://caretransitions.org/tools-and-resources/. Accessed January 22, 2016.
- . Instructions for scoring the CTM‐3. Available at: http://caretransitions.org/tools-and-resources/. Accessed January 22, 2016.
- , , , et al. Patient‐reported discharge readiness and 30‐day risk of readmission or death: a prospective cohort study. Am J Med. 2016;129:89–95.
- , , , , . Implementaiton of the Care Transitions Intervention: sustainability and lessons learned. Prof Case Manag. 2009;14(6):282–293.
- , , , . The care transitions innovation (C‐TraIn) for socioeconomically disadvantaged adults: results of a cluster randomized controlled trial. J Gen Intern Med. 2014;29(11):1460–1467.
- , , , et al. Telephone calls to patients after discharge from the hospital: an important part of transitions of care. Med Educ Online. 2015;29(20):26701.
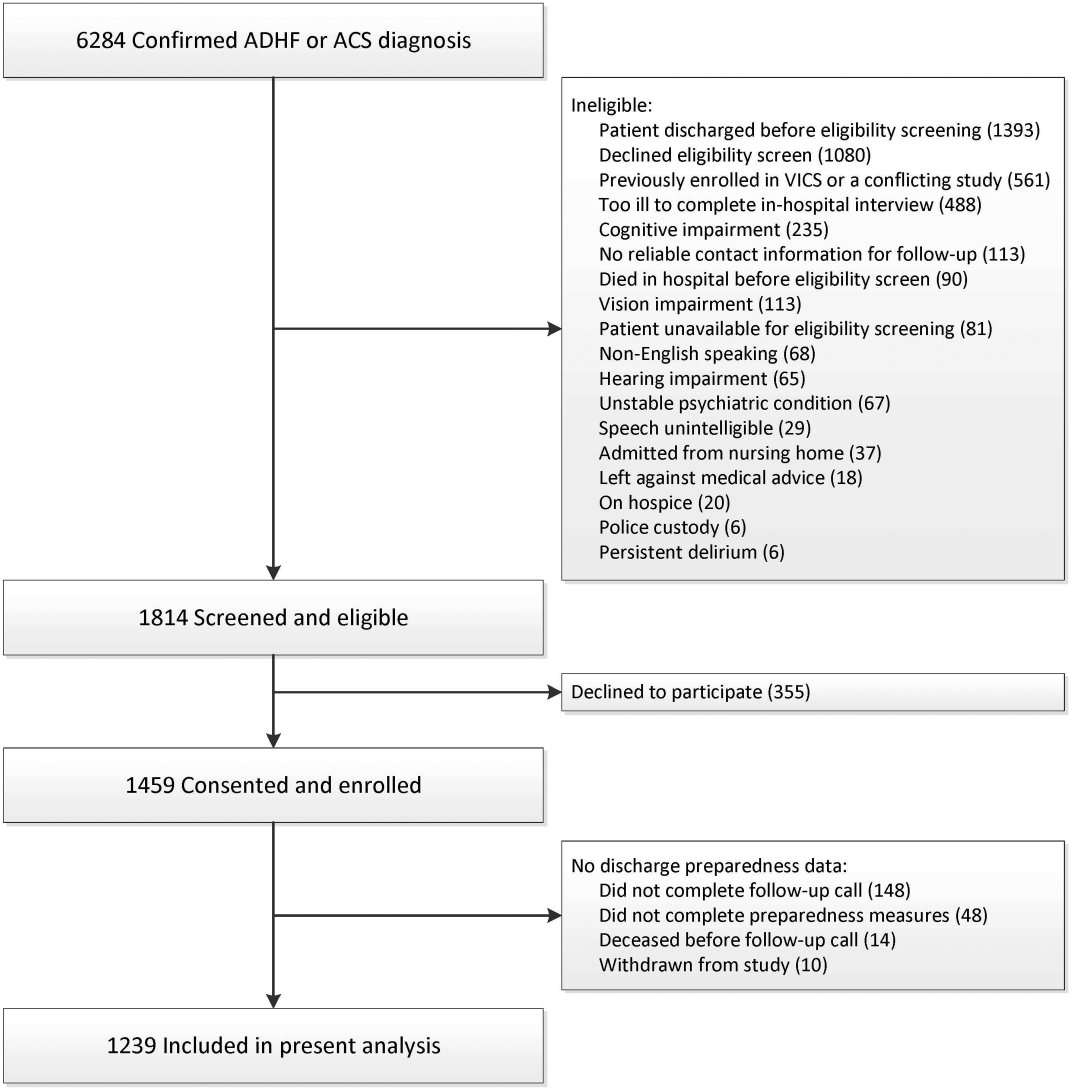
Does caffeine intake during pregnancy affect birth weight?
No. Reducing caffeinated coffee consumption by 180 mg of caffeine (the equivalent of 2 cups) per day after 16 weeks’ gestation doesn’t affect birth weight. Consuming more than 300 mg of caffeine per day is associated with a clinically trivial, and statistically insignificant (less than 1 ounce), reduction in birth weight, compared with consuming no caffeine (strength of recommendation: B, randomized controlled trial [RCT] and large prospective cohort study).
EVIDENCE SUMMARY
A Cochrane systematic review of the effects of caffeine on pregnancy identified 2 studies, only one of which addressed the question of maternal caffeine intake and infant birth weight.1 The double-blind RCT evaluating caffeine intake during pregnancy found no significant differences in birth weight or length of gestation between women who drank regular coffee and women who drank decaffeinated coffee.2
At 16 weeks’ gestation, investigators randomized 1207 pregnant women who reported daily intake of at least 3 cups of regular coffee to drink unlabeled instant coffee (which was either regular or decaffeinated) for the rest of their pregnancy. The women were allowed to request as much of their assigned instant coffee as they wanted.
Subjects were recruited from among all women with uncomplicated, singleton pregnancies who were expected to deliver at a Danish university hospital during the study period. Investigators interviewed the women at 20, 25, and 34 weeks to determine coffee consumption (including both coffee provided by the investigators and other coffee), consumption of other caffeinated beverages, and smoking status.
The difference in caffeine intake between the groups didn’t correspond to significant differences in birth weight (16 g lighter with caffeinated coffee; 95% confidence interval [CI], −40 g to 73 g; P=.48) or birth length (0.03 cm longer with caffeinated coffee; 95% CI, −0.29 to 0.22) among infants born to the 1150 women who completed the study.
Limitations of the study include randomizing women after 16 weeks’ gestation and the observation that many women correctly guessed which type of coffee they received (35% of women drinking caffeinated coffee and 49% of women drinking decaf).
A caffeine effect, but with study limitations
The Cochrane systematic review (described above) and a meta-analysis of 9 prospective cohort studies with a total of 90,000 patients that evaluated maternal caffeine intake found that it was associated with increased low birth weight, intrauterine growth restriction (IUGR), or small for gestational age (SGA) infants.3
Researchers assessed caffeine consumption from coffee or other sources either by questionnaire (5 studies) or interview (4 studies) at various times during pregnancy, mostly in the first or second trimester, and assigned subjects to 4 intake categories: none, low (50-149 mg/d), moderate (150-349 mg/d), and high (>350 mg/d).
Compared with no caffeine, all levels of caffeine intake were associated with increased rates of low birth weight, IUGR, or SGA (low intake: relative risk [RR]=1.13; 95% CI, 1.06-1.21; moderate intake: RR=1.38; 95% CI, 1.18-1.62; high intake: RR=1.60; 95% CI, 1.24-2.08).
A major limitation of the meta-analysis was that 8 of the included studies were identified by the reviewers as having quality problems. The reviewers also identified additional cohort studies, not included in the meta-analysis, which failed to show any association between caffeine intake and poor pregnancy outcomes.
Results of best-quality study prove clinically trivial
The best-quality prospective cohort study in the review described above was also the largest, comprising two-thirds of the total patients. It found a statistically significant, but clinically trivial, association between caffeine intake and birth weight.4
Investigators from Norway’s Institute of Public Health mailed surveys to 106,707 pregnant Norwegian women and recruited 59,123 with uncomplicated singleton pregnancies. The survey assessed diet and lifestyle at several stages of pregnancy and correlated caffeine intake with birth weight, gestational length, and SGA deliveries. Investigators calculated caffeine intake from coffee and other dietary sources (tea and chocolate).
Higher caffeine intake was associated with a small reduction in birth weight (8 g/100 mg/d of additional caffeine intake; 95% CI, −10 to −6 g/100 mg/d). Higher intake was also associated with increasing likelihood of SGA birth, a finding of borderline significance (odds ratio [OR]=1.18; 95% CI, 1.00-1.38, comparing intake <50 mg/d with 51-200 mg/d; OR=1.62; 95% CI, 1.26-2.29, comparing <50 mg/d with 201-300 mg/d; and OR=1.62; 95% CI, 1.15-2.29, comparing <50 mg/d with >300 mg/d).
1. Jahanfar S, Jaafar SH. Effects of restricted caffeine intake by mother on fetal, neonatal and pregnancy outcome. Cochrane Database Syst Rev. 2013;(2):CD006965.
2. Bech BH, Obel C, Henriksen TB, et al. Effect of reducing caffeine intake on birth weight and length of gestation: randomised controlled trial. BMJ. 2007;334:409.
3. Chen LW, Wu Y, Neelakantan N, et al. Maternal caffeine intake during pregnancy is associated with risk of low birth weight: a systematic review and dose-response meta-analysis. BMC Medicine. 2014;12:174-176.
4. Sengpiel V, Elind E, Bacelis J, et al. Maternal caffeine intake during pregnancy is associated with birth weight but not with gestational length: results form a large prospective observational cohort trial. BMC Medicine. 2013;11:42.
No. Reducing caffeinated coffee consumption by 180 mg of caffeine (the equivalent of 2 cups) per day after 16 weeks’ gestation doesn’t affect birth weight. Consuming more than 300 mg of caffeine per day is associated with a clinically trivial, and statistically insignificant (less than 1 ounce), reduction in birth weight, compared with consuming no caffeine (strength of recommendation: B, randomized controlled trial [RCT] and large prospective cohort study).
EVIDENCE SUMMARY
A Cochrane systematic review of the effects of caffeine on pregnancy identified 2 studies, only one of which addressed the question of maternal caffeine intake and infant birth weight.1 The double-blind RCT evaluating caffeine intake during pregnancy found no significant differences in birth weight or length of gestation between women who drank regular coffee and women who drank decaffeinated coffee.2
At 16 weeks’ gestation, investigators randomized 1207 pregnant women who reported daily intake of at least 3 cups of regular coffee to drink unlabeled instant coffee (which was either regular or decaffeinated) for the rest of their pregnancy. The women were allowed to request as much of their assigned instant coffee as they wanted.
Subjects were recruited from among all women with uncomplicated, singleton pregnancies who were expected to deliver at a Danish university hospital during the study period. Investigators interviewed the women at 20, 25, and 34 weeks to determine coffee consumption (including both coffee provided by the investigators and other coffee), consumption of other caffeinated beverages, and smoking status.
The difference in caffeine intake between the groups didn’t correspond to significant differences in birth weight (16 g lighter with caffeinated coffee; 95% confidence interval [CI], −40 g to 73 g; P=.48) or birth length (0.03 cm longer with caffeinated coffee; 95% CI, −0.29 to 0.22) among infants born to the 1150 women who completed the study.
Limitations of the study include randomizing women after 16 weeks’ gestation and the observation that many women correctly guessed which type of coffee they received (35% of women drinking caffeinated coffee and 49% of women drinking decaf).
A caffeine effect, but with study limitations
The Cochrane systematic review (described above) and a meta-analysis of 9 prospective cohort studies with a total of 90,000 patients that evaluated maternal caffeine intake found that it was associated with increased low birth weight, intrauterine growth restriction (IUGR), or small for gestational age (SGA) infants.3
Researchers assessed caffeine consumption from coffee or other sources either by questionnaire (5 studies) or interview (4 studies) at various times during pregnancy, mostly in the first or second trimester, and assigned subjects to 4 intake categories: none, low (50-149 mg/d), moderate (150-349 mg/d), and high (>350 mg/d).
Compared with no caffeine, all levels of caffeine intake were associated with increased rates of low birth weight, IUGR, or SGA (low intake: relative risk [RR]=1.13; 95% CI, 1.06-1.21; moderate intake: RR=1.38; 95% CI, 1.18-1.62; high intake: RR=1.60; 95% CI, 1.24-2.08).
A major limitation of the meta-analysis was that 8 of the included studies were identified by the reviewers as having quality problems. The reviewers also identified additional cohort studies, not included in the meta-analysis, which failed to show any association between caffeine intake and poor pregnancy outcomes.
Results of best-quality study prove clinically trivial
The best-quality prospective cohort study in the review described above was also the largest, comprising two-thirds of the total patients. It found a statistically significant, but clinically trivial, association between caffeine intake and birth weight.4
Investigators from Norway’s Institute of Public Health mailed surveys to 106,707 pregnant Norwegian women and recruited 59,123 with uncomplicated singleton pregnancies. The survey assessed diet and lifestyle at several stages of pregnancy and correlated caffeine intake with birth weight, gestational length, and SGA deliveries. Investigators calculated caffeine intake from coffee and other dietary sources (tea and chocolate).
Higher caffeine intake was associated with a small reduction in birth weight (8 g/100 mg/d of additional caffeine intake; 95% CI, −10 to −6 g/100 mg/d). Higher intake was also associated with increasing likelihood of SGA birth, a finding of borderline significance (odds ratio [OR]=1.18; 95% CI, 1.00-1.38, comparing intake <50 mg/d with 51-200 mg/d; OR=1.62; 95% CI, 1.26-2.29, comparing <50 mg/d with 201-300 mg/d; and OR=1.62; 95% CI, 1.15-2.29, comparing <50 mg/d with >300 mg/d).
No. Reducing caffeinated coffee consumption by 180 mg of caffeine (the equivalent of 2 cups) per day after 16 weeks’ gestation doesn’t affect birth weight. Consuming more than 300 mg of caffeine per day is associated with a clinically trivial, and statistically insignificant (less than 1 ounce), reduction in birth weight, compared with consuming no caffeine (strength of recommendation: B, randomized controlled trial [RCT] and large prospective cohort study).
EVIDENCE SUMMARY
A Cochrane systematic review of the effects of caffeine on pregnancy identified 2 studies, only one of which addressed the question of maternal caffeine intake and infant birth weight.1 The double-blind RCT evaluating caffeine intake during pregnancy found no significant differences in birth weight or length of gestation between women who drank regular coffee and women who drank decaffeinated coffee.2
At 16 weeks’ gestation, investigators randomized 1207 pregnant women who reported daily intake of at least 3 cups of regular coffee to drink unlabeled instant coffee (which was either regular or decaffeinated) for the rest of their pregnancy. The women were allowed to request as much of their assigned instant coffee as they wanted.
Subjects were recruited from among all women with uncomplicated, singleton pregnancies who were expected to deliver at a Danish university hospital during the study period. Investigators interviewed the women at 20, 25, and 34 weeks to determine coffee consumption (including both coffee provided by the investigators and other coffee), consumption of other caffeinated beverages, and smoking status.
The difference in caffeine intake between the groups didn’t correspond to significant differences in birth weight (16 g lighter with caffeinated coffee; 95% confidence interval [CI], −40 g to 73 g; P=.48) or birth length (0.03 cm longer with caffeinated coffee; 95% CI, −0.29 to 0.22) among infants born to the 1150 women who completed the study.
Limitations of the study include randomizing women after 16 weeks’ gestation and the observation that many women correctly guessed which type of coffee they received (35% of women drinking caffeinated coffee and 49% of women drinking decaf).
A caffeine effect, but with study limitations
The Cochrane systematic review (described above) and a meta-analysis of 9 prospective cohort studies with a total of 90,000 patients that evaluated maternal caffeine intake found that it was associated with increased low birth weight, intrauterine growth restriction (IUGR), or small for gestational age (SGA) infants.3
Researchers assessed caffeine consumption from coffee or other sources either by questionnaire (5 studies) or interview (4 studies) at various times during pregnancy, mostly in the first or second trimester, and assigned subjects to 4 intake categories: none, low (50-149 mg/d), moderate (150-349 mg/d), and high (>350 mg/d).
Compared with no caffeine, all levels of caffeine intake were associated with increased rates of low birth weight, IUGR, or SGA (low intake: relative risk [RR]=1.13; 95% CI, 1.06-1.21; moderate intake: RR=1.38; 95% CI, 1.18-1.62; high intake: RR=1.60; 95% CI, 1.24-2.08).
A major limitation of the meta-analysis was that 8 of the included studies were identified by the reviewers as having quality problems. The reviewers also identified additional cohort studies, not included in the meta-analysis, which failed to show any association between caffeine intake and poor pregnancy outcomes.
Results of best-quality study prove clinically trivial
The best-quality prospective cohort study in the review described above was also the largest, comprising two-thirds of the total patients. It found a statistically significant, but clinically trivial, association between caffeine intake and birth weight.4
Investigators from Norway’s Institute of Public Health mailed surveys to 106,707 pregnant Norwegian women and recruited 59,123 with uncomplicated singleton pregnancies. The survey assessed diet and lifestyle at several stages of pregnancy and correlated caffeine intake with birth weight, gestational length, and SGA deliveries. Investigators calculated caffeine intake from coffee and other dietary sources (tea and chocolate).
Higher caffeine intake was associated with a small reduction in birth weight (8 g/100 mg/d of additional caffeine intake; 95% CI, −10 to −6 g/100 mg/d). Higher intake was also associated with increasing likelihood of SGA birth, a finding of borderline significance (odds ratio [OR]=1.18; 95% CI, 1.00-1.38, comparing intake <50 mg/d with 51-200 mg/d; OR=1.62; 95% CI, 1.26-2.29, comparing <50 mg/d with 201-300 mg/d; and OR=1.62; 95% CI, 1.15-2.29, comparing <50 mg/d with >300 mg/d).
1. Jahanfar S, Jaafar SH. Effects of restricted caffeine intake by mother on fetal, neonatal and pregnancy outcome. Cochrane Database Syst Rev. 2013;(2):CD006965.
2. Bech BH, Obel C, Henriksen TB, et al. Effect of reducing caffeine intake on birth weight and length of gestation: randomised controlled trial. BMJ. 2007;334:409.
3. Chen LW, Wu Y, Neelakantan N, et al. Maternal caffeine intake during pregnancy is associated with risk of low birth weight: a systematic review and dose-response meta-analysis. BMC Medicine. 2014;12:174-176.
4. Sengpiel V, Elind E, Bacelis J, et al. Maternal caffeine intake during pregnancy is associated with birth weight but not with gestational length: results form a large prospective observational cohort trial. BMC Medicine. 2013;11:42.
1. Jahanfar S, Jaafar SH. Effects of restricted caffeine intake by mother on fetal, neonatal and pregnancy outcome. Cochrane Database Syst Rev. 2013;(2):CD006965.
2. Bech BH, Obel C, Henriksen TB, et al. Effect of reducing caffeine intake on birth weight and length of gestation: randomised controlled trial. BMJ. 2007;334:409.
3. Chen LW, Wu Y, Neelakantan N, et al. Maternal caffeine intake during pregnancy is associated with risk of low birth weight: a systematic review and dose-response meta-analysis. BMC Medicine. 2014;12:174-176.
4. Sengpiel V, Elind E, Bacelis J, et al. Maternal caffeine intake during pregnancy is associated with birth weight but not with gestational length: results form a large prospective observational cohort trial. BMC Medicine. 2013;11:42.
Evidence-based answers from the Family Physicians Inquiries Network

Do corticosteroids relieve Bell’s palsy?
Yes, but not severe disease. Corticosteroids likely improve facial motor function in adults with mild to moderate Bell’s palsy (strength of recommendation [SOR]: B, meta-analysis of heterogeneous randomized controlled trials [RCTs]). Corticosteroids are probably ineffective in treating cosmetically disabling or severe disease (SOR: A, meta-analysis and large RCT).
Improvement seen with corticosteroids in mild to moderate palsy
A 2010 Cochrane review of 8 RCTs (7 double-blind) compared corticosteroids with placebo in 1569 patients with Bell’s palsy, 24 months to 84 years of age.1 The definition of mild and moderate severity of symptoms differed across studies, as did corticosteroid doses. Only 6 trials required initiation of therapy within 3 days.
More patients in the corticosteroid group had completely recovered facial motor function at 6 months than patients taking placebo (77% vs 65%; 7 trials, 1507 patients; relative risk [RR]=0.71; 95% confidence interval [CI], 0.61-0.81; number needed to treat=10). Improvement in cosmetically disabling or severe disease wasn’t significant (5 trials, 668 patients; RR=0.97; 95% CI, 0.44-2.2).
Prednisolone with and without an antiviral reduces facial weakness
A 2012 prospective, randomized, double-blind, placebo-controlled, multicenter trial evaluated prednisolone (60 mg/day for 5 days, tapered for 5 days) in 829 adults, 18 to 75 years of age.2 Patients were randomized to one of 4 groups: placebo plus placebo, prednisolone plus placebo, valacyclovir plus placebo, and prednisolone plus valacyclovir. Facial function was assessed over 12 months using the Sunnybrook grading system (scored from 0 to 100; 0=complete paralysis, 100=normal function).
Compared to the groups not receiving any prednisolone, the 2 groups that received prednisolone, either with placebo or valacyclovir, had significantly less facial weakness at 12 months for both mild and moderate palsy (Sunnybrook scores <90: 184 patients; difference= −10.3%; 95% CI, −15.9 to −4.7; P<.001; Sunnybrook score <80: 134 patients; difference= −6.9%; 95% CI, −11.9 to −1.9; P=.01; Sunnybrook score <70: 98 patients; difference= −7.8%; 95% CI, −12.1 to −3.4; P<.001). Patients with severe disease (Sunnybrook score <50) didn’t show significant improvement (56 patients; difference= –2.9%; CI, −6.4 to 0.5; P=.10).
Guideline recommends corticosteroids for Bell’s palsy
The 2014 American Academy of Neurology evidence-based guideline reviewed all studies of the use of steroids in Bell’s palsy published after the original 2001 guideline.3 They found 2 high-quality RCTs, both of which are included in the 2010 Cochrane review. The 2014 guideline recommends corticosteroids for every patient who develops Bell’s palsy unless a medical contraindication exists (2 Class 1 studies [RCTs], Level A [must prescribe or offer]).
1. Salinas RA, Alvarez G, Daly F, et al. Corticosteroids for Bell’s palsy (idiopathic facial paralysis). Cochrane Database Syst Rev. 2010;(3):CD001942.
2. Berg T, Bylund N, Marsk E, et al. The effect of prednisolone on sequelae in Bell’s palsy. Arch Otolaryngol Head Neck Surg. 2012;138:445-449.
3. Gronseth G, Paduga R, American Academy of Neurology. Evidence-based guideline update: steroids and antivirals for Bell’s palsy: report of the Guideline Development Subcommittee of the American Academy of Neurology. Neurology. 2012;79:2209-2213.
Yes, but not severe disease. Corticosteroids likely improve facial motor function in adults with mild to moderate Bell’s palsy (strength of recommendation [SOR]: B, meta-analysis of heterogeneous randomized controlled trials [RCTs]). Corticosteroids are probably ineffective in treating cosmetically disabling or severe disease (SOR: A, meta-analysis and large RCT).
Improvement seen with corticosteroids in mild to moderate palsy
A 2010 Cochrane review of 8 RCTs (7 double-blind) compared corticosteroids with placebo in 1569 patients with Bell’s palsy, 24 months to 84 years of age.1 The definition of mild and moderate severity of symptoms differed across studies, as did corticosteroid doses. Only 6 trials required initiation of therapy within 3 days.
More patients in the corticosteroid group had completely recovered facial motor function at 6 months than patients taking placebo (77% vs 65%; 7 trials, 1507 patients; relative risk [RR]=0.71; 95% confidence interval [CI], 0.61-0.81; number needed to treat=10). Improvement in cosmetically disabling or severe disease wasn’t significant (5 trials, 668 patients; RR=0.97; 95% CI, 0.44-2.2).
Prednisolone with and without an antiviral reduces facial weakness
A 2012 prospective, randomized, double-blind, placebo-controlled, multicenter trial evaluated prednisolone (60 mg/day for 5 days, tapered for 5 days) in 829 adults, 18 to 75 years of age.2 Patients were randomized to one of 4 groups: placebo plus placebo, prednisolone plus placebo, valacyclovir plus placebo, and prednisolone plus valacyclovir. Facial function was assessed over 12 months using the Sunnybrook grading system (scored from 0 to 100; 0=complete paralysis, 100=normal function).
Compared to the groups not receiving any prednisolone, the 2 groups that received prednisolone, either with placebo or valacyclovir, had significantly less facial weakness at 12 months for both mild and moderate palsy (Sunnybrook scores <90: 184 patients; difference= −10.3%; 95% CI, −15.9 to −4.7; P<.001; Sunnybrook score <80: 134 patients; difference= −6.9%; 95% CI, −11.9 to −1.9; P=.01; Sunnybrook score <70: 98 patients; difference= −7.8%; 95% CI, −12.1 to −3.4; P<.001). Patients with severe disease (Sunnybrook score <50) didn’t show significant improvement (56 patients; difference= –2.9%; CI, −6.4 to 0.5; P=.10).
Guideline recommends corticosteroids for Bell’s palsy
The 2014 American Academy of Neurology evidence-based guideline reviewed all studies of the use of steroids in Bell’s palsy published after the original 2001 guideline.3 They found 2 high-quality RCTs, both of which are included in the 2010 Cochrane review. The 2014 guideline recommends corticosteroids for every patient who develops Bell’s palsy unless a medical contraindication exists (2 Class 1 studies [RCTs], Level A [must prescribe or offer]).
Yes, but not severe disease. Corticosteroids likely improve facial motor function in adults with mild to moderate Bell’s palsy (strength of recommendation [SOR]: B, meta-analysis of heterogeneous randomized controlled trials [RCTs]). Corticosteroids are probably ineffective in treating cosmetically disabling or severe disease (SOR: A, meta-analysis and large RCT).
Improvement seen with corticosteroids in mild to moderate palsy
A 2010 Cochrane review of 8 RCTs (7 double-blind) compared corticosteroids with placebo in 1569 patients with Bell’s palsy, 24 months to 84 years of age.1 The definition of mild and moderate severity of symptoms differed across studies, as did corticosteroid doses. Only 6 trials required initiation of therapy within 3 days.
More patients in the corticosteroid group had completely recovered facial motor function at 6 months than patients taking placebo (77% vs 65%; 7 trials, 1507 patients; relative risk [RR]=0.71; 95% confidence interval [CI], 0.61-0.81; number needed to treat=10). Improvement in cosmetically disabling or severe disease wasn’t significant (5 trials, 668 patients; RR=0.97; 95% CI, 0.44-2.2).
Prednisolone with and without an antiviral reduces facial weakness
A 2012 prospective, randomized, double-blind, placebo-controlled, multicenter trial evaluated prednisolone (60 mg/day for 5 days, tapered for 5 days) in 829 adults, 18 to 75 years of age.2 Patients were randomized to one of 4 groups: placebo plus placebo, prednisolone plus placebo, valacyclovir plus placebo, and prednisolone plus valacyclovir. Facial function was assessed over 12 months using the Sunnybrook grading system (scored from 0 to 100; 0=complete paralysis, 100=normal function).
Compared to the groups not receiving any prednisolone, the 2 groups that received prednisolone, either with placebo or valacyclovir, had significantly less facial weakness at 12 months for both mild and moderate palsy (Sunnybrook scores <90: 184 patients; difference= −10.3%; 95% CI, −15.9 to −4.7; P<.001; Sunnybrook score <80: 134 patients; difference= −6.9%; 95% CI, −11.9 to −1.9; P=.01; Sunnybrook score <70: 98 patients; difference= −7.8%; 95% CI, −12.1 to −3.4; P<.001). Patients with severe disease (Sunnybrook score <50) didn’t show significant improvement (56 patients; difference= –2.9%; CI, −6.4 to 0.5; P=.10).
Guideline recommends corticosteroids for Bell’s palsy
The 2014 American Academy of Neurology evidence-based guideline reviewed all studies of the use of steroids in Bell’s palsy published after the original 2001 guideline.3 They found 2 high-quality RCTs, both of which are included in the 2010 Cochrane review. The 2014 guideline recommends corticosteroids for every patient who develops Bell’s palsy unless a medical contraindication exists (2 Class 1 studies [RCTs], Level A [must prescribe or offer]).
1. Salinas RA, Alvarez G, Daly F, et al. Corticosteroids for Bell’s palsy (idiopathic facial paralysis). Cochrane Database Syst Rev. 2010;(3):CD001942.
2. Berg T, Bylund N, Marsk E, et al. The effect of prednisolone on sequelae in Bell’s palsy. Arch Otolaryngol Head Neck Surg. 2012;138:445-449.
3. Gronseth G, Paduga R, American Academy of Neurology. Evidence-based guideline update: steroids and antivirals for Bell’s palsy: report of the Guideline Development Subcommittee of the American Academy of Neurology. Neurology. 2012;79:2209-2213.
1. Salinas RA, Alvarez G, Daly F, et al. Corticosteroids for Bell’s palsy (idiopathic facial paralysis). Cochrane Database Syst Rev. 2010;(3):CD001942.
2. Berg T, Bylund N, Marsk E, et al. The effect of prednisolone on sequelae in Bell’s palsy. Arch Otolaryngol Head Neck Surg. 2012;138:445-449.
3. Gronseth G, Paduga R, American Academy of Neurology. Evidence-based guideline update: steroids and antivirals for Bell’s palsy: report of the Guideline Development Subcommittee of the American Academy of Neurology. Neurology. 2012;79:2209-2213.
Evidence-based answers from the Family Physicians Inquiries Network
Stem cell therapy for MS: Steady progress but not ready for general use
NEW ORLEANS – Stem cell-mediated functional regeneration continues to attract interest in the treatment of multiple sclerosis (MS). The reality, however, is daunting.
“Several types of cell-based therapeutic strategies are under investigation, with different risks, benefits, and goals. Some of these strategies show promise but significant methodological questions need to be answered,” Dr. Andrew D. Goodman said at a meeting held by the Americas Committee for Treatment and Research in Multiple Sclerosis.

The present reality is that stem cell transplantation is not yet ready for general use to treat MS. Yet, the possible benefits of the approach demand further exploration, including clinical trials, according to Dr. Goodman, professor of neurology, chief of the neuroimmunology unit, and director of the multiple sclerosis center at the University of Rochester (N.Y.).
MS stem cell therapy hinges on the pluripotent nature of stem cells, particularly mesenchymal stem cells (MSCs) and hematopoietic stem cells. MS therapy would involve regeneration of nerve cell myelin in the brain and/or spinal cord and possibly suppression of inflammation.
Autologous HSC transplantation
Immunoablation followed by the autologous HSC transplantation (HSCT) has been explored in the ASTIMS phase II randomized trials (Neurology. Mar 10;84[10]:981-8 and HALT-MS, JAMA Neurol. 2015 Feb;72[2]:159-69), and in a Northwestern University case series (JAMA. 2015 Jan 20;313[3]:275-84).
ASTIMS compared high-dose chemotherapy followed by autologous HSCT with mitoxantrone (which is no longer used). Only 22% percent of patients had relapsing-remitting MS (RRMS; the one where HSCT generally works) and 78% had primary progressive MS (where HSCT generally does not work well or is not optimal). Yet, HSCT worked, with new T2 lesions reduced by 79%. No difference in disability progression was evident. Interim (3-year) results of HALT-MS were encouraging, with sustained remission of active RRMS and improved neurologic function. The Northwestern case series also documented improvements in neurologic disability and other clinical outcomes.
“The available data suggest that immunoablation and HSCT is highly effective in active RRMS. Patients most likely to benefit are young and still ambulatory with a relatively recent disease onset featuring highly active MS with MRI lesion activity and continued activity despite first- and second-line agents,” Dr. Goodman said.
While encouraging, the small patient numbers of the two trials and uncontrolled nature of the case series prevent conclusions concerning the therapeutic use of autologous HSCT in RRMS. Furthermore, risks of the approach include MS relapse, treatment-related adverse effects, adverse effects due to myelosuppression and immunoablation, and secondary autoimmune disorders that may arise at a later time.
Mesenchymal stem cell transplantation
MSCs offer the advantages of a variety of sources in adult tissue, established methods of culture, and either local or peripheral administration. Their finite capacity for proliferation is a drawback. Studies to date of MSC transplantation in MS have involved about 100 patients, so it is much too early to consider MSC use. Even if therapy is contemplated, whether it should be directed at quelling inflammation or to promote repair is undecided. As well, cell production and delivery issues need to be addressed, Dr. Goodman said.
Human oligodendrocyte progenitor cell transplantation
The implantation of CD 140a+ cell populations containing human oligodendrocyte progenitor cells (hOPCs) into the cerebral hemispheres of patients with non-relapsing secondary progressive MS as a means of stabilizing or improving neurological function is being planned. The NYSTEM project, with Dr. Goodman as a lead investigator, will first seek to identify the maximum tolerated dose of hOPCs.
The study is planned with the knowledge of safety issues that include cancer tumorigenesis. Yet exploration of the possible benefits will be evident only by testing in humans. “I don’t know of any way to find out except by trying,” Dr. Goodman said.
Dr. Goodman disclosed receiving research support and/or serving as a consultant to Avanir, Teva, Genzyme/Sanofi, Sun Pharma, Ono, Roche, AbbVie, Biogen, Novartis, Acorda, Purdue, and EMD Serono.
NEW ORLEANS – Stem cell-mediated functional regeneration continues to attract interest in the treatment of multiple sclerosis (MS). The reality, however, is daunting.
“Several types of cell-based therapeutic strategies are under investigation, with different risks, benefits, and goals. Some of these strategies show promise but significant methodological questions need to be answered,” Dr. Andrew D. Goodman said at a meeting held by the Americas Committee for Treatment and Research in Multiple Sclerosis.
The present reality is that stem cell transplantation is not yet ready for general use to treat MS. Yet, the possible benefits of the approach demand further exploration, including clinical trials, according to Dr. Goodman, professor of neurology, chief of the neuroimmunology unit, and director of the multiple sclerosis center at the University of Rochester (N.Y.).
MS stem cell therapy hinges on the pluripotent nature of stem cells, particularly mesenchymal stem cells (MSCs) and hematopoietic stem cells. MS therapy would involve regeneration of nerve cell myelin in the brain and/or spinal cord and possibly suppression of inflammation.
Autologous HSC transplantation
Immunoablation followed by the autologous HSC transplantation (HSCT) has been explored in the ASTIMS phase II randomized trials (Neurology. Mar 10;84[10]:981-8 and HALT-MS, JAMA Neurol. 2015 Feb;72[2]:159-69), and in a Northwestern University case series (JAMA. 2015 Jan 20;313[3]:275-84).
ASTIMS compared high-dose chemotherapy followed by autologous HSCT with mitoxantrone (which is no longer used). Only 22% percent of patients had relapsing-remitting MS (RRMS; the one where HSCT generally works) and 78% had primary progressive MS (where HSCT generally does not work well or is not optimal). Yet, HSCT worked, with new T2 lesions reduced by 79%. No difference in disability progression was evident. Interim (3-year) results of HALT-MS were encouraging, with sustained remission of active RRMS and improved neurologic function. The Northwestern case series also documented improvements in neurologic disability and other clinical outcomes.
“The available data suggest that immunoablation and HSCT is highly effective in active RRMS. Patients most likely to benefit are young and still ambulatory with a relatively recent disease onset featuring highly active MS with MRI lesion activity and continued activity despite first- and second-line agents,” Dr. Goodman said.
While encouraging, the small patient numbers of the two trials and uncontrolled nature of the case series prevent conclusions concerning the therapeutic use of autologous HSCT in RRMS. Furthermore, risks of the approach include MS relapse, treatment-related adverse effects, adverse effects due to myelosuppression and immunoablation, and secondary autoimmune disorders that may arise at a later time.
Mesenchymal stem cell transplantation
MSCs offer the advantages of a variety of sources in adult tissue, established methods of culture, and either local or peripheral administration. Their finite capacity for proliferation is a drawback. Studies to date of MSC transplantation in MS have involved about 100 patients, so it is much too early to consider MSC use. Even if therapy is contemplated, whether it should be directed at quelling inflammation or to promote repair is undecided. As well, cell production and delivery issues need to be addressed, Dr. Goodman said.
Human oligodendrocyte progenitor cell transplantation
The implantation of CD 140a+ cell populations containing human oligodendrocyte progenitor cells (hOPCs) into the cerebral hemispheres of patients with non-relapsing secondary progressive MS as a means of stabilizing or improving neurological function is being planned. The NYSTEM project, with Dr. Goodman as a lead investigator, will first seek to identify the maximum tolerated dose of hOPCs.
The study is planned with the knowledge of safety issues that include cancer tumorigenesis. Yet exploration of the possible benefits will be evident only by testing in humans. “I don’t know of any way to find out except by trying,” Dr. Goodman said.
Dr. Goodman disclosed receiving research support and/or serving as a consultant to Avanir, Teva, Genzyme/Sanofi, Sun Pharma, Ono, Roche, AbbVie, Biogen, Novartis, Acorda, Purdue, and EMD Serono.
NEW ORLEANS – Stem cell-mediated functional regeneration continues to attract interest in the treatment of multiple sclerosis (MS). The reality, however, is daunting.
“Several types of cell-based therapeutic strategies are under investigation, with different risks, benefits, and goals. Some of these strategies show promise but significant methodological questions need to be answered,” Dr. Andrew D. Goodman said at a meeting held by the Americas Committee for Treatment and Research in Multiple Sclerosis.
The present reality is that stem cell transplantation is not yet ready for general use to treat MS. Yet, the possible benefits of the approach demand further exploration, including clinical trials, according to Dr. Goodman, professor of neurology, chief of the neuroimmunology unit, and director of the multiple sclerosis center at the University of Rochester (N.Y.).
MS stem cell therapy hinges on the pluripotent nature of stem cells, particularly mesenchymal stem cells (MSCs) and hematopoietic stem cells. MS therapy would involve regeneration of nerve cell myelin in the brain and/or spinal cord and possibly suppression of inflammation.
Autologous HSC transplantation
Immunoablation followed by the autologous HSC transplantation (HSCT) has been explored in the ASTIMS phase II randomized trials (Neurology. Mar 10;84[10]:981-8 and HALT-MS, JAMA Neurol. 2015 Feb;72[2]:159-69), and in a Northwestern University case series (JAMA. 2015 Jan 20;313[3]:275-84).
ASTIMS compared high-dose chemotherapy followed by autologous HSCT with mitoxantrone (which is no longer used). Only 22% percent of patients had relapsing-remitting MS (RRMS; the one where HSCT generally works) and 78% had primary progressive MS (where HSCT generally does not work well or is not optimal). Yet, HSCT worked, with new T2 lesions reduced by 79%. No difference in disability progression was evident. Interim (3-year) results of HALT-MS were encouraging, with sustained remission of active RRMS and improved neurologic function. The Northwestern case series also documented improvements in neurologic disability and other clinical outcomes.
“The available data suggest that immunoablation and HSCT is highly effective in active RRMS. Patients most likely to benefit are young and still ambulatory with a relatively recent disease onset featuring highly active MS with MRI lesion activity and continued activity despite first- and second-line agents,” Dr. Goodman said.
While encouraging, the small patient numbers of the two trials and uncontrolled nature of the case series prevent conclusions concerning the therapeutic use of autologous HSCT in RRMS. Furthermore, risks of the approach include MS relapse, treatment-related adverse effects, adverse effects due to myelosuppression and immunoablation, and secondary autoimmune disorders that may arise at a later time.
Mesenchymal stem cell transplantation
MSCs offer the advantages of a variety of sources in adult tissue, established methods of culture, and either local or peripheral administration. Their finite capacity for proliferation is a drawback. Studies to date of MSC transplantation in MS have involved about 100 patients, so it is much too early to consider MSC use. Even if therapy is contemplated, whether it should be directed at quelling inflammation or to promote repair is undecided. As well, cell production and delivery issues need to be addressed, Dr. Goodman said.
Human oligodendrocyte progenitor cell transplantation
The implantation of CD 140a+ cell populations containing human oligodendrocyte progenitor cells (hOPCs) into the cerebral hemispheres of patients with non-relapsing secondary progressive MS as a means of stabilizing or improving neurological function is being planned. The NYSTEM project, with Dr. Goodman as a lead investigator, will first seek to identify the maximum tolerated dose of hOPCs.
The study is planned with the knowledge of safety issues that include cancer tumorigenesis. Yet exploration of the possible benefits will be evident only by testing in humans. “I don’t know of any way to find out except by trying,” Dr. Goodman said.
Dr. Goodman disclosed receiving research support and/or serving as a consultant to Avanir, Teva, Genzyme/Sanofi, Sun Pharma, Ono, Roche, AbbVie, Biogen, Novartis, Acorda, Purdue, and EMD Serono.
EXPERT ANALYSIS FROM ACTRIMS FORUM 2016

QI and Patient Safety: No Longer Just an Elective for Trainees
The demand for training in healthcare quality and patient safety, for both medical students and residents, has never been higher. The Quality and Safety Educators Academy (QSEA, sites.hospitalmedicine.org/qsea) responds to that demand by providing medical educators with the knowledge and tools to integrate quality improvement and safety concepts into their curricula.
Sponsored by the Society of Hospital Medicine (SHM) and the Alliance for Academic Internal Medicine (AAIM), QSEA 2016 is a two-and-a-half-day course designed as a faculty development program. This year, QSEA will be held at Tempe Mission Palms Hotel and Conference Center in Tempe, Ariz., from May 23 to 25.
Attendees will enjoy a hands-on, interactive learning environment with a 10-to-1 student-to-faculty ratio. Participants will develop a professional network and leave with a tool kit of educational resources and curricular tools for quality and safety education.
Think QSEA is for you? Make plans to attend now if you are:
- A program director or assistant program director interested in acquiring new curricular ideas to help meet the ACGME requirements, which require residency programs to integrate quality and safety in their curriculum
- A medical school leader or clerkship director developing quality and safety curricula for students
- A faculty member beginning a new role or expanding an existing role in quality and safety education
- A quality and safety leader who wishes to extend influence and effectiveness by learning strategies to teach and engage trainees
QSEA has sold out each of the past four years, so don’t delay. Register online at sites.hospitalmedicine.org/qsea/register.html or via phone at 800-843-3360. Questions? Email [email protected]. TH
Brett Radler is SHM’s communications coordinator.
The demand for training in healthcare quality and patient safety, for both medical students and residents, has never been higher. The Quality and Safety Educators Academy (QSEA, sites.hospitalmedicine.org/qsea) responds to that demand by providing medical educators with the knowledge and tools to integrate quality improvement and safety concepts into their curricula.
Sponsored by the Society of Hospital Medicine (SHM) and the Alliance for Academic Internal Medicine (AAIM), QSEA 2016 is a two-and-a-half-day course designed as a faculty development program. This year, QSEA will be held at Tempe Mission Palms Hotel and Conference Center in Tempe, Ariz., from May 23 to 25.
Attendees will enjoy a hands-on, interactive learning environment with a 10-to-1 student-to-faculty ratio. Participants will develop a professional network and leave with a tool kit of educational resources and curricular tools for quality and safety education.
Think QSEA is for you? Make plans to attend now if you are:
- A program director or assistant program director interested in acquiring new curricular ideas to help meet the ACGME requirements, which require residency programs to integrate quality and safety in their curriculum
- A medical school leader or clerkship director developing quality and safety curricula for students
- A faculty member beginning a new role or expanding an existing role in quality and safety education
- A quality and safety leader who wishes to extend influence and effectiveness by learning strategies to teach and engage trainees
QSEA has sold out each of the past four years, so don’t delay. Register online at sites.hospitalmedicine.org/qsea/register.html or via phone at 800-843-3360. Questions? Email [email protected]. TH
Brett Radler is SHM’s communications coordinator.
The demand for training in healthcare quality and patient safety, for both medical students and residents, has never been higher. The Quality and Safety Educators Academy (QSEA, sites.hospitalmedicine.org/qsea) responds to that demand by providing medical educators with the knowledge and tools to integrate quality improvement and safety concepts into their curricula.
Sponsored by the Society of Hospital Medicine (SHM) and the Alliance for Academic Internal Medicine (AAIM), QSEA 2016 is a two-and-a-half-day course designed as a faculty development program. This year, QSEA will be held at Tempe Mission Palms Hotel and Conference Center in Tempe, Ariz., from May 23 to 25.
Attendees will enjoy a hands-on, interactive learning environment with a 10-to-1 student-to-faculty ratio. Participants will develop a professional network and leave with a tool kit of educational resources and curricular tools for quality and safety education.
Think QSEA is for you? Make plans to attend now if you are:
- A program director or assistant program director interested in acquiring new curricular ideas to help meet the ACGME requirements, which require residency programs to integrate quality and safety in their curriculum
- A medical school leader or clerkship director developing quality and safety curricula for students
- A faculty member beginning a new role or expanding an existing role in quality and safety education
- A quality and safety leader who wishes to extend influence and effectiveness by learning strategies to teach and engage trainees
QSEA has sold out each of the past four years, so don’t delay. Register online at sites.hospitalmedicine.org/qsea/register.html or via phone at 800-843-3360. Questions? Email [email protected]. TH
Brett Radler is SHM’s communications coordinator.
U.S. flu activity continues steady climb
Influenza-like illness (ILI) activity reached a new national high for the 2015-2016 flu season during the week ending Feb. 20, according to the Centers for Disease Control and Prevention.
Nationwide, the proportion of outpatient visits for ILI was 3.2%, up from 3.1% the week before and well over the national baseline of 2.1%. Arizona and Puerto Rico were still at level 10 on the CDC’s 1-10 scale for ILI activity, and they were joined in the “high” range of activity by California, New Mexico, North Carolina, Texas, and Utah, which were all at level 8, the CDC reported Feb. 26.
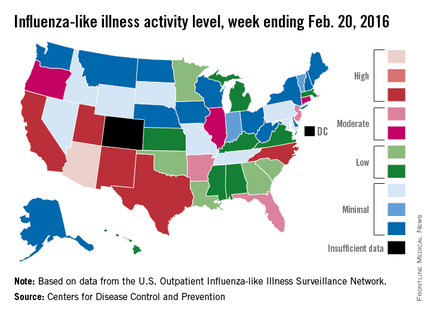
States in the “moderate” range of activity for week 19 of the 2015-2016 flu season (week 7 of calendar year 2016) were Arkansas, Florida, and New Jersey at level 7 and Connecticut, Illinois, and Oregon at level 6. There were 13 states in the “low” range of activity – five at level 5 and eight states at level 4 – and 24 states in the “minimal” range, of which 13 were at level 1. Colorado and the District of Columbia had insufficient data to determine activity level, according to data from the CDC’s Outpatient Influenza-like Illness Surveillance Network.
For the week, one flu-related pediatric death, associated with an influenza B virus, was reported to the CDC, bringing the total to 14 for the season. The only states reporting more that one death are California (two) and Florida (three), the CDC said. The average number of deaths for the three previous flu seasons is over 143.
During week 19, a total of 18,844 respiratory specimens were tested, 13.8% of which were positive: 76.1% for influenza A and 23.9% for influenza B. Since Oct. 1, 2015, 4.2% of specimens have tested positive for influenza, with a 70% to 30% split between influenza A and B, the CDC report showed.
Influenza-like illness (ILI) activity reached a new national high for the 2015-2016 flu season during the week ending Feb. 20, according to the Centers for Disease Control and Prevention.
Nationwide, the proportion of outpatient visits for ILI was 3.2%, up from 3.1% the week before and well over the national baseline of 2.1%. Arizona and Puerto Rico were still at level 10 on the CDC’s 1-10 scale for ILI activity, and they were joined in the “high” range of activity by California, New Mexico, North Carolina, Texas, and Utah, which were all at level 8, the CDC reported Feb. 26.
States in the “moderate” range of activity for week 19 of the 2015-2016 flu season (week 7 of calendar year 2016) were Arkansas, Florida, and New Jersey at level 7 and Connecticut, Illinois, and Oregon at level 6. There were 13 states in the “low” range of activity – five at level 5 and eight states at level 4 – and 24 states in the “minimal” range, of which 13 were at level 1. Colorado and the District of Columbia had insufficient data to determine activity level, according to data from the CDC’s Outpatient Influenza-like Illness Surveillance Network.
For the week, one flu-related pediatric death, associated with an influenza B virus, was reported to the CDC, bringing the total to 14 for the season. The only states reporting more that one death are California (two) and Florida (three), the CDC said. The average number of deaths for the three previous flu seasons is over 143.
During week 19, a total of 18,844 respiratory specimens were tested, 13.8% of which were positive: 76.1% for influenza A and 23.9% for influenza B. Since Oct. 1, 2015, 4.2% of specimens have tested positive for influenza, with a 70% to 30% split between influenza A and B, the CDC report showed.
Influenza-like illness (ILI) activity reached a new national high for the 2015-2016 flu season during the week ending Feb. 20, according to the Centers for Disease Control and Prevention.
Nationwide, the proportion of outpatient visits for ILI was 3.2%, up from 3.1% the week before and well over the national baseline of 2.1%. Arizona and Puerto Rico were still at level 10 on the CDC’s 1-10 scale for ILI activity, and they were joined in the “high” range of activity by California, New Mexico, North Carolina, Texas, and Utah, which were all at level 8, the CDC reported Feb. 26.
States in the “moderate” range of activity for week 19 of the 2015-2016 flu season (week 7 of calendar year 2016) were Arkansas, Florida, and New Jersey at level 7 and Connecticut, Illinois, and Oregon at level 6. There were 13 states in the “low” range of activity – five at level 5 and eight states at level 4 – and 24 states in the “minimal” range, of which 13 were at level 1. Colorado and the District of Columbia had insufficient data to determine activity level, according to data from the CDC’s Outpatient Influenza-like Illness Surveillance Network.
For the week, one flu-related pediatric death, associated with an influenza B virus, was reported to the CDC, bringing the total to 14 for the season. The only states reporting more that one death are California (two) and Florida (three), the CDC said. The average number of deaths for the three previous flu seasons is over 143.
During week 19, a total of 18,844 respiratory specimens were tested, 13.8% of which were positive: 76.1% for influenza A and 23.9% for influenza B. Since Oct. 1, 2015, 4.2% of specimens have tested positive for influenza, with a 70% to 30% split between influenza A and B, the CDC report showed.
FDA approves obinutuzumab for FL
The US Food and Drug Administration (FDA) has approved obinutuzumab (Gazyva) for certain patients with previously treated follicular lymphoma (FL).
Obinutuzumab is a glycoengineered, humanized, monoclonal antibody that selectively binds to the extracellular domain of the CD20 antigen on B cells.
The drug was previously approved by the FDA for use in combination with chlorambucil to treat patients with previously untreated chronic lymphocytic leukemia.
Now, obinutuzumab is approved for use in combination with bendamustine, followed by obinutuzumab alone, to treat patients with FL who did not respond to a rituximab-containing regimen or whose FL returned after such treatment.
The recommended dose and schedule for the regimen is:
- Obinutuzumab at 1000 mg by intravenous infusion on days 1, 8, and 15 of cycle 1; on day 1 of cycles 2-6 (28-day cycles); then every 2 months for 2 years.
- Bendamustine at 90 mg/m2 by intravenous infusion on days 1 and 2 of cycles 1-6.
Full prescribing information for obinutuzumab is available on the FDA website or at www.Gazyva.com.
Phase 3 study
The approval for obinutuzumab in FL is based on results from the phase 3 GADOLIN study. The trial included 413 patients with rituximab-refractory non-Hodgkin lymphoma, including 321 patients with FL, 46 with marginal zone lymphoma, and 28 with small lymphocytic lymphoma.
The patients were randomized to receive bendamustine alone (control arm) or a combination of bendamustine and obinutuzumab followed by obinutuzumab maintenance (every 2 months for 2 years or until progression).
The primary endpoint of the study was progression-free survival (PFS), as assessed by an independent review committee (IRC). The secondary endpoints were PFS as assessed by investigator review, best overall response, complete response (CR), partial response (PR), duration of response, overall survival, and safety profile.
Among patients with FL, the obinutuzumab regimen improved PFS compared to bendamustine alone, as assessed by IRC (hazard ratio [HR]=0.48, P<0.0001). The median PFS was not reached in patients receiving the obinutuzumab regimen but was 13.8 months in those receiving bendamustine alone.
Investigator-assessed PFS was consistent with IRC-assessed PFS. Investigators said the median PFS with the obinutuzumab regimen was more than double that with bendamustine alone—29.2 months vs 13.7 months (HR=0.48, P<0.0001).
Best overall response for patients receiving the obinutuzumab regimen was 78.7% (15.5% CR, 63.2% PR), compared to 74.7% for those receiving bendamustine alone (18.7% CR, 56% PR), as assessed by the IRC.
The median duration of response was not reached for patients receiving the obinutuzumab regimen and was 11.6 months for those receiving bendamustine alone.
The median overall survival has not yet been reached in either study arm.
The most common grade 3/4 adverse events observed in patients receiving the obinutuzumab regimen were neutropenia (33%), infusion reactions (11%), and thrombocytopenia (10%).
The most common adverse events of any grade were infusion reactions (69%), neutropenia (35%), nausea (54%), fatigue (39%), cough (26%), diarrhea (27%), constipation (19%), fever (18%), thrombocytopenia (15%), vomiting (22%), upper respiratory tract infection (13%), decreased appetite (18%), joint or muscle pain (12%), sinusitis (12%), anemia (12%), general weakness (11%), and urinary tract infection (10%).
About obinutuzumab
Obinutuzumab is being studied in a large clinical program, including the phase 3 GOYA and GALLIUM studies.
In GOYA, researchers are comparing obinutuzumab head-to-head with rituximab plus CHOP chemotherapy in first-line diffuse large B-cell lymphoma. In GALLIUM, researchers are comparing obinutuzumab plus chemotherapy head-to-head with rituximab plus chemotherapy in first-line indolent non-Hodgkin lymphoma.
Additional combination studies investigating obinutuzumab with other approved or investigational medicines, including cancer immunotherapies and small-molecule inhibitors, are planned or underway across a range of blood cancers.
Obinutuzumab was discovered by Roche Glycart AG, a wholly owned, independent research unit of Roche. In the US, obinutuzumab is part of a collaboration between Genentech and Biogen.
Genentech has a patient assistance program, Genentech Access Solutions, that can help qualifying patients access obinutuzumab and other Genentech medications.
The program is designed to help people navigate the access and reimbursement process and provide assistance to eligible patients in the US who are uninsured or cannot afford the out-of-pocket costs for their medicine. For more information, visit www.Genentech-Access.com. 
The US Food and Drug Administration (FDA) has approved obinutuzumab (Gazyva) for certain patients with previously treated follicular lymphoma (FL).
Obinutuzumab is a glycoengineered, humanized, monoclonal antibody that selectively binds to the extracellular domain of the CD20 antigen on B cells.
The drug was previously approved by the FDA for use in combination with chlorambucil to treat patients with previously untreated chronic lymphocytic leukemia.
Now, obinutuzumab is approved for use in combination with bendamustine, followed by obinutuzumab alone, to treat patients with FL who did not respond to a rituximab-containing regimen or whose FL returned after such treatment.
The recommended dose and schedule for the regimen is:
- Obinutuzumab at 1000 mg by intravenous infusion on days 1, 8, and 15 of cycle 1; on day 1 of cycles 2-6 (28-day cycles); then every 2 months for 2 years.
- Bendamustine at 90 mg/m2 by intravenous infusion on days 1 and 2 of cycles 1-6.
Full prescribing information for obinutuzumab is available on the FDA website or at www.Gazyva.com.
Phase 3 study
The approval for obinutuzumab in FL is based on results from the phase 3 GADOLIN study. The trial included 413 patients with rituximab-refractory non-Hodgkin lymphoma, including 321 patients with FL, 46 with marginal zone lymphoma, and 28 with small lymphocytic lymphoma.
The patients were randomized to receive bendamustine alone (control arm) or a combination of bendamustine and obinutuzumab followed by obinutuzumab maintenance (every 2 months for 2 years or until progression).
The primary endpoint of the study was progression-free survival (PFS), as assessed by an independent review committee (IRC). The secondary endpoints were PFS as assessed by investigator review, best overall response, complete response (CR), partial response (PR), duration of response, overall survival, and safety profile.
Among patients with FL, the obinutuzumab regimen improved PFS compared to bendamustine alone, as assessed by IRC (hazard ratio [HR]=0.48, P<0.0001). The median PFS was not reached in patients receiving the obinutuzumab regimen but was 13.8 months in those receiving bendamustine alone.
Investigator-assessed PFS was consistent with IRC-assessed PFS. Investigators said the median PFS with the obinutuzumab regimen was more than double that with bendamustine alone—29.2 months vs 13.7 months (HR=0.48, P<0.0001).
Best overall response for patients receiving the obinutuzumab regimen was 78.7% (15.5% CR, 63.2% PR), compared to 74.7% for those receiving bendamustine alone (18.7% CR, 56% PR), as assessed by the IRC.
The median duration of response was not reached for patients receiving the obinutuzumab regimen and was 11.6 months for those receiving bendamustine alone.
The median overall survival has not yet been reached in either study arm.
The most common grade 3/4 adverse events observed in patients receiving the obinutuzumab regimen were neutropenia (33%), infusion reactions (11%), and thrombocytopenia (10%).
The most common adverse events of any grade were infusion reactions (69%), neutropenia (35%), nausea (54%), fatigue (39%), cough (26%), diarrhea (27%), constipation (19%), fever (18%), thrombocytopenia (15%), vomiting (22%), upper respiratory tract infection (13%), decreased appetite (18%), joint or muscle pain (12%), sinusitis (12%), anemia (12%), general weakness (11%), and urinary tract infection (10%).
About obinutuzumab
Obinutuzumab is being studied in a large clinical program, including the phase 3 GOYA and GALLIUM studies.
In GOYA, researchers are comparing obinutuzumab head-to-head with rituximab plus CHOP chemotherapy in first-line diffuse large B-cell lymphoma. In GALLIUM, researchers are comparing obinutuzumab plus chemotherapy head-to-head with rituximab plus chemotherapy in first-line indolent non-Hodgkin lymphoma.
Additional combination studies investigating obinutuzumab with other approved or investigational medicines, including cancer immunotherapies and small-molecule inhibitors, are planned or underway across a range of blood cancers.
Obinutuzumab was discovered by Roche Glycart AG, a wholly owned, independent research unit of Roche. In the US, obinutuzumab is part of a collaboration between Genentech and Biogen.
Genentech has a patient assistance program, Genentech Access Solutions, that can help qualifying patients access obinutuzumab and other Genentech medications.
The program is designed to help people navigate the access and reimbursement process and provide assistance to eligible patients in the US who are uninsured or cannot afford the out-of-pocket costs for their medicine. For more information, visit www.Genentech-Access.com.
The US Food and Drug Administration (FDA) has approved obinutuzumab (Gazyva) for certain patients with previously treated follicular lymphoma (FL).
Obinutuzumab is a glycoengineered, humanized, monoclonal antibody that selectively binds to the extracellular domain of the CD20 antigen on B cells.
The drug was previously approved by the FDA for use in combination with chlorambucil to treat patients with previously untreated chronic lymphocytic leukemia.
Now, obinutuzumab is approved for use in combination with bendamustine, followed by obinutuzumab alone, to treat patients with FL who did not respond to a rituximab-containing regimen or whose FL returned after such treatment.
The recommended dose and schedule for the regimen is:
- Obinutuzumab at 1000 mg by intravenous infusion on days 1, 8, and 15 of cycle 1; on day 1 of cycles 2-6 (28-day cycles); then every 2 months for 2 years.
- Bendamustine at 90 mg/m2 by intravenous infusion on days 1 and 2 of cycles 1-6.
Full prescribing information for obinutuzumab is available on the FDA website or at www.Gazyva.com.
Phase 3 study
The approval for obinutuzumab in FL is based on results from the phase 3 GADOLIN study. The trial included 413 patients with rituximab-refractory non-Hodgkin lymphoma, including 321 patients with FL, 46 with marginal zone lymphoma, and 28 with small lymphocytic lymphoma.
The patients were randomized to receive bendamustine alone (control arm) or a combination of bendamustine and obinutuzumab followed by obinutuzumab maintenance (every 2 months for 2 years or until progression).
The primary endpoint of the study was progression-free survival (PFS), as assessed by an independent review committee (IRC). The secondary endpoints were PFS as assessed by investigator review, best overall response, complete response (CR), partial response (PR), duration of response, overall survival, and safety profile.
Among patients with FL, the obinutuzumab regimen improved PFS compared to bendamustine alone, as assessed by IRC (hazard ratio [HR]=0.48, P<0.0001). The median PFS was not reached in patients receiving the obinutuzumab regimen but was 13.8 months in those receiving bendamustine alone.
Investigator-assessed PFS was consistent with IRC-assessed PFS. Investigators said the median PFS with the obinutuzumab regimen was more than double that with bendamustine alone—29.2 months vs 13.7 months (HR=0.48, P<0.0001).
Best overall response for patients receiving the obinutuzumab regimen was 78.7% (15.5% CR, 63.2% PR), compared to 74.7% for those receiving bendamustine alone (18.7% CR, 56% PR), as assessed by the IRC.
The median duration of response was not reached for patients receiving the obinutuzumab regimen and was 11.6 months for those receiving bendamustine alone.
The median overall survival has not yet been reached in either study arm.
The most common grade 3/4 adverse events observed in patients receiving the obinutuzumab regimen were neutropenia (33%), infusion reactions (11%), and thrombocytopenia (10%).
The most common adverse events of any grade were infusion reactions (69%), neutropenia (35%), nausea (54%), fatigue (39%), cough (26%), diarrhea (27%), constipation (19%), fever (18%), thrombocytopenia (15%), vomiting (22%), upper respiratory tract infection (13%), decreased appetite (18%), joint or muscle pain (12%), sinusitis (12%), anemia (12%), general weakness (11%), and urinary tract infection (10%).
About obinutuzumab
Obinutuzumab is being studied in a large clinical program, including the phase 3 GOYA and GALLIUM studies.
In GOYA, researchers are comparing obinutuzumab head-to-head with rituximab plus CHOP chemotherapy in first-line diffuse large B-cell lymphoma. In GALLIUM, researchers are comparing obinutuzumab plus chemotherapy head-to-head with rituximab plus chemotherapy in first-line indolent non-Hodgkin lymphoma.
Additional combination studies investigating obinutuzumab with other approved or investigational medicines, including cancer immunotherapies and small-molecule inhibitors, are planned or underway across a range of blood cancers.
Obinutuzumab was discovered by Roche Glycart AG, a wholly owned, independent research unit of Roche. In the US, obinutuzumab is part of a collaboration between Genentech and Biogen.
Genentech has a patient assistance program, Genentech Access Solutions, that can help qualifying patients access obinutuzumab and other Genentech medications.
The program is designed to help people navigate the access and reimbursement process and provide assistance to eligible patients in the US who are uninsured or cannot afford the out-of-pocket costs for their medicine. For more information, visit www.Genentech-Access.com.
Brain atrophy may be a clinically relevant measure in PPMS: Data from INFORMS
NEW ORLEANS – The recently published results of the INFORMS multicenter, double-blind, placebo-controlled parallel-group study (NCT00731692) that compared the efficacy of fingolimod in slowing disease progression in primary progressive multiple sclerosis (PPMS) with placebo proved disappointing. However, further scrutiny of the data has provided valuable insights, such as supportive evidence for brain atrophy as a clinically relevant measure in PPMS patients.
“The degree of clinical worsening was directly associated with patient’s extent of brain volume loss. Patients in the extreme category of disability progression had more brain volume loss than patients with only one progression or those who remained clinically stable,” wrote Dr. Jerry Wolinsky of the University of Texas Health Science Center at Houston and his colleagues in a poster presented Feb. 19 at the meeting held by the Americas Committee for Treatment and Research in Multiple Sclerosis.

In INFORMS, 970 patients with PPMS were randomly allocated (1:1) to receive oral fingolimod 0.5 mg or placebo for at least 36 months and for up to 5 years. The anti-inflammatory effects of fingolimod did not slow disease progression in PPMS.
While INFORMS did not pan out in terms of the primary endpoint, the long duration of the study, use of various progression measures, and rigorous patient selection offered the unique opportunity to assess the associations of magnetic resonance imaging of the brain over at least 3 years of the clinical progression occurring in patients with PPMS.
All patients had being clinically diagnosed with PPMS, with disease duration of 2-10 years and objective evidence of progression in disability in the prior 2 years. The composite endpoint of INFORMS based on the change in Expanded Disability Status Scale (EDSS), 25-Foot Timed Walk Test, or 9-Hole Peg Test was used to gauge 3-month confirmed disease progression (3CDP). The patients were classified according to EDSS-determined disease progression as extreme (more than one occurrence of 3CDP; n = 162), moderate (one occurrence of 3CDP; n = 309), and stable (no 3CDP; n = 499).
Mean age, % male, and baseline EDSS scores were similar across the three categories (whole population: 48.4 ± 8.4 years; 51.6%; and 4.7 ± 1.0, respectively). Mean number of gadolinium-positive lesions in the extreme and stable category was 0.39 ± 1.1 and 0.25 ± 1.0, respectively. Baseline T2 lesion volume was 10,160.8 ± 12,743.3 mm3 in extreme patients and 9,585.8 ± 12,421.6 mm3 in stable patients.
Patients in the extreme category displayed greater changes in the three endpoint measures than did the moderate and stable categories. At month 36, the mean change in brain volume, compared with baseline, was –1.76 ± 1.4 in the extreme group and –1.26 ± 0.9 in stable group. Corresponding values for mean number of gadolinium-positive lesions were 0.40 ± 1.4 and 0.10 ± 0.5. Corresponding numbers of new/newly enlarging T2 lesions from baseline to month 36 were 1.7 ± 4.6 and 0.9 ± 2.9.
Patients in the extreme category exceeded the recently proposed cut-off for pathologically increased brain volume loss by about 60%, compared with only about 14% for patients in the stable category.
The higher change in brain volume from baseline in patients who progressed to extreme disability “supports brain atrophy as a clinically relevant measure of neuroprotection in PPMS trials,” wrote Dr. Wolinsky and his colleagues.
The study was funded by Novartis Pharma AG. Dr. Wolinsky disclosed consulting fees from Genzyme/Sanofi, Hoffmann-La Roche/Genentech, Forward Pharma, Alkermes, AbbVie, Novartis Pharmaceuticals, Teva, and XenoPort and advisory board participation for Hoffman-La Roche/Genentech, Forward Pharma, EMD Serono, Actelion, Novartis Pharmaceuticals, Teva, and Xenoport. He performed contract research for Genzyme/Sanofi.
NEW ORLEANS – The recently published results of the INFORMS multicenter, double-blind, placebo-controlled parallel-group study (NCT00731692) that compared the efficacy of fingolimod in slowing disease progression in primary progressive multiple sclerosis (PPMS) with placebo proved disappointing. However, further scrutiny of the data has provided valuable insights, such as supportive evidence for brain atrophy as a clinically relevant measure in PPMS patients.
“The degree of clinical worsening was directly associated with patient’s extent of brain volume loss. Patients in the extreme category of disability progression had more brain volume loss than patients with only one progression or those who remained clinically stable,” wrote Dr. Jerry Wolinsky of the University of Texas Health Science Center at Houston and his colleagues in a poster presented Feb. 19 at the meeting held by the Americas Committee for Treatment and Research in Multiple Sclerosis.
In INFORMS, 970 patients with PPMS were randomly allocated (1:1) to receive oral fingolimod 0.5 mg or placebo for at least 36 months and for up to 5 years. The anti-inflammatory effects of fingolimod did not slow disease progression in PPMS.
While INFORMS did not pan out in terms of the primary endpoint, the long duration of the study, use of various progression measures, and rigorous patient selection offered the unique opportunity to assess the associations of magnetic resonance imaging of the brain over at least 3 years of the clinical progression occurring in patients with PPMS.
All patients had being clinically diagnosed with PPMS, with disease duration of 2-10 years and objective evidence of progression in disability in the prior 2 years. The composite endpoint of INFORMS based on the change in Expanded Disability Status Scale (EDSS), 25-Foot Timed Walk Test, or 9-Hole Peg Test was used to gauge 3-month confirmed disease progression (3CDP). The patients were classified according to EDSS-determined disease progression as extreme (more than one occurrence of 3CDP; n = 162), moderate (one occurrence of 3CDP; n = 309), and stable (no 3CDP; n = 499).
Mean age, % male, and baseline EDSS scores were similar across the three categories (whole population: 48.4 ± 8.4 years; 51.6%; and 4.7 ± 1.0, respectively). Mean number of gadolinium-positive lesions in the extreme and stable category was 0.39 ± 1.1 and 0.25 ± 1.0, respectively. Baseline T2 lesion volume was 10,160.8 ± 12,743.3 mm3 in extreme patients and 9,585.8 ± 12,421.6 mm3 in stable patients.
Patients in the extreme category displayed greater changes in the three endpoint measures than did the moderate and stable categories. At month 36, the mean change in brain volume, compared with baseline, was –1.76 ± 1.4 in the extreme group and –1.26 ± 0.9 in stable group. Corresponding values for mean number of gadolinium-positive lesions were 0.40 ± 1.4 and 0.10 ± 0.5. Corresponding numbers of new/newly enlarging T2 lesions from baseline to month 36 were 1.7 ± 4.6 and 0.9 ± 2.9.
Patients in the extreme category exceeded the recently proposed cut-off for pathologically increased brain volume loss by about 60%, compared with only about 14% for patients in the stable category.
The higher change in brain volume from baseline in patients who progressed to extreme disability “supports brain atrophy as a clinically relevant measure of neuroprotection in PPMS trials,” wrote Dr. Wolinsky and his colleagues.
The study was funded by Novartis Pharma AG. Dr. Wolinsky disclosed consulting fees from Genzyme/Sanofi, Hoffmann-La Roche/Genentech, Forward Pharma, Alkermes, AbbVie, Novartis Pharmaceuticals, Teva, and XenoPort and advisory board participation for Hoffman-La Roche/Genentech, Forward Pharma, EMD Serono, Actelion, Novartis Pharmaceuticals, Teva, and Xenoport. He performed contract research for Genzyme/Sanofi.
NEW ORLEANS – The recently published results of the INFORMS multicenter, double-blind, placebo-controlled parallel-group study (NCT00731692) that compared the efficacy of fingolimod in slowing disease progression in primary progressive multiple sclerosis (PPMS) with placebo proved disappointing. However, further scrutiny of the data has provided valuable insights, such as supportive evidence for brain atrophy as a clinically relevant measure in PPMS patients.
“The degree of clinical worsening was directly associated with patient’s extent of brain volume loss. Patients in the extreme category of disability progression had more brain volume loss than patients with only one progression or those who remained clinically stable,” wrote Dr. Jerry Wolinsky of the University of Texas Health Science Center at Houston and his colleagues in a poster presented Feb. 19 at the meeting held by the Americas Committee for Treatment and Research in Multiple Sclerosis.
In INFORMS, 970 patients with PPMS were randomly allocated (1:1) to receive oral fingolimod 0.5 mg or placebo for at least 36 months and for up to 5 years. The anti-inflammatory effects of fingolimod did not slow disease progression in PPMS.
While INFORMS did not pan out in terms of the primary endpoint, the long duration of the study, use of various progression measures, and rigorous patient selection offered the unique opportunity to assess the associations of magnetic resonance imaging of the brain over at least 3 years of the clinical progression occurring in patients with PPMS.
All patients had being clinically diagnosed with PPMS, with disease duration of 2-10 years and objective evidence of progression in disability in the prior 2 years. The composite endpoint of INFORMS based on the change in Expanded Disability Status Scale (EDSS), 25-Foot Timed Walk Test, or 9-Hole Peg Test was used to gauge 3-month confirmed disease progression (3CDP). The patients were classified according to EDSS-determined disease progression as extreme (more than one occurrence of 3CDP; n = 162), moderate (one occurrence of 3CDP; n = 309), and stable (no 3CDP; n = 499).
Mean age, % male, and baseline EDSS scores were similar across the three categories (whole population: 48.4 ± 8.4 years; 51.6%; and 4.7 ± 1.0, respectively). Mean number of gadolinium-positive lesions in the extreme and stable category was 0.39 ± 1.1 and 0.25 ± 1.0, respectively. Baseline T2 lesion volume was 10,160.8 ± 12,743.3 mm3 in extreme patients and 9,585.8 ± 12,421.6 mm3 in stable patients.
Patients in the extreme category displayed greater changes in the three endpoint measures than did the moderate and stable categories. At month 36, the mean change in brain volume, compared with baseline, was –1.76 ± 1.4 in the extreme group and –1.26 ± 0.9 in stable group. Corresponding values for mean number of gadolinium-positive lesions were 0.40 ± 1.4 and 0.10 ± 0.5. Corresponding numbers of new/newly enlarging T2 lesions from baseline to month 36 were 1.7 ± 4.6 and 0.9 ± 2.9.
Patients in the extreme category exceeded the recently proposed cut-off for pathologically increased brain volume loss by about 60%, compared with only about 14% for patients in the stable category.
The higher change in brain volume from baseline in patients who progressed to extreme disability “supports brain atrophy as a clinically relevant measure of neuroprotection in PPMS trials,” wrote Dr. Wolinsky and his colleagues.
The study was funded by Novartis Pharma AG. Dr. Wolinsky disclosed consulting fees from Genzyme/Sanofi, Hoffmann-La Roche/Genentech, Forward Pharma, Alkermes, AbbVie, Novartis Pharmaceuticals, Teva, and XenoPort and advisory board participation for Hoffman-La Roche/Genentech, Forward Pharma, EMD Serono, Actelion, Novartis Pharmaceuticals, Teva, and Xenoport. He performed contract research for Genzyme/Sanofi.
Key clinical point: Brain atrophy could be a clinically useful and relevant measure in primary progressing multiple sclerosis.
Major finding: Progression to extreme disability was associated with greater brain volume loss.
Data source: Data from the multinational, double-blind, placebo-controlled, parallel-group INFORMS trial.
Disclosures: The study was funded by Novartis Pharma AG. Dr. Wolinsky disclosed consulting fees from Genzyme/Sanofi, Hoffmann-La Roche/Genentech, Forward Pharma, Alkermes, AbbVie, Novartis Pharmaceuticals, Teva, and XenoPort, and advisory board participation for Hoffman-La Roche/Genentech, Forward Pharma, EMD Serono, Actelion, Novartis Pharmaceuticals, Teva, and Xenoport. He performed contract research for Genzyme/Sanofi.

Triage MS-related ED visits to reduce unnecessary treatment
NEW ORLEANS – The majority of multiple sclerosis–related emergency department visits in a recent chart review were related to pseudoflares or MS-related complications, rather than to true MS relapse.
The findings suggest that many diagnostic tests, treatments, and hospital admissions are unnecessary, Dr. Hesham Abboud of the Cleveland Clinic and his colleagues reported in a poster at the meeting held by the Americas Committee for Treatment and Research in Multiple Sclerosis.
Of 97 MS-related visits among 75 patients, 33 were for new neurologic symptoms, 29 were for worsening of preexisting symptoms, and 36 were for MS-related complications. New relapse was diagnosed in only 27 visits (27.8%), and urinary tract infections were found in about one-third of patients presenting with either urinary or neurologic symptoms, the investigators said.
New MRIs were ordered in 37 patients (38.1%); 89 emergency department visits (91.7%) resulted in hospital admissions and 40.4% were related to neurology; and steroid treatment was used in 24 visits (24.7%), 7 of which were for worsening of preexisting symptoms, the investigators said.
Of the visits involving new neurologic symptoms, one-third were not from relapse; 59% of the MRIs done in those situations were positive for enhancing or new lesions. Of the visits with worsening preexisting symptoms, only 16.6% were associated with a new relapse, and 28.5% of MRIs done in those situations were positive, the investigators said.
Although many ED visits among MS patients are driven by neurologic complaints, true relapse is rarely present, and not all those with true relapse require hospital admission and steroid treatment, they noted, concluding that developing a care path and triaging system for MS patients in the ED could prevent unnecessary MRIs, steroid treatment, and hospital admissions.
The investigators reported having no disclosures.
NEW ORLEANS – The majority of multiple sclerosis–related emergency department visits in a recent chart review were related to pseudoflares or MS-related complications, rather than to true MS relapse.
The findings suggest that many diagnostic tests, treatments, and hospital admissions are unnecessary, Dr. Hesham Abboud of the Cleveland Clinic and his colleagues reported in a poster at the meeting held by the Americas Committee for Treatment and Research in Multiple Sclerosis.
Of 97 MS-related visits among 75 patients, 33 were for new neurologic symptoms, 29 were for worsening of preexisting symptoms, and 36 were for MS-related complications. New relapse was diagnosed in only 27 visits (27.8%), and urinary tract infections were found in about one-third of patients presenting with either urinary or neurologic symptoms, the investigators said.
New MRIs were ordered in 37 patients (38.1%); 89 emergency department visits (91.7%) resulted in hospital admissions and 40.4% were related to neurology; and steroid treatment was used in 24 visits (24.7%), 7 of which were for worsening of preexisting symptoms, the investigators said.
Of the visits involving new neurologic symptoms, one-third were not from relapse; 59% of the MRIs done in those situations were positive for enhancing or new lesions. Of the visits with worsening preexisting symptoms, only 16.6% were associated with a new relapse, and 28.5% of MRIs done in those situations were positive, the investigators said.
Although many ED visits among MS patients are driven by neurologic complaints, true relapse is rarely present, and not all those with true relapse require hospital admission and steroid treatment, they noted, concluding that developing a care path and triaging system for MS patients in the ED could prevent unnecessary MRIs, steroid treatment, and hospital admissions.
The investigators reported having no disclosures.
NEW ORLEANS – The majority of multiple sclerosis–related emergency department visits in a recent chart review were related to pseudoflares or MS-related complications, rather than to true MS relapse.
The findings suggest that many diagnostic tests, treatments, and hospital admissions are unnecessary, Dr. Hesham Abboud of the Cleveland Clinic and his colleagues reported in a poster at the meeting held by the Americas Committee for Treatment and Research in Multiple Sclerosis.
Of 97 MS-related visits among 75 patients, 33 were for new neurologic symptoms, 29 were for worsening of preexisting symptoms, and 36 were for MS-related complications. New relapse was diagnosed in only 27 visits (27.8%), and urinary tract infections were found in about one-third of patients presenting with either urinary or neurologic symptoms, the investigators said.
New MRIs were ordered in 37 patients (38.1%); 89 emergency department visits (91.7%) resulted in hospital admissions and 40.4% were related to neurology; and steroid treatment was used in 24 visits (24.7%), 7 of which were for worsening of preexisting symptoms, the investigators said.
Of the visits involving new neurologic symptoms, one-third were not from relapse; 59% of the MRIs done in those situations were positive for enhancing or new lesions. Of the visits with worsening preexisting symptoms, only 16.6% were associated with a new relapse, and 28.5% of MRIs done in those situations were positive, the investigators said.
Although many ED visits among MS patients are driven by neurologic complaints, true relapse is rarely present, and not all those with true relapse require hospital admission and steroid treatment, they noted, concluding that developing a care path and triaging system for MS patients in the ED could prevent unnecessary MRIs, steroid treatment, and hospital admissions.
The investigators reported having no disclosures.
AT ACTRIMS FORUM 2016
Key clinical point: The majority of multiple sclerosis–related emergency department visits in a recent chart review were related to pseudoflares or MS-related complications, rather than true MS relapse.
Major finding: New relapse was diagnosed in only 27 visits (27.8%).
Data source: A retrospective chart review of 75 patients with 97 MS-related ED visits.
Disclosures: The investigators reported having no disclosures.