User login
BRAIN Initiative Could Advance the Field of Neuromodulation
LAS VEGAS—Through various programs, the BRAIN Initiative seeks to fund research in 2016 that could advance the field of neuromodulation, according to a lecture given at the 19th Annual Meeting of the North American Neuromodulation Society. These investigations could affect the treatment of epilepsy, headache, Parkinson’s disease, or other neurologic disorders.
The BRAIN Initiative has two main objectives, said Stephanie Fertig, MBA, Director of Small Business Programs at the National Institute of Neurological Disorders and Stroke. The first is to foster the development of new technologies for mapping connections in the brain and discovering patterns of neural activity. The second goal is to use these new technologies, as well as existing technologies, to further neurologists’ understanding of how the neural circuit affects the function of the healthy or diseased brain. The initiative, which President Obama introduced in 2013, is a collaboration between federal agencies, including the National Science Foundation and NIH, private foundations, universities, and industry. Information on the BRAIN Initiative can be found online at www.braininitiative.nih.gov.
Researchers Invited to Apply for Funding
Several of the BRAIN Initiative’s programs are intended to promote the identification, development, and optimization of new technologies and approaches for large-scale recording and modulation in the nervous system. The goal is to foster research that will add to scientific understanding of the dynamic signaling in the nervous system, said Ms. Fertig. One program seeks applications to study new and untested ideas for recording and modulating technology, including ideas in the initial stages of conceptualization. Other programs aim to further proof-of-concept testing for such technology, as well as to enable the optimization of the technology with feedback from the user community.
Another of the initiative’s programs is intended to fund nonclinical and clinical studies that will help advance invasive recording or stimulating devices that could, in turn, treat CNS disorders and improve understanding of the human brain. Researchers will receive support for the implementation of clinical prototype devices, nonclinical safety and efficacy testing, design verification and validation activities, and pursuit of regulatory approval for a small clinical study. The program will consider clinical studies of acute or short-term procedures that entail nonsignificant risk (as determined by an Institutional Review Board), as well as those that entail a significant risk and require an Investigational Device Exemption (IDE) from the FDA. The BRAIN Initiative provides two options for researchers interested in funding for invasive devices, said Ms. Fertig. “One is if you need to do some nonclinical work before you get your IDE and then move into the clinic. That’s the phase translational to clinical research track. Then there’s the direct-to-clinical research program,” which is appropriate for investigators who do not need to perform nonclinical work and are ready for a clinical study.
Public–Private Partnership Program
The BRAIN Initiative also created a Public–Private Partnership Program to facilitate collaboration between clinical investigators and manufacturers of invasive recording or stimulating devices. This program is intended to promote clinical research and foster partnerships between clinical researchers and the developers of “next-generation implantable stimulating–recording devices,” said Ms. Fertig. Data about the safety and utility of such devices can be costly to obtain, but the Public–Private Partnership Program will enable researchers to use existing manufacturers’ safety data. To date, six device manufacturers (ie, Medtronic, Boston Scientific, Blackrock, NeuroPace, NeuroNexus, and Second Sight) have signed a memorandum of understanding with NIH to provide support and information on materials (eg, devices and software). The information will guide investigators who want to pursue specific agreements with manufacturers for the submission of research proposals to NIH. Furthermore, NIH has created templates of collaborative research agreements and confidential disclosure agreements to quicken the legal and administrative process for establishing partnerships between manufacturers and academic research institutions.
Funding Supports Device-Related Research
The BRAIN Initiative already has funded various studies that could lead to new invasive treatments for various neurologic disorders. Leigh R. Hochberg, MD, PhD, Director of the Neurotechnology Trials Unit at Massachusetts General Hospital in Boston, and associates received NIH support for the development of the BrainGate device. Dr. Hochberg created BrainGate, a brain implant system, to allow patients with quadriplegia to control external devices such as prosthetic arms by thought alone. Dr. Hochberg’s BRAIN project is to develop BrainGate into a fully implanted medical treatment system without external components. The goal is to enable patients to use the device independently on an ongoing basis.
In addition, Gregory A. Worrell, MD, PhD, Professor of Neurology at Mayo Clinic in Rochester, Minnesota, and colleagues received funding to study wireless devices that measure brain activity, predict seizure onset, and deliver therapeutic stimulation to mitigate seizures. Dr. Worrell’s group initially plans to conduct a preclinical study to test one such device in dogs with epilepsy. If the device is successful, the group will perform a pilot clinical trial in patients with epilepsy.
Finally, Nicholas D. Schiff, MD, Jerold B. Katz Professor of Neurology and Neuroscience at Weill Cornell Medical College in New York, and colleagues received support for their efforts to develop device therapy for cognitive impairment associated with traumatic brain injury. They are focusing on a device that delivers deep brain stimulation to the thalamus, which they hypothesize may restore the disrupted circuit function that underlies the cognitive disability.
—Erik Greb
Suggested Reading
Brinkmann BH, Patterson EE, Vite C, et al. Forecasting seizures using intracranial EEG measures and SVM in naturally occurring canine epilepsy. PLoS One. 2015;10(8):e0133900.
Gummadavelli A, Motelow JE, Smith N, et al. Thalamic stimulation to improve level of consciousness after seizures: evaluation of electrophysiology and behavior. Epilepsia. 2015;56(1):114-124.
Hochberg LR, Bacher D, Jarosiewicz B, et al. Reach and grasp by people with tetraplegia using a neurally controlled robotic arm. Nature. 2012;485(7398):372-375.
LAS VEGAS—Through various programs, the BRAIN Initiative seeks to fund research in 2016 that could advance the field of neuromodulation, according to a lecture given at the 19th Annual Meeting of the North American Neuromodulation Society. These investigations could affect the treatment of epilepsy, headache, Parkinson’s disease, or other neurologic disorders.
The BRAIN Initiative has two main objectives, said Stephanie Fertig, MBA, Director of Small Business Programs at the National Institute of Neurological Disorders and Stroke. The first is to foster the development of new technologies for mapping connections in the brain and discovering patterns of neural activity. The second goal is to use these new technologies, as well as existing technologies, to further neurologists’ understanding of how the neural circuit affects the function of the healthy or diseased brain. The initiative, which President Obama introduced in 2013, is a collaboration between federal agencies, including the National Science Foundation and NIH, private foundations, universities, and industry. Information on the BRAIN Initiative can be found online at www.braininitiative.nih.gov.
Researchers Invited to Apply for Funding
Several of the BRAIN Initiative’s programs are intended to promote the identification, development, and optimization of new technologies and approaches for large-scale recording and modulation in the nervous system. The goal is to foster research that will add to scientific understanding of the dynamic signaling in the nervous system, said Ms. Fertig. One program seeks applications to study new and untested ideas for recording and modulating technology, including ideas in the initial stages of conceptualization. Other programs aim to further proof-of-concept testing for such technology, as well as to enable the optimization of the technology with feedback from the user community.
Another of the initiative’s programs is intended to fund nonclinical and clinical studies that will help advance invasive recording or stimulating devices that could, in turn, treat CNS disorders and improve understanding of the human brain. Researchers will receive support for the implementation of clinical prototype devices, nonclinical safety and efficacy testing, design verification and validation activities, and pursuit of regulatory approval for a small clinical study. The program will consider clinical studies of acute or short-term procedures that entail nonsignificant risk (as determined by an Institutional Review Board), as well as those that entail a significant risk and require an Investigational Device Exemption (IDE) from the FDA. The BRAIN Initiative provides two options for researchers interested in funding for invasive devices, said Ms. Fertig. “One is if you need to do some nonclinical work before you get your IDE and then move into the clinic. That’s the phase translational to clinical research track. Then there’s the direct-to-clinical research program,” which is appropriate for investigators who do not need to perform nonclinical work and are ready for a clinical study.
Public–Private Partnership Program
The BRAIN Initiative also created a Public–Private Partnership Program to facilitate collaboration between clinical investigators and manufacturers of invasive recording or stimulating devices. This program is intended to promote clinical research and foster partnerships between clinical researchers and the developers of “next-generation implantable stimulating–recording devices,” said Ms. Fertig. Data about the safety and utility of such devices can be costly to obtain, but the Public–Private Partnership Program will enable researchers to use existing manufacturers’ safety data. To date, six device manufacturers (ie, Medtronic, Boston Scientific, Blackrock, NeuroPace, NeuroNexus, and Second Sight) have signed a memorandum of understanding with NIH to provide support and information on materials (eg, devices and software). The information will guide investigators who want to pursue specific agreements with manufacturers for the submission of research proposals to NIH. Furthermore, NIH has created templates of collaborative research agreements and confidential disclosure agreements to quicken the legal and administrative process for establishing partnerships between manufacturers and academic research institutions.
Funding Supports Device-Related Research
The BRAIN Initiative already has funded various studies that could lead to new invasive treatments for various neurologic disorders. Leigh R. Hochberg, MD, PhD, Director of the Neurotechnology Trials Unit at Massachusetts General Hospital in Boston, and associates received NIH support for the development of the BrainGate device. Dr. Hochberg created BrainGate, a brain implant system, to allow patients with quadriplegia to control external devices such as prosthetic arms by thought alone. Dr. Hochberg’s BRAIN project is to develop BrainGate into a fully implanted medical treatment system without external components. The goal is to enable patients to use the device independently on an ongoing basis.
In addition, Gregory A. Worrell, MD, PhD, Professor of Neurology at Mayo Clinic in Rochester, Minnesota, and colleagues received funding to study wireless devices that measure brain activity, predict seizure onset, and deliver therapeutic stimulation to mitigate seizures. Dr. Worrell’s group initially plans to conduct a preclinical study to test one such device in dogs with epilepsy. If the device is successful, the group will perform a pilot clinical trial in patients with epilepsy.
Finally, Nicholas D. Schiff, MD, Jerold B. Katz Professor of Neurology and Neuroscience at Weill Cornell Medical College in New York, and colleagues received support for their efforts to develop device therapy for cognitive impairment associated with traumatic brain injury. They are focusing on a device that delivers deep brain stimulation to the thalamus, which they hypothesize may restore the disrupted circuit function that underlies the cognitive disability.
—Erik Greb
LAS VEGAS—Through various programs, the BRAIN Initiative seeks to fund research in 2016 that could advance the field of neuromodulation, according to a lecture given at the 19th Annual Meeting of the North American Neuromodulation Society. These investigations could affect the treatment of epilepsy, headache, Parkinson’s disease, or other neurologic disorders.
The BRAIN Initiative has two main objectives, said Stephanie Fertig, MBA, Director of Small Business Programs at the National Institute of Neurological Disorders and Stroke. The first is to foster the development of new technologies for mapping connections in the brain and discovering patterns of neural activity. The second goal is to use these new technologies, as well as existing technologies, to further neurologists’ understanding of how the neural circuit affects the function of the healthy or diseased brain. The initiative, which President Obama introduced in 2013, is a collaboration between federal agencies, including the National Science Foundation and NIH, private foundations, universities, and industry. Information on the BRAIN Initiative can be found online at www.braininitiative.nih.gov.
Researchers Invited to Apply for Funding
Several of the BRAIN Initiative’s programs are intended to promote the identification, development, and optimization of new technologies and approaches for large-scale recording and modulation in the nervous system. The goal is to foster research that will add to scientific understanding of the dynamic signaling in the nervous system, said Ms. Fertig. One program seeks applications to study new and untested ideas for recording and modulating technology, including ideas in the initial stages of conceptualization. Other programs aim to further proof-of-concept testing for such technology, as well as to enable the optimization of the technology with feedback from the user community.
Another of the initiative’s programs is intended to fund nonclinical and clinical studies that will help advance invasive recording or stimulating devices that could, in turn, treat CNS disorders and improve understanding of the human brain. Researchers will receive support for the implementation of clinical prototype devices, nonclinical safety and efficacy testing, design verification and validation activities, and pursuit of regulatory approval for a small clinical study. The program will consider clinical studies of acute or short-term procedures that entail nonsignificant risk (as determined by an Institutional Review Board), as well as those that entail a significant risk and require an Investigational Device Exemption (IDE) from the FDA. The BRAIN Initiative provides two options for researchers interested in funding for invasive devices, said Ms. Fertig. “One is if you need to do some nonclinical work before you get your IDE and then move into the clinic. That’s the phase translational to clinical research track. Then there’s the direct-to-clinical research program,” which is appropriate for investigators who do not need to perform nonclinical work and are ready for a clinical study.
Public–Private Partnership Program
The BRAIN Initiative also created a Public–Private Partnership Program to facilitate collaboration between clinical investigators and manufacturers of invasive recording or stimulating devices. This program is intended to promote clinical research and foster partnerships between clinical researchers and the developers of “next-generation implantable stimulating–recording devices,” said Ms. Fertig. Data about the safety and utility of such devices can be costly to obtain, but the Public–Private Partnership Program will enable researchers to use existing manufacturers’ safety data. To date, six device manufacturers (ie, Medtronic, Boston Scientific, Blackrock, NeuroPace, NeuroNexus, and Second Sight) have signed a memorandum of understanding with NIH to provide support and information on materials (eg, devices and software). The information will guide investigators who want to pursue specific agreements with manufacturers for the submission of research proposals to NIH. Furthermore, NIH has created templates of collaborative research agreements and confidential disclosure agreements to quicken the legal and administrative process for establishing partnerships between manufacturers and academic research institutions.
Funding Supports Device-Related Research
The BRAIN Initiative already has funded various studies that could lead to new invasive treatments for various neurologic disorders. Leigh R. Hochberg, MD, PhD, Director of the Neurotechnology Trials Unit at Massachusetts General Hospital in Boston, and associates received NIH support for the development of the BrainGate device. Dr. Hochberg created BrainGate, a brain implant system, to allow patients with quadriplegia to control external devices such as prosthetic arms by thought alone. Dr. Hochberg’s BRAIN project is to develop BrainGate into a fully implanted medical treatment system without external components. The goal is to enable patients to use the device independently on an ongoing basis.
In addition, Gregory A. Worrell, MD, PhD, Professor of Neurology at Mayo Clinic in Rochester, Minnesota, and colleagues received funding to study wireless devices that measure brain activity, predict seizure onset, and deliver therapeutic stimulation to mitigate seizures. Dr. Worrell’s group initially plans to conduct a preclinical study to test one such device in dogs with epilepsy. If the device is successful, the group will perform a pilot clinical trial in patients with epilepsy.
Finally, Nicholas D. Schiff, MD, Jerold B. Katz Professor of Neurology and Neuroscience at Weill Cornell Medical College in New York, and colleagues received support for their efforts to develop device therapy for cognitive impairment associated with traumatic brain injury. They are focusing on a device that delivers deep brain stimulation to the thalamus, which they hypothesize may restore the disrupted circuit function that underlies the cognitive disability.
—Erik Greb
Suggested Reading
Brinkmann BH, Patterson EE, Vite C, et al. Forecasting seizures using intracranial EEG measures and SVM in naturally occurring canine epilepsy. PLoS One. 2015;10(8):e0133900.
Gummadavelli A, Motelow JE, Smith N, et al. Thalamic stimulation to improve level of consciousness after seizures: evaluation of electrophysiology and behavior. Epilepsia. 2015;56(1):114-124.
Hochberg LR, Bacher D, Jarosiewicz B, et al. Reach and grasp by people with tetraplegia using a neurally controlled robotic arm. Nature. 2012;485(7398):372-375.
Suggested Reading
Brinkmann BH, Patterson EE, Vite C, et al. Forecasting seizures using intracranial EEG measures and SVM in naturally occurring canine epilepsy. PLoS One. 2015;10(8):e0133900.
Gummadavelli A, Motelow JE, Smith N, et al. Thalamic stimulation to improve level of consciousness after seizures: evaluation of electrophysiology and behavior. Epilepsia. 2015;56(1):114-124.
Hochberg LR, Bacher D, Jarosiewicz B, et al. Reach and grasp by people with tetraplegia using a neurally controlled robotic arm. Nature. 2012;485(7398):372-375.
VIDEO: A better way to treat large intraventricular hemorrhages
LOS ANGELES – For intraventricular hemorrhages of at least 20 mL, alteplase (Activase – Genentech) delivered directly into the clot by external ventricular drain almost doubles the odds of achieving a modified Rankin Score of 0-3 by 6 months.
More clot is removed – and patients with large intraventricular hemorrhages (IVHs) do better – with more vigorous alteplase dosing and when more than one drain is used.
The findings come from the Clot Lysis Evaluation of Accelerated Resolution (CLEAR III) trial, which randomized 249 IVH patients to 1 mg alteplase every 8 hours for up to 12 doses, and 251 to saline on the same schedule, delivered by external ventricular drain. The intervention didn’t make much difference with small hemorrhages.
In a video interview at the International Stroke Conference, investigator Dr. Issam Awad, a professor of surgery and neurology and director of neurovascular surgery at the University of Chicago, explained how to do the technique correctly for larger clots, and the expected benefits.
The video associated with this article is no longer available on this site. Please view all of our videos on the MDedge YouTube channel
LOS ANGELES – For intraventricular hemorrhages of at least 20 mL, alteplase (Activase – Genentech) delivered directly into the clot by external ventricular drain almost doubles the odds of achieving a modified Rankin Score of 0-3 by 6 months.
More clot is removed – and patients with large intraventricular hemorrhages (IVHs) do better – with more vigorous alteplase dosing and when more than one drain is used.
The findings come from the Clot Lysis Evaluation of Accelerated Resolution (CLEAR III) trial, which randomized 249 IVH patients to 1 mg alteplase every 8 hours for up to 12 doses, and 251 to saline on the same schedule, delivered by external ventricular drain. The intervention didn’t make much difference with small hemorrhages.
In a video interview at the International Stroke Conference, investigator Dr. Issam Awad, a professor of surgery and neurology and director of neurovascular surgery at the University of Chicago, explained how to do the technique correctly for larger clots, and the expected benefits.
The video associated with this article is no longer available on this site. Please view all of our videos on the MDedge YouTube channel
LOS ANGELES – For intraventricular hemorrhages of at least 20 mL, alteplase (Activase – Genentech) delivered directly into the clot by external ventricular drain almost doubles the odds of achieving a modified Rankin Score of 0-3 by 6 months.
More clot is removed – and patients with large intraventricular hemorrhages (IVHs) do better – with more vigorous alteplase dosing and when more than one drain is used.
The findings come from the Clot Lysis Evaluation of Accelerated Resolution (CLEAR III) trial, which randomized 249 IVH patients to 1 mg alteplase every 8 hours for up to 12 doses, and 251 to saline on the same schedule, delivered by external ventricular drain. The intervention didn’t make much difference with small hemorrhages.
In a video interview at the International Stroke Conference, investigator Dr. Issam Awad, a professor of surgery and neurology and director of neurovascular surgery at the University of Chicago, explained how to do the technique correctly for larger clots, and the expected benefits.
The video associated with this article is no longer available on this site. Please view all of our videos on the MDedge YouTube channel
AT THE INTERNATIONAL STROKE CONFERENCE

VIDEO: Intracranial warfarin bleeds smaller with prothrombin complex instead of FFP
LOS ANGELES – The international normalized ratio fell to 1.2 or less within 3 hours among 18 of 27 (67%) patients who received four-factor prothrombin complex concentrate (octaplex [Octapharma]) for warfarin-related intracranial hemorrhages, but only 2 of 23 (9%) who received fresh frozen plasma, according to a randomized trial from Germany.
Hematoma expansion was reduced by 16.9 mL (P = .026) at 3 hours and 16.4 mL (P = .018) at 24 hours in the prothrombin complex concentrate (PCC) group.
All the patients presented within 12 hours of symptom onset with an INR of at least 2; they received fresh frozen plasma (FFP) or four-factor PCC within an hour of their cerebral CT. There were eight deaths in the FFP group, including five due to hematoma expansion. The five deaths in the PCC group occurred after day 5, and one was thought to be because of hematoma expansion. Patients were 76 years old, on average, and the majority were men; both groups received vitamin K.
The findings make a case for PCC at a time when it’s unclear how best to handle warfarin-related intracranial bleeds, and whether the extra cost of PCC is worth it. Investigator Dr. Thorsten Steiner, a professor of neurology at the University of Heidelberg (Germany), addressed the relevant issues, including PCC safety, in a video interview at the International Stroke Conference sponsored by the American Heart Association. The investigator-initiated trial was funded by Octapharma, and Dr. Steiner reported receiving a research grant from the company.
The video associated with this article is no longer available on this site. Please view all of our videos on the MDedge YouTube channel
LOS ANGELES – The international normalized ratio fell to 1.2 or less within 3 hours among 18 of 27 (67%) patients who received four-factor prothrombin complex concentrate (octaplex [Octapharma]) for warfarin-related intracranial hemorrhages, but only 2 of 23 (9%) who received fresh frozen plasma, according to a randomized trial from Germany.
Hematoma expansion was reduced by 16.9 mL (P = .026) at 3 hours and 16.4 mL (P = .018) at 24 hours in the prothrombin complex concentrate (PCC) group.
All the patients presented within 12 hours of symptom onset with an INR of at least 2; they received fresh frozen plasma (FFP) or four-factor PCC within an hour of their cerebral CT. There were eight deaths in the FFP group, including five due to hematoma expansion. The five deaths in the PCC group occurred after day 5, and one was thought to be because of hematoma expansion. Patients were 76 years old, on average, and the majority were men; both groups received vitamin K.
The findings make a case for PCC at a time when it’s unclear how best to handle warfarin-related intracranial bleeds, and whether the extra cost of PCC is worth it. Investigator Dr. Thorsten Steiner, a professor of neurology at the University of Heidelberg (Germany), addressed the relevant issues, including PCC safety, in a video interview at the International Stroke Conference sponsored by the American Heart Association. The investigator-initiated trial was funded by Octapharma, and Dr. Steiner reported receiving a research grant from the company.
The video associated with this article is no longer available on this site. Please view all of our videos on the MDedge YouTube channel
LOS ANGELES – The international normalized ratio fell to 1.2 or less within 3 hours among 18 of 27 (67%) patients who received four-factor prothrombin complex concentrate (octaplex [Octapharma]) for warfarin-related intracranial hemorrhages, but only 2 of 23 (9%) who received fresh frozen plasma, according to a randomized trial from Germany.
Hematoma expansion was reduced by 16.9 mL (P = .026) at 3 hours and 16.4 mL (P = .018) at 24 hours in the prothrombin complex concentrate (PCC) group.
All the patients presented within 12 hours of symptom onset with an INR of at least 2; they received fresh frozen plasma (FFP) or four-factor PCC within an hour of their cerebral CT. There were eight deaths in the FFP group, including five due to hematoma expansion. The five deaths in the PCC group occurred after day 5, and one was thought to be because of hematoma expansion. Patients were 76 years old, on average, and the majority were men; both groups received vitamin K.
The findings make a case for PCC at a time when it’s unclear how best to handle warfarin-related intracranial bleeds, and whether the extra cost of PCC is worth it. Investigator Dr. Thorsten Steiner, a professor of neurology at the University of Heidelberg (Germany), addressed the relevant issues, including PCC safety, in a video interview at the International Stroke Conference sponsored by the American Heart Association. The investigator-initiated trial was funded by Octapharma, and Dr. Steiner reported receiving a research grant from the company.
The video associated with this article is no longer available on this site. Please view all of our videos on the MDedge YouTube channel
AT THE INTERNATIONAL STROKE CONFERENCE

Natalizumab May Increase Risk of JCV Seroconversion
Patients with multiple sclerosis (MS) who receive natalizumab may have as much as a 10-fold greater risk of seroconversion to John Cunningham virus (JCV)-positive status, according to a study published online January 27 in Neurology Neuroimmunology & Neuroinflammation.
“An increase in the levels of anti-JCV antibodies could signify an increased risk of progressive multifocal leukoencephalopathy (PML),” said the study’s senior author, Heinz Wiendl, MD, Professor of Neurology at the University of Münster in Germany.
Dr. Wiendl and colleagues performed a longitudinal analysis of 525 German patients with MS and 711 French patients with MS, all of whom were treated with natalizumab, to assess whether the therapy influenced JCV seroconversion or JCV index value (ie, the level of anti-JCV antibody titers). An independent contractor processed and analyzed sera samples with the second-generation enzyme-linked immunosorbent assay kit STRATIFY JCV DxSelect.
Seroconversion and Increasing Index Value
Of the 525 German patients, 296 (56.4%) were JCV-negative throughout the observation period, and 171 were JCV-positive (32.6%). Forty-three patients changed from being JCV-negative to JCV-positive (8.2%), and 15 patients changed from being JCV-positive to JCV-negative (2.9%). When the authors used JCV serostatus to determine seroconversion, the longitudinal assessment started out with 339 initially JCV-negative patients. The serostatus of 43 of these initially JCV-negative patients changed to JCV-positive, which is a rate of 12.7% in 14.8 months (10.3% per year).
Of the 711 French patients, 243 initially were JCV-negative. The serostatus of 20 (8.2%) of these latter patients changed to JCV-positive in their first year of treatment, and 21 (8.6%) of the patients became JCV-positive in their second year of treatment. In all, the serostatus of 41 of 243 patients (16.9%) changed to JCV-positive in the first two years of natalizumab treatment (8.5% per year).
In addition, JCV index values changed in 525 patients during the observation period. The proportion of patients with an index value less than 0.4 was reduced by 20 patients (ie, from 65.1% to 61.3%), and the group of patients with low risk (ie, values between 0.4 and 0.9) was reduced by one patient to 7.8%. The patient groups with medium (ie, 0.9–1.5) and high risk (ie, greater than 1.5) increased by seven patients from 4.6% to 5.9% and by 14 patients from 22.3% to 25%, respectively.Furthermore, 161 of 201 JCV-positive patients (80%) had stable JCV index values over time. The remaining 40 patients (20%) had fluctuations of more than 30% in 14.8 months. Six of these patients (3%) had decreasing index values, and 34 (17%) had increasing index values (mean, 200.8%). Overall, the index value of all JCV-positive patients increased by an average of 15.9% in 14.8 months (12.9% per year).
Increased Index May Not Indicate Imminent PML
The high rate of seroconversion that the investigators observed “clearly supports the facilitation by treatment with natalizumab,” said Dr. Wiendl. “Our observed seroconversion of 8% to 10% per year and the rise in seroprevalence of 5% to 6% in 15 to 24 months is at least eight to 10 times as much as would be expected by age.” The study results imply that not every patient with MS is susceptible to JCV seroconversion by treatment, but natalizumab might facilitate seroconversion in patients who are susceptible.
No research has examined the influence of other MS treatments on JCV index values, and the investigators thus cannot be certain that natalizumab treatment caused the increase in index values observed in the study. But because there was no correlation between age and index value in JCV-positive patients, it is valid to speculate that natalizumab treatment induces rising JCV index values.
“If the hypothesis that treatment with natalizumab is associated with enhanced JCV seroconversion and higher index values is proven, it would also be important to determine whether cessation of natalizumab therapy (or perhaps prolonged infusion intervals) could lead to lower JCV index values as well,” Dr. Wiendl continued. The association “does not diminish [natalizumab’s] clinical efficacy, but calls for more elaborate strategies for PML risk stratification according to current scientific developments, also regarding patients with prior use of immunosuppressants, where the JCV index is not helpful.
“It is important that people with MS taking natalizumab speak with their doctor before making any changes to their treatment,” Dr. Wiendl added. “Still, this study shows anti-JCV antibodies may serve as a useful biomarker…. The results of this study underscore the need for frequent monitoring of anti-JCV antibodies in people who are being treated with natalizumab for MS.”
JCV serology, however, should not be the only PML risk biomarker to stratify patients treated with natalizumab, said Dr. Wiendl. Neurologists should explore and potentially apply additional biomarkers such as CD62L in peripheral blood or IgM bands in CSF. Together, all of these biomarkers may provide more accurate information about patients’ PML risk and help reduce the incidence of PML.
The investigators’ data extend earlier paired, longitudinal studies in various countries of patients treated with natalizumab who had similarly high rates of conversion and a rise in titers, said Adil Javed, MD, PhD, Associate Professor of Neurology, and Anthony T. Reder, MD, Professor of Neurology, both at the University of Chicago, in an accompanying editorial. Although the JCV index appears to be a valid serum marker of risk for PML, “risk is relative,” they said. “Despite a higher JCV replication state, an increase in JCV-antibody index does not necessarily mean that PML infection is imminent…. Schwab et al extend growing observations that JCV-antibody index values need to be monitored and that seroconversion or rising JCV-antibody titers alter the risk of PML in patients treated with natalizumab.”
—Erik Greb
Suggested Reading
Schwab N, Schneider-Hohendorf T, Pignolet B, et al. Therapy with natalizumab is associated with high JCV seroconversion and rising JCV index values. Neurol Neuroimmunol Neuroinflamm. 2016;3(1):e195.
Javed A, Reder AT. Rising JCV-Ab index during natalizumab therapy for MS: Inauspicious for a highly efficacious drug. Neurol Neuroimmunol Neuroinflamm. 2016;3(1):e199.
Patients with multiple sclerosis (MS) who receive natalizumab may have as much as a 10-fold greater risk of seroconversion to John Cunningham virus (JCV)-positive status, according to a study published online January 27 in Neurology Neuroimmunology & Neuroinflammation.
“An increase in the levels of anti-JCV antibodies could signify an increased risk of progressive multifocal leukoencephalopathy (PML),” said the study’s senior author, Heinz Wiendl, MD, Professor of Neurology at the University of Münster in Germany.
Dr. Wiendl and colleagues performed a longitudinal analysis of 525 German patients with MS and 711 French patients with MS, all of whom were treated with natalizumab, to assess whether the therapy influenced JCV seroconversion or JCV index value (ie, the level of anti-JCV antibody titers). An independent contractor processed and analyzed sera samples with the second-generation enzyme-linked immunosorbent assay kit STRATIFY JCV DxSelect.
Seroconversion and Increasing Index Value
Of the 525 German patients, 296 (56.4%) were JCV-negative throughout the observation period, and 171 were JCV-positive (32.6%). Forty-three patients changed from being JCV-negative to JCV-positive (8.2%), and 15 patients changed from being JCV-positive to JCV-negative (2.9%). When the authors used JCV serostatus to determine seroconversion, the longitudinal assessment started out with 339 initially JCV-negative patients. The serostatus of 43 of these initially JCV-negative patients changed to JCV-positive, which is a rate of 12.7% in 14.8 months (10.3% per year).
Of the 711 French patients, 243 initially were JCV-negative. The serostatus of 20 (8.2%) of these latter patients changed to JCV-positive in their first year of treatment, and 21 (8.6%) of the patients became JCV-positive in their second year of treatment. In all, the serostatus of 41 of 243 patients (16.9%) changed to JCV-positive in the first two years of natalizumab treatment (8.5% per year).
In addition, JCV index values changed in 525 patients during the observation period. The proportion of patients with an index value less than 0.4 was reduced by 20 patients (ie, from 65.1% to 61.3%), and the group of patients with low risk (ie, values between 0.4 and 0.9) was reduced by one patient to 7.8%. The patient groups with medium (ie, 0.9–1.5) and high risk (ie, greater than 1.5) increased by seven patients from 4.6% to 5.9% and by 14 patients from 22.3% to 25%, respectively.Furthermore, 161 of 201 JCV-positive patients (80%) had stable JCV index values over time. The remaining 40 patients (20%) had fluctuations of more than 30% in 14.8 months. Six of these patients (3%) had decreasing index values, and 34 (17%) had increasing index values (mean, 200.8%). Overall, the index value of all JCV-positive patients increased by an average of 15.9% in 14.8 months (12.9% per year).
Increased Index May Not Indicate Imminent PML
The high rate of seroconversion that the investigators observed “clearly supports the facilitation by treatment with natalizumab,” said Dr. Wiendl. “Our observed seroconversion of 8% to 10% per year and the rise in seroprevalence of 5% to 6% in 15 to 24 months is at least eight to 10 times as much as would be expected by age.” The study results imply that not every patient with MS is susceptible to JCV seroconversion by treatment, but natalizumab might facilitate seroconversion in patients who are susceptible.
No research has examined the influence of other MS treatments on JCV index values, and the investigators thus cannot be certain that natalizumab treatment caused the increase in index values observed in the study. But because there was no correlation between age and index value in JCV-positive patients, it is valid to speculate that natalizumab treatment induces rising JCV index values.
“If the hypothesis that treatment with natalizumab is associated with enhanced JCV seroconversion and higher index values is proven, it would also be important to determine whether cessation of natalizumab therapy (or perhaps prolonged infusion intervals) could lead to lower JCV index values as well,” Dr. Wiendl continued. The association “does not diminish [natalizumab’s] clinical efficacy, but calls for more elaborate strategies for PML risk stratification according to current scientific developments, also regarding patients with prior use of immunosuppressants, where the JCV index is not helpful.
“It is important that people with MS taking natalizumab speak with their doctor before making any changes to their treatment,” Dr. Wiendl added. “Still, this study shows anti-JCV antibodies may serve as a useful biomarker…. The results of this study underscore the need for frequent monitoring of anti-JCV antibodies in people who are being treated with natalizumab for MS.”
JCV serology, however, should not be the only PML risk biomarker to stratify patients treated with natalizumab, said Dr. Wiendl. Neurologists should explore and potentially apply additional biomarkers such as CD62L in peripheral blood or IgM bands in CSF. Together, all of these biomarkers may provide more accurate information about patients’ PML risk and help reduce the incidence of PML.
The investigators’ data extend earlier paired, longitudinal studies in various countries of patients treated with natalizumab who had similarly high rates of conversion and a rise in titers, said Adil Javed, MD, PhD, Associate Professor of Neurology, and Anthony T. Reder, MD, Professor of Neurology, both at the University of Chicago, in an accompanying editorial. Although the JCV index appears to be a valid serum marker of risk for PML, “risk is relative,” they said. “Despite a higher JCV replication state, an increase in JCV-antibody index does not necessarily mean that PML infection is imminent…. Schwab et al extend growing observations that JCV-antibody index values need to be monitored and that seroconversion or rising JCV-antibody titers alter the risk of PML in patients treated with natalizumab.”
—Erik Greb
Patients with multiple sclerosis (MS) who receive natalizumab may have as much as a 10-fold greater risk of seroconversion to John Cunningham virus (JCV)-positive status, according to a study published online January 27 in Neurology Neuroimmunology & Neuroinflammation.
“An increase in the levels of anti-JCV antibodies could signify an increased risk of progressive multifocal leukoencephalopathy (PML),” said the study’s senior author, Heinz Wiendl, MD, Professor of Neurology at the University of Münster in Germany.
Dr. Wiendl and colleagues performed a longitudinal analysis of 525 German patients with MS and 711 French patients with MS, all of whom were treated with natalizumab, to assess whether the therapy influenced JCV seroconversion or JCV index value (ie, the level of anti-JCV antibody titers). An independent contractor processed and analyzed sera samples with the second-generation enzyme-linked immunosorbent assay kit STRATIFY JCV DxSelect.
Seroconversion and Increasing Index Value
Of the 525 German patients, 296 (56.4%) were JCV-negative throughout the observation period, and 171 were JCV-positive (32.6%). Forty-three patients changed from being JCV-negative to JCV-positive (8.2%), and 15 patients changed from being JCV-positive to JCV-negative (2.9%). When the authors used JCV serostatus to determine seroconversion, the longitudinal assessment started out with 339 initially JCV-negative patients. The serostatus of 43 of these initially JCV-negative patients changed to JCV-positive, which is a rate of 12.7% in 14.8 months (10.3% per year).
Of the 711 French patients, 243 initially were JCV-negative. The serostatus of 20 (8.2%) of these latter patients changed to JCV-positive in their first year of treatment, and 21 (8.6%) of the patients became JCV-positive in their second year of treatment. In all, the serostatus of 41 of 243 patients (16.9%) changed to JCV-positive in the first two years of natalizumab treatment (8.5% per year).
In addition, JCV index values changed in 525 patients during the observation period. The proportion of patients with an index value less than 0.4 was reduced by 20 patients (ie, from 65.1% to 61.3%), and the group of patients with low risk (ie, values between 0.4 and 0.9) was reduced by one patient to 7.8%. The patient groups with medium (ie, 0.9–1.5) and high risk (ie, greater than 1.5) increased by seven patients from 4.6% to 5.9% and by 14 patients from 22.3% to 25%, respectively.Furthermore, 161 of 201 JCV-positive patients (80%) had stable JCV index values over time. The remaining 40 patients (20%) had fluctuations of more than 30% in 14.8 months. Six of these patients (3%) had decreasing index values, and 34 (17%) had increasing index values (mean, 200.8%). Overall, the index value of all JCV-positive patients increased by an average of 15.9% in 14.8 months (12.9% per year).
Increased Index May Not Indicate Imminent PML
The high rate of seroconversion that the investigators observed “clearly supports the facilitation by treatment with natalizumab,” said Dr. Wiendl. “Our observed seroconversion of 8% to 10% per year and the rise in seroprevalence of 5% to 6% in 15 to 24 months is at least eight to 10 times as much as would be expected by age.” The study results imply that not every patient with MS is susceptible to JCV seroconversion by treatment, but natalizumab might facilitate seroconversion in patients who are susceptible.
No research has examined the influence of other MS treatments on JCV index values, and the investigators thus cannot be certain that natalizumab treatment caused the increase in index values observed in the study. But because there was no correlation between age and index value in JCV-positive patients, it is valid to speculate that natalizumab treatment induces rising JCV index values.
“If the hypothesis that treatment with natalizumab is associated with enhanced JCV seroconversion and higher index values is proven, it would also be important to determine whether cessation of natalizumab therapy (or perhaps prolonged infusion intervals) could lead to lower JCV index values as well,” Dr. Wiendl continued. The association “does not diminish [natalizumab’s] clinical efficacy, but calls for more elaborate strategies for PML risk stratification according to current scientific developments, also regarding patients with prior use of immunosuppressants, where the JCV index is not helpful.
“It is important that people with MS taking natalizumab speak with their doctor before making any changes to their treatment,” Dr. Wiendl added. “Still, this study shows anti-JCV antibodies may serve as a useful biomarker…. The results of this study underscore the need for frequent monitoring of anti-JCV antibodies in people who are being treated with natalizumab for MS.”
JCV serology, however, should not be the only PML risk biomarker to stratify patients treated with natalizumab, said Dr. Wiendl. Neurologists should explore and potentially apply additional biomarkers such as CD62L in peripheral blood or IgM bands in CSF. Together, all of these biomarkers may provide more accurate information about patients’ PML risk and help reduce the incidence of PML.
The investigators’ data extend earlier paired, longitudinal studies in various countries of patients treated with natalizumab who had similarly high rates of conversion and a rise in titers, said Adil Javed, MD, PhD, Associate Professor of Neurology, and Anthony T. Reder, MD, Professor of Neurology, both at the University of Chicago, in an accompanying editorial. Although the JCV index appears to be a valid serum marker of risk for PML, “risk is relative,” they said. “Despite a higher JCV replication state, an increase in JCV-antibody index does not necessarily mean that PML infection is imminent…. Schwab et al extend growing observations that JCV-antibody index values need to be monitored and that seroconversion or rising JCV-antibody titers alter the risk of PML in patients treated with natalizumab.”
—Erik Greb
Suggested Reading
Schwab N, Schneider-Hohendorf T, Pignolet B, et al. Therapy with natalizumab is associated with high JCV seroconversion and rising JCV index values. Neurol Neuroimmunol Neuroinflamm. 2016;3(1):e195.
Javed A, Reder AT. Rising JCV-Ab index during natalizumab therapy for MS: Inauspicious for a highly efficacious drug. Neurol Neuroimmunol Neuroinflamm. 2016;3(1):e199.
Suggested Reading
Schwab N, Schneider-Hohendorf T, Pignolet B, et al. Therapy with natalizumab is associated with high JCV seroconversion and rising JCV index values. Neurol Neuroimmunol Neuroinflamm. 2016;3(1):e195.
Javed A, Reder AT. Rising JCV-Ab index during natalizumab therapy for MS: Inauspicious for a highly efficacious drug. Neurol Neuroimmunol Neuroinflamm. 2016;3(1):e199.
Key Elements of Critical Care
Code 99291 is used for critical care, evaluation, and management of the critically ill or critically injured patient, first 30–74 minutes.1 It is to be reported only once per day per physician or group member of the same specialty.

Code 99292 is for critical care, evaluation, and management of the critically ill or critically injured patient, each additional 30 minutes. It is to be listed separately in addition to the code for primary service.1 Code 99292 is categorized as an add-on code. It must be reported on the same invoice as its primary code, 99291. Multiple units of code 99292 can be reported per day per physician/group.
Despite the increased resources and references for critical care billing, critical care reporting issues persist. Medicare data analysis continues to identify 99291 as high risk for claim payment errors, perpetuating prepayment claim edits for outlier utilization and location discrepancies (i.e., settings other than inpatient hospital, outpatient hospital, or the emergency department). 2,3,4
Bolster your documentation with these three key elements.
Critical Illness, Injury Management
Current Procedural Terminology (CPT) and the Centers for Medicare & Medicaid Services (CMS) define “critical illness or injury” as a condition that acutely impairs one or more vital organ systems such that there is a high probability of imminent or life-threatening deterioration in the patient’s condition (e.g., central nervous system failure; circulatory failure; shock; renal, hepatic, metabolic, and/or respiratory failure).5
Hospitalists providing care to the critically ill patient must perform highly complex decision making and interventions of high intensity that are required to prevent the patient’s inevitable decline. CMS further elaborates that “the patient shall be critically ill or injured at the time of the physician’s visit.”6 This is to ensure that hospitalists and other specialists support the medical necessity of the service and do not continue to report critical care codes on days after the patient has become stable and improved.
Consider the following scenarios:
CMS examples of patients whose medical condition may warrant critical care services (99291, 99292):6
- An 81-year-old male patient is admitted to the ICU following abdominal aortic aneurysm resection. Two days after surgery, he requires fluids and pressors to maintain adequate perfusion and arterial pressures. He remains ventilator dependent.
- A 67-year-old female patient is three days post mitral valve repair. She develops petechiae, hypotension, and hypoxia requiring respiratory and circulatory support.
- A 70-year-old admitted for right lower lobe pneumococcal pneumonia with a history of COPD becomes hypoxic and hypotensive two days after admission.
- A 68-year-old admitted for an acute anterior wall myocardial infarction continues to have symptomatic ventricular tachycardia that is marginally responsive to antiarrhythmic therapy.
CMS examples of patients who may not satisfy Medicare medical necessity criteria, or do not meet critical care criteria, or who do not have a critical care illness or injury and, therefore, are not eligible for critical care payment but may be reported using another appropriate hospital care code, such as subsequent hospital care codes (99231–99233), initial hospital care codes (99221–99223), or hospital consultation codes (99251–99255) when applicable:1,6
- Patients admitted to a critical care unit because no other hospital beds were available;
- Patients admitted to a critical care unit for close nursing observation and/or frequent monitoring of vital signs (e.g., drug toxicity or overdose);
- Patients admitted to a critical care unit because hospital rules require certain treatments (e.g., insulin infusions) to be administered in the critical care unit; and
- Patients receiving only care of a chronic illness in absence of care for a critical illness (e.g., daily management of a chronic ventilator patient, management of or care related to dialysis for end-stage renal disease). Services considered palliative in nature as this type of care do not meet the definition of critical care services.7
Concurrent Care
Critically ill patients often require the care of hospitalists and other specialists throughout the course of treatment. Payors are sensitive to the multiple hours billed by multiple providers for a single patient on a given day. Claim logic provides an automated response to only allow reimbursement for 99291 once per day when reported by physicians of the same group and specialty.8 Physicians of different specialties can separately report critical care hours as long as they are caring for a condition that meets the definition of critical care.
The CMS example of this: A dermatologist evaluates and treats a rash on an ICU patient who is maintained on a ventilator and nitroglycerine infusion that are being managed by an intensivist. The dermatologist should not report a service for critical care.6
Similarly for hospitalists, if an intensivist is taking care of the critical condition and there is nothing more for the hospitalist to add to the plan of care for the critical condition, critical care services may not be justified.
When different specialists are reporting critical care on the same day, it is imperative for the documentation to demonstrate that care is not duplicative of any other provider’s care (i.e., identify management of different conditions or revising elements of the plan). The care cannot overlap the same time period of any other physician reporting critical care services.
Calculating Time
Critical care time constitutes bedside time and time spent on the patient’s unit/floor where the physician is immediately available to the patient (see Table 1). Certain labs, diagnostic studies, and procedures are considered inherent to critical care services and are not reported separately on the claim form: cardiac output measurements (93561, 93562); chest X-rays (71010, 71015, 71020); pulse oximetry (94760, 94761, 94762); blood gases and interpretation of data stored in computers, such as ECGs, blood pressures, and hematologic data (99090); gastric intubation (43752, 43753); temporary transcutaneous pacing (92953); ventilation management (94002–94004, 94660, 94662); and vascular access procedures (36000, 36410, 36415, 36591, 36600).1

Instead, physician time associated with the performance and/or interpretation of these services is toward the cumulative critical care time of the day. Services or procedures that are considered separately billable (e.g., central line placement, intubation, CPR) cannot contribute to critical care time.
When separately billable procedures are performed by the same provider/specialty group on the same day as critical care, physicians should make a notation in the medical record indicating the non-overlapping service times (e.g., “central line insertion is not included as critical care time”). This may assist with securing reimbursement when the payor requests the documentation for each reported claim item.
Activities on the floor/unit that do not directly contribute to patient care or management (e.g., review of literature, teaching rounds) cannot be counted toward critical care time. Do not count time associated with indirect care provided outside of the patient’s unit/floor (e.g., reviewing data or calling the family from the office) toward critical care time.
Family discussions can be counted toward critical care time but must take place at bedside or on the patient’s unit/floor. The patient must participate in the discussion unless medically unable or clinically incompetent to participate. If unable to participate, a notation in the chart must delineate the patient’s inability to participate and the reason.
Credited time can only involve obtaining a medical history and/or discussing treatment options or limitation(s) of treatment. The conversation must bear directly on patient management.1,7 Do not count time associated with providing periodic condition updates to the family, answering questions about the patient’s condition that are unrelated to decision making, or counseling the family during their grief process. If the conversation must take place via phone, it may be counted toward critical care time if the physician is calling from the patient’s unit/floor and the conversation involves the same criterion identified for face-to-face family meetings.10
Physicians should keep track of their critical care time throughout the day. Since critical care time is a cumulative service, each entry should include the total time that critical care services were provided (e.g., 45 minutes).10 Some payors may still impose the notation of “start-and-stop time” per encounter (e.g., 2–2:50 a.m.).
Same-specialty physicians (i.e., two hospitalists from the same group practice) may require separate claims. The initial critical care hour (99291) must be met by a single physician. Medically necessary critical care time beyond the first hour (99292) may be met individually by the same physician or collectively with another physician from the same group. The physician performing the additional time, beyond the first hour, reports the appropriate units of 99292 (see Table 1) under the corresponding NPI.11
CMS has issued instructions for contractors to recognize this atypical reporting method. However, non-Medicare payors may not recognize this newer reporting method and maintain that the cumulative service (by the same-specialty physician in the same provider group) should be reported under one physician name. Be sure to query the payors for appropriate reporting methods. TH
References
- Abraham M, Ahlman J, Boudreau A, Connelly J, Crosslin, R. Current Procedural Terminology 2015 Professional Edition. Chicago: American Medical Association Press; 2014. 23-25.
- Widespread prepayment targeted review notification—CPT 99291. Cahaba website. Available at: www.cahabagba.com/news/widespread-prepayment-targeted-review-notification-part-b/. Accessed December 17, 2015.
- Critical care CPT 99291 widespread prepayment targeted review results. Cahaba website. Available at: https://www.cahabagba.com/news/critical-care-cpt-99291-widespread-prepayment-targeted-review-results-2/. Accessed December 17, 2015.
- Prepayment edit of evaluation and management (E/M) code 99291. First Coast Service Options, Inc. website. Available at: medicare.fcso.com/Publications_B/2013/251608.pdf. Accessed December 17, 2015.
- Medicare claims processing manual: chapter 12, section 30.6.12A. Centers for Medicare & Medicaid Services website. Available at: www.cms.gov/Regulations-and-Guidance/Guidance/Manuals/downloads/clm104c12.pdf. Accessed December 17, 2015.
- Medicare claims processing manual: chapter 12, section 30.6.12B. Centers for Medicare & Medicaid Services website. Available at: www.cms.gov/Regulations-and-Guidance/Guidance/Manuals/downloads/clm104c12.pdf. Accessed December 17, 2015.
- Critical care fact sheet. CGS Administrators, LLC website. Available at: www.cgsmedicare.com/partb/mr/pdf/critical_care_fact_sheet.pdf. Accessed December 17, 2015.
- Same day same service policy. United Healthcare website. Available at: www.unitedhealthcareonline.com/ccmcontent/ProviderII/UHC/en-US/Main%20Menu/Tools%20&%20Resources/Policies%20and%20Protocols/Medicare%20Advantage%20Reimbursement%20Policies/S/SameDaySameService.pdf. Accessed December 17, 2015.
- Medicare claims processing manual: chapter 12, section 30.6.12G. Centers for Medicare & Medicaid Services website. Available at: www.cms.gov/Regulations-and-Guidance/Guidance/Manuals/downloads/clm104c12.pdf. Accessed December 17, 2015.
- Medicare claims processing manual: chapter 12, section 30.6.12E. Centers for Medicare & Medicaid Services website. Available at: www.cms.gov/Regulations-and-Guidance/Guidance/Manuals/downloads/clm104c12.pdf. Accessed December 17, 2015.
- Medicare claims processing manual: chapter 12, section 30.6.12I. Centers for Medicare & Medicaid Services website. Available at: www.cms.gov/Regulations-and-Guidance/Guidance/Manuals/downloads/clm104c12.pdf. Accessed December 17, 2015.
Code 99291 is used for critical care, evaluation, and management of the critically ill or critically injured patient, first 30–74 minutes.1 It is to be reported only once per day per physician or group member of the same specialty.
Code 99292 is for critical care, evaluation, and management of the critically ill or critically injured patient, each additional 30 minutes. It is to be listed separately in addition to the code for primary service.1 Code 99292 is categorized as an add-on code. It must be reported on the same invoice as its primary code, 99291. Multiple units of code 99292 can be reported per day per physician/group.
Despite the increased resources and references for critical care billing, critical care reporting issues persist. Medicare data analysis continues to identify 99291 as high risk for claim payment errors, perpetuating prepayment claim edits for outlier utilization and location discrepancies (i.e., settings other than inpatient hospital, outpatient hospital, or the emergency department). 2,3,4
Bolster your documentation with these three key elements.
Critical Illness, Injury Management
Current Procedural Terminology (CPT) and the Centers for Medicare & Medicaid Services (CMS) define “critical illness or injury” as a condition that acutely impairs one or more vital organ systems such that there is a high probability of imminent or life-threatening deterioration in the patient’s condition (e.g., central nervous system failure; circulatory failure; shock; renal, hepatic, metabolic, and/or respiratory failure).5
Hospitalists providing care to the critically ill patient must perform highly complex decision making and interventions of high intensity that are required to prevent the patient’s inevitable decline. CMS further elaborates that “the patient shall be critically ill or injured at the time of the physician’s visit.”6 This is to ensure that hospitalists and other specialists support the medical necessity of the service and do not continue to report critical care codes on days after the patient has become stable and improved.
Consider the following scenarios:
CMS examples of patients whose medical condition may warrant critical care services (99291, 99292):6
- An 81-year-old male patient is admitted to the ICU following abdominal aortic aneurysm resection. Two days after surgery, he requires fluids and pressors to maintain adequate perfusion and arterial pressures. He remains ventilator dependent.
- A 67-year-old female patient is three days post mitral valve repair. She develops petechiae, hypotension, and hypoxia requiring respiratory and circulatory support.
- A 70-year-old admitted for right lower lobe pneumococcal pneumonia with a history of COPD becomes hypoxic and hypotensive two days after admission.
- A 68-year-old admitted for an acute anterior wall myocardial infarction continues to have symptomatic ventricular tachycardia that is marginally responsive to antiarrhythmic therapy.
CMS examples of patients who may not satisfy Medicare medical necessity criteria, or do not meet critical care criteria, or who do not have a critical care illness or injury and, therefore, are not eligible for critical care payment but may be reported using another appropriate hospital care code, such as subsequent hospital care codes (99231–99233), initial hospital care codes (99221–99223), or hospital consultation codes (99251–99255) when applicable:1,6
- Patients admitted to a critical care unit because no other hospital beds were available;
- Patients admitted to a critical care unit for close nursing observation and/or frequent monitoring of vital signs (e.g., drug toxicity or overdose);
- Patients admitted to a critical care unit because hospital rules require certain treatments (e.g., insulin infusions) to be administered in the critical care unit; and
- Patients receiving only care of a chronic illness in absence of care for a critical illness (e.g., daily management of a chronic ventilator patient, management of or care related to dialysis for end-stage renal disease). Services considered palliative in nature as this type of care do not meet the definition of critical care services.7
Concurrent Care
Critically ill patients often require the care of hospitalists and other specialists throughout the course of treatment. Payors are sensitive to the multiple hours billed by multiple providers for a single patient on a given day. Claim logic provides an automated response to only allow reimbursement for 99291 once per day when reported by physicians of the same group and specialty.8 Physicians of different specialties can separately report critical care hours as long as they are caring for a condition that meets the definition of critical care.
The CMS example of this: A dermatologist evaluates and treats a rash on an ICU patient who is maintained on a ventilator and nitroglycerine infusion that are being managed by an intensivist. The dermatologist should not report a service for critical care.6
Similarly for hospitalists, if an intensivist is taking care of the critical condition and there is nothing more for the hospitalist to add to the plan of care for the critical condition, critical care services may not be justified.
When different specialists are reporting critical care on the same day, it is imperative for the documentation to demonstrate that care is not duplicative of any other provider’s care (i.e., identify management of different conditions or revising elements of the plan). The care cannot overlap the same time period of any other physician reporting critical care services.
Calculating Time
Critical care time constitutes bedside time and time spent on the patient’s unit/floor where the physician is immediately available to the patient (see Table 1). Certain labs, diagnostic studies, and procedures are considered inherent to critical care services and are not reported separately on the claim form: cardiac output measurements (93561, 93562); chest X-rays (71010, 71015, 71020); pulse oximetry (94760, 94761, 94762); blood gases and interpretation of data stored in computers, such as ECGs, blood pressures, and hematologic data (99090); gastric intubation (43752, 43753); temporary transcutaneous pacing (92953); ventilation management (94002–94004, 94660, 94662); and vascular access procedures (36000, 36410, 36415, 36591, 36600).1
Instead, physician time associated with the performance and/or interpretation of these services is toward the cumulative critical care time of the day. Services or procedures that are considered separately billable (e.g., central line placement, intubation, CPR) cannot contribute to critical care time.
When separately billable procedures are performed by the same provider/specialty group on the same day as critical care, physicians should make a notation in the medical record indicating the non-overlapping service times (e.g., “central line insertion is not included as critical care time”). This may assist with securing reimbursement when the payor requests the documentation for each reported claim item.
Activities on the floor/unit that do not directly contribute to patient care or management (e.g., review of literature, teaching rounds) cannot be counted toward critical care time. Do not count time associated with indirect care provided outside of the patient’s unit/floor (e.g., reviewing data or calling the family from the office) toward critical care time.
Family discussions can be counted toward critical care time but must take place at bedside or on the patient’s unit/floor. The patient must participate in the discussion unless medically unable or clinically incompetent to participate. If unable to participate, a notation in the chart must delineate the patient’s inability to participate and the reason.
Credited time can only involve obtaining a medical history and/or discussing treatment options or limitation(s) of treatment. The conversation must bear directly on patient management.1,7 Do not count time associated with providing periodic condition updates to the family, answering questions about the patient’s condition that are unrelated to decision making, or counseling the family during their grief process. If the conversation must take place via phone, it may be counted toward critical care time if the physician is calling from the patient’s unit/floor and the conversation involves the same criterion identified for face-to-face family meetings.10
Physicians should keep track of their critical care time throughout the day. Since critical care time is a cumulative service, each entry should include the total time that critical care services were provided (e.g., 45 minutes).10 Some payors may still impose the notation of “start-and-stop time” per encounter (e.g., 2–2:50 a.m.).
Same-specialty physicians (i.e., two hospitalists from the same group practice) may require separate claims. The initial critical care hour (99291) must be met by a single physician. Medically necessary critical care time beyond the first hour (99292) may be met individually by the same physician or collectively with another physician from the same group. The physician performing the additional time, beyond the first hour, reports the appropriate units of 99292 (see Table 1) under the corresponding NPI.11
CMS has issued instructions for contractors to recognize this atypical reporting method. However, non-Medicare payors may not recognize this newer reporting method and maintain that the cumulative service (by the same-specialty physician in the same provider group) should be reported under one physician name. Be sure to query the payors for appropriate reporting methods. TH
References
- Abraham M, Ahlman J, Boudreau A, Connelly J, Crosslin, R. Current Procedural Terminology 2015 Professional Edition. Chicago: American Medical Association Press; 2014. 23-25.
- Widespread prepayment targeted review notification—CPT 99291. Cahaba website. Available at: www.cahabagba.com/news/widespread-prepayment-targeted-review-notification-part-b/. Accessed December 17, 2015.
- Critical care CPT 99291 widespread prepayment targeted review results. Cahaba website. Available at: https://www.cahabagba.com/news/critical-care-cpt-99291-widespread-prepayment-targeted-review-results-2/. Accessed December 17, 2015.
- Prepayment edit of evaluation and management (E/M) code 99291. First Coast Service Options, Inc. website. Available at: medicare.fcso.com/Publications_B/2013/251608.pdf. Accessed December 17, 2015.
- Medicare claims processing manual: chapter 12, section 30.6.12A. Centers for Medicare & Medicaid Services website. Available at: www.cms.gov/Regulations-and-Guidance/Guidance/Manuals/downloads/clm104c12.pdf. Accessed December 17, 2015.
- Medicare claims processing manual: chapter 12, section 30.6.12B. Centers for Medicare & Medicaid Services website. Available at: www.cms.gov/Regulations-and-Guidance/Guidance/Manuals/downloads/clm104c12.pdf. Accessed December 17, 2015.
- Critical care fact sheet. CGS Administrators, LLC website. Available at: www.cgsmedicare.com/partb/mr/pdf/critical_care_fact_sheet.pdf. Accessed December 17, 2015.
- Same day same service policy. United Healthcare website. Available at: www.unitedhealthcareonline.com/ccmcontent/ProviderII/UHC/en-US/Main%20Menu/Tools%20&%20Resources/Policies%20and%20Protocols/Medicare%20Advantage%20Reimbursement%20Policies/S/SameDaySameService.pdf. Accessed December 17, 2015.
- Medicare claims processing manual: chapter 12, section 30.6.12G. Centers for Medicare & Medicaid Services website. Available at: www.cms.gov/Regulations-and-Guidance/Guidance/Manuals/downloads/clm104c12.pdf. Accessed December 17, 2015.
- Medicare claims processing manual: chapter 12, section 30.6.12E. Centers for Medicare & Medicaid Services website. Available at: www.cms.gov/Regulations-and-Guidance/Guidance/Manuals/downloads/clm104c12.pdf. Accessed December 17, 2015.
- Medicare claims processing manual: chapter 12, section 30.6.12I. Centers for Medicare & Medicaid Services website. Available at: www.cms.gov/Regulations-and-Guidance/Guidance/Manuals/downloads/clm104c12.pdf. Accessed December 17, 2015.
Code 99291 is used for critical care, evaluation, and management of the critically ill or critically injured patient, first 30–74 minutes.1 It is to be reported only once per day per physician or group member of the same specialty.
Code 99292 is for critical care, evaluation, and management of the critically ill or critically injured patient, each additional 30 minutes. It is to be listed separately in addition to the code for primary service.1 Code 99292 is categorized as an add-on code. It must be reported on the same invoice as its primary code, 99291. Multiple units of code 99292 can be reported per day per physician/group.
Despite the increased resources and references for critical care billing, critical care reporting issues persist. Medicare data analysis continues to identify 99291 as high risk for claim payment errors, perpetuating prepayment claim edits for outlier utilization and location discrepancies (i.e., settings other than inpatient hospital, outpatient hospital, or the emergency department). 2,3,4
Bolster your documentation with these three key elements.
Critical Illness, Injury Management
Current Procedural Terminology (CPT) and the Centers for Medicare & Medicaid Services (CMS) define “critical illness or injury” as a condition that acutely impairs one or more vital organ systems such that there is a high probability of imminent or life-threatening deterioration in the patient’s condition (e.g., central nervous system failure; circulatory failure; shock; renal, hepatic, metabolic, and/or respiratory failure).5
Hospitalists providing care to the critically ill patient must perform highly complex decision making and interventions of high intensity that are required to prevent the patient’s inevitable decline. CMS further elaborates that “the patient shall be critically ill or injured at the time of the physician’s visit.”6 This is to ensure that hospitalists and other specialists support the medical necessity of the service and do not continue to report critical care codes on days after the patient has become stable and improved.
Consider the following scenarios:
CMS examples of patients whose medical condition may warrant critical care services (99291, 99292):6
- An 81-year-old male patient is admitted to the ICU following abdominal aortic aneurysm resection. Two days after surgery, he requires fluids and pressors to maintain adequate perfusion and arterial pressures. He remains ventilator dependent.
- A 67-year-old female patient is three days post mitral valve repair. She develops petechiae, hypotension, and hypoxia requiring respiratory and circulatory support.
- A 70-year-old admitted for right lower lobe pneumococcal pneumonia with a history of COPD becomes hypoxic and hypotensive two days after admission.
- A 68-year-old admitted for an acute anterior wall myocardial infarction continues to have symptomatic ventricular tachycardia that is marginally responsive to antiarrhythmic therapy.
CMS examples of patients who may not satisfy Medicare medical necessity criteria, or do not meet critical care criteria, or who do not have a critical care illness or injury and, therefore, are not eligible for critical care payment but may be reported using another appropriate hospital care code, such as subsequent hospital care codes (99231–99233), initial hospital care codes (99221–99223), or hospital consultation codes (99251–99255) when applicable:1,6
- Patients admitted to a critical care unit because no other hospital beds were available;
- Patients admitted to a critical care unit for close nursing observation and/or frequent monitoring of vital signs (e.g., drug toxicity or overdose);
- Patients admitted to a critical care unit because hospital rules require certain treatments (e.g., insulin infusions) to be administered in the critical care unit; and
- Patients receiving only care of a chronic illness in absence of care for a critical illness (e.g., daily management of a chronic ventilator patient, management of or care related to dialysis for end-stage renal disease). Services considered palliative in nature as this type of care do not meet the definition of critical care services.7
Concurrent Care
Critically ill patients often require the care of hospitalists and other specialists throughout the course of treatment. Payors are sensitive to the multiple hours billed by multiple providers for a single patient on a given day. Claim logic provides an automated response to only allow reimbursement for 99291 once per day when reported by physicians of the same group and specialty.8 Physicians of different specialties can separately report critical care hours as long as they are caring for a condition that meets the definition of critical care.
The CMS example of this: A dermatologist evaluates and treats a rash on an ICU patient who is maintained on a ventilator and nitroglycerine infusion that are being managed by an intensivist. The dermatologist should not report a service for critical care.6
Similarly for hospitalists, if an intensivist is taking care of the critical condition and there is nothing more for the hospitalist to add to the plan of care for the critical condition, critical care services may not be justified.
When different specialists are reporting critical care on the same day, it is imperative for the documentation to demonstrate that care is not duplicative of any other provider’s care (i.e., identify management of different conditions or revising elements of the plan). The care cannot overlap the same time period of any other physician reporting critical care services.
Calculating Time
Critical care time constitutes bedside time and time spent on the patient’s unit/floor where the physician is immediately available to the patient (see Table 1). Certain labs, diagnostic studies, and procedures are considered inherent to critical care services and are not reported separately on the claim form: cardiac output measurements (93561, 93562); chest X-rays (71010, 71015, 71020); pulse oximetry (94760, 94761, 94762); blood gases and interpretation of data stored in computers, such as ECGs, blood pressures, and hematologic data (99090); gastric intubation (43752, 43753); temporary transcutaneous pacing (92953); ventilation management (94002–94004, 94660, 94662); and vascular access procedures (36000, 36410, 36415, 36591, 36600).1
Instead, physician time associated with the performance and/or interpretation of these services is toward the cumulative critical care time of the day. Services or procedures that are considered separately billable (e.g., central line placement, intubation, CPR) cannot contribute to critical care time.
When separately billable procedures are performed by the same provider/specialty group on the same day as critical care, physicians should make a notation in the medical record indicating the non-overlapping service times (e.g., “central line insertion is not included as critical care time”). This may assist with securing reimbursement when the payor requests the documentation for each reported claim item.
Activities on the floor/unit that do not directly contribute to patient care or management (e.g., review of literature, teaching rounds) cannot be counted toward critical care time. Do not count time associated with indirect care provided outside of the patient’s unit/floor (e.g., reviewing data or calling the family from the office) toward critical care time.
Family discussions can be counted toward critical care time but must take place at bedside or on the patient’s unit/floor. The patient must participate in the discussion unless medically unable or clinically incompetent to participate. If unable to participate, a notation in the chart must delineate the patient’s inability to participate and the reason.
Credited time can only involve obtaining a medical history and/or discussing treatment options or limitation(s) of treatment. The conversation must bear directly on patient management.1,7 Do not count time associated with providing periodic condition updates to the family, answering questions about the patient’s condition that are unrelated to decision making, or counseling the family during their grief process. If the conversation must take place via phone, it may be counted toward critical care time if the physician is calling from the patient’s unit/floor and the conversation involves the same criterion identified for face-to-face family meetings.10
Physicians should keep track of their critical care time throughout the day. Since critical care time is a cumulative service, each entry should include the total time that critical care services were provided (e.g., 45 minutes).10 Some payors may still impose the notation of “start-and-stop time” per encounter (e.g., 2–2:50 a.m.).
Same-specialty physicians (i.e., two hospitalists from the same group practice) may require separate claims. The initial critical care hour (99291) must be met by a single physician. Medically necessary critical care time beyond the first hour (99292) may be met individually by the same physician or collectively with another physician from the same group. The physician performing the additional time, beyond the first hour, reports the appropriate units of 99292 (see Table 1) under the corresponding NPI.11
CMS has issued instructions for contractors to recognize this atypical reporting method. However, non-Medicare payors may not recognize this newer reporting method and maintain that the cumulative service (by the same-specialty physician in the same provider group) should be reported under one physician name. Be sure to query the payors for appropriate reporting methods. TH
References
- Abraham M, Ahlman J, Boudreau A, Connelly J, Crosslin, R. Current Procedural Terminology 2015 Professional Edition. Chicago: American Medical Association Press; 2014. 23-25.
- Widespread prepayment targeted review notification—CPT 99291. Cahaba website. Available at: www.cahabagba.com/news/widespread-prepayment-targeted-review-notification-part-b/. Accessed December 17, 2015.
- Critical care CPT 99291 widespread prepayment targeted review results. Cahaba website. Available at: https://www.cahabagba.com/news/critical-care-cpt-99291-widespread-prepayment-targeted-review-results-2/. Accessed December 17, 2015.
- Prepayment edit of evaluation and management (E/M) code 99291. First Coast Service Options, Inc. website. Available at: medicare.fcso.com/Publications_B/2013/251608.pdf. Accessed December 17, 2015.
- Medicare claims processing manual: chapter 12, section 30.6.12A. Centers for Medicare & Medicaid Services website. Available at: www.cms.gov/Regulations-and-Guidance/Guidance/Manuals/downloads/clm104c12.pdf. Accessed December 17, 2015.
- Medicare claims processing manual: chapter 12, section 30.6.12B. Centers for Medicare & Medicaid Services website. Available at: www.cms.gov/Regulations-and-Guidance/Guidance/Manuals/downloads/clm104c12.pdf. Accessed December 17, 2015.
- Critical care fact sheet. CGS Administrators, LLC website. Available at: www.cgsmedicare.com/partb/mr/pdf/critical_care_fact_sheet.pdf. Accessed December 17, 2015.
- Same day same service policy. United Healthcare website. Available at: www.unitedhealthcareonline.com/ccmcontent/ProviderII/UHC/en-US/Main%20Menu/Tools%20&%20Resources/Policies%20and%20Protocols/Medicare%20Advantage%20Reimbursement%20Policies/S/SameDaySameService.pdf. Accessed December 17, 2015.
- Medicare claims processing manual: chapter 12, section 30.6.12G. Centers for Medicare & Medicaid Services website. Available at: www.cms.gov/Regulations-and-Guidance/Guidance/Manuals/downloads/clm104c12.pdf. Accessed December 17, 2015.
- Medicare claims processing manual: chapter 12, section 30.6.12E. Centers for Medicare & Medicaid Services website. Available at: www.cms.gov/Regulations-and-Guidance/Guidance/Manuals/downloads/clm104c12.pdf. Accessed December 17, 2015.
- Medicare claims processing manual: chapter 12, section 30.6.12I. Centers for Medicare & Medicaid Services website. Available at: www.cms.gov/Regulations-and-Guidance/Guidance/Manuals/downloads/clm104c12.pdf. Accessed December 17, 2015.
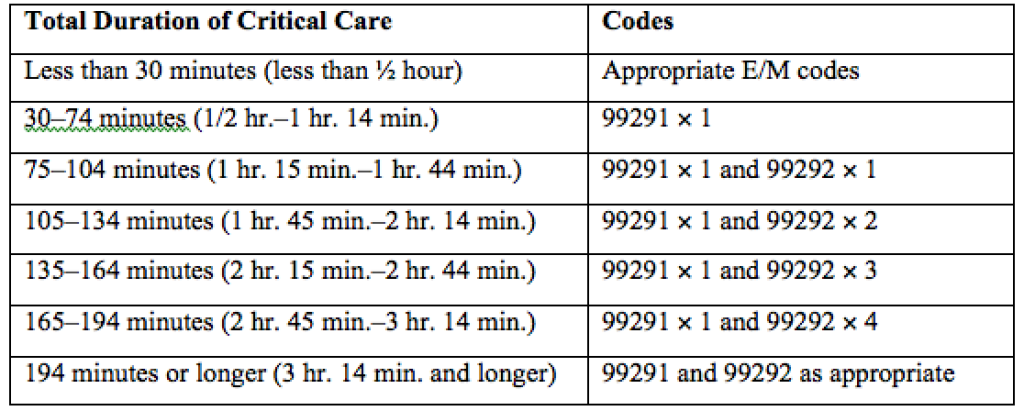
Pre-labor cesarean delivery linked to ALL

Photo by Nina Matthews
Researchers have found a potential correlation between pre-labor cesarean delivery (PLCD) and acute lymphoblastic leukemia (ALL).
The team analyzed data from 13 studies and found a 23% increase in the risk of ALL in children born by PLCD.
However, there was no link between PLCD and acute myeloid leukemia (AML), and there was no correlation between emergency cesareans and ALL or AML.
Erin Marcotte, PhD, of the University of Minnesota, and her colleagues reported these results in The Lancet Haematology.
The researchers analyzed data from the Childhood Leukemia International Consortium. They looked at 33,571 subjects overall, including 23,351 control subjects, 8780 cases of ALL, and 1332 cases of AML.
The analyses were controlled for a number of outside factors, including breastfeeding, parental education levels, and ethnicity.
“Our goal was to determine if there was an association between cesarean deliveries and ALL [and] to identify potential new targets for research into cancer prevention if there is a correlation,” Dr Marcotte said.
“While the link between overall cesarean delivery and childhood leukemia was not statistically significant, it was notable to find an association between pre-labor cesarean delivery and ALL.”
The data suggested AML was not associated with cesarean delivery. The odds ratios (ORs) were 0.99 for all cesarean deliveries, 0.83 for PLCD, and 1.05 for emergency cesarean delivery.
The ORs for ALL were 1.06 overall, 1.02 for emergency cesarean delivery, and 1.23 (P=0.018) for PLCD.
The reason for the increased risk of ALL with PLCD is not known. The researchers said several mechanisms may be at play, including the stress response in the fetus caused by labor and the colonization of microbiota a newborn experiences during a vaginal delivery that is missed during a cesarean birth.
“The most plausible explanation for the association between ALL and pre-labor cesarean delivery is in the cortisol, or stress-related, mechanism,” Dr Marcotte said. “Because ALL is not associated with all cesarean deliveries, it seems less likely the microbiota colonization is a significant factor in this phenomenon. We believe further investigation into this cortisol-mechanism link is warranted due to these findings.”
The researchers said the strength of association in these findings is comparable to other studies looking at cesarean delivery rates and other childhood outcomes, including Type I diabetes and asthma. They believe further investigation into this study’s findings is needed, utilizing more detailed and reliable delivery information.
“This association deserves a closer look to better determine what’s behind the link,” said Logan Spector, PhD, of the University of Minnesota.
“Cortisol exposure is plausible since similar compounds are used to treat ALL. We also know that some are born with cells that are on the path to becoming leukemia. Thus, our working hypothesis is that cortisol exposure at birth may eliminate these pre-leukemic cells.” 
Photo by Nina Matthews
Researchers have found a potential correlation between pre-labor cesarean delivery (PLCD) and acute lymphoblastic leukemia (ALL).
The team analyzed data from 13 studies and found a 23% increase in the risk of ALL in children born by PLCD.
However, there was no link between PLCD and acute myeloid leukemia (AML), and there was no correlation between emergency cesareans and ALL or AML.
Erin Marcotte, PhD, of the University of Minnesota, and her colleagues reported these results in The Lancet Haematology.
The researchers analyzed data from the Childhood Leukemia International Consortium. They looked at 33,571 subjects overall, including 23,351 control subjects, 8780 cases of ALL, and 1332 cases of AML.
The analyses were controlled for a number of outside factors, including breastfeeding, parental education levels, and ethnicity.
“Our goal was to determine if there was an association between cesarean deliveries and ALL [and] to identify potential new targets for research into cancer prevention if there is a correlation,” Dr Marcotte said.
“While the link between overall cesarean delivery and childhood leukemia was not statistically significant, it was notable to find an association between pre-labor cesarean delivery and ALL.”
The data suggested AML was not associated with cesarean delivery. The odds ratios (ORs) were 0.99 for all cesarean deliveries, 0.83 for PLCD, and 1.05 for emergency cesarean delivery.
The ORs for ALL were 1.06 overall, 1.02 for emergency cesarean delivery, and 1.23 (P=0.018) for PLCD.
The reason for the increased risk of ALL with PLCD is not known. The researchers said several mechanisms may be at play, including the stress response in the fetus caused by labor and the colonization of microbiota a newborn experiences during a vaginal delivery that is missed during a cesarean birth.
“The most plausible explanation for the association between ALL and pre-labor cesarean delivery is in the cortisol, or stress-related, mechanism,” Dr Marcotte said. “Because ALL is not associated with all cesarean deliveries, it seems less likely the microbiota colonization is a significant factor in this phenomenon. We believe further investigation into this cortisol-mechanism link is warranted due to these findings.”
The researchers said the strength of association in these findings is comparable to other studies looking at cesarean delivery rates and other childhood outcomes, including Type I diabetes and asthma. They believe further investigation into this study’s findings is needed, utilizing more detailed and reliable delivery information.
“This association deserves a closer look to better determine what’s behind the link,” said Logan Spector, PhD, of the University of Minnesota.
“Cortisol exposure is plausible since similar compounds are used to treat ALL. We also know that some are born with cells that are on the path to becoming leukemia. Thus, our working hypothesis is that cortisol exposure at birth may eliminate these pre-leukemic cells.”
Photo by Nina Matthews
Researchers have found a potential correlation between pre-labor cesarean delivery (PLCD) and acute lymphoblastic leukemia (ALL).
The team analyzed data from 13 studies and found a 23% increase in the risk of ALL in children born by PLCD.
However, there was no link between PLCD and acute myeloid leukemia (AML), and there was no correlation between emergency cesareans and ALL or AML.
Erin Marcotte, PhD, of the University of Minnesota, and her colleagues reported these results in The Lancet Haematology.
The researchers analyzed data from the Childhood Leukemia International Consortium. They looked at 33,571 subjects overall, including 23,351 control subjects, 8780 cases of ALL, and 1332 cases of AML.
The analyses were controlled for a number of outside factors, including breastfeeding, parental education levels, and ethnicity.
“Our goal was to determine if there was an association between cesarean deliveries and ALL [and] to identify potential new targets for research into cancer prevention if there is a correlation,” Dr Marcotte said.
“While the link between overall cesarean delivery and childhood leukemia was not statistically significant, it was notable to find an association between pre-labor cesarean delivery and ALL.”
The data suggested AML was not associated with cesarean delivery. The odds ratios (ORs) were 0.99 for all cesarean deliveries, 0.83 for PLCD, and 1.05 for emergency cesarean delivery.
The ORs for ALL were 1.06 overall, 1.02 for emergency cesarean delivery, and 1.23 (P=0.018) for PLCD.
The reason for the increased risk of ALL with PLCD is not known. The researchers said several mechanisms may be at play, including the stress response in the fetus caused by labor and the colonization of microbiota a newborn experiences during a vaginal delivery that is missed during a cesarean birth.
“The most plausible explanation for the association between ALL and pre-labor cesarean delivery is in the cortisol, or stress-related, mechanism,” Dr Marcotte said. “Because ALL is not associated with all cesarean deliveries, it seems less likely the microbiota colonization is a significant factor in this phenomenon. We believe further investigation into this cortisol-mechanism link is warranted due to these findings.”
The researchers said the strength of association in these findings is comparable to other studies looking at cesarean delivery rates and other childhood outcomes, including Type I diabetes and asthma. They believe further investigation into this study’s findings is needed, utilizing more detailed and reliable delivery information.
“This association deserves a closer look to better determine what’s behind the link,” said Logan Spector, PhD, of the University of Minnesota.
“Cortisol exposure is plausible since similar compounds are used to treat ALL. We also know that some are born with cells that are on the path to becoming leukemia. Thus, our working hypothesis is that cortisol exposure at birth may eliminate these pre-leukemic cells.”
FDA authorizes CDC’s test for Zika virus
Photo by Jeremy L. Grisham
The US Food and Drug Administration (FDA) has issued an Emergency Use Authorization (EUA) for a laboratory test used to detect the Zika virus.
The test, which was developed by the Centers for Disease Control and Prevention (CDC), is called the Zika IgM Antibody Capture Enzyme-Linked Immunosorbent Assay (Zika MAC-ELISA).
It will be distributed to certain laboratories in the US and abroad over the next 2 weeks.
The test will not be available in US hospitals or other primary care settings.
The Zika MAC-ELISA test can detect human immunoglobulin M (IgM) antibodies to the Zika virus. These antibodies appear in the blood of an infected person 4 to 5 days after the start of the illness, and they remain in the blood for about 12 weeks.
The Zika MAC-ELISA test is intended for use in sera or cerebrospinal fluid when submitted with a patient-matched serum sample from individuals meeting CDC Zika clinical and epidemiological criteria for testing. This includes people with a history of symptoms associated with Zika and/or people who have recently traveled to an area that has active Zika transmission.
Results of Zika MAC-ELISA tests require careful interpretation. The test can give false-positive results when someone has been infected with a virus closely related to Zika (such as dengue virus).
When positive or inconclusive results occur, additional testing (plaque reduction neutralization test) to confirm the presence of antibodies to Zika virus will be performed by the CDC or a CDC-authorized laboratory.
Moreover, a negative test result does not necessarily mean a person has not been infected with Zika virus. If a sample is collected just after a person becomes ill, there may not be enough IgM antibodies for the test to measure, resulting in a false-negative.
Similarly, if the sample was collected more than 12 weeks after illness, it is possible that the body has successfully fought the virus and IgM antibody levels have dropped below the detectable limit.
The CDC will begin distributing the Zika MAC-ELISA test over the next 2 weeks to qualified laboratories in the Laboratory Response Network, an integrated network of domestic and international laboratories that can respond to public health emergencies.
About the EUA
An EUA allows the use of unapproved medical products or unapproved uses of approved medical products in an emergency. The products must be used to diagnose, treat, or prevent serious or life-threatening conditions caused by chemical, biological, radiological, or nuclear threat agents, when there are no adequate alternatives.
As there are no commercially available diagnostic tests approved by the FDA for the detection of Zika virus infection, the agency decided an EUA was crucial to ensure timely access to a diagnostic tool.
The FDA issued the EUA for the Zika MAC-ELISA test based on data submitted by the CDC and on the US Secretary of Health and Human Services’ declaration that circumstances exist to justify the emergency use of in vitro diagnostic tests for the detection of Zika virus and Zika virus infection. This EUA will end when the Secretary’s declaration ends, unless the FDA revokes it sooner.
Photo by Jeremy L. Grisham
The US Food and Drug Administration (FDA) has issued an Emergency Use Authorization (EUA) for a laboratory test used to detect the Zika virus.
The test, which was developed by the Centers for Disease Control and Prevention (CDC), is called the Zika IgM Antibody Capture Enzyme-Linked Immunosorbent Assay (Zika MAC-ELISA).
It will be distributed to certain laboratories in the US and abroad over the next 2 weeks.
The test will not be available in US hospitals or other primary care settings.
The Zika MAC-ELISA test can detect human immunoglobulin M (IgM) antibodies to the Zika virus. These antibodies appear in the blood of an infected person 4 to 5 days after the start of the illness, and they remain in the blood for about 12 weeks.
The Zika MAC-ELISA test is intended for use in sera or cerebrospinal fluid when submitted with a patient-matched serum sample from individuals meeting CDC Zika clinical and epidemiological criteria for testing. This includes people with a history of symptoms associated with Zika and/or people who have recently traveled to an area that has active Zika transmission.
Results of Zika MAC-ELISA tests require careful interpretation. The test can give false-positive results when someone has been infected with a virus closely related to Zika (such as dengue virus).
When positive or inconclusive results occur, additional testing (plaque reduction neutralization test) to confirm the presence of antibodies to Zika virus will be performed by the CDC or a CDC-authorized laboratory.
Moreover, a negative test result does not necessarily mean a person has not been infected with Zika virus. If a sample is collected just after a person becomes ill, there may not be enough IgM antibodies for the test to measure, resulting in a false-negative.
Similarly, if the sample was collected more than 12 weeks after illness, it is possible that the body has successfully fought the virus and IgM antibody levels have dropped below the detectable limit.
The CDC will begin distributing the Zika MAC-ELISA test over the next 2 weeks to qualified laboratories in the Laboratory Response Network, an integrated network of domestic and international laboratories that can respond to public health emergencies.
About the EUA
An EUA allows the use of unapproved medical products or unapproved uses of approved medical products in an emergency. The products must be used to diagnose, treat, or prevent serious or life-threatening conditions caused by chemical, biological, radiological, or nuclear threat agents, when there are no adequate alternatives.
As there are no commercially available diagnostic tests approved by the FDA for the detection of Zika virus infection, the agency decided an EUA was crucial to ensure timely access to a diagnostic tool.
The FDA issued the EUA for the Zika MAC-ELISA test based on data submitted by the CDC and on the US Secretary of Health and Human Services’ declaration that circumstances exist to justify the emergency use of in vitro diagnostic tests for the detection of Zika virus and Zika virus infection. This EUA will end when the Secretary’s declaration ends, unless the FDA revokes it sooner.
Photo by Jeremy L. Grisham
The US Food and Drug Administration (FDA) has issued an Emergency Use Authorization (EUA) for a laboratory test used to detect the Zika virus.
The test, which was developed by the Centers for Disease Control and Prevention (CDC), is called the Zika IgM Antibody Capture Enzyme-Linked Immunosorbent Assay (Zika MAC-ELISA).
It will be distributed to certain laboratories in the US and abroad over the next 2 weeks.
The test will not be available in US hospitals or other primary care settings.
The Zika MAC-ELISA test can detect human immunoglobulin M (IgM) antibodies to the Zika virus. These antibodies appear in the blood of an infected person 4 to 5 days after the start of the illness, and they remain in the blood for about 12 weeks.
The Zika MAC-ELISA test is intended for use in sera or cerebrospinal fluid when submitted with a patient-matched serum sample from individuals meeting CDC Zika clinical and epidemiological criteria for testing. This includes people with a history of symptoms associated with Zika and/or people who have recently traveled to an area that has active Zika transmission.
Results of Zika MAC-ELISA tests require careful interpretation. The test can give false-positive results when someone has been infected with a virus closely related to Zika (such as dengue virus).
When positive or inconclusive results occur, additional testing (plaque reduction neutralization test) to confirm the presence of antibodies to Zika virus will be performed by the CDC or a CDC-authorized laboratory.
Moreover, a negative test result does not necessarily mean a person has not been infected with Zika virus. If a sample is collected just after a person becomes ill, there may not be enough IgM antibodies for the test to measure, resulting in a false-negative.
Similarly, if the sample was collected more than 12 weeks after illness, it is possible that the body has successfully fought the virus and IgM antibody levels have dropped below the detectable limit.
The CDC will begin distributing the Zika MAC-ELISA test over the next 2 weeks to qualified laboratories in the Laboratory Response Network, an integrated network of domestic and international laboratories that can respond to public health emergencies.
About the EUA
An EUA allows the use of unapproved medical products or unapproved uses of approved medical products in an emergency. The products must be used to diagnose, treat, or prevent serious or life-threatening conditions caused by chemical, biological, radiological, or nuclear threat agents, when there are no adequate alternatives.
As there are no commercially available diagnostic tests approved by the FDA for the detection of Zika virus infection, the agency decided an EUA was crucial to ensure timely access to a diagnostic tool.
The FDA issued the EUA for the Zika MAC-ELISA test based on data submitted by the CDC and on the US Secretary of Health and Human Services’ declaration that circumstances exist to justify the emergency use of in vitro diagnostic tests for the detection of Zika virus and Zika virus infection. This EUA will end when the Secretary’s declaration ends, unless the FDA revokes it sooner.
Predicting Readmissions from EHR Data
Unplanned hospital readmissions are frequent, costly, and potentially avoidable.[1, 2] Due to major federal financial readmissions penalties targeting excessive 30‐day readmissions, there is increasing attention to implementing hospital‐initiated interventions to reduce readmissions.[3, 4] However, universal enrollment of all hospitalized patients into such programs may be too resource intensive for many hospitals.[5] To optimize efficiency and effectiveness, interventions should be targeted to individuals most likely to benefit.[6, 7] However, existing readmission risk‐prediction models have achieved only modest discrimination, have largely used administrative claims data not available until months after discharge, or are limited to only a subset of patients with Medicare or a specific clinical condition.[8, 9, 10, 11, 12, 13, 14] These limitations have precluded accurate identification of high‐risk individuals in an all‐payer general medical inpatient population to provide actionable information for intervention prior to discharge.
Approaches using electronic health record (EHR) data could allow early identification of high‐risk patients during the index hospitalization to enable initiation of interventions prior to discharge. To date, such strategies have relied largely on EHR data from the day of admission.[15, 16] However, given that variation in 30‐day readmission rates are thought to reflect the quality of in‐hospital care, incorporating EHR data from the entire hospital stay to reflect hospital care processes and clinical trajectory may more accurately identify at‐risk patients.[17, 18, 19, 20] Improved accuracy in risk prediction would help better target intervention efforts in the immediate postdischarge period, an interval characterized by heightened vulnerability for adverse events.[21]
To help hospitals target transitional care interventions more effectively to high‐risk individuals prior to discharge, we derived and validated a readmissions risk‐prediction model incorporating EHR data from the entire course of the index hospitalization, which we termed the full‐stay EHR model. We also compared the full‐stay EHR model performance to our group's previously derived prediction model based on EHR data on the day of admission, termed the first‐day EHR model, as well as to 2 other validated readmission models similarly intended to yield near real‐time risk predictions prior to or shortly after hospital discharge.[9, 10, 15]
METHODS
Study Design, Population, and Data Sources
We conducted an observational cohort study using EHR data from 6 hospitals in the DallasFort Worth metroplex between November 1, 2009 and October 30, 2010 using the same EHR system (Epic Systems Corp., Verona, WI). One site was a university‐affiliated safety net hospital; the remaining 5 sites were teaching and nonteaching community sites.
We included consecutive hospitalizations among adults 18 years old discharged alive from any medicine inpatient service. For individuals with multiple hospitalizations during the study period, we included only the first hospitalization. We excluded individuals who died during the index hospitalization, were transferred to another acute care facility, left against medical advice, or who died outside of the hospital within 30 days of discharge. For model derivation, we randomly split the sample into separate derivation (50%) and validation cohorts (50%).
Outcomes
The primary outcome was 30‐day hospital readmission, defined as a nonelective hospitalization within 30 days of discharge to any of 75 acute care hospitals within a 100‐mile radius of Dallas, ascertained from an all‐payer regional hospitalization database. Nonelective hospitalizations included all hospitalizations classified as a emergency, urgent, or trauma, and excluded those classified as elective as per the Centers for Medicare and Medicaid Services Claim Inpatient Admission Type Code definitions.
Predictor Variables for the Full‐Stay EHR Model
The full‐stay EHR model was iteratively developed from our group's previously derived and validated risk‐prediction model using EHR data available on admission (first‐day EHR model).[15] For the full‐stay EHR model, we included all predictor variables included in our published first‐day EHR model as candidate risk factors. Based on prior literature, we additionally expanded candidate predictors available on admission to include marital status (proxy for social isolation) and socioeconomic disadvantage (percent poverty, unemployment, median income, and educational attainment by zip code of residence as proxy measures of the social and built environment).[22, 23, 24, 25, 26, 27] We also expanded the ascertainment of prior hospitalization to include admissions at both the index hospital and any of 75 acute care hospitals from the same, separate all‐payer regional hospitalization database used to ascertain 30‐day readmissions.
Candidate predictors from the remainder of the hospital stay (ie, following the first 24 hours of admission) were included if they were: (1) available in the EHR of all participating hospitals, (2) routinely collected or available at the time of hospital discharge, and (3) plausible predictors of adverse outcomes based on prior literature and clinical expertise. These included length of stay, in‐hospital complications, transfer to an intensive or coronary care unit, blood transfusions, vital sign instabilities within 24 hours of discharge, select laboratory values at time of discharge, and disposition status. We also assessed trajectories of vital signs and selected laboratory values (defined as changes in these measures from admission to discharge).
Statistical Analysis
Model Derivation
Univariate relationships between readmission and each of the candidate predictors were assessed in the derivation cohort using a prespecified significance threshold of P 0.05. We included all factors from our previously derived and validated first‐day EHR model as candidate predictors.[15] Continuous laboratory and vital sign values at the time of discharge were categorized based on clinically meaningful cutoffs; predictors with missing values were assumed to be normal (1% missing for each variable). Significant univariate candidate variables were entered in a multivariate logistic regression model using stepwise backward selection with a prespecified significance threshold of P 0.05. We performed several sensitivity analyses to confirm the robustness of our model. First, we alternately derived the full‐stay model using stepwise forward selection. Second, we forced in all significant variables from our first‐day EHR model, and entered the candidate variables from the remainder of the hospital stay using both stepwise backward and forward selection separately. Third, prespecified interactions between variables were evaluated for inclusion. Though final predictors varied slightly between the different approaches, discrimination of each model was similar to the model derived using our primary analytic approach (C statistics 0.01, data not shown).
Model Validation
We assessed model discrimination and calibration of the derived full‐stay EHR model using the validation cohort. Model discrimination was estimated by the C statistic. The C statistic represents the probability that, given 2 hospitalized individuals (1 who was readmitted and the other who was not), the model will predict a higher risk for the readmitted patient than for the nonreadmitted patient. Model calibration was assessed by comparing predicted to observed probabilities of readmission by quintiles of risk, and with the Hosmer‐Lemeshow goodness‐of‐fit test.
Comparison to Existing Models
We compared the full‐stay EHR model performance to 3 previously published models: our group's first‐day EHR model, and the LACE (includes Length of stay, Acute (nonelective) admission status, Charlson Comorbidity Index, and Emergency department visits in the past year) and HOSPITAL (includes Hemoglobin at discharge, discharge from Oncology service, Sodium level at discharge, Procedure during index hospitalization, Index hospitalization Type (nonelective), number of Admissions in the past year, and Length of stay) models, which were both derived to predict 30‐day readmissions among general medical inpatients and were intended to help clinicians identify high‐risk patients to target for discharge interventions.[9, 10, 15] We assessed each model's performance in our validation cohort, calculating the C statistic, integrated discrimination index (IDI), and net reclassification index (NRI) compared to the full‐stay model. IDI is a summary measure of both discrimination and reclassification, where more positive values suggest improvement in model performance in both these domains compared to a reference model.[28] The NRI is defined as the sum of the net proportions of correctly reclassified persons with and without the event of interest.[29] The theoretical range of values is 2 to 2, with more positive values indicating improved net reclassification compared to a reference model. Here, we calculated a category‐based NRI to evaluate the performance of models in correctly classifying individuals with and without readmissions into the highest readmission risk quintile versus the lowest 4 risk quintiles compared to the full‐stay EHR model.[29] This prespecified cutoff is relevant for hospitals interested in identifying the highest‐risk individuals for targeted intervention.[6] Because some hospitals may be able to target a greater number of individuals for intervention, we performed a sensitivity analysis by assessing category‐based NRI for reclassification into the top 2 risk quintiles versus the lowest 3 risk quintiles and found no meaningful difference in our results (data not shown). Finally, we qualitatively assessed calibration of comparator models in our validation cohort by comparing predicted probability to observed probability of readmission by quintiles of risk for each model. We conducted all analyses using Stata 12.1 (StataCorp, College Station, TX). This study was approved by the UT Southwestern Medical Center institutional review board.
RESULTS
Overall, 32,922 index hospitalizations were included in our study cohort; 12.7% resulted in a 30‐day readmission (see Supporting Figure 1 in the online version of this article). Individuals had a mean age of 62 years and had diverse race/ethnicity and primary insurance status; half were female (Table 1). The study sample was randomly split into a derivation cohort (50%, n = 16,492) and validation cohort (50%, n = 16,430). Individuals in the derivation cohort with a 30‐day readmission had markedly different socioeconomic and clinical characteristics compared to those not readmitted (Table 1).
| Entire Cohort, N = 32,922 | Derivation Cohort, N = 16,492 | |||
|---|---|---|---|---|
|
No Readmission, N = 14,312 |
Readmission, N = 2,180 |
P Value | ||
| ||||
| Demographic characteristics | ||||
| Age, y, mean (SD) | 62 (17.3) | 61 (17.4) | 64 (17.0) | 0.001 |
| Female, n (%) | 17,715 (53.8) | 7,694 (53.8) | 1,163 (53.3) | 0.72 |
| Race/ethnicity | 0.001 | |||
| White | 21,359 (64.9) | 9,329 (65.2) | 1,361 (62.4) | |
| Black | 5,964 (18.1) | 2,520 (17.6) | 434 (19.9) | |
| Hispanic | 4,452 (13.5) | 1,931 (13.5) | 338 (15.5) | |
| Other | 1,147 (3.5) | 532 (3.7) | 47 (2.2) | |
| Marital status, n (%) | 0.001 | |||
| Single | 8,076 (24.5) | 3,516 (24.6) | 514 (23.6) | |
| Married | 13,394 (40.7) | 5,950 (41.6) | 812 (37.3) | |
| Separated/divorced | 3,468 (10.5) | 1,460 (10.2) | 251 (11.5) | |
| Widowed | 4,487 (13.7) | 1,868 (13.1) | 388 (17.8) | |
| Other | 3,497 (10.6) | 1,518 (10.6) | 215 (9.9) | |
| Primary payer, n (%) | 0.001 | |||
| Private | 13,090 (39.8) | 5,855 (40.9) | 726 (33.3) | |
| Medicare | 13,015 (39.5) | 5,597 (39.1) | 987 (45.3) | |
| Medicaid | 2,204 (6.7) | 852 (5.9) | 242 (11.1) | |
| Charity, self‐pay, or other | 4,613 (14.0) | 2,008 (14.0) | 225 (10.3) | |
| High‐poverty neighborhood, n (%)* | 7,468 (22.7) | 3,208 (22.4) | 548 (25.1) | 0.001 |
| Utilization history | ||||
| 1 ED visits in past year, n (%) | 9,299 (28.2) | 3,793 (26.5) | 823 (37.8) | 0.001 |
| 1 hospitalizations in past year, n (%) | 10,189 (30.9) | 4,074 (28.5) | 1,012 (46.4) | 0.001 |
| Clinical factors from first day of hospitalization | ||||
| Nonelective admission, n (%) | 27,818 (84.5) | 11,960 (83.6) | 1,960 (89.9) | 0.001 |
| Charlson Comorbidity Index, median (IQR)∥ | 0 (01) | 0 (00) | 0 (03) | 0.001 |
| Laboratory abnormalities within 24 hours of admission | ||||
| Albumin 2 g/dL | 355 (1.1) | 119 (0.8) | 46 (2.1) | 0.001 |
| Albumin 23 g/dL | 4,732 (14.4) | 1,956 (13.7) | 458 (21.0) | 0.001 |
| Aspartate aminotransferase >40 U/L | 4,610 (14.0) | 1,922 (13.4) | 383 (17.6) | 0.001 |
| Creatine phosphokinase 60 g/L | 3,728 (11.3) | 1,536 (10.7) | 330 (15.1) | 0.001 |
| Mean corpuscular volume >100 fL/red cell | 1,346 (4.1) | 537 (3.8) | 134 (6.2) | 0.001 |
| Platelets 90 103/L | 912 (2.8) | 357 (2.5) | 116 (5.3) | 0.001 |
| Platelets >350 103/L | 3,332 (10.1) | 1,433 (10.0) | 283 (13.0) | 0.001 |
| Prothrombin time >35 seconds | 248 (0.8) | 90 (0.6) | 35 (1.6) | 0.001 |
| Clinical factors from remainder of hospital stay | ||||
| Length of stay, d, median (IQR) | 4 (26) | 4 (26) | 5 (38) | 0.001 |
| ICU transfer after first 24 hours, n (%) | 988 (3.0) | 408 (2.9) | 94 (4.3) | 0.001 |
| Hospital complications, n (%) | ||||
| Clostridium difficile infection | 119 (0.4) | 44 (0.3) | 24 (1.1) | 0.001 |
| Pressure ulcer | 358 (1.1) | 126 (0.9) | 46 (2.1) | 0.001 |
| Venous thromboembolism | 301 (0.9) | 112 (0.8) | 34 (1.6) | 0.001 |
| Respiratory failure | 1,048 (3.2) | 463 (3.2) | 112 (5.1) | 0.001 |
| Central line‐associated bloodstream infection | 22 (0.07) | 6 (0.04) | 5 (0.23) | 0.005 |
| Catheter‐associated urinary tract infection | 47 (0.14) | 20 (0.14) | 6 (0.28) | 0.15 |
| Acute myocardial infarction | 293 (0.9) | 110 (0.8) | 32 (1.5) | 0.001 |
| Pneumonia | 1,754 (5.3) | 719 (5.0) | 154 (7.1) | 0.001 |
| Sepsis | 853 (2.6) | 368 (2.6) | 73 (3.4) | 0.04 |
| Blood transfusion during hospitalization, n (%) | 4,511 (13.7) | 1,837 (12.8) | 425 (19.5) | 0.001 |
| Laboratory abnormalities at discharge# | ||||
| Blood urea nitrogen >20 mg/dL, n (%) | 10,014 (30.4) | 4,077 (28.5) | 929 (42.6) | 0.001 |
| Sodium 135 mEq/L, n (%) | 4,583 (13.9) | 1,850 (12.9) | 440 (20.2) | 0.001 |
| Hematocrit 27 | 3,104 (9.4) | 1,231 (8.6) | 287 (13.2) | 0.001 |
| 1 vital sign instability at discharge, n (%)# | 6,192 (18.8) | 2,624 (18.3) | 525 (24.1) | 0.001 |
| Discharge location, n (%) | 0.001 | |||
| Home | 23,339 (70.9) | 10,282 (71.8) | 1,383 (63.4) | |
| Home health | 3,185 (9.7) | 1,356 (9.5) | 234 (10.7) | |
| Postacute care** | 5,990 (18.2) | 2,496 (17.4) | 549 (25.2) | |
| Hospice | 408 (1.2) | 178 (1.2) | 14 (0.6) | |
Derivation and Validation of the Full‐Stay EHR Model for 30‐Day Readmission
Our final model included 24 independent variables, including demographic characteristics, utilization history, clinical factors from the first day of admission, and clinical factors from the remainder of the hospital stay (Table 2). The strongest independent predictor of readmission was hospital‐acquired Clostridium difficile infection (adjusted odds ratio [AOR]: 2.03, 95% confidence interval [CI] 1.18‐3.48); other hospital‐acquired complications including pressure ulcers and venous thromboembolism were also significant predictors. Though having Medicaid was associated with increased odds of readmission (AOR: 1.55, 95% CI: 1.31‐1.83), other zip codelevel measures of socioeconomic disadvantage were not predictive and were not included in the final model. Being discharged to hospice was associated with markedly lower odds of readmission (AOR: 0.23, 95% CI: 0.13‐0.40).
| Odds Ratio (95% CI) | ||
|---|---|---|
| Univariate | Multivariate* | |
| ||
| Demographic characteristics | ||
| Age, per 10 years | 1.08 (1.051.11) | 1.07 (1.041.10) |
| Medicaid | 1.97 (1.702.29) | 1.55 (1.311.83) |
| Widow | 1.44 (1.281.63) | 1.27 (1.111.45) |
| Utilization history | ||
| Prior ED visit, per visit | 1.08 (1.061.10) | 1.04 (1.021.06) |
| Prior hospitalization, per hospitalization | 1.30 (1.271.34) | 1.16 (1.121.20) |
| Hospital and clinical factors from first day of hospitalization | ||
| Nonelective admission | 1.75 (1.512.03) | 1.42 (1.221.65) |
| Charlson Comorbidity Index, per point | 1.19 (1.171.21) | 1.06 (1.041.09) |
| Laboratory abnormalities within 24 hours of admission | ||
| Albumin 2 g/dL | 2.57 (1.823.62) | 1.52 (1.052.21) |
| Albumin 23 g/dL | 1.68 (1.501.88) | 1.20 (1.061.36) |
| Aspartate aminotransferase >40 U/L | 1.37 (1.221.55) | 1.21 (1.061.38) |
| Creatine phosphokinase 60 g/L | 1.48 (1.301.69) | 1.28 (1.111.46) |
| Mean corpuscular volume >100 fL/red cell | 1.68 (1.382.04) | 1.32 (1.071.62) |
| Platelets 90 103/L | 2.20 (1.772.72) | 1.56 (1.231.97) |
| Platelets >350 103/L | 1.34 (1.171.54) | 1.24 (1.081.44) |
| Prothrombin time >35 seconds | 2.58 (1.743.82) | 1.92 (1.272.90) |
| Hospital and clinical factors from remainder of hospital stay | ||
| Length of stay, per day | 1.08 (1.071.09) | 1.06 (1.041.07) |
| Hospital complications | ||
| Clostridium difficile infection | 3.61 (2.195.95) | 2.03 (1.183.48) |
| Pressure ulcer | 2.43 (1.733.41) | 1.64 (1.152.34) |
| Venous thromboembolism | 2.01 (1.362.96) | 1.55 (1.032.32) |
| Laboratory abnormalities at discharge | ||
| Blood urea nitrogen >20 mg/dL | 1.86 (1.702.04) | 1.37 (1.241.52) |
| Sodium 135 mEq/L | 1.70 (1.521.91) | 1.34 (1.181.51) |
| Hematocrit 27 | 1.61 (1.401.85) | 1.22 (1.051.41) |
| Vital sign instability at discharge, per instability | 1.29 (1.201.40) | 1.25 (1.151.36) |
| Discharged to hospice | 0.51 (0.300.89) | 0.23 (0.130.40) |
In our validation cohort, the full‐stay EHR model had fair discrimination, with a C statistic of 0.69 (95% CI: 0.68‐0.70) (Table 3). The full‐stay EHR model was well calibrated across all quintiles of risk, with slight overestimation of predicted risk in the lowest and highest quintiles (Figure 1a) (see Supporting Table 5 in the online version of this article). It also effectively stratified individuals across a broad range of predicted readmission risk from 4.1% in the lowest decile to 36.5% in the highest decile (Table 3).
| Model Name | C‐Statistic (95% CI) | IDI, % (95% CI) | NRI (95% CI) | Average Predicted Risk, % | |
|---|---|---|---|---|---|
| Lowest Decile | Highest Decile | ||||
| |||||
| Full‐stay EHR model | |||||
| Derivation cohort | 0.72 (0.70 to 0.73) | 4.1 | 36.5 | ||
| Validation cohort | 0.69 (0.68 to 0.70) | [Reference] | [Reference] | 4.1 | 36.5 |
| First‐day EHR model | 0.67 (0.66 to 0.68) | 1.2 (1.4 to 1.0) | 0.020 (0.038 to 0.002) | 5.8 | 31.9 |
| LACE model | 0.65 (0.64 to 0.66) | 2.6 (2.9 to 2.3) | 0.046 (0.067 to 0.024) | 6.1 | 27.5 |
| HOSPITAL model | 0.64 (0.62 to 0.65) | 3.2 (3.5 to 2.9) | 0.058 (0.080 to 0.035) | 6.7 | 26.6 |
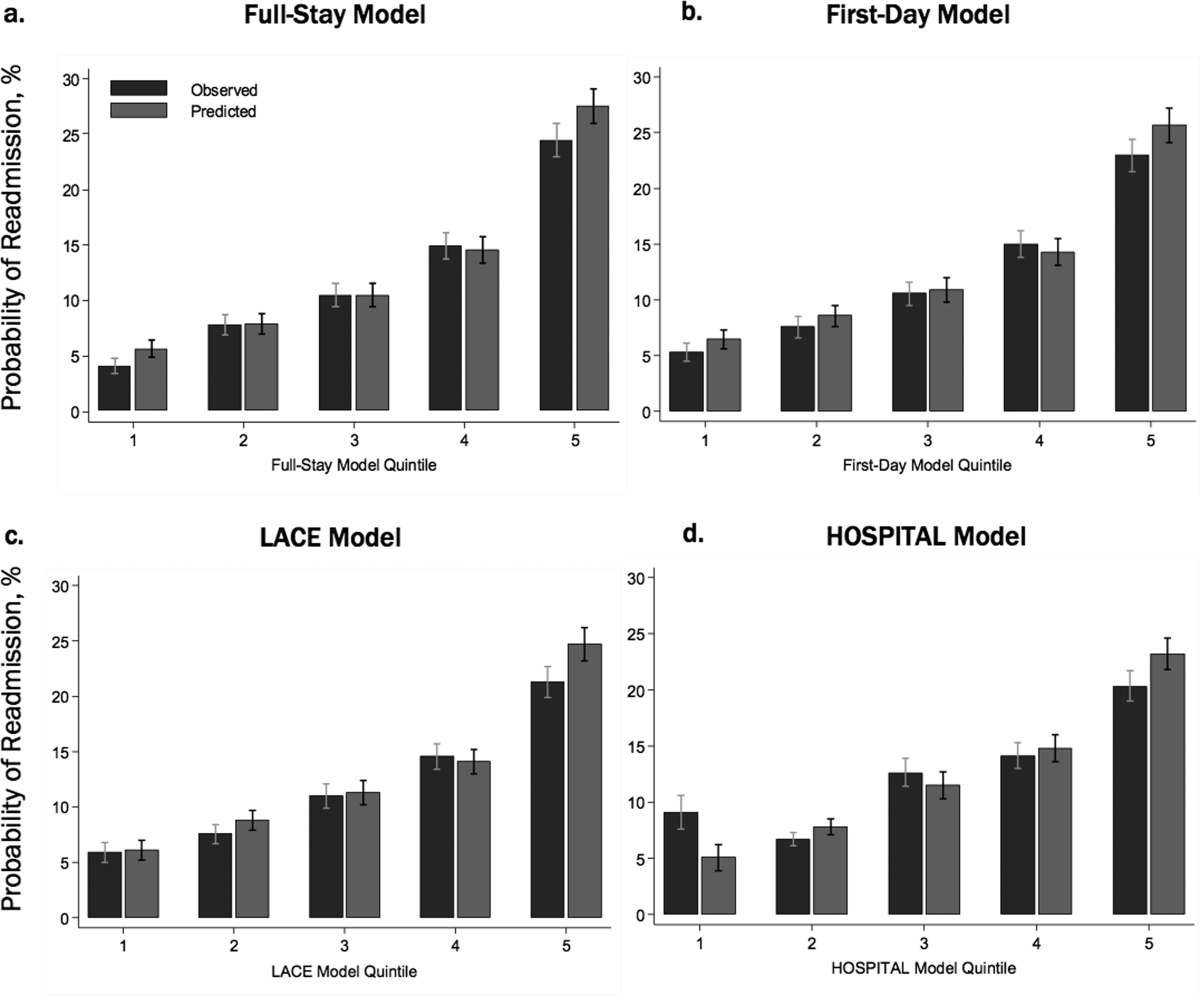
Comparing the Performance of the Full‐Stay EHR Model to Other Models
The full‐stay EHR model had better discrimination compared to the first‐day EHR model and the LACE and HOSPITAL models, though the magnitude of improvement was modest (Table 3). The full‐stay EHR model also stratified individuals across a broader range of readmission risk, and was better able to discriminate and classify those in the highest quintile of risk from those in the lowest 4 quintiles of risk compared to other models as assessed by the IDI and NRI (Table 3) (see Supporting Tables 14 and Supporting Figure 2 in the online version of this article). In terms of model calibration, both the first‐day EHR and LACE models were also well calibrated, whereas the HOSPITAL model was less robust (Figure 1).
The diagnostic accuracy of the full‐stay EHR model in correctly predicting those in the highest quintile of risk was better than that of the first‐day, LACE, and HOSPITAL models, though overall improvements in the sensitivity, specificity, positive and negative predictive values, and positive and negative likelihood ratios were also modest (see Supporting Table 6 in the online version of this article).
DISCUSSION
In this study, we used clinically detailed EHR data from the entire hospitalization on 32,922 individuals treated in 6 diverse hospitals to develop an all‐payer, multicondition readmission risk‐prediction model. To our knowledge, this is the first 30‐day hospital readmission risk‐prediction model to use a comprehensive set of factors from EHR data from the entire hospital stay. Prior EHR‐based models have focused exclusively on data available on or prior to the first day of admission, which account for clinical severity on admission but do not account for factors uncovered during the inpatient stay that influence the chance of a postdischarge adverse outcome.[15, 30] We specifically assessed the prognostic impact of a comprehensive set of factors from the entire index hospitalization, including hospital‐acquired complications, clinical trajectory, and stability on discharge in predicting hospital readmissions. Our full‐stay EHR model had statistically better discrimination, calibration, and diagnostic accuracy than our existing all‐cause first‐day EHR model[15] and 2 previously published readmissions models that included more limited information from hospitalization (such as length of stay).[9, 10] However, although the more complicated full‐stay EHR model was statistically better than previously published models, we were surprised that the predictive performance was only modestly improved despite the inclusion of many additional clinically relevant prognostic factors.
Taken together, our study has several important implications. First, the added complexity and resource intensity of implementing a full‐stay EHR model yields only modestly improved readmission risk prediction. Thus, hospitals and healthcare systems interested in targeting their highest‐risk individuals for interventions to reduce 30‐day readmission should consider doing so within the first day of hospital admission. Our group's previously derived and validated first‐day EHR model, which used data only from the first day of admission, qualitatively performed nearly as well as the full‐stay EHR model.[15] Additionally, a recent study using only preadmission EHR data to predict 30‐day readmissions also achieved similar discrimination and diagnostic accuracy as our full‐stay model.[30]
Second, the field of readmissions risk‐prediction modeling may be reaching the maximum achievable model performance using data that are currently available in the EHR. Our limited ability to accurately predict all‐cause 30‐day readmission risk may reflect the influence of currently unmeasured patient, system, and community factors on readmissions.[31, 32, 33] Due to the constraints of data collected in the EHR, we were unable to include several patient‐level clinical characteristics associated with hospital readmission, including self‐perceived health status, functional impairment, and cognition.[33, 34, 35, 36] However, given their modest effect sizes (ORs ranging from 1.062.10), adequately measuring and including these risk factors in our model may not meaningfully improve model performance and diagnostic accuracy. Further, many social and behavioral patient‐level factors are also not consistently available in EHR data. Though we explored the role of several neighborhood‐level socioeconomic measuresincluding prevalence of poverty, median income, education, and unemploymentwe found that none were significantly associated with 30‐day readmissions. These particular measures may have been inadequate to characterize individual‐level social and behavioral factors, as several previous studies have demonstrated that patient‐level factors such as social support, substance abuse, and medication and visit adherence can influence readmission risk in heart failure and pneumonia.[11, 16, 22, 25] This underscores the need for more standardized routine collection of data across functional, social, and behavioral domains in clinical settings, as recently championed by the Institute of Medicine.[11, 37] Integrating data from outside the EHR on postdischarge health behaviors, self‐management, follow‐up care, recovery, and home environment may be another important but untapped strategy for further improving prediction of readmissions.[25, 38]
Third, a multicondition readmission risk‐prediction model may be a less effective strategy than more customized disease‐specific models for selected conditions associated with high 30‐day readmission rates. Our group's previously derived and internally validated models for heart failure and human immunodeficiency virus had superior discrimination compared to our full‐stay EHR model (C statistic of 0.72 for each).[11, 13] However, given differences in the included population and time periods studied, a head‐to‐head comparison of these different strategies is needed to assess differences in model performance and utility.
Our study had several strengths. To our knowledge, this is the first study to rigorously measure the additive influence of in‐hospital complications, clinical trajectory, and stability on discharge on the risk of 30‐day hospital readmission. Additionally, our study included a large, diverse study population that included all payers, all ages of adults, a mix of community, academic, and safety net hospitals, and individuals from a broad array of racial/ethnic and socioeconomic backgrounds.
Our results should be interpreted in light of several limitations. First, though we sought to represent a diverse group of hospitals, all study sites were located within north Texas and generalizability to other regions is uncertain. Second, our ascertainment of prior hospitalizations and readmissions was more inclusive than what could be typically accomplished in real time using only EHR data from a single clinical site. We performed a sensitivity analysis using only prior utilization data available within the EHR from the index hospital with no meaningful difference in our findings (data not shown). Additionally, a recent study found that 30‐day readmissions occur at the index hospital for over 75% of events, suggesting that 30‐day readmissions are fairly comprehensively captured even with only single‐site data.[39] Third, we were not able to include data on outpatient visits before or after the index hospitalization, which may influence the risk of readmission.[1, 40]
In conclusion, incorporating clinically granular EHR data from the entire course of hospitalization modestly improves prediction of 30‐day readmissions compared to models that only include information from the first 24 hours of hospital admission or models that use far fewer variables. However, given the limited improvement in prediction, our findings suggest that from the practical perspective of implementing real‐time models to identify those at highest risk for readmission, it may not be worth the added complexity of waiting until the end of a hospitalization to leverage additional data on hospital complications, and the trajectory of laboratory and vital sign values currently available in the EHR. Further improvement in prediction of readmissions will likely require accounting for psychosocial, functional, behavioral, and postdischarge factors not currently present in the inpatient EHR.
Disclosures: This study was presented at the Society of Hospital Medicine 2015 Annual Meeting in National Harbor, Maryland, and the Society of General Internal Medicine 2015 Annual Meeting in Toronto, Canada. This work was supported by the Agency for Healthcare Research and Qualityfunded UT Southwestern Center for Patient‐Centered Outcomes Research (1R24HS022418‐01) and the Commonwealth Foundation (#20100323). Drs. Nguyen and Makam received funding from the UT Southwestern KL2 Scholars Program (NIH/NCATS KL2 TR001103). Dr. Halm was also supported in part by NIH/NCATS U54 RFA‐TR‐12‐006. The study sponsors had no role in the design and conduct of the study; collection, management, analysis, and interpretation of the data; and preparation, review, or approval of the manuscript. The authors have no conflicts of interest to disclose.
- , , . Rehospitalizations among patients in the Medicare fee‐for‐service program. N Engl J Med. 2009;360(14):1418–1428.
- , , , , . Proportion of hospital readmissions deemed avoidable: a systematic review. CMAJ. 2011;183(7):E391–E402.
- , , , , , . Hospital‐initiated transitional care interventions as a patient safety strategy: a systematic review. Ann Intern Med. 2013;158(5 pt 2):433–440.
- , , , , . Interventions to reduce 30‐day rehospitalization: a systematic review. Ann Intern Med. 2011;155(8):520–528.
- , , , , , . Interventions to Improve Care Transitions at Hospital Discharge. Rockville, MD: Agency for Healthcare Research and Quality; 2013.
- , , , et al. Allocating scarce resources in real‐time to reduce heart failure readmissions: a prospective, controlled study. BMJ Qual Saf. 2013;22(12):998–1005.
- , , , , . Implementing electronic health care predictive analytics: considerations and challenges. Health Aff (Millwood). 2014;33(7):1148–1154.
- , , , et al. Risk prediction models for hospital readmission: a systematic review. JAMA. 2011;306(15):1688–1698.
- , , , et al. Derivation and validation of an index to predict early death or unplanned readmission after discharge from hospital to the community. CMAJ. 2010;182(6):551–557.
- , , , . Potentially avoidable 30‐day hospital readmissions in medical patients: derivation and validation of a prediction model. JAMA Intern Med. 2013;173(8):632–638.
- , , , et al. An automated model to identify heart failure patients at risk for 30‐day readmission or death using electronic medical record data. Med Care. 2010;48(11):981–988.
- , , , et al. An automated model using electronic medical record data identifies patients with cirrhosis at high risk for readmission. Clin Gastroenterol Hepatol. 2013;11(10):1335–1341.e1331.
- , , , , , . An electronic medical record‐based model to predict 30‐day risk of readmission and death among HIV‐infected inpatients. J Acquir Immune Defic Syndr. 2012;61(3):349–358.
- , , , et al. Development and use of an administrative claims measure for profiling hospital‐wide performance on 30‐day unplanned readmission. Ann Intern Med. 2014;161(10 suppl):S66–S75.
- , , , et al. Electronic medical record‐based multicondition models to predict the risk of 30 day readmission or death among adult medicine patients: validation and comparison to existing models. BMC Med Inform Decis Mak. 2015;15(1):39.
- , , , et al. Linking electronic health record‐extracted psychosocial data in real‐time to risk of readmission for heart failure. Psychosomatics. 2011;52(4):319–327.
- , . A conceptual framework for the study of early readmission as an indicator of quality of care. Soc Sci Med. 1996;43(11):1533–1541.
- , , , et al. Hospital readmission performance and patterns of readmission: retrospective cohort study of Medicare admissions. BMJ. 2013;347:f6571.
- , , , , , . Getting more performance from performance measurement. N Engl J Med. 2014;371(23):2145–2147.
- , , , et al. Hospital strategy uptake and reductions in unplanned readmission rates for patients with heart failure: a prospective study. J Gen Intern Med. 2015;30(5):605–611.
- . Post‐hospital syndrome—an acquired, transient condition of generalized risk. N Engl J Med. 2013;368(2):100–102.
- , , , et al. Impact of social factors on risk of readmission or mortality in pneumonia and heart failure: systematic review. J Gen Intern Med. 2013;28(2):269–282.
- , , , , , . Effect of clinical and social risk factors on hospital profiling for stroke readmission: a cohort study. Ann Intern Med. 2014;161(11):775–784.
- , , , et al. Neighborhood socioeconomic disadvantage and 30‐day rehospitalization: a retrospective cohort study. Ann Intern Med. 2014;161(11):765–774.
- , , , , , . Postdischarge environmental and socioeconomic factors and the likelihood of early hospital readmission among community‐dwelling Medicare beneficiaries. Gerontologist. 2008;48(4):495–504.
- , , . Socioeconomic status and readmissions: evidence from an urban teaching hospital. Health Aff (Millwood). 2014;33(5):778–785.
- , , , . Adding socioeconomic data to hospital readmissions calculations may produce more useful results. Health Aff (Millwood). 2014;33(5):786–791.
- , , , . Evaluating the added predictive ability of a new marker: from area under the ROC curve to reclassification and beyond. Stat Med. 2008;27(2):157–172; discussion 207–212.
- , , , , . Net reclassification improvement: computation, interpretation, and controversies: a literature review and clinician's guide. Ann Intern Med. 2014;160(2):122–131.
- , , , , , . Predicting 30‐day readmissions with preadmission electronic health record data. Med Care. 2015;53(3):283–289.
- , . Hospital readmissions—not just a measure of quality. JAMA. 2011;306(16):1796–1797.
- , . Thirty‐day readmissions—truth and consequences. N Engl J Med. 2012;366(15):1366–1369.
- , , , . Functional impairment and hospital readmission in medicare seniors. JAMA Intern Med. 2015;175(4):559–565.
- , , . Clinical and sociodemographic risk factors for readmission of Medicare beneficiaries. Health Care Financ Rev. 1988;10(1):27–36.
- , , , , , . Mini‐cog performance: novel marker of post discharge risk among patients hospitalized for heart failure. Circ Heart Fail. 2015;8(1):8–16.
- , , , , , . Association of impaired functional status at hospital discharge and subsequent rehospitalization. J Hosp Med. 2014;9(5):277–282.
- , . Patients in context—EHR capture of social and behavioral determinants of health. N Engl J Med. 2015;372(8):698–701.
- , , , , . Envisioning a social‐health information exchange as a platform to support a patient‐centered medical neighborhood: a feasibility study. J Gen Intern Med. 2015;30(1):60–67.
- , , , , , . Patient factors contributing to variation in same‐hospital readmission rate. Med Care Res Review. 2015;72(3):338–358.
- , , . Does increased access to primary care reduce hospital readmissions? Veterans Affairs Cooperative Study Group on Primary Care and Hospital Readmission. N Engl J Med. 1996;334(22):1441–1447.
Unplanned hospital readmissions are frequent, costly, and potentially avoidable.[1, 2] Due to major federal financial readmissions penalties targeting excessive 30‐day readmissions, there is increasing attention to implementing hospital‐initiated interventions to reduce readmissions.[3, 4] However, universal enrollment of all hospitalized patients into such programs may be too resource intensive for many hospitals.[5] To optimize efficiency and effectiveness, interventions should be targeted to individuals most likely to benefit.[6, 7] However, existing readmission risk‐prediction models have achieved only modest discrimination, have largely used administrative claims data not available until months after discharge, or are limited to only a subset of patients with Medicare or a specific clinical condition.[8, 9, 10, 11, 12, 13, 14] These limitations have precluded accurate identification of high‐risk individuals in an all‐payer general medical inpatient population to provide actionable information for intervention prior to discharge.
Approaches using electronic health record (EHR) data could allow early identification of high‐risk patients during the index hospitalization to enable initiation of interventions prior to discharge. To date, such strategies have relied largely on EHR data from the day of admission.[15, 16] However, given that variation in 30‐day readmission rates are thought to reflect the quality of in‐hospital care, incorporating EHR data from the entire hospital stay to reflect hospital care processes and clinical trajectory may more accurately identify at‐risk patients.[17, 18, 19, 20] Improved accuracy in risk prediction would help better target intervention efforts in the immediate postdischarge period, an interval characterized by heightened vulnerability for adverse events.[21]
To help hospitals target transitional care interventions more effectively to high‐risk individuals prior to discharge, we derived and validated a readmissions risk‐prediction model incorporating EHR data from the entire course of the index hospitalization, which we termed the full‐stay EHR model. We also compared the full‐stay EHR model performance to our group's previously derived prediction model based on EHR data on the day of admission, termed the first‐day EHR model, as well as to 2 other validated readmission models similarly intended to yield near real‐time risk predictions prior to or shortly after hospital discharge.[9, 10, 15]
METHODS
Study Design, Population, and Data Sources
We conducted an observational cohort study using EHR data from 6 hospitals in the DallasFort Worth metroplex between November 1, 2009 and October 30, 2010 using the same EHR system (Epic Systems Corp., Verona, WI). One site was a university‐affiliated safety net hospital; the remaining 5 sites were teaching and nonteaching community sites.
We included consecutive hospitalizations among adults 18 years old discharged alive from any medicine inpatient service. For individuals with multiple hospitalizations during the study period, we included only the first hospitalization. We excluded individuals who died during the index hospitalization, were transferred to another acute care facility, left against medical advice, or who died outside of the hospital within 30 days of discharge. For model derivation, we randomly split the sample into separate derivation (50%) and validation cohorts (50%).
Outcomes
The primary outcome was 30‐day hospital readmission, defined as a nonelective hospitalization within 30 days of discharge to any of 75 acute care hospitals within a 100‐mile radius of Dallas, ascertained from an all‐payer regional hospitalization database. Nonelective hospitalizations included all hospitalizations classified as a emergency, urgent, or trauma, and excluded those classified as elective as per the Centers for Medicare and Medicaid Services Claim Inpatient Admission Type Code definitions.
Predictor Variables for the Full‐Stay EHR Model
The full‐stay EHR model was iteratively developed from our group's previously derived and validated risk‐prediction model using EHR data available on admission (first‐day EHR model).[15] For the full‐stay EHR model, we included all predictor variables included in our published first‐day EHR model as candidate risk factors. Based on prior literature, we additionally expanded candidate predictors available on admission to include marital status (proxy for social isolation) and socioeconomic disadvantage (percent poverty, unemployment, median income, and educational attainment by zip code of residence as proxy measures of the social and built environment).[22, 23, 24, 25, 26, 27] We also expanded the ascertainment of prior hospitalization to include admissions at both the index hospital and any of 75 acute care hospitals from the same, separate all‐payer regional hospitalization database used to ascertain 30‐day readmissions.
Candidate predictors from the remainder of the hospital stay (ie, following the first 24 hours of admission) were included if they were: (1) available in the EHR of all participating hospitals, (2) routinely collected or available at the time of hospital discharge, and (3) plausible predictors of adverse outcomes based on prior literature and clinical expertise. These included length of stay, in‐hospital complications, transfer to an intensive or coronary care unit, blood transfusions, vital sign instabilities within 24 hours of discharge, select laboratory values at time of discharge, and disposition status. We also assessed trajectories of vital signs and selected laboratory values (defined as changes in these measures from admission to discharge).
Statistical Analysis
Model Derivation
Univariate relationships between readmission and each of the candidate predictors were assessed in the derivation cohort using a prespecified significance threshold of P 0.05. We included all factors from our previously derived and validated first‐day EHR model as candidate predictors.[15] Continuous laboratory and vital sign values at the time of discharge were categorized based on clinically meaningful cutoffs; predictors with missing values were assumed to be normal (1% missing for each variable). Significant univariate candidate variables were entered in a multivariate logistic regression model using stepwise backward selection with a prespecified significance threshold of P 0.05. We performed several sensitivity analyses to confirm the robustness of our model. First, we alternately derived the full‐stay model using stepwise forward selection. Second, we forced in all significant variables from our first‐day EHR model, and entered the candidate variables from the remainder of the hospital stay using both stepwise backward and forward selection separately. Third, prespecified interactions between variables were evaluated for inclusion. Though final predictors varied slightly between the different approaches, discrimination of each model was similar to the model derived using our primary analytic approach (C statistics 0.01, data not shown).
Model Validation
We assessed model discrimination and calibration of the derived full‐stay EHR model using the validation cohort. Model discrimination was estimated by the C statistic. The C statistic represents the probability that, given 2 hospitalized individuals (1 who was readmitted and the other who was not), the model will predict a higher risk for the readmitted patient than for the nonreadmitted patient. Model calibration was assessed by comparing predicted to observed probabilities of readmission by quintiles of risk, and with the Hosmer‐Lemeshow goodness‐of‐fit test.
Comparison to Existing Models
We compared the full‐stay EHR model performance to 3 previously published models: our group's first‐day EHR model, and the LACE (includes Length of stay, Acute (nonelective) admission status, Charlson Comorbidity Index, and Emergency department visits in the past year) and HOSPITAL (includes Hemoglobin at discharge, discharge from Oncology service, Sodium level at discharge, Procedure during index hospitalization, Index hospitalization Type (nonelective), number of Admissions in the past year, and Length of stay) models, which were both derived to predict 30‐day readmissions among general medical inpatients and were intended to help clinicians identify high‐risk patients to target for discharge interventions.[9, 10, 15] We assessed each model's performance in our validation cohort, calculating the C statistic, integrated discrimination index (IDI), and net reclassification index (NRI) compared to the full‐stay model. IDI is a summary measure of both discrimination and reclassification, where more positive values suggest improvement in model performance in both these domains compared to a reference model.[28] The NRI is defined as the sum of the net proportions of correctly reclassified persons with and without the event of interest.[29] The theoretical range of values is 2 to 2, with more positive values indicating improved net reclassification compared to a reference model. Here, we calculated a category‐based NRI to evaluate the performance of models in correctly classifying individuals with and without readmissions into the highest readmission risk quintile versus the lowest 4 risk quintiles compared to the full‐stay EHR model.[29] This prespecified cutoff is relevant for hospitals interested in identifying the highest‐risk individuals for targeted intervention.[6] Because some hospitals may be able to target a greater number of individuals for intervention, we performed a sensitivity analysis by assessing category‐based NRI for reclassification into the top 2 risk quintiles versus the lowest 3 risk quintiles and found no meaningful difference in our results (data not shown). Finally, we qualitatively assessed calibration of comparator models in our validation cohort by comparing predicted probability to observed probability of readmission by quintiles of risk for each model. We conducted all analyses using Stata 12.1 (StataCorp, College Station, TX). This study was approved by the UT Southwestern Medical Center institutional review board.
RESULTS
Overall, 32,922 index hospitalizations were included in our study cohort; 12.7% resulted in a 30‐day readmission (see Supporting Figure 1 in the online version of this article). Individuals had a mean age of 62 years and had diverse race/ethnicity and primary insurance status; half were female (Table 1). The study sample was randomly split into a derivation cohort (50%, n = 16,492) and validation cohort (50%, n = 16,430). Individuals in the derivation cohort with a 30‐day readmission had markedly different socioeconomic and clinical characteristics compared to those not readmitted (Table 1).
| Entire Cohort, N = 32,922 | Derivation Cohort, N = 16,492 | |||
|---|---|---|---|---|
|
No Readmission, N = 14,312 |
Readmission, N = 2,180 |
P Value | ||
| ||||
| Demographic characteristics | ||||
| Age, y, mean (SD) | 62 (17.3) | 61 (17.4) | 64 (17.0) | 0.001 |
| Female, n (%) | 17,715 (53.8) | 7,694 (53.8) | 1,163 (53.3) | 0.72 |
| Race/ethnicity | 0.001 | |||
| White | 21,359 (64.9) | 9,329 (65.2) | 1,361 (62.4) | |
| Black | 5,964 (18.1) | 2,520 (17.6) | 434 (19.9) | |
| Hispanic | 4,452 (13.5) | 1,931 (13.5) | 338 (15.5) | |
| Other | 1,147 (3.5) | 532 (3.7) | 47 (2.2) | |
| Marital status, n (%) | 0.001 | |||
| Single | 8,076 (24.5) | 3,516 (24.6) | 514 (23.6) | |
| Married | 13,394 (40.7) | 5,950 (41.6) | 812 (37.3) | |
| Separated/divorced | 3,468 (10.5) | 1,460 (10.2) | 251 (11.5) | |
| Widowed | 4,487 (13.7) | 1,868 (13.1) | 388 (17.8) | |
| Other | 3,497 (10.6) | 1,518 (10.6) | 215 (9.9) | |
| Primary payer, n (%) | 0.001 | |||
| Private | 13,090 (39.8) | 5,855 (40.9) | 726 (33.3) | |
| Medicare | 13,015 (39.5) | 5,597 (39.1) | 987 (45.3) | |
| Medicaid | 2,204 (6.7) | 852 (5.9) | 242 (11.1) | |
| Charity, self‐pay, or other | 4,613 (14.0) | 2,008 (14.0) | 225 (10.3) | |
| High‐poverty neighborhood, n (%)* | 7,468 (22.7) | 3,208 (22.4) | 548 (25.1) | 0.001 |
| Utilization history | ||||
| 1 ED visits in past year, n (%) | 9,299 (28.2) | 3,793 (26.5) | 823 (37.8) | 0.001 |
| 1 hospitalizations in past year, n (%) | 10,189 (30.9) | 4,074 (28.5) | 1,012 (46.4) | 0.001 |
| Clinical factors from first day of hospitalization | ||||
| Nonelective admission, n (%) | 27,818 (84.5) | 11,960 (83.6) | 1,960 (89.9) | 0.001 |
| Charlson Comorbidity Index, median (IQR)∥ | 0 (01) | 0 (00) | 0 (03) | 0.001 |
| Laboratory abnormalities within 24 hours of admission | ||||
| Albumin 2 g/dL | 355 (1.1) | 119 (0.8) | 46 (2.1) | 0.001 |
| Albumin 23 g/dL | 4,732 (14.4) | 1,956 (13.7) | 458 (21.0) | 0.001 |
| Aspartate aminotransferase >40 U/L | 4,610 (14.0) | 1,922 (13.4) | 383 (17.6) | 0.001 |
| Creatine phosphokinase 60 g/L | 3,728 (11.3) | 1,536 (10.7) | 330 (15.1) | 0.001 |
| Mean corpuscular volume >100 fL/red cell | 1,346 (4.1) | 537 (3.8) | 134 (6.2) | 0.001 |
| Platelets 90 103/L | 912 (2.8) | 357 (2.5) | 116 (5.3) | 0.001 |
| Platelets >350 103/L | 3,332 (10.1) | 1,433 (10.0) | 283 (13.0) | 0.001 |
| Prothrombin time >35 seconds | 248 (0.8) | 90 (0.6) | 35 (1.6) | 0.001 |
| Clinical factors from remainder of hospital stay | ||||
| Length of stay, d, median (IQR) | 4 (26) | 4 (26) | 5 (38) | 0.001 |
| ICU transfer after first 24 hours, n (%) | 988 (3.0) | 408 (2.9) | 94 (4.3) | 0.001 |
| Hospital complications, n (%) | ||||
| Clostridium difficile infection | 119 (0.4) | 44 (0.3) | 24 (1.1) | 0.001 |
| Pressure ulcer | 358 (1.1) | 126 (0.9) | 46 (2.1) | 0.001 |
| Venous thromboembolism | 301 (0.9) | 112 (0.8) | 34 (1.6) | 0.001 |
| Respiratory failure | 1,048 (3.2) | 463 (3.2) | 112 (5.1) | 0.001 |
| Central line‐associated bloodstream infection | 22 (0.07) | 6 (0.04) | 5 (0.23) | 0.005 |
| Catheter‐associated urinary tract infection | 47 (0.14) | 20 (0.14) | 6 (0.28) | 0.15 |
| Acute myocardial infarction | 293 (0.9) | 110 (0.8) | 32 (1.5) | 0.001 |
| Pneumonia | 1,754 (5.3) | 719 (5.0) | 154 (7.1) | 0.001 |
| Sepsis | 853 (2.6) | 368 (2.6) | 73 (3.4) | 0.04 |
| Blood transfusion during hospitalization, n (%) | 4,511 (13.7) | 1,837 (12.8) | 425 (19.5) | 0.001 |
| Laboratory abnormalities at discharge# | ||||
| Blood urea nitrogen >20 mg/dL, n (%) | 10,014 (30.4) | 4,077 (28.5) | 929 (42.6) | 0.001 |
| Sodium 135 mEq/L, n (%) | 4,583 (13.9) | 1,850 (12.9) | 440 (20.2) | 0.001 |
| Hematocrit 27 | 3,104 (9.4) | 1,231 (8.6) | 287 (13.2) | 0.001 |
| 1 vital sign instability at discharge, n (%)# | 6,192 (18.8) | 2,624 (18.3) | 525 (24.1) | 0.001 |
| Discharge location, n (%) | 0.001 | |||
| Home | 23,339 (70.9) | 10,282 (71.8) | 1,383 (63.4) | |
| Home health | 3,185 (9.7) | 1,356 (9.5) | 234 (10.7) | |
| Postacute care** | 5,990 (18.2) | 2,496 (17.4) | 549 (25.2) | |
| Hospice | 408 (1.2) | 178 (1.2) | 14 (0.6) | |
Derivation and Validation of the Full‐Stay EHR Model for 30‐Day Readmission
Our final model included 24 independent variables, including demographic characteristics, utilization history, clinical factors from the first day of admission, and clinical factors from the remainder of the hospital stay (Table 2). The strongest independent predictor of readmission was hospital‐acquired Clostridium difficile infection (adjusted odds ratio [AOR]: 2.03, 95% confidence interval [CI] 1.18‐3.48); other hospital‐acquired complications including pressure ulcers and venous thromboembolism were also significant predictors. Though having Medicaid was associated with increased odds of readmission (AOR: 1.55, 95% CI: 1.31‐1.83), other zip codelevel measures of socioeconomic disadvantage were not predictive and were not included in the final model. Being discharged to hospice was associated with markedly lower odds of readmission (AOR: 0.23, 95% CI: 0.13‐0.40).
| Odds Ratio (95% CI) | ||
|---|---|---|
| Univariate | Multivariate* | |
| ||
| Demographic characteristics | ||
| Age, per 10 years | 1.08 (1.051.11) | 1.07 (1.041.10) |
| Medicaid | 1.97 (1.702.29) | 1.55 (1.311.83) |
| Widow | 1.44 (1.281.63) | 1.27 (1.111.45) |
| Utilization history | ||
| Prior ED visit, per visit | 1.08 (1.061.10) | 1.04 (1.021.06) |
| Prior hospitalization, per hospitalization | 1.30 (1.271.34) | 1.16 (1.121.20) |
| Hospital and clinical factors from first day of hospitalization | ||
| Nonelective admission | 1.75 (1.512.03) | 1.42 (1.221.65) |
| Charlson Comorbidity Index, per point | 1.19 (1.171.21) | 1.06 (1.041.09) |
| Laboratory abnormalities within 24 hours of admission | ||
| Albumin 2 g/dL | 2.57 (1.823.62) | 1.52 (1.052.21) |
| Albumin 23 g/dL | 1.68 (1.501.88) | 1.20 (1.061.36) |
| Aspartate aminotransferase >40 U/L | 1.37 (1.221.55) | 1.21 (1.061.38) |
| Creatine phosphokinase 60 g/L | 1.48 (1.301.69) | 1.28 (1.111.46) |
| Mean corpuscular volume >100 fL/red cell | 1.68 (1.382.04) | 1.32 (1.071.62) |
| Platelets 90 103/L | 2.20 (1.772.72) | 1.56 (1.231.97) |
| Platelets >350 103/L | 1.34 (1.171.54) | 1.24 (1.081.44) |
| Prothrombin time >35 seconds | 2.58 (1.743.82) | 1.92 (1.272.90) |
| Hospital and clinical factors from remainder of hospital stay | ||
| Length of stay, per day | 1.08 (1.071.09) | 1.06 (1.041.07) |
| Hospital complications | ||
| Clostridium difficile infection | 3.61 (2.195.95) | 2.03 (1.183.48) |
| Pressure ulcer | 2.43 (1.733.41) | 1.64 (1.152.34) |
| Venous thromboembolism | 2.01 (1.362.96) | 1.55 (1.032.32) |
| Laboratory abnormalities at discharge | ||
| Blood urea nitrogen >20 mg/dL | 1.86 (1.702.04) | 1.37 (1.241.52) |
| Sodium 135 mEq/L | 1.70 (1.521.91) | 1.34 (1.181.51) |
| Hematocrit 27 | 1.61 (1.401.85) | 1.22 (1.051.41) |
| Vital sign instability at discharge, per instability | 1.29 (1.201.40) | 1.25 (1.151.36) |
| Discharged to hospice | 0.51 (0.300.89) | 0.23 (0.130.40) |
In our validation cohort, the full‐stay EHR model had fair discrimination, with a C statistic of 0.69 (95% CI: 0.68‐0.70) (Table 3). The full‐stay EHR model was well calibrated across all quintiles of risk, with slight overestimation of predicted risk in the lowest and highest quintiles (Figure 1a) (see Supporting Table 5 in the online version of this article). It also effectively stratified individuals across a broad range of predicted readmission risk from 4.1% in the lowest decile to 36.5% in the highest decile (Table 3).
| Model Name | C‐Statistic (95% CI) | IDI, % (95% CI) | NRI (95% CI) | Average Predicted Risk, % | |
|---|---|---|---|---|---|
| Lowest Decile | Highest Decile | ||||
| |||||
| Full‐stay EHR model | |||||
| Derivation cohort | 0.72 (0.70 to 0.73) | 4.1 | 36.5 | ||
| Validation cohort | 0.69 (0.68 to 0.70) | [Reference] | [Reference] | 4.1 | 36.5 |
| First‐day EHR model | 0.67 (0.66 to 0.68) | 1.2 (1.4 to 1.0) | 0.020 (0.038 to 0.002) | 5.8 | 31.9 |
| LACE model | 0.65 (0.64 to 0.66) | 2.6 (2.9 to 2.3) | 0.046 (0.067 to 0.024) | 6.1 | 27.5 |
| HOSPITAL model | 0.64 (0.62 to 0.65) | 3.2 (3.5 to 2.9) | 0.058 (0.080 to 0.035) | 6.7 | 26.6 |
Comparing the Performance of the Full‐Stay EHR Model to Other Models
The full‐stay EHR model had better discrimination compared to the first‐day EHR model and the LACE and HOSPITAL models, though the magnitude of improvement was modest (Table 3). The full‐stay EHR model also stratified individuals across a broader range of readmission risk, and was better able to discriminate and classify those in the highest quintile of risk from those in the lowest 4 quintiles of risk compared to other models as assessed by the IDI and NRI (Table 3) (see Supporting Tables 14 and Supporting Figure 2 in the online version of this article). In terms of model calibration, both the first‐day EHR and LACE models were also well calibrated, whereas the HOSPITAL model was less robust (Figure 1).
The diagnostic accuracy of the full‐stay EHR model in correctly predicting those in the highest quintile of risk was better than that of the first‐day, LACE, and HOSPITAL models, though overall improvements in the sensitivity, specificity, positive and negative predictive values, and positive and negative likelihood ratios were also modest (see Supporting Table 6 in the online version of this article).
DISCUSSION
In this study, we used clinically detailed EHR data from the entire hospitalization on 32,922 individuals treated in 6 diverse hospitals to develop an all‐payer, multicondition readmission risk‐prediction model. To our knowledge, this is the first 30‐day hospital readmission risk‐prediction model to use a comprehensive set of factors from EHR data from the entire hospital stay. Prior EHR‐based models have focused exclusively on data available on or prior to the first day of admission, which account for clinical severity on admission but do not account for factors uncovered during the inpatient stay that influence the chance of a postdischarge adverse outcome.[15, 30] We specifically assessed the prognostic impact of a comprehensive set of factors from the entire index hospitalization, including hospital‐acquired complications, clinical trajectory, and stability on discharge in predicting hospital readmissions. Our full‐stay EHR model had statistically better discrimination, calibration, and diagnostic accuracy than our existing all‐cause first‐day EHR model[15] and 2 previously published readmissions models that included more limited information from hospitalization (such as length of stay).[9, 10] However, although the more complicated full‐stay EHR model was statistically better than previously published models, we were surprised that the predictive performance was only modestly improved despite the inclusion of many additional clinically relevant prognostic factors.
Taken together, our study has several important implications. First, the added complexity and resource intensity of implementing a full‐stay EHR model yields only modestly improved readmission risk prediction. Thus, hospitals and healthcare systems interested in targeting their highest‐risk individuals for interventions to reduce 30‐day readmission should consider doing so within the first day of hospital admission. Our group's previously derived and validated first‐day EHR model, which used data only from the first day of admission, qualitatively performed nearly as well as the full‐stay EHR model.[15] Additionally, a recent study using only preadmission EHR data to predict 30‐day readmissions also achieved similar discrimination and diagnostic accuracy as our full‐stay model.[30]
Second, the field of readmissions risk‐prediction modeling may be reaching the maximum achievable model performance using data that are currently available in the EHR. Our limited ability to accurately predict all‐cause 30‐day readmission risk may reflect the influence of currently unmeasured patient, system, and community factors on readmissions.[31, 32, 33] Due to the constraints of data collected in the EHR, we were unable to include several patient‐level clinical characteristics associated with hospital readmission, including self‐perceived health status, functional impairment, and cognition.[33, 34, 35, 36] However, given their modest effect sizes (ORs ranging from 1.062.10), adequately measuring and including these risk factors in our model may not meaningfully improve model performance and diagnostic accuracy. Further, many social and behavioral patient‐level factors are also not consistently available in EHR data. Though we explored the role of several neighborhood‐level socioeconomic measuresincluding prevalence of poverty, median income, education, and unemploymentwe found that none were significantly associated with 30‐day readmissions. These particular measures may have been inadequate to characterize individual‐level social and behavioral factors, as several previous studies have demonstrated that patient‐level factors such as social support, substance abuse, and medication and visit adherence can influence readmission risk in heart failure and pneumonia.[11, 16, 22, 25] This underscores the need for more standardized routine collection of data across functional, social, and behavioral domains in clinical settings, as recently championed by the Institute of Medicine.[11, 37] Integrating data from outside the EHR on postdischarge health behaviors, self‐management, follow‐up care, recovery, and home environment may be another important but untapped strategy for further improving prediction of readmissions.[25, 38]
Third, a multicondition readmission risk‐prediction model may be a less effective strategy than more customized disease‐specific models for selected conditions associated with high 30‐day readmission rates. Our group's previously derived and internally validated models for heart failure and human immunodeficiency virus had superior discrimination compared to our full‐stay EHR model (C statistic of 0.72 for each).[11, 13] However, given differences in the included population and time periods studied, a head‐to‐head comparison of these different strategies is needed to assess differences in model performance and utility.
Our study had several strengths. To our knowledge, this is the first study to rigorously measure the additive influence of in‐hospital complications, clinical trajectory, and stability on discharge on the risk of 30‐day hospital readmission. Additionally, our study included a large, diverse study population that included all payers, all ages of adults, a mix of community, academic, and safety net hospitals, and individuals from a broad array of racial/ethnic and socioeconomic backgrounds.
Our results should be interpreted in light of several limitations. First, though we sought to represent a diverse group of hospitals, all study sites were located within north Texas and generalizability to other regions is uncertain. Second, our ascertainment of prior hospitalizations and readmissions was more inclusive than what could be typically accomplished in real time using only EHR data from a single clinical site. We performed a sensitivity analysis using only prior utilization data available within the EHR from the index hospital with no meaningful difference in our findings (data not shown). Additionally, a recent study found that 30‐day readmissions occur at the index hospital for over 75% of events, suggesting that 30‐day readmissions are fairly comprehensively captured even with only single‐site data.[39] Third, we were not able to include data on outpatient visits before or after the index hospitalization, which may influence the risk of readmission.[1, 40]
In conclusion, incorporating clinically granular EHR data from the entire course of hospitalization modestly improves prediction of 30‐day readmissions compared to models that only include information from the first 24 hours of hospital admission or models that use far fewer variables. However, given the limited improvement in prediction, our findings suggest that from the practical perspective of implementing real‐time models to identify those at highest risk for readmission, it may not be worth the added complexity of waiting until the end of a hospitalization to leverage additional data on hospital complications, and the trajectory of laboratory and vital sign values currently available in the EHR. Further improvement in prediction of readmissions will likely require accounting for psychosocial, functional, behavioral, and postdischarge factors not currently present in the inpatient EHR.
Disclosures: This study was presented at the Society of Hospital Medicine 2015 Annual Meeting in National Harbor, Maryland, and the Society of General Internal Medicine 2015 Annual Meeting in Toronto, Canada. This work was supported by the Agency for Healthcare Research and Qualityfunded UT Southwestern Center for Patient‐Centered Outcomes Research (1R24HS022418‐01) and the Commonwealth Foundation (#20100323). Drs. Nguyen and Makam received funding from the UT Southwestern KL2 Scholars Program (NIH/NCATS KL2 TR001103). Dr. Halm was also supported in part by NIH/NCATS U54 RFA‐TR‐12‐006. The study sponsors had no role in the design and conduct of the study; collection, management, analysis, and interpretation of the data; and preparation, review, or approval of the manuscript. The authors have no conflicts of interest to disclose.
Unplanned hospital readmissions are frequent, costly, and potentially avoidable.[1, 2] Due to major federal financial readmissions penalties targeting excessive 30‐day readmissions, there is increasing attention to implementing hospital‐initiated interventions to reduce readmissions.[3, 4] However, universal enrollment of all hospitalized patients into such programs may be too resource intensive for many hospitals.[5] To optimize efficiency and effectiveness, interventions should be targeted to individuals most likely to benefit.[6, 7] However, existing readmission risk‐prediction models have achieved only modest discrimination, have largely used administrative claims data not available until months after discharge, or are limited to only a subset of patients with Medicare or a specific clinical condition.[8, 9, 10, 11, 12, 13, 14] These limitations have precluded accurate identification of high‐risk individuals in an all‐payer general medical inpatient population to provide actionable information for intervention prior to discharge.
Approaches using electronic health record (EHR) data could allow early identification of high‐risk patients during the index hospitalization to enable initiation of interventions prior to discharge. To date, such strategies have relied largely on EHR data from the day of admission.[15, 16] However, given that variation in 30‐day readmission rates are thought to reflect the quality of in‐hospital care, incorporating EHR data from the entire hospital stay to reflect hospital care processes and clinical trajectory may more accurately identify at‐risk patients.[17, 18, 19, 20] Improved accuracy in risk prediction would help better target intervention efforts in the immediate postdischarge period, an interval characterized by heightened vulnerability for adverse events.[21]
To help hospitals target transitional care interventions more effectively to high‐risk individuals prior to discharge, we derived and validated a readmissions risk‐prediction model incorporating EHR data from the entire course of the index hospitalization, which we termed the full‐stay EHR model. We also compared the full‐stay EHR model performance to our group's previously derived prediction model based on EHR data on the day of admission, termed the first‐day EHR model, as well as to 2 other validated readmission models similarly intended to yield near real‐time risk predictions prior to or shortly after hospital discharge.[9, 10, 15]
METHODS
Study Design, Population, and Data Sources
We conducted an observational cohort study using EHR data from 6 hospitals in the DallasFort Worth metroplex between November 1, 2009 and October 30, 2010 using the same EHR system (Epic Systems Corp., Verona, WI). One site was a university‐affiliated safety net hospital; the remaining 5 sites were teaching and nonteaching community sites.
We included consecutive hospitalizations among adults 18 years old discharged alive from any medicine inpatient service. For individuals with multiple hospitalizations during the study period, we included only the first hospitalization. We excluded individuals who died during the index hospitalization, were transferred to another acute care facility, left against medical advice, or who died outside of the hospital within 30 days of discharge. For model derivation, we randomly split the sample into separate derivation (50%) and validation cohorts (50%).
Outcomes
The primary outcome was 30‐day hospital readmission, defined as a nonelective hospitalization within 30 days of discharge to any of 75 acute care hospitals within a 100‐mile radius of Dallas, ascertained from an all‐payer regional hospitalization database. Nonelective hospitalizations included all hospitalizations classified as a emergency, urgent, or trauma, and excluded those classified as elective as per the Centers for Medicare and Medicaid Services Claim Inpatient Admission Type Code definitions.
Predictor Variables for the Full‐Stay EHR Model
The full‐stay EHR model was iteratively developed from our group's previously derived and validated risk‐prediction model using EHR data available on admission (first‐day EHR model).[15] For the full‐stay EHR model, we included all predictor variables included in our published first‐day EHR model as candidate risk factors. Based on prior literature, we additionally expanded candidate predictors available on admission to include marital status (proxy for social isolation) and socioeconomic disadvantage (percent poverty, unemployment, median income, and educational attainment by zip code of residence as proxy measures of the social and built environment).[22, 23, 24, 25, 26, 27] We also expanded the ascertainment of prior hospitalization to include admissions at both the index hospital and any of 75 acute care hospitals from the same, separate all‐payer regional hospitalization database used to ascertain 30‐day readmissions.
Candidate predictors from the remainder of the hospital stay (ie, following the first 24 hours of admission) were included if they were: (1) available in the EHR of all participating hospitals, (2) routinely collected or available at the time of hospital discharge, and (3) plausible predictors of adverse outcomes based on prior literature and clinical expertise. These included length of stay, in‐hospital complications, transfer to an intensive or coronary care unit, blood transfusions, vital sign instabilities within 24 hours of discharge, select laboratory values at time of discharge, and disposition status. We also assessed trajectories of vital signs and selected laboratory values (defined as changes in these measures from admission to discharge).
Statistical Analysis
Model Derivation
Univariate relationships between readmission and each of the candidate predictors were assessed in the derivation cohort using a prespecified significance threshold of P 0.05. We included all factors from our previously derived and validated first‐day EHR model as candidate predictors.[15] Continuous laboratory and vital sign values at the time of discharge were categorized based on clinically meaningful cutoffs; predictors with missing values were assumed to be normal (1% missing for each variable). Significant univariate candidate variables were entered in a multivariate logistic regression model using stepwise backward selection with a prespecified significance threshold of P 0.05. We performed several sensitivity analyses to confirm the robustness of our model. First, we alternately derived the full‐stay model using stepwise forward selection. Second, we forced in all significant variables from our first‐day EHR model, and entered the candidate variables from the remainder of the hospital stay using both stepwise backward and forward selection separately. Third, prespecified interactions between variables were evaluated for inclusion. Though final predictors varied slightly between the different approaches, discrimination of each model was similar to the model derived using our primary analytic approach (C statistics 0.01, data not shown).
Model Validation
We assessed model discrimination and calibration of the derived full‐stay EHR model using the validation cohort. Model discrimination was estimated by the C statistic. The C statistic represents the probability that, given 2 hospitalized individuals (1 who was readmitted and the other who was not), the model will predict a higher risk for the readmitted patient than for the nonreadmitted patient. Model calibration was assessed by comparing predicted to observed probabilities of readmission by quintiles of risk, and with the Hosmer‐Lemeshow goodness‐of‐fit test.
Comparison to Existing Models
We compared the full‐stay EHR model performance to 3 previously published models: our group's first‐day EHR model, and the LACE (includes Length of stay, Acute (nonelective) admission status, Charlson Comorbidity Index, and Emergency department visits in the past year) and HOSPITAL (includes Hemoglobin at discharge, discharge from Oncology service, Sodium level at discharge, Procedure during index hospitalization, Index hospitalization Type (nonelective), number of Admissions in the past year, and Length of stay) models, which were both derived to predict 30‐day readmissions among general medical inpatients and were intended to help clinicians identify high‐risk patients to target for discharge interventions.[9, 10, 15] We assessed each model's performance in our validation cohort, calculating the C statistic, integrated discrimination index (IDI), and net reclassification index (NRI) compared to the full‐stay model. IDI is a summary measure of both discrimination and reclassification, where more positive values suggest improvement in model performance in both these domains compared to a reference model.[28] The NRI is defined as the sum of the net proportions of correctly reclassified persons with and without the event of interest.[29] The theoretical range of values is 2 to 2, with more positive values indicating improved net reclassification compared to a reference model. Here, we calculated a category‐based NRI to evaluate the performance of models in correctly classifying individuals with and without readmissions into the highest readmission risk quintile versus the lowest 4 risk quintiles compared to the full‐stay EHR model.[29] This prespecified cutoff is relevant for hospitals interested in identifying the highest‐risk individuals for targeted intervention.[6] Because some hospitals may be able to target a greater number of individuals for intervention, we performed a sensitivity analysis by assessing category‐based NRI for reclassification into the top 2 risk quintiles versus the lowest 3 risk quintiles and found no meaningful difference in our results (data not shown). Finally, we qualitatively assessed calibration of comparator models in our validation cohort by comparing predicted probability to observed probability of readmission by quintiles of risk for each model. We conducted all analyses using Stata 12.1 (StataCorp, College Station, TX). This study was approved by the UT Southwestern Medical Center institutional review board.
RESULTS
Overall, 32,922 index hospitalizations were included in our study cohort; 12.7% resulted in a 30‐day readmission (see Supporting Figure 1 in the online version of this article). Individuals had a mean age of 62 years and had diverse race/ethnicity and primary insurance status; half were female (Table 1). The study sample was randomly split into a derivation cohort (50%, n = 16,492) and validation cohort (50%, n = 16,430). Individuals in the derivation cohort with a 30‐day readmission had markedly different socioeconomic and clinical characteristics compared to those not readmitted (Table 1).
| Entire Cohort, N = 32,922 | Derivation Cohort, N = 16,492 | |||
|---|---|---|---|---|
|
No Readmission, N = 14,312 |
Readmission, N = 2,180 |
P Value | ||
| ||||
| Demographic characteristics | ||||
| Age, y, mean (SD) | 62 (17.3) | 61 (17.4) | 64 (17.0) | 0.001 |
| Female, n (%) | 17,715 (53.8) | 7,694 (53.8) | 1,163 (53.3) | 0.72 |
| Race/ethnicity | 0.001 | |||
| White | 21,359 (64.9) | 9,329 (65.2) | 1,361 (62.4) | |
| Black | 5,964 (18.1) | 2,520 (17.6) | 434 (19.9) | |
| Hispanic | 4,452 (13.5) | 1,931 (13.5) | 338 (15.5) | |
| Other | 1,147 (3.5) | 532 (3.7) | 47 (2.2) | |
| Marital status, n (%) | 0.001 | |||
| Single | 8,076 (24.5) | 3,516 (24.6) | 514 (23.6) | |
| Married | 13,394 (40.7) | 5,950 (41.6) | 812 (37.3) | |
| Separated/divorced | 3,468 (10.5) | 1,460 (10.2) | 251 (11.5) | |
| Widowed | 4,487 (13.7) | 1,868 (13.1) | 388 (17.8) | |
| Other | 3,497 (10.6) | 1,518 (10.6) | 215 (9.9) | |
| Primary payer, n (%) | 0.001 | |||
| Private | 13,090 (39.8) | 5,855 (40.9) | 726 (33.3) | |
| Medicare | 13,015 (39.5) | 5,597 (39.1) | 987 (45.3) | |
| Medicaid | 2,204 (6.7) | 852 (5.9) | 242 (11.1) | |
| Charity, self‐pay, or other | 4,613 (14.0) | 2,008 (14.0) | 225 (10.3) | |
| High‐poverty neighborhood, n (%)* | 7,468 (22.7) | 3,208 (22.4) | 548 (25.1) | 0.001 |
| Utilization history | ||||
| 1 ED visits in past year, n (%) | 9,299 (28.2) | 3,793 (26.5) | 823 (37.8) | 0.001 |
| 1 hospitalizations in past year, n (%) | 10,189 (30.9) | 4,074 (28.5) | 1,012 (46.4) | 0.001 |
| Clinical factors from first day of hospitalization | ||||
| Nonelective admission, n (%) | 27,818 (84.5) | 11,960 (83.6) | 1,960 (89.9) | 0.001 |
| Charlson Comorbidity Index, median (IQR)∥ | 0 (01) | 0 (00) | 0 (03) | 0.001 |
| Laboratory abnormalities within 24 hours of admission | ||||
| Albumin 2 g/dL | 355 (1.1) | 119 (0.8) | 46 (2.1) | 0.001 |
| Albumin 23 g/dL | 4,732 (14.4) | 1,956 (13.7) | 458 (21.0) | 0.001 |
| Aspartate aminotransferase >40 U/L | 4,610 (14.0) | 1,922 (13.4) | 383 (17.6) | 0.001 |
| Creatine phosphokinase 60 g/L | 3,728 (11.3) | 1,536 (10.7) | 330 (15.1) | 0.001 |
| Mean corpuscular volume >100 fL/red cell | 1,346 (4.1) | 537 (3.8) | 134 (6.2) | 0.001 |
| Platelets 90 103/L | 912 (2.8) | 357 (2.5) | 116 (5.3) | 0.001 |
| Platelets >350 103/L | 3,332 (10.1) | 1,433 (10.0) | 283 (13.0) | 0.001 |
| Prothrombin time >35 seconds | 248 (0.8) | 90 (0.6) | 35 (1.6) | 0.001 |
| Clinical factors from remainder of hospital stay | ||||
| Length of stay, d, median (IQR) | 4 (26) | 4 (26) | 5 (38) | 0.001 |
| ICU transfer after first 24 hours, n (%) | 988 (3.0) | 408 (2.9) | 94 (4.3) | 0.001 |
| Hospital complications, n (%) | ||||
| Clostridium difficile infection | 119 (0.4) | 44 (0.3) | 24 (1.1) | 0.001 |
| Pressure ulcer | 358 (1.1) | 126 (0.9) | 46 (2.1) | 0.001 |
| Venous thromboembolism | 301 (0.9) | 112 (0.8) | 34 (1.6) | 0.001 |
| Respiratory failure | 1,048 (3.2) | 463 (3.2) | 112 (5.1) | 0.001 |
| Central line‐associated bloodstream infection | 22 (0.07) | 6 (0.04) | 5 (0.23) | 0.005 |
| Catheter‐associated urinary tract infection | 47 (0.14) | 20 (0.14) | 6 (0.28) | 0.15 |
| Acute myocardial infarction | 293 (0.9) | 110 (0.8) | 32 (1.5) | 0.001 |
| Pneumonia | 1,754 (5.3) | 719 (5.0) | 154 (7.1) | 0.001 |
| Sepsis | 853 (2.6) | 368 (2.6) | 73 (3.4) | 0.04 |
| Blood transfusion during hospitalization, n (%) | 4,511 (13.7) | 1,837 (12.8) | 425 (19.5) | 0.001 |
| Laboratory abnormalities at discharge# | ||||
| Blood urea nitrogen >20 mg/dL, n (%) | 10,014 (30.4) | 4,077 (28.5) | 929 (42.6) | 0.001 |
| Sodium 135 mEq/L, n (%) | 4,583 (13.9) | 1,850 (12.9) | 440 (20.2) | 0.001 |
| Hematocrit 27 | 3,104 (9.4) | 1,231 (8.6) | 287 (13.2) | 0.001 |
| 1 vital sign instability at discharge, n (%)# | 6,192 (18.8) | 2,624 (18.3) | 525 (24.1) | 0.001 |
| Discharge location, n (%) | 0.001 | |||
| Home | 23,339 (70.9) | 10,282 (71.8) | 1,383 (63.4) | |
| Home health | 3,185 (9.7) | 1,356 (9.5) | 234 (10.7) | |
| Postacute care** | 5,990 (18.2) | 2,496 (17.4) | 549 (25.2) | |
| Hospice | 408 (1.2) | 178 (1.2) | 14 (0.6) | |
Derivation and Validation of the Full‐Stay EHR Model for 30‐Day Readmission
Our final model included 24 independent variables, including demographic characteristics, utilization history, clinical factors from the first day of admission, and clinical factors from the remainder of the hospital stay (Table 2). The strongest independent predictor of readmission was hospital‐acquired Clostridium difficile infection (adjusted odds ratio [AOR]: 2.03, 95% confidence interval [CI] 1.18‐3.48); other hospital‐acquired complications including pressure ulcers and venous thromboembolism were also significant predictors. Though having Medicaid was associated with increased odds of readmission (AOR: 1.55, 95% CI: 1.31‐1.83), other zip codelevel measures of socioeconomic disadvantage were not predictive and were not included in the final model. Being discharged to hospice was associated with markedly lower odds of readmission (AOR: 0.23, 95% CI: 0.13‐0.40).
| Odds Ratio (95% CI) | ||
|---|---|---|
| Univariate | Multivariate* | |
| ||
| Demographic characteristics | ||
| Age, per 10 years | 1.08 (1.051.11) | 1.07 (1.041.10) |
| Medicaid | 1.97 (1.702.29) | 1.55 (1.311.83) |
| Widow | 1.44 (1.281.63) | 1.27 (1.111.45) |
| Utilization history | ||
| Prior ED visit, per visit | 1.08 (1.061.10) | 1.04 (1.021.06) |
| Prior hospitalization, per hospitalization | 1.30 (1.271.34) | 1.16 (1.121.20) |
| Hospital and clinical factors from first day of hospitalization | ||
| Nonelective admission | 1.75 (1.512.03) | 1.42 (1.221.65) |
| Charlson Comorbidity Index, per point | 1.19 (1.171.21) | 1.06 (1.041.09) |
| Laboratory abnormalities within 24 hours of admission | ||
| Albumin 2 g/dL | 2.57 (1.823.62) | 1.52 (1.052.21) |
| Albumin 23 g/dL | 1.68 (1.501.88) | 1.20 (1.061.36) |
| Aspartate aminotransferase >40 U/L | 1.37 (1.221.55) | 1.21 (1.061.38) |
| Creatine phosphokinase 60 g/L | 1.48 (1.301.69) | 1.28 (1.111.46) |
| Mean corpuscular volume >100 fL/red cell | 1.68 (1.382.04) | 1.32 (1.071.62) |
| Platelets 90 103/L | 2.20 (1.772.72) | 1.56 (1.231.97) |
| Platelets >350 103/L | 1.34 (1.171.54) | 1.24 (1.081.44) |
| Prothrombin time >35 seconds | 2.58 (1.743.82) | 1.92 (1.272.90) |
| Hospital and clinical factors from remainder of hospital stay | ||
| Length of stay, per day | 1.08 (1.071.09) | 1.06 (1.041.07) |
| Hospital complications | ||
| Clostridium difficile infection | 3.61 (2.195.95) | 2.03 (1.183.48) |
| Pressure ulcer | 2.43 (1.733.41) | 1.64 (1.152.34) |
| Venous thromboembolism | 2.01 (1.362.96) | 1.55 (1.032.32) |
| Laboratory abnormalities at discharge | ||
| Blood urea nitrogen >20 mg/dL | 1.86 (1.702.04) | 1.37 (1.241.52) |
| Sodium 135 mEq/L | 1.70 (1.521.91) | 1.34 (1.181.51) |
| Hematocrit 27 | 1.61 (1.401.85) | 1.22 (1.051.41) |
| Vital sign instability at discharge, per instability | 1.29 (1.201.40) | 1.25 (1.151.36) |
| Discharged to hospice | 0.51 (0.300.89) | 0.23 (0.130.40) |
In our validation cohort, the full‐stay EHR model had fair discrimination, with a C statistic of 0.69 (95% CI: 0.68‐0.70) (Table 3). The full‐stay EHR model was well calibrated across all quintiles of risk, with slight overestimation of predicted risk in the lowest and highest quintiles (Figure 1a) (see Supporting Table 5 in the online version of this article). It also effectively stratified individuals across a broad range of predicted readmission risk from 4.1% in the lowest decile to 36.5% in the highest decile (Table 3).
| Model Name | C‐Statistic (95% CI) | IDI, % (95% CI) | NRI (95% CI) | Average Predicted Risk, % | |
|---|---|---|---|---|---|
| Lowest Decile | Highest Decile | ||||
| |||||
| Full‐stay EHR model | |||||
| Derivation cohort | 0.72 (0.70 to 0.73) | 4.1 | 36.5 | ||
| Validation cohort | 0.69 (0.68 to 0.70) | [Reference] | [Reference] | 4.1 | 36.5 |
| First‐day EHR model | 0.67 (0.66 to 0.68) | 1.2 (1.4 to 1.0) | 0.020 (0.038 to 0.002) | 5.8 | 31.9 |
| LACE model | 0.65 (0.64 to 0.66) | 2.6 (2.9 to 2.3) | 0.046 (0.067 to 0.024) | 6.1 | 27.5 |
| HOSPITAL model | 0.64 (0.62 to 0.65) | 3.2 (3.5 to 2.9) | 0.058 (0.080 to 0.035) | 6.7 | 26.6 |
Comparing the Performance of the Full‐Stay EHR Model to Other Models
The full‐stay EHR model had better discrimination compared to the first‐day EHR model and the LACE and HOSPITAL models, though the magnitude of improvement was modest (Table 3). The full‐stay EHR model also stratified individuals across a broader range of readmission risk, and was better able to discriminate and classify those in the highest quintile of risk from those in the lowest 4 quintiles of risk compared to other models as assessed by the IDI and NRI (Table 3) (see Supporting Tables 14 and Supporting Figure 2 in the online version of this article). In terms of model calibration, both the first‐day EHR and LACE models were also well calibrated, whereas the HOSPITAL model was less robust (Figure 1).
The diagnostic accuracy of the full‐stay EHR model in correctly predicting those in the highest quintile of risk was better than that of the first‐day, LACE, and HOSPITAL models, though overall improvements in the sensitivity, specificity, positive and negative predictive values, and positive and negative likelihood ratios were also modest (see Supporting Table 6 in the online version of this article).
DISCUSSION
In this study, we used clinically detailed EHR data from the entire hospitalization on 32,922 individuals treated in 6 diverse hospitals to develop an all‐payer, multicondition readmission risk‐prediction model. To our knowledge, this is the first 30‐day hospital readmission risk‐prediction model to use a comprehensive set of factors from EHR data from the entire hospital stay. Prior EHR‐based models have focused exclusively on data available on or prior to the first day of admission, which account for clinical severity on admission but do not account for factors uncovered during the inpatient stay that influence the chance of a postdischarge adverse outcome.[15, 30] We specifically assessed the prognostic impact of a comprehensive set of factors from the entire index hospitalization, including hospital‐acquired complications, clinical trajectory, and stability on discharge in predicting hospital readmissions. Our full‐stay EHR model had statistically better discrimination, calibration, and diagnostic accuracy than our existing all‐cause first‐day EHR model[15] and 2 previously published readmissions models that included more limited information from hospitalization (such as length of stay).[9, 10] However, although the more complicated full‐stay EHR model was statistically better than previously published models, we were surprised that the predictive performance was only modestly improved despite the inclusion of many additional clinically relevant prognostic factors.
Taken together, our study has several important implications. First, the added complexity and resource intensity of implementing a full‐stay EHR model yields only modestly improved readmission risk prediction. Thus, hospitals and healthcare systems interested in targeting their highest‐risk individuals for interventions to reduce 30‐day readmission should consider doing so within the first day of hospital admission. Our group's previously derived and validated first‐day EHR model, which used data only from the first day of admission, qualitatively performed nearly as well as the full‐stay EHR model.[15] Additionally, a recent study using only preadmission EHR data to predict 30‐day readmissions also achieved similar discrimination and diagnostic accuracy as our full‐stay model.[30]
Second, the field of readmissions risk‐prediction modeling may be reaching the maximum achievable model performance using data that are currently available in the EHR. Our limited ability to accurately predict all‐cause 30‐day readmission risk may reflect the influence of currently unmeasured patient, system, and community factors on readmissions.[31, 32, 33] Due to the constraints of data collected in the EHR, we were unable to include several patient‐level clinical characteristics associated with hospital readmission, including self‐perceived health status, functional impairment, and cognition.[33, 34, 35, 36] However, given their modest effect sizes (ORs ranging from 1.062.10), adequately measuring and including these risk factors in our model may not meaningfully improve model performance and diagnostic accuracy. Further, many social and behavioral patient‐level factors are also not consistently available in EHR data. Though we explored the role of several neighborhood‐level socioeconomic measuresincluding prevalence of poverty, median income, education, and unemploymentwe found that none were significantly associated with 30‐day readmissions. These particular measures may have been inadequate to characterize individual‐level social and behavioral factors, as several previous studies have demonstrated that patient‐level factors such as social support, substance abuse, and medication and visit adherence can influence readmission risk in heart failure and pneumonia.[11, 16, 22, 25] This underscores the need for more standardized routine collection of data across functional, social, and behavioral domains in clinical settings, as recently championed by the Institute of Medicine.[11, 37] Integrating data from outside the EHR on postdischarge health behaviors, self‐management, follow‐up care, recovery, and home environment may be another important but untapped strategy for further improving prediction of readmissions.[25, 38]
Third, a multicondition readmission risk‐prediction model may be a less effective strategy than more customized disease‐specific models for selected conditions associated with high 30‐day readmission rates. Our group's previously derived and internally validated models for heart failure and human immunodeficiency virus had superior discrimination compared to our full‐stay EHR model (C statistic of 0.72 for each).[11, 13] However, given differences in the included population and time periods studied, a head‐to‐head comparison of these different strategies is needed to assess differences in model performance and utility.
Our study had several strengths. To our knowledge, this is the first study to rigorously measure the additive influence of in‐hospital complications, clinical trajectory, and stability on discharge on the risk of 30‐day hospital readmission. Additionally, our study included a large, diverse study population that included all payers, all ages of adults, a mix of community, academic, and safety net hospitals, and individuals from a broad array of racial/ethnic and socioeconomic backgrounds.
Our results should be interpreted in light of several limitations. First, though we sought to represent a diverse group of hospitals, all study sites were located within north Texas and generalizability to other regions is uncertain. Second, our ascertainment of prior hospitalizations and readmissions was more inclusive than what could be typically accomplished in real time using only EHR data from a single clinical site. We performed a sensitivity analysis using only prior utilization data available within the EHR from the index hospital with no meaningful difference in our findings (data not shown). Additionally, a recent study found that 30‐day readmissions occur at the index hospital for over 75% of events, suggesting that 30‐day readmissions are fairly comprehensively captured even with only single‐site data.[39] Third, we were not able to include data on outpatient visits before or after the index hospitalization, which may influence the risk of readmission.[1, 40]
In conclusion, incorporating clinically granular EHR data from the entire course of hospitalization modestly improves prediction of 30‐day readmissions compared to models that only include information from the first 24 hours of hospital admission or models that use far fewer variables. However, given the limited improvement in prediction, our findings suggest that from the practical perspective of implementing real‐time models to identify those at highest risk for readmission, it may not be worth the added complexity of waiting until the end of a hospitalization to leverage additional data on hospital complications, and the trajectory of laboratory and vital sign values currently available in the EHR. Further improvement in prediction of readmissions will likely require accounting for psychosocial, functional, behavioral, and postdischarge factors not currently present in the inpatient EHR.
Disclosures: This study was presented at the Society of Hospital Medicine 2015 Annual Meeting in National Harbor, Maryland, and the Society of General Internal Medicine 2015 Annual Meeting in Toronto, Canada. This work was supported by the Agency for Healthcare Research and Qualityfunded UT Southwestern Center for Patient‐Centered Outcomes Research (1R24HS022418‐01) and the Commonwealth Foundation (#20100323). Drs. Nguyen and Makam received funding from the UT Southwestern KL2 Scholars Program (NIH/NCATS KL2 TR001103). Dr. Halm was also supported in part by NIH/NCATS U54 RFA‐TR‐12‐006. The study sponsors had no role in the design and conduct of the study; collection, management, analysis, and interpretation of the data; and preparation, review, or approval of the manuscript. The authors have no conflicts of interest to disclose.
- , , . Rehospitalizations among patients in the Medicare fee‐for‐service program. N Engl J Med. 2009;360(14):1418–1428.
- , , , , . Proportion of hospital readmissions deemed avoidable: a systematic review. CMAJ. 2011;183(7):E391–E402.
- , , , , , . Hospital‐initiated transitional care interventions as a patient safety strategy: a systematic review. Ann Intern Med. 2013;158(5 pt 2):433–440.
- , , , , . Interventions to reduce 30‐day rehospitalization: a systematic review. Ann Intern Med. 2011;155(8):520–528.
- , , , , , . Interventions to Improve Care Transitions at Hospital Discharge. Rockville, MD: Agency for Healthcare Research and Quality; 2013.
- , , , et al. Allocating scarce resources in real‐time to reduce heart failure readmissions: a prospective, controlled study. BMJ Qual Saf. 2013;22(12):998–1005.
- , , , , . Implementing electronic health care predictive analytics: considerations and challenges. Health Aff (Millwood). 2014;33(7):1148–1154.
- , , , et al. Risk prediction models for hospital readmission: a systematic review. JAMA. 2011;306(15):1688–1698.
- , , , et al. Derivation and validation of an index to predict early death or unplanned readmission after discharge from hospital to the community. CMAJ. 2010;182(6):551–557.
- , , , . Potentially avoidable 30‐day hospital readmissions in medical patients: derivation and validation of a prediction model. JAMA Intern Med. 2013;173(8):632–638.
- , , , et al. An automated model to identify heart failure patients at risk for 30‐day readmission or death using electronic medical record data. Med Care. 2010;48(11):981–988.
- , , , et al. An automated model using electronic medical record data identifies patients with cirrhosis at high risk for readmission. Clin Gastroenterol Hepatol. 2013;11(10):1335–1341.e1331.
- , , , , , . An electronic medical record‐based model to predict 30‐day risk of readmission and death among HIV‐infected inpatients. J Acquir Immune Defic Syndr. 2012;61(3):349–358.
- , , , et al. Development and use of an administrative claims measure for profiling hospital‐wide performance on 30‐day unplanned readmission. Ann Intern Med. 2014;161(10 suppl):S66–S75.
- , , , et al. Electronic medical record‐based multicondition models to predict the risk of 30 day readmission or death among adult medicine patients: validation and comparison to existing models. BMC Med Inform Decis Mak. 2015;15(1):39.
- , , , et al. Linking electronic health record‐extracted psychosocial data in real‐time to risk of readmission for heart failure. Psychosomatics. 2011;52(4):319–327.
- , . A conceptual framework for the study of early readmission as an indicator of quality of care. Soc Sci Med. 1996;43(11):1533–1541.
- , , , et al. Hospital readmission performance and patterns of readmission: retrospective cohort study of Medicare admissions. BMJ. 2013;347:f6571.
- , , , , , . Getting more performance from performance measurement. N Engl J Med. 2014;371(23):2145–2147.
- , , , et al. Hospital strategy uptake and reductions in unplanned readmission rates for patients with heart failure: a prospective study. J Gen Intern Med. 2015;30(5):605–611.
- . Post‐hospital syndrome—an acquired, transient condition of generalized risk. N Engl J Med. 2013;368(2):100–102.
- , , , et al. Impact of social factors on risk of readmission or mortality in pneumonia and heart failure: systematic review. J Gen Intern Med. 2013;28(2):269–282.
- , , , , , . Effect of clinical and social risk factors on hospital profiling for stroke readmission: a cohort study. Ann Intern Med. 2014;161(11):775–784.
- , , , et al. Neighborhood socioeconomic disadvantage and 30‐day rehospitalization: a retrospective cohort study. Ann Intern Med. 2014;161(11):765–774.
- , , , , , . Postdischarge environmental and socioeconomic factors and the likelihood of early hospital readmission among community‐dwelling Medicare beneficiaries. Gerontologist. 2008;48(4):495–504.
- , , . Socioeconomic status and readmissions: evidence from an urban teaching hospital. Health Aff (Millwood). 2014;33(5):778–785.
- , , , . Adding socioeconomic data to hospital readmissions calculations may produce more useful results. Health Aff (Millwood). 2014;33(5):786–791.
- , , , . Evaluating the added predictive ability of a new marker: from area under the ROC curve to reclassification and beyond. Stat Med. 2008;27(2):157–172; discussion 207–212.
- , , , , . Net reclassification improvement: computation, interpretation, and controversies: a literature review and clinician's guide. Ann Intern Med. 2014;160(2):122–131.
- , , , , , . Predicting 30‐day readmissions with preadmission electronic health record data. Med Care. 2015;53(3):283–289.
- , . Hospital readmissions—not just a measure of quality. JAMA. 2011;306(16):1796–1797.
- , . Thirty‐day readmissions—truth and consequences. N Engl J Med. 2012;366(15):1366–1369.
- , , , . Functional impairment and hospital readmission in medicare seniors. JAMA Intern Med. 2015;175(4):559–565.
- , , . Clinical and sociodemographic risk factors for readmission of Medicare beneficiaries. Health Care Financ Rev. 1988;10(1):27–36.
- , , , , , . Mini‐cog performance: novel marker of post discharge risk among patients hospitalized for heart failure. Circ Heart Fail. 2015;8(1):8–16.
- , , , , , . Association of impaired functional status at hospital discharge and subsequent rehospitalization. J Hosp Med. 2014;9(5):277–282.
- , . Patients in context—EHR capture of social and behavioral determinants of health. N Engl J Med. 2015;372(8):698–701.
- , , , , . Envisioning a social‐health information exchange as a platform to support a patient‐centered medical neighborhood: a feasibility study. J Gen Intern Med. 2015;30(1):60–67.
- , , , , , . Patient factors contributing to variation in same‐hospital readmission rate. Med Care Res Review. 2015;72(3):338–358.
- , , . Does increased access to primary care reduce hospital readmissions? Veterans Affairs Cooperative Study Group on Primary Care and Hospital Readmission. N Engl J Med. 1996;334(22):1441–1447.
- , , . Rehospitalizations among patients in the Medicare fee‐for‐service program. N Engl J Med. 2009;360(14):1418–1428.
- , , , , . Proportion of hospital readmissions deemed avoidable: a systematic review. CMAJ. 2011;183(7):E391–E402.
- , , , , , . Hospital‐initiated transitional care interventions as a patient safety strategy: a systematic review. Ann Intern Med. 2013;158(5 pt 2):433–440.
- , , , , . Interventions to reduce 30‐day rehospitalization: a systematic review. Ann Intern Med. 2011;155(8):520–528.
- , , , , , . Interventions to Improve Care Transitions at Hospital Discharge. Rockville, MD: Agency for Healthcare Research and Quality; 2013.
- , , , et al. Allocating scarce resources in real‐time to reduce heart failure readmissions: a prospective, controlled study. BMJ Qual Saf. 2013;22(12):998–1005.
- , , , , . Implementing electronic health care predictive analytics: considerations and challenges. Health Aff (Millwood). 2014;33(7):1148–1154.
- , , , et al. Risk prediction models for hospital readmission: a systematic review. JAMA. 2011;306(15):1688–1698.
- , , , et al. Derivation and validation of an index to predict early death or unplanned readmission after discharge from hospital to the community. CMAJ. 2010;182(6):551–557.
- , , , . Potentially avoidable 30‐day hospital readmissions in medical patients: derivation and validation of a prediction model. JAMA Intern Med. 2013;173(8):632–638.
- , , , et al. An automated model to identify heart failure patients at risk for 30‐day readmission or death using electronic medical record data. Med Care. 2010;48(11):981–988.
- , , , et al. An automated model using electronic medical record data identifies patients with cirrhosis at high risk for readmission. Clin Gastroenterol Hepatol. 2013;11(10):1335–1341.e1331.
- , , , , , . An electronic medical record‐based model to predict 30‐day risk of readmission and death among HIV‐infected inpatients. J Acquir Immune Defic Syndr. 2012;61(3):349–358.
- , , , et al. Development and use of an administrative claims measure for profiling hospital‐wide performance on 30‐day unplanned readmission. Ann Intern Med. 2014;161(10 suppl):S66–S75.
- , , , et al. Electronic medical record‐based multicondition models to predict the risk of 30 day readmission or death among adult medicine patients: validation and comparison to existing models. BMC Med Inform Decis Mak. 2015;15(1):39.
- , , , et al. Linking electronic health record‐extracted psychosocial data in real‐time to risk of readmission for heart failure. Psychosomatics. 2011;52(4):319–327.
- , . A conceptual framework for the study of early readmission as an indicator of quality of care. Soc Sci Med. 1996;43(11):1533–1541.
- , , , et al. Hospital readmission performance and patterns of readmission: retrospective cohort study of Medicare admissions. BMJ. 2013;347:f6571.
- , , , , , . Getting more performance from performance measurement. N Engl J Med. 2014;371(23):2145–2147.
- , , , et al. Hospital strategy uptake and reductions in unplanned readmission rates for patients with heart failure: a prospective study. J Gen Intern Med. 2015;30(5):605–611.
- . Post‐hospital syndrome—an acquired, transient condition of generalized risk. N Engl J Med. 2013;368(2):100–102.
- , , , et al. Impact of social factors on risk of readmission or mortality in pneumonia and heart failure: systematic review. J Gen Intern Med. 2013;28(2):269–282.
- , , , , , . Effect of clinical and social risk factors on hospital profiling for stroke readmission: a cohort study. Ann Intern Med. 2014;161(11):775–784.
- , , , et al. Neighborhood socioeconomic disadvantage and 30‐day rehospitalization: a retrospective cohort study. Ann Intern Med. 2014;161(11):765–774.
- , , , , , . Postdischarge environmental and socioeconomic factors and the likelihood of early hospital readmission among community‐dwelling Medicare beneficiaries. Gerontologist. 2008;48(4):495–504.
- , , . Socioeconomic status and readmissions: evidence from an urban teaching hospital. Health Aff (Millwood). 2014;33(5):778–785.
- , , , . Adding socioeconomic data to hospital readmissions calculations may produce more useful results. Health Aff (Millwood). 2014;33(5):786–791.
- , , , . Evaluating the added predictive ability of a new marker: from area under the ROC curve to reclassification and beyond. Stat Med. 2008;27(2):157–172; discussion 207–212.
- , , , , . Net reclassification improvement: computation, interpretation, and controversies: a literature review and clinician's guide. Ann Intern Med. 2014;160(2):122–131.
- , , , , , . Predicting 30‐day readmissions with preadmission electronic health record data. Med Care. 2015;53(3):283–289.
- , . Hospital readmissions—not just a measure of quality. JAMA. 2011;306(16):1796–1797.
- , . Thirty‐day readmissions—truth and consequences. N Engl J Med. 2012;366(15):1366–1369.
- , , , . Functional impairment and hospital readmission in medicare seniors. JAMA Intern Med. 2015;175(4):559–565.
- , , . Clinical and sociodemographic risk factors for readmission of Medicare beneficiaries. Health Care Financ Rev. 1988;10(1):27–36.
- , , , , , . Mini‐cog performance: novel marker of post discharge risk among patients hospitalized for heart failure. Circ Heart Fail. 2015;8(1):8–16.
- , , , , , . Association of impaired functional status at hospital discharge and subsequent rehospitalization. J Hosp Med. 2014;9(5):277–282.
- , . Patients in context—EHR capture of social and behavioral determinants of health. N Engl J Med. 2015;372(8):698–701.
- , , , , . Envisioning a social‐health information exchange as a platform to support a patient‐centered medical neighborhood: a feasibility study. J Gen Intern Med. 2015;30(1):60–67.
- , , , , , . Patient factors contributing to variation in same‐hospital readmission rate. Med Care Res Review. 2015;72(3):338–358.
- , , . Does increased access to primary care reduce hospital readmissions? Veterans Affairs Cooperative Study Group on Primary Care and Hospital Readmission. N Engl J Med. 1996;334(22):1441–1447.
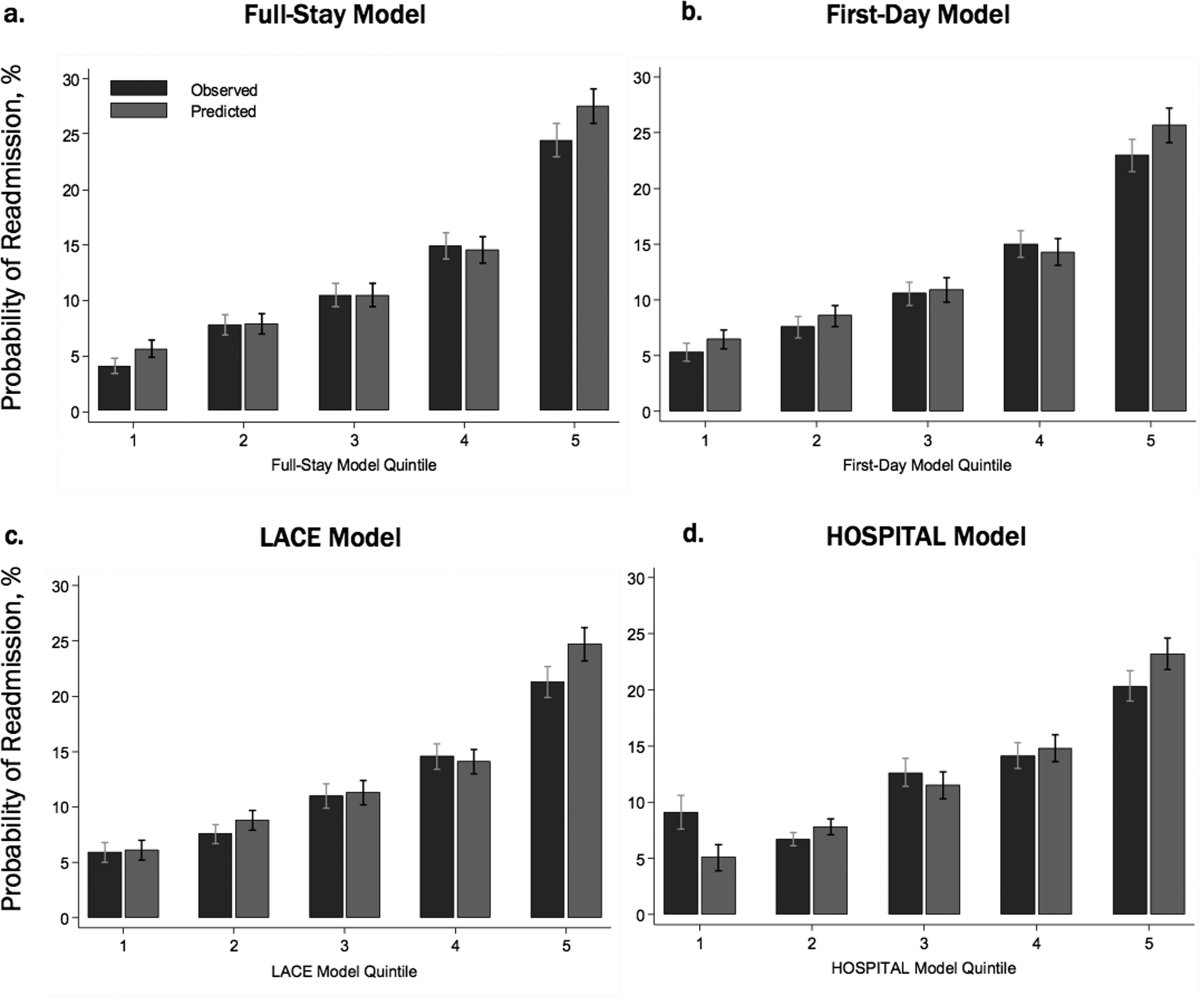
Financial Performance and Outcomes
Hospital care accounts for the single largest category of national healthcare expenditures, totaling $936.9 billion in 2013.[1] With ongoing scrutiny of US healthcare spending, hospitals are under increasing pressure to justify high costs and robust profits.[2] However, the dominant fee‐for‐service reimbursement model creates incentives for hospitals to prioritize high volume over high‐quality care to maximize profits.[3] Because hospitals may be reluctant to implement improvements if better quality is not accompanied by better payment or improved financial margins, an approach to stimulate quality improvement among hospitals has been to leverage consumer pressure through required public reporting of selected outcome metrics.[4, 5] Public reporting of outcomes is thought to influence hospital reputation; in turn, reputation affects patient perceptions and influences demand for hospital services, potentially enabling reputable hospitals to command higher prices for services to enhance hospital revenue.[6, 7]
Though improving outcomes is thought to reduce overall healthcare costs, it is unclear whether improving outcomes results in a hospital's financial return on investment.[4, 5, 8] Quality improvement can require substantial upfront investment, requiring that hospitals already have robust financial health to engage in such initiatives.[9, 10] Consequently, instead of stimulating broad efforts in quality improvement, public reporting may exacerbate existing disparities in hospital quality and finances, by rewarding already financially healthy hospitals, and by inadvertently penalizing hospitals without the means to invest in quality improvement.[11, 12, 13, 14, 15] Alternately, because fee‐for‐service remains the dominant reimbursement model for hospitals, loss of revenue through reducing readmissions may outweigh any financial gains from improved public reputation and result in worse overall financial performance, though robust evidence for this concern is lacking.[16, 17]
A small number of existing studies suggest a limited correlation between improved hospital financial performance and improved quality, patient safety, and lower readmission rates.[18, 19, 20] However, these studies had several limitations. They were conducted prior to public reporting of selected outcome metrics by the Centers for Medicare and Medicaid Services (CMS)[18, 19, 20]; used data from the Medicare Cost Report, which is not uniformly audited and thus prone to measurement error[19, 20]; used only relative measures of hospital financial performance (eg, operating margin), which do not capture the absolute amount of revenue potentially available for investment in quality improvement[18, 19]; or compared only hospitals at the extremes of financial performance, potentially exaggerating the magnitude of the relationship between hospital financial performance and quality outcomes.[19]
To address this gap in the literature, we sought to assess whether hospitals with robust financial performance have lower 30‐day risk‐standardized mortality and hospital readmission rates for acute myocardial infarction (AMI), congestive heart failure (CHF), and pneumonia (PNA). Given the concern that hospitals with the lowest mortality and readmission rates may experience a decrease in financial performance due to the lower volume of hospitalizations, we also assessed whether hospitals with the lowest readmission and mortality rates had a differential change in financial performance over time compared to hospitals with the highest rates.
METHODS
Data Sources and Study Population
This was an observational study using audited financial data from the 2008 and 2012 Hospital Annual Financial Data Files from the Office of Statewide Health Planning and Development (OSHPD) in the state of California, merged with data on outcome measures publicly reported by CMS via the Hospital Compare website for July 1, 2008 to June 30, 2011.[21, 22] We included all general acute care hospitals with available OSHPD data in 2008 and at least 1 publicly reported outcome from 2008 to 2011. We excluded hospitals without 1 year of audited financial data for 2008 and hospitals that closed during 2008 to 2011.
Measures of Financial Performance
Because we hypothesized that the absolute amount of revenue generated from clinical operations would influence investment in quality improvement programs more so than relative changes in revenue,[20] we used net revenue from operations (total operating revenue minus total operating expense) as our primary measure of hospital financial performance. We also performed 2 companion analyses using 2 commonly reported relative measures of financial performanceoperating margin (net revenue from operations divided by total operating revenue) and total margin (net total revenue divided by total revenue from all sources). Net revenue from operations for 2008 was adjusted to 2012 US dollars using the chained Consumer Price Index for all urban consumers.
Outcomes
For our primary analysis, the primary outcomes were publicly reported all‐cause 30‐day risk‐standardized mortality rates (RSMR) and readmission rates (RSRR) for AMI, CHF, and PNA aggregated over a 3‐year period. These measures were adjusted for key demographic and clinical characteristics available in Medicare data. CMS began publicly reporting 30‐day RSMR for AMI and CHF in June 2007, RSMR for PNA in June 2008, and RSRR for all 3 conditions in July 2009.[23, 24]
To assess whether public reporting had an effect on subsequent hospital financial performance, we conducted a companion analysis where the primary outcome of interest was change in hospital financial performance over time, using the same definitions of financial performance outlined above. For this companion analysis, publicly reported 30‐day RSMR and RSRR for AMI, CHF, and PNA were assessed as predictors of subsequent financial performance.
Hospital Characteristics
Hospital characteristics were ascertained from the OSHPD data. Safety‐net status was defined as hospitals with an annual Medicaid caseload (number of Medicaid discharges divided by the total number of discharges) 1 standard deviation above the mean Medicaid caseload, as defined in previous studies.[25]
Statistical Analyses
Effect of Baseline Financial Performance on Subsequent Publicly Reported Outcomes
To estimate the relationship between baseline hospital financial performance in 2008 and subsequent RSMR and RSRR for AMI, CHF, and PNA from 2008 to 2011, we used linear regression adjusted for the following hospital characteristics: teaching status, rural location, bed size, safety‐net status, ownership, Medicare caseload, and volume of cases reported for the respective outcome. We accounted for clustering of hospitals by ownership. We adjusted for hospital volume of reported cases for each condition given that the risk‐standardization models used by CMS shrink outcomes for small hospitals to the mean, and therefore do not account for a potential volume‐outcome relationship.[26] We conducted a sensitivity analysis excluding hospitals at the extremes of financial performance, defined as hospitals with extreme outlier values for each financial performance measure (eg, values more than 3 times the interquartile range above the first quartile or below the third quartile).[27] Nonlinearity of financial performance measures was assessed using restricted cubic splines. For ease of interpretation, we scaled the estimated change in RSMR and RSRR per $50 million increase in net revenue from operations, and graphed nonparametric relationships using restricted cubic splines.
Effect of Public Reporting on Subsequent Hospital Financial Performance
To assess whether public reporting had an effect on subsequent hospital financial performance, we conducted a companion hospital‐level difference‐in‐differences analysis to assess for differential changes in hospital financial performance between 2008 and 2012, stratified by tertiles of RSMR and RSRR rates from 2008 to 2011. This approach compares differences in an outcome of interest (hospital financial performance) within each group (where each group is a tertile of publicly reported rates of RSMR or RSRR), and then compares the difference in these differences between groups. Therefore, these analyses use each group as their own historical control and the opposite group as a concurrent control to account for potential secular trends. To conduct our difference‐in‐differences analysis, we compared the change in financial performance over time in the top tertile of hospitals to the change in financial performance over time in the bottom tertile of hospitals with respect to AMI, CHF, and PNA RSMR and RSRR. Our models therefore included year (2008 vs 2012), tertile of publicly reported rates for RSMR or RSRR, and the interaction between them as predictors, where the interaction was the difference‐in‐differences term and the primary predictor of interest. In addition to adjusting for hospital characteristics and accounting for clustering as mentioned above, we also included 3 separate interaction terms for year with bed size, safety‐net status, and Medicare caseload, to account for potential changes in the hospitals over time that may have independently influenced financial performance and publicly reported 30‐day measures. For sensitivity analyses, we repeated our difference‐in‐differences analyses excluding hospitals with a change in ownership and extreme outliers with respect to financial performance in 2008. We performed model diagnostics including assessment of functional form, linearity, normality, constant variance, and model misspecification. All analyses were conducted using Stata version 12.1 (StataCorp, College Station, TX). This study was deemed exempt from review by the UT Southwestern Medical Center institutional review board.
RESULTS
Among the 279 included hospitals (see Supporting Figure 1 in the online version of this article), 278 also had financial data available for 2012. In 2008, the median net revenue from operations was $1.6 million (interquartile range [IQR], $2.4 to $10.3 million), the median operating margin was 1.5% (IQR, 4.6% to 6%), and the median total margin was 2.5% (IQR, 2.2% to 7.5% (Table 1). The number of hospitals reporting each outcome, and median outcome rates, are shown in Table 2.
| 2008, n = 279 | 2012, n = 278 | |
|---|---|---|
| ||
| Hospital characteristics | ||
| Teaching, n (%) | 28 (10.0) | 28 (10.0) |
| Rural, n (%) | 55 (19.7) | 55 (19.7) |
| Bed size, n (%) | ||
| 099 (small) | 57 (20.4) | 55 (19.8) |
| 100299 (medium) | 130 (46.6) | 132 (47.5) |
| 300 (large) | 92 (33.0) | 91 (32.7) |
| Safety‐net hospital, n (%)* | 46 (16.5) | 48 (17.3) |
| Hospital ownership, n (%) | ||
| City or county | 15 (5.4) | 16 (5.8) |
| District | 42 (15.1) | 39 (14.0) |
| Investor | 66 (23.7) | 66 (23.7) |
| Private nonprofit | 156 (55.9) | 157 (56.5) |
| Medicare caseload, mean % (SD) | 41.6 (14.7) | 43.6 (14.7) |
| Financial performance measures | ||
| Net revenue from operations, median $ in millions (IQR; range) | 1.6 (2.4 to 10.3; 495.9 to 144.1) | 3.2 (2.9 to 15.4; 396.2 to 276.8) |
| Operating margin, median % (IQR; range) | 1.5 (4.6 to 6.8; 77.8 to 26.4) | 2.3 (3.9 to 8.2; 134.8 to 21.1) |
| Total margin, median % (IQR; range) | 2.5 (2.2 to 7.5; 101.0 to 26.3) | 4.5 (0.7 to 9.8; 132.2 to 31.1) |
| No. | Median % (IQR) | Adjusted % Change (95% CI) per $50 Million Increase in Net Revenue From Operations | ||
|---|---|---|---|---|
| Overall | Extreme Outliers Excluded | |||
| ||||
| Myocardial infarction | ||||
| Mortality rate | 211 | 15.2 (14.216.2) | 0.07 (0.10 to 0.24) | 0.63 (0.21 to 1.48) |
| Readmission rate | 184 | 19.4 (18.520.2) | Nonlinear | 0.34 (1.17 to 0.50) |
| Congestive heart failure | ||||
| Mortality rate | 259 | 11.1 (10.112.1) | 0.17 (0.01 to 0.35) | Nonlinear∥ |
| Readmission rate | 264 | 24.5 (23.525.6) | 0.07 (0.27 to 0.14) | 0.45 (1.36 to 0.47) |
| Pneumonia | ||||
| Mortality rate | 268 | 11.6 (10.413.2) | 0.17 (0.42 to 0.07) | 0.35 (1.19 to 0.49) |
| Readmission rate | 268 | 18.2 (17.319.1) | 0.04 (0.20 to 0.11) | 0.56 (1.27 to 0.16) |
Relationship Between Financial Performance and Publicly Reported Outcomes
Acute Myocardial Infarction
We did not observe a consistent relationship between hospital financial performance and AMI mortality and readmission rates. In our overall adjusted analyses, net revenue from operations was not associated with mortality, but was significantly associated with a decrease in AMI readmissions among hospitals with net revenue from operations between approximately $5 million to $145 million (nonlinear relationship, F statistic = 4.8, P 0.001 (Table 2, Figure 1A). However, after excluding 23 extreme outlying hospitals by net revenue from operations (10 underperformers with net revenue $49.4 million and 13 overperformers with net revenue >$52.1 million), this relationship was no longer observed. Using operating margin instead of net revenue from operations as the measure of hospital financial performance, we observed a 0.2% increase in AMI mortality (95% confidence interval [CI]: 0.06%‐0.35%) (see Supporting Table 1 and Supporting Figure 2 in the online version of this article) for each 10% increase in operating margin, which persisted with the exclusion of 5 outlying hospitals by operating margin (all 5 were underperformers, with operating margins 38.6%). However, using total margin as the measure of financial performance, there was no significant relationship with either mortality or readmissions (see Supporting Table 2 and Supporting Figure 3 in the online version of this article).
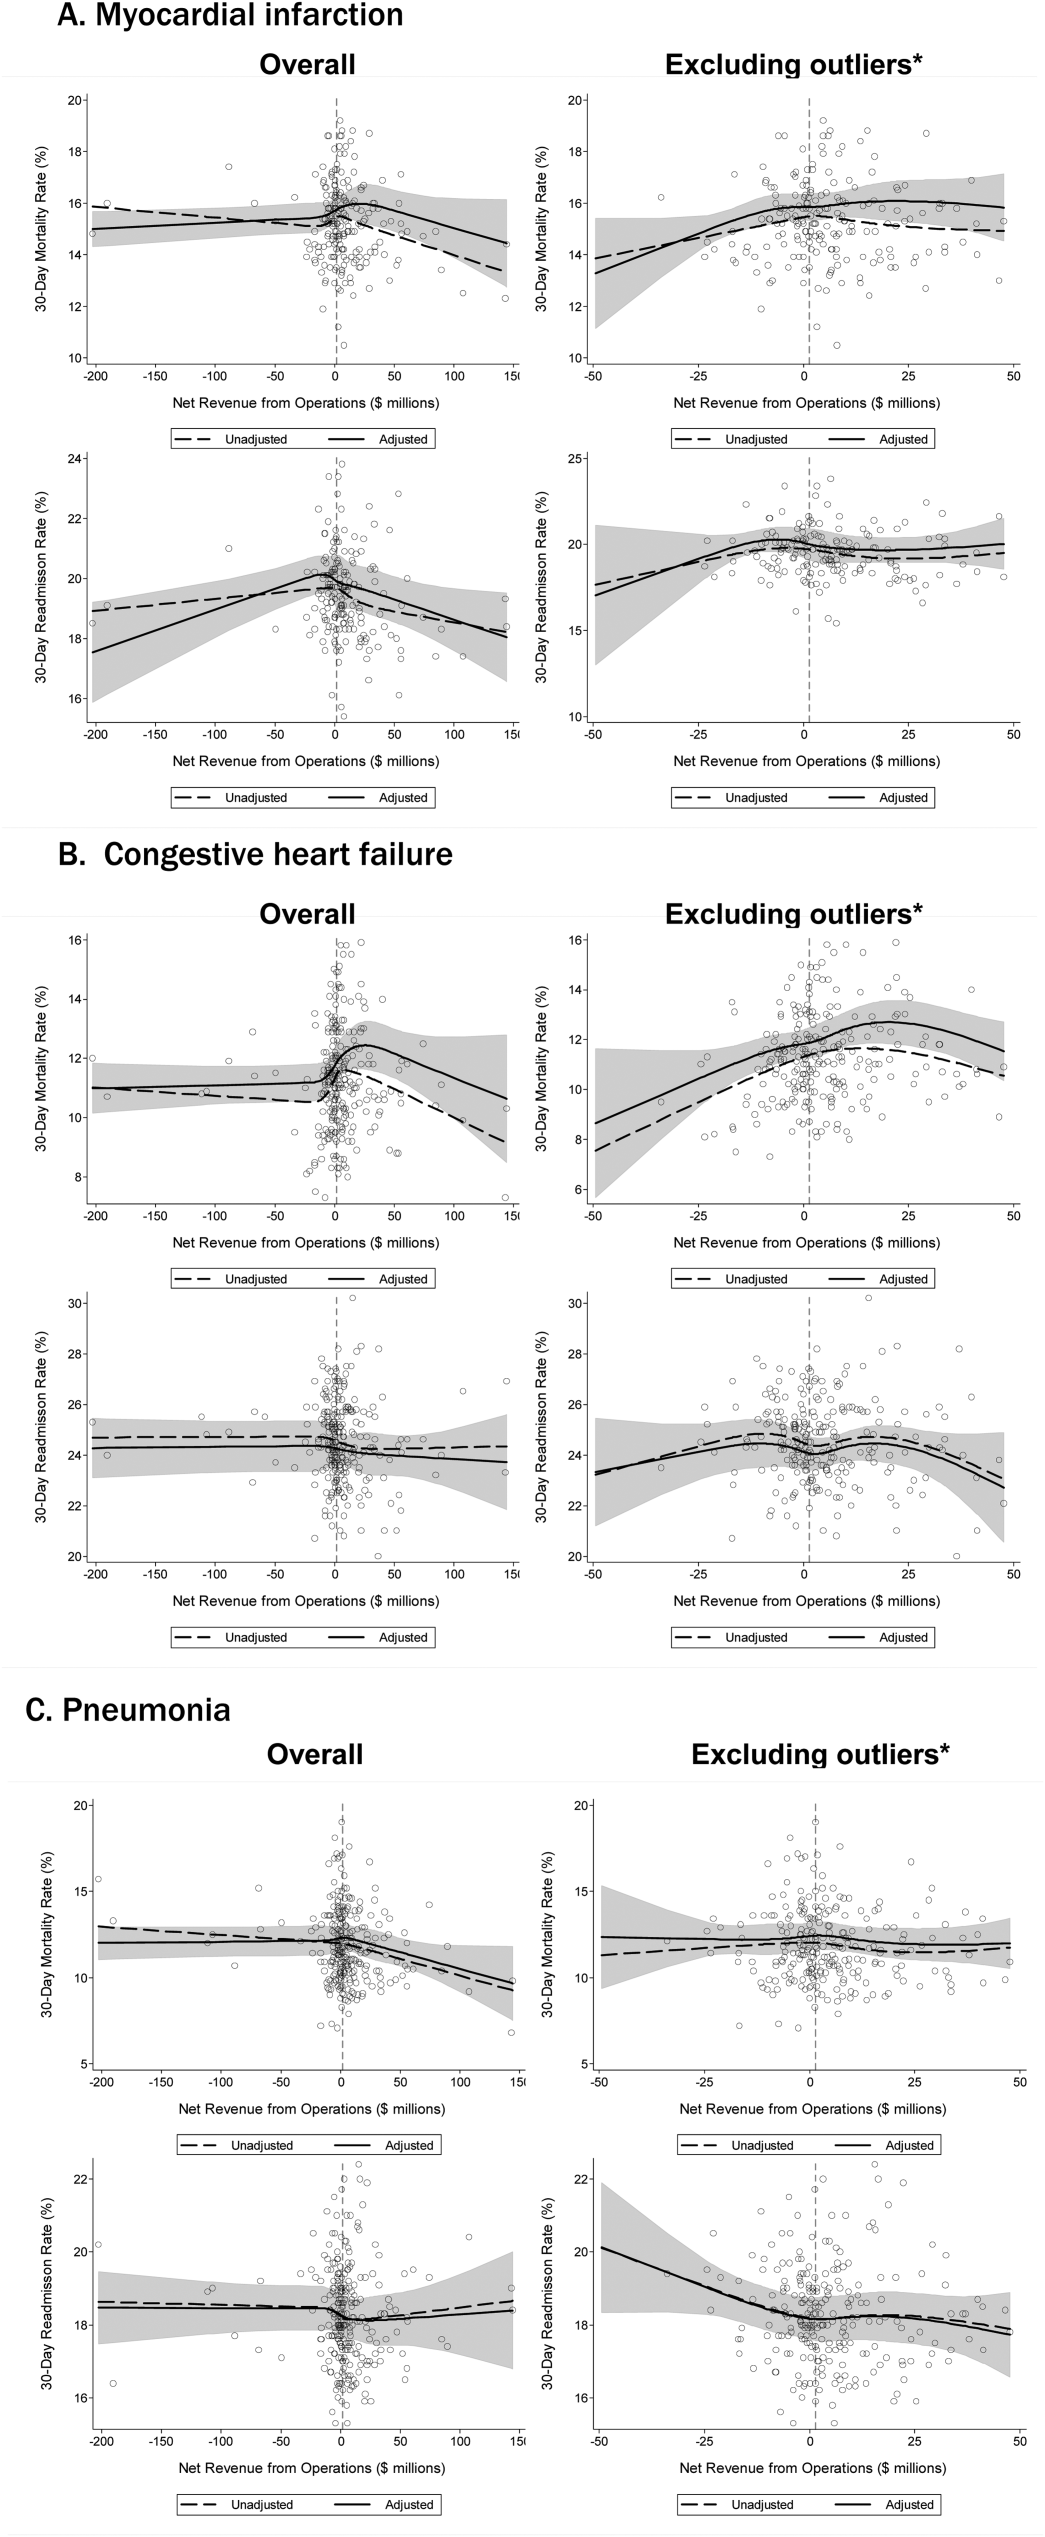
Congestive Heart Failure
In our primary analyses, we did not observe a significant relationship between net revenue from operations and CHF mortality and readmission rates. However, after excluding 23 extreme outliers, increasing net revenue from operations was associated with a modest increase in CHF mortality among hospitals, with net revenue between approximately $35 million and $20 million (nonlinear relationship, F statistic = 3.6, P = 0.008 (Table 2, Figure 1B). Using alternate measures of financial performance, we observed a consistent relationship between increasing hospital financial performance and higher 30‐day CHF mortality rate. Using operating margin, we observed a slight increase in the mortality rate for CHF (0.26% increase in CHF RSMR for every 10% increase in operating margin) (95% CI: 0.07%‐0.45%) (see Supporting Table 1 and Supporting Figure 2 in the online version of this article), which persisted after the exclusion of 5 extreme outliers. Using total margin, we observed a significant but modest association between improved hospital financial performance and increased mortality rate for CHF (nonlinear relationship, F statistic = 2.9, P = 0.03) (see Supporting Table 2 and Supporting Figure 3 in the online version of this article), which persisted after the exclusion of 3 extreme outliers (0.32% increase in CHF RSMR for every 10% increase in total margin) (95% CI: 0.03%‐0.62%).
Pneumonia
Hospital financial performance (using net revenue, operating margin, or total margin) was not associated with 30‐day PNA mortality or readmission rates.
Relationship of Readmission and Mortality Rates on Subsequent Hospital Financial Performance
Compared to hospitals in the highest tertile of readmission and mortality rates (ie, those with the worst rates), hospitals in the lowest tertile of readmission and mortality rates (ie, those with the best rates) had a similar magnitude of increase in net revenue from operations from 2008 to 2012 (Table 3). The difference‐in‐differences analyses showed no relationship between readmission or mortality rates for AMI, CHF, and PNA and changes in net revenue from operations from 2008 to 2012 (difference‐in‐differences estimates ranged from $8.61 to $6.77 million, P > 0.3 for all). These results were robust to the exclusion of hospitals with a change in ownership and extreme outliers by net revenue from operations (data not reported).
| Outcome | Tertile With Highest Outcome Rates (Worst Hospitals) | Tertile With Lowest Outcome Rates (Best Hospitals) | Difference in Net From Operations Differences Between Highest and Lowest Outcome Rate Tertiles, $ Million (95% CI) | P | ||
|---|---|---|---|---|---|---|
| Outcome, Median % (IQR) | Gain/Loss in Net Revenue From Operations From 2008 to 2012, $ Million* | Outcome, Median % (IQR) | Gain/Loss in Net Revenue from Operations From 2008 to 2012, $ Million* | |||
| ||||||
| AMI mortality | 16.7 (16.217.4) | +65.62 | 13.8 (13.314.2) | +74.23 | 8.61 (27.95 to 10.73) | 0.38 |
| AMI readmit | 20.7 (20.321.5) | +38.62 | 18.3 (17.718.6) | +31.85 | +6.77 (13.24 to 26.77) | 0.50 |
| CHF mortality | 13.0 (12.313.9) | +45.66 | 9.6 (8.910.1) | +48.60 | 2.94 (11.61 to 5.73) | 0.50 |
| CHF readmit | 26.2 (25.726.9) | +47.08 | 23.0 (22.323.5) | +46.08 | +0.99 (10.51 to 12.50) | 0.87 |
| PNA mortality | 13.9 (13.314.7) | +43.46 | 9.9 (9.310.4) | +38.28 | +5.18 (7.01 to 17.37) | 0.40 |
| PNA readmit | 19.4 (19.120.1) | +47.21 | 17.0 (16.517.3) | +45.45 | +1.76 (8.34 to 11.86) | 0.73 |
DISCUSSION
Using audited financial data from California hospitals in 2008 and 2012, and CMS data on publicly reported outcomes from 2008 to 2011, we found no consistent relationship between hospital financial performance and publicly reported outcomes for AMI and PNA. However, better hospital financial performance was associated with a modest increase in 30‐day risk‐standardized CHF mortality rates, which was consistent across all 3 measures of hospital financial performance. Reassuringly, there was no difference in the change in net revenue from operations between 2008 and 2012 between hospitals in the highest and lowest tertiles of readmission and mortality rates for AMI, CHF, and PNA. In other words, hospitals with the lowest rates of 30‐day readmissions and mortality for AMI, CHF, and PNA did not experience a loss in net revenue from operations over time, compared to hospitals with the highest readmission and mortality rates.
Our study differs in several important ways from Ly et al., the only other study to our knowledge that investigated the relationship between hospital financial performance and outcomes for patients with AMI, CHF, and PNA.[19] First, outcomes in the Ly et al. study were ascertained in 2007, which preceded public reporting of outcomes. Second, the primary comparison was between hospitals in the bottom versus top decile of operating margin. Although Ly and colleagues also found no association between hospital financial performance and mortality rates for these 3 conditions, they found a significant absolute decrease of approximately 3% in readmission rates among hospitals in the top decile of operating margin versus those in bottom decile. However, readmission rates were comparable among the remaining 80% of hospitals, suggesting that these findings primarily reflected the influence of a few outlier hospitals. Third, the use of nonuniformly audited hospital financial data may have resulted in misclassification of financial performance. Our findings also differ from 2 previous studies that identified a modest association between improved hospital financial performance and decreased adverse patient safety events.[18, 20] However, publicly reported outcomes may not be fully representative of hospital quality and patient safety.[28, 29]
The limited association between hospital financial performance and publicly reported outcomes for AMI and PNA is noteworthy for several reasons. First, publicly reporting outcomes alone without concomitant changes to reimbursement may be inadequate to create strong financial incentives for hospital investment in quality improvement initiatives. Hospitals participating in both public reporting of outcomes and pay‐for‐performance have been shown to achieve greater improvements in outcomes than hospitals engaged only in public reporting.[30] Our time interval for ascertainment of outcomes preceded CMS implementation of the Hospital Readmissions Reduction Program (HRRP) in October 2012, which withholds up to 3% of Medicare hospital reimbursements for higher than expected mortality and readmission rates for AMI, CHF, and PNA. Once outcomes data become available for a 3‐year post‐HRRP implementation period, the impact of this combined approach can be assessed. Second, because adherence to many evidence‐based process measures for these conditions (ie, aspirin use in AMI) is already high, there may be a ceiling effect present that obviates the need for further hospital financial investment to optimize delivery of best practices.[31, 32] Third, hospitals themselves may contribute little to variation in mortality and readmission risk. Of the total variation in mortality and readmission rates among Texas Medicare beneficiaries, only about 1% is attributable to hospitals, whereas 42% to 56% of the variation is explained by differences in patient characteristics.[33, 34] Fourth, there is either low‐quality or insufficient evidence that transitional care interventions specifically targeted to patients with AMI or PNA result in better outcomes.[35] Thus, greater financial investment in hospital‐initiated and postdischarge transitional care interventions for these specific conditions may result in less than the desired effect. Lastly, many hospitalizations for these conditions are emergency hospitalizations that occur after patients present to the emergency department with unexpected and potentially life‐threatening symptoms. Thus, patients may not be able to incorporate the reputation or performance metrics of a hospital in their decisions for where they are hospitalized for AMI, CHF, or PNA despite the public reporting of outcomes.
Given the strong evidence that transitional care interventions reduce readmissions and mortality among patients hospitalized with CHF, we were surprised to find that improved hospital financial performance was associated with an increased risk‐adjusted CHF mortality rate.[36] This association held true for all 3 different measures of hospital financial performance, suggesting that this unexpected finding is unlikely to be the result of statistical chance, though potential reasons for this association remain unclear. One possibility is that the CMS model for CHF mortality may not adequately risk adjust for severity of illness.[37, 38] Thus, robust financial performance may be a marker for hospitals with more advanced heart failure services that care for more patients with severe illness.
Our findings should be interpreted in the context of certain limitations. Our study only included an analysis of outcomes for AMI, CHF, and PNA among older fee‐for‐service Medicare beneficiaries aggregated at the hospital level in California between 2008 and 2012, so generalizability to other populations, conditions, states, and time periods is uncertain. The observational design precludes a robust causal inference between financial performance and outcomes. For readmissions, rates were publicly reported for only the last 2 years of the 3‐year reporting period; thus, our findings may underestimate the association between hospital financial performance and publicly reported readmission rates.
CONCLUSION
There is no consistent relationship between hospital financial performance and subsequent publicly reported outcomes for AMI and PNA. However, for unclear reasons, hospitals with better financial performance had modestly higher CHF mortality rates. Given this limited association, public reporting of outcomes may have had less than the intended impact in motivating hospitals to invest in quality improvement. Additional financial incentives in addition to public reporting, such as readmissions penalties, may help motivate hospitals with robust financial performance to further improve outcomes. This would be a key area for future investigation once outcomes data are available for the 3‐year period following CMS implementation of readmissions penalties in 2012. Reassuringly, there was no association between low 30‐day mortality and readmissions rates and subsequent poor financial performance, suggesting that improved outcomes do not necessarily lead to loss of revenue.
Disclosures
Drs. Nguyen, Halm, and Makam were supported in part by the Agency for Healthcare Research and Quality University of Texas Southwestern Center for Patient‐Centered Outcomes Research (1R24HS022418‐01). Drs. Nguyen and Makam received funding from the University of Texas Southwestern KL2 Scholars Program (NIH/NCATS KL2 TR001103). The study sponsors had no role in design and conduct of the study; collection, management, analysis, and interpretation of the data; and preparation, review, or approval of the manuscript. The authors have no conflicts of interest to disclose.
- Centers for Medicare and Medicaid Services. Office of the Actuary. National Health Statistics Group. National Healthcare Expenditures Data. Baltimore, MD; 2013. https://www.cms.gov/Research-Statistics-Data-and-Systems/Statistics-Trends-and-Reports/NationalHealthExpendData/NationalHealthAccountsHistorical.html. Accessed February 16, 2016.
- . Bitter pill: why medical bills are killing us. Time Magazine. February 20, 2013:16–55.
- . Fee‐for‐service will remain a feature of major payment reforms, requiring more changes in Medicare physician payment. Health Aff (Millwood). 2012;31(9):1977–1983.
- , , , et al. The business case for quality: case studies and an analysis. Health Aff (Millwood). 2003;22(2):17–30.
- , , , . Public reporting on quality in the United States and the United Kingdom. Health Aff (Millwood). 2003;22(3):134–148.
- , , , , . The business case for health‐care quality improvement. J Patient Saf. 2013;9(1):44–52.
- , , . Hospital performance reports: impact on quality, market share, and reputation. Health Aff (Millwood). 2005;24(4):1150–1160.
- , , , . The savings illusion—why clinical quality improvement fails to deliver bottom‐line results. N Engl J Med. 2011;365(26):e48.
- , , , , . Hospital Quality: Ingredients for Success—Overview and Lessons Learned. New York, NY: Commonwealth Fund; 2004.
- , , . Hospital Quality Improvement: Strategies and Lessons from U.S. Hospitals. New York, NY: Commonwealth Fund; 2007.
- , , , et al. Hospital financial condition and operational decisions related to the quality of hospital care. Med Care Res Rev. 2007;64(2):148–168.
- , , , , , . Will pay‐for‐performance and quality reporting affect health care disparities? Health Aff (Millwood). 2007;26(3):w405–w414.
- , , . Comparison of change in quality of care between safety‐net and non‐safety‐net hospitals. JAMA. 2008;299(18):2180–2187.
- , . Could Medicare readmission policy exacerbate health care system inequity? Ann Intern Med. 2010;152(2):114–117.
- , . Minding the gap between efforts to reduce readmissions and disparities. JAMA. 2011;305(7):715–716.
- , . Medicare Health Support Pilot Program. N Engl J Med. 2012;366(7):666; author reply 667–668.
- , . Revisiting hospital readmissions. JAMA. 2013;309(4):398–400.
- , . Hospital finances and patient safety outcomes. Inquiry. 2005;42(1):60–72.
- , , . The association between hospital margins, quality of care, and closure or other change in operating status. J Gen Intern Med. 2011;26(11):1291–1296.
- , , , . Hospital financial condition and the quality of patient care. Health Econ. 2008;17(8):977–995.
- State of California Office of Statewide Health Planning and Development. Healthcare Information Division. Annual financial data. Available at: http://www.oshpd.ca.gov/HID/Products/Hospitals/AnnFinanData/PivotProfles/default.asp. Accessed June 23, 2015.
- Centers for Medicare 4(1):11–13.
- , , , et al. Quality of care for acute myocardial infarction at urban safety‐net hospitals. Health Aff (Millwood). 2007;26(1):238–248.
- , , , et al. The Hospital Compare mortality model and the volume‐outcome relationship. Health Serv Res. 2010;45(5 Pt 1):1148–1167.
- . Exploratory Data Analysis. Boston, MA: Addison‐Wesley; 1977.
- , , , et al. Limits of readmission rates in measuring hospital quality suggest the need for added metrics. Health Aff (Millwood). 2013;32(6):1083–1091.
- , , , et al. Hospital performance measures and 30‐day readmission rates. J Gen Intern Med. 2013;28(3):377–385.
- , , , et al. Public reporting and pay for performance in hospital quality improvement. N Engl J Med. 2007;356(5):486–496.
- , , , et al. Usual source of care and outcomes following acute myocardial infarction. J Gen Intern Med. 2014;29(6):862–869.
- , . Public reporting on hospital process improvements is linked to better patient outcomes. Health Aff (Millwood). 2010;29(7):1319–1324.
- , , , . Variation in length of stay and outcomes among hospitalized patients attributable to hospitals and hospitalists. J Gen Intern Med. 2013;28(3):370–376.
- , , , , . Variation in the risk of readmission among hospitals: the relative contribution of patient, hospital and inpatient provider characteristics. J Gen Intern Med. 2014;29(4):572–578.
- , , , et al. Transitional care after hospitalization for acute stroke or myocardial infarction: a systematic review. Ann Intern Med. 2012;157(6):407–416.
- , , , . The inverse relationship between mortality rates and performance in the Hospital Quality Alliance measures. Health Aff (Millwood). 2007;26(4):1104–1110.
- , , , et al. An automated model to identify heart failure patients at risk for 30‐day readmission or death using electronic medical record data. Med Care. 2010;48(11):981–988.
- , , . Indications of biased risk adjustment in the hospital readmission reduction program. J Ambul Care Manage. 2015;38(1):39–47.
Hospital care accounts for the single largest category of national healthcare expenditures, totaling $936.9 billion in 2013.[1] With ongoing scrutiny of US healthcare spending, hospitals are under increasing pressure to justify high costs and robust profits.[2] However, the dominant fee‐for‐service reimbursement model creates incentives for hospitals to prioritize high volume over high‐quality care to maximize profits.[3] Because hospitals may be reluctant to implement improvements if better quality is not accompanied by better payment or improved financial margins, an approach to stimulate quality improvement among hospitals has been to leverage consumer pressure through required public reporting of selected outcome metrics.[4, 5] Public reporting of outcomes is thought to influence hospital reputation; in turn, reputation affects patient perceptions and influences demand for hospital services, potentially enabling reputable hospitals to command higher prices for services to enhance hospital revenue.[6, 7]
Though improving outcomes is thought to reduce overall healthcare costs, it is unclear whether improving outcomes results in a hospital's financial return on investment.[4, 5, 8] Quality improvement can require substantial upfront investment, requiring that hospitals already have robust financial health to engage in such initiatives.[9, 10] Consequently, instead of stimulating broad efforts in quality improvement, public reporting may exacerbate existing disparities in hospital quality and finances, by rewarding already financially healthy hospitals, and by inadvertently penalizing hospitals without the means to invest in quality improvement.[11, 12, 13, 14, 15] Alternately, because fee‐for‐service remains the dominant reimbursement model for hospitals, loss of revenue through reducing readmissions may outweigh any financial gains from improved public reputation and result in worse overall financial performance, though robust evidence for this concern is lacking.[16, 17]
A small number of existing studies suggest a limited correlation between improved hospital financial performance and improved quality, patient safety, and lower readmission rates.[18, 19, 20] However, these studies had several limitations. They were conducted prior to public reporting of selected outcome metrics by the Centers for Medicare and Medicaid Services (CMS)[18, 19, 20]; used data from the Medicare Cost Report, which is not uniformly audited and thus prone to measurement error[19, 20]; used only relative measures of hospital financial performance (eg, operating margin), which do not capture the absolute amount of revenue potentially available for investment in quality improvement[18, 19]; or compared only hospitals at the extremes of financial performance, potentially exaggerating the magnitude of the relationship between hospital financial performance and quality outcomes.[19]
To address this gap in the literature, we sought to assess whether hospitals with robust financial performance have lower 30‐day risk‐standardized mortality and hospital readmission rates for acute myocardial infarction (AMI), congestive heart failure (CHF), and pneumonia (PNA). Given the concern that hospitals with the lowest mortality and readmission rates may experience a decrease in financial performance due to the lower volume of hospitalizations, we also assessed whether hospitals with the lowest readmission and mortality rates had a differential change in financial performance over time compared to hospitals with the highest rates.
METHODS
Data Sources and Study Population
This was an observational study using audited financial data from the 2008 and 2012 Hospital Annual Financial Data Files from the Office of Statewide Health Planning and Development (OSHPD) in the state of California, merged with data on outcome measures publicly reported by CMS via the Hospital Compare website for July 1, 2008 to June 30, 2011.[21, 22] We included all general acute care hospitals with available OSHPD data in 2008 and at least 1 publicly reported outcome from 2008 to 2011. We excluded hospitals without 1 year of audited financial data for 2008 and hospitals that closed during 2008 to 2011.
Measures of Financial Performance
Because we hypothesized that the absolute amount of revenue generated from clinical operations would influence investment in quality improvement programs more so than relative changes in revenue,[20] we used net revenue from operations (total operating revenue minus total operating expense) as our primary measure of hospital financial performance. We also performed 2 companion analyses using 2 commonly reported relative measures of financial performanceoperating margin (net revenue from operations divided by total operating revenue) and total margin (net total revenue divided by total revenue from all sources). Net revenue from operations for 2008 was adjusted to 2012 US dollars using the chained Consumer Price Index for all urban consumers.
Outcomes
For our primary analysis, the primary outcomes were publicly reported all‐cause 30‐day risk‐standardized mortality rates (RSMR) and readmission rates (RSRR) for AMI, CHF, and PNA aggregated over a 3‐year period. These measures were adjusted for key demographic and clinical characteristics available in Medicare data. CMS began publicly reporting 30‐day RSMR for AMI and CHF in June 2007, RSMR for PNA in June 2008, and RSRR for all 3 conditions in July 2009.[23, 24]
To assess whether public reporting had an effect on subsequent hospital financial performance, we conducted a companion analysis where the primary outcome of interest was change in hospital financial performance over time, using the same definitions of financial performance outlined above. For this companion analysis, publicly reported 30‐day RSMR and RSRR for AMI, CHF, and PNA were assessed as predictors of subsequent financial performance.
Hospital Characteristics
Hospital characteristics were ascertained from the OSHPD data. Safety‐net status was defined as hospitals with an annual Medicaid caseload (number of Medicaid discharges divided by the total number of discharges) 1 standard deviation above the mean Medicaid caseload, as defined in previous studies.[25]
Statistical Analyses
Effect of Baseline Financial Performance on Subsequent Publicly Reported Outcomes
To estimate the relationship between baseline hospital financial performance in 2008 and subsequent RSMR and RSRR for AMI, CHF, and PNA from 2008 to 2011, we used linear regression adjusted for the following hospital characteristics: teaching status, rural location, bed size, safety‐net status, ownership, Medicare caseload, and volume of cases reported for the respective outcome. We accounted for clustering of hospitals by ownership. We adjusted for hospital volume of reported cases for each condition given that the risk‐standardization models used by CMS shrink outcomes for small hospitals to the mean, and therefore do not account for a potential volume‐outcome relationship.[26] We conducted a sensitivity analysis excluding hospitals at the extremes of financial performance, defined as hospitals with extreme outlier values for each financial performance measure (eg, values more than 3 times the interquartile range above the first quartile or below the third quartile).[27] Nonlinearity of financial performance measures was assessed using restricted cubic splines. For ease of interpretation, we scaled the estimated change in RSMR and RSRR per $50 million increase in net revenue from operations, and graphed nonparametric relationships using restricted cubic splines.
Effect of Public Reporting on Subsequent Hospital Financial Performance
To assess whether public reporting had an effect on subsequent hospital financial performance, we conducted a companion hospital‐level difference‐in‐differences analysis to assess for differential changes in hospital financial performance between 2008 and 2012, stratified by tertiles of RSMR and RSRR rates from 2008 to 2011. This approach compares differences in an outcome of interest (hospital financial performance) within each group (where each group is a tertile of publicly reported rates of RSMR or RSRR), and then compares the difference in these differences between groups. Therefore, these analyses use each group as their own historical control and the opposite group as a concurrent control to account for potential secular trends. To conduct our difference‐in‐differences analysis, we compared the change in financial performance over time in the top tertile of hospitals to the change in financial performance over time in the bottom tertile of hospitals with respect to AMI, CHF, and PNA RSMR and RSRR. Our models therefore included year (2008 vs 2012), tertile of publicly reported rates for RSMR or RSRR, and the interaction between them as predictors, where the interaction was the difference‐in‐differences term and the primary predictor of interest. In addition to adjusting for hospital characteristics and accounting for clustering as mentioned above, we also included 3 separate interaction terms for year with bed size, safety‐net status, and Medicare caseload, to account for potential changes in the hospitals over time that may have independently influenced financial performance and publicly reported 30‐day measures. For sensitivity analyses, we repeated our difference‐in‐differences analyses excluding hospitals with a change in ownership and extreme outliers with respect to financial performance in 2008. We performed model diagnostics including assessment of functional form, linearity, normality, constant variance, and model misspecification. All analyses were conducted using Stata version 12.1 (StataCorp, College Station, TX). This study was deemed exempt from review by the UT Southwestern Medical Center institutional review board.
RESULTS
Among the 279 included hospitals (see Supporting Figure 1 in the online version of this article), 278 also had financial data available for 2012. In 2008, the median net revenue from operations was $1.6 million (interquartile range [IQR], $2.4 to $10.3 million), the median operating margin was 1.5% (IQR, 4.6% to 6%), and the median total margin was 2.5% (IQR, 2.2% to 7.5% (Table 1). The number of hospitals reporting each outcome, and median outcome rates, are shown in Table 2.
| 2008, n = 279 | 2012, n = 278 | |
|---|---|---|
| ||
| Hospital characteristics | ||
| Teaching, n (%) | 28 (10.0) | 28 (10.0) |
| Rural, n (%) | 55 (19.7) | 55 (19.7) |
| Bed size, n (%) | ||
| 099 (small) | 57 (20.4) | 55 (19.8) |
| 100299 (medium) | 130 (46.6) | 132 (47.5) |
| 300 (large) | 92 (33.0) | 91 (32.7) |
| Safety‐net hospital, n (%)* | 46 (16.5) | 48 (17.3) |
| Hospital ownership, n (%) | ||
| City or county | 15 (5.4) | 16 (5.8) |
| District | 42 (15.1) | 39 (14.0) |
| Investor | 66 (23.7) | 66 (23.7) |
| Private nonprofit | 156 (55.9) | 157 (56.5) |
| Medicare caseload, mean % (SD) | 41.6 (14.7) | 43.6 (14.7) |
| Financial performance measures | ||
| Net revenue from operations, median $ in millions (IQR; range) | 1.6 (2.4 to 10.3; 495.9 to 144.1) | 3.2 (2.9 to 15.4; 396.2 to 276.8) |
| Operating margin, median % (IQR; range) | 1.5 (4.6 to 6.8; 77.8 to 26.4) | 2.3 (3.9 to 8.2; 134.8 to 21.1) |
| Total margin, median % (IQR; range) | 2.5 (2.2 to 7.5; 101.0 to 26.3) | 4.5 (0.7 to 9.8; 132.2 to 31.1) |
| No. | Median % (IQR) | Adjusted % Change (95% CI) per $50 Million Increase in Net Revenue From Operations | ||
|---|---|---|---|---|
| Overall | Extreme Outliers Excluded | |||
| ||||
| Myocardial infarction | ||||
| Mortality rate | 211 | 15.2 (14.216.2) | 0.07 (0.10 to 0.24) | 0.63 (0.21 to 1.48) |
| Readmission rate | 184 | 19.4 (18.520.2) | Nonlinear | 0.34 (1.17 to 0.50) |
| Congestive heart failure | ||||
| Mortality rate | 259 | 11.1 (10.112.1) | 0.17 (0.01 to 0.35) | Nonlinear∥ |
| Readmission rate | 264 | 24.5 (23.525.6) | 0.07 (0.27 to 0.14) | 0.45 (1.36 to 0.47) |
| Pneumonia | ||||
| Mortality rate | 268 | 11.6 (10.413.2) | 0.17 (0.42 to 0.07) | 0.35 (1.19 to 0.49) |
| Readmission rate | 268 | 18.2 (17.319.1) | 0.04 (0.20 to 0.11) | 0.56 (1.27 to 0.16) |
Relationship Between Financial Performance and Publicly Reported Outcomes
Acute Myocardial Infarction
We did not observe a consistent relationship between hospital financial performance and AMI mortality and readmission rates. In our overall adjusted analyses, net revenue from operations was not associated with mortality, but was significantly associated with a decrease in AMI readmissions among hospitals with net revenue from operations between approximately $5 million to $145 million (nonlinear relationship, F statistic = 4.8, P 0.001 (Table 2, Figure 1A). However, after excluding 23 extreme outlying hospitals by net revenue from operations (10 underperformers with net revenue $49.4 million and 13 overperformers with net revenue >$52.1 million), this relationship was no longer observed. Using operating margin instead of net revenue from operations as the measure of hospital financial performance, we observed a 0.2% increase in AMI mortality (95% confidence interval [CI]: 0.06%‐0.35%) (see Supporting Table 1 and Supporting Figure 2 in the online version of this article) for each 10% increase in operating margin, which persisted with the exclusion of 5 outlying hospitals by operating margin (all 5 were underperformers, with operating margins 38.6%). However, using total margin as the measure of financial performance, there was no significant relationship with either mortality or readmissions (see Supporting Table 2 and Supporting Figure 3 in the online version of this article).
Congestive Heart Failure
In our primary analyses, we did not observe a significant relationship between net revenue from operations and CHF mortality and readmission rates. However, after excluding 23 extreme outliers, increasing net revenue from operations was associated with a modest increase in CHF mortality among hospitals, with net revenue between approximately $35 million and $20 million (nonlinear relationship, F statistic = 3.6, P = 0.008 (Table 2, Figure 1B). Using alternate measures of financial performance, we observed a consistent relationship between increasing hospital financial performance and higher 30‐day CHF mortality rate. Using operating margin, we observed a slight increase in the mortality rate for CHF (0.26% increase in CHF RSMR for every 10% increase in operating margin) (95% CI: 0.07%‐0.45%) (see Supporting Table 1 and Supporting Figure 2 in the online version of this article), which persisted after the exclusion of 5 extreme outliers. Using total margin, we observed a significant but modest association between improved hospital financial performance and increased mortality rate for CHF (nonlinear relationship, F statistic = 2.9, P = 0.03) (see Supporting Table 2 and Supporting Figure 3 in the online version of this article), which persisted after the exclusion of 3 extreme outliers (0.32% increase in CHF RSMR for every 10% increase in total margin) (95% CI: 0.03%‐0.62%).
Pneumonia
Hospital financial performance (using net revenue, operating margin, or total margin) was not associated with 30‐day PNA mortality or readmission rates.
Relationship of Readmission and Mortality Rates on Subsequent Hospital Financial Performance
Compared to hospitals in the highest tertile of readmission and mortality rates (ie, those with the worst rates), hospitals in the lowest tertile of readmission and mortality rates (ie, those with the best rates) had a similar magnitude of increase in net revenue from operations from 2008 to 2012 (Table 3). The difference‐in‐differences analyses showed no relationship between readmission or mortality rates for AMI, CHF, and PNA and changes in net revenue from operations from 2008 to 2012 (difference‐in‐differences estimates ranged from $8.61 to $6.77 million, P > 0.3 for all). These results were robust to the exclusion of hospitals with a change in ownership and extreme outliers by net revenue from operations (data not reported).
| Outcome | Tertile With Highest Outcome Rates (Worst Hospitals) | Tertile With Lowest Outcome Rates (Best Hospitals) | Difference in Net From Operations Differences Between Highest and Lowest Outcome Rate Tertiles, $ Million (95% CI) | P | ||
|---|---|---|---|---|---|---|
| Outcome, Median % (IQR) | Gain/Loss in Net Revenue From Operations From 2008 to 2012, $ Million* | Outcome, Median % (IQR) | Gain/Loss in Net Revenue from Operations From 2008 to 2012, $ Million* | |||
| ||||||
| AMI mortality | 16.7 (16.217.4) | +65.62 | 13.8 (13.314.2) | +74.23 | 8.61 (27.95 to 10.73) | 0.38 |
| AMI readmit | 20.7 (20.321.5) | +38.62 | 18.3 (17.718.6) | +31.85 | +6.77 (13.24 to 26.77) | 0.50 |
| CHF mortality | 13.0 (12.313.9) | +45.66 | 9.6 (8.910.1) | +48.60 | 2.94 (11.61 to 5.73) | 0.50 |
| CHF readmit | 26.2 (25.726.9) | +47.08 | 23.0 (22.323.5) | +46.08 | +0.99 (10.51 to 12.50) | 0.87 |
| PNA mortality | 13.9 (13.314.7) | +43.46 | 9.9 (9.310.4) | +38.28 | +5.18 (7.01 to 17.37) | 0.40 |
| PNA readmit | 19.4 (19.120.1) | +47.21 | 17.0 (16.517.3) | +45.45 | +1.76 (8.34 to 11.86) | 0.73 |
DISCUSSION
Using audited financial data from California hospitals in 2008 and 2012, and CMS data on publicly reported outcomes from 2008 to 2011, we found no consistent relationship between hospital financial performance and publicly reported outcomes for AMI and PNA. However, better hospital financial performance was associated with a modest increase in 30‐day risk‐standardized CHF mortality rates, which was consistent across all 3 measures of hospital financial performance. Reassuringly, there was no difference in the change in net revenue from operations between 2008 and 2012 between hospitals in the highest and lowest tertiles of readmission and mortality rates for AMI, CHF, and PNA. In other words, hospitals with the lowest rates of 30‐day readmissions and mortality for AMI, CHF, and PNA did not experience a loss in net revenue from operations over time, compared to hospitals with the highest readmission and mortality rates.
Our study differs in several important ways from Ly et al., the only other study to our knowledge that investigated the relationship between hospital financial performance and outcomes for patients with AMI, CHF, and PNA.[19] First, outcomes in the Ly et al. study were ascertained in 2007, which preceded public reporting of outcomes. Second, the primary comparison was between hospitals in the bottom versus top decile of operating margin. Although Ly and colleagues also found no association between hospital financial performance and mortality rates for these 3 conditions, they found a significant absolute decrease of approximately 3% in readmission rates among hospitals in the top decile of operating margin versus those in bottom decile. However, readmission rates were comparable among the remaining 80% of hospitals, suggesting that these findings primarily reflected the influence of a few outlier hospitals. Third, the use of nonuniformly audited hospital financial data may have resulted in misclassification of financial performance. Our findings also differ from 2 previous studies that identified a modest association between improved hospital financial performance and decreased adverse patient safety events.[18, 20] However, publicly reported outcomes may not be fully representative of hospital quality and patient safety.[28, 29]
The limited association between hospital financial performance and publicly reported outcomes for AMI and PNA is noteworthy for several reasons. First, publicly reporting outcomes alone without concomitant changes to reimbursement may be inadequate to create strong financial incentives for hospital investment in quality improvement initiatives. Hospitals participating in both public reporting of outcomes and pay‐for‐performance have been shown to achieve greater improvements in outcomes than hospitals engaged only in public reporting.[30] Our time interval for ascertainment of outcomes preceded CMS implementation of the Hospital Readmissions Reduction Program (HRRP) in October 2012, which withholds up to 3% of Medicare hospital reimbursements for higher than expected mortality and readmission rates for AMI, CHF, and PNA. Once outcomes data become available for a 3‐year post‐HRRP implementation period, the impact of this combined approach can be assessed. Second, because adherence to many evidence‐based process measures for these conditions (ie, aspirin use in AMI) is already high, there may be a ceiling effect present that obviates the need for further hospital financial investment to optimize delivery of best practices.[31, 32] Third, hospitals themselves may contribute little to variation in mortality and readmission risk. Of the total variation in mortality and readmission rates among Texas Medicare beneficiaries, only about 1% is attributable to hospitals, whereas 42% to 56% of the variation is explained by differences in patient characteristics.[33, 34] Fourth, there is either low‐quality or insufficient evidence that transitional care interventions specifically targeted to patients with AMI or PNA result in better outcomes.[35] Thus, greater financial investment in hospital‐initiated and postdischarge transitional care interventions for these specific conditions may result in less than the desired effect. Lastly, many hospitalizations for these conditions are emergency hospitalizations that occur after patients present to the emergency department with unexpected and potentially life‐threatening symptoms. Thus, patients may not be able to incorporate the reputation or performance metrics of a hospital in their decisions for where they are hospitalized for AMI, CHF, or PNA despite the public reporting of outcomes.
Given the strong evidence that transitional care interventions reduce readmissions and mortality among patients hospitalized with CHF, we were surprised to find that improved hospital financial performance was associated with an increased risk‐adjusted CHF mortality rate.[36] This association held true for all 3 different measures of hospital financial performance, suggesting that this unexpected finding is unlikely to be the result of statistical chance, though potential reasons for this association remain unclear. One possibility is that the CMS model for CHF mortality may not adequately risk adjust for severity of illness.[37, 38] Thus, robust financial performance may be a marker for hospitals with more advanced heart failure services that care for more patients with severe illness.
Our findings should be interpreted in the context of certain limitations. Our study only included an analysis of outcomes for AMI, CHF, and PNA among older fee‐for‐service Medicare beneficiaries aggregated at the hospital level in California between 2008 and 2012, so generalizability to other populations, conditions, states, and time periods is uncertain. The observational design precludes a robust causal inference between financial performance and outcomes. For readmissions, rates were publicly reported for only the last 2 years of the 3‐year reporting period; thus, our findings may underestimate the association between hospital financial performance and publicly reported readmission rates.
CONCLUSION
There is no consistent relationship between hospital financial performance and subsequent publicly reported outcomes for AMI and PNA. However, for unclear reasons, hospitals with better financial performance had modestly higher CHF mortality rates. Given this limited association, public reporting of outcomes may have had less than the intended impact in motivating hospitals to invest in quality improvement. Additional financial incentives in addition to public reporting, such as readmissions penalties, may help motivate hospitals with robust financial performance to further improve outcomes. This would be a key area for future investigation once outcomes data are available for the 3‐year period following CMS implementation of readmissions penalties in 2012. Reassuringly, there was no association between low 30‐day mortality and readmissions rates and subsequent poor financial performance, suggesting that improved outcomes do not necessarily lead to loss of revenue.
Disclosures
Drs. Nguyen, Halm, and Makam were supported in part by the Agency for Healthcare Research and Quality University of Texas Southwestern Center for Patient‐Centered Outcomes Research (1R24HS022418‐01). Drs. Nguyen and Makam received funding from the University of Texas Southwestern KL2 Scholars Program (NIH/NCATS KL2 TR001103). The study sponsors had no role in design and conduct of the study; collection, management, analysis, and interpretation of the data; and preparation, review, or approval of the manuscript. The authors have no conflicts of interest to disclose.
Hospital care accounts for the single largest category of national healthcare expenditures, totaling $936.9 billion in 2013.[1] With ongoing scrutiny of US healthcare spending, hospitals are under increasing pressure to justify high costs and robust profits.[2] However, the dominant fee‐for‐service reimbursement model creates incentives for hospitals to prioritize high volume over high‐quality care to maximize profits.[3] Because hospitals may be reluctant to implement improvements if better quality is not accompanied by better payment or improved financial margins, an approach to stimulate quality improvement among hospitals has been to leverage consumer pressure through required public reporting of selected outcome metrics.[4, 5] Public reporting of outcomes is thought to influence hospital reputation; in turn, reputation affects patient perceptions and influences demand for hospital services, potentially enabling reputable hospitals to command higher prices for services to enhance hospital revenue.[6, 7]
Though improving outcomes is thought to reduce overall healthcare costs, it is unclear whether improving outcomes results in a hospital's financial return on investment.[4, 5, 8] Quality improvement can require substantial upfront investment, requiring that hospitals already have robust financial health to engage in such initiatives.[9, 10] Consequently, instead of stimulating broad efforts in quality improvement, public reporting may exacerbate existing disparities in hospital quality and finances, by rewarding already financially healthy hospitals, and by inadvertently penalizing hospitals without the means to invest in quality improvement.[11, 12, 13, 14, 15] Alternately, because fee‐for‐service remains the dominant reimbursement model for hospitals, loss of revenue through reducing readmissions may outweigh any financial gains from improved public reputation and result in worse overall financial performance, though robust evidence for this concern is lacking.[16, 17]
A small number of existing studies suggest a limited correlation between improved hospital financial performance and improved quality, patient safety, and lower readmission rates.[18, 19, 20] However, these studies had several limitations. They were conducted prior to public reporting of selected outcome metrics by the Centers for Medicare and Medicaid Services (CMS)[18, 19, 20]; used data from the Medicare Cost Report, which is not uniformly audited and thus prone to measurement error[19, 20]; used only relative measures of hospital financial performance (eg, operating margin), which do not capture the absolute amount of revenue potentially available for investment in quality improvement[18, 19]; or compared only hospitals at the extremes of financial performance, potentially exaggerating the magnitude of the relationship between hospital financial performance and quality outcomes.[19]
To address this gap in the literature, we sought to assess whether hospitals with robust financial performance have lower 30‐day risk‐standardized mortality and hospital readmission rates for acute myocardial infarction (AMI), congestive heart failure (CHF), and pneumonia (PNA). Given the concern that hospitals with the lowest mortality and readmission rates may experience a decrease in financial performance due to the lower volume of hospitalizations, we also assessed whether hospitals with the lowest readmission and mortality rates had a differential change in financial performance over time compared to hospitals with the highest rates.
METHODS
Data Sources and Study Population
This was an observational study using audited financial data from the 2008 and 2012 Hospital Annual Financial Data Files from the Office of Statewide Health Planning and Development (OSHPD) in the state of California, merged with data on outcome measures publicly reported by CMS via the Hospital Compare website for July 1, 2008 to June 30, 2011.[21, 22] We included all general acute care hospitals with available OSHPD data in 2008 and at least 1 publicly reported outcome from 2008 to 2011. We excluded hospitals without 1 year of audited financial data for 2008 and hospitals that closed during 2008 to 2011.
Measures of Financial Performance
Because we hypothesized that the absolute amount of revenue generated from clinical operations would influence investment in quality improvement programs more so than relative changes in revenue,[20] we used net revenue from operations (total operating revenue minus total operating expense) as our primary measure of hospital financial performance. We also performed 2 companion analyses using 2 commonly reported relative measures of financial performanceoperating margin (net revenue from operations divided by total operating revenue) and total margin (net total revenue divided by total revenue from all sources). Net revenue from operations for 2008 was adjusted to 2012 US dollars using the chained Consumer Price Index for all urban consumers.
Outcomes
For our primary analysis, the primary outcomes were publicly reported all‐cause 30‐day risk‐standardized mortality rates (RSMR) and readmission rates (RSRR) for AMI, CHF, and PNA aggregated over a 3‐year period. These measures were adjusted for key demographic and clinical characteristics available in Medicare data. CMS began publicly reporting 30‐day RSMR for AMI and CHF in June 2007, RSMR for PNA in June 2008, and RSRR for all 3 conditions in July 2009.[23, 24]
To assess whether public reporting had an effect on subsequent hospital financial performance, we conducted a companion analysis where the primary outcome of interest was change in hospital financial performance over time, using the same definitions of financial performance outlined above. For this companion analysis, publicly reported 30‐day RSMR and RSRR for AMI, CHF, and PNA were assessed as predictors of subsequent financial performance.
Hospital Characteristics
Hospital characteristics were ascertained from the OSHPD data. Safety‐net status was defined as hospitals with an annual Medicaid caseload (number of Medicaid discharges divided by the total number of discharges) 1 standard deviation above the mean Medicaid caseload, as defined in previous studies.[25]
Statistical Analyses
Effect of Baseline Financial Performance on Subsequent Publicly Reported Outcomes
To estimate the relationship between baseline hospital financial performance in 2008 and subsequent RSMR and RSRR for AMI, CHF, and PNA from 2008 to 2011, we used linear regression adjusted for the following hospital characteristics: teaching status, rural location, bed size, safety‐net status, ownership, Medicare caseload, and volume of cases reported for the respective outcome. We accounted for clustering of hospitals by ownership. We adjusted for hospital volume of reported cases for each condition given that the risk‐standardization models used by CMS shrink outcomes for small hospitals to the mean, and therefore do not account for a potential volume‐outcome relationship.[26] We conducted a sensitivity analysis excluding hospitals at the extremes of financial performance, defined as hospitals with extreme outlier values for each financial performance measure (eg, values more than 3 times the interquartile range above the first quartile or below the third quartile).[27] Nonlinearity of financial performance measures was assessed using restricted cubic splines. For ease of interpretation, we scaled the estimated change in RSMR and RSRR per $50 million increase in net revenue from operations, and graphed nonparametric relationships using restricted cubic splines.
Effect of Public Reporting on Subsequent Hospital Financial Performance
To assess whether public reporting had an effect on subsequent hospital financial performance, we conducted a companion hospital‐level difference‐in‐differences analysis to assess for differential changes in hospital financial performance between 2008 and 2012, stratified by tertiles of RSMR and RSRR rates from 2008 to 2011. This approach compares differences in an outcome of interest (hospital financial performance) within each group (where each group is a tertile of publicly reported rates of RSMR or RSRR), and then compares the difference in these differences between groups. Therefore, these analyses use each group as their own historical control and the opposite group as a concurrent control to account for potential secular trends. To conduct our difference‐in‐differences analysis, we compared the change in financial performance over time in the top tertile of hospitals to the change in financial performance over time in the bottom tertile of hospitals with respect to AMI, CHF, and PNA RSMR and RSRR. Our models therefore included year (2008 vs 2012), tertile of publicly reported rates for RSMR or RSRR, and the interaction between them as predictors, where the interaction was the difference‐in‐differences term and the primary predictor of interest. In addition to adjusting for hospital characteristics and accounting for clustering as mentioned above, we also included 3 separate interaction terms for year with bed size, safety‐net status, and Medicare caseload, to account for potential changes in the hospitals over time that may have independently influenced financial performance and publicly reported 30‐day measures. For sensitivity analyses, we repeated our difference‐in‐differences analyses excluding hospitals with a change in ownership and extreme outliers with respect to financial performance in 2008. We performed model diagnostics including assessment of functional form, linearity, normality, constant variance, and model misspecification. All analyses were conducted using Stata version 12.1 (StataCorp, College Station, TX). This study was deemed exempt from review by the UT Southwestern Medical Center institutional review board.
RESULTS
Among the 279 included hospitals (see Supporting Figure 1 in the online version of this article), 278 also had financial data available for 2012. In 2008, the median net revenue from operations was $1.6 million (interquartile range [IQR], $2.4 to $10.3 million), the median operating margin was 1.5% (IQR, 4.6% to 6%), and the median total margin was 2.5% (IQR, 2.2% to 7.5% (Table 1). The number of hospitals reporting each outcome, and median outcome rates, are shown in Table 2.
| 2008, n = 279 | 2012, n = 278 | |
|---|---|---|
| ||
| Hospital characteristics | ||
| Teaching, n (%) | 28 (10.0) | 28 (10.0) |
| Rural, n (%) | 55 (19.7) | 55 (19.7) |
| Bed size, n (%) | ||
| 099 (small) | 57 (20.4) | 55 (19.8) |
| 100299 (medium) | 130 (46.6) | 132 (47.5) |
| 300 (large) | 92 (33.0) | 91 (32.7) |
| Safety‐net hospital, n (%)* | 46 (16.5) | 48 (17.3) |
| Hospital ownership, n (%) | ||
| City or county | 15 (5.4) | 16 (5.8) |
| District | 42 (15.1) | 39 (14.0) |
| Investor | 66 (23.7) | 66 (23.7) |
| Private nonprofit | 156 (55.9) | 157 (56.5) |
| Medicare caseload, mean % (SD) | 41.6 (14.7) | 43.6 (14.7) |
| Financial performance measures | ||
| Net revenue from operations, median $ in millions (IQR; range) | 1.6 (2.4 to 10.3; 495.9 to 144.1) | 3.2 (2.9 to 15.4; 396.2 to 276.8) |
| Operating margin, median % (IQR; range) | 1.5 (4.6 to 6.8; 77.8 to 26.4) | 2.3 (3.9 to 8.2; 134.8 to 21.1) |
| Total margin, median % (IQR; range) | 2.5 (2.2 to 7.5; 101.0 to 26.3) | 4.5 (0.7 to 9.8; 132.2 to 31.1) |
| No. | Median % (IQR) | Adjusted % Change (95% CI) per $50 Million Increase in Net Revenue From Operations | ||
|---|---|---|---|---|
| Overall | Extreme Outliers Excluded | |||
| ||||
| Myocardial infarction | ||||
| Mortality rate | 211 | 15.2 (14.216.2) | 0.07 (0.10 to 0.24) | 0.63 (0.21 to 1.48) |
| Readmission rate | 184 | 19.4 (18.520.2) | Nonlinear | 0.34 (1.17 to 0.50) |
| Congestive heart failure | ||||
| Mortality rate | 259 | 11.1 (10.112.1) | 0.17 (0.01 to 0.35) | Nonlinear∥ |
| Readmission rate | 264 | 24.5 (23.525.6) | 0.07 (0.27 to 0.14) | 0.45 (1.36 to 0.47) |
| Pneumonia | ||||
| Mortality rate | 268 | 11.6 (10.413.2) | 0.17 (0.42 to 0.07) | 0.35 (1.19 to 0.49) |
| Readmission rate | 268 | 18.2 (17.319.1) | 0.04 (0.20 to 0.11) | 0.56 (1.27 to 0.16) |
Relationship Between Financial Performance and Publicly Reported Outcomes
Acute Myocardial Infarction
We did not observe a consistent relationship between hospital financial performance and AMI mortality and readmission rates. In our overall adjusted analyses, net revenue from operations was not associated with mortality, but was significantly associated with a decrease in AMI readmissions among hospitals with net revenue from operations between approximately $5 million to $145 million (nonlinear relationship, F statistic = 4.8, P 0.001 (Table 2, Figure 1A). However, after excluding 23 extreme outlying hospitals by net revenue from operations (10 underperformers with net revenue $49.4 million and 13 overperformers with net revenue >$52.1 million), this relationship was no longer observed. Using operating margin instead of net revenue from operations as the measure of hospital financial performance, we observed a 0.2% increase in AMI mortality (95% confidence interval [CI]: 0.06%‐0.35%) (see Supporting Table 1 and Supporting Figure 2 in the online version of this article) for each 10% increase in operating margin, which persisted with the exclusion of 5 outlying hospitals by operating margin (all 5 were underperformers, with operating margins 38.6%). However, using total margin as the measure of financial performance, there was no significant relationship with either mortality or readmissions (see Supporting Table 2 and Supporting Figure 3 in the online version of this article).
Congestive Heart Failure
In our primary analyses, we did not observe a significant relationship between net revenue from operations and CHF mortality and readmission rates. However, after excluding 23 extreme outliers, increasing net revenue from operations was associated with a modest increase in CHF mortality among hospitals, with net revenue between approximately $35 million and $20 million (nonlinear relationship, F statistic = 3.6, P = 0.008 (Table 2, Figure 1B). Using alternate measures of financial performance, we observed a consistent relationship between increasing hospital financial performance and higher 30‐day CHF mortality rate. Using operating margin, we observed a slight increase in the mortality rate for CHF (0.26% increase in CHF RSMR for every 10% increase in operating margin) (95% CI: 0.07%‐0.45%) (see Supporting Table 1 and Supporting Figure 2 in the online version of this article), which persisted after the exclusion of 5 extreme outliers. Using total margin, we observed a significant but modest association between improved hospital financial performance and increased mortality rate for CHF (nonlinear relationship, F statistic = 2.9, P = 0.03) (see Supporting Table 2 and Supporting Figure 3 in the online version of this article), which persisted after the exclusion of 3 extreme outliers (0.32% increase in CHF RSMR for every 10% increase in total margin) (95% CI: 0.03%‐0.62%).
Pneumonia
Hospital financial performance (using net revenue, operating margin, or total margin) was not associated with 30‐day PNA mortality or readmission rates.
Relationship of Readmission and Mortality Rates on Subsequent Hospital Financial Performance
Compared to hospitals in the highest tertile of readmission and mortality rates (ie, those with the worst rates), hospitals in the lowest tertile of readmission and mortality rates (ie, those with the best rates) had a similar magnitude of increase in net revenue from operations from 2008 to 2012 (Table 3). The difference‐in‐differences analyses showed no relationship between readmission or mortality rates for AMI, CHF, and PNA and changes in net revenue from operations from 2008 to 2012 (difference‐in‐differences estimates ranged from $8.61 to $6.77 million, P > 0.3 for all). These results were robust to the exclusion of hospitals with a change in ownership and extreme outliers by net revenue from operations (data not reported).
| Outcome | Tertile With Highest Outcome Rates (Worst Hospitals) | Tertile With Lowest Outcome Rates (Best Hospitals) | Difference in Net From Operations Differences Between Highest and Lowest Outcome Rate Tertiles, $ Million (95% CI) | P | ||
|---|---|---|---|---|---|---|
| Outcome, Median % (IQR) | Gain/Loss in Net Revenue From Operations From 2008 to 2012, $ Million* | Outcome, Median % (IQR) | Gain/Loss in Net Revenue from Operations From 2008 to 2012, $ Million* | |||
| ||||||
| AMI mortality | 16.7 (16.217.4) | +65.62 | 13.8 (13.314.2) | +74.23 | 8.61 (27.95 to 10.73) | 0.38 |
| AMI readmit | 20.7 (20.321.5) | +38.62 | 18.3 (17.718.6) | +31.85 | +6.77 (13.24 to 26.77) | 0.50 |
| CHF mortality | 13.0 (12.313.9) | +45.66 | 9.6 (8.910.1) | +48.60 | 2.94 (11.61 to 5.73) | 0.50 |
| CHF readmit | 26.2 (25.726.9) | +47.08 | 23.0 (22.323.5) | +46.08 | +0.99 (10.51 to 12.50) | 0.87 |
| PNA mortality | 13.9 (13.314.7) | +43.46 | 9.9 (9.310.4) | +38.28 | +5.18 (7.01 to 17.37) | 0.40 |
| PNA readmit | 19.4 (19.120.1) | +47.21 | 17.0 (16.517.3) | +45.45 | +1.76 (8.34 to 11.86) | 0.73 |
DISCUSSION
Using audited financial data from California hospitals in 2008 and 2012, and CMS data on publicly reported outcomes from 2008 to 2011, we found no consistent relationship between hospital financial performance and publicly reported outcomes for AMI and PNA. However, better hospital financial performance was associated with a modest increase in 30‐day risk‐standardized CHF mortality rates, which was consistent across all 3 measures of hospital financial performance. Reassuringly, there was no difference in the change in net revenue from operations between 2008 and 2012 between hospitals in the highest and lowest tertiles of readmission and mortality rates for AMI, CHF, and PNA. In other words, hospitals with the lowest rates of 30‐day readmissions and mortality for AMI, CHF, and PNA did not experience a loss in net revenue from operations over time, compared to hospitals with the highest readmission and mortality rates.
Our study differs in several important ways from Ly et al., the only other study to our knowledge that investigated the relationship between hospital financial performance and outcomes for patients with AMI, CHF, and PNA.[19] First, outcomes in the Ly et al. study were ascertained in 2007, which preceded public reporting of outcomes. Second, the primary comparison was between hospitals in the bottom versus top decile of operating margin. Although Ly and colleagues also found no association between hospital financial performance and mortality rates for these 3 conditions, they found a significant absolute decrease of approximately 3% in readmission rates among hospitals in the top decile of operating margin versus those in bottom decile. However, readmission rates were comparable among the remaining 80% of hospitals, suggesting that these findings primarily reflected the influence of a few outlier hospitals. Third, the use of nonuniformly audited hospital financial data may have resulted in misclassification of financial performance. Our findings also differ from 2 previous studies that identified a modest association between improved hospital financial performance and decreased adverse patient safety events.[18, 20] However, publicly reported outcomes may not be fully representative of hospital quality and patient safety.[28, 29]
The limited association between hospital financial performance and publicly reported outcomes for AMI and PNA is noteworthy for several reasons. First, publicly reporting outcomes alone without concomitant changes to reimbursement may be inadequate to create strong financial incentives for hospital investment in quality improvement initiatives. Hospitals participating in both public reporting of outcomes and pay‐for‐performance have been shown to achieve greater improvements in outcomes than hospitals engaged only in public reporting.[30] Our time interval for ascertainment of outcomes preceded CMS implementation of the Hospital Readmissions Reduction Program (HRRP) in October 2012, which withholds up to 3% of Medicare hospital reimbursements for higher than expected mortality and readmission rates for AMI, CHF, and PNA. Once outcomes data become available for a 3‐year post‐HRRP implementation period, the impact of this combined approach can be assessed. Second, because adherence to many evidence‐based process measures for these conditions (ie, aspirin use in AMI) is already high, there may be a ceiling effect present that obviates the need for further hospital financial investment to optimize delivery of best practices.[31, 32] Third, hospitals themselves may contribute little to variation in mortality and readmission risk. Of the total variation in mortality and readmission rates among Texas Medicare beneficiaries, only about 1% is attributable to hospitals, whereas 42% to 56% of the variation is explained by differences in patient characteristics.[33, 34] Fourth, there is either low‐quality or insufficient evidence that transitional care interventions specifically targeted to patients with AMI or PNA result in better outcomes.[35] Thus, greater financial investment in hospital‐initiated and postdischarge transitional care interventions for these specific conditions may result in less than the desired effect. Lastly, many hospitalizations for these conditions are emergency hospitalizations that occur after patients present to the emergency department with unexpected and potentially life‐threatening symptoms. Thus, patients may not be able to incorporate the reputation or performance metrics of a hospital in their decisions for where they are hospitalized for AMI, CHF, or PNA despite the public reporting of outcomes.
Given the strong evidence that transitional care interventions reduce readmissions and mortality among patients hospitalized with CHF, we were surprised to find that improved hospital financial performance was associated with an increased risk‐adjusted CHF mortality rate.[36] This association held true for all 3 different measures of hospital financial performance, suggesting that this unexpected finding is unlikely to be the result of statistical chance, though potential reasons for this association remain unclear. One possibility is that the CMS model for CHF mortality may not adequately risk adjust for severity of illness.[37, 38] Thus, robust financial performance may be a marker for hospitals with more advanced heart failure services that care for more patients with severe illness.
Our findings should be interpreted in the context of certain limitations. Our study only included an analysis of outcomes for AMI, CHF, and PNA among older fee‐for‐service Medicare beneficiaries aggregated at the hospital level in California between 2008 and 2012, so generalizability to other populations, conditions, states, and time periods is uncertain. The observational design precludes a robust causal inference between financial performance and outcomes. For readmissions, rates were publicly reported for only the last 2 years of the 3‐year reporting period; thus, our findings may underestimate the association between hospital financial performance and publicly reported readmission rates.
CONCLUSION
There is no consistent relationship between hospital financial performance and subsequent publicly reported outcomes for AMI and PNA. However, for unclear reasons, hospitals with better financial performance had modestly higher CHF mortality rates. Given this limited association, public reporting of outcomes may have had less than the intended impact in motivating hospitals to invest in quality improvement. Additional financial incentives in addition to public reporting, such as readmissions penalties, may help motivate hospitals with robust financial performance to further improve outcomes. This would be a key area for future investigation once outcomes data are available for the 3‐year period following CMS implementation of readmissions penalties in 2012. Reassuringly, there was no association between low 30‐day mortality and readmissions rates and subsequent poor financial performance, suggesting that improved outcomes do not necessarily lead to loss of revenue.
Disclosures
Drs. Nguyen, Halm, and Makam were supported in part by the Agency for Healthcare Research and Quality University of Texas Southwestern Center for Patient‐Centered Outcomes Research (1R24HS022418‐01). Drs. Nguyen and Makam received funding from the University of Texas Southwestern KL2 Scholars Program (NIH/NCATS KL2 TR001103). The study sponsors had no role in design and conduct of the study; collection, management, analysis, and interpretation of the data; and preparation, review, or approval of the manuscript. The authors have no conflicts of interest to disclose.
- Centers for Medicare and Medicaid Services. Office of the Actuary. National Health Statistics Group. National Healthcare Expenditures Data. Baltimore, MD; 2013. https://www.cms.gov/Research-Statistics-Data-and-Systems/Statistics-Trends-and-Reports/NationalHealthExpendData/NationalHealthAccountsHistorical.html. Accessed February 16, 2016.
- . Bitter pill: why medical bills are killing us. Time Magazine. February 20, 2013:16–55.
- . Fee‐for‐service will remain a feature of major payment reforms, requiring more changes in Medicare physician payment. Health Aff (Millwood). 2012;31(9):1977–1983.
- , , , et al. The business case for quality: case studies and an analysis. Health Aff (Millwood). 2003;22(2):17–30.
- , , , . Public reporting on quality in the United States and the United Kingdom. Health Aff (Millwood). 2003;22(3):134–148.
- , , , , . The business case for health‐care quality improvement. J Patient Saf. 2013;9(1):44–52.
- , , . Hospital performance reports: impact on quality, market share, and reputation. Health Aff (Millwood). 2005;24(4):1150–1160.
- , , , . The savings illusion—why clinical quality improvement fails to deliver bottom‐line results. N Engl J Med. 2011;365(26):e48.
- , , , , . Hospital Quality: Ingredients for Success—Overview and Lessons Learned. New York, NY: Commonwealth Fund; 2004.
- , , . Hospital Quality Improvement: Strategies and Lessons from U.S. Hospitals. New York, NY: Commonwealth Fund; 2007.
- , , , et al. Hospital financial condition and operational decisions related to the quality of hospital care. Med Care Res Rev. 2007;64(2):148–168.
- , , , , , . Will pay‐for‐performance and quality reporting affect health care disparities? Health Aff (Millwood). 2007;26(3):w405–w414.
- , , . Comparison of change in quality of care between safety‐net and non‐safety‐net hospitals. JAMA. 2008;299(18):2180–2187.
- , . Could Medicare readmission policy exacerbate health care system inequity? Ann Intern Med. 2010;152(2):114–117.
- , . Minding the gap between efforts to reduce readmissions and disparities. JAMA. 2011;305(7):715–716.
- , . Medicare Health Support Pilot Program. N Engl J Med. 2012;366(7):666; author reply 667–668.
- , . Revisiting hospital readmissions. JAMA. 2013;309(4):398–400.
- , . Hospital finances and patient safety outcomes. Inquiry. 2005;42(1):60–72.
- , , . The association between hospital margins, quality of care, and closure or other change in operating status. J Gen Intern Med. 2011;26(11):1291–1296.
- , , , . Hospital financial condition and the quality of patient care. Health Econ. 2008;17(8):977–995.
- State of California Office of Statewide Health Planning and Development. Healthcare Information Division. Annual financial data. Available at: http://www.oshpd.ca.gov/HID/Products/Hospitals/AnnFinanData/PivotProfles/default.asp. Accessed June 23, 2015.
- Centers for Medicare 4(1):11–13.
- , , , et al. Quality of care for acute myocardial infarction at urban safety‐net hospitals. Health Aff (Millwood). 2007;26(1):238–248.
- , , , et al. The Hospital Compare mortality model and the volume‐outcome relationship. Health Serv Res. 2010;45(5 Pt 1):1148–1167.
- . Exploratory Data Analysis. Boston, MA: Addison‐Wesley; 1977.
- , , , et al. Limits of readmission rates in measuring hospital quality suggest the need for added metrics. Health Aff (Millwood). 2013;32(6):1083–1091.
- , , , et al. Hospital performance measures and 30‐day readmission rates. J Gen Intern Med. 2013;28(3):377–385.
- , , , et al. Public reporting and pay for performance in hospital quality improvement. N Engl J Med. 2007;356(5):486–496.
- , , , et al. Usual source of care and outcomes following acute myocardial infarction. J Gen Intern Med. 2014;29(6):862–869.
- , . Public reporting on hospital process improvements is linked to better patient outcomes. Health Aff (Millwood). 2010;29(7):1319–1324.
- , , , . Variation in length of stay and outcomes among hospitalized patients attributable to hospitals and hospitalists. J Gen Intern Med. 2013;28(3):370–376.
- , , , , . Variation in the risk of readmission among hospitals: the relative contribution of patient, hospital and inpatient provider characteristics. J Gen Intern Med. 2014;29(4):572–578.
- , , , et al. Transitional care after hospitalization for acute stroke or myocardial infarction: a systematic review. Ann Intern Med. 2012;157(6):407–416.
- , , , . The inverse relationship between mortality rates and performance in the Hospital Quality Alliance measures. Health Aff (Millwood). 2007;26(4):1104–1110.
- , , , et al. An automated model to identify heart failure patients at risk for 30‐day readmission or death using electronic medical record data. Med Care. 2010;48(11):981–988.
- , , . Indications of biased risk adjustment in the hospital readmission reduction program. J Ambul Care Manage. 2015;38(1):39–47.
- Centers for Medicare and Medicaid Services. Office of the Actuary. National Health Statistics Group. National Healthcare Expenditures Data. Baltimore, MD; 2013. https://www.cms.gov/Research-Statistics-Data-and-Systems/Statistics-Trends-and-Reports/NationalHealthExpendData/NationalHealthAccountsHistorical.html. Accessed February 16, 2016.
- . Bitter pill: why medical bills are killing us. Time Magazine. February 20, 2013:16–55.
- . Fee‐for‐service will remain a feature of major payment reforms, requiring more changes in Medicare physician payment. Health Aff (Millwood). 2012;31(9):1977–1983.
- , , , et al. The business case for quality: case studies and an analysis. Health Aff (Millwood). 2003;22(2):17–30.
- , , , . Public reporting on quality in the United States and the United Kingdom. Health Aff (Millwood). 2003;22(3):134–148.
- , , , , . The business case for health‐care quality improvement. J Patient Saf. 2013;9(1):44–52.
- , , . Hospital performance reports: impact on quality, market share, and reputation. Health Aff (Millwood). 2005;24(4):1150–1160.
- , , , . The savings illusion—why clinical quality improvement fails to deliver bottom‐line results. N Engl J Med. 2011;365(26):e48.
- , , , , . Hospital Quality: Ingredients for Success—Overview and Lessons Learned. New York, NY: Commonwealth Fund; 2004.
- , , . Hospital Quality Improvement: Strategies and Lessons from U.S. Hospitals. New York, NY: Commonwealth Fund; 2007.
- , , , et al. Hospital financial condition and operational decisions related to the quality of hospital care. Med Care Res Rev. 2007;64(2):148–168.
- , , , , , . Will pay‐for‐performance and quality reporting affect health care disparities? Health Aff (Millwood). 2007;26(3):w405–w414.
- , , . Comparison of change in quality of care between safety‐net and non‐safety‐net hospitals. JAMA. 2008;299(18):2180–2187.
- , . Could Medicare readmission policy exacerbate health care system inequity? Ann Intern Med. 2010;152(2):114–117.
- , . Minding the gap between efforts to reduce readmissions and disparities. JAMA. 2011;305(7):715–716.
- , . Medicare Health Support Pilot Program. N Engl J Med. 2012;366(7):666; author reply 667–668.
- , . Revisiting hospital readmissions. JAMA. 2013;309(4):398–400.
- , . Hospital finances and patient safety outcomes. Inquiry. 2005;42(1):60–72.
- , , . The association between hospital margins, quality of care, and closure or other change in operating status. J Gen Intern Med. 2011;26(11):1291–1296.
- , , , . Hospital financial condition and the quality of patient care. Health Econ. 2008;17(8):977–995.
- State of California Office of Statewide Health Planning and Development. Healthcare Information Division. Annual financial data. Available at: http://www.oshpd.ca.gov/HID/Products/Hospitals/AnnFinanData/PivotProfles/default.asp. Accessed June 23, 2015.
- Centers for Medicare 4(1):11–13.
- , , , et al. Quality of care for acute myocardial infarction at urban safety‐net hospitals. Health Aff (Millwood). 2007;26(1):238–248.
- , , , et al. The Hospital Compare mortality model and the volume‐outcome relationship. Health Serv Res. 2010;45(5 Pt 1):1148–1167.
- . Exploratory Data Analysis. Boston, MA: Addison‐Wesley; 1977.
- , , , et al. Limits of readmission rates in measuring hospital quality suggest the need for added metrics. Health Aff (Millwood). 2013;32(6):1083–1091.
- , , , et al. Hospital performance measures and 30‐day readmission rates. J Gen Intern Med. 2013;28(3):377–385.
- , , , et al. Public reporting and pay for performance in hospital quality improvement. N Engl J Med. 2007;356(5):486–496.
- , , , et al. Usual source of care and outcomes following acute myocardial infarction. J Gen Intern Med. 2014;29(6):862–869.
- , . Public reporting on hospital process improvements is linked to better patient outcomes. Health Aff (Millwood). 2010;29(7):1319–1324.
- , , , . Variation in length of stay and outcomes among hospitalized patients attributable to hospitals and hospitalists. J Gen Intern Med. 2013;28(3):370–376.
- , , , , . Variation in the risk of readmission among hospitals: the relative contribution of patient, hospital and inpatient provider characteristics. J Gen Intern Med. 2014;29(4):572–578.
- , , , et al. Transitional care after hospitalization for acute stroke or myocardial infarction: a systematic review. Ann Intern Med. 2012;157(6):407–416.
- , , , . The inverse relationship between mortality rates and performance in the Hospital Quality Alliance measures. Health Aff (Millwood). 2007;26(4):1104–1110.
- , , , et al. An automated model to identify heart failure patients at risk for 30‐day readmission or death using electronic medical record data. Med Care. 2010;48(11):981–988.
- , , . Indications of biased risk adjustment in the hospital readmission reduction program. J Ambul Care Manage. 2015;38(1):39–47.
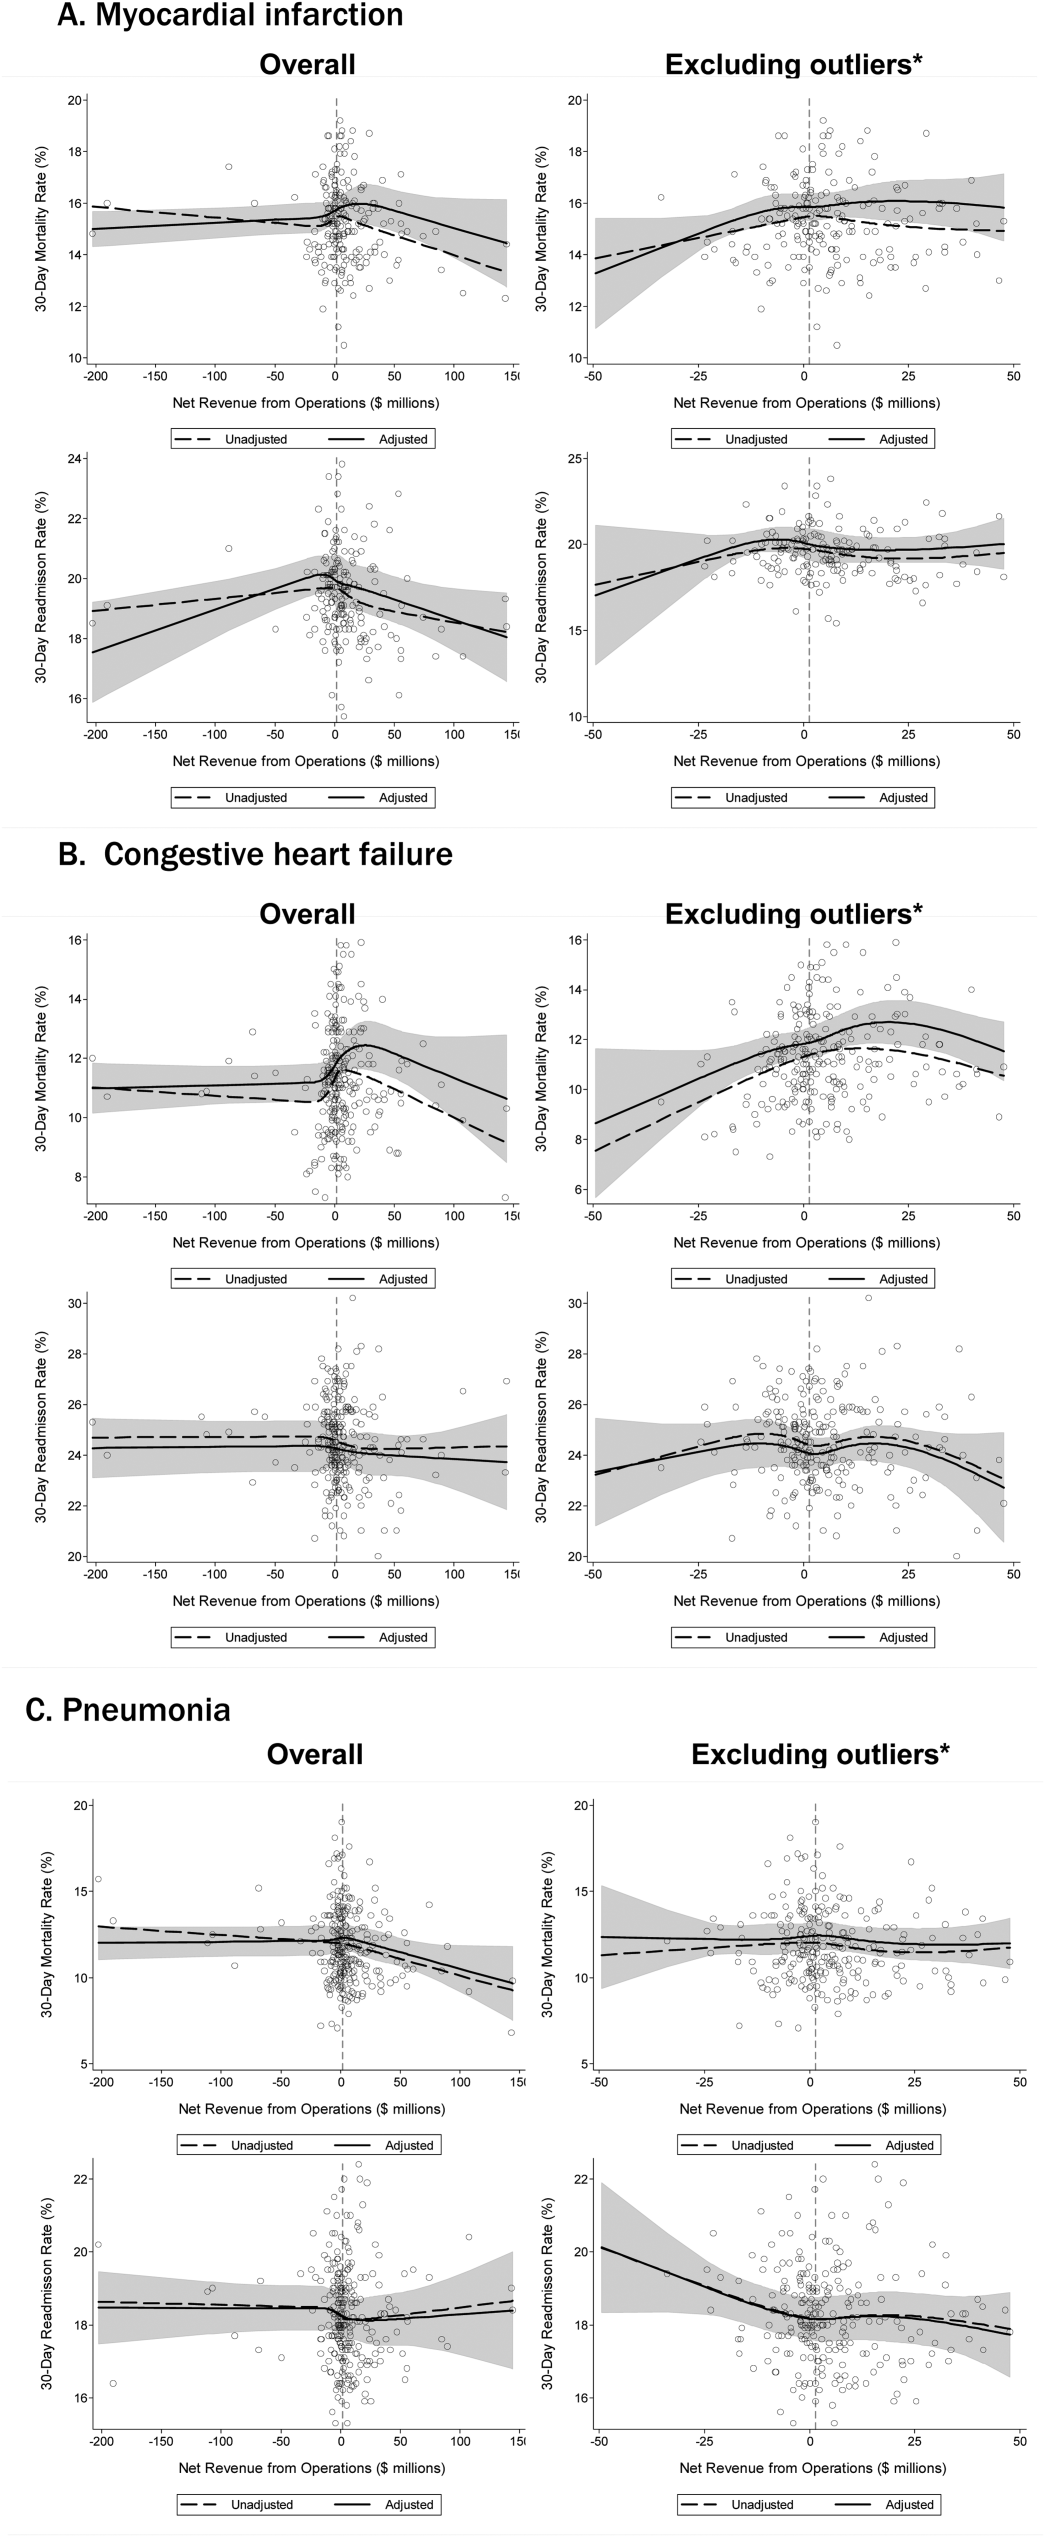
Identifying an Idle Line for Its Removal
Infections acquired in the hospital are termed healthcare‐associated infections (HAIs) and include central lineassociated blood stream infections (CLABSIs). Among HAIs, CLABSIs cause the highest number of preventable deaths.[1] Central venous catheters (CVCs) or central lines are commonly used in the hospital.[2] Each year their use is linked to 250,000 cases of CLABSIs in the United States.[3] Some CLABSIs may be prevented by the prompt removal of the line.[4] However, CVCs are often retained after their clinical indication has lapsed and are then referred to as idle lines.[5, 6] In this work, we propose and theoretically test a guideline to facilitate the safe removal of an idle line by observing the agreement and disagreement between actual practice and the proposed guideline.
METHODS
Setting
This work was conducted at a large, urban, tertiary care, academic health center in the United States as a collaborative effort to improve quality at our institution.[7]
Design and Patients
The reports linked with the electronic medical records at our institution include a daily, ward‐by‐ward listing of patients who have access other than a peripheral line in place. This central line dashboard accesses the information on intravenous access charted by bedside nurses to create a list of patients on every ward who have any kind of central access. Temporary central venous lines (CVLs), peripherally inserted central catheters (PICCs), ports, and dialysis catheters are all included. The unit charge nurses and managers use this dashboard to facilitate compliance with line care bundles. We used this source to identify patients with either type of CVC (CVLs or PICCs) on 8 days in August 2014, September 2014, and October 2014. Patients were included if they had a CVC and were on a general medical or surgical ward bed on audit day. CVLs at all sites were included (femoral, subclavian, and internal jugular). Patients in an intensive care unit (ICU) or progressive care unit on the day of the audit were excluded. Patients whose catheters were for chemotherapy and those admitted for a transplant or receiving palliative or hospice care were also excluded.
Data Collection
A protocol for data collection was written out, and a training session was held to review definitions, data sources, and methods to ensure consistency. Two authors (M.M. and J.D.) assisted by an experienced clinical nurse specialist collected data on the patients captured on audit days. Each chart was reviewed on the day of the audit, the 2 days preceding the audit day, and then followed until the patient was either discharged from the hospital or transferred to a higher level of care, died, or transitioned to palliative or hospice care. Demographics, details about the line, and the criteria for justified use were extracted from the electronic medical record.
Definitions
Justified and Idle Days
To justify the presence of a CVC on any given day, we used criteria that fell under 3 categories: intravenous (IV) access needs, unstable vitals, or meeting sepsis/systemic inflammatory response syndrome (SIRS) criteria (Table 1). For vital signs, a single abnormal reading was counted as fulfilling criteria for that day. If no criterion for justified use was met, the line was considered idle for that day.
|
| IV access needs |
| Expected duration of IV antibiotics >6 days |
| Administration of TPN |
| Anticipated requirement of home IV medications |
| Requirement of IV medications with documented difficult access |
| Hemorrhage requiring blood transfusions |
| Requiring more than 3 infusions |
| Requiring more than 2 infusions and blood transfusions |
| Abnormal vitals |
| Diastolic blood pressure >120 mm Hg |
| Systolic blood pressure 90 mm Hg |
| Systolic blood pressure >200 mm Hg |
| Heart rate >120 beats per minute |
| Heart rate 50 beats per minute |
| Respiratory rate >30 breaths per minute |
| Respiratory rate 10 breaths per minute |
| Oxygen saturation 90% as measured by pulse oximetry |
| Meeting SIRS criteria (2 or more of the following present) |
| Temp >38C, Temp 36C, heart rate >90 beats per minute, respiratory rate >20 breaths per minute, WBC >12,000/mm3, WBC 1,000/mm3, bandemia >10% |
Qualifying IV access needs were defined similarly to those previously used,[5, 6] whereas those for SIRS followed the current consensus.[8] To determine the number of IV medications or infusions, the medication administration record was reviewed. If 3 or more infusions were found, their compatibility was checked using the same database that nurses use at our institution. Difficult IV access was inferred from the indication for line placement, coupled with the absence of documentation of a peripheral IV. Clinical progress notes were reviewed to extract information on the length of proposed IV antibiotic courses, and discharge instructions were reviewed to verify whether the line was removed prior to discharge or not. The cutoffs for diastolic blood pressure, respiratory rate, and oxygen saturation used to label patients hemodynamically labile are the same as those used by previous authors and also constitute the definition of hypertensive urgency.[5, 9] However, we diverged from the values previously used for tachycardia, bradycardia, and systolic hypotension using heart rates >120 and 50 beats per minute (compared to >130 and 40 beats per minute) and systolics 90 mm Hg (compared to 80 mm Hg) to justify the line.[5] Early warning scores have been used to identify hospitalized ward patients who are at risk for clinical deterioration. Although each score utilizes different thresholds, the risk for clinical deterioration increases as the vitals worsen.[10] Bearing this in mind, the thresholds we elected to use are more clinically conservative and also parallel the nursing call orders currently used at our institution.
Proposed Guideline
We propose the guideline that a CVC may be safely removed the day after the first idle day.
RESULTS
A total of 126 lines were observed in 126 patients. Eighty‐three (65.9%) of the lines were PICCs. The remaining 43 (34.1%) were CVLs. The indications for line placement were distributed between the need for central access, total parenteral nutrition, or antibiotics (Table 2).
| Description | Value |
|---|---|
| |
| Age in yrs mean (SD) | 55.7 (18) |
| Gender, n (%) | |
| Female | 66 (52.4) |
| Male | 60 (47.6) |
| Type of line, n (%) | |
| PICC | 83 (65.9) |
| CVL | 43 (34.1) |
| Indication for line placement, n (%) | |
| Meds requiring central access or TPN | 36 (28.6) |
| Antibiotics | 34 (27.0) |
| Hemodynamic instability | 30 (23.8) |
| Poor access with multiple IV medications | 18 (14.3) |
| Unknown | 8 (6.3) |
| Line removed prior to discharge, n (%) | |
| Yes | 76 (60.3) |
| No | 50 (39.7) |
Out of the 126 patients, 50 (39.7%) were discharged from the hospital, died, were transferred to a higher level of care, or transitioned to palliative or hospice care with the line in place. In the remaining 76 patients, the audit captured 635 days, out of which a line was in place for 522 (82.2%) days. Of these 522 days, the line's presence was justified by our criteria for 351 (67.2%) days. The most common reason for a line to be justified on any given day was the need for antibiotics followed by the presence of SIRS criteria (Table 3). The remaining 171 (32.7%) days were idle.
| Criteria | N | % |
|---|---|---|
| ||
| No. of factors justifying use | ||
| 1 | 184 | 52.4% |
| 2 | 127 | 36.2% |
| >2 | 40 | 11.4 |
| Reason for justifying line* | ||
| Anticipate home or >6 days of antibiotic use | 181 | 51.6 |
| SIRS criteria | 124 | 35.3 |
| TPN | 96 | 27.4 |
| Hemodynamic instability based on hr and bp | 78 | 22.2 |
| Poor access with need for IV medications | 57 | 16.2 |
| Respiratory rate (10 or >30/minute) | 25 | 7.1 |
| Active hemorrhage requiring transfusions | 12 | 3.4 |
| >3 infusions | 6 | 1.7 |
A comparison of the actual removal of the 76 central lines in practice relative to the proposed guideline of removing it the day following the first idle day is displayed in Figure 1. The central line was removed prior to our proposed guideline in 11 (14.5%) patients, and waiting for an idle day in these patients would have added 46 line days. In almost half the patients (n = 36, 47.4%), the line was removed in agreement with the proposed guideline. None of the patients in whom the line was removed prior to or in accordance with our proposed guideline required a line reinsertion. Line removal was delayed in 29 (38.2%) patients when compared to our proposed guideline. In these patients, following the guideline would have created 122 line‐free days. Most (n = 102, 83.6%) of these potential line‐free days were idle. Twenty (16.4%) were justified, of which half (n = 10) were justified by meeting SIRS criteria.

DISCUSSION
Approximately 1 in every 25 inpatients in the United States has at least 1 HAI on any given day.[11] The case fatality rate from a CLABSI may be as high as 12%, and up to 70% of these infections may be preventable.[1, 12] Interventions successful in decreasing CLABSIs have focused on patients in ICUs.[13] However, CVCs are increasingly prevalent outside the ICU, with over 4.5 million line days in non‐ICU beds reported to the National Healthcare Safety Network in 2012 compared to 2.5 million in 2010.[2, 14] However, adherence rates to infection control practices may be lower on the wards than in the ICUs.[6, 15] Consequently, although the number of CLABSIs has declined over the last decade, most are now occurring outside the ICU.[16] These trends underscore the need to develop strategies aimed at CLABSI prevention on the floors.
Analogous to the life cycle of a urinary catheter described by Meddings et al.,[17] strategies to prevent CLABSIs and other CVC‐related complications may be designed around the life cycle of a CVC. The life cycle starts with insertion and moves on to the maintenance, removal, and possible reinsertion of the line. The process thus starts with the decision to place the line. Over the last decade, this decision making has changed in part due to PICCs. This shift is reflected in PICC prevalence rates: in 2001, 11% of audited central lines were PICCs compared to 56% in 2007.[5, 6] In our audit, 66% of the CVCs were PICCs. This increase in the use of PICCs may be attributable to the ease and safety of their placement coupled with the increased availability of vascular access placement teams.[18] The risk of overuse that may result from such expediency may be countered by adhering to guidelines such as the Michigan Appropriateness Guide for Intravenous Catheters, which provides both clinically detailed guidance and an impetus for reflective decision making around intravenous access.[19]
The placement of CVCs for prolonged parenteral antibiotics may be a particular subset that bears further exploration. Similar to previous reports, we found that a large number of the CVCs were both inserted for and justified by the need for IV antibiotics.[5] Guidelines delineated by the Infectious Diseases Society of America regarding outpatient parenteral antibiotics weigh both the duration of therapy and the antimicrobial's potential for causing phlebitis when recommending the type of intravascular access.[20] Many courses may therefore be completed through peripheral or midline catheters. Developing strong partnerships between infectious disease specialists, hospitalists, and the facilities or home‐care services treating these patients may curtail the use of CVCs for antimicrobial administration.
The main focus of our work is on facilitating the safe removal of CVCs. The risk of CLABSIs increases each day a CVC is in place, and guidelines to prevent CLABSIs include recommendations to promptly remove nonessential catheters.[4, 21] There is also an emerging understanding that the risk of a PICC‐related CLABSI approaches that from a traditional central line in hospitalized patients, and PICCs confer an increased risk of venous thromboembolism.[18, 22] Although nearly half of surveyed hospitalists recently reported leaving PICCs in place until discharge day, our data suggest that this practice may be driven by the trajectory of a patient's recovery as much as by knowledge gaps related to the use of PICCs.[23] In nearly half the instances, clinical practice already mirrors our proposed guideline, with line removal coinciding with both the timing proposed by our guideline and discharge day. However, there is room for improvement, as line removal may have been expedited in the 29 patients in whom the line was retained after the first idle day. Maintaining an awareness of its presence and weighing its risks and benefits daily may facilitate the removal of a CVC. Based on the recent findings that up to a quarter of clinicians are unaware that their patients have a central line, the mere reminder of the presence of a line using such criteria may expedite its removal by triggering a purposeful reassessment of its ongoing need.[24] Premature CVC removal requiring line reinsertion is an unintended consequence that may emerge from the earlier removal of lines. In our sample, none of the patients who had lines removed either prior to or in accordance with our proposed guideline required a line reinsertion. In addition to line reinsertion, delays in laboratory testing and reporting due to the unavailability of access, increased patient discomfort, or increased workload on the bedside nurse or vascular access team must also be considered when implementing strategies aimed at decreasing line days.
We envisage using these criteria to both empower practitioners with knowledge and foster shared accountability between all team members by using a uniform tool. This can occur through partnerships between infection control, clinical nurse specialists, bedside nursing, and physicians. The electronic medical record could be leveraged to scan the record for the criteria and create a notification when the line becomes idle. In alignment with the Michigan Appropriateness Guide for Intravenous Catheters guidelines, we do not support the removal of lines by nursing staff without physician notification.[19] Such principles have been successfully harnessed in strategies to prevent both catheter‐associated urinary tract infections and CLABSIs in ICUs.[13, 25] In light of the complexity surrounding the decision making for CVCs, our criteria were focused on the wards and erred on the side of clinical caution. This clinical conservatism is apparent in the patients in whom lines were removed prior to what our guideline would propose, yet none of the patients required a line reinsertion. As concerns about recrudescent clinical instability may drive decision making around line removal, such conservatism may be warranted initially. However, the fidelity of these criteria in the clinical setting will need prospective validation. In particular, the inclusion of SIRS criteria may have led to an overestimation of justified days. Further studies may be needed to refine the criteria and find a clinical hierarchy that balances the risks and benefits of retaining a central line.
Our work has certain limitations. It is a single center's experience, and our findings may not therefore be generalizable. Except for when the indication for the line was for difficult access, we did not attempt to verify the presence of a peripheral IV. This, in combination with the inclusion of SIRS criteria, likely leads to an underestimation of idle days. In the interest of focusing on patients in whom the decision making around a line would be the least controversial, we did not continue to follow patients who were transferred to a higher level of care. It is possible, however, that these transfers were precipitated by line‐associated complications such as sepsis and would be important to track. We did not measure the agreement between data collectors, although definitions and methodologies were standardized and reviewed prior to data collection. As this was an observational assessment of a proposed guideline, we cannot predict how the recommendations generated by it will be received by clinicians. Although this may prove to be a barrier in adoption, we hope that the conversation it initiates leads to change.
Hospitalists are positioned to potentially influence the entire life cycle of a central line on the floor. Strategies can be enacted at each stage to help decrease the potential of harm from these devices to our patients. Creating and testing criteria and guidelines such as we propose represents just 1 such strategy in a multidisciplinary effort to provide the best possible care we can.
Acknowledgements
The authors thank Jennifer Dunscomb, Kristen Kelly, and their teams, and Deanna Sidwell, Todd Biggerstaff, Joan Miller, Rob Clark, and the tireless providers at Indiana University Health Methodist Hospital for their support.
Disclosures: This work was supported by the Indiana University Health Values Grant for research. The authors have no conflicts of interests to report.
- , , , , , . Estimating the proportion of healthcare‐associated infections that are reasonably preventable and the related mortality and costs. Infect Control Hosp Epidemiol. 2011;32(2):101–114.
- , , , et al. National Healthcare Safety Network (NHSN) report, data summary for 2012, device‐associated module. Am J Infect Control. 2013;41(12):1148–1166.
- , , . The risk of bloodstream infection in adults with different intravascular devices: a systematic review of 200 published prospective studies. Mayo Clin Proc. 2006;81(9):1159–1171.
- , , , et al. Guidelines for the prevention of intravascular catheter‐related infections. Clin Infect Dis. 2011;52(9):e162–e193.
- , , , et al. Temporary central venous catheter utilization patterns in a large tertiary care center: tracking the “idle central venous catheter.” Infect Control Hosp Epidemiol. 2012;33(1):50–57.
- , , , , , . Unnecessary use of central venous catheters: the need to look outside the intensive care unit. Infect Control Hosp Epidemiol. 2004;25(3):266–268.
- IU Health Methodist Hospital website. Available at: http://iuhealth.org/methodist/aboIut. Accessed October 20, 2014.
- , , , et al. Definitions for Sepsis and Organ Failure and Guidelines for the Use of Innovative Therapies in Sepsis. The ACCP/SCCM Consensus Conference Committee. American College of Chest Physicians/Society of Critical Care Medicine. Chest. 2009;136(5 suppl):e28.
- , , , , , . Acute hypertension: a systematic review and appraisal of guidelines. Ochsner J. 2014;14(4):655–663.
- , , . Predicting clinical deterioration in the hospital: the impact of outcome selection. Resuscitation. 2013;84(5):564–568.
- , , , et al. Multistate point‐prevalence survey of health care–associated infections. N Engl J Med. 2014;370(13):1198–1208.
- , , , et al. Estimating health care‐associated infections and deaths in U.S. hospitals, 2002. Public Health Rep. 2007;122(2):160–166.
- , , , et al. An intervention to decrease catheter‐related bloodstream infections in the ICU. N Engl J Med. 2006;355(26):2725–2732.
- , , , et al. Data summary for 2011, device‐associated module. Centers for Disease Control and Prevention. National Healthcare Safety Network (NHSN) Report. Available at: http://www.cdc.gov/nhsn/PDFs/dataStat/NHSN‐Report‐2011‐Data‐Summary.pdf. Published April 1, 2013. Last accessed January 2015.
- , , . Idle central venous catheter‐days pose infection risk for patients after discharge from intensive care. Am J Infect Control. 2014;42(4):453–455.
- , . Update on emerging infections: news from the Centers for Disease Control and Prevention. Vital signs: central line‐associated blood stream infections—United States, 2001, 2008, and 2009. Ann Emerg Med. 2011;58(5):447–451.
- , , , , , . Reducing unnecessary urinary catheter use and other strategies to prevent catheter‐associated urinary tract infection: an integrative review. BMJ Qual Saf. 2014;23(4):277–289.
- , , , , . The risk of bloodstream infection associated with peripherally inserted central catheters compared with central venous catheters in adults: a systematic review and meta‐analysis. Infect Control Hosp Epidemiol. 2013;34(9):908–918.
- , , , et al. The Michigan Appropriateness Guide for Intravenous Catheters (MAGIC): results from a multispecialty panel using the RAND/UCLA Appropriateness Method. Ann Intern Med. 2015;163(6 suppl):S1–S40.
- , , , et al. Practice guidelines for outpatient parenteral antimicrobial therapy. IDSA guidelines. Clin Infect Dis. 2004;38(12):1651–1672.
- , . Nonuniform risk of bloodstream infection with increasing central venous catheter‐days. Infect Control Hosp Epidemiol. 2005;26(8):715–719.
- , , , et al. Risk of venous thromboembolism associated with peripherally inserted central catheters: a systematic review and meta‐analysis. Lancet. 2013;382(9889):311–325.
- , , , , . Hospitalist experiences, practice, opinions, and knowledge regarding peripherally inserted central catheters: results of a national survey. J Hosp Med. 2013;8(11):635–638.
- , , , et al. Do clinicians know which of their patients have central venous catheters? Ann Intern Med. 2014;161(8):562.
- , , , , , . Reducing foley catheter device days in an intensive care unit: using the evidence to change practice. AACN Adv Crit Care. 2006;17(3):272–283.
Infections acquired in the hospital are termed healthcare‐associated infections (HAIs) and include central lineassociated blood stream infections (CLABSIs). Among HAIs, CLABSIs cause the highest number of preventable deaths.[1] Central venous catheters (CVCs) or central lines are commonly used in the hospital.[2] Each year their use is linked to 250,000 cases of CLABSIs in the United States.[3] Some CLABSIs may be prevented by the prompt removal of the line.[4] However, CVCs are often retained after their clinical indication has lapsed and are then referred to as idle lines.[5, 6] In this work, we propose and theoretically test a guideline to facilitate the safe removal of an idle line by observing the agreement and disagreement between actual practice and the proposed guideline.
METHODS
Setting
This work was conducted at a large, urban, tertiary care, academic health center in the United States as a collaborative effort to improve quality at our institution.[7]
Design and Patients
The reports linked with the electronic medical records at our institution include a daily, ward‐by‐ward listing of patients who have access other than a peripheral line in place. This central line dashboard accesses the information on intravenous access charted by bedside nurses to create a list of patients on every ward who have any kind of central access. Temporary central venous lines (CVLs), peripherally inserted central catheters (PICCs), ports, and dialysis catheters are all included. The unit charge nurses and managers use this dashboard to facilitate compliance with line care bundles. We used this source to identify patients with either type of CVC (CVLs or PICCs) on 8 days in August 2014, September 2014, and October 2014. Patients were included if they had a CVC and were on a general medical or surgical ward bed on audit day. CVLs at all sites were included (femoral, subclavian, and internal jugular). Patients in an intensive care unit (ICU) or progressive care unit on the day of the audit were excluded. Patients whose catheters were for chemotherapy and those admitted for a transplant or receiving palliative or hospice care were also excluded.
Data Collection
A protocol for data collection was written out, and a training session was held to review definitions, data sources, and methods to ensure consistency. Two authors (M.M. and J.D.) assisted by an experienced clinical nurse specialist collected data on the patients captured on audit days. Each chart was reviewed on the day of the audit, the 2 days preceding the audit day, and then followed until the patient was either discharged from the hospital or transferred to a higher level of care, died, or transitioned to palliative or hospice care. Demographics, details about the line, and the criteria for justified use were extracted from the electronic medical record.
Definitions
Justified and Idle Days
To justify the presence of a CVC on any given day, we used criteria that fell under 3 categories: intravenous (IV) access needs, unstable vitals, or meeting sepsis/systemic inflammatory response syndrome (SIRS) criteria (Table 1). For vital signs, a single abnormal reading was counted as fulfilling criteria for that day. If no criterion for justified use was met, the line was considered idle for that day.
|
| IV access needs |
| Expected duration of IV antibiotics >6 days |
| Administration of TPN |
| Anticipated requirement of home IV medications |
| Requirement of IV medications with documented difficult access |
| Hemorrhage requiring blood transfusions |
| Requiring more than 3 infusions |
| Requiring more than 2 infusions and blood transfusions |
| Abnormal vitals |
| Diastolic blood pressure >120 mm Hg |
| Systolic blood pressure 90 mm Hg |
| Systolic blood pressure >200 mm Hg |
| Heart rate >120 beats per minute |
| Heart rate 50 beats per minute |
| Respiratory rate >30 breaths per minute |
| Respiratory rate 10 breaths per minute |
| Oxygen saturation 90% as measured by pulse oximetry |
| Meeting SIRS criteria (2 or more of the following present) |
| Temp >38C, Temp 36C, heart rate >90 beats per minute, respiratory rate >20 breaths per minute, WBC >12,000/mm3, WBC 1,000/mm3, bandemia >10% |
Qualifying IV access needs were defined similarly to those previously used,[5, 6] whereas those for SIRS followed the current consensus.[8] To determine the number of IV medications or infusions, the medication administration record was reviewed. If 3 or more infusions were found, their compatibility was checked using the same database that nurses use at our institution. Difficult IV access was inferred from the indication for line placement, coupled with the absence of documentation of a peripheral IV. Clinical progress notes were reviewed to extract information on the length of proposed IV antibiotic courses, and discharge instructions were reviewed to verify whether the line was removed prior to discharge or not. The cutoffs for diastolic blood pressure, respiratory rate, and oxygen saturation used to label patients hemodynamically labile are the same as those used by previous authors and also constitute the definition of hypertensive urgency.[5, 9] However, we diverged from the values previously used for tachycardia, bradycardia, and systolic hypotension using heart rates >120 and 50 beats per minute (compared to >130 and 40 beats per minute) and systolics 90 mm Hg (compared to 80 mm Hg) to justify the line.[5] Early warning scores have been used to identify hospitalized ward patients who are at risk for clinical deterioration. Although each score utilizes different thresholds, the risk for clinical deterioration increases as the vitals worsen.[10] Bearing this in mind, the thresholds we elected to use are more clinically conservative and also parallel the nursing call orders currently used at our institution.
Proposed Guideline
We propose the guideline that a CVC may be safely removed the day after the first idle day.
RESULTS
A total of 126 lines were observed in 126 patients. Eighty‐three (65.9%) of the lines were PICCs. The remaining 43 (34.1%) were CVLs. The indications for line placement were distributed between the need for central access, total parenteral nutrition, or antibiotics (Table 2).
| Description | Value |
|---|---|
| |
| Age in yrs mean (SD) | 55.7 (18) |
| Gender, n (%) | |
| Female | 66 (52.4) |
| Male | 60 (47.6) |
| Type of line, n (%) | |
| PICC | 83 (65.9) |
| CVL | 43 (34.1) |
| Indication for line placement, n (%) | |
| Meds requiring central access or TPN | 36 (28.6) |
| Antibiotics | 34 (27.0) |
| Hemodynamic instability | 30 (23.8) |
| Poor access with multiple IV medications | 18 (14.3) |
| Unknown | 8 (6.3) |
| Line removed prior to discharge, n (%) | |
| Yes | 76 (60.3) |
| No | 50 (39.7) |
Out of the 126 patients, 50 (39.7%) were discharged from the hospital, died, were transferred to a higher level of care, or transitioned to palliative or hospice care with the line in place. In the remaining 76 patients, the audit captured 635 days, out of which a line was in place for 522 (82.2%) days. Of these 522 days, the line's presence was justified by our criteria for 351 (67.2%) days. The most common reason for a line to be justified on any given day was the need for antibiotics followed by the presence of SIRS criteria (Table 3). The remaining 171 (32.7%) days were idle.
| Criteria | N | % |
|---|---|---|
| ||
| No. of factors justifying use | ||
| 1 | 184 | 52.4% |
| 2 | 127 | 36.2% |
| >2 | 40 | 11.4 |
| Reason for justifying line* | ||
| Anticipate home or >6 days of antibiotic use | 181 | 51.6 |
| SIRS criteria | 124 | 35.3 |
| TPN | 96 | 27.4 |
| Hemodynamic instability based on hr and bp | 78 | 22.2 |
| Poor access with need for IV medications | 57 | 16.2 |
| Respiratory rate (10 or >30/minute) | 25 | 7.1 |
| Active hemorrhage requiring transfusions | 12 | 3.4 |
| >3 infusions | 6 | 1.7 |
A comparison of the actual removal of the 76 central lines in practice relative to the proposed guideline of removing it the day following the first idle day is displayed in Figure 1. The central line was removed prior to our proposed guideline in 11 (14.5%) patients, and waiting for an idle day in these patients would have added 46 line days. In almost half the patients (n = 36, 47.4%), the line was removed in agreement with the proposed guideline. None of the patients in whom the line was removed prior to or in accordance with our proposed guideline required a line reinsertion. Line removal was delayed in 29 (38.2%) patients when compared to our proposed guideline. In these patients, following the guideline would have created 122 line‐free days. Most (n = 102, 83.6%) of these potential line‐free days were idle. Twenty (16.4%) were justified, of which half (n = 10) were justified by meeting SIRS criteria.
DISCUSSION
Approximately 1 in every 25 inpatients in the United States has at least 1 HAI on any given day.[11] The case fatality rate from a CLABSI may be as high as 12%, and up to 70% of these infections may be preventable.[1, 12] Interventions successful in decreasing CLABSIs have focused on patients in ICUs.[13] However, CVCs are increasingly prevalent outside the ICU, with over 4.5 million line days in non‐ICU beds reported to the National Healthcare Safety Network in 2012 compared to 2.5 million in 2010.[2, 14] However, adherence rates to infection control practices may be lower on the wards than in the ICUs.[6, 15] Consequently, although the number of CLABSIs has declined over the last decade, most are now occurring outside the ICU.[16] These trends underscore the need to develop strategies aimed at CLABSI prevention on the floors.
Analogous to the life cycle of a urinary catheter described by Meddings et al.,[17] strategies to prevent CLABSIs and other CVC‐related complications may be designed around the life cycle of a CVC. The life cycle starts with insertion and moves on to the maintenance, removal, and possible reinsertion of the line. The process thus starts with the decision to place the line. Over the last decade, this decision making has changed in part due to PICCs. This shift is reflected in PICC prevalence rates: in 2001, 11% of audited central lines were PICCs compared to 56% in 2007.[5, 6] In our audit, 66% of the CVCs were PICCs. This increase in the use of PICCs may be attributable to the ease and safety of their placement coupled with the increased availability of vascular access placement teams.[18] The risk of overuse that may result from such expediency may be countered by adhering to guidelines such as the Michigan Appropriateness Guide for Intravenous Catheters, which provides both clinically detailed guidance and an impetus for reflective decision making around intravenous access.[19]
The placement of CVCs for prolonged parenteral antibiotics may be a particular subset that bears further exploration. Similar to previous reports, we found that a large number of the CVCs were both inserted for and justified by the need for IV antibiotics.[5] Guidelines delineated by the Infectious Diseases Society of America regarding outpatient parenteral antibiotics weigh both the duration of therapy and the antimicrobial's potential for causing phlebitis when recommending the type of intravascular access.[20] Many courses may therefore be completed through peripheral or midline catheters. Developing strong partnerships between infectious disease specialists, hospitalists, and the facilities or home‐care services treating these patients may curtail the use of CVCs for antimicrobial administration.
The main focus of our work is on facilitating the safe removal of CVCs. The risk of CLABSIs increases each day a CVC is in place, and guidelines to prevent CLABSIs include recommendations to promptly remove nonessential catheters.[4, 21] There is also an emerging understanding that the risk of a PICC‐related CLABSI approaches that from a traditional central line in hospitalized patients, and PICCs confer an increased risk of venous thromboembolism.[18, 22] Although nearly half of surveyed hospitalists recently reported leaving PICCs in place until discharge day, our data suggest that this practice may be driven by the trajectory of a patient's recovery as much as by knowledge gaps related to the use of PICCs.[23] In nearly half the instances, clinical practice already mirrors our proposed guideline, with line removal coinciding with both the timing proposed by our guideline and discharge day. However, there is room for improvement, as line removal may have been expedited in the 29 patients in whom the line was retained after the first idle day. Maintaining an awareness of its presence and weighing its risks and benefits daily may facilitate the removal of a CVC. Based on the recent findings that up to a quarter of clinicians are unaware that their patients have a central line, the mere reminder of the presence of a line using such criteria may expedite its removal by triggering a purposeful reassessment of its ongoing need.[24] Premature CVC removal requiring line reinsertion is an unintended consequence that may emerge from the earlier removal of lines. In our sample, none of the patients who had lines removed either prior to or in accordance with our proposed guideline required a line reinsertion. In addition to line reinsertion, delays in laboratory testing and reporting due to the unavailability of access, increased patient discomfort, or increased workload on the bedside nurse or vascular access team must also be considered when implementing strategies aimed at decreasing line days.
We envisage using these criteria to both empower practitioners with knowledge and foster shared accountability between all team members by using a uniform tool. This can occur through partnerships between infection control, clinical nurse specialists, bedside nursing, and physicians. The electronic medical record could be leveraged to scan the record for the criteria and create a notification when the line becomes idle. In alignment with the Michigan Appropriateness Guide for Intravenous Catheters guidelines, we do not support the removal of lines by nursing staff without physician notification.[19] Such principles have been successfully harnessed in strategies to prevent both catheter‐associated urinary tract infections and CLABSIs in ICUs.[13, 25] In light of the complexity surrounding the decision making for CVCs, our criteria were focused on the wards and erred on the side of clinical caution. This clinical conservatism is apparent in the patients in whom lines were removed prior to what our guideline would propose, yet none of the patients required a line reinsertion. As concerns about recrudescent clinical instability may drive decision making around line removal, such conservatism may be warranted initially. However, the fidelity of these criteria in the clinical setting will need prospective validation. In particular, the inclusion of SIRS criteria may have led to an overestimation of justified days. Further studies may be needed to refine the criteria and find a clinical hierarchy that balances the risks and benefits of retaining a central line.
Our work has certain limitations. It is a single center's experience, and our findings may not therefore be generalizable. Except for when the indication for the line was for difficult access, we did not attempt to verify the presence of a peripheral IV. This, in combination with the inclusion of SIRS criteria, likely leads to an underestimation of idle days. In the interest of focusing on patients in whom the decision making around a line would be the least controversial, we did not continue to follow patients who were transferred to a higher level of care. It is possible, however, that these transfers were precipitated by line‐associated complications such as sepsis and would be important to track. We did not measure the agreement between data collectors, although definitions and methodologies were standardized and reviewed prior to data collection. As this was an observational assessment of a proposed guideline, we cannot predict how the recommendations generated by it will be received by clinicians. Although this may prove to be a barrier in adoption, we hope that the conversation it initiates leads to change.
Hospitalists are positioned to potentially influence the entire life cycle of a central line on the floor. Strategies can be enacted at each stage to help decrease the potential of harm from these devices to our patients. Creating and testing criteria and guidelines such as we propose represents just 1 such strategy in a multidisciplinary effort to provide the best possible care we can.
Acknowledgements
The authors thank Jennifer Dunscomb, Kristen Kelly, and their teams, and Deanna Sidwell, Todd Biggerstaff, Joan Miller, Rob Clark, and the tireless providers at Indiana University Health Methodist Hospital for their support.
Disclosures: This work was supported by the Indiana University Health Values Grant for research. The authors have no conflicts of interests to report.
Infections acquired in the hospital are termed healthcare‐associated infections (HAIs) and include central lineassociated blood stream infections (CLABSIs). Among HAIs, CLABSIs cause the highest number of preventable deaths.[1] Central venous catheters (CVCs) or central lines are commonly used in the hospital.[2] Each year their use is linked to 250,000 cases of CLABSIs in the United States.[3] Some CLABSIs may be prevented by the prompt removal of the line.[4] However, CVCs are often retained after their clinical indication has lapsed and are then referred to as idle lines.[5, 6] In this work, we propose and theoretically test a guideline to facilitate the safe removal of an idle line by observing the agreement and disagreement between actual practice and the proposed guideline.
METHODS
Setting
This work was conducted at a large, urban, tertiary care, academic health center in the United States as a collaborative effort to improve quality at our institution.[7]
Design and Patients
The reports linked with the electronic medical records at our institution include a daily, ward‐by‐ward listing of patients who have access other than a peripheral line in place. This central line dashboard accesses the information on intravenous access charted by bedside nurses to create a list of patients on every ward who have any kind of central access. Temporary central venous lines (CVLs), peripherally inserted central catheters (PICCs), ports, and dialysis catheters are all included. The unit charge nurses and managers use this dashboard to facilitate compliance with line care bundles. We used this source to identify patients with either type of CVC (CVLs or PICCs) on 8 days in August 2014, September 2014, and October 2014. Patients were included if they had a CVC and were on a general medical or surgical ward bed on audit day. CVLs at all sites were included (femoral, subclavian, and internal jugular). Patients in an intensive care unit (ICU) or progressive care unit on the day of the audit were excluded. Patients whose catheters were for chemotherapy and those admitted for a transplant or receiving palliative or hospice care were also excluded.
Data Collection
A protocol for data collection was written out, and a training session was held to review definitions, data sources, and methods to ensure consistency. Two authors (M.M. and J.D.) assisted by an experienced clinical nurse specialist collected data on the patients captured on audit days. Each chart was reviewed on the day of the audit, the 2 days preceding the audit day, and then followed until the patient was either discharged from the hospital or transferred to a higher level of care, died, or transitioned to palliative or hospice care. Demographics, details about the line, and the criteria for justified use were extracted from the electronic medical record.
Definitions
Justified and Idle Days
To justify the presence of a CVC on any given day, we used criteria that fell under 3 categories: intravenous (IV) access needs, unstable vitals, or meeting sepsis/systemic inflammatory response syndrome (SIRS) criteria (Table 1). For vital signs, a single abnormal reading was counted as fulfilling criteria for that day. If no criterion for justified use was met, the line was considered idle for that day.
|
| IV access needs |
| Expected duration of IV antibiotics >6 days |
| Administration of TPN |
| Anticipated requirement of home IV medications |
| Requirement of IV medications with documented difficult access |
| Hemorrhage requiring blood transfusions |
| Requiring more than 3 infusions |
| Requiring more than 2 infusions and blood transfusions |
| Abnormal vitals |
| Diastolic blood pressure >120 mm Hg |
| Systolic blood pressure 90 mm Hg |
| Systolic blood pressure >200 mm Hg |
| Heart rate >120 beats per minute |
| Heart rate 50 beats per minute |
| Respiratory rate >30 breaths per minute |
| Respiratory rate 10 breaths per minute |
| Oxygen saturation 90% as measured by pulse oximetry |
| Meeting SIRS criteria (2 or more of the following present) |
| Temp >38C, Temp 36C, heart rate >90 beats per minute, respiratory rate >20 breaths per minute, WBC >12,000/mm3, WBC 1,000/mm3, bandemia >10% |
Qualifying IV access needs were defined similarly to those previously used,[5, 6] whereas those for SIRS followed the current consensus.[8] To determine the number of IV medications or infusions, the medication administration record was reviewed. If 3 or more infusions were found, their compatibility was checked using the same database that nurses use at our institution. Difficult IV access was inferred from the indication for line placement, coupled with the absence of documentation of a peripheral IV. Clinical progress notes were reviewed to extract information on the length of proposed IV antibiotic courses, and discharge instructions were reviewed to verify whether the line was removed prior to discharge or not. The cutoffs for diastolic blood pressure, respiratory rate, and oxygen saturation used to label patients hemodynamically labile are the same as those used by previous authors and also constitute the definition of hypertensive urgency.[5, 9] However, we diverged from the values previously used for tachycardia, bradycardia, and systolic hypotension using heart rates >120 and 50 beats per minute (compared to >130 and 40 beats per minute) and systolics 90 mm Hg (compared to 80 mm Hg) to justify the line.[5] Early warning scores have been used to identify hospitalized ward patients who are at risk for clinical deterioration. Although each score utilizes different thresholds, the risk for clinical deterioration increases as the vitals worsen.[10] Bearing this in mind, the thresholds we elected to use are more clinically conservative and also parallel the nursing call orders currently used at our institution.
Proposed Guideline
We propose the guideline that a CVC may be safely removed the day after the first idle day.
RESULTS
A total of 126 lines were observed in 126 patients. Eighty‐three (65.9%) of the lines were PICCs. The remaining 43 (34.1%) were CVLs. The indications for line placement were distributed between the need for central access, total parenteral nutrition, or antibiotics (Table 2).
| Description | Value |
|---|---|
| |
| Age in yrs mean (SD) | 55.7 (18) |
| Gender, n (%) | |
| Female | 66 (52.4) |
| Male | 60 (47.6) |
| Type of line, n (%) | |
| PICC | 83 (65.9) |
| CVL | 43 (34.1) |
| Indication for line placement, n (%) | |
| Meds requiring central access or TPN | 36 (28.6) |
| Antibiotics | 34 (27.0) |
| Hemodynamic instability | 30 (23.8) |
| Poor access with multiple IV medications | 18 (14.3) |
| Unknown | 8 (6.3) |
| Line removed prior to discharge, n (%) | |
| Yes | 76 (60.3) |
| No | 50 (39.7) |
Out of the 126 patients, 50 (39.7%) were discharged from the hospital, died, were transferred to a higher level of care, or transitioned to palliative or hospice care with the line in place. In the remaining 76 patients, the audit captured 635 days, out of which a line was in place for 522 (82.2%) days. Of these 522 days, the line's presence was justified by our criteria for 351 (67.2%) days. The most common reason for a line to be justified on any given day was the need for antibiotics followed by the presence of SIRS criteria (Table 3). The remaining 171 (32.7%) days were idle.
| Criteria | N | % |
|---|---|---|
| ||
| No. of factors justifying use | ||
| 1 | 184 | 52.4% |
| 2 | 127 | 36.2% |
| >2 | 40 | 11.4 |
| Reason for justifying line* | ||
| Anticipate home or >6 days of antibiotic use | 181 | 51.6 |
| SIRS criteria | 124 | 35.3 |
| TPN | 96 | 27.4 |
| Hemodynamic instability based on hr and bp | 78 | 22.2 |
| Poor access with need for IV medications | 57 | 16.2 |
| Respiratory rate (10 or >30/minute) | 25 | 7.1 |
| Active hemorrhage requiring transfusions | 12 | 3.4 |
| >3 infusions | 6 | 1.7 |
A comparison of the actual removal of the 76 central lines in practice relative to the proposed guideline of removing it the day following the first idle day is displayed in Figure 1. The central line was removed prior to our proposed guideline in 11 (14.5%) patients, and waiting for an idle day in these patients would have added 46 line days. In almost half the patients (n = 36, 47.4%), the line was removed in agreement with the proposed guideline. None of the patients in whom the line was removed prior to or in accordance with our proposed guideline required a line reinsertion. Line removal was delayed in 29 (38.2%) patients when compared to our proposed guideline. In these patients, following the guideline would have created 122 line‐free days. Most (n = 102, 83.6%) of these potential line‐free days were idle. Twenty (16.4%) were justified, of which half (n = 10) were justified by meeting SIRS criteria.
DISCUSSION
Approximately 1 in every 25 inpatients in the United States has at least 1 HAI on any given day.[11] The case fatality rate from a CLABSI may be as high as 12%, and up to 70% of these infections may be preventable.[1, 12] Interventions successful in decreasing CLABSIs have focused on patients in ICUs.[13] However, CVCs are increasingly prevalent outside the ICU, with over 4.5 million line days in non‐ICU beds reported to the National Healthcare Safety Network in 2012 compared to 2.5 million in 2010.[2, 14] However, adherence rates to infection control practices may be lower on the wards than in the ICUs.[6, 15] Consequently, although the number of CLABSIs has declined over the last decade, most are now occurring outside the ICU.[16] These trends underscore the need to develop strategies aimed at CLABSI prevention on the floors.
Analogous to the life cycle of a urinary catheter described by Meddings et al.,[17] strategies to prevent CLABSIs and other CVC‐related complications may be designed around the life cycle of a CVC. The life cycle starts with insertion and moves on to the maintenance, removal, and possible reinsertion of the line. The process thus starts with the decision to place the line. Over the last decade, this decision making has changed in part due to PICCs. This shift is reflected in PICC prevalence rates: in 2001, 11% of audited central lines were PICCs compared to 56% in 2007.[5, 6] In our audit, 66% of the CVCs were PICCs. This increase in the use of PICCs may be attributable to the ease and safety of their placement coupled with the increased availability of vascular access placement teams.[18] The risk of overuse that may result from such expediency may be countered by adhering to guidelines such as the Michigan Appropriateness Guide for Intravenous Catheters, which provides both clinically detailed guidance and an impetus for reflective decision making around intravenous access.[19]
The placement of CVCs for prolonged parenteral antibiotics may be a particular subset that bears further exploration. Similar to previous reports, we found that a large number of the CVCs were both inserted for and justified by the need for IV antibiotics.[5] Guidelines delineated by the Infectious Diseases Society of America regarding outpatient parenteral antibiotics weigh both the duration of therapy and the antimicrobial's potential for causing phlebitis when recommending the type of intravascular access.[20] Many courses may therefore be completed through peripheral or midline catheters. Developing strong partnerships between infectious disease specialists, hospitalists, and the facilities or home‐care services treating these patients may curtail the use of CVCs for antimicrobial administration.
The main focus of our work is on facilitating the safe removal of CVCs. The risk of CLABSIs increases each day a CVC is in place, and guidelines to prevent CLABSIs include recommendations to promptly remove nonessential catheters.[4, 21] There is also an emerging understanding that the risk of a PICC‐related CLABSI approaches that from a traditional central line in hospitalized patients, and PICCs confer an increased risk of venous thromboembolism.[18, 22] Although nearly half of surveyed hospitalists recently reported leaving PICCs in place until discharge day, our data suggest that this practice may be driven by the trajectory of a patient's recovery as much as by knowledge gaps related to the use of PICCs.[23] In nearly half the instances, clinical practice already mirrors our proposed guideline, with line removal coinciding with both the timing proposed by our guideline and discharge day. However, there is room for improvement, as line removal may have been expedited in the 29 patients in whom the line was retained after the first idle day. Maintaining an awareness of its presence and weighing its risks and benefits daily may facilitate the removal of a CVC. Based on the recent findings that up to a quarter of clinicians are unaware that their patients have a central line, the mere reminder of the presence of a line using such criteria may expedite its removal by triggering a purposeful reassessment of its ongoing need.[24] Premature CVC removal requiring line reinsertion is an unintended consequence that may emerge from the earlier removal of lines. In our sample, none of the patients who had lines removed either prior to or in accordance with our proposed guideline required a line reinsertion. In addition to line reinsertion, delays in laboratory testing and reporting due to the unavailability of access, increased patient discomfort, or increased workload on the bedside nurse or vascular access team must also be considered when implementing strategies aimed at decreasing line days.
We envisage using these criteria to both empower practitioners with knowledge and foster shared accountability between all team members by using a uniform tool. This can occur through partnerships between infection control, clinical nurse specialists, bedside nursing, and physicians. The electronic medical record could be leveraged to scan the record for the criteria and create a notification when the line becomes idle. In alignment with the Michigan Appropriateness Guide for Intravenous Catheters guidelines, we do not support the removal of lines by nursing staff without physician notification.[19] Such principles have been successfully harnessed in strategies to prevent both catheter‐associated urinary tract infections and CLABSIs in ICUs.[13, 25] In light of the complexity surrounding the decision making for CVCs, our criteria were focused on the wards and erred on the side of clinical caution. This clinical conservatism is apparent in the patients in whom lines were removed prior to what our guideline would propose, yet none of the patients required a line reinsertion. As concerns about recrudescent clinical instability may drive decision making around line removal, such conservatism may be warranted initially. However, the fidelity of these criteria in the clinical setting will need prospective validation. In particular, the inclusion of SIRS criteria may have led to an overestimation of justified days. Further studies may be needed to refine the criteria and find a clinical hierarchy that balances the risks and benefits of retaining a central line.
Our work has certain limitations. It is a single center's experience, and our findings may not therefore be generalizable. Except for when the indication for the line was for difficult access, we did not attempt to verify the presence of a peripheral IV. This, in combination with the inclusion of SIRS criteria, likely leads to an underestimation of idle days. In the interest of focusing on patients in whom the decision making around a line would be the least controversial, we did not continue to follow patients who were transferred to a higher level of care. It is possible, however, that these transfers were precipitated by line‐associated complications such as sepsis and would be important to track. We did not measure the agreement between data collectors, although definitions and methodologies were standardized and reviewed prior to data collection. As this was an observational assessment of a proposed guideline, we cannot predict how the recommendations generated by it will be received by clinicians. Although this may prove to be a barrier in adoption, we hope that the conversation it initiates leads to change.
Hospitalists are positioned to potentially influence the entire life cycle of a central line on the floor. Strategies can be enacted at each stage to help decrease the potential of harm from these devices to our patients. Creating and testing criteria and guidelines such as we propose represents just 1 such strategy in a multidisciplinary effort to provide the best possible care we can.
Acknowledgements
The authors thank Jennifer Dunscomb, Kristen Kelly, and their teams, and Deanna Sidwell, Todd Biggerstaff, Joan Miller, Rob Clark, and the tireless providers at Indiana University Health Methodist Hospital for their support.
Disclosures: This work was supported by the Indiana University Health Values Grant for research. The authors have no conflicts of interests to report.
- , , , , , . Estimating the proportion of healthcare‐associated infections that are reasonably preventable and the related mortality and costs. Infect Control Hosp Epidemiol. 2011;32(2):101–114.
- , , , et al. National Healthcare Safety Network (NHSN) report, data summary for 2012, device‐associated module. Am J Infect Control. 2013;41(12):1148–1166.
- , , . The risk of bloodstream infection in adults with different intravascular devices: a systematic review of 200 published prospective studies. Mayo Clin Proc. 2006;81(9):1159–1171.
- , , , et al. Guidelines for the prevention of intravascular catheter‐related infections. Clin Infect Dis. 2011;52(9):e162–e193.
- , , , et al. Temporary central venous catheter utilization patterns in a large tertiary care center: tracking the “idle central venous catheter.” Infect Control Hosp Epidemiol. 2012;33(1):50–57.
- , , , , , . Unnecessary use of central venous catheters: the need to look outside the intensive care unit. Infect Control Hosp Epidemiol. 2004;25(3):266–268.
- IU Health Methodist Hospital website. Available at: http://iuhealth.org/methodist/aboIut. Accessed October 20, 2014.
- , , , et al. Definitions for Sepsis and Organ Failure and Guidelines for the Use of Innovative Therapies in Sepsis. The ACCP/SCCM Consensus Conference Committee. American College of Chest Physicians/Society of Critical Care Medicine. Chest. 2009;136(5 suppl):e28.
- , , , , , . Acute hypertension: a systematic review and appraisal of guidelines. Ochsner J. 2014;14(4):655–663.
- , , . Predicting clinical deterioration in the hospital: the impact of outcome selection. Resuscitation. 2013;84(5):564–568.
- , , , et al. Multistate point‐prevalence survey of health care–associated infections. N Engl J Med. 2014;370(13):1198–1208.
- , , , et al. Estimating health care‐associated infections and deaths in U.S. hospitals, 2002. Public Health Rep. 2007;122(2):160–166.
- , , , et al. An intervention to decrease catheter‐related bloodstream infections in the ICU. N Engl J Med. 2006;355(26):2725–2732.
- , , , et al. Data summary for 2011, device‐associated module. Centers for Disease Control and Prevention. National Healthcare Safety Network (NHSN) Report. Available at: http://www.cdc.gov/nhsn/PDFs/dataStat/NHSN‐Report‐2011‐Data‐Summary.pdf. Published April 1, 2013. Last accessed January 2015.
- , , . Idle central venous catheter‐days pose infection risk for patients after discharge from intensive care. Am J Infect Control. 2014;42(4):453–455.
- , . Update on emerging infections: news from the Centers for Disease Control and Prevention. Vital signs: central line‐associated blood stream infections—United States, 2001, 2008, and 2009. Ann Emerg Med. 2011;58(5):447–451.
- , , , , , . Reducing unnecessary urinary catheter use and other strategies to prevent catheter‐associated urinary tract infection: an integrative review. BMJ Qual Saf. 2014;23(4):277–289.
- , , , , . The risk of bloodstream infection associated with peripherally inserted central catheters compared with central venous catheters in adults: a systematic review and meta‐analysis. Infect Control Hosp Epidemiol. 2013;34(9):908–918.
- , , , et al. The Michigan Appropriateness Guide for Intravenous Catheters (MAGIC): results from a multispecialty panel using the RAND/UCLA Appropriateness Method. Ann Intern Med. 2015;163(6 suppl):S1–S40.
- , , , et al. Practice guidelines for outpatient parenteral antimicrobial therapy. IDSA guidelines. Clin Infect Dis. 2004;38(12):1651–1672.
- , . Nonuniform risk of bloodstream infection with increasing central venous catheter‐days. Infect Control Hosp Epidemiol. 2005;26(8):715–719.
- , , , et al. Risk of venous thromboembolism associated with peripherally inserted central catheters: a systematic review and meta‐analysis. Lancet. 2013;382(9889):311–325.
- , , , , . Hospitalist experiences, practice, opinions, and knowledge regarding peripherally inserted central catheters: results of a national survey. J Hosp Med. 2013;8(11):635–638.
- , , , et al. Do clinicians know which of their patients have central venous catheters? Ann Intern Med. 2014;161(8):562.
- , , , , , . Reducing foley catheter device days in an intensive care unit: using the evidence to change practice. AACN Adv Crit Care. 2006;17(3):272–283.
- , , , , , . Estimating the proportion of healthcare‐associated infections that are reasonably preventable and the related mortality and costs. Infect Control Hosp Epidemiol. 2011;32(2):101–114.
- , , , et al. National Healthcare Safety Network (NHSN) report, data summary for 2012, device‐associated module. Am J Infect Control. 2013;41(12):1148–1166.
- , , . The risk of bloodstream infection in adults with different intravascular devices: a systematic review of 200 published prospective studies. Mayo Clin Proc. 2006;81(9):1159–1171.
- , , , et al. Guidelines for the prevention of intravascular catheter‐related infections. Clin Infect Dis. 2011;52(9):e162–e193.
- , , , et al. Temporary central venous catheter utilization patterns in a large tertiary care center: tracking the “idle central venous catheter.” Infect Control Hosp Epidemiol. 2012;33(1):50–57.
- , , , , , . Unnecessary use of central venous catheters: the need to look outside the intensive care unit. Infect Control Hosp Epidemiol. 2004;25(3):266–268.
- IU Health Methodist Hospital website. Available at: http://iuhealth.org/methodist/aboIut. Accessed October 20, 2014.
- , , , et al. Definitions for Sepsis and Organ Failure and Guidelines for the Use of Innovative Therapies in Sepsis. The ACCP/SCCM Consensus Conference Committee. American College of Chest Physicians/Society of Critical Care Medicine. Chest. 2009;136(5 suppl):e28.
- , , , , , . Acute hypertension: a systematic review and appraisal of guidelines. Ochsner J. 2014;14(4):655–663.
- , , . Predicting clinical deterioration in the hospital: the impact of outcome selection. Resuscitation. 2013;84(5):564–568.
- , , , et al. Multistate point‐prevalence survey of health care–associated infections. N Engl J Med. 2014;370(13):1198–1208.
- , , , et al. Estimating health care‐associated infections and deaths in U.S. hospitals, 2002. Public Health Rep. 2007;122(2):160–166.
- , , , et al. An intervention to decrease catheter‐related bloodstream infections in the ICU. N Engl J Med. 2006;355(26):2725–2732.
- , , , et al. Data summary for 2011, device‐associated module. Centers for Disease Control and Prevention. National Healthcare Safety Network (NHSN) Report. Available at: http://www.cdc.gov/nhsn/PDFs/dataStat/NHSN‐Report‐2011‐Data‐Summary.pdf. Published April 1, 2013. Last accessed January 2015.
- , , . Idle central venous catheter‐days pose infection risk for patients after discharge from intensive care. Am J Infect Control. 2014;42(4):453–455.
- , . Update on emerging infections: news from the Centers for Disease Control and Prevention. Vital signs: central line‐associated blood stream infections—United States, 2001, 2008, and 2009. Ann Emerg Med. 2011;58(5):447–451.
- , , , , , . Reducing unnecessary urinary catheter use and other strategies to prevent catheter‐associated urinary tract infection: an integrative review. BMJ Qual Saf. 2014;23(4):277–289.
- , , , , . The risk of bloodstream infection associated with peripherally inserted central catheters compared with central venous catheters in adults: a systematic review and meta‐analysis. Infect Control Hosp Epidemiol. 2013;34(9):908–918.
- , , , et al. The Michigan Appropriateness Guide for Intravenous Catheters (MAGIC): results from a multispecialty panel using the RAND/UCLA Appropriateness Method. Ann Intern Med. 2015;163(6 suppl):S1–S40.
- , , , et al. Practice guidelines for outpatient parenteral antimicrobial therapy. IDSA guidelines. Clin Infect Dis. 2004;38(12):1651–1672.
- , . Nonuniform risk of bloodstream infection with increasing central venous catheter‐days. Infect Control Hosp Epidemiol. 2005;26(8):715–719.
- , , , et al. Risk of venous thromboembolism associated with peripherally inserted central catheters: a systematic review and meta‐analysis. Lancet. 2013;382(9889):311–325.
- , , , , . Hospitalist experiences, practice, opinions, and knowledge regarding peripherally inserted central catheters: results of a national survey. J Hosp Med. 2013;8(11):635–638.
- , , , et al. Do clinicians know which of their patients have central venous catheters? Ann Intern Med. 2014;161(8):562.
- , , , , , . Reducing foley catheter device days in an intensive care unit: using the evidence to change practice. AACN Adv Crit Care. 2006;17(3):272–283.