User login
Kidney Disease: Surprising Patients
Q) Recently, I have seen four or five Asian-American patients with really bad kidney function. All of them were thin but had diabetes, hypertension, and a serum creatinine > 2 mg/dL. The kidney disease was a shock to them (and me). Am I missing something here?
Diabetes and hypertension are the most common causes of chronic kidney disease (CKD), with diabetes slightly edging out hypertension for the number 1 slot.1 Although Asian Americans have a tendency toward a lower body mass index (BMI) than the general population, this does not exclude them from developing diabetes or hypertension.
About 20% (1 in 5) of Asian-American adults have both diabetes and hypertension. In fact, Asian Americans with a BMI ≤ 25 often develop type 2 diabetes (T2DM), which is a direct contrast to other racial and ethnic groups in whom T2DM is more prevalent at higher BMIs. The current thinking is that Asian Americans have a higher percentage of body fat at lower BMIs.2 Among racial and ethnic subgroups, Asian Americans have the highest prevalence of undiagnosed diabetes (close to 50%).2
In 2004, after adjusting for lower BMI, McNeely and Boyko found that the incidence of diabetes in Asian Americans was 60% higher than in the Hispanic population.3 In 2015, this influenced the American Diabetes Association (ADA) to change its recommendation for diabetes screening in Asian Americans, lowering the threshold to a BMI of 23.4
Since abdominal or visceral fat is a risk factor for heart disease, hypertension, and diabetes, and it appears that the Asian-American population carries excess fat centrally, this population is also at risk for cardiac disease.5 For that reason, in this population, the American Heart Association recommends measuring waist circumference to screen for hidden abdominal adiposity.6
Thus, the trend you are seeing in your patient population is really only the tip of the iceberg. The Asian-American population is the fastest-growing ethnic group in the United States.3 It’s time to update your diabetes screening protocols. —SWM
Shushanne Wynter-Minott, DNP, FNP-BC
Memorial Healthcare System, Hollywood, Florida
References
1. CDC. National Chronic Kidney Disease Fact Sheet, 2014. www.cdc.gov/diabetes/pubs/pdf/kidney_Factsheet.pdf. Accessed February 3, 2016.
2. Menke A, Casagrande S, Geiss L, Cowie CC. Prevalence of and trends in diabetes among adults in the United States, 1988-2012. JAMA. 2015;314(10):1021-1029.
3. McNeely MJ, Boyko EJ. Type 2 diabetes prevalence in Asian Americans: results of a national health survey. Diabetes Care. 2004;27(1):66-69.
4. American Diabetes Association. Standards of medical care in diabetes—2015: summary of revisions. Diabetes Care. 2015;38(suppl):S4.
5. Park YW, Allison DB, Heymsfield SB, Gallagher D. Larger amounts of visceral adipose tissue in Asian Americans. Obes Res. 2001;9(7):381-387.
6. Rao G, Powell-Wiley TM, Ancheta I, et al; American Heart Association Obesity Committee of the Council on Lifestyle and Cardiometabolic Health. Identification of obesity and cardiovascular risk in ethnically and racially diverse populations: a scientific statement from the American Heart Association. Circulation. 2015;132(5):457-472.
| Clinician Reviews in partnership with |
Renal Consult is edited by Jane S. Davis, CRNP, DNP, a member of the Clinician Reviews editorial board, who is a nurse practitioner in the Division of Nephrology at the University of Alabama at Birmingham and is the communications chairperson for the National Kidney Foundation’s Council of Advanced Practitioners (NKF-CAP); and Kim Zuber, PA-C, MSPS, DFAAPA, a retired PA who works with the American Academy of Nephrology PAs and is also past chair of the NKF-CAP. This month’s responses were authored by Shushanne Wynter-Minott, DNP, FNP-BC, who practices with Memorial Healthcare System in Hollywood, Florida, and Cindy Smith, DNP, APRN, CNN-NP, FNP-BC, who practice with Renal Consultants, PLLC, in South Charleston, West Virgina.
Q) Recently, I have seen four or five Asian-American patients with really bad kidney function. All of them were thin but had diabetes, hypertension, and a serum creatinine > 2 mg/dL. The kidney disease was a shock to them (and me). Am I missing something here?
Diabetes and hypertension are the most common causes of chronic kidney disease (CKD), with diabetes slightly edging out hypertension for the number 1 slot.1 Although Asian Americans have a tendency toward a lower body mass index (BMI) than the general population, this does not exclude them from developing diabetes or hypertension.
About 20% (1 in 5) of Asian-American adults have both diabetes and hypertension. In fact, Asian Americans with a BMI ≤ 25 often develop type 2 diabetes (T2DM), which is a direct contrast to other racial and ethnic groups in whom T2DM is more prevalent at higher BMIs. The current thinking is that Asian Americans have a higher percentage of body fat at lower BMIs.2 Among racial and ethnic subgroups, Asian Americans have the highest prevalence of undiagnosed diabetes (close to 50%).2
In 2004, after adjusting for lower BMI, McNeely and Boyko found that the incidence of diabetes in Asian Americans was 60% higher than in the Hispanic population.3 In 2015, this influenced the American Diabetes Association (ADA) to change its recommendation for diabetes screening in Asian Americans, lowering the threshold to a BMI of 23.4
Since abdominal or visceral fat is a risk factor for heart disease, hypertension, and diabetes, and it appears that the Asian-American population carries excess fat centrally, this population is also at risk for cardiac disease.5 For that reason, in this population, the American Heart Association recommends measuring waist circumference to screen for hidden abdominal adiposity.6
Thus, the trend you are seeing in your patient population is really only the tip of the iceberg. The Asian-American population is the fastest-growing ethnic group in the United States.3 It’s time to update your diabetes screening protocols. —SWM
Shushanne Wynter-Minott, DNP, FNP-BC
Memorial Healthcare System, Hollywood, Florida
References
1. CDC. National Chronic Kidney Disease Fact Sheet, 2014. www.cdc.gov/diabetes/pubs/pdf/kidney_Factsheet.pdf. Accessed February 3, 2016.
2. Menke A, Casagrande S, Geiss L, Cowie CC. Prevalence of and trends in diabetes among adults in the United States, 1988-2012. JAMA. 2015;314(10):1021-1029.
3. McNeely MJ, Boyko EJ. Type 2 diabetes prevalence in Asian Americans: results of a national health survey. Diabetes Care. 2004;27(1):66-69.
4. American Diabetes Association. Standards of medical care in diabetes—2015: summary of revisions. Diabetes Care. 2015;38(suppl):S4.
5. Park YW, Allison DB, Heymsfield SB, Gallagher D. Larger amounts of visceral adipose tissue in Asian Americans. Obes Res. 2001;9(7):381-387.
6. Rao G, Powell-Wiley TM, Ancheta I, et al; American Heart Association Obesity Committee of the Council on Lifestyle and Cardiometabolic Health. Identification of obesity and cardiovascular risk in ethnically and racially diverse populations: a scientific statement from the American Heart Association. Circulation. 2015;132(5):457-472.
Kidney Disease: Unexpected Consequences
Q) We were operating on a 58-year-old woman for a subcapital fracture of her right hip. The orthopedist mentioned that the patient had kidney disease and that it probably caused her hip fracture. I didn’t know kidney disease causes hip fractures. Is this true?
Evolving evidence suggests an association between diminishing renal function and increased risk for fracture. Here’s a look at the available data:
Atherosclerosis Risk in Communities (ARIC) Study. During a median 13 years’ follow-up of 10,955 community-based older adults, investigators identified higher albuminuria level and decreased creatinine-based estimated glomerular filtration rate (eGFR) as significant risk factors for fracture. Other risk factors included older age, race (Caucasians had the highest incidence), and sex (women were more likely than men to sustain a fracture). A nonlinear relationship was observed between eGFR and fracture diagnosis, with a graded association between fracture and albuminuria level.7
Cardiovascular Health Study. In this study of 4,699 older community-based adults, kidney function was assessed by measurement of serum cystatin C. During a mean follow-up of 7.1 years, higher cystatin C levels correlated to a higher risk for hip fracture in both sexes. In women, there was a significant association between diminishing renal function and hip fracture status: Those with lower eGFRs had a higher incidence of fractures. There was a similar magnitude of association among men, but it was not significant.8
Health, Aging and Body Composite Study. In 2,754 older adults, an association was noted between decreased femoral neck bone mineral density (BMD) and increased risk for fracture in those with and without CKD stage 3 to 5. With a concurrent diagnosis of osteoporosis, there was a 110% increased risk for nonspinal fracture in those with CKD and a 63% increased risk for those without CKD.9 In a study of 485 adult hemodialysis patients, decreased total hip and femoral neck BMD was associated with an increased risk for fractures in women with parathyroid hormone levels on the lower range of acceptable in this population (intact parathyroid hormone level [IPTH] < 204 pg/mL) and for spinal fractures in both genders.10
Bone changes associated with deterioration of renal function are complex and multifactorial. Human bone is a composite of protein fused to mineral crystals, primarily calcium and phosphate. Bone is dynamic, being broken down and rebuilt throughout adulthood, with the skeleton almost completely rebuilt every 10 years.11
CKD–mineral and bone disorder (CKD–MBD) is a systemic disorder seen in those with kidney disease that affects bone and mineral metabolism. Its manifestations include abnormalities in the bone, calcifications of vascular and/or soft tissues, abnormal vitamin D metabolism, and disruptions in the phosphorus, calcium, and parathyroid hormone levels. These components, and the severity of the condition, vary by stage of CKD. One component of CKD–MBD, renal osteodystrophy, is associated with changes in bone morphology and is definitively diagnosed by bone biopsy.12
Care of these patients is complex and can be compounded by osteoporosis and/or loss of bone strength. Osteoporosis, like CKD, increases in incidence with age and is associated with fracture risk.11
While useful for diagnosing osteoporosis and predicting fracture risk in the general population, dual-energy X-ray densitometry (DXA) has not been recommended in those with CKD due to the type of bone changes that occur with diminished renal function.12 However, evolving evidence regarding use of DXA in these patients prompted a Kidney Disease: Improving Global Outcomes (KDIGO) “controversies” conference to recommend reexamination of the evidence regarding this recommendation.13 KDIGO’s 2009 clinical practice guideline on CKD–MBD (http://kdigo.org/home/mineral-bone-disorder/) can be of benefit in the assessment and care of affected patients. —CS
Cindy Smith, DNP, APRN, CNN-NP, FNP-BC
Renal Consultants, PLLC, South Charleston, West Virgina
References
7. Daya NR, Voskertchian A, Schneider ALC, et al. Kidney function and fracture risk: the Atherosclerosis Risk in Communities (ARIC) study. Am J Kidney Dis. 2016;67(2):218-226.
8. Fried LF, Biggs ML, Shlipak MG, et al. Association of kidney function with incident hip fracture in older adults. J Am Soc Nephrol. 2007;18:282-286.
9. Yenchek RH, Ix JH, Shlipak MG, et al. Bone mineral density and fracture risk in older individuals with CKD. Clin J Am Soc Nephrol. 2012;7(7):1130-1136.
10. Iimori S, Mori Y, Akita W, et al. Diagnostic usefulness of bone mineral density and biochemical markers of bone turnover in predicting fracture in CKD stage 5D patients—a single-center cohort study. Nephrol Dial Transplant. 2012;27:345-351.
11. Office of the Surgeon General (US). Bone Health and Osteoporosis: a Report of the Surgeon General. Rockville, MD: Office of the Surgeon General; 2004.
12. Kidney Disease: Improving Global Outcomes (KDIGO) CKD-MBD Work Group. KDIGO clinical practice guideline for the diagnosis, evaluation, prevention and treatment of chronic kidney disease-mineral and bone disorder (CKD-MBD). Kidney Int Suppl. 2009;113:S1-S130.
13. Ketteler M, Elder GJ, Evenepoel P, et al. Revisiting KDIGO clinical practice guideline on chronic kidney disease-mineral and bone disorder: a commentary from a Kidney Disease: Improving Global Outcomes controversies conference. Kidney Int. 2015;87(3):502-528.
| Clinician Reviews in partnership with |
Renal Consult is edited by Jane S. Davis, CRNP, DNP, a member of the Clinician Reviews editorial board, who is a nurse practitioner in the Division of Nephrology at the University of Alabama at Birmingham and is the communications chairperson for the National Kidney Foundation’s Council of Advanced Practitioners (NKF-CAP); and Kim Zuber, PA-C, MSPS, DFAAPA, a retired PA who works with the American Academy of Nephrology PAs and is also past chair of the NKF-CAP. This month’s responses were authored by Shushanne Wynter-Minott, DNP, FNP-BC, who practices with Memorial Healthcare System in Hollywood, Florida, and Cindy Smith, DNP, APRN, CNN-NP, FNP-BC, who practice with Renal Consultants, PLLC, in South Charleston, West Virgina.
Q) We were operating on a 58-year-old woman for a subcapital fracture of her right hip. The orthopedist mentioned that the patient had kidney disease and that it probably caused her hip fracture. I didn’t know kidney disease causes hip fractures. Is this true?
Evolving evidence suggests an association between diminishing renal function and increased risk for fracture. Here’s a look at the available data:
Atherosclerosis Risk in Communities (ARIC) Study. During a median 13 years’ follow-up of 10,955 community-based older adults, investigators identified higher albuminuria level and decreased creatinine-based estimated glomerular filtration rate (eGFR) as significant risk factors for fracture. Other risk factors included older age, race (Caucasians had the highest incidence), and sex (women were more likely than men to sustain a fracture). A nonlinear relationship was observed between eGFR and fracture diagnosis, with a graded association between fracture and albuminuria level.7
Cardiovascular Health Study. In this study of 4,699 older community-based adults, kidney function was assessed by measurement of serum cystatin C. During a mean follow-up of 7.1 years, higher cystatin C levels correlated to a higher risk for hip fracture in both sexes. In women, there was a significant association between diminishing renal function and hip fracture status: Those with lower eGFRs had a higher incidence of fractures. There was a similar magnitude of association among men, but it was not significant.8
Health, Aging and Body Composite Study. In 2,754 older adults, an association was noted between decreased femoral neck bone mineral density (BMD) and increased risk for fracture in those with and without CKD stage 3 to 5. With a concurrent diagnosis of osteoporosis, there was a 110% increased risk for nonspinal fracture in those with CKD and a 63% increased risk for those without CKD.9 In a study of 485 adult hemodialysis patients, decreased total hip and femoral neck BMD was associated with an increased risk for fractures in women with parathyroid hormone levels on the lower range of acceptable in this population (intact parathyroid hormone level [IPTH] < 204 pg/mL) and for spinal fractures in both genders.10
Bone changes associated with deterioration of renal function are complex and multifactorial. Human bone is a composite of protein fused to mineral crystals, primarily calcium and phosphate. Bone is dynamic, being broken down and rebuilt throughout adulthood, with the skeleton almost completely rebuilt every 10 years.11
CKD–mineral and bone disorder (CKD–MBD) is a systemic disorder seen in those with kidney disease that affects bone and mineral metabolism. Its manifestations include abnormalities in the bone, calcifications of vascular and/or soft tissues, abnormal vitamin D metabolism, and disruptions in the phosphorus, calcium, and parathyroid hormone levels. These components, and the severity of the condition, vary by stage of CKD. One component of CKD–MBD, renal osteodystrophy, is associated with changes in bone morphology and is definitively diagnosed by bone biopsy.12
Care of these patients is complex and can be compounded by osteoporosis and/or loss of bone strength. Osteoporosis, like CKD, increases in incidence with age and is associated with fracture risk.11
While useful for diagnosing osteoporosis and predicting fracture risk in the general population, dual-energy X-ray densitometry (DXA) has not been recommended in those with CKD due to the type of bone changes that occur with diminished renal function.12 However, evolving evidence regarding use of DXA in these patients prompted a Kidney Disease: Improving Global Outcomes (KDIGO) “controversies” conference to recommend reexamination of the evidence regarding this recommendation.13 KDIGO’s 2009 clinical practice guideline on CKD–MBD (http://kdigo.org/home/mineral-bone-disorder/) can be of benefit in the assessment and care of affected patients. —CS
Cindy Smith, DNP, APRN, CNN-NP, FNP-BC
Renal Consultants, PLLC, South Charleston, West Virgina
References
7. Daya NR, Voskertchian A, Schneider ALC, et al. Kidney function and fracture risk: the Atherosclerosis Risk in Communities (ARIC) study. Am J Kidney Dis. 2016;67(2):218-226.
8. Fried LF, Biggs ML, Shlipak MG, et al. Association of kidney function with incident hip fracture in older adults. J Am Soc Nephrol. 2007;18:282-286.
9. Yenchek RH, Ix JH, Shlipak MG, et al. Bone mineral density and fracture risk in older individuals with CKD. Clin J Am Soc Nephrol. 2012;7(7):1130-1136.
10. Iimori S, Mori Y, Akita W, et al. Diagnostic usefulness of bone mineral density and biochemical markers of bone turnover in predicting fracture in CKD stage 5D patients—a single-center cohort study. Nephrol Dial Transplant. 2012;27:345-351.
11. Office of the Surgeon General (US). Bone Health and Osteoporosis: a Report of the Surgeon General. Rockville, MD: Office of the Surgeon General; 2004.
12. Kidney Disease: Improving Global Outcomes (KDIGO) CKD-MBD Work Group. KDIGO clinical practice guideline for the diagnosis, evaluation, prevention and treatment of chronic kidney disease-mineral and bone disorder (CKD-MBD). Kidney Int Suppl. 2009;113:S1-S130.
13. Ketteler M, Elder GJ, Evenepoel P, et al. Revisiting KDIGO clinical practice guideline on chronic kidney disease-mineral and bone disorder: a commentary from a Kidney Disease: Improving Global Outcomes controversies conference. Kidney Int. 2015;87(3):502-528.
Shortness of Breath and Loss of Appetite
Answer
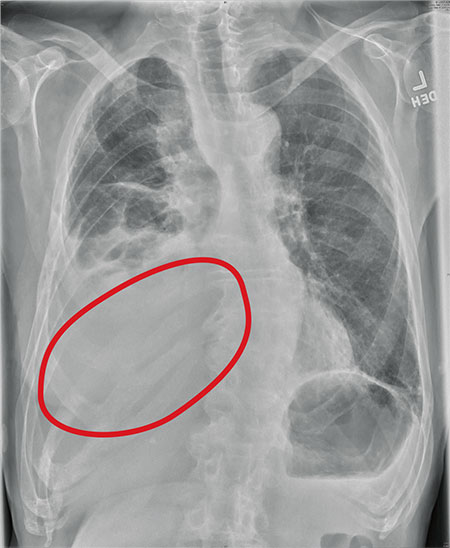
The radiograph shows several abnormalities: There is a moderate to large right pleural effusion, as well as a parenchymal density within the right lower lobe. In addition, several of the ribs have a mottled appearance.
All of these findings are highly suspicious for primary as well as metastatic carcinoma. The patient was admitted to the hospital for further workup.
Answer
The radiograph shows several abnormalities: There is a moderate to large right pleural effusion, as well as a parenchymal density within the right lower lobe. In addition, several of the ribs have a mottled appearance.
All of these findings are highly suspicious for primary as well as metastatic carcinoma. The patient was admitted to the hospital for further workup.
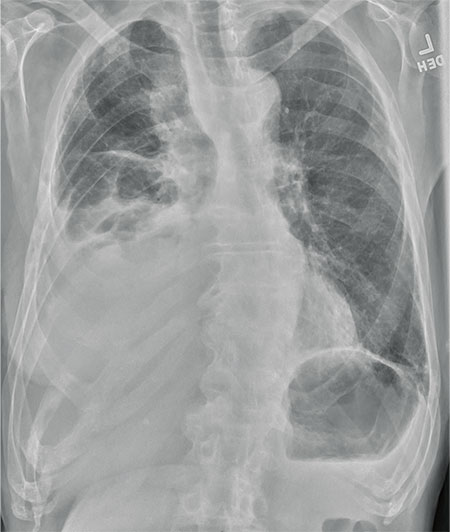
An 80-year-old man presents with a complaint of acute shortness of breath. He says he has had difficulty breathing for the past two months, but the problem has worsened in the past two days. He reports experiencing dyspnea on exertion and denies fever or chills. He says he has had no appetite lately, adding that he’s lost about 20 to 30 lb in the past couple of months. Medical history is significant for atrial fibrillation, hypothyroidism, hyperlipidemia, and remote bladder cancer. He is a former heavy smoker who quit about 30 years ago. On initial assessment, you note an elderly male in mild respiratory distress. His vital signs are stable, except for his O2 saturation, which is 90% on room air. On auscultation, you note decreased breath sounds on the right and occasional wheezing. You order some preliminary lab work, as well as a chest radiograph. What is your impression?

Cold and Fever Followed by Chest Discomfort
ANSWER
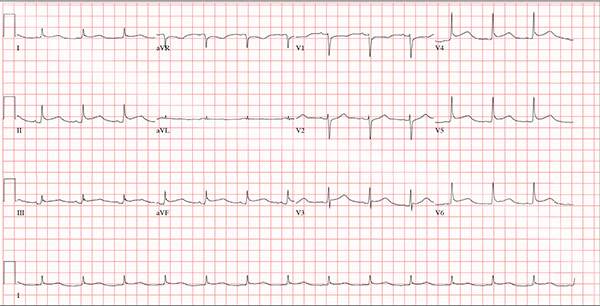
This ECG demonstrates normal sinus rhythm and diffuse ST elevations consistent with a diagnosis of pericarditis.
Although the QTc interval is long, it is due to the ST changes of pericarditis. Comparison with previous ECGs documented normal QTc intervals.
The patient’s pericarditis is most likely related to his recent viral illness. Following treatment with indomethacin, his symptoms resolved and his ECG normalized. Also, his abscess was managed by the surgical service and has since resolved.
ANSWER
This ECG demonstrates normal sinus rhythm and diffuse ST elevations consistent with a diagnosis of pericarditis.
Although the QTc interval is long, it is due to the ST changes of pericarditis. Comparison with previous ECGs documented normal QTc intervals.
The patient’s pericarditis is most likely related to his recent viral illness. Following treatment with indomethacin, his symptoms resolved and his ECG normalized. Also, his abscess was managed by the surgical service and has since resolved.

A 47-year-old man presents with a five-day history of chest discomfort that he describes as vague and achy but not painful. The discomfort does not radiate to his arm or neck and is not affected by activity. About six weeks ago, the patient says, he developed a severe viral cold that had him bedridden for several days. During his illness, his temperature reached 102°F for three or four days, and he developed a rash that subsided around the time his fever did. He had shortness of breath then, but not now. He adds, however, that if he takes a deep breath, coughs, or sneezes, he feels a shooting pain beneath his sternum. Medical history is remarkable for hypertension, type 2 diabetes, and Wolff-Parkinson-White syndrome. Surgical history includes a left inguinal hernia repair at age 6, an appendectomy for acute appendicitis at age 13, and a successful catheter ablation at age 24. The patient, a long-haul trucker, is on the road five days a week and home on weekends. He is married and has four teenage children. He does not smoke or use recreational drugs; the company he works for performs weekly drug checks and offers financial incentives to employees who do not smoke. Family history reveals that his father died at age 68 of complications of diabetes. His 64-year-old mother is alive and well and has no health issues of which he is aware. His grandparents are deceased, and he has no information on their medical history. His medication list includes metoprolol, glyburide, and metformin. He has no known drug allergies. Review of systems reveals that he has recently developed an abscess on his left buttock that he says he needs to get fixed. He wears glasses and has several teeth with dental caries. He denies any symptoms suggestive of diabetic neuropathy. The remainder of the review is normal. Physical exam reveals that he weighs 228 lb and stands 76 in tall. Vital signs include a blood pressure of 138/84 mm Hg; pulse, 80 beats/min and regular; respiratory rate, 14 breaths/min-1; temperature, 99°F; and O2 saturation, 97% on room air. Pertinent physical findings include clear lungs bilaterally and a friction rub over the entire precordium. The abdomen is soft and nontender. There is a 1-cm abscess located 2 cm left of the sacrum that is fluctuant and tender to palpation. There is no peripheral edema. All pulses are present and strong bilaterally, and there are no focal neurologic findings. Laboratory tests reveal a normal blood chemistry panel. The complete blood count is remarkable for a white blood cell count of 12,000 cells/µL. In light of the friction rub, an ECG is obtained. It shows a ventricular rate of 82 beats/min; PR interval, 130 ms; QRS duration, 90 ms; QT/QTc interval, 442/516 ms; P axis, 78°; R axis, 59°; and T axis, 73°. What is your interpretation of this ECG?
Lesion Is Tender and Bleeds Copiously
ANSWER
The correct answer is pyogenic granuloma (choice “d”), further discussion of which follows. Bacillary angiomatosis (choice “a”) is a lesion caused by infection with a species of Bartonella—a distinctly unusual problem. While a retained foreign body (choice “b”), such as a splinter, could trigger a similar lesion, there was no relevant history to suggest this was the case here. The most concerning differential item, melanoma (choice “c”), can present as a glistening red nodule, especially in children, but this too would be quite unusual.
DISCUSSION
Pyogenic granuloma (PG) was the name originally given to these common lesions, which are neither pyogenic (pus producing) nor truly granulomatous (demonstrating a classic histologic pattern). Rather, they are the body’s frustrated attempt to lay down new blood supply in a healing but oft-traumatized lesion (eg, acne lesion, tag, nevus, or wart).
Other names for them include sclerosing hemangioma and lobular capillary hemangioma. Their appearance can vary from the classic look seen in this case to older lesions that tend to be drier and more warty.
PGs are far more common in children than in adults and greatly favor females over males. Pregnancy appears to trigger them, especially in the mouth, but they can appear on fingers, nipples, or even the scalp. Certain drugs, such as isotretinoin and certain chemotherapy agents, predispose to their formation.
PGs removed from children (by shave technique, followed by electrodesiccation and curettage) must be sent for pathologic examination to rule out nodular melanoma. That’s what was done in this case, with the pathology report confirming the expected vascular nature of the lesion.
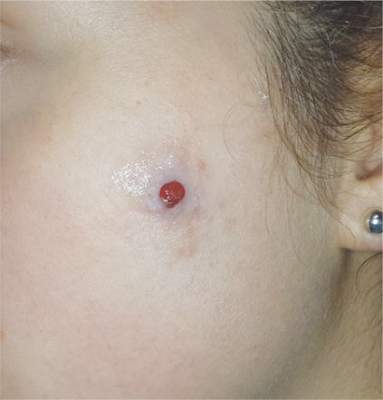
The lesion on the face of this 16-year-old girl is slightly tender to the touch and bleeds copiously with even minor trauma. It manifested several months ago and has persisted even after a course of oral antibiotics (trimethoprim/sulfa) as well as twice-daily application of mupirocin ointment. Prior to the lesion’s appearance, the girl experienced an acne flare. Her mother, who is present, says her daughter “just couldn’t leave it alone” and was often observed picking at the problem area. The patient is otherwise healthy. The lesion in question measures about 1.6 cm. It comprises a round, flesh-colored, 1-cm nodule in the center of which is a bright red, glistening 5-mm papule. There is no erythema in or around the lesion or any palpable adenopathy. The rest of the patient’s exposed skin is unremarkable.

Vulvar pain in pregnancy
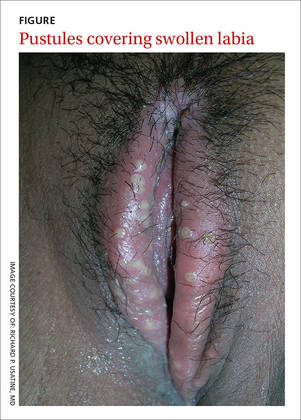
A 30-year-old pregnant woman presented to a rural Panamanian hospital with new onset genital pain, vaginal itching, and dysuria that she’d had for 48 hours. The patient was in the first trimester of her pregnancy and indicated that she’d had recent unprotected sex with a new partner who wasn’t the father of the developing fetus. The patient had never experienced symptoms like these before and denied ever having a sexually transmitted infection (STI). On physical exam, the physician noted numerous pustules covering tender, swollen labia (FIGURE). A small amount of white discharge was noted at the introitus.
HOW WOULD YOU TREAT THIS PATIENT?
Diagnosis: Herpes simplex virus
The physician on-call diagnosed candida vaginitis along with a bacterial skin infection, and admitted the patient to the hospital for intravenous (IV) antibiotics. Fortunately, we were there on a medical mission and were consulted on the case.
We diagnosed a primary herpes simplex virus type 2 (HSV-2) infection in this patient, based on the classic presentation of grouped pustules and vesicles on erythematous and swollen labia, and the patient’s complaint of dysuria.
Herpes cultures weren’t available in the hospital, but the clinical picture was unmistakable for HSV infection. Since multiple STIs may occur simultaneously, we ordered a serum rapid plasma reagin (RPR) test for syphilis, and tested her urine for gonorrhea and chlamydia. The tests were negative.
Differential Dx includes other STIs and a fixed drug eruption
Herpes is a common STI and most people don’t have symptoms. In 2012, an estimated 417 million people worldwide were living with genital herpes caused by HSV-2.1
The differential diagnosis for HSV infection includes primary syphilis, chancroid, folliculitis, and fixed drug eruptions.
Primary syphilis (Treponema pallidum) commonly presents with a painless, ulcerated, clean-based ulcer. While the chancre of primary syphilis can sometimes be painful, this patient did not have ulcers at the time of her presentation. Her pustules would likely ulcerate over time, but would not resemble the chancre of syphilis.
Chancroid (Haemophilus ducreyi) is a less common STI than syphilis and HSV infection. It presents with deep, sharply defined, purulent ulcers that are often associated with painful adenopathy. The ulcers can appear grey or yellowish in color.
Folliculitis presents with pustules surrounding hair follicles. Some of the pustules were surrounding hair follicles in this patient’s case, but others were independent of the hair. The patient’s marked swelling and tenderness along with dysuria also did not fit the characteristics of folliculitis.
Fixed drug eruptions can occur in the genital region, but the patient had neither bullous nor ulcerated eruptions (as one would expect with this condition). Fixed drug eruptions are usually hyperpigmented and require a history of taking medication, such as an antibiotic or a nonsteroidal anti-inflammatory drug.
Questions that help narrow the differential. Zeroing in on the cause of a patient’s genital lesions requires that you ask whether the lesions are painful, if the patient has dysuria, if there are any constitutional symptoms, and if this has happened before. Other distinguishing factors include enlarged lymph nodes and the presence of multiple (vs single) lesions.
Viral cell cultures are the preferred lab test
Common laboratory tests to make the diagnosis include viral culture, direct fluorescence antibody (DFA), polymerase chain reaction (PCR), and type-specific serologic tests.
Viral cell culture is the preferred test for suspected HSV of the skin and mucous membranes.2 PCR is the preferred test for suspected herpes meningitis or encephalitis when cerebrospinal fluid has been obtained through lumbar puncture.3 DFA and herpes culture can be ordered simultaneously. DFA can provide a quick result, and herpes culture can provide a more sensitive result (this may take 5-7 days before results are available).
No evidence that antivirals pose risk during pregnancy
Treatment with antivirals (acyclovir, famciclovir, or valacyclovir) may help to reduce the length of the outbreak. Oral antivirals are usually sufficient for uncomplicated HSV; IV antivirals may be needed in complicated cases. The current recommendation for acyclovir (the most commonly prescribed drug for HSV infection) is 400 mg 3 times daily or 200 mg 5 times daily for 7 to 10 days in a primary outbreak.3
Antiviral therapy is most effective if begun within 72 hours of symptom onset in primary herpes genitalis.4 Analgesics can help with pain control and sitz baths are helpful for women with severe dysuria.
Maternal–fetal transmission of HSV is associated with significant morbidity and mortality in children.5 The Centers for Disease Control and Prevention and the American College of Obstetricians and Gynecologists recommend that cesarean delivery be offered as soon as possible to women who have active HSV lesions or, in those with a history of genital herpes, symptoms of vulvar pain or burning at the time of delivery.3
There is no evidence that the use of antiviral agents in women who are pregnant and have a history of genital herpes prevents perinatal transmission of HSV to neonates.6 However, antenatal antiviral prophylaxis has been shown to reduce viral shedding, recurrences at delivery, and the need for cesarean delivery.7
Our patient was treated with oral acyclovir 400 mg 3 times a day for 10 days. One day after seeking care, she had less pain, swelling, and tenderness and was discharged. (Based on the severity of the outbreak and lack of sanitary living conditions, hospitalization was the safest and most reliable option.) The patient was counseled on the ramifications of HSV infection in pregnancy, including the fact that she might need a cesarean section. She was told that she must get prenatal care and that she needed to tell her primary care physician about her HSV infection. She was also warned about the risk of disease transmission to sexual partners and the importance of using barrier contraception to minimize the risk of future transmission.
CORRESPONDENCE
Luke Wallis, BS, 6410 Rambling Trail Drive, San Antonio, TX 78240; [email protected].
1. World Health Organization. Herpes simplex virus. World Health Organization Web site. Available at: http://www.who.int/mediacentre/factsheets/fs400/en/. Accessed February 8, 2016.
2. Ramaswamy M, McDonald C, Smith M, et al. Diagnosis of genital herpes by real time PCR in routine clinical practice. Sex Transm Infect. 2004;80:406-410.
3. Workowski KA, Berman S; Centers for Disease Control and Prevention (CDC). Sexually transmitted diseases treatment guidelines, 2010. MMWR Recomm Rep. 2010;59:1-110.
4. Cernik C, Gallina K, Brodell RT. The treatment of herpes simplex infections: an evidence-based review. Arch Intern Med. 2008;168:1137-1144.
5. Flagg EW, Weinstock H. Incidence of neonatal herpes simplex virus infections in the United States, 2006. Pediatrics. 2011;127:e1-e8.
6. Wenner C, Nashelsky J. Antiviral agents for pregnant women with genital herpes. Am Fam Physician. 2005;72:1807-1808.
7. Hollier LM, Wendel GD. Third trimester antiviral prophylaxis for preventing maternal genital herpes simplex virus (HSV) recurrences and neonatal infection. Cochrane Database Syst Rev. 2008;CD004946.
A 30-year-old pregnant woman presented to a rural Panamanian hospital with new onset genital pain, vaginal itching, and dysuria that she’d had for 48 hours. The patient was in the first trimester of her pregnancy and indicated that she’d had recent unprotected sex with a new partner who wasn’t the father of the developing fetus. The patient had never experienced symptoms like these before and denied ever having a sexually transmitted infection (STI). On physical exam, the physician noted numerous pustules covering tender, swollen labia (FIGURE). A small amount of white discharge was noted at the introitus.
HOW WOULD YOU TREAT THIS PATIENT?
Diagnosis: Herpes simplex virus
The physician on-call diagnosed candida vaginitis along with a bacterial skin infection, and admitted the patient to the hospital for intravenous (IV) antibiotics. Fortunately, we were there on a medical mission and were consulted on the case.
We diagnosed a primary herpes simplex virus type 2 (HSV-2) infection in this patient, based on the classic presentation of grouped pustules and vesicles on erythematous and swollen labia, and the patient’s complaint of dysuria.
Herpes cultures weren’t available in the hospital, but the clinical picture was unmistakable for HSV infection. Since multiple STIs may occur simultaneously, we ordered a serum rapid plasma reagin (RPR) test for syphilis, and tested her urine for gonorrhea and chlamydia. The tests were negative.
Differential Dx includes other STIs and a fixed drug eruption
Herpes is a common STI and most people don’t have symptoms. In 2012, an estimated 417 million people worldwide were living with genital herpes caused by HSV-2.1
The differential diagnosis for HSV infection includes primary syphilis, chancroid, folliculitis, and fixed drug eruptions.
Primary syphilis (Treponema pallidum) commonly presents with a painless, ulcerated, clean-based ulcer. While the chancre of primary syphilis can sometimes be painful, this patient did not have ulcers at the time of her presentation. Her pustules would likely ulcerate over time, but would not resemble the chancre of syphilis.
Chancroid (Haemophilus ducreyi) is a less common STI than syphilis and HSV infection. It presents with deep, sharply defined, purulent ulcers that are often associated with painful adenopathy. The ulcers can appear grey or yellowish in color.
Folliculitis presents with pustules surrounding hair follicles. Some of the pustules were surrounding hair follicles in this patient’s case, but others were independent of the hair. The patient’s marked swelling and tenderness along with dysuria also did not fit the characteristics of folliculitis.
Fixed drug eruptions can occur in the genital region, but the patient had neither bullous nor ulcerated eruptions (as one would expect with this condition). Fixed drug eruptions are usually hyperpigmented and require a history of taking medication, such as an antibiotic or a nonsteroidal anti-inflammatory drug.
Questions that help narrow the differential. Zeroing in on the cause of a patient’s genital lesions requires that you ask whether the lesions are painful, if the patient has dysuria, if there are any constitutional symptoms, and if this has happened before. Other distinguishing factors include enlarged lymph nodes and the presence of multiple (vs single) lesions.
Viral cell cultures are the preferred lab test
Common laboratory tests to make the diagnosis include viral culture, direct fluorescence antibody (DFA), polymerase chain reaction (PCR), and type-specific serologic tests.
Viral cell culture is the preferred test for suspected HSV of the skin and mucous membranes.2 PCR is the preferred test for suspected herpes meningitis or encephalitis when cerebrospinal fluid has been obtained through lumbar puncture.3 DFA and herpes culture can be ordered simultaneously. DFA can provide a quick result, and herpes culture can provide a more sensitive result (this may take 5-7 days before results are available).
No evidence that antivirals pose risk during pregnancy
Treatment with antivirals (acyclovir, famciclovir, or valacyclovir) may help to reduce the length of the outbreak. Oral antivirals are usually sufficient for uncomplicated HSV; IV antivirals may be needed in complicated cases. The current recommendation for acyclovir (the most commonly prescribed drug for HSV infection) is 400 mg 3 times daily or 200 mg 5 times daily for 7 to 10 days in a primary outbreak.3
Antiviral therapy is most effective if begun within 72 hours of symptom onset in primary herpes genitalis.4 Analgesics can help with pain control and sitz baths are helpful for women with severe dysuria.
Maternal–fetal transmission of HSV is associated with significant morbidity and mortality in children.5 The Centers for Disease Control and Prevention and the American College of Obstetricians and Gynecologists recommend that cesarean delivery be offered as soon as possible to women who have active HSV lesions or, in those with a history of genital herpes, symptoms of vulvar pain or burning at the time of delivery.3
There is no evidence that the use of antiviral agents in women who are pregnant and have a history of genital herpes prevents perinatal transmission of HSV to neonates.6 However, antenatal antiviral prophylaxis has been shown to reduce viral shedding, recurrences at delivery, and the need for cesarean delivery.7
Our patient was treated with oral acyclovir 400 mg 3 times a day for 10 days. One day after seeking care, she had less pain, swelling, and tenderness and was discharged. (Based on the severity of the outbreak and lack of sanitary living conditions, hospitalization was the safest and most reliable option.) The patient was counseled on the ramifications of HSV infection in pregnancy, including the fact that she might need a cesarean section. She was told that she must get prenatal care and that she needed to tell her primary care physician about her HSV infection. She was also warned about the risk of disease transmission to sexual partners and the importance of using barrier contraception to minimize the risk of future transmission.
CORRESPONDENCE
Luke Wallis, BS, 6410 Rambling Trail Drive, San Antonio, TX 78240; [email protected].
1. World Health Organization. Herpes simplex virus. World Health Organization Web site. Available at: http://www.who.int/mediacentre/factsheets/fs400/en/. Accessed February 8, 2016.
2. Ramaswamy M, McDonald C, Smith M, et al. Diagnosis of genital herpes by real time PCR in routine clinical practice. Sex Transm Infect. 2004;80:406-410.
3. Workowski KA, Berman S; Centers for Disease Control and Prevention (CDC). Sexually transmitted diseases treatment guidelines, 2010. MMWR Recomm Rep. 2010;59:1-110.
4. Cernik C, Gallina K, Brodell RT. The treatment of herpes simplex infections: an evidence-based review. Arch Intern Med. 2008;168:1137-1144.
5. Flagg EW, Weinstock H. Incidence of neonatal herpes simplex virus infections in the United States, 2006. Pediatrics. 2011;127:e1-e8.
6. Wenner C, Nashelsky J. Antiviral agents for pregnant women with genital herpes. Am Fam Physician. 2005;72:1807-1808.
7. Hollier LM, Wendel GD. Third trimester antiviral prophylaxis for preventing maternal genital herpes simplex virus (HSV) recurrences and neonatal infection. Cochrane Database Syst Rev. 2008;CD004946.
Working with scribes—the good, the surprising

The clerical work involved in managing the electronic medical record (EMR) is clearly not at the top of the skill set for physicians, yet many office-based clinicians find themselves bogged down in this work with no easy way out.
However, practices that are adopting team-based care—where each team member works at the top of his or her skill set—are finding a solution in the form of scribing, or team documentation. This approach can ease that burden and perhaps even help to curb physician burnout in the process. But many questions still surround this approach, notably: What do we know about the quality of this documentation?
Research conducted by Misra-Hebert et al reported on in this issue provides some insight—and reason for optimism. (See “Medical scribes: How do their notes stack up?”) Their study found that scribes’ outpatient notes stack up quite well when compared to those of physicians. And having worked with this approach to documentation, I can attest to its benefits, as well.
Two approaches, one goal. There are 2 different ways that physicians can get help with documentation. One involves the use of trained scribes, who come from a variety of backgrounds and are charged with writing down, or scribing, what the physician says. The other involves training staff, usually certified medical assistants (CMAs) or licensed practical nurses (LPNs), to take on a wide variety of additional duties including refill management, care gap closure, and most of the duties concerning the EMR—including documentation.
Misra-Hebert et al studied the second approach and found important evidence that using staff in this way does not adversely affect—and may even enhance—documentation previously done entirely by physicians.
This change in the way we approach EMRs involves commitment, as I’ve seen first hand. There needs to be significant training to make this work and there needs to be more staff, since physicians require 2 of these valuable team members to function effectively. (At least that’s been our experience.)
We are in the process of implementing team-based care throughout our 32-location health care system and have found that using CMAs and LPNs to assist with documentation is a “win” for everyone.
1. A win for the patient. Patients immediately notice that their physicians are now able to focus on them during the office visit, since they no longer have to tend to the demands of the computer. In addition, since the CMAs/LPNs are with patients during the entire visit, the patients bond with them and feel the extra support from this relationship.
2. A win for the care team. Physician satisfaction has never been higher. Charts are usually closed at the end of each half-day. There is no need to take work home at night. CMAs/LPNs feel empowered and meaningfully involved in patient care. Their increase in satisfaction mirrors that of the physicians.
3. A win for the system. Not only are quality measures improving, but access improves since this team support increases efficiency. The biggest surprise of all for us was a financial one. We are able to see more patients per day and are billing at a higher level of service, since there is more time to attend to more of the patient’s needs (thanks to the additional team support).
There is much talk about putting joy back into the practice of medicine. But the benchmark of any change needs to be whether it helps our patients. I believe that team documentation does. Happier, less burned-out physicians are able to better focus on patients during their visit. As one patient recently said to me at the end of a visit, “I feel like I’ve got my doctor back.”
That’s something that patients, and doctors alike, can feel good about.
Swollen lymph nodes • patient is otherwise "healthy" • Dx?
THE CASE
A 52-year-old woman presented to our family clinic for a well woman exam. The only complaints she had were fatigue, which she attributed to a work day that began at 4 am, and hot flashes. She denied fever, weight loss, abdominal pain, medication use, or recent foreign travel. She had a history of hyperlipidemia and surgical removal of a cutaneous melanoma at age 12.
Her vital signs and physical exam were normal with the exception of 3 enlarged left inguinal lymph nodes and approximately 5 enlarged right inguinal lymph nodes. The nodes were freely moveable and non-tender. No additional lymphadenopathy or splenomegaly was found.
THE DIAGNOSIS
The patient’s work-up included a Pap smear, complete blood count (CBC), comprehensive metabolic panel (CMP), and pelvic and inguinal ultrasound. All tests were normal, except the ultrasound, which revealed 3 solid left inguinal lymph nodes measuring 1.2 to 1.6 cm and 6 solid right inguinal lymph nodes measuring 1.1 to 1.8 cm. An abdominal and pelvic computed tomography (CT) scan with contrast identified nonspecific mesenteric, inguinal, retrocrural, and retroperitoneal adenopathy. An open biopsy of the largest inguinal lymph node revealed follicular lymphoma, a form of non-Hodgkin’s lymphoma. (Hodgkin’s and non-Hodgkin’s lymphoma (NHL) are uncommon causes of inguinal lymphadenopathy.1)
We consulted Oncology and they recommended a positron emission tomography (PET)/CT scan, which showed widespread lymphadenopathy. A bone marrow biopsy confirmed follicular lymphoma grade II, Ann Arbor stage III.
DISCUSSION
Generalized lymphadenopathy involves lymph node enlargement in more than one region of the body. Lymph nodes >1 cm in adults are considered abnormal and the differential diagnosis is broad (TABLE2-5). A patient’s age is a significant factor in the evaluation of peripheral lymphadenopathy.2-5 Results from one study of 628 patients who underwent nodal biopsy for peripheral lymphadenopathy revealed approximately 80% of nodes in patients under age 30 were noncancerous and likely had an infectious cause.3 However, among patients over age 50, only 40% were noncancerous.3
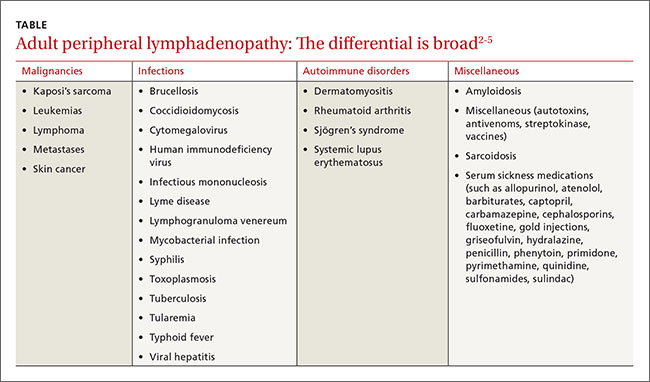
Node enlargement can be palpated in the head, neck, axilla, inguinal, and popliteal areas. Inguinal lymph nodes up to 2 cm in size may be palpable in healthy patients who spend time barefoot outdoors, have chronic leg trauma or infections, or have sexually transmitted infections.6 However, any lymph node >1 cm in adults should be considered abnormal.2-5
Method of diagnosis depends on malignancy risk
A definitive diagnosis in patients with lymph nodes >1 cm can be made by open lymph node biopsy (the gold standard) or fine needle aspiration (FNA); however, these procedures are rarely needed if malignancy risk is low.
Data on the prevalence of malignant peripheral lymphadenopathy is limited.4 Fijten et al reported that among 2556 patients who presented to a family medicine clinic with unexplained lymphadenopathy, the prevalence of malignancy was as low as 1.1%.7 However, the prevalence of malignant lymph nodes among patients referred to a surgical center for biopsy by primary care physicians was approximately 40% to 60%.3 This highlights the importance of a thorough history, physical exam, and referral when appropriate to increase the yield of diagnostic biopsies.
Low risk for malignancy is suggested when lymphadenopathy is present for less than 2 weeks or persists for more than one year with no increase in size.2 Benign causes such as sexually transmitted infections, Epstein-Barr virus, or medications should be treated appropriately. With no cause identified, 4 weeks of observation is recommended before biopsy.2,4,5,8 CT, PET, and biopsy should be considered early for large, concerning masses. No evidence supports empiric antibiotic use for unknown causes.2,5
High risk for malignancy is suggested in patients who are ≥50 years, present with constitutional symptoms, have lymphadenopathy >1 cm in >2 regions of the body, history of cancer, or have nodes that are rapidly enlarging, firm, fixed, or painless.2,3,5,7,9 Supraclavicular lymphadenopathy has the highest risk for malignancy, especially in patients ≥40 years.7 Enlarged iliac, popliteal, epitrochlear, and umbilical lymph nodes are never normal.2,4,5,7,10 Biopsy should be considered early in these patients.2-4,7 FNA or core needle biopsy is acceptable for an initial diagnosis, but negative results may require open biopsy.1,5,8 Prior to biopsy, imaging with ultrasound is recommended.1,2,8,11
Our patient was offered rituximab alone or rituximab in addition to cyclophosphamide, hydroxydoxorubicin, vincristine, and prednisone (R-CHOP). The patient chose rituximab alone, which resulted in a 30% reduction in the size of her intra-abdominal disease. At this point, the patient and her oncologist chose to stop treatment and monitor her clinically.
Three months later, the patient returned to our family clinic complaining of postnasal drip, throat pain, and neck fullness that she’d had for one month that weren’t responsive to over-the-counter remedies and antibiotics. A supervised osteopathic medical student’s exam revealed right tonsillar enlargement (grade 3+) with minimal erythema and no exudates. A neck CT confirmed right tonsillar enlargement. The patient was referred to Otolaryngology, and the surgeon performed a tonsillectomy that demonstrated disease progression to follicular lymphoma grade IIIa. Given the new findings, Oncology recommended R-CHOP and the patient agreed.
The patient completed R-CHOP and her cancer was in remission one year later.
THE TAKEAWAY
Peripheral lymphadenopathy presents a diagnostic challenge that requires a thorough history and physical exam. General wellness exams should incorporate a comprehensive physical that includes the palpation of lymph nodes. Exam challenges include distinguishing benign lymphadenopathy (reactive lymphadenitis) from malignant lymphadenopathy.
In patients with low risk for malignancy, a period of 4 weeks of observation is reasonable. Biopsy should be considered early for risk factors including patient’s age ≥50, constitutional symptoms, lymphadenopathy >1 cm in >2 regions of the body, history of cancer, or rapidly enlarging nodes.
1. Metzgeroth G, Schneider S, Walz C, et al. Fine needle aspiration and core needle biopsy in the diagnosis of lymphadenopathy of unknown aetiology. Ann Hematol. 2012;91:1477-1484.
2. Bazemore AW, Smucker DR. Lymphadenopathy and malignancy. Am Fam Physician. 2002;66:2103-2110.
3. Lee Y, Terry R, Lukes RJ. Lymph node biopsy for diagnosis: a statistical study. J Surg Oncol. 1980;14:53-60.
4. Ferrer R. Lymphadenopathy: differential diagnosis and evaluation. Am Fam Physician. 1998;58:1313-1320.
5. Motyckova G, Steensma DP. Why does my patient have lymphadenopathy or splenomegaly? Hematol Oncol Clin North Am. 2012;26:395-408.
6. Habermann TM, Steensma DP. Lymphadenopathy. Mayo Clin Proc. 2000;75:723-732.
7. Fijten GH, Blijham GH. Unexplained lymphadenopathy in family practice. An evaluation of the probability of malignant causes and the effectiveness of physicians’ workup. J Fam Pract. 1988;27:373-376.
8. Chau I, Kelleher MT, Cunningham D, et al. Rapid access multidisciplinary lymph node diagnostic clinic: analysis of 550 patients. Br J Cancer. 2003;88:354-361.
9. Vassilakopoulos TP, Pangalis GA. Application of a prediction rule to select which patients presenting with lymphadenopathy should undergo a lymph node biopsy. Medicine (Baltimore). 2000;79:338-347.
10. Dar IH, Kamili MA, Dar SH, et al. Sister Mary Joseph nodule-A case report with review of literature. J Res Med Sci. 2009;14:385-387.
11. Cui XW, Jenssen C, Saftoiu A, et al. New ultrasound techniques for lymph node evaluation. World J Gastroenterol. 2013;19:4850-4860.
THE CASE
A 52-year-old woman presented to our family clinic for a well woman exam. The only complaints she had were fatigue, which she attributed to a work day that began at 4 am, and hot flashes. She denied fever, weight loss, abdominal pain, medication use, or recent foreign travel. She had a history of hyperlipidemia and surgical removal of a cutaneous melanoma at age 12.
Her vital signs and physical exam were normal with the exception of 3 enlarged left inguinal lymph nodes and approximately 5 enlarged right inguinal lymph nodes. The nodes were freely moveable and non-tender. No additional lymphadenopathy or splenomegaly was found.
THE DIAGNOSIS
The patient’s work-up included a Pap smear, complete blood count (CBC), comprehensive metabolic panel (CMP), and pelvic and inguinal ultrasound. All tests were normal, except the ultrasound, which revealed 3 solid left inguinal lymph nodes measuring 1.2 to 1.6 cm and 6 solid right inguinal lymph nodes measuring 1.1 to 1.8 cm. An abdominal and pelvic computed tomography (CT) scan with contrast identified nonspecific mesenteric, inguinal, retrocrural, and retroperitoneal adenopathy. An open biopsy of the largest inguinal lymph node revealed follicular lymphoma, a form of non-Hodgkin’s lymphoma. (Hodgkin’s and non-Hodgkin’s lymphoma (NHL) are uncommon causes of inguinal lymphadenopathy.1)
We consulted Oncology and they recommended a positron emission tomography (PET)/CT scan, which showed widespread lymphadenopathy. A bone marrow biopsy confirmed follicular lymphoma grade II, Ann Arbor stage III.
DISCUSSION
Generalized lymphadenopathy involves lymph node enlargement in more than one region of the body. Lymph nodes >1 cm in adults are considered abnormal and the differential diagnosis is broad (TABLE2-5). A patient’s age is a significant factor in the evaluation of peripheral lymphadenopathy.2-5 Results from one study of 628 patients who underwent nodal biopsy for peripheral lymphadenopathy revealed approximately 80% of nodes in patients under age 30 were noncancerous and likely had an infectious cause.3 However, among patients over age 50, only 40% were noncancerous.3
Node enlargement can be palpated in the head, neck, axilla, inguinal, and popliteal areas. Inguinal lymph nodes up to 2 cm in size may be palpable in healthy patients who spend time barefoot outdoors, have chronic leg trauma or infections, or have sexually transmitted infections.6 However, any lymph node >1 cm in adults should be considered abnormal.2-5
Method of diagnosis depends on malignancy risk
A definitive diagnosis in patients with lymph nodes >1 cm can be made by open lymph node biopsy (the gold standard) or fine needle aspiration (FNA); however, these procedures are rarely needed if malignancy risk is low.
Data on the prevalence of malignant peripheral lymphadenopathy is limited.4 Fijten et al reported that among 2556 patients who presented to a family medicine clinic with unexplained lymphadenopathy, the prevalence of malignancy was as low as 1.1%.7 However, the prevalence of malignant lymph nodes among patients referred to a surgical center for biopsy by primary care physicians was approximately 40% to 60%.3 This highlights the importance of a thorough history, physical exam, and referral when appropriate to increase the yield of diagnostic biopsies.
Low risk for malignancy is suggested when lymphadenopathy is present for less than 2 weeks or persists for more than one year with no increase in size.2 Benign causes such as sexually transmitted infections, Epstein-Barr virus, or medications should be treated appropriately. With no cause identified, 4 weeks of observation is recommended before biopsy.2,4,5,8 CT, PET, and biopsy should be considered early for large, concerning masses. No evidence supports empiric antibiotic use for unknown causes.2,5
High risk for malignancy is suggested in patients who are ≥50 years, present with constitutional symptoms, have lymphadenopathy >1 cm in >2 regions of the body, history of cancer, or have nodes that are rapidly enlarging, firm, fixed, or painless.2,3,5,7,9 Supraclavicular lymphadenopathy has the highest risk for malignancy, especially in patients ≥40 years.7 Enlarged iliac, popliteal, epitrochlear, and umbilical lymph nodes are never normal.2,4,5,7,10 Biopsy should be considered early in these patients.2-4,7 FNA or core needle biopsy is acceptable for an initial diagnosis, but negative results may require open biopsy.1,5,8 Prior to biopsy, imaging with ultrasound is recommended.1,2,8,11
Our patient was offered rituximab alone or rituximab in addition to cyclophosphamide, hydroxydoxorubicin, vincristine, and prednisone (R-CHOP). The patient chose rituximab alone, which resulted in a 30% reduction in the size of her intra-abdominal disease. At this point, the patient and her oncologist chose to stop treatment and monitor her clinically.
Three months later, the patient returned to our family clinic complaining of postnasal drip, throat pain, and neck fullness that she’d had for one month that weren’t responsive to over-the-counter remedies and antibiotics. A supervised osteopathic medical student’s exam revealed right tonsillar enlargement (grade 3+) with minimal erythema and no exudates. A neck CT confirmed right tonsillar enlargement. The patient was referred to Otolaryngology, and the surgeon performed a tonsillectomy that demonstrated disease progression to follicular lymphoma grade IIIa. Given the new findings, Oncology recommended R-CHOP and the patient agreed.
The patient completed R-CHOP and her cancer was in remission one year later.
THE TAKEAWAY
Peripheral lymphadenopathy presents a diagnostic challenge that requires a thorough history and physical exam. General wellness exams should incorporate a comprehensive physical that includes the palpation of lymph nodes. Exam challenges include distinguishing benign lymphadenopathy (reactive lymphadenitis) from malignant lymphadenopathy.
In patients with low risk for malignancy, a period of 4 weeks of observation is reasonable. Biopsy should be considered early for risk factors including patient’s age ≥50, constitutional symptoms, lymphadenopathy >1 cm in >2 regions of the body, history of cancer, or rapidly enlarging nodes.
1. Metzgeroth G, Schneider S, Walz C, et al. Fine needle aspiration and core needle biopsy in the diagnosis of lymphadenopathy of unknown aetiology. Ann Hematol. 2012;91:1477-1484.
2. Bazemore AW, Smucker DR. Lymphadenopathy and malignancy. Am Fam Physician. 2002;66:2103-2110.
3. Lee Y, Terry R, Lukes RJ. Lymph node biopsy for diagnosis: a statistical study. J Surg Oncol. 1980;14:53-60.
4. Ferrer R. Lymphadenopathy: differential diagnosis and evaluation. Am Fam Physician. 1998;58:1313-1320.
5. Motyckova G, Steensma DP. Why does my patient have lymphadenopathy or splenomegaly? Hematol Oncol Clin North Am. 2012;26:395-408.
6. Habermann TM, Steensma DP. Lymphadenopathy. Mayo Clin Proc. 2000;75:723-732.
7. Fijten GH, Blijham GH. Unexplained lymphadenopathy in family practice. An evaluation of the probability of malignant causes and the effectiveness of physicians’ workup. J Fam Pract. 1988;27:373-376.
8. Chau I, Kelleher MT, Cunningham D, et al. Rapid access multidisciplinary lymph node diagnostic clinic: analysis of 550 patients. Br J Cancer. 2003;88:354-361.
9. Vassilakopoulos TP, Pangalis GA. Application of a prediction rule to select which patients presenting with lymphadenopathy should undergo a lymph node biopsy. Medicine (Baltimore). 2000;79:338-347.
10. Dar IH, Kamili MA, Dar SH, et al. Sister Mary Joseph nodule-A case report with review of literature. J Res Med Sci. 2009;14:385-387.
11. Cui XW, Jenssen C, Saftoiu A, et al. New ultrasound techniques for lymph node evaluation. World J Gastroenterol. 2013;19:4850-4860.

Taking an integrative approach to migraine headaches
› Ask all patients with migraines about their use of complementary and alternative medicine and what modalities, if any, they have found helpful. A
› Advise patients that while butterbur has been proven effective at reducing migraine frequency, its use requires caution, as products not processed properly may contain hepatotoxic compounds. A
› Caution women who are pregnant or attempting to conceive to avoid feverfew, which may cause uterine contractions. C
Strength of recommendation (SOR)
A Good-quality patient-oriented evidence
B Inconsistent or limited-quality patient-oriented evidence
C Consensus, usual practice, opinion, disease-oriented evidence, case series
Americans who suffer from migraine headaches are far more likely than those who don’t to turn to complementary and alternative medicine (CAM). A 2007 National Health Interview Survey and a subsequent analysis of the results found that just under 50% of adults with migraine headaches used alternative therapies; among those without migraine, 34% did.1,2 What’s more, only about half of the migraine patients who reported the use of CAM modalities mentioned it to their health care providers.2
With migraine affecting some 36 million Americans,3 chances are you are caring for many of them. It is likely, too, that you are unaware of which of your headache patients are using alternative treatments, or what modalities they have tried. The only way to find out is to ask.
Women, who are 3 times more likely than men to suffer from migraine headache,4 are also the greatest users of CAM, particularly biologically based therapies and mind-body practices.5 Use is highly individualized and typically does not involve professional supervision.5
A number of alternative modalities look promising for migraine prevention. As a family physician, you are in an ideal position to guide patients in the use of safe and effective CAM therapies. To do so, however, you need to be familiar with the evidence for or against various options—many of which can be used in conjunction with pharmacotherapy.
An integrative approach to the treatment of migraine headaches makes use of the best available evidence for both conventional and alternative therapies and takes into account the whole person, including all aspects of his or her belief system and lifestyle. It also emphasizes a strong physician-patient relationship, which can have a powerful therapeutic effect.
We wrote this evidence-based update with such an approach in mind. In the text and table that follow, we present the latest findings. But first, a brief review of what constitutes migraine headache and an overview of conventional treatment.
A conventional approach to migraine
Migraine headache is a common and disabling neurologic disorder that frequently goes unrecognized and undertreated.6 It is generally characterized as recurrent headaches that are unilateral, pulsating, moderately severe, aggravated by physical activity, and associated with nausea, vomiting, photophobia, phonophobia, and sometimes a preceding aura. Conventional treatment typically includes abortive treatment for acute migraine, with medications such as the triptans and dihydroergotamine. Acetaminophen, nonsteroidal anti-inflammatory drugs (NSAIDs), and the combination of acetaminophen/aspirin/caffeine are also effective. Opiates are efficacious, but not recommended.7
Prophylactic medications are generally offered to patients experiencing more than 4 migraines per month. The American Academy of Neurology cites strong evidence for the use of divalproex, valproate, topiramate, and beta-blockers, including metoprolol, propranolol, and timolol. Frovatriptan has strong evidence for prevention of menstrual-associated migraine. Common adverse effects include weight loss and parasthesias with topiramate and weight gain and somnolence with valproate, divalproex, and beta-blockers. There is also moderate evidence for the use of amitriptyline, venlafaxine, atenolol, and nadolol. Potential adverse effects must be considered to determine the optimal therapy for individual patients, and trial and error are often required.8
Addressing triggers
Conventional treatment also focuses on identifying and avoiding triggers to the extent possible. Physicians typically advise patients to keep a headache diary, recording details about diet and lifestyle, triggers, frequency and intensity of attacks, and possible patterns of headaches due to medication overuse.
Sleep disturbances and stress are common triggers, and instruction in sleep hygiene and stress reduction, as well as screening for anxiety or depression, can be beneficial. Other frequently reported factors believed to trigger or aggravate migraine attacks are skipping meals, particular foods, alcohol, weather changes, and exposure to light, sounds, and odors.
Despite the focus on migraine triggers, however, clinical studies of the role they play have shown conflicting results. A recent study involving 27 patients7 found that when attempting to provoke migraine with aura using participants’ self-reported triggers, only 3 individuals reported that the provocation actually led to a migraine.9 Additional studies suggest that exposure to headache triggers has the same effect as exposure to anxiety, with short-term exposure associated with an increased pain response and prolonged exposure leading to a decreased response.10,11 Thus, it may be beneficial to advise patients to learn to cope with controlled exposure to triggers rather than to aim for trigger avoidance.12
If noise is identified as a trigger, for instance, repeated exposure in a relaxed environment can help desensitize the patient. Triggers such as visual disturbances and odors are also good candidates for desensitization, while others, such as sleep deprivation and skipping meals, are better served by avoidance.12
CAM approaches: A look at the evidence
Acupuncture, butterbur, feverfew, magnesium, riboflavin, and biofeedback look promising for migraine prevention. Many of our patients are already using these and other alternative therapies. Here’s what the latest studies show (TABLE).2,9-11, 13-51
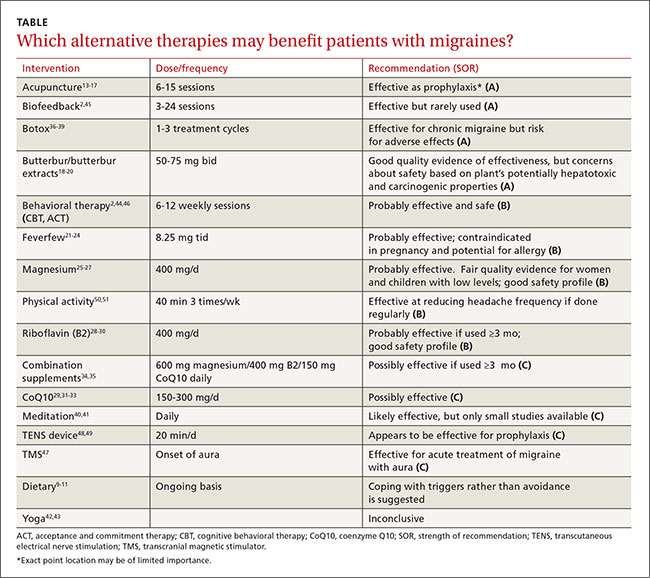
Can acupuncture help?
A 2009 Cochrane review of 22 high-quality studies with a total of 4419 participants supports the use of acupuncture for migraine prophylaxis.13 Acupuncture was found to be superior to no prophylactic treatment and acute treatment alone, and as effective as conventional preventive medications. Interestingly, though, among studies included in the Cochrane review that compared true acupuncture with sham interventions, no significant difference in results was found.
A more recent meta-analysis of 29 studies representing nearly 18,000 patients did show true acupuncture to be statistically superior to sham acupuncture, although the difference was of small clinical significance. Sham acupuncture was also shown to have a larger clinical effect than oral placebos, raising questions about the importance of exact point location.14
In a 2015 study comparing real and sham acupuncture over a 20-week period, however, the differences were more marked. Those who received real acupuncture reported significantly fewer migraine days and less severe headaches, and there were more responders in the treatment group compared with recipients of the sham procedures.15 Overall, the evidence indicates that acupuncture is at least as effective as conventional drug treatment for migraine prophylaxis, but with fewer adverse effects.13-17
Butterbur raises concerns about toxicity
Butterbur (Petasites hybridus) is one of the best-studied natural remedies for migraine. The research has primarily focused on an extract of 15% petasin and isopetasin sold under the trade name Petadolex. A study of patients using this herbal preparation for 16 weeks showed a response rate of 48% for reduction in headache frequency among those taking 75 mg twice daily and a 36% reduction in those taking 50 mg twice a day. The primary adverse effect was burping.18
Proper processing is crucial. The key concern about butterbur is that it naturally contains hepatotoxic compounds called pyrrolizidine alkaloids (PA), which may remain if the product is not properly processed.18-20 The labeling on many butterbur products states that they are “PA-free,” but because the manufacturers, rather than the US Food and Drug Administration (FDA), bear the responsibility for the safety and labeling of supplements, there is little oversight.
In fact, supplement quality is of considerable concern and subject to ongoing research. DNA bar-coding studies have confirmed that many common herbal preparations either contain ingredients not listed on the label or, conversely, fail to contain all the ingredients that are listed.52 Patients should be advised to look for evidence of quality assurance when purchasing herbal supplements, such as that offered by the US Pharmacopeia (USP) on a limited range of products. (We have not found any butterbur supplements with USP verification.)
Feverfew yields mixed results
Studies of feverfew extract for migraine have had conflicting results, probably because different extracts have been tested. A recent Cochrane review, however, cited one clinical trial (N=218) that added positive evidence to previously inconclusive findings.21
The study in question assessed a proprietary extract of feverfew (MIG-99) and found a small decrease in frequency of migraines (0.6 per month) compared with placebo. Adverse effects were gastrointestinal disturbances and mouth ulcers.22
Warn women of childbearing age that feverfew may cause uterine contractions and is contraindicated for those who are pregnant or trying to conceive.23 In addition, patients who are allergic to ragweed, chrysanthemums, or other members of the daisy family may be allergic to feverfew, as well.24
Magnesium is helpful for some
While magnesium is used for both acute relief of migraine and as prophylaxis, evidence of its efficacy is mixed. Studies have been promising in women with low magnesium levels and those who suffer from menstrual migraines, and for use in children with migraine headaches as both acute and preventive treatment.25,26
One RCT involving 160 children ages 5 to 16 years found magnesium to have a synergistic effect with acetaminophen or ibuprofen, leading to greater acute pain relief and reducing migraine frequency.27 A recent meta-analysis, however, concluded that intravenous magnesium is not likely to be effective for acute treatment.53 The main adverse effects seen with magnesium are diarrhea and soft stools.
Patients with renal disease should avoid magnesium supplementation. Food sources of magnesium include whole grains, spinach, nuts, legumes, and white potatoes.54
Riboflavin shows promise
Riboflavin (B2) plays an important role in cellular energy production and is an important antioxidant in mitochondria. Several small studies have shown promising results with high-dose (400 mg) riboflavin in migraine prevention, with evidence suggesting that it may be as effective as beta-blockers such as bisoprolol and metoprolol.28-30 Discoloration of urine, which turns bright yellow, is the primary adverse effect.
CoQ10 helps those with low levels
Like riboflavin, coenzyme Q10 (CoQ10) is involved in mitochondrial transport and plays an important role in cellular energy metabolism. Several small studies have shown efficacy in migraine prevention in doses of 150 to 300 mg/d, with response rates between 30% and 50%.31,32 Based on data in adults, the American Academy of Neurology guidelines give CoQ10 a Level C rating, indicating that it is possibly effective in preventing migraine.29
An open label study of children with migraine found that close to a third were below the reference range for CoQ10 levels. Their serum levels increased when they began taking CoQ10 supplements, resulting in a significant reduction in headache frequency and an improvement in migraine-related disability.33
Combination supplements have little efficacy
In a study published in 2015,34 a proprietary supplement containing magnesium 600 mg, riboflavin 400 mg, CoQ10 150 mg, and low-dose multivitamins, taken daily, did not show statistically significant efficacy in the reduction of migraine days. After 3 months of supplementation, however, the severity of migraine pain improved. Adverse effects included abdominal discomfort and diarrhea.
Another study compared a combination of riboflavin 400 mg, magnesium 300 mg, and feverfew 100 mg with low-dose riboflavin (25 mg) as placebo, and found that the combination did not reduce the frequency or severity of migraine any more than the placebo.35
Botox may relieve chronic migraine
Onabotulinumtoxin A (Botox) has FDA approval for the prevention of chronic migraines—ie, migraines that occur >15 days per month and at least 4 hours or more per day.55 Botox is administered by injection every 12 weeks, across 31 sites on the head and neck. The recommended dose is 155 units, with 5 units delivered into each injection site.
This protocol has been found to reduce the number of headache days by 50% in half of those being treated after one cycle, and in more than 70% of patients after 3 cycles.36 Potential adverse effects include blepharoptosis, neck muscle weakness, and the risk of botulism at sites distant from the injections.37-39
Mind-body therapies are most widely used
Of all the CAM therapies used by patients with migraine headaches, mind-body modalities are the most prevalent. Overall, 30% of headache patients use them, compared with 17% of the general population.2
Many of these modalities have been found to be effective and safe to use with the conventional migraine treatments with which patients commonly combine them.
Meditation. Both spiritual and secular forms of meditation have been studied for acute and preventive treatment of migraine and found to be effective. A recent small study suggests that spiritual meditation may be more effective,40 but secular mindfulness-based stress reduction training has also shown promise in migraine treatment.
One positive effect is that those who meditate typically use less migraine medication,41 decreasing the burden of disease. Meditation is increasingly available via a range of options, including both in-person groups and online sessions, and can easily augment conventional medical treatments.
Yoga, which typically combines physical postures, breathing techniques, and mental concentration/meditation, is increasingly widespread. While there is compelling evidence of its effect in treating chronic pain and stress-related conditions,42 studies specific to migraine are lacking. Several small studies comparing yoga to NSAIDs, educational handouts, and conventional care for headache suggest that yoga has efficacy for the treatment of migraine, but the findings are limited by methodology and sample size.42,43
Relaxation training. Various types of relaxation are described in the literature, often combining progressive muscle relaxation, diaphragmatic breathing, and relaxation-inducing imagery. Although the consensus is that these techniques are effective, differences in standards, frequency, and duration of training make it hard to draw conclusions.44
Biofeedback is similar to relaxation training, with the key difference being that it uses monitoring to train patients to alter their physiological state, thereby leading to desired changes—eg, fewer headaches and lower intensity of pain. Monitors evaluate skin temperature, electromyography, heart rate variability (blood-volume-pulse), and skin conductance, among other measures.
A robust collection of studies has shown the efficacy of skin temperature feedback, blood-volume-pulse feedback, and electromyography feedback as treatment for migraine.45 Blood-volume-pulse feedback in combination with additional home training is perhaps more effective than other modalities. Despite convincing evidence of its efficacy for migraine headaches, however, only about 1% of patients with migraine use biofeedback. That’s likely due to a lack of availability outside of urban medical centers, limited insurance coverage, and time constraints.2,45
Behavioral therapy can be of help
Cognitive behavioral therapy (CBT) focuses on adjusting maladaptive thoughts and behaviors. For migraine patients, this may include identifying and changing the patient’s response to migraine triggers such as stress, sleep deprivation, and fear of headache pain. Relaxation techniques may be incorporated into the therapy.
The effect size of CBT for prevention is comparable to prophylactic medication use, with 34% to 40% of patients achieving a clinically significant decrease in the number of attacks. Additive effects are especially promising, with more than two-thirds of patients achieving decreased frequency when CBT is combined with preventative medications.2,44,46
Acceptance and commitment therapy (ACT) is a newer variant of CBT that has recently been studied.44 Unlike CBT, in which patients are taught to control and revise their maladaptive thoughts and feelings, ACT focuses on noticing and accepting such unwanted thoughts and feelings and changing the way individuals respond to them rather than changing the thoughts themselves. Further study is needed to determine whether ACT is an effective treatment for migraine.
FDA-approved devices take aim at migraine
A transcranial magnetic stimulator (TMS) (Cerena, eNeura Inc, Sunnyvale, Calif) received FDA approval in 2013.56 The single-pulse TMS is the first device authorized for the treatment of migraine headache pain. It is geared specifically to patients suffering from migraine with aura and requires a prescription.
In a study of 201 patients, the group using the TMS device at the onset of aura had a 38% response rate, compared with a 17% response among those in the sham control group. Dizziness was reported as an adverse effect. Caution patients who express an interest in it that the device should not be used by those who are at risk for seizures or have an implanted device, such as a pacemaker or deep brain stimulator.47
Transcutaneous electrical nerve stimulation (TENS) has long been used for chronic pain, but in 2014 the FDA approved the first TENS device aimed at the prevention of migraine headaches in patients age 18 and older.57 It is also the first such device approved for use prior to the onset of pain.
The Cefaly (Cefaly US, Inc., Wilton, Conn), which requires a prescription, is worn like a headband. It is positioned on the forehead just above the eyes, using an adhesive electrode, and is worn once a day for 20 minutes. The device applies an electrical current to the skin and underlying tissues to stimulate branches of the trigeminal nerve, which can cause a tingling or massaging sensation. Several small studies have shown a decrease in migraine frequency comparable with other preventive treatments. The main adverse effect reported was sedation, but more than half of those who used it were satisfied and willing to purchase the device.48,49
Regular exercise has little downside
While physical activity can be a trigger for acute migraine, regular exercise has been shown to decrease the frequency of migraine attacks. And, although aerobic exercise is no more effective as migraine prophylaxis than conventional drug treatments, it has few adverse effects. For patients who want to stay fit and avoid taking preventive medications, exercise is a valuable adjunct to conventional treatments.50,51
CORRESPONDENCE
Laura Armstrong, MD, Memorial Hermann Family Medicine Residency Program, 14023 Southwest Freeway, Sugar Land, TX 77478; [email protected].
1. National Center for Complementary and Integrative Health. 2007 Statistics on CAM Use in the United States. National Center for Complementary and Integrative Health Web site. Available at: https://nccih.nih.gov/news/camstats/2007. Accessed January 6, 2016.
2. Wells RE, Bertisch SM, Buettner C, et al. Complementary and alternative medicine use among adults with migraines/severe headaches. Headache. 2011;51:1087-1097.
3. Lipton RB, Silberstein SD. Episodic and chronic migraine headache: breaking down barriers to optimal treatment and prevention. Headache. 2015;55:S103-S122.
4. Migraine Research Foundation. Migraine in women. Migraine Research Foundation Web site. Available at: http://www.migraineresearchfoundation.org/Migraine%20in%20Women.html. Accessed January 7, 2016.
5. Clarke TC, Black LI, Stussman BJ, et al. Trends in the use of complementary health approaches among adults: United States, 2002-2012. Natl Health Stat Report. 2015:1-16.
6. Headache Classification Committee of the International Headache Society (IHS). The international classification of headache disorders, 3rd ed. Cephalalgia. 2013;33:629-808.
7. Marmura MJ, Silberstein SD, Schwedt TJ. The acute treatment of migraine in adults: the American Headache Society evidence assessment of migraine pharmacotherapies. Headache. 2015;55:3-20.
8. Silberstein SD, Holland S, Freitag F, et al; Quality Standards Subcommittee of the American Academy of Neurology and the American Headache Society. Evidence-based guideline update: pharmacologic treatment for episodic migraine prevention in adults: report of the Quality Standards Subcommittee of the American Academy of Neurology and the American Headache Society. Neurology. 2012;78:1337-1345.
9. Hougaard A, Amin FM, Hauge AW, et al. Provocation of migraine with aura using natural trigger factors. Neurology. 2013;80:428-431.
10. Kelman L. The triggers or precipitants of the acute migraine attack. Cephalalgia. 2007;27:394-402.
11. Martin PR. Managing headache triggers: Think ‘coping’ not ‘avoidance’. Cephalalgia. 2010;30:634-637.
12. Martin PR, MacLeod C. Behavioral management of headache triggers: Avoidance of triggers is an inadequate strategy. Clin Psychol Rev. 2009;29:483-495.
13. Linde K, Allais G, Brinkhaus B, et al. Acupuncture for migraine prophylaxis. Cochrane Database Syst Rev. 2009:CD001218.
14. Vickers AJ, Cronin AM, Maschino AC, et al; Acupuncture Trialists’ Collaboration. Acupuncture for chronic pain: individual patient data meta-analysis. Arch Intern Med. 2012;172:1444-1453.
15. Wang Y, Xue CC, Helme R, et al. Acupuncture for frequent migraine: A randomized, patient/assessor blinded, controlled trial with one-year follow-up. Evid Based Complement Alternat Med. 2015;2015:920353.
16. Da Silva AN. Acupuncture for migraine prevention. Headache. 2015;55:470-473.
17. Meissner K, Fassler M, Rücker G, et al. Differential effectiveness of placebo treatments: a systematic review of migraine prophylaxis. JAMA Intern Med. 2013;173:1941-1951.
18. Lipton RB, Göbel H, Einhäupl KM, et al. Petasites hybridus root (butterbur) is an effective preventive treatment for migraine. Neurology. 2004;63:2240-2244.
19. Grossman W, Schmidramsl H. An extract of Petasites hybridus is effective in the prophylaxis of migraine. Altern Med Rev. 2001;6:303-310.
20. Diener HC, Rahlfs VW, Danesch U. The first placebo-controlled trial of a special butterbur root extract for the prevention of migraine: Reanalysis of efficacy criteria. Eur Neurol. 2004;51:89-97.
21. Wider B, Pittler MH, Ernst E. Feverfew for preventing migraine. Cochrane Database Syst Rev. 2015;4:CD002286.
22. Pfaffenrath V, Diener HC, Fischer M, et al; Investigators. The efficacy and safety of Tanacetum parthenium (feverfew) in migraine prophylaxis--a double-blind, multicentre, randomized placebo-controlled dose-response study. Cephalalgia. 2002;22:523-532.
23. Ernst E, Pittler MH. The efficacy and safety of feverfew (Tanacetum parthenium L.): an update of a systematic review. Public Health Nutr. 2000;3:509-514.
24. Natural Medicines. Feverfew Professional Monograph, 2016. Natural Medicines Web site. Available at: https://naturalmedicines.therapeuticresearch.com/. Accessed January 1, 2016.
25. Wang F, Van Den Eeden SK, Ackerson LM, et al. Oral magnesium oxide prophylaxis of frequent migrainous headache in children: a randomized, double-blind, placebo-controlled trial. Headache. 2003;43:601-610.
26. Facchinetti F, Sances G, Borella P, et al. Magnesium prophylaxis of menstrual migraine: effects on intracellular magnesium. Headache. 1991;31:298-301.
27. Gallelli L, Avenoso T, Falcone D, et al. Effects of acetaminophen and ibuprofen in children with migraine receiving preventive treatment with magnesium. Headache. 2014;54:313-324.
28. Sándor PS, Afra J, Ambrosini A, et al. Prophylactic treatment of migraine with beta-blockers and riboflavin: differential effects on the intensity dependence of auditory evoked cortical potentials. Headache. 2000;40:30-35.
29. Holland S, Silberstein SD, Freitag F, et al; Quality Standards Subcommittee of the American Academy of Neurology and the American Headache Society. Evidence-based guideline update: NSAIDs and other complementary treatments for episodic migraine prevention in adults: report of the Quality Standards Subcommittee of the American Academy of Neurology and the American Headache Society. Neurology. 2012;78:1346-1353.
30. Boehnke C, Reuter U, Flach U, et al. High-dose riboflavin treatment is efficacious in migraine prophylaxis: an open study in a tertiary care centre. Eur J Neurol. 2004;11:475-477.
31. Sándor PS, Di Clemente L, Coppola G, et al. Efficacy of coenzyme Q10 in migraine prophylaxis: a randomized controlled trial. Neurology. 2005;64:713-715.
32. Rozen TD, Oshinsky ML, Gebeline CA, et al. Open label trial of coenzyme Q10 as a migraine preventive. Cephalalgia. 2002;22:137-141.
33. Hershey AD, Powers SW, Vockell AL, et al. Coenzyme Q10 deficiency and response to supplementation in pediatric and adolescent migraine. Headache. 2007;47:73-80.
34. Gaul C, Diener HC, Danesch U; Migravent Study Group. Improvement of migraine symptoms with a proprietary supplement containing riboflavin, magnesium and Q10: a randomized, placebo-controlled, double-blind, multicenter trial. J Headache Pain. 2015;16:516.
35. Maizels M, Blumenfeld A, Burchette R. A combination of riboflavin, magnesium, and feverfew for migraine prophylaxis: a randomized trial. Headache. 2004;44:885-890.
36. Silberstein SD, Dodick DW, Aurora SK, et al. Percent of patients with chronic migraine who responded per onabotulinumtoxin A treatment cycle: PREEMPT. J Neurol Neurosurg Psychiatry. 2015;86:996-1001.
37. Estemalik E, Tepper S. Preventive treatment in migraine and the new US guidelines. Neuropsychiatr Dis Treat. 2013;9:709-720.
38. Aurora SK, Winner P, Freeman MC, et al. Onabotulinumtoxin A for treatment of chronic migraine: pooled analyses of the 56-week PREEMPT clinical program. Headache. 2011;51:1358-1373.
39. Diener HC, Dodick DW, Aurora SK, et al; PREEMPT 2 Chronic Migraine Study Group. Onabotulinumtoxin A for treatment of chronic migraine: results from the double-blind, randomized, placebo-controlled phase of the PREEMPT 2 trial. Cephalalgia. 2010;30:804-814.
40. Wachholtz AB, Malone CD, Pargament KI. Effect of different meditation types on migraine headache medication use. Behav Med. 2015:1-8.
41. Smitherman TA, Wells RE, Ford SG. Emerging behavioral treatments for migraine. Curr Pain Headache Rep. 2015;19:13.
42. Kisan R, Sujan M, Adoor M, et al. Effect of yoga on migraine: A comprehensive study using clinical profile and cardiac autonomic functions. Int J Yoga. 2014;7:126-132.
43. Büssing A, Ostermann T, Lüdtke R, et al. Effects of yoga interventions on pain and pain-associated disability: a meta-analysis. J Pain. 2012;13:1-9.
44. Penzien DB, Irby MB, Smitherman TA, et al. Well-established and empirically supported behavioral treatments for migraine. Curr Pain Headache Rep. 2015;19:34.
45. Nestoriuc Y, Martin A. Efficacy of biofeedback for migraine: a meta-analysis. Pain. 2007;128:111-127.
46. Fritsche G, Kröner-Herwig B, Kropp P, et al. Psychological therapy of migraine: systematic review. Schmerz. 2013;27:263-274.
47. Lipton RB, Dodick DW, Silberstein SD, et al. Single-pulse transcranial magnetic stimulation for acute treatment of migraine with aura: a randomised, double-blind, parallel-group, sham-controlled trial. Lancet Neurol. 2010;9:373-380.
48. Schoenen J, Vandersmissen B, Jeangette S, et al. Migraine prevention with a supraorbital transcutaneous stimulator: a randomized controlled trial. Neurology. 2013;80:697-704.
49. Piquet M, Balestra C, Sava SL, et al. Supraorbital transcutaneous neurostimulation has sedative effects in healthy subjects. BMC Neurol. 2011;11:135.
50. Gil-Martínez A, Kindelan-Calvo P, Agudo-Carmona D, et al. Therapeutic exercise as treatment for migraine and tension-type headaches: a systematic review of randomised clinical trials. Rev Neurol. 2013;57:433-443.
51. Varkey E, Cider A, Carlsson J, et al. Exercise as migraine prophylaxis: a randomized study using relaxation and topiramate as controls. Cephalalgia. 2011;31:1428-1438.
52. Newmaster SG, Grguric M, Shanmughanandhan D, et al. DNA barcoding detects contamination and substitution in North American herbal products. BMC Med. 2013;11:222.
53. Choi H, Parmar N. The use of intravenous magnesium sulphate for acute migraine: meta-analysis of randomized controlled trials. Eur J Emerg Med. 2014;21:2-9.
54. Volpe SL. Magnesium in disease prevention and overall health. Adv Nutr. 2013;4:S378-S383.
55. US Food and Drug Administration. FDA approves Botox to treat chronic migraine. US Food and Drug Administration Web site. October 15, 2010. Available at: http://www.fda.gov/NewsEvents/Newsroom/PressAnnouncements/ucm229782.htm. Accessed January 7, 2016.
56. US Food and Drug Administration. FDA allows marketing of first device to relieve migraine headache pain. US Food and Drug Administration Web site. December 13, 2013. Available at: http://www.fda.gov/NewsEvents/Newsroom/PressAnnouncements/ucm378608.htm. Accessed January 7, 2016.
57. US Food and Drug Administration. FDA allows marketing of first medical device to prevent migraine headache. US Food and Drug Administration Web site. March 11, 2014. Available at: http://www.fda.gov/NewsEvents/Newsroom/PressAnnouncements/ucm388765.htm. Accessed January 7, 2016.
› Ask all patients with migraines about their use of complementary and alternative medicine and what modalities, if any, they have found helpful. A
› Advise patients that while butterbur has been proven effective at reducing migraine frequency, its use requires caution, as products not processed properly may contain hepatotoxic compounds. A
› Caution women who are pregnant or attempting to conceive to avoid feverfew, which may cause uterine contractions. C
Strength of recommendation (SOR)
A Good-quality patient-oriented evidence
B Inconsistent or limited-quality patient-oriented evidence
C Consensus, usual practice, opinion, disease-oriented evidence, case series
Americans who suffer from migraine headaches are far more likely than those who don’t to turn to complementary and alternative medicine (CAM). A 2007 National Health Interview Survey and a subsequent analysis of the results found that just under 50% of adults with migraine headaches used alternative therapies; among those without migraine, 34% did.1,2 What’s more, only about half of the migraine patients who reported the use of CAM modalities mentioned it to their health care providers.2
With migraine affecting some 36 million Americans,3 chances are you are caring for many of them. It is likely, too, that you are unaware of which of your headache patients are using alternative treatments, or what modalities they have tried. The only way to find out is to ask.
Women, who are 3 times more likely than men to suffer from migraine headache,4 are also the greatest users of CAM, particularly biologically based therapies and mind-body practices.5 Use is highly individualized and typically does not involve professional supervision.5
A number of alternative modalities look promising for migraine prevention. As a family physician, you are in an ideal position to guide patients in the use of safe and effective CAM therapies. To do so, however, you need to be familiar with the evidence for or against various options—many of which can be used in conjunction with pharmacotherapy.
An integrative approach to the treatment of migraine headaches makes use of the best available evidence for both conventional and alternative therapies and takes into account the whole person, including all aspects of his or her belief system and lifestyle. It also emphasizes a strong physician-patient relationship, which can have a powerful therapeutic effect.
We wrote this evidence-based update with such an approach in mind. In the text and table that follow, we present the latest findings. But first, a brief review of what constitutes migraine headache and an overview of conventional treatment.
A conventional approach to migraine
Migraine headache is a common and disabling neurologic disorder that frequently goes unrecognized and undertreated.6 It is generally characterized as recurrent headaches that are unilateral, pulsating, moderately severe, aggravated by physical activity, and associated with nausea, vomiting, photophobia, phonophobia, and sometimes a preceding aura. Conventional treatment typically includes abortive treatment for acute migraine, with medications such as the triptans and dihydroergotamine. Acetaminophen, nonsteroidal anti-inflammatory drugs (NSAIDs), and the combination of acetaminophen/aspirin/caffeine are also effective. Opiates are efficacious, but not recommended.7
Prophylactic medications are generally offered to patients experiencing more than 4 migraines per month. The American Academy of Neurology cites strong evidence for the use of divalproex, valproate, topiramate, and beta-blockers, including metoprolol, propranolol, and timolol. Frovatriptan has strong evidence for prevention of menstrual-associated migraine. Common adverse effects include weight loss and parasthesias with topiramate and weight gain and somnolence with valproate, divalproex, and beta-blockers. There is also moderate evidence for the use of amitriptyline, venlafaxine, atenolol, and nadolol. Potential adverse effects must be considered to determine the optimal therapy for individual patients, and trial and error are often required.8
Addressing triggers
Conventional treatment also focuses on identifying and avoiding triggers to the extent possible. Physicians typically advise patients to keep a headache diary, recording details about diet and lifestyle, triggers, frequency and intensity of attacks, and possible patterns of headaches due to medication overuse.
Sleep disturbances and stress are common triggers, and instruction in sleep hygiene and stress reduction, as well as screening for anxiety or depression, can be beneficial. Other frequently reported factors believed to trigger or aggravate migraine attacks are skipping meals, particular foods, alcohol, weather changes, and exposure to light, sounds, and odors.
Despite the focus on migraine triggers, however, clinical studies of the role they play have shown conflicting results. A recent study involving 27 patients7 found that when attempting to provoke migraine with aura using participants’ self-reported triggers, only 3 individuals reported that the provocation actually led to a migraine.9 Additional studies suggest that exposure to headache triggers has the same effect as exposure to anxiety, with short-term exposure associated with an increased pain response and prolonged exposure leading to a decreased response.10,11 Thus, it may be beneficial to advise patients to learn to cope with controlled exposure to triggers rather than to aim for trigger avoidance.12
If noise is identified as a trigger, for instance, repeated exposure in a relaxed environment can help desensitize the patient. Triggers such as visual disturbances and odors are also good candidates for desensitization, while others, such as sleep deprivation and skipping meals, are better served by avoidance.12
CAM approaches: A look at the evidence
Acupuncture, butterbur, feverfew, magnesium, riboflavin, and biofeedback look promising for migraine prevention. Many of our patients are already using these and other alternative therapies. Here’s what the latest studies show (TABLE).2,9-11, 13-51
Can acupuncture help?
A 2009 Cochrane review of 22 high-quality studies with a total of 4419 participants supports the use of acupuncture for migraine prophylaxis.13 Acupuncture was found to be superior to no prophylactic treatment and acute treatment alone, and as effective as conventional preventive medications. Interestingly, though, among studies included in the Cochrane review that compared true acupuncture with sham interventions, no significant difference in results was found.
A more recent meta-analysis of 29 studies representing nearly 18,000 patients did show true acupuncture to be statistically superior to sham acupuncture, although the difference was of small clinical significance. Sham acupuncture was also shown to have a larger clinical effect than oral placebos, raising questions about the importance of exact point location.14
In a 2015 study comparing real and sham acupuncture over a 20-week period, however, the differences were more marked. Those who received real acupuncture reported significantly fewer migraine days and less severe headaches, and there were more responders in the treatment group compared with recipients of the sham procedures.15 Overall, the evidence indicates that acupuncture is at least as effective as conventional drug treatment for migraine prophylaxis, but with fewer adverse effects.13-17
Butterbur raises concerns about toxicity
Butterbur (Petasites hybridus) is one of the best-studied natural remedies for migraine. The research has primarily focused on an extract of 15% petasin and isopetasin sold under the trade name Petadolex. A study of patients using this herbal preparation for 16 weeks showed a response rate of 48% for reduction in headache frequency among those taking 75 mg twice daily and a 36% reduction in those taking 50 mg twice a day. The primary adverse effect was burping.18
Proper processing is crucial. The key concern about butterbur is that it naturally contains hepatotoxic compounds called pyrrolizidine alkaloids (PA), which may remain if the product is not properly processed.18-20 The labeling on many butterbur products states that they are “PA-free,” but because the manufacturers, rather than the US Food and Drug Administration (FDA), bear the responsibility for the safety and labeling of supplements, there is little oversight.
In fact, supplement quality is of considerable concern and subject to ongoing research. DNA bar-coding studies have confirmed that many common herbal preparations either contain ingredients not listed on the label or, conversely, fail to contain all the ingredients that are listed.52 Patients should be advised to look for evidence of quality assurance when purchasing herbal supplements, such as that offered by the US Pharmacopeia (USP) on a limited range of products. (We have not found any butterbur supplements with USP verification.)
Feverfew yields mixed results
Studies of feverfew extract for migraine have had conflicting results, probably because different extracts have been tested. A recent Cochrane review, however, cited one clinical trial (N=218) that added positive evidence to previously inconclusive findings.21
The study in question assessed a proprietary extract of feverfew (MIG-99) and found a small decrease in frequency of migraines (0.6 per month) compared with placebo. Adverse effects were gastrointestinal disturbances and mouth ulcers.22
Warn women of childbearing age that feverfew may cause uterine contractions and is contraindicated for those who are pregnant or trying to conceive.23 In addition, patients who are allergic to ragweed, chrysanthemums, or other members of the daisy family may be allergic to feverfew, as well.24
Magnesium is helpful for some
While magnesium is used for both acute relief of migraine and as prophylaxis, evidence of its efficacy is mixed. Studies have been promising in women with low magnesium levels and those who suffer from menstrual migraines, and for use in children with migraine headaches as both acute and preventive treatment.25,26
One RCT involving 160 children ages 5 to 16 years found magnesium to have a synergistic effect with acetaminophen or ibuprofen, leading to greater acute pain relief and reducing migraine frequency.27 A recent meta-analysis, however, concluded that intravenous magnesium is not likely to be effective for acute treatment.53 The main adverse effects seen with magnesium are diarrhea and soft stools.
Patients with renal disease should avoid magnesium supplementation. Food sources of magnesium include whole grains, spinach, nuts, legumes, and white potatoes.54
Riboflavin shows promise
Riboflavin (B2) plays an important role in cellular energy production and is an important antioxidant in mitochondria. Several small studies have shown promising results with high-dose (400 mg) riboflavin in migraine prevention, with evidence suggesting that it may be as effective as beta-blockers such as bisoprolol and metoprolol.28-30 Discoloration of urine, which turns bright yellow, is the primary adverse effect.
CoQ10 helps those with low levels
Like riboflavin, coenzyme Q10 (CoQ10) is involved in mitochondrial transport and plays an important role in cellular energy metabolism. Several small studies have shown efficacy in migraine prevention in doses of 150 to 300 mg/d, with response rates between 30% and 50%.31,32 Based on data in adults, the American Academy of Neurology guidelines give CoQ10 a Level C rating, indicating that it is possibly effective in preventing migraine.29
An open label study of children with migraine found that close to a third were below the reference range for CoQ10 levels. Their serum levels increased when they began taking CoQ10 supplements, resulting in a significant reduction in headache frequency and an improvement in migraine-related disability.33
Combination supplements have little efficacy
In a study published in 2015,34 a proprietary supplement containing magnesium 600 mg, riboflavin 400 mg, CoQ10 150 mg, and low-dose multivitamins, taken daily, did not show statistically significant efficacy in the reduction of migraine days. After 3 months of supplementation, however, the severity of migraine pain improved. Adverse effects included abdominal discomfort and diarrhea.
Another study compared a combination of riboflavin 400 mg, magnesium 300 mg, and feverfew 100 mg with low-dose riboflavin (25 mg) as placebo, and found that the combination did not reduce the frequency or severity of migraine any more than the placebo.35
Botox may relieve chronic migraine
Onabotulinumtoxin A (Botox) has FDA approval for the prevention of chronic migraines—ie, migraines that occur >15 days per month and at least 4 hours or more per day.55 Botox is administered by injection every 12 weeks, across 31 sites on the head and neck. The recommended dose is 155 units, with 5 units delivered into each injection site.
This protocol has been found to reduce the number of headache days by 50% in half of those being treated after one cycle, and in more than 70% of patients after 3 cycles.36 Potential adverse effects include blepharoptosis, neck muscle weakness, and the risk of botulism at sites distant from the injections.37-39
Mind-body therapies are most widely used
Of all the CAM therapies used by patients with migraine headaches, mind-body modalities are the most prevalent. Overall, 30% of headache patients use them, compared with 17% of the general population.2
Many of these modalities have been found to be effective and safe to use with the conventional migraine treatments with which patients commonly combine them.
Meditation. Both spiritual and secular forms of meditation have been studied for acute and preventive treatment of migraine and found to be effective. A recent small study suggests that spiritual meditation may be more effective,40 but secular mindfulness-based stress reduction training has also shown promise in migraine treatment.
One positive effect is that those who meditate typically use less migraine medication,41 decreasing the burden of disease. Meditation is increasingly available via a range of options, including both in-person groups and online sessions, and can easily augment conventional medical treatments.
Yoga, which typically combines physical postures, breathing techniques, and mental concentration/meditation, is increasingly widespread. While there is compelling evidence of its effect in treating chronic pain and stress-related conditions,42 studies specific to migraine are lacking. Several small studies comparing yoga to NSAIDs, educational handouts, and conventional care for headache suggest that yoga has efficacy for the treatment of migraine, but the findings are limited by methodology and sample size.42,43
Relaxation training. Various types of relaxation are described in the literature, often combining progressive muscle relaxation, diaphragmatic breathing, and relaxation-inducing imagery. Although the consensus is that these techniques are effective, differences in standards, frequency, and duration of training make it hard to draw conclusions.44
Biofeedback is similar to relaxation training, with the key difference being that it uses monitoring to train patients to alter their physiological state, thereby leading to desired changes—eg, fewer headaches and lower intensity of pain. Monitors evaluate skin temperature, electromyography, heart rate variability (blood-volume-pulse), and skin conductance, among other measures.
A robust collection of studies has shown the efficacy of skin temperature feedback, blood-volume-pulse feedback, and electromyography feedback as treatment for migraine.45 Blood-volume-pulse feedback in combination with additional home training is perhaps more effective than other modalities. Despite convincing evidence of its efficacy for migraine headaches, however, only about 1% of patients with migraine use biofeedback. That’s likely due to a lack of availability outside of urban medical centers, limited insurance coverage, and time constraints.2,45
Behavioral therapy can be of help
Cognitive behavioral therapy (CBT) focuses on adjusting maladaptive thoughts and behaviors. For migraine patients, this may include identifying and changing the patient’s response to migraine triggers such as stress, sleep deprivation, and fear of headache pain. Relaxation techniques may be incorporated into the therapy.
The effect size of CBT for prevention is comparable to prophylactic medication use, with 34% to 40% of patients achieving a clinically significant decrease in the number of attacks. Additive effects are especially promising, with more than two-thirds of patients achieving decreased frequency when CBT is combined with preventative medications.2,44,46
Acceptance and commitment therapy (ACT) is a newer variant of CBT that has recently been studied.44 Unlike CBT, in which patients are taught to control and revise their maladaptive thoughts and feelings, ACT focuses on noticing and accepting such unwanted thoughts and feelings and changing the way individuals respond to them rather than changing the thoughts themselves. Further study is needed to determine whether ACT is an effective treatment for migraine.
FDA-approved devices take aim at migraine
A transcranial magnetic stimulator (TMS) (Cerena, eNeura Inc, Sunnyvale, Calif) received FDA approval in 2013.56 The single-pulse TMS is the first device authorized for the treatment of migraine headache pain. It is geared specifically to patients suffering from migraine with aura and requires a prescription.
In a study of 201 patients, the group using the TMS device at the onset of aura had a 38% response rate, compared with a 17% response among those in the sham control group. Dizziness was reported as an adverse effect. Caution patients who express an interest in it that the device should not be used by those who are at risk for seizures or have an implanted device, such as a pacemaker or deep brain stimulator.47
Transcutaneous electrical nerve stimulation (TENS) has long been used for chronic pain, but in 2014 the FDA approved the first TENS device aimed at the prevention of migraine headaches in patients age 18 and older.57 It is also the first such device approved for use prior to the onset of pain.
The Cefaly (Cefaly US, Inc., Wilton, Conn), which requires a prescription, is worn like a headband. It is positioned on the forehead just above the eyes, using an adhesive electrode, and is worn once a day for 20 minutes. The device applies an electrical current to the skin and underlying tissues to stimulate branches of the trigeminal nerve, which can cause a tingling or massaging sensation. Several small studies have shown a decrease in migraine frequency comparable with other preventive treatments. The main adverse effect reported was sedation, but more than half of those who used it were satisfied and willing to purchase the device.48,49
Regular exercise has little downside
While physical activity can be a trigger for acute migraine, regular exercise has been shown to decrease the frequency of migraine attacks. And, although aerobic exercise is no more effective as migraine prophylaxis than conventional drug treatments, it has few adverse effects. For patients who want to stay fit and avoid taking preventive medications, exercise is a valuable adjunct to conventional treatments.50,51
CORRESPONDENCE
Laura Armstrong, MD, Memorial Hermann Family Medicine Residency Program, 14023 Southwest Freeway, Sugar Land, TX 77478; [email protected].
1. National Center for Complementary and Integrative Health. 2007 Statistics on CAM Use in the United States. National Center for Complementary and Integrative Health Web site. Available at: https://nccih.nih.gov/news/camstats/2007. Accessed January 6, 2016.
2. Wells RE, Bertisch SM, Buettner C, et al. Complementary and alternative medicine use among adults with migraines/severe headaches. Headache. 2011;51:1087-1097.
3. Lipton RB, Silberstein SD. Episodic and chronic migraine headache: breaking down barriers to optimal treatment and prevention. Headache. 2015;55:S103-S122.
4. Migraine Research Foundation. Migraine in women. Migraine Research Foundation Web site. Available at: http://www.migraineresearchfoundation.org/Migraine%20in%20Women.html. Accessed January 7, 2016.
5. Clarke TC, Black LI, Stussman BJ, et al. Trends in the use of complementary health approaches among adults: United States, 2002-2012. Natl Health Stat Report. 2015:1-16.
6. Headache Classification Committee of the International Headache Society (IHS). The international classification of headache disorders, 3rd ed. Cephalalgia. 2013;33:629-808.
7. Marmura MJ, Silberstein SD, Schwedt TJ. The acute treatment of migraine in adults: the American Headache Society evidence assessment of migraine pharmacotherapies. Headache. 2015;55:3-20.
8. Silberstein SD, Holland S, Freitag F, et al; Quality Standards Subcommittee of the American Academy of Neurology and the American Headache Society. Evidence-based guideline update: pharmacologic treatment for episodic migraine prevention in adults: report of the Quality Standards Subcommittee of the American Academy of Neurology and the American Headache Society. Neurology. 2012;78:1337-1345.
9. Hougaard A, Amin FM, Hauge AW, et al. Provocation of migraine with aura using natural trigger factors. Neurology. 2013;80:428-431.
10. Kelman L. The triggers or precipitants of the acute migraine attack. Cephalalgia. 2007;27:394-402.
11. Martin PR. Managing headache triggers: Think ‘coping’ not ‘avoidance’. Cephalalgia. 2010;30:634-637.
12. Martin PR, MacLeod C. Behavioral management of headache triggers: Avoidance of triggers is an inadequate strategy. Clin Psychol Rev. 2009;29:483-495.
13. Linde K, Allais G, Brinkhaus B, et al. Acupuncture for migraine prophylaxis. Cochrane Database Syst Rev. 2009:CD001218.
14. Vickers AJ, Cronin AM, Maschino AC, et al; Acupuncture Trialists’ Collaboration. Acupuncture for chronic pain: individual patient data meta-analysis. Arch Intern Med. 2012;172:1444-1453.
15. Wang Y, Xue CC, Helme R, et al. Acupuncture for frequent migraine: A randomized, patient/assessor blinded, controlled trial with one-year follow-up. Evid Based Complement Alternat Med. 2015;2015:920353.
16. Da Silva AN. Acupuncture for migraine prevention. Headache. 2015;55:470-473.
17. Meissner K, Fassler M, Rücker G, et al. Differential effectiveness of placebo treatments: a systematic review of migraine prophylaxis. JAMA Intern Med. 2013;173:1941-1951.
18. Lipton RB, Göbel H, Einhäupl KM, et al. Petasites hybridus root (butterbur) is an effective preventive treatment for migraine. Neurology. 2004;63:2240-2244.
19. Grossman W, Schmidramsl H. An extract of Petasites hybridus is effective in the prophylaxis of migraine. Altern Med Rev. 2001;6:303-310.
20. Diener HC, Rahlfs VW, Danesch U. The first placebo-controlled trial of a special butterbur root extract for the prevention of migraine: Reanalysis of efficacy criteria. Eur Neurol. 2004;51:89-97.
21. Wider B, Pittler MH, Ernst E. Feverfew for preventing migraine. Cochrane Database Syst Rev. 2015;4:CD002286.
22. Pfaffenrath V, Diener HC, Fischer M, et al; Investigators. The efficacy and safety of Tanacetum parthenium (feverfew) in migraine prophylaxis--a double-blind, multicentre, randomized placebo-controlled dose-response study. Cephalalgia. 2002;22:523-532.
23. Ernst E, Pittler MH. The efficacy and safety of feverfew (Tanacetum parthenium L.): an update of a systematic review. Public Health Nutr. 2000;3:509-514.
24. Natural Medicines. Feverfew Professional Monograph, 2016. Natural Medicines Web site. Available at: https://naturalmedicines.therapeuticresearch.com/. Accessed January 1, 2016.
25. Wang F, Van Den Eeden SK, Ackerson LM, et al. Oral magnesium oxide prophylaxis of frequent migrainous headache in children: a randomized, double-blind, placebo-controlled trial. Headache. 2003;43:601-610.
26. Facchinetti F, Sances G, Borella P, et al. Magnesium prophylaxis of menstrual migraine: effects on intracellular magnesium. Headache. 1991;31:298-301.
27. Gallelli L, Avenoso T, Falcone D, et al. Effects of acetaminophen and ibuprofen in children with migraine receiving preventive treatment with magnesium. Headache. 2014;54:313-324.
28. Sándor PS, Afra J, Ambrosini A, et al. Prophylactic treatment of migraine with beta-blockers and riboflavin: differential effects on the intensity dependence of auditory evoked cortical potentials. Headache. 2000;40:30-35.
29. Holland S, Silberstein SD, Freitag F, et al; Quality Standards Subcommittee of the American Academy of Neurology and the American Headache Society. Evidence-based guideline update: NSAIDs and other complementary treatments for episodic migraine prevention in adults: report of the Quality Standards Subcommittee of the American Academy of Neurology and the American Headache Society. Neurology. 2012;78:1346-1353.
30. Boehnke C, Reuter U, Flach U, et al. High-dose riboflavin treatment is efficacious in migraine prophylaxis: an open study in a tertiary care centre. Eur J Neurol. 2004;11:475-477.
31. Sándor PS, Di Clemente L, Coppola G, et al. Efficacy of coenzyme Q10 in migraine prophylaxis: a randomized controlled trial. Neurology. 2005;64:713-715.
32. Rozen TD, Oshinsky ML, Gebeline CA, et al. Open label trial of coenzyme Q10 as a migraine preventive. Cephalalgia. 2002;22:137-141.
33. Hershey AD, Powers SW, Vockell AL, et al. Coenzyme Q10 deficiency and response to supplementation in pediatric and adolescent migraine. Headache. 2007;47:73-80.
34. Gaul C, Diener HC, Danesch U; Migravent Study Group. Improvement of migraine symptoms with a proprietary supplement containing riboflavin, magnesium and Q10: a randomized, placebo-controlled, double-blind, multicenter trial. J Headache Pain. 2015;16:516.
35. Maizels M, Blumenfeld A, Burchette R. A combination of riboflavin, magnesium, and feverfew for migraine prophylaxis: a randomized trial. Headache. 2004;44:885-890.
36. Silberstein SD, Dodick DW, Aurora SK, et al. Percent of patients with chronic migraine who responded per onabotulinumtoxin A treatment cycle: PREEMPT. J Neurol Neurosurg Psychiatry. 2015;86:996-1001.
37. Estemalik E, Tepper S. Preventive treatment in migraine and the new US guidelines. Neuropsychiatr Dis Treat. 2013;9:709-720.
38. Aurora SK, Winner P, Freeman MC, et al. Onabotulinumtoxin A for treatment of chronic migraine: pooled analyses of the 56-week PREEMPT clinical program. Headache. 2011;51:1358-1373.
39. Diener HC, Dodick DW, Aurora SK, et al; PREEMPT 2 Chronic Migraine Study Group. Onabotulinumtoxin A for treatment of chronic migraine: results from the double-blind, randomized, placebo-controlled phase of the PREEMPT 2 trial. Cephalalgia. 2010;30:804-814.
40. Wachholtz AB, Malone CD, Pargament KI. Effect of different meditation types on migraine headache medication use. Behav Med. 2015:1-8.
41. Smitherman TA, Wells RE, Ford SG. Emerging behavioral treatments for migraine. Curr Pain Headache Rep. 2015;19:13.
42. Kisan R, Sujan M, Adoor M, et al. Effect of yoga on migraine: A comprehensive study using clinical profile and cardiac autonomic functions. Int J Yoga. 2014;7:126-132.
43. Büssing A, Ostermann T, Lüdtke R, et al. Effects of yoga interventions on pain and pain-associated disability: a meta-analysis. J Pain. 2012;13:1-9.
44. Penzien DB, Irby MB, Smitherman TA, et al. Well-established and empirically supported behavioral treatments for migraine. Curr Pain Headache Rep. 2015;19:34.
45. Nestoriuc Y, Martin A. Efficacy of biofeedback for migraine: a meta-analysis. Pain. 2007;128:111-127.
46. Fritsche G, Kröner-Herwig B, Kropp P, et al. Psychological therapy of migraine: systematic review. Schmerz. 2013;27:263-274.
47. Lipton RB, Dodick DW, Silberstein SD, et al. Single-pulse transcranial magnetic stimulation for acute treatment of migraine with aura: a randomised, double-blind, parallel-group, sham-controlled trial. Lancet Neurol. 2010;9:373-380.
48. Schoenen J, Vandersmissen B, Jeangette S, et al. Migraine prevention with a supraorbital transcutaneous stimulator: a randomized controlled trial. Neurology. 2013;80:697-704.
49. Piquet M, Balestra C, Sava SL, et al. Supraorbital transcutaneous neurostimulation has sedative effects in healthy subjects. BMC Neurol. 2011;11:135.
50. Gil-Martínez A, Kindelan-Calvo P, Agudo-Carmona D, et al. Therapeutic exercise as treatment for migraine and tension-type headaches: a systematic review of randomised clinical trials. Rev Neurol. 2013;57:433-443.
51. Varkey E, Cider A, Carlsson J, et al. Exercise as migraine prophylaxis: a randomized study using relaxation and topiramate as controls. Cephalalgia. 2011;31:1428-1438.
52. Newmaster SG, Grguric M, Shanmughanandhan D, et al. DNA barcoding detects contamination and substitution in North American herbal products. BMC Med. 2013;11:222.
53. Choi H, Parmar N. The use of intravenous magnesium sulphate for acute migraine: meta-analysis of randomized controlled trials. Eur J Emerg Med. 2014;21:2-9.
54. Volpe SL. Magnesium in disease prevention and overall health. Adv Nutr. 2013;4:S378-S383.
55. US Food and Drug Administration. FDA approves Botox to treat chronic migraine. US Food and Drug Administration Web site. October 15, 2010. Available at: http://www.fda.gov/NewsEvents/Newsroom/PressAnnouncements/ucm229782.htm. Accessed January 7, 2016.
56. US Food and Drug Administration. FDA allows marketing of first device to relieve migraine headache pain. US Food and Drug Administration Web site. December 13, 2013. Available at: http://www.fda.gov/NewsEvents/Newsroom/PressAnnouncements/ucm378608.htm. Accessed January 7, 2016.
57. US Food and Drug Administration. FDA allows marketing of first medical device to prevent migraine headache. US Food and Drug Administration Web site. March 11, 2014. Available at: http://www.fda.gov/NewsEvents/Newsroom/PressAnnouncements/ucm388765.htm. Accessed January 7, 2016.

Can patients with infectious endocarditis be safely anticoagulated?
Managing anticoagulation in patients with infectious endocarditis requires an individualized approach, using a careful risk-benefit assessment on a case-by-case basis. There is a dearth of high-quality evidence; consequently, the recommendations also vary according to the clinical situation.
Newly diagnosed native valve infectious endocarditis in itself is not an indication for anticoagulation.1–3 The question of whether to anticoagulate arises in patients who have a preexisting or coexisting indication for anticoagulation such as atrial fibrillation, deep vein thrombosis, pulmonary embolism, or a mechanical prosthetic heart valve. The question becomes yet more complex in patients with cerebrovascular complications and a coexistent strong indication for anticoagulation, creating what is often a very thorny dilemma.
Based on a review of available evidence, recommendations for anticoagulation in patients with infectious endocarditis are summarized below.
AVAILABLE EVIDENCE IS SCARCE AND MIXED
Earlier observational studies suggested a significant risk of cerebral hemorrhage with anticoagulation in patients with native valve endocarditis, although none of these studies were recent (some of them took place in the 1940s), and none are methodologically compelling.4–8 Consequently, some experts have expressed skepticism regarding their findings, particularly in recent years.
In part, this skepticism arises from studies that showed a lower incidence of cerebrovascular complications and smaller vegetation size in patients with prosthetic valve infectious endocarditis, studies in which many of the patients received anticoagulation therapy.9,10 The mechanism responsible for this effect is theorized to be that the vegetation is an amalgam of destroyed cells, platelets, and fibrin, with anticoagulation preventing this aggregation from further growth and propagation.
How great is the benefit or the potential harm?
Some experts argue that the incidence of ischemic stroke with hemorrhagic transformation in patients with infectious endocarditis receiving anticoagulation is overestimated. According to this view, the beneficial effects of anticoagulation at least counterbalance the potential harmful effects.
In addition to the studies cited above, recent studies have shown that patients on anticoagulation tend to have smaller vegetations and fewer cerebrovascular complications.11–13 Snygg-Martin et al11 and Rasmussen et al12 found not only that cerebrovascular complications were less common in patients already on anticoagulation at the time infectious endocarditis was diagnosed, but also that no increase in the rate of hemorrhagic lesions was reported.
These were all nonrandomized studies, and most of the patients in them had native valve infectious endocarditis diagnosed at an early stage. Importantly, these studies found that the beneficial effects of anticoagulation were only present if the patient was receiving warfarin before infectious endocarditis was diagnosed and antibiotic therapy was initiated. No benefits from anticoagulation were demonstrated once antimicrobial therapy was begun.
Similarly, Anavekar et al14 showed that embolic events occurred significantly less often in those who were currently on continuous daily antiplatelet therapy, suggesting that receiving antiplatelet agents at baseline protects against cardioembolic events in patients who develop infective endocarditis. However, the only randomized trial examining the initiation of antiplatelet therapy in patients diagnosed with infectious endocarditis receiving antibiotic treatment showed that adding aspirin did not reduce the risk of embolic events and was associated with a trend toward increased risk of bleeding.15
A recent large cohort study suggested that infectious endocarditis patients who receive anticoagulation therapy may have a higher incidence of cerebrovascular complications (hazard ratio 1.31, 95% confidence interval 1.00–1.72, P = .048), with a particular association of anticoagulation therapy with intracranial bleeding (hazard ratio 2.71, 95% confidence interval 1.54–4.76, P = .001).16
Another provocative link supported by the same study was a higher incidence of hemorrhagic complications with anticoagulation in patients with infectious endocarditis caused by Staphylococcus aureus, an association also suggested by older data from Tornos et al,8 but not seen in a study by Rasmussen et al.12
Continuing anticoagulation is an individualized decision
The benefit or harm of anticoagulation in patients with infectious endocarditis may be determined at least in part by a complex mix of factors including the valve involved (embolic events are more common with mitral valve vegetations than with aortic valve vegetations), vegetation size (higher risk if > 1 cm), mobility of vegetations, and perhaps the virulence of the causative organism.16,17 The fact that antimicrobial therapy obviates any beneficial effect of anticoagulation speaks strongly against starting anticoagulation therapy in infectious endocarditis patients with the sole purpose of reducing stroke risk.
Without large randomized trials to better delineate the risks and benefits of continuing preexisting anticoagulation in all patients with infectious endocarditis, patients already receiving anticoagulants need a careful, individualized risk-benefit assessment. Current guidelines agree that newly diagnosed infectious endocarditis per se is not an indication for anticoagulation or aspirin therapy (Table 1).1–3
TAKE-HOME POINTS
- Starting antiplatelet and anticoagulation therapy for the sole purpose of stroke prevention is not recommended in patients with newly diagnosed infectious endocarditis.
- In most cases, anticoagulation and antiplatelet therapy should be temporarily discontinued in patients with infectious endocarditis and stroke or suspected stroke.
- Patients need careful assessment on a case-by-case basis, and the presence of risk factors predisposing patients to cerebrovascular complications (eg, large or very mobile vegetations, causative pathogens such as S aureus or Candida spp) may prompt temporary suspension of anticoagulation and antiplatelet therapy.
- If there is a clear preexisting or coexisting indication for these agents and surgery is not anticipated, consider continuing antiplatelet and anticoagulant therapy in patients with infectious endocarditis, provided they lack the risk factors described above and stroke has been excluded.
- If there is a clear preexisting or coexisting indication for these agents and surgery is being considered, consider using a short-acting anticoagulant such as intravenous or low-molecular weight heparin as a bridge to surgery.
- Baddour LM, Wilson WR, Bayer AS, et al. Infective endocarditis in adults: diagnosis, antimicrobial therapy, and management of complications: a scientific statement for healthcare professionals from the American Heart Association. Circulation 2015; 132:1435–1486.
- Habib G, Lancellotti P, Antunes MJ, et al. 2015 ESC guidelines for the management of infective endocarditis. Rev Esp Cardiol (Engl Ed) 2016; 69:69.
- Whitlock RP, Sun JC, Fremes SE, Rubens FD, Teoh KH. Antithrombotic and thrombolytic therapy for valvular disease: Antithrombotic Therapy and Prevention of Thrombosis, 9th ed: American College of Chest Physicians evidence-based clinical practice guidelines. Chest 2012; 141:e576S–e600S.
- Delahaye JP, Poncet P, Malquarti V, Beaune J, Garé JP, Mann JM. Cerebrovascular accidents in infective endocarditis: role of anticoagulation. Eur Heart J 1990; 11:1074–1078.
- Loewe L. The combined use of anti-infectives and anticoagulants in the treatment of subacute bacterial endocarditis. Bull N Y Acad Med 1945; 21:59–86.
- Priest WS, Smith JM, McGee GC. The effect of anticoagulants on the penicillin therapy and the pathologic lesions of subacute bacterial endocarditis. N Engl J Med 1946; 235:699–706.
- Pruitt AA, Rubin RH, Karchmer AW, Duncan GW. Neurologic complications of bacterial endocarditis. Medicine 1978; 57:329–343.
- Tornos P, Almirante B, Mirabet S, Permanyer G, Pahissa A, Soler-Soler J. Infective endocarditis due to Staphylococcus aureus: deleterious effect of anticoagulant therapy. Arch Intern Med 1999; 159:473–475.
- Wilson WR, Geraci JE, Danielson GK, et al. Anticoagulant therapy and central nervous system complications in patients with prosthetic valve endocarditis. Circulation 1978; 57:1004–1007.
- Schulz R, Werner GS, Fuchs JB, et al. Clinical outcome and echocardiographic findings of native and prosthetic valve endocarditis in the 1990’s. Eur Heart J 1996; 17:281–288.
- Snygg-Martin U, Rasmussen RV, Hassager C, Bruun NE, Andersson R, Olaison L. Warfarin therapy and incidence of cerebrovascular complications in left-sided native valve endocarditis. Eur J Clin Microbiol Infect Dis 2011; 30:151–157.
- Rasmussen RV, Snygg-Martin U, Olaison L, et al. Major cerebral events in Staphylococcus aureus infective endocarditis: is anticoagulant therapy safe? Cardiology 2009; 114:284–291.
- Yau JW, Lee P, Wilson A, Jenkins AJ. Prosthetic valve endocarditis: what is the evidence for anticoagulant therapy? Intern Med J 2011; 41:795–797.
- Anavekar NS, Tleyjeh IM, Mirzoyev Z, et al. Impact of prior antiplatelet therapy on risk of embolism in infective endocarditis. Clin Infect Dis 2007; 44:1180–1186.
- Chan KL, Dumesnil JG, Cujec B, et al. A randomized trial of aspirin on the risk of embolic events in patients with infective endocarditis. J Am Coll Cardiol 2003; 42:775–780.
- Garcia-Cabrera E, Fernández-Hidalgo N, Almirante B, et al. Neurological complications of infective endocarditis: risk factors, outcome, and impact of cardiac surgery: a multicenter observational study. Circulation 2013; 127:2272–2284.
- Thuny F, Di Salvo G, Belliard O, et al. Risk of embolism and death in infective endocarditis: prognostic value of echocardiography: a prospective multicenter study. Circulation 2005; 112:69–75.
Managing anticoagulation in patients with infectious endocarditis requires an individualized approach, using a careful risk-benefit assessment on a case-by-case basis. There is a dearth of high-quality evidence; consequently, the recommendations also vary according to the clinical situation.
Newly diagnosed native valve infectious endocarditis in itself is not an indication for anticoagulation.1–3 The question of whether to anticoagulate arises in patients who have a preexisting or coexisting indication for anticoagulation such as atrial fibrillation, deep vein thrombosis, pulmonary embolism, or a mechanical prosthetic heart valve. The question becomes yet more complex in patients with cerebrovascular complications and a coexistent strong indication for anticoagulation, creating what is often a very thorny dilemma.
Based on a review of available evidence, recommendations for anticoagulation in patients with infectious endocarditis are summarized below.
AVAILABLE EVIDENCE IS SCARCE AND MIXED
Earlier observational studies suggested a significant risk of cerebral hemorrhage with anticoagulation in patients with native valve endocarditis, although none of these studies were recent (some of them took place in the 1940s), and none are methodologically compelling.4–8 Consequently, some experts have expressed skepticism regarding their findings, particularly in recent years.
In part, this skepticism arises from studies that showed a lower incidence of cerebrovascular complications and smaller vegetation size in patients with prosthetic valve infectious endocarditis, studies in which many of the patients received anticoagulation therapy.9,10 The mechanism responsible for this effect is theorized to be that the vegetation is an amalgam of destroyed cells, platelets, and fibrin, with anticoagulation preventing this aggregation from further growth and propagation.
How great is the benefit or the potential harm?
Some experts argue that the incidence of ischemic stroke with hemorrhagic transformation in patients with infectious endocarditis receiving anticoagulation is overestimated. According to this view, the beneficial effects of anticoagulation at least counterbalance the potential harmful effects.
In addition to the studies cited above, recent studies have shown that patients on anticoagulation tend to have smaller vegetations and fewer cerebrovascular complications.11–13 Snygg-Martin et al11 and Rasmussen et al12 found not only that cerebrovascular complications were less common in patients already on anticoagulation at the time infectious endocarditis was diagnosed, but also that no increase in the rate of hemorrhagic lesions was reported.
These were all nonrandomized studies, and most of the patients in them had native valve infectious endocarditis diagnosed at an early stage. Importantly, these studies found that the beneficial effects of anticoagulation were only present if the patient was receiving warfarin before infectious endocarditis was diagnosed and antibiotic therapy was initiated. No benefits from anticoagulation were demonstrated once antimicrobial therapy was begun.
Similarly, Anavekar et al14 showed that embolic events occurred significantly less often in those who were currently on continuous daily antiplatelet therapy, suggesting that receiving antiplatelet agents at baseline protects against cardioembolic events in patients who develop infective endocarditis. However, the only randomized trial examining the initiation of antiplatelet therapy in patients diagnosed with infectious endocarditis receiving antibiotic treatment showed that adding aspirin did not reduce the risk of embolic events and was associated with a trend toward increased risk of bleeding.15
A recent large cohort study suggested that infectious endocarditis patients who receive anticoagulation therapy may have a higher incidence of cerebrovascular complications (hazard ratio 1.31, 95% confidence interval 1.00–1.72, P = .048), with a particular association of anticoagulation therapy with intracranial bleeding (hazard ratio 2.71, 95% confidence interval 1.54–4.76, P = .001).16
Another provocative link supported by the same study was a higher incidence of hemorrhagic complications with anticoagulation in patients with infectious endocarditis caused by Staphylococcus aureus, an association also suggested by older data from Tornos et al,8 but not seen in a study by Rasmussen et al.12
Continuing anticoagulation is an individualized decision
The benefit or harm of anticoagulation in patients with infectious endocarditis may be determined at least in part by a complex mix of factors including the valve involved (embolic events are more common with mitral valve vegetations than with aortic valve vegetations), vegetation size (higher risk if > 1 cm), mobility of vegetations, and perhaps the virulence of the causative organism.16,17 The fact that antimicrobial therapy obviates any beneficial effect of anticoagulation speaks strongly against starting anticoagulation therapy in infectious endocarditis patients with the sole purpose of reducing stroke risk.
Without large randomized trials to better delineate the risks and benefits of continuing preexisting anticoagulation in all patients with infectious endocarditis, patients already receiving anticoagulants need a careful, individualized risk-benefit assessment. Current guidelines agree that newly diagnosed infectious endocarditis per se is not an indication for anticoagulation or aspirin therapy (Table 1).1–3
TAKE-HOME POINTS
- Starting antiplatelet and anticoagulation therapy for the sole purpose of stroke prevention is not recommended in patients with newly diagnosed infectious endocarditis.
- In most cases, anticoagulation and antiplatelet therapy should be temporarily discontinued in patients with infectious endocarditis and stroke or suspected stroke.
- Patients need careful assessment on a case-by-case basis, and the presence of risk factors predisposing patients to cerebrovascular complications (eg, large or very mobile vegetations, causative pathogens such as S aureus or Candida spp) may prompt temporary suspension of anticoagulation and antiplatelet therapy.
- If there is a clear preexisting or coexisting indication for these agents and surgery is not anticipated, consider continuing antiplatelet and anticoagulant therapy in patients with infectious endocarditis, provided they lack the risk factors described above and stroke has been excluded.
- If there is a clear preexisting or coexisting indication for these agents and surgery is being considered, consider using a short-acting anticoagulant such as intravenous or low-molecular weight heparin as a bridge to surgery.
- Baddour LM, Wilson WR, Bayer AS, et al. Infective endocarditis in adults: diagnosis, antimicrobial therapy, and management of complications: a scientific statement for healthcare professionals from the American Heart Association. Circulation 2015; 132:1435–1486.
- Habib G, Lancellotti P, Antunes MJ, et al. 2015 ESC guidelines for the management of infective endocarditis. Rev Esp Cardiol (Engl Ed) 2016; 69:69.
- Whitlock RP, Sun JC, Fremes SE, Rubens FD, Teoh KH. Antithrombotic and thrombolytic therapy for valvular disease: Antithrombotic Therapy and Prevention of Thrombosis, 9th ed: American College of Chest Physicians evidence-based clinical practice guidelines. Chest 2012; 141:e576S–e600S.
- Delahaye JP, Poncet P, Malquarti V, Beaune J, Garé JP, Mann JM. Cerebrovascular accidents in infective endocarditis: role of anticoagulation. Eur Heart J 1990; 11:1074–1078.
- Loewe L. The combined use of anti-infectives and anticoagulants in the treatment of subacute bacterial endocarditis. Bull N Y Acad Med 1945; 21:59–86.
- Priest WS, Smith JM, McGee GC. The effect of anticoagulants on the penicillin therapy and the pathologic lesions of subacute bacterial endocarditis. N Engl J Med 1946; 235:699–706.
- Pruitt AA, Rubin RH, Karchmer AW, Duncan GW. Neurologic complications of bacterial endocarditis. Medicine 1978; 57:329–343.
- Tornos P, Almirante B, Mirabet S, Permanyer G, Pahissa A, Soler-Soler J. Infective endocarditis due to Staphylococcus aureus: deleterious effect of anticoagulant therapy. Arch Intern Med 1999; 159:473–475.
- Wilson WR, Geraci JE, Danielson GK, et al. Anticoagulant therapy and central nervous system complications in patients with prosthetic valve endocarditis. Circulation 1978; 57:1004–1007.
- Schulz R, Werner GS, Fuchs JB, et al. Clinical outcome and echocardiographic findings of native and prosthetic valve endocarditis in the 1990’s. Eur Heart J 1996; 17:281–288.
- Snygg-Martin U, Rasmussen RV, Hassager C, Bruun NE, Andersson R, Olaison L. Warfarin therapy and incidence of cerebrovascular complications in left-sided native valve endocarditis. Eur J Clin Microbiol Infect Dis 2011; 30:151–157.
- Rasmussen RV, Snygg-Martin U, Olaison L, et al. Major cerebral events in Staphylococcus aureus infective endocarditis: is anticoagulant therapy safe? Cardiology 2009; 114:284–291.
- Yau JW, Lee P, Wilson A, Jenkins AJ. Prosthetic valve endocarditis: what is the evidence for anticoagulant therapy? Intern Med J 2011; 41:795–797.
- Anavekar NS, Tleyjeh IM, Mirzoyev Z, et al. Impact of prior antiplatelet therapy on risk of embolism in infective endocarditis. Clin Infect Dis 2007; 44:1180–1186.
- Chan KL, Dumesnil JG, Cujec B, et al. A randomized trial of aspirin on the risk of embolic events in patients with infective endocarditis. J Am Coll Cardiol 2003; 42:775–780.
- Garcia-Cabrera E, Fernández-Hidalgo N, Almirante B, et al. Neurological complications of infective endocarditis: risk factors, outcome, and impact of cardiac surgery: a multicenter observational study. Circulation 2013; 127:2272–2284.
- Thuny F, Di Salvo G, Belliard O, et al. Risk of embolism and death in infective endocarditis: prognostic value of echocardiography: a prospective multicenter study. Circulation 2005; 112:69–75.