User login
Risks of keeping controlled substances in office tilt away from benefits
I don’t stack narcotics in my office. Never have, never will.
Honestly, in this day and age, I don’t understand why anyone would.
I get the occasional patient with a bad migraine who wants to come in for “a shot.” Sorry, I don’t carry that. I suppose I could carry Ketorolac, but I try to run a simple, nonurgent practice. If you have an urgent situation, go to an emergency department or urgent care.

I couldn’t agree more. It’s better to avoid the problem altogether.
In 1998, on my very first day of work as an attending, the group I’d signed with put me in a satellite office normally used by their headache specialist. While familiarizing myself with what was where, I discovered a bottle of injectable meperidine. It wasn’t locked up, just sitting next to the zolmitriptan (Zomig) samples in an unsecured cabinet. I picked it up in shock to make sure I’d read the label correctly. I put it back down then (somewhat paranoid) picked it back up, wiped my fingerprints off, and put it down in the exact same spot it had been. Although it was obviously a serious infraction, I didn’t want to jeopardize my standing as a new hire. So, I just ignored it. But, I sure worried about what would happen if a DEA inspector showed up.
So, today, I just don’t deal with it. No controlled substances, less paperwork, fewer worries. Simplicity is bliss, and modern medicine has enough worries as it is.
This still gets me the occasional complaint of, “Well, my other neurologist did!” but, frankly, I don’t care. They can run their practice how they want, and I’ll run mine.
In a world of regulations, daily press stories on “pill mills” overusing narcotics, and my quarterly prescription tracking reports from the state board, I want to keep my involvement in them as minimal as possible. I may prescribe them, but I don’t want the potential nightmares of having them on site.
Dr. Block has a solo neurology practice in Scottsdale, Ariz.
I don’t stack narcotics in my office. Never have, never will.
Honestly, in this day and age, I don’t understand why anyone would.
I get the occasional patient with a bad migraine who wants to come in for “a shot.” Sorry, I don’t carry that. I suppose I could carry Ketorolac, but I try to run a simple, nonurgent practice. If you have an urgent situation, go to an emergency department or urgent care.
I couldn’t agree more. It’s better to avoid the problem altogether.
In 1998, on my very first day of work as an attending, the group I’d signed with put me in a satellite office normally used by their headache specialist. While familiarizing myself with what was where, I discovered a bottle of injectable meperidine. It wasn’t locked up, just sitting next to the zolmitriptan (Zomig) samples in an unsecured cabinet. I picked it up in shock to make sure I’d read the label correctly. I put it back down then (somewhat paranoid) picked it back up, wiped my fingerprints off, and put it down in the exact same spot it had been. Although it was obviously a serious infraction, I didn’t want to jeopardize my standing as a new hire. So, I just ignored it. But, I sure worried about what would happen if a DEA inspector showed up.
So, today, I just don’t deal with it. No controlled substances, less paperwork, fewer worries. Simplicity is bliss, and modern medicine has enough worries as it is.
This still gets me the occasional complaint of, “Well, my other neurologist did!” but, frankly, I don’t care. They can run their practice how they want, and I’ll run mine.
In a world of regulations, daily press stories on “pill mills” overusing narcotics, and my quarterly prescription tracking reports from the state board, I want to keep my involvement in them as minimal as possible. I may prescribe them, but I don’t want the potential nightmares of having them on site.
Dr. Block has a solo neurology practice in Scottsdale, Ariz.
FDA approves generic version of HIV drug Truvada
The U.S. Food and Drug Administration has approved the first generic version of emtricitabine and tenofovir disoproxil fumarate tablets, previously known by the brand name Truvada, for the treatment of HIV-1 infection.
Like Truvada, the generic version of the drug – produced by Teva Pharmaceuticals USA and approved in 200-mg/300-mg tablet form – is indicated for use in combination with other antiretrovirals for patients infected with HIV-1 and for pre-exposure prophylaxis (PrEP) to prevent sexually-acquired HIV infection in high-risk adults.
Women infected with HIV-1 should not breastfeed while taking emtricitabine and tenofovir disoproxil fumarate, the FDA said, and the drug can be used only in pediatric patients weighing more than 17 kg.
[email protected]
On Twitter @richpizzi
Revisions coming to McDonald Criteria for MS
NEW ORLEANS – Changes are coming to the current McDonald Criteria for diagnosing multiple sclerosis, primarily because of advances in the understanding of MS since the criteria were last updated in 2010.
Such advances include the availability of new data regarding the relationship between MS and other spectrum disorders and data concerning the performance of the 2010 McDonald Criteria in several patient populations, according to Jeffrey A. Cohen, MD, who cochaired the effort known as the International Panel on Diagnosis of Multiple Sclerosis. “There also were new data concerning the utility of cerebrospinal fluid evaluation and increasing recognition that the role of cerebrospinal fluid (CSF) examination perhaps needs increased emphasis,” Dr. Cohen said at the annual meeting of the Consortium of Multiple Sclerosis Centers. “It’s been somewhat de-emphasized in previous versions of the criteria. Then, there was identification of subsets of patients that were felt to have a high likelihood of MS but in whom the diagnosis could not be made by the current criteria – patients who fell through the cracks. There was also increasing recognition of the frequency and important consequences of misdiagnosis.”

The panel emphasized that evidence supporting the McDonald criteria is predominately based on patients with a typical clinically isolated syndrome (CIS) at onset. It also acknowledged the difficulty of confirming a diagnosis of MS, the importance of addressing alternative diagnoses and absence of atypical features and red flags, and the rigor necessary for interpreting clinical, imaging, and laboratory studies. “Misdiagnosis is common,” Dr. Cohen told meeting attendees. “In some series, upwards of 50%-60% of patients referred to a specialized MS center turn out to have some other diagnosis. Our panel had discussions related to the tradeoff between sensitivity of the criteria and trying to make the diagnosis earlier and in a broader range of patients but counterbalancing that against the risk of a misdiagnosis. Our conclusion was that, although some of that might be created by the criteria, it’s mostly a problem of misapplying the criteria. One needs to remember that to make the diagnosis of MS does not merely require demonstrating that the patient has a disease process that involves potentially multiple places in the CNS and as recurrent events over time, but one has to apply the diagnostic data with rigor.”
Another emphasis expected to be included in updated McDonald criteria is the use of CSF and spinal cord imaging, as well as the notion that a history, examination, and synthesis of a patient’s overall clinical picture “needs to be made by a clinician with MS-related expertise,” Dr. Cohen said. “One cannot merely use the criteria as a checklist.”
The panelists also discussed modifying the term “possible MS,” which is already in the McDonald criteria, to include patients with CIS who do not (yet) fulfill the diagnostic criteria for MS; radiologically isolated syndrome (RIS); solitary sclerosis; and patients with clinical manifestations, imaging, and other features that are compatible with MS but not typical for those who may or may not be determined to have MS or in the future.
Dr. Cohen noted that additional data concerning the applicability of the McDonald criteria to Asian and Latin populations have been published since 2010 but are modest. “There is no indication the McDonald criteria cannot be used in these populations,” he said. “Care is needed to address alternative diagnoses, particularly neuromyelitis optica spectrum disorder (NMOSD) in both and also infectious diseases in Latin America.” Several studies also support the applicability of the McDonald criteria in children, with certain caveats. “One needs to be careful in diagnosing MS in people younger than 11 years of age,” Dr. Cohen said. “If the initial event is [acute disseminated encephalomyelitis], they also need to have a typical clinically isolated syndrome.”
Panelists also agreed that the McDonald criteria apply to older patients, with caveats that a new diagnosis of MS is rarely considered in older adults. “They are more likely to have a progressive course, either progressive from onset or following previous unrecognized relapses,” Dr. Cohen said. “There needs to be careful consideration of alternative diagnoses and, particularly, comorbidities. This represents an example of a diagnostic scenario for which CSF examination is advised.”
Panel members found that the recognized range of potential clinical manifestations of NMOSD is becoming wider and is still being defined. “Emerging data suggests a substantial proportion of AQP-4 seronegative patients with NMOSD features (about 20%) have anti–myelin oligodendrocyte glycoprotein antibodies,” he said. “Although some features of MS and NMOSD overlap, they are now understood to be distinct disorders.”
Other points under consideration for the 2017 revision of the McDonald Criteria included incorporating the revised phenotype categories (relapse-remitting, secondary progressive, primary progressive, and progressive relapsing), expanding the role of CSF to allow diagnosis of MS with CIS plus DIS plus oligoclonal bands, determining whether to accept 2016 Revised Magnetic Resonance Imaging in Multiple Sclerosis MRI criteria in aggregate or in part, and incorporating optic nerve involvement.
Dr. Cohen disclosed that he has received compensation as a consultant for Adamas, Celgene, Merck, Mallinckrodt, and Novartis.
NEW ORLEANS – Changes are coming to the current McDonald Criteria for diagnosing multiple sclerosis, primarily because of advances in the understanding of MS since the criteria were last updated in 2010.
Such advances include the availability of new data regarding the relationship between MS and other spectrum disorders and data concerning the performance of the 2010 McDonald Criteria in several patient populations, according to Jeffrey A. Cohen, MD, who cochaired the effort known as the International Panel on Diagnosis of Multiple Sclerosis. “There also were new data concerning the utility of cerebrospinal fluid evaluation and increasing recognition that the role of cerebrospinal fluid (CSF) examination perhaps needs increased emphasis,” Dr. Cohen said at the annual meeting of the Consortium of Multiple Sclerosis Centers. “It’s been somewhat de-emphasized in previous versions of the criteria. Then, there was identification of subsets of patients that were felt to have a high likelihood of MS but in whom the diagnosis could not be made by the current criteria – patients who fell through the cracks. There was also increasing recognition of the frequency and important consequences of misdiagnosis.”
The panel emphasized that evidence supporting the McDonald criteria is predominately based on patients with a typical clinically isolated syndrome (CIS) at onset. It also acknowledged the difficulty of confirming a diagnosis of MS, the importance of addressing alternative diagnoses and absence of atypical features and red flags, and the rigor necessary for interpreting clinical, imaging, and laboratory studies. “Misdiagnosis is common,” Dr. Cohen told meeting attendees. “In some series, upwards of 50%-60% of patients referred to a specialized MS center turn out to have some other diagnosis. Our panel had discussions related to the tradeoff between sensitivity of the criteria and trying to make the diagnosis earlier and in a broader range of patients but counterbalancing that against the risk of a misdiagnosis. Our conclusion was that, although some of that might be created by the criteria, it’s mostly a problem of misapplying the criteria. One needs to remember that to make the diagnosis of MS does not merely require demonstrating that the patient has a disease process that involves potentially multiple places in the CNS and as recurrent events over time, but one has to apply the diagnostic data with rigor.”
Another emphasis expected to be included in updated McDonald criteria is the use of CSF and spinal cord imaging, as well as the notion that a history, examination, and synthesis of a patient’s overall clinical picture “needs to be made by a clinician with MS-related expertise,” Dr. Cohen said. “One cannot merely use the criteria as a checklist.”
The panelists also discussed modifying the term “possible MS,” which is already in the McDonald criteria, to include patients with CIS who do not (yet) fulfill the diagnostic criteria for MS; radiologically isolated syndrome (RIS); solitary sclerosis; and patients with clinical manifestations, imaging, and other features that are compatible with MS but not typical for those who may or may not be determined to have MS or in the future.
Dr. Cohen noted that additional data concerning the applicability of the McDonald criteria to Asian and Latin populations have been published since 2010 but are modest. “There is no indication the McDonald criteria cannot be used in these populations,” he said. “Care is needed to address alternative diagnoses, particularly neuromyelitis optica spectrum disorder (NMOSD) in both and also infectious diseases in Latin America.” Several studies also support the applicability of the McDonald criteria in children, with certain caveats. “One needs to be careful in diagnosing MS in people younger than 11 years of age,” Dr. Cohen said. “If the initial event is [acute disseminated encephalomyelitis], they also need to have a typical clinically isolated syndrome.”
Panelists also agreed that the McDonald criteria apply to older patients, with caveats that a new diagnosis of MS is rarely considered in older adults. “They are more likely to have a progressive course, either progressive from onset or following previous unrecognized relapses,” Dr. Cohen said. “There needs to be careful consideration of alternative diagnoses and, particularly, comorbidities. This represents an example of a diagnostic scenario for which CSF examination is advised.”
Panel members found that the recognized range of potential clinical manifestations of NMOSD is becoming wider and is still being defined. “Emerging data suggests a substantial proportion of AQP-4 seronegative patients with NMOSD features (about 20%) have anti–myelin oligodendrocyte glycoprotein antibodies,” he said. “Although some features of MS and NMOSD overlap, they are now understood to be distinct disorders.”
Other points under consideration for the 2017 revision of the McDonald Criteria included incorporating the revised phenotype categories (relapse-remitting, secondary progressive, primary progressive, and progressive relapsing), expanding the role of CSF to allow diagnosis of MS with CIS plus DIS plus oligoclonal bands, determining whether to accept 2016 Revised Magnetic Resonance Imaging in Multiple Sclerosis MRI criteria in aggregate or in part, and incorporating optic nerve involvement.
Dr. Cohen disclosed that he has received compensation as a consultant for Adamas, Celgene, Merck, Mallinckrodt, and Novartis.
EXPERT ANALYSIS AT THE CMSC ANNUAL MEETING
Transcranial magnetic stimulation shows more promise in refractory OCD
SAN FRANCISCO – Mounting evidence suggests that transcranial magnetic stimulation is an effective noninvasive therapy for obsessive-compulsive disorder refractory to first-line medications, Eric Hollander, MD, said at the annual conference of the Anxiety and Depression Association of America.
A novel treatment for obsessive-compulsive disorder (OCD) would be most welcome. This is a disorder that’s common – affecting 2%-3% of the population – debilitating, and notoriously tough to treat. Roughly half of patients with OCD don’t respond to first-line therapy, which is selective serotonin reuptake inhibitors, cognitive-behavioral therapy, or both, according to Dr. Hollander, director of the autism and obsessive-compulsive spectrum program as well as the anxiety and depression program at Albert Einstein College of Medicine in New York.

Four companies now have FDA-cleared TMS devices indicated for treatment of major depression: Brainsway, which markets a dTMS device, and Neuronetics, MagVenture, and Magstim, which sell repetitive TMS (rTMS) devices that do not penetrate as deeply beneath the skull as dTMS and therefore target different brain structures.
TMS for OCD is, at present, off-label therapy. Yet, there is now sufficient experience derived from formal clinical trials and off-label use in clinical practice to be able to state that the standard target area for rTMS is the supplementary motor area (SMA), according to Dr. Hollander.
He was senior author of a randomized open-label pilot study involving 50 consecutive OCD patients refractory to SSRIs. Half were assigned to a popular second-line strategy: augmentation with antipsychotic agents. The other half received five 20-minute-long rTMS sessions per week for 3 weeks using low-frequency 1 Hz bilateral stimulation of the SMA.
At 3 weeks, the treatment response rate as defined by at least a 25% reduction from baseline on the Yale-Brown Obsessive-Compulsive Scale (YBOCS) was 68% in the rTMS group, compared with 24% in the control arm. Thus, rTMS was better than treatment as usual (J Psychopharmacol. 2016 Jun;30[6]:568-78).
“That’s considerable improvement after only 3 weeks of stimulation, which is a very short time, compared to other OCD treatments,” the psychiatrist noted.
In another study, Dr. Hollander and his coinvestigators used the same rTMS regimen targeting the SMA in 22 SSRI-refractory OCD patients. After 3 weeks of rTMS, 12 of the 22 were treatment responders and 3 patients were in remission.
Moreover, these effects were long-lasting. At 6 months, 13 patients were responders and 4 were in remission, and, at 12 months – nearly a year after their relatively brief course of rTMS – there were 12 responders and 3 remitters.
Participants also showed significant reductions on both the Hamilton Depression Rating Scale (HAM-D) and the Hamilton Anxiety Rating Scale (HAM-A), effects that were sustained during follow-up, although the improvement in OCD symptoms was more impressive, he said.
Other investigators also have reported positive results using rTMS for OCD, with the first publication coming from Italian investigators more than a decade ago (Int J Neuropsychopharmacol. 2006 Feb;9[1]:95-100).
Studies of dTMS for OCD are a more recent development. In 2016, investigators reported on 40 OCD patients treated double-blind with either high-stimulation dTMS at 20 Hz, low-stimulation at 1 Hz, or a sham magnetic coil daily for 5 weeks. The target areas were the medial prefrontal and anterior cingulate cortices, areas too deep to be reached using rTMS. At the 5-week mark, the patients who received high-stimulation dTMS showed a mean 26% improvement in YBOCS scores, compared with a 6% reduction in the low-stimulation and sham-treatment arms.
In this study, electroencephalogram evoked potential responses over the anterior cingulate cortex correlated with clinical response, thus providing a welcome biomarker of treatment efficacy.
How TMS works in OCD
TMS involves placing a coil on the scalp to create a magnetic pulse that passes through the skull and achieves predictable changes in neuronal activity in brain tissue, either exciting or deactivating target regions depending upon whether high- or low-frequency TMS is applied.
Brain imaging studies show that OCD is characterized by hyperactivation of the medial frontal cortex and the SMA. The dysfunctional circuitry of OCD has been worked out. It’s striatally based, involving frontal-striatal-thalamic circuits. The SMA sits right above the anterior cingulate cortex and provides access to these key pathways. Basically, increased neuronal activity in the frontal lobes of OCD patients results in miscommunication with the striatal and thalamic regions, with resultant thalamic hyperactivity. This failure of cortical inhibition leads to persistent intrusive thoughts and behaviors, Dr. Hollander explained.
The neural circuitry of OCD is distinct from that of other anxiety disorders, and it appears that TMS is not as effective in those disorders as in OCD, he added.
The anterior cingulate is one step closer than the SMA to the frontal-striatal-thalamic circuits, which are of particular therapeutic interest in OCD, and it’s accessible by dTMS. Anterior cingulate activity is decreased in OCD. When high-frequency dTMS revs up that activity, the result is symptomatic improvement. Of note, the anterior cingulate also is the target for cingulotomy, an established surgical treatment for OCD.
Dr. Hollander reported receiving research funding from the National Institute of Mental Health, the National Institute on Drug Abuse, and the National Institute of Neurological Disorders and Stroke. He serves as a consultant to a number of pharmaceutical companies.
SAN FRANCISCO – Mounting evidence suggests that transcranial magnetic stimulation is an effective noninvasive therapy for obsessive-compulsive disorder refractory to first-line medications, Eric Hollander, MD, said at the annual conference of the Anxiety and Depression Association of America.
A novel treatment for obsessive-compulsive disorder (OCD) would be most welcome. This is a disorder that’s common – affecting 2%-3% of the population – debilitating, and notoriously tough to treat. Roughly half of patients with OCD don’t respond to first-line therapy, which is selective serotonin reuptake inhibitors, cognitive-behavioral therapy, or both, according to Dr. Hollander, director of the autism and obsessive-compulsive spectrum program as well as the anxiety and depression program at Albert Einstein College of Medicine in New York.
Four companies now have FDA-cleared TMS devices indicated for treatment of major depression: Brainsway, which markets a dTMS device, and Neuronetics, MagVenture, and Magstim, which sell repetitive TMS (rTMS) devices that do not penetrate as deeply beneath the skull as dTMS and therefore target different brain structures.
TMS for OCD is, at present, off-label therapy. Yet, there is now sufficient experience derived from formal clinical trials and off-label use in clinical practice to be able to state that the standard target area for rTMS is the supplementary motor area (SMA), according to Dr. Hollander.
He was senior author of a randomized open-label pilot study involving 50 consecutive OCD patients refractory to SSRIs. Half were assigned to a popular second-line strategy: augmentation with antipsychotic agents. The other half received five 20-minute-long rTMS sessions per week for 3 weeks using low-frequency 1 Hz bilateral stimulation of the SMA.
At 3 weeks, the treatment response rate as defined by at least a 25% reduction from baseline on the Yale-Brown Obsessive-Compulsive Scale (YBOCS) was 68% in the rTMS group, compared with 24% in the control arm. Thus, rTMS was better than treatment as usual (J Psychopharmacol. 2016 Jun;30[6]:568-78).
“That’s considerable improvement after only 3 weeks of stimulation, which is a very short time, compared to other OCD treatments,” the psychiatrist noted.
In another study, Dr. Hollander and his coinvestigators used the same rTMS regimen targeting the SMA in 22 SSRI-refractory OCD patients. After 3 weeks of rTMS, 12 of the 22 were treatment responders and 3 patients were in remission.
Moreover, these effects were long-lasting. At 6 months, 13 patients were responders and 4 were in remission, and, at 12 months – nearly a year after their relatively brief course of rTMS – there were 12 responders and 3 remitters.
Participants also showed significant reductions on both the Hamilton Depression Rating Scale (HAM-D) and the Hamilton Anxiety Rating Scale (HAM-A), effects that were sustained during follow-up, although the improvement in OCD symptoms was more impressive, he said.
Other investigators also have reported positive results using rTMS for OCD, with the first publication coming from Italian investigators more than a decade ago (Int J Neuropsychopharmacol. 2006 Feb;9[1]:95-100).
Studies of dTMS for OCD are a more recent development. In 2016, investigators reported on 40 OCD patients treated double-blind with either high-stimulation dTMS at 20 Hz, low-stimulation at 1 Hz, or a sham magnetic coil daily for 5 weeks. The target areas were the medial prefrontal and anterior cingulate cortices, areas too deep to be reached using rTMS. At the 5-week mark, the patients who received high-stimulation dTMS showed a mean 26% improvement in YBOCS scores, compared with a 6% reduction in the low-stimulation and sham-treatment arms.
In this study, electroencephalogram evoked potential responses over the anterior cingulate cortex correlated with clinical response, thus providing a welcome biomarker of treatment efficacy.
How TMS works in OCD
TMS involves placing a coil on the scalp to create a magnetic pulse that passes through the skull and achieves predictable changes in neuronal activity in brain tissue, either exciting or deactivating target regions depending upon whether high- or low-frequency TMS is applied.
Brain imaging studies show that OCD is characterized by hyperactivation of the medial frontal cortex and the SMA. The dysfunctional circuitry of OCD has been worked out. It’s striatally based, involving frontal-striatal-thalamic circuits. The SMA sits right above the anterior cingulate cortex and provides access to these key pathways. Basically, increased neuronal activity in the frontal lobes of OCD patients results in miscommunication with the striatal and thalamic regions, with resultant thalamic hyperactivity. This failure of cortical inhibition leads to persistent intrusive thoughts and behaviors, Dr. Hollander explained.
The neural circuitry of OCD is distinct from that of other anxiety disorders, and it appears that TMS is not as effective in those disorders as in OCD, he added.
The anterior cingulate is one step closer than the SMA to the frontal-striatal-thalamic circuits, which are of particular therapeutic interest in OCD, and it’s accessible by dTMS. Anterior cingulate activity is decreased in OCD. When high-frequency dTMS revs up that activity, the result is symptomatic improvement. Of note, the anterior cingulate also is the target for cingulotomy, an established surgical treatment for OCD.
Dr. Hollander reported receiving research funding from the National Institute of Mental Health, the National Institute on Drug Abuse, and the National Institute of Neurological Disorders and Stroke. He serves as a consultant to a number of pharmaceutical companies.
EXPERT ANALYSIS FROM THE ANXIETY AND DEPRESSION CONFERENCE 2017
Sacroiliac structural changes show on MRI in nonradiographic axial SpA despite no inflammation
Structural lesions of the sacroiliac joints (SIJ) may be present on MRI in patients with nonradiographic axial spondyloarthritis (nr-axSpA), even when radiographs are normal or inconclusive for such lesions and there is no evidence of inflammation on MRI, according to findings from a cohort of patients in a randomized trial.
In the study, the patients who exhibited such lesions, especially erosions, were more likely to have more severe disease and greater spinal inflammation than were patients who did not have the structural lesions on MRI.

The presence of MRI structural lesions appeared to reflect more severe disease with greater spinal inflammation, the investigators said, based on higher mean SPARCC spinal scores in 23 discovertebral units. The mean number of discovertebral units involved was significantly greater overall among patients with structural lesions (6.5), compared with those without (3.3). Both Bath Ankylosing Spondylitis Activity Index and Bath Ankylosing Spondylitis Functional Index scores were also significantly higher for patients with BME but no MRI structural lesions (a mean of 6.4 cm and 4.6 cm, respectively), when compared with patients who had both (a mean of 5.7 cm and 3.7 cm, respectively).
Age, sex, and HLA-B27 status also appeared to play a role in the frequency with which MRI structural lesions coexisted with BME. The group of patients with both BME and structural lesions in the sacroiliac joint were significantly more often male (83% vs. 48%), younger (mean age of 30 vs. 34 years), and HLA-B27 positive (87% vs. 63%) than in those with only BME.
“These data support the concept that nr-axSpA is an early stage of axSpA and that structural lesions in the SIJ are associated with a more severe phenotype characterized by more active spinal inflammation,” the investigators wrote.
The presence of structural lesions might also identify patients who would benefit the most from early treatment with biologics, they suggested. “It has been suggested that there is a window of opportunity for disease modification with anti-inflammatory agents by treating acute inflammatory lesions before bone formation pathways are triggered in more complex inflammatory lesions. Consequently, the presence of structural lesions in the SIJ may help select patients for intervention with anti-TNF agents early in the disease course.”
The study was funded by Pfizer. Three of the authors are employees of Pfizer. Two authors have received consulting fees and/or research funding/grants from a variety of companies that make drugs for the treatment of ankylosing spondylitis, including Pfizer.
Structural lesions of the sacroiliac joints (SIJ) may be present on MRI in patients with nonradiographic axial spondyloarthritis (nr-axSpA), even when radiographs are normal or inconclusive for such lesions and there is no evidence of inflammation on MRI, according to findings from a cohort of patients in a randomized trial.
In the study, the patients who exhibited such lesions, especially erosions, were more likely to have more severe disease and greater spinal inflammation than were patients who did not have the structural lesions on MRI.
The presence of MRI structural lesions appeared to reflect more severe disease with greater spinal inflammation, the investigators said, based on higher mean SPARCC spinal scores in 23 discovertebral units. The mean number of discovertebral units involved was significantly greater overall among patients with structural lesions (6.5), compared with those without (3.3). Both Bath Ankylosing Spondylitis Activity Index and Bath Ankylosing Spondylitis Functional Index scores were also significantly higher for patients with BME but no MRI structural lesions (a mean of 6.4 cm and 4.6 cm, respectively), when compared with patients who had both (a mean of 5.7 cm and 3.7 cm, respectively).
Age, sex, and HLA-B27 status also appeared to play a role in the frequency with which MRI structural lesions coexisted with BME. The group of patients with both BME and structural lesions in the sacroiliac joint were significantly more often male (83% vs. 48%), younger (mean age of 30 vs. 34 years), and HLA-B27 positive (87% vs. 63%) than in those with only BME.
“These data support the concept that nr-axSpA is an early stage of axSpA and that structural lesions in the SIJ are associated with a more severe phenotype characterized by more active spinal inflammation,” the investigators wrote.
The presence of structural lesions might also identify patients who would benefit the most from early treatment with biologics, they suggested. “It has been suggested that there is a window of opportunity for disease modification with anti-inflammatory agents by treating acute inflammatory lesions before bone formation pathways are triggered in more complex inflammatory lesions. Consequently, the presence of structural lesions in the SIJ may help select patients for intervention with anti-TNF agents early in the disease course.”
The study was funded by Pfizer. Three of the authors are employees of Pfizer. Two authors have received consulting fees and/or research funding/grants from a variety of companies that make drugs for the treatment of ankylosing spondylitis, including Pfizer.
FROM ARTHRITIS RESEARCH & THERAPY
Key clinical point:
Major finding: Sacroiliac joint erosions on MRI occurred in 11% of patients who did not have bone marrow edema, which was significantly less than its occurrence in 45% of those with BME.
Data source: A study of 183 patients with nr-axSpA who had participated in a treatment trial.
Disclosures: The study was funded by Pfizer. Three of the authors are employees of Pfizer. Two authors have received consulting fees and/or research funding/grants from a variety of companies that make drugs for the treatment of ankylosing spondylitis, including Pfizer.
Who’s best suited for Internet-based CBT?
SAN FRANCISCO – Nearly 6% of patients deteriorated during Internet-based cognitive-behavioral therapy (iCBT) in an individual patient data meta-analysis totaling 2,866 participants in 29 published clinical trials, Alexander Rozental, PhD, reported at the annual conference of the Anxiety and Depression Association of America.
On the other hand, the meta-analysis also highlighted the hazards of doing nothing for patients experiencing mental distress: 17.4% of patients deteriorated while in wait-list control groups in the 29 trials, a rate of harm triple the 5.8% deterioration rate in patients during iCBT, added Dr. Rozental, a clinical psychologist at Stockholm University.
This meta-analysis is one of the very few studies to look at the negative effects of a psychologic treatment. Psychotherapy research has focused almost entirely on the positive effects. That’s at odds with the way pharmacologic research is conducted, in which reporting of adverse events is mandatory, he noted.
Of patients in the meta-analysis, 61% sought treatment for anxiety disorders, 20% for depression, and the rest for erectile dysfunction, pathological gambling, or relationship problems.
iCBT is particularly popular in Sweden, where it was developed two decades ago as a means of disseminating evidence-based, manualized therapy to a broad population in a highly cost-effective manner. This form of psychotherapy typically entails 8 to 12 weekly treatment modules, with weekly assignments, predetermined deadlines, texts and exercises, and regular, albeit relatively brief, contact with a therapist via secure email.
Dr. Rozental and his coinvestigators reviewed individual patient data in search of predictors of treatment success or deterioration. A profile emerged of the patients least likely to deteriorate while on iCBT: older age, university-educated, in a stable relationship, and with a higher level of symptoms pretreatment.
“You might interpret the findings as an indicator for matching the right type of treatment to the right patient. Perhaps those [who] are younger, have less than a university degree, and are not in a relationship might be better off in a face to face treatment, at least in terms of preventing deterioration,” he observed in an interview. “This makes sense if you think about the amount of work you have to do on your own in Internet-based psychological treatments, which include limited access to a therapist and require reading a lot of text material.”
Patients participating in iCBT who fit that profile might need extra support from a therapist in order to improve, Dr. Rozental added.
He reported having no financial conflicts regarding his study, which was funded by the Swedish Research Council for Health, Working Life, and Welfare.
AT THE ANXIETY AND DEPRESSION CONFERENCE 2017
Key clinical point:
Major finding: Slightly less than 6% of patients deteriorated while participating in Internet-based cognitive-behavioral therapy, mostly for anxiety disorders or depression.
Data source: This individual patient data meta-analysis involved 2,866 participants in 29 published clinical trials of internet-based cognitive-behavioral therapy.
Disclosures: The study was funded by the Swedish Research Council for Health, Working Life, and Welfare. The presenter reported having no financial conflicts.
Almost one-third of Syrian refugees in U.S. met PTSD criteria
SAN FRANCISCO – Nearly one-third of adult Syrian civil war refugees who have resettled in the Detroit area meet diagnostic criteria for posttraumatic stress disorder, according to preliminary results of an ongoing study presented by Arash Javanbakht, MD, at the annual conference of the Anxiety and Depression Association of America.
That’s comparable to PTSD rates documented in Vietnam War combat veterans.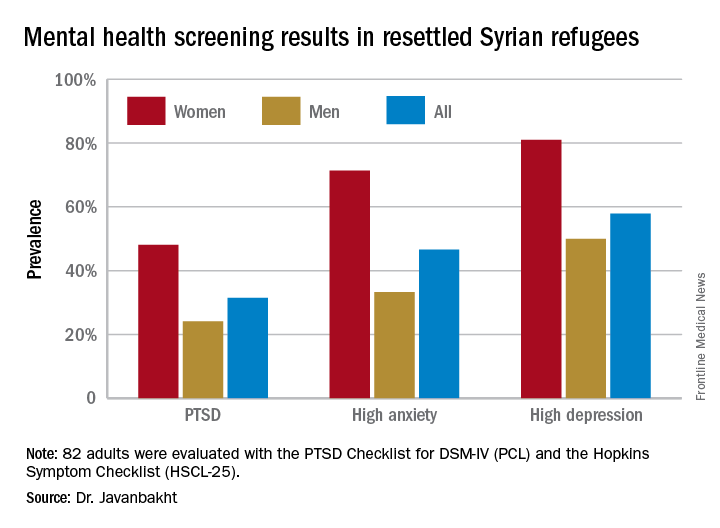
“Based on these data, mental health care for Syrian refugees resettling in the U.S. is highly needed,” he observed.
Michigan has a large population of Syrian war refugees. All who settle in southeastern Michigan undergo an initial health examination at Arab American and Chaldean Council primary care clinics staffed by bilingual teams. More than 90% of eligible adult refugees who have been invited to join Dr. Javanbakht’s mental health screening study have opted to participate. This extraordinarily high recruitment rate suggests that the findings are generalizable to the broader Syrian refugee community throughout the United States in his view.
The screening tools employed in the study are the PTSD Checklist, DSM-IV version (PCL), and the Hopkins Symptom Checklist (HSCL-25), which contains 10 anxiety questions and 15 depression questions.
Of the first 82 adult Syrian refugees evaluated, 26 (31.5%) were diagnosed as having PTSD on the basis of a PCL total score of 40 or more plus fulfillment of the DSM-IV diagnostic criteria for the disorder. In fact, this subgroup had a mean PCL score of 62.3. The prevalence of PTSD was twice as great in women, compared with men (see graphic).
Clinically impactful anxiety symptoms as defined by an HSCL-25 anxiety score greater than 1.79 was present in 38 refugees (47%), and clinically meaningful depressive symptoms were present in 47 (58%).
Anxiety, depression, and PTSD all were tightly correlated, complicating the clinical challenges, the psychiatrist noted.
Enrollment in the study is ongoing, but a first pass examination of a participant population that’s now twice the size of that in his presentation at the conference continues to show similar results, according to Dr. Javanbakht.
Dr. Javanbakht reported having no financial conflicts of interest regarding the study, which was funded by the state of Michigan and the Detroit Wayne Mental Health Authority.
AT THE ANXIETY AND DEPRESSION CONFERENCE 2017
Key clinical point:
Major finding: One-third of adult Syrian war refugees who have resettled in Michigan have posttraumatic stress disorder.
Data source: This ongoing cross-sectional study initially screened 82 adult Syrian civil war refugees for PTSD, anxiety, and depression.
Disclosures: This ongoing study is funded by the state of Michigan and the Detroit Wayne Mental Health Authority. The presenter reported having no financial conflicts of interest.
New approval lights up gliomas to aid resection
The Food and Drug Administration has approved aminolevulinic acid hydrochloride (Gleolan) to help visualize gliomas during surgery and allow for more complete resection.
Aminolevulinic acid hydrochloride lights up the tumor so surgeons can distinguish it from healthy tissue. Patients take the drug orally – 20 mg/kg – approximately 3 hours before anesthesia. Glioma cells take it up and convert it to the fluorescent chemical protoporphyrin IX. When illuminated under blue light, protoporphyrin in the tumor glows an intense red, while normal brain tissue appears blue, enabling “the surgeon to see the tumor more clearly during brain surgery and to remove it more accurately, sparing healthy brain tissue,” according to information from NX Development Corp, which markets Gleolan.
In a phase III trial of 349 patients with suspected malignant glioma amenable to complete resection, a contrast-enhanced tumor was resected in 64% of patients in the aminolevulinic acid (ALA) arm, versus 38 % of patients in the control-group, who had conventional resection under white light (P less than .001); 20.5 % of ALA patients versus 11 % patients in the control arm were alive at 6 months without progression.
FDA officials noted that there’s a risk of false negatives and positives with ALA, and that “an increase in the extent of resection might increase the risk of serious neurologic deficits in the short term.”
Side effects in preapproval studies included fever, hypotension, nausea, and vomiting in more than 1% percent of patients within a week of surgery. Adverse events included chills, abnormal liver function tests, and diarrhea in less than 1% of patients within 6 weeks of surgery.
Extended-release Aristada OK’d for 2-month dosing for schizophrenia
The Food and Drug Administration has expanded labeling of extended-release aripiprazole lauroxil (Aristada) to allow for administration once every 2 months at a dose of 1,064 mg, for schizophrenia.
Depending on patient needs, treatment now can be initiated at a dose of 441 mg, 662 mg, or 882 mg administered monthly; 882 mg administered every 6 weeks; or 1,064 mg administered every 2 months. For patients who have never taken aripiprazole, “establish tolerability with oral aripiprazole prior to initiating treatment with Aristada. Due to the half-life of oral aripiprazole, it may take up to 2 weeks to fully assess tolerability,” according to the updated labeling. The new 2-month option is expected to be available in mid-June.
Another extended-release IM aripiprazole option, (Abilify Maintena, Otsuka) is approved only for once-a-month injection.![]()
Approval of the bimonthly dose was based on pharmacokinetic data showing long-term therapeutic aripiprazole plasma levels. Labeling did not note whether the higher dose is associated with increased adverse events. Aristada originally was approved in 2015.
As with other atypical antipsychotics, Aristada labeling notes that the drug should not be used in elderly patients with dementia because of the increased risk of fatal strokes. The labeling also warns of the possibility of tardive dyskinesia, metabolic derangements, compulsive behaviors, agranulocytosis, and other risks.
Early literacy assessment tool shows promise for screening preschool children
SAN FRANCISCO – The 10-item Early Literary Assessment Tool (ELSAT) used during regular pediatrician appointments in the first 4 years of life has shown promise in screening preschool children for delayed literacy skills that could result in later reading problems, based on a pilot study conducted in the preschool setting.
ELSAT “can be completed by a clinician [in the primary care setting] in less than a minute and can be incorporated into the Reach Out and Read intervention. An important next step in our research is to study the feasibility of the ELSAT within primary care visits and obtain feedback from clinicians about the ease of administration and value to their practice,” said Sai N. Iyer, MD, a developmental-behavioral pediatric fellow at the University of California, San Diego.

The initial 40-item ELSAT addressed three key domains of early literacy skills: knowledge and awareness of printed words, knowledge of letters, and recognition of word sounds. The observational study had two phases. ELSAT was developed and refined in the pilot phase, with validation against three aforementioned reference measures in the validation phase. The process whittled the test down to 10 items, with the same three domains represented. Comparisons were between the individual measures and a composite of the three.

The 10-item ELSAT correlated with each of the reference measures and with the composite of the three measures of early literacy (Pearson’s correlation, 810; P less than .01; Cronbach’s alpha [a measure of internal consistency] of .852). A cut-off ELSAT score of less than or equal to 5 predicted a “below average” score in any of the three reference measures and identified delayed literacy with a sensitivity of 92% and an acceptable specificity of 64%, Dr. Iyer explained during her presentation at the Pediatric Academic Societies meeting.
Language skills acquired during the first few years of life in the home and preschool settings lay the path for the development of more sophisticated reading skills, including decoding and comprehension beginning in grade 1. “Research has shown that about 40% of children enter kindergarten behind their peers in important early literacy skills. This gap widens with time, and the cost of catching them up far exceeds the cost of screening and early intervention. Many studies have demonstrated that effective early interventions improve the long-term outcomes for children who are at risk for later reading failure. Children who are reading at a below grade level by 4th grade are unlikely to catch up. Low levels of literacy have an impact on later educational and employment opportunities and set up a cycle of social and economic disadvantage that can have transgenerational effects,” Dr. Iyer said.
While parent-completed questionnaires are a convenient way to perform developmental screening, they are limited by the health literacy of the parents and other factors. Furthermore, while some preschools perform assessments, not all children attend preschools. This prompted Dr. Iyer and colleagues to think about developing a more objective screening strategy, with which a clinician could do the brief assessment. “All preschool children do see their pediatrician/primary care provider for vaccinations that are required before kindergarten. This makes the primary care setting an ideal opportunity to screen these children,” said Dr. Iyer.
During the question-and-answer session, an attendee described the data concerning the dichotomy in the test results between the public and private preschools as “some of the most impressive and depressing I’ve seen in this area.”
In a later interview, Dr. Iyer commented that, while the results in the study were not entirely new or surprising, “it was remarkable that we were able to demonstrate such significant differences in a sample of children enrolled in a high-quality preschool. Without specific screening and intervention, these early literacy delays would go unrecognized and increase the risk of poor academic outcomes for these high-risk children. The children were all in some type of preschool environment. Throughout the country, there are many children from low-income families who are not able to access preschool education. Although we did not test these children in our study, it is likely that the gaps between these children and their more advantaged peers are even higher. The pediatrician’s office may be the only place for these children to receive early literacy screening and anticipatory guidance on reading readiness.”
The sponsor of the study was the University of California, San Diego. The study was funded by the 2015 Academic Pediatric Association Young Investigator Award and by Reach Out and Read. Dr. Iyer had no relevant financial disclosures to report.
SAN FRANCISCO – The 10-item Early Literary Assessment Tool (ELSAT) used during regular pediatrician appointments in the first 4 years of life has shown promise in screening preschool children for delayed literacy skills that could result in later reading problems, based on a pilot study conducted in the preschool setting.
ELSAT “can be completed by a clinician [in the primary care setting] in less than a minute and can be incorporated into the Reach Out and Read intervention. An important next step in our research is to study the feasibility of the ELSAT within primary care visits and obtain feedback from clinicians about the ease of administration and value to their practice,” said Sai N. Iyer, MD, a developmental-behavioral pediatric fellow at the University of California, San Diego.
The initial 40-item ELSAT addressed three key domains of early literacy skills: knowledge and awareness of printed words, knowledge of letters, and recognition of word sounds. The observational study had two phases. ELSAT was developed and refined in the pilot phase, with validation against three aforementioned reference measures in the validation phase. The process whittled the test down to 10 items, with the same three domains represented. Comparisons were between the individual measures and a composite of the three.
The 10-item ELSAT correlated with each of the reference measures and with the composite of the three measures of early literacy (Pearson’s correlation, 810; P less than .01; Cronbach’s alpha [a measure of internal consistency] of .852). A cut-off ELSAT score of less than or equal to 5 predicted a “below average” score in any of the three reference measures and identified delayed literacy with a sensitivity of 92% and an acceptable specificity of 64%, Dr. Iyer explained during her presentation at the Pediatric Academic Societies meeting.
Language skills acquired during the first few years of life in the home and preschool settings lay the path for the development of more sophisticated reading skills, including decoding and comprehension beginning in grade 1. “Research has shown that about 40% of children enter kindergarten behind their peers in important early literacy skills. This gap widens with time, and the cost of catching them up far exceeds the cost of screening and early intervention. Many studies have demonstrated that effective early interventions improve the long-term outcomes for children who are at risk for later reading failure. Children who are reading at a below grade level by 4th grade are unlikely to catch up. Low levels of literacy have an impact on later educational and employment opportunities and set up a cycle of social and economic disadvantage that can have transgenerational effects,” Dr. Iyer said.
While parent-completed questionnaires are a convenient way to perform developmental screening, they are limited by the health literacy of the parents and other factors. Furthermore, while some preschools perform assessments, not all children attend preschools. This prompted Dr. Iyer and colleagues to think about developing a more objective screening strategy, with which a clinician could do the brief assessment. “All preschool children do see their pediatrician/primary care provider for vaccinations that are required before kindergarten. This makes the primary care setting an ideal opportunity to screen these children,” said Dr. Iyer.
During the question-and-answer session, an attendee described the data concerning the dichotomy in the test results between the public and private preschools as “some of the most impressive and depressing I’ve seen in this area.”
In a later interview, Dr. Iyer commented that, while the results in the study were not entirely new or surprising, “it was remarkable that we were able to demonstrate such significant differences in a sample of children enrolled in a high-quality preschool. Without specific screening and intervention, these early literacy delays would go unrecognized and increase the risk of poor academic outcomes for these high-risk children. The children were all in some type of preschool environment. Throughout the country, there are many children from low-income families who are not able to access preschool education. Although we did not test these children in our study, it is likely that the gaps between these children and their more advantaged peers are even higher. The pediatrician’s office may be the only place for these children to receive early literacy screening and anticipatory guidance on reading readiness.”
The sponsor of the study was the University of California, San Diego. The study was funded by the 2015 Academic Pediatric Association Young Investigator Award and by Reach Out and Read. Dr. Iyer had no relevant financial disclosures to report.
AT PAS 2017
Key clinical point:
Major finding: The 10-item ELSAT correlated with each of the reference measures and with the composite of the three measures of early literacy (Pearson’s correlation, 810; P less than .01; Cronbach’s alpha [a measure of internal consistency] of .852).
Data source: An observational study of 54-month-old children in five public preschools (n = 61) and two private preschools (n = 35) in San Diego.
Disclosures: The sponsor of the study was the University of California, San Diego. The study was funded by the 2015 Academic Pediatric Association Young Investigator Award and by Reach Out and Read. Dr. Iyer had no relevant financial disclosures to report.