User login
Combo with daratumumab could be alternative to ASCT in MM

CHICAGO—Results of an open-label phase 1b study of daratumumab combined with carfilzomib, lenalidomide, and dexamethasone (KRd) in newly diagnosed multiple myeloma (MM) patients have shown the combination to be highly effective, with an overall response rate of 100%.
Ninety-one percent of patients achieved a very good partial response (VGPR) or better, and 43% achieved a complete response (CR) or better.
Investigators had hypothesized that rather than using autologous stem cell transplant (ASCT) to improve results of treatment with KRd, the combination could alternatively be improved by incorporating daratumumab into a KRd regimen.
Andrzej Jakubowiak, MD, of the University of Chicago Medical Center in Illinois, presented the findings of the MMY1001 study at the 2017 ASCO Annual Meeting (abstract 8000*).
“I think what was one of the more important developments in myeloma last year,” Dr Jakubowiak said, “was data from randomized studies showing that adding daratumumab to either lenalidomide and dexamethasone in the POLLUX study or bortezomib and dexamethasone, a proteasome inhibitor, in the CASTOR study, improves responses, depth of response, and . . . dramatically improved progression-free survival.”
“[W]e have now the rationale to potentially combine daratumumab with both an IMiD and proteasome inhibitor,” he explained, “which led to the development of this phase 1b study in which we combined daratumumab with KRd and evaluated tolerability and efficacy.”
Study design
Twenty-two transplant-eligible or -ineligible newly diagnosed MM patients were enrolled on the study.
Treatment duration was planned to be 13 cycles or less and patients had the option to move to transplant after 4 cycles.
They could have no clinically significant cardiac disease and echocardiogram was required prior to transplant.
The dosing schedule was the established dosing schema for daratumumab and KRd with 2 notable differences in the 28-day cycles.
First, the daratumumab dose was a split dose. So patients received 8 mg/kg on days 1-2 of cycle 1, 16 mg/kg a week on cycle 2, 16 mg/kg every 2 weeks on cycles 3 – 6, and every 4th week thereafter.
The second difference was carfilzomib dosing was a weekly regimen with escalation from 20 mg/m2 on day 1, cycle 1 to 70 mg/m2 on day 8 of cycle 1.
Lenalidomide (25 mg on days 1-21 of each cycle) and dexamethasone (40 mg/week) were the standard regimens for these drugs.
The primary endpoint was safety and tolerability. The secondary endpoint was overall response rate (ORR), duration of response, time to response, and infusion-related reactions (IRR).
The study also had an exploratory endpoint of progression-free survival (PFS).
Baseline characteristics
Patients were a median age of 59.5 years (range 34 – 74). About two thirds were younger than 65 and one third were between 65 and 75.
A little over half were male and most (86%) were white.
A little more than half (55%) had an ECOG score of 0, 41% were ECOG 1, and 5% were ECOG 2.
Patient disposition
As of the cutoff date of March 24, 8 of the 22 patients enrolled (36%) discontinued treatment: 1 due to an adverse event (AE), 1 due to progressive disease, and 6 patients (27%) proceeded to ASCT.
Dr Jakubowiak pointed out that response was censored at this point for patients who proceeded to transplant.
The median follow-up was 10.8 months (range, 4.0 – 12.5) and the median number of treatment cycles was 11.5 (range, 1.0 – 13.0).
“What is of interest to many of us,” Dr Jakubowiak said, “is that patients were escalated to the planned dose of 70 mg/m2 by cycle 2 except for 3 patients.”
Of the 3, 1 discontinued before day 1 of the second cycle due to toxicity, 1 had a dose reduction to 56 mg/m2 at day of the second cycle, and 1 escalated to 70 mg/m2 at day 8 of cycle 3.
Ultimately, all patients who remained on study were able to escalate to 70 mg/m2.
Safety
The hematologic treatment-emergent adverse events (TEAE) generally followed what has been observed in similar studies before, Dr Jakubowiak noted.
Hematologic TEAEs of all grades occurring in 30% or more of patients were lymphopenia (68%), thrombocytopenia (55%), anemia (46%), leukopenia (41%), and neutropenia (32%).
The most common non-hematologic TEAEs of all grades occurring in 30% of patients or more were diarrhea (73%), upper respiratory infection (59%) cough, constipation, and fatigue (50% each), dyspnea and insomnia (46%), nausea, rash, and back pain (41%), muscle spasm (36%), and vomiting, pain in extremity, hyperglycemia, and increased ALT (32%).
The most common grade 3/4 TEAEs were infrequent and many events had none of grade 3/4 severity.
The safety profile is consistent with what was previously reported for daratumumab or KRd, Dr Jakubowiak affirmed.
Serious TEAEs
Serious TEAEs occurred in 10 patients (46%), with many occurring in just 1 patient. Pulmonary embolism (PE) was the most frequent, occurring in 3 patients.
All patients were required to be on aspirin prophylaxis and 1 of the patients who had a PE discontinued therapy.
The number of patients with a serious TEAE reasonably related to an individual study drug were 3 (14%) for daratumumab, 5 (23%) for carfilzomib, 5 (23%) for lenalidomide, and 2 (9%) for dexamethasone.
The TEAEs of interest—tachycardia, congestive heart failure, and hypertension—occurred in a single patient each.
Overall, serious TEAEs were consistent with previous reports from KRd studies.
Echocardiogram assessment
Investigators conducted 30 systemic evaluations on the impact of this regimen on heart function. The investigators observed no change from baseline through the duration of treatment in patients’ left ventricular ejection fractions.
One patient developed congestive heart failure, possibly related to daratumumab or carfilzomib. This patient resumed treatment with a reduced carfilzomib dose, elected ASCT on study day 113, and ended treatment with a VGPR.
“In all,” Dr Jakubowiak said, “we feel that there is no apparent signal of adverse impact of the addition of daratumumab on cardiac function.”
Infusion times and reactions
Overall, IRRs occurred in 27% of the patients, “which appears lower than with previous daratumumab studies,” Dr Jakubowiak noted. And IRRs occurred more frequently during the first infusion than subsequent infusions.
The split-dose infusion time was very similar to that of second and subsequent cycles.
There were limited events related to infusions. All were grade 1 or 2 and most occurred in only a single patient.
Response rate
The median number of treatment cycles administered was 11.5 (range, 2.0 – 13.0). The best response was 100% PR or better, 91% achieved VGPR or better, 42% CR or better, and 29% a stringent CR.
The depth of response improved with duration of treatment. For example, the sCR rate increased from 5% after 4 cycles to 29% at the end of treatment.
PFS was an exploratory endpoint. One patient progressed at 10.8 months and the 12-month PFS rate was 94% with all patients alive.
Stem cell harvest and ASCT
“For many of us,” Dr Jakubowiak commented, “it’s also of interest how this regimen will impact stem cell harvest.”
Nineteen of 22 patients were deemed to be transplant eligible, and the median number of CD34+ cells collected from them was 10.4 x 10⁶ cells/kg.
Patients had a median of 5 treatment cycles prior to stem cell harvest, and 14 (74%) had a VGPR or better prior to harvest.
The investigators believe stem cell yield was consistent with previous KRd studies.
Dr Jakubowiak commented that the deepening of response over time “is a phenomenon we think is important. . . . In all, the data from this small phase 1b study provide support for further evaluation of this regimen in newly diagnosed myeloma."
The study was funded by Janssen Research and Development, LLC. ![]()
*Data presented during the meeting differ from the abstract.
Assessing the risks associated with MRI patients with a pacemaker or defibrillator
Clinical Question: What are the risks of nonthoracic MRI in patients with pacemakers or implantable cardioverter-defibrillators (ICD) who are not preapproved by the Food and Drug Administration for MRI scanning?
Background: Implantable cardiovascular devices could suffer heating in MRI magnetic fields leading to cardiac thermal injury and changes in pacing properties. The FDA approves “MRI-conditional devices” deemed safe for MRI, but up to six million patients worldwide (and two million in the United States) have non–MRI conditional devices.
Setting: U.S. Centers participating in the MagnaSafe registry.
Synopsis: Adults with non–MRI conditional pacemakers (1000 cases) or ICDs (500 cases) implanted in the thorax after 2001 were scanned with nonthoracic MRI at 1.5 Tesla. Patients with abandoned or inactive leads, other implantable devices, and low batteries and pacing-dependent patients with ICDs were excluded.
Devices were interrogated before each MRI and set to either no pacing or asynchronous pacing with all tachycardia and bradycardia therapies deactivated. Primary endpoints included immediate death, generator or lead failure, loss of capture in paced patients, new arrhythmia, and generator reset.
No patients suffered death or device or lead failure. Six patients developed self-terminating atrial arrhythmias, while an additional six had partial pacemaker electrical reset. Several devices had detectable changes in battery voltage, lead impedance, pacing threshold, and P- or R-wave amplitude without evident clinical significance. Multiple MRIs caused no increase in adverse outcomes. This study suggests that patients with non–MRI conditional devices may be at low risk from nonthoracic imaging if appropriately screened with temporary pacemaker function modification before MRI.
Bottom Line: Appropriately screened and prepared patients with non–MRI conditional thoracic pacemakers or ICDs may be at low risk for complications from nonthoracic MRI at 1.5 Tesla.
Reference: Russo RJ, Costa HS, Silva PD, et al. Assessing the risks associated with MRI in patients with a pacemaker or defibrillator. N Engl J Med. 2017;376:755-64.
Dr. Frederick is assistant clinical professor in the division of hospital Medicine, department of medicine, University of California, San Diego.
Is Diabetes Distress on Your Radar Screen?

Managing diabetes is a complex undertaking, with an extensive regimen of self-care—including regular exercise, meal planning, blood glucose monitoring, medication scheduling, and multiple visits—that is critically linked to glycemic control and the prevention of complications. Incorporating all of these elements into daily life can be daunting.1-3
In fact, nearly half of US adults with diabetes fail to meet the recommended targets.4 This leads to frustration, which often manifests in psychosocial problems that further hamper efforts to manage the disease.5-10 The most notable is a psychosocial disorder known as diabetes distress, which affects close to 45% of persons with diabetes.11,12
It is important to note that diabetes distress is not a psychiatric disorder; rather, it is a broad affective reaction to the stress of living with this chronic and complex disease.13-15 By negatively affecting adherence to a self-care regimen, diabetes distress contributes to worsening glycemic control and increasing morbidity.16-18
Recognizing that about 80% of those with diabetes are treated in primary care settings, this review is intended to call your attention to diabetes distress, alert you to brief screening tools that can easily be incorporated into clinic visits, and offer guidance in matching proposed interventions to the aspects of diabetes self-management that cause patients the greatest distress.19
DIABETES DISTRESS: WHAT IT IS, WHAT IT'S NOT
For patients with type 2 diabetes, diabetes distress centers around four main issues
- Frustration with the demands of self-care
- Apprehension about the future and the possibility of developing serious complications
- Concern about both the quality and the cost of required medical care
- Perceived lack of support from family and/or friends.11,12,20
As mentioned earlier, diabetes distress is not a psychiatric condition and should not be confused with major depressive disorder (MDD). Here’s help in telling the difference.
For starters, a diagnosis of depression is symptom-based.13 MDD requires the presence of at least five of the nine symptoms defined by the Diagnostic and Statistical Manual of Mental Disorders, Fifth ed. (DSM-5)—eg, persistent feelings of worthlessness or guilt, sleep disturbances, lack of interest in normal activities—for at least two weeks.21 What’s more, the diagnostic criteria for MDD do not specify a cause or disease process. Nor do they distinguish between a pathological response and an expected reaction to a stressful life event.22 Further, depression measures reflect symptoms (eg, hyperglycemia), as well as stressful experiences resulting from diabetes self-care, which may contribute to the high rate of false positives or incorrect diagnoses of MDD and missed diagnoses of diabetes distress.23
Unlike MDD, diabetes distress has a specific cause—diabetes—and can best be understood as an emotional response to a demanding health condition.13 And, because the source of the problem is identified, diabetes distress can be treated with specific interventions targeting the areas causing the highest levels of stress.
When a psychiatric condition and diabetes distress overlap
MDD, anxiety disorders, and diabetes distress are all common in patients with diabetes, and the co-occurrence of a psychiatric disorder and diabetes distress is high.24,25Thus, it is important not only to identify cases of diabetes distress but also to consider comorbid depression and/or anxiety in patients with diabetes distress.
More often, though, it is the other way around, according to the Distress and Depression in Diabetes (3D) study. The researchers recently found that 84% of patients with moderate or high diabetes distress did not fulfill the criteria for MDD, but that 67% of diabetes patients with MDD also had moderate or high diabetes distress.13,15,17,25
The data highlight the importance of screening patients with a dual diagnosis of diabetes and MDD for diabetes distress. Keep in mind that persons diagnosed with diabetes distress and a comorbid psychiatric condition may require more complex and intensive treatment than those with either diabetes distress or MDD alone.25
SCREENING FOR DIABETES DISTRESS
Diabetes distress can be easily assessed using one of several patient-reported outcome measures. Six validated measures, ranging in length from one to 28 questions, are designed for use in primary care (see Table).26-30 Some of the measures are easily accessible online; others require a subscription to MEDLINE.
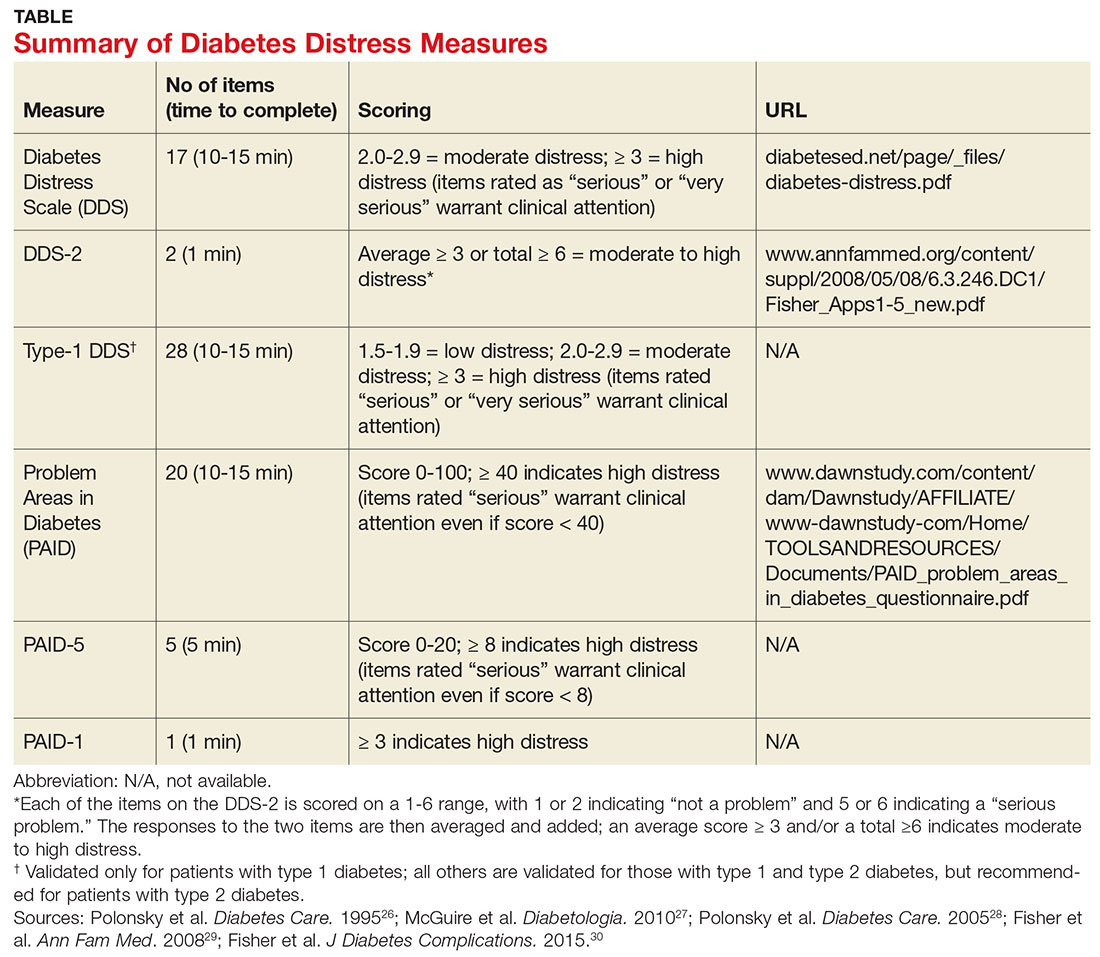
Problem Areas in Diabetes (PAID). There are three versions of PAID—a 20-item screen assessing a broad range of feelings related to living with diabetes and its treatment, a five-item version (PAID-5) with high rates of sensitivity (95%) and specificity (89%), and a single-item test (PAID-1) that is highly correlated with the longer version.26,27
Diabetes Distress Scale (DDS). This tool is available in a 17-item measure assessing diabetes distress as it relates to the emotional burden, physician-related distress, regimen-related distress, and interpersonal distress.28 DDS is also available in a short form (DDS-2) with two items and a 28-item scale specifically for patients with type 1 diabetes.29,30 T1-DDS, the only diabetes distress measure focused on this particular patient population, assesses the seven sources of distress found to be common among adults with type 1 diabetes: powerlessness, negative social perceptions, physician distress, friend/family distress, hypoglycemia distress, management distress, and eating distress.
Studies have shown that not only do those with type 1 diabetes experience different stressors compared with their type 2 counterparts, but also that they tend to experience distress differently. For patients with type 1 diabetes, for example, powerlessness ranked as the highest source of distress, followed by eating distress and hypoglycemia distress. These sources of distress differ from the regimen distress, emotional burden, interpersonal distress, and physician distress identified by those with type 2 diabetes.30
HOW TO RESPOND TO DIABETES DISTRESS
Diabetes distress is easier to identify than to successfully treat. Few validated treatments for diabetes distress exist and, to our knowledge, only two studies have assessed interventions aimed at reduction of such distress.31,32
The REDEEM trial recruited adults with type 2 diabetes and diabetes distress to participate in a 12-month randomized controlled trial (RCT).31 The trial had three arms, comparing the effectiveness of a computer-assisted self-management (CASM) program alone, a CASM program plus in-person diabetes distress–specific problem-solving therapy, and a computer-assisted minimally supportive intervention. The main outcomes included diabetes distress (using the DDS scale and subscales), self-management behaviors, and A1C.
Participants in all three arms showed significant reductions in total diabetes distress and improvements in self-management behaviors, with no significant differences among the groups. No differences in A1C were found. However, those in the CASM program plus distress-specific therapy arm showed a larger reduction in regimen distress compared with the other two groups.31
The DIAMOS trial recruited adults who had type 1 or type 2 diabetes, diabetes distress, and subclinical depressive symptoms for a two-arm RCT.32 One group underwent cognitive behavioral interventions, while the controls had standard group-based diabetes education. The main outcomes included diabetes distress (measured via the PAID scale), depressive symptoms, well-being, diabetes self-care, diabetes acceptance, satisfaction with diabetes treatment, A1C, and subclinical inflammation.
The intervention group showed greater improvement in diabetes distress and depressive symptoms compared with the control group, but no differences in well-being, self-care, treatment satisfaction, A1C, or subclinical inflammation were observed.32
Both studies support the use of problem-solving therapy and cognitive behavioral interventions for patients with diabetes distress. Future research should evaluate the effectiveness of these interventions in the primary care setting.
What else to offer when challenges mount?
Diabetes is a progressive disease, and most patients experience multiple challenges over time. These typically include complications and comorbidities, physical limitations, polypharmacy, hypoglycemia, and cognitive impairment, as well as changes in everything from medication and lifestyle to insurance coverage and social support.33,34 All increase the risk for diabetes distress, as well as related psychiatric conditions.
Aging and diabetes are independent risk factors for cognitive impairment, for example, and the presence of both increases this risk.35 What’s more, diabetes alone is associated with poorer executive function, the higher-level cognitive processes that allow individuals to engage in independent, purposeful, and flexible goal-related behaviors.36-38 Both poor cognitive function and impaired executive function interfere with the ability to perform self-care behaviors such as adjusting insulin doses, drawing insulin into a syringe, or dialing an insulin dose with an insulin pen.39 This in turn can lead to frustration and increase the likelihood of moderate to high diabetes distress.
Assessing diabetes distress in patients with cognitive impairment, poor executive functioning, or other psychological limitations is particularly difficult, however, as no diabetes distress measures take such deficits into account. Thus, primary care providers without expertise in neuropsychology should consider referring patients with such problems to specialists for assessment.
The progressive nature of diabetes also highlights the need for primary care providers to periodically screen for diabetes distress and engage in ongoing discussions about what type of care is best for individual patients, and why. When developing or updating treatment plans and making recommendations, it is crucial to consider the impact the treatment would likely have on the patient’s physical and mental health and to explicitly inquire about and acknowledge his or her values and preferences for care.40-44
It is also important to remain aware of socioeconomic changes—in employment, insurance coverage, and living situations, for example—which are not addressed in the screening tools.
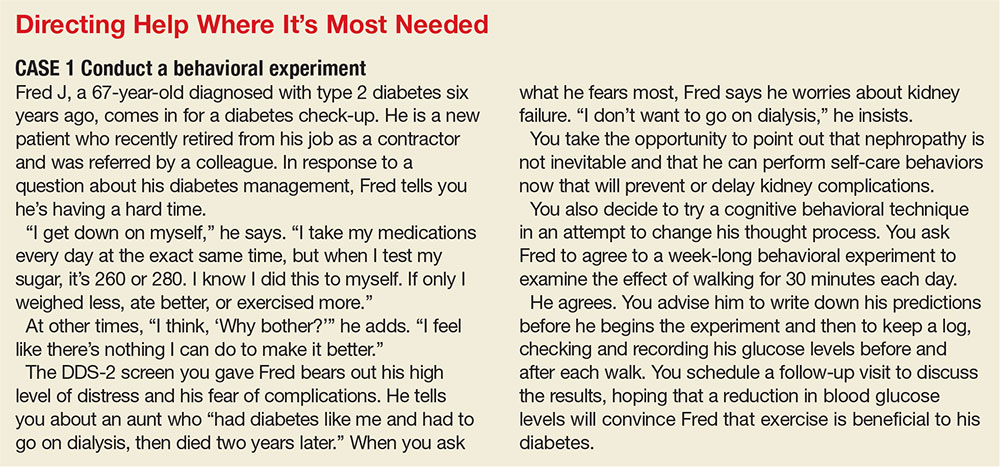
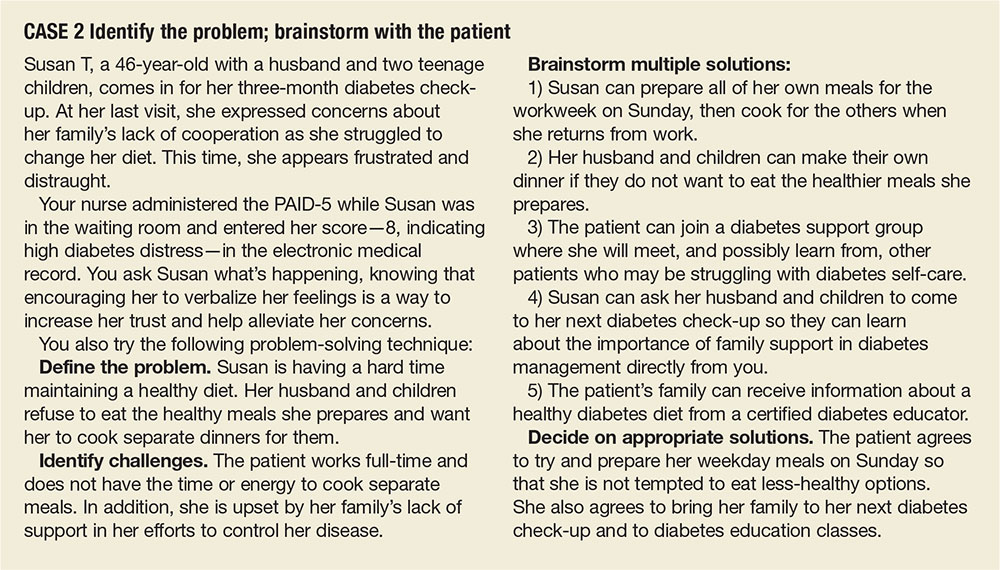
Moderate to high diabetes distress scores, as well as individual items patients identify as “very serious” problems, represent clinical red flags that should be the focus of careful discussion during a medical visit. Patients with moderate to high distress should be referred to a therapist trained in cognitive behavioral therapy or problem-solving therapy. Clinicians who lack access to such resources can incorporate cognitive behavioral and problem-solving techniques into patient discussions. (See “Directing Help Where It’s Most Needed.”) All patients should be referred to a certified diabetes educator—a key component of diabetes care.45,46
1. Gafarian CT, Heiby EM, Blair P, et al. The diabetes time management questionnaire. Diabetes Educ. 1999;25:585-592.
2. Wdowik MJ, Kendall PA, Harris MA. College students with diabetes: using focus groups and interviews to determine psychosocial issues and barriers to control. Diabetes Educ. 1997;23:558-562.
3. Rubin RR. Psychological issues and treatment for people with diabetes. J Clin Psychol. 2001;57:457-478.
4. Ali MK, Bullard KM, Gregg EW. Achievement of goals in US diabetes care, 1999-2010. N Engl J Med. 2013;369:287-288.
5. Lloyd CE, Smith J, Weinger K. Stress and diabetes: Review of the links. Diabetes Spectr. 2005;18:121-127.
6. Weinger K. Psychosocial issues and self-care. Am J Nurs. 2007;107(6 suppl):S34-S38.
7. Weinger K, Jacobson AM. Psychosocial and quality of life correlates of glycemic control during intensive treatment of type 1 diabetes. Patient Educ Couns. 2001;42:123-131.
8. Albright TL, Parchman M, Burge SK. Predictors of self-care behavior in adults with type 2 diabetes: an RRNeST study. Fam Med. 2001;33:354-360.
9. Gonzalez JS, Safren SA, Cagliero E, et al. Depression, self-care, and medication adherence in type 2 diabetes: relationships across the full range of symptom severity. Diabetes Care. 2007;30:2222-2227.
10. Gonzalez JS, Safren SA, Delahanty LM, et al. Symptoms of depression prospectively predict poorer self-care in patients with type 2 diabetes. Diabet Med. 2008;25:1102-1107.
11. Nicolucci A, Kovacs Burns K, Holt RI, et al. Diabetes Attitudes, Wishes and Needs second study (DAWN2): cross-national benchmarking of diabetes-related psychosocial outcomes for people with diabetes. Diabet Med. 2013;30:767-777.
12. Fisher L, Hessler DM, Polonsky W, et al. When is diabetes distress clinically meaningful?: establishing cut points for the Diabetes Distress Scale. Diabetes Care. 2012;35:259-264.
13. Fisher L, Gonzalez JS, Polonsky WH. The confusing tale of depression and distress in patients with diabetes: a call for greater clarity and precision. Diabet Med. 2014;31:764-772.
14. Fisher L, Mullan JT, Skaff MM, et al. Predicting diabetes distress in patients with type 2 diabetes: a longitudinal study. Diabet Med. 2009;26:622-627.
15. Fisher L, Skaff MM, Mullan JT, et al. Clinical depression versus distress among patients with type 2 diabetes: not just a question of semantics. Diabetes Care. 2007;30:542-548.
16. Gonzalez JS, Delahanty LM, Safren SA, et al. Differentiating symptoms of depression from diabetes-specific distress: relationships with self-care in type 2 diabetes. Diabetologia. 2008;51:1822-1825.
17. Fisher L, Mullan JT, Arean P, et al. Diabetes distress but not clinical depression or depressive symptoms is associated with glycemic control in both cross-sectional and longitudinal analyses. Diabetes Care. 2010;33:23-28.
18. Fisher EB, Thorpe CT, Devellis BM, et al. Healthy coping, negative emotions, and diabetes management: a systematic review and appraisal. Diabetes Educ. 2007;33:1080-1106.
19. Peterson KA, Radosevich DM, O’Connor PJ, et al. Improving diabetes care in practice: findings from the TRANSLATE trial. Diabetes Care. 2008;31:2238-2243.
20. Fisher L, Glasgow RE, Strycker LA. The relationship between diabetes distress and clinical depression with glycemic control among patients with type 2 diabetes. Diabetes Care. 2010;33:1034-1036.
21. Cole J, McGuffin P, Farmer AE. The classification of depression: are we still confused? Br J Psychiatry. 2008;192:83-85.
22. Wakefield JC. The concept of mental disorder. On the boundary between biological facts and social values. Am Psychol. 1992;47:373-388.
23. Fisher L, Gonzalez JS, Polonsky WH. The confusing tale of depression and distress in patients with diabetes: a call for greater clarity and precision. Diabet Med. 2014;31:764-772.
24. Ciechanowski PS, Katon WJ, Russo JE. Depression and diabetes: impact of depressive symptoms on adherence, function, and costs. Arch Intern Med. 2000;160:3278-3285.
25. Fisher L, Skaff MM, Mullan JT, et al. A longitudinal study of affective and anxiety disorders, depressive affect and diabetes distress in adults with type 2 diabetes. Diabet Med. 2008;25:1096-1101.
26. Polonsky WH, Anderson BJ, Lohrer PA, et al. Assessment of diabetes-related distress. Diabetes Care. 1995;18:754-760.
27. McGuire BE, Morrison TG, Hermanns N, et al. Short-form measures of diabetes-related emotional distress: the Problem Areas in Diabetes Scale (PAID)-5 and PAID-1. Diabetologia. 2010;53:66-69.
28. Polonsky WH, Fisher L, Earles J, et al. Assessing psychosocial distress in diabetes: development of the Diabetes Distress Scale. Diabetes Care. 2005;28:626-631.
29. Fisher L, Glasgow RE, Mullan JT, et al. Development of a brief diabetes distress screening instrument. Ann Fam Med. 2008;6:246-252.
30. Fisher L, Polonsky WH, Hessler DM, et al. Understanding the sources of diabetes distress in adults with type 1 diabetes. J Diabetes Complications. 2015;29:572-577.
31. Fisher L, Hessler D, Glasgow RE, et al. REDEEM: a pragmatic trial to reduce diabetes distress. Diabetes Care. 2013;36:2551-2558.
32. Hermanns N, Schmitt A, Gahr A, et al. The effect of a Diabetes-Specific Cognitive Behavioral Treatment Program (DIAMOS) for patients with diabetes and subclinical depression: results of a randomized controlled trial. Diabetes Care. 2015;38:551-560.
33. Weinger K, Beverly EA, Smaldone A. Diabetes self-care and the older adult. Western J Nurs Res. 2014;36:1272-1298.
34. Beverly EA, Ritholz MD, Shepherd C, et al. The psychosocial challenges and care of older adults with diabetes: “can’t do what I used to do; can’t be who I once was.” Curr Diab Rep. 2016;16:48.
35. Lu FP, Lin KP, Kuo HK. Diabetes and the risk of multi-system aging phenotypes: a systematic review and meta-analysis. PLoS One. 2009;4:e4144.
36. Thabit H, Kyaw TT, McDermott J, et al. Executive function and diabetes mellitus—a stone left unturned? Curr Diabetes Rev. 2012;8:109-115.
37. McNally K, Rohan J, Pendley JS, et al. Executive functioning, treatment adherence, and glycemic control in children with type 1 diabetes. Diabetes Care. 2010;33:1159-1162.
38. Rucker JL, McDowd JM, Kluding PM. Executive function and type 2 diabetes: putting the pieces together. Phys Ther. 2012;92:454-462.
39. Kirkman MS, Briscoe VJ, Clark N, et al. Diabetes in older adults. Diabetes Care. 2012;35:2650-2664.
40. Durso SC. Using clinical guidelines designed for older adults with diabetes mellitus and complex health status. JAMA. 2006;295:1935-1940.
41. Oftedal B, Karlsen B, Bru E. Life values and self-regulation behaviours among adults with type 2 diabetes. J Clin Nurs. 2010;19:2548-2556.
42. Morrow AS, Haidet P, Skinner J, et al. Integrating diabetes self-management with the health goals of older adults: a qualitative exploration. Patient Educ Couns. 2008;72:418-423.
43. Huang ES, Gorawara-Bhat R, Chin MH. Self-reported goals of older patients with type 2 diabetes mellitus. J Am Geriatr Soc. 2005;53:306-311.
44. Beverly EA, Wray LA, LaCoe CL, et al. Listening to older adults’ values and preferences for type 2 diabetes care: a qualitative study. Diabetes Spectr. 2014;27:44-49.
45. American Association of Diabetes Educators. Why refer for diabetes education? American Association of Diabetes Educators. www.diabeteseducator.org/practice/provider-resources/why-refer-for-diabetes-education. Accessed May 16, 2017.
46. Ismail K, Winkley K, Rabe-Hesketh S. Systematic review and meta-analysis of randomised controlled trials of psychological interventions to improve glycaemic control in patients with type 2 diabetes. Lancet. 2004;363:1589-1597.
Managing diabetes is a complex undertaking, with an extensive regimen of self-care—including regular exercise, meal planning, blood glucose monitoring, medication scheduling, and multiple visits—that is critically linked to glycemic control and the prevention of complications. Incorporating all of these elements into daily life can be daunting.1-3
In fact, nearly half of US adults with diabetes fail to meet the recommended targets.4 This leads to frustration, which often manifests in psychosocial problems that further hamper efforts to manage the disease.5-10 The most notable is a psychosocial disorder known as diabetes distress, which affects close to 45% of persons with diabetes.11,12
It is important to note that diabetes distress is not a psychiatric disorder; rather, it is a broad affective reaction to the stress of living with this chronic and complex disease.13-15 By negatively affecting adherence to a self-care regimen, diabetes distress contributes to worsening glycemic control and increasing morbidity.16-18
Recognizing that about 80% of those with diabetes are treated in primary care settings, this review is intended to call your attention to diabetes distress, alert you to brief screening tools that can easily be incorporated into clinic visits, and offer guidance in matching proposed interventions to the aspects of diabetes self-management that cause patients the greatest distress.19
DIABETES DISTRESS: WHAT IT IS, WHAT IT'S NOT
For patients with type 2 diabetes, diabetes distress centers around four main issues
- Frustration with the demands of self-care
- Apprehension about the future and the possibility of developing serious complications
- Concern about both the quality and the cost of required medical care
- Perceived lack of support from family and/or friends.11,12,20
As mentioned earlier, diabetes distress is not a psychiatric condition and should not be confused with major depressive disorder (MDD). Here’s help in telling the difference.
For starters, a diagnosis of depression is symptom-based.13 MDD requires the presence of at least five of the nine symptoms defined by the Diagnostic and Statistical Manual of Mental Disorders, Fifth ed. (DSM-5)—eg, persistent feelings of worthlessness or guilt, sleep disturbances, lack of interest in normal activities—for at least two weeks.21 What’s more, the diagnostic criteria for MDD do not specify a cause or disease process. Nor do they distinguish between a pathological response and an expected reaction to a stressful life event.22 Further, depression measures reflect symptoms (eg, hyperglycemia), as well as stressful experiences resulting from diabetes self-care, which may contribute to the high rate of false positives or incorrect diagnoses of MDD and missed diagnoses of diabetes distress.23
Unlike MDD, diabetes distress has a specific cause—diabetes—and can best be understood as an emotional response to a demanding health condition.13 And, because the source of the problem is identified, diabetes distress can be treated with specific interventions targeting the areas causing the highest levels of stress.
When a psychiatric condition and diabetes distress overlap
MDD, anxiety disorders, and diabetes distress are all common in patients with diabetes, and the co-occurrence of a psychiatric disorder and diabetes distress is high.24,25Thus, it is important not only to identify cases of diabetes distress but also to consider comorbid depression and/or anxiety in patients with diabetes distress.
More often, though, it is the other way around, according to the Distress and Depression in Diabetes (3D) study. The researchers recently found that 84% of patients with moderate or high diabetes distress did not fulfill the criteria for MDD, but that 67% of diabetes patients with MDD also had moderate or high diabetes distress.13,15,17,25
The data highlight the importance of screening patients with a dual diagnosis of diabetes and MDD for diabetes distress. Keep in mind that persons diagnosed with diabetes distress and a comorbid psychiatric condition may require more complex and intensive treatment than those with either diabetes distress or MDD alone.25
SCREENING FOR DIABETES DISTRESS
Diabetes distress can be easily assessed using one of several patient-reported outcome measures. Six validated measures, ranging in length from one to 28 questions, are designed for use in primary care (see Table).26-30 Some of the measures are easily accessible online; others require a subscription to MEDLINE.
Problem Areas in Diabetes (PAID). There are three versions of PAID—a 20-item screen assessing a broad range of feelings related to living with diabetes and its treatment, a five-item version (PAID-5) with high rates of sensitivity (95%) and specificity (89%), and a single-item test (PAID-1) that is highly correlated with the longer version.26,27
Diabetes Distress Scale (DDS). This tool is available in a 17-item measure assessing diabetes distress as it relates to the emotional burden, physician-related distress, regimen-related distress, and interpersonal distress.28 DDS is also available in a short form (DDS-2) with two items and a 28-item scale specifically for patients with type 1 diabetes.29,30 T1-DDS, the only diabetes distress measure focused on this particular patient population, assesses the seven sources of distress found to be common among adults with type 1 diabetes: powerlessness, negative social perceptions, physician distress, friend/family distress, hypoglycemia distress, management distress, and eating distress.
Studies have shown that not only do those with type 1 diabetes experience different stressors compared with their type 2 counterparts, but also that they tend to experience distress differently. For patients with type 1 diabetes, for example, powerlessness ranked as the highest source of distress, followed by eating distress and hypoglycemia distress. These sources of distress differ from the regimen distress, emotional burden, interpersonal distress, and physician distress identified by those with type 2 diabetes.30
HOW TO RESPOND TO DIABETES DISTRESS
Diabetes distress is easier to identify than to successfully treat. Few validated treatments for diabetes distress exist and, to our knowledge, only two studies have assessed interventions aimed at reduction of such distress.31,32
The REDEEM trial recruited adults with type 2 diabetes and diabetes distress to participate in a 12-month randomized controlled trial (RCT).31 The trial had three arms, comparing the effectiveness of a computer-assisted self-management (CASM) program alone, a CASM program plus in-person diabetes distress–specific problem-solving therapy, and a computer-assisted minimally supportive intervention. The main outcomes included diabetes distress (using the DDS scale and subscales), self-management behaviors, and A1C.
Participants in all three arms showed significant reductions in total diabetes distress and improvements in self-management behaviors, with no significant differences among the groups. No differences in A1C were found. However, those in the CASM program plus distress-specific therapy arm showed a larger reduction in regimen distress compared with the other two groups.31
The DIAMOS trial recruited adults who had type 1 or type 2 diabetes, diabetes distress, and subclinical depressive symptoms for a two-arm RCT.32 One group underwent cognitive behavioral interventions, while the controls had standard group-based diabetes education. The main outcomes included diabetes distress (measured via the PAID scale), depressive symptoms, well-being, diabetes self-care, diabetes acceptance, satisfaction with diabetes treatment, A1C, and subclinical inflammation.
The intervention group showed greater improvement in diabetes distress and depressive symptoms compared with the control group, but no differences in well-being, self-care, treatment satisfaction, A1C, or subclinical inflammation were observed.32
Both studies support the use of problem-solving therapy and cognitive behavioral interventions for patients with diabetes distress. Future research should evaluate the effectiveness of these interventions in the primary care setting.
What else to offer when challenges mount?
Diabetes is a progressive disease, and most patients experience multiple challenges over time. These typically include complications and comorbidities, physical limitations, polypharmacy, hypoglycemia, and cognitive impairment, as well as changes in everything from medication and lifestyle to insurance coverage and social support.33,34 All increase the risk for diabetes distress, as well as related psychiatric conditions.
Aging and diabetes are independent risk factors for cognitive impairment, for example, and the presence of both increases this risk.35 What’s more, diabetes alone is associated with poorer executive function, the higher-level cognitive processes that allow individuals to engage in independent, purposeful, and flexible goal-related behaviors.36-38 Both poor cognitive function and impaired executive function interfere with the ability to perform self-care behaviors such as adjusting insulin doses, drawing insulin into a syringe, or dialing an insulin dose with an insulin pen.39 This in turn can lead to frustration and increase the likelihood of moderate to high diabetes distress.
Assessing diabetes distress in patients with cognitive impairment, poor executive functioning, or other psychological limitations is particularly difficult, however, as no diabetes distress measures take such deficits into account. Thus, primary care providers without expertise in neuropsychology should consider referring patients with such problems to specialists for assessment.
The progressive nature of diabetes also highlights the need for primary care providers to periodically screen for diabetes distress and engage in ongoing discussions about what type of care is best for individual patients, and why. When developing or updating treatment plans and making recommendations, it is crucial to consider the impact the treatment would likely have on the patient’s physical and mental health and to explicitly inquire about and acknowledge his or her values and preferences for care.40-44
It is also important to remain aware of socioeconomic changes—in employment, insurance coverage, and living situations, for example—which are not addressed in the screening tools.
Moderate to high diabetes distress scores, as well as individual items patients identify as “very serious” problems, represent clinical red flags that should be the focus of careful discussion during a medical visit. Patients with moderate to high distress should be referred to a therapist trained in cognitive behavioral therapy or problem-solving therapy. Clinicians who lack access to such resources can incorporate cognitive behavioral and problem-solving techniques into patient discussions. (See “Directing Help Where It’s Most Needed.”) All patients should be referred to a certified diabetes educator—a key component of diabetes care.45,46
1. Gafarian CT, Heiby EM, Blair P, et al. The diabetes time management questionnaire. Diabetes Educ. 1999;25:585-592.
2. Wdowik MJ, Kendall PA, Harris MA. College students with diabetes: using focus groups and interviews to determine psychosocial issues and barriers to control. Diabetes Educ. 1997;23:558-562.
3. Rubin RR. Psychological issues and treatment for people with diabetes. J Clin Psychol. 2001;57:457-478.
4. Ali MK, Bullard KM, Gregg EW. Achievement of goals in US diabetes care, 1999-2010. N Engl J Med. 2013;369:287-288.
5. Lloyd CE, Smith J, Weinger K. Stress and diabetes: Review of the links. Diabetes Spectr. 2005;18:121-127.
6. Weinger K. Psychosocial issues and self-care. Am J Nurs. 2007;107(6 suppl):S34-S38.
7. Weinger K, Jacobson AM. Psychosocial and quality of life correlates of glycemic control during intensive treatment of type 1 diabetes. Patient Educ Couns. 2001;42:123-131.
8. Albright TL, Parchman M, Burge SK. Predictors of self-care behavior in adults with type 2 diabetes: an RRNeST study. Fam Med. 2001;33:354-360.
9. Gonzalez JS, Safren SA, Cagliero E, et al. Depression, self-care, and medication adherence in type 2 diabetes: relationships across the full range of symptom severity. Diabetes Care. 2007;30:2222-2227.
10. Gonzalez JS, Safren SA, Delahanty LM, et al. Symptoms of depression prospectively predict poorer self-care in patients with type 2 diabetes. Diabet Med. 2008;25:1102-1107.
11. Nicolucci A, Kovacs Burns K, Holt RI, et al. Diabetes Attitudes, Wishes and Needs second study (DAWN2): cross-national benchmarking of diabetes-related psychosocial outcomes for people with diabetes. Diabet Med. 2013;30:767-777.
12. Fisher L, Hessler DM, Polonsky W, et al. When is diabetes distress clinically meaningful?: establishing cut points for the Diabetes Distress Scale. Diabetes Care. 2012;35:259-264.
13. Fisher L, Gonzalez JS, Polonsky WH. The confusing tale of depression and distress in patients with diabetes: a call for greater clarity and precision. Diabet Med. 2014;31:764-772.
14. Fisher L, Mullan JT, Skaff MM, et al. Predicting diabetes distress in patients with type 2 diabetes: a longitudinal study. Diabet Med. 2009;26:622-627.
15. Fisher L, Skaff MM, Mullan JT, et al. Clinical depression versus distress among patients with type 2 diabetes: not just a question of semantics. Diabetes Care. 2007;30:542-548.
16. Gonzalez JS, Delahanty LM, Safren SA, et al. Differentiating symptoms of depression from diabetes-specific distress: relationships with self-care in type 2 diabetes. Diabetologia. 2008;51:1822-1825.
17. Fisher L, Mullan JT, Arean P, et al. Diabetes distress but not clinical depression or depressive symptoms is associated with glycemic control in both cross-sectional and longitudinal analyses. Diabetes Care. 2010;33:23-28.
18. Fisher EB, Thorpe CT, Devellis BM, et al. Healthy coping, negative emotions, and diabetes management: a systematic review and appraisal. Diabetes Educ. 2007;33:1080-1106.
19. Peterson KA, Radosevich DM, O’Connor PJ, et al. Improving diabetes care in practice: findings from the TRANSLATE trial. Diabetes Care. 2008;31:2238-2243.
20. Fisher L, Glasgow RE, Strycker LA. The relationship between diabetes distress and clinical depression with glycemic control among patients with type 2 diabetes. Diabetes Care. 2010;33:1034-1036.
21. Cole J, McGuffin P, Farmer AE. The classification of depression: are we still confused? Br J Psychiatry. 2008;192:83-85.
22. Wakefield JC. The concept of mental disorder. On the boundary between biological facts and social values. Am Psychol. 1992;47:373-388.
23. Fisher L, Gonzalez JS, Polonsky WH. The confusing tale of depression and distress in patients with diabetes: a call for greater clarity and precision. Diabet Med. 2014;31:764-772.
24. Ciechanowski PS, Katon WJ, Russo JE. Depression and diabetes: impact of depressive symptoms on adherence, function, and costs. Arch Intern Med. 2000;160:3278-3285.
25. Fisher L, Skaff MM, Mullan JT, et al. A longitudinal study of affective and anxiety disorders, depressive affect and diabetes distress in adults with type 2 diabetes. Diabet Med. 2008;25:1096-1101.
26. Polonsky WH, Anderson BJ, Lohrer PA, et al. Assessment of diabetes-related distress. Diabetes Care. 1995;18:754-760.
27. McGuire BE, Morrison TG, Hermanns N, et al. Short-form measures of diabetes-related emotional distress: the Problem Areas in Diabetes Scale (PAID)-5 and PAID-1. Diabetologia. 2010;53:66-69.
28. Polonsky WH, Fisher L, Earles J, et al. Assessing psychosocial distress in diabetes: development of the Diabetes Distress Scale. Diabetes Care. 2005;28:626-631.
29. Fisher L, Glasgow RE, Mullan JT, et al. Development of a brief diabetes distress screening instrument. Ann Fam Med. 2008;6:246-252.
30. Fisher L, Polonsky WH, Hessler DM, et al. Understanding the sources of diabetes distress in adults with type 1 diabetes. J Diabetes Complications. 2015;29:572-577.
31. Fisher L, Hessler D, Glasgow RE, et al. REDEEM: a pragmatic trial to reduce diabetes distress. Diabetes Care. 2013;36:2551-2558.
32. Hermanns N, Schmitt A, Gahr A, et al. The effect of a Diabetes-Specific Cognitive Behavioral Treatment Program (DIAMOS) for patients with diabetes and subclinical depression: results of a randomized controlled trial. Diabetes Care. 2015;38:551-560.
33. Weinger K, Beverly EA, Smaldone A. Diabetes self-care and the older adult. Western J Nurs Res. 2014;36:1272-1298.
34. Beverly EA, Ritholz MD, Shepherd C, et al. The psychosocial challenges and care of older adults with diabetes: “can’t do what I used to do; can’t be who I once was.” Curr Diab Rep. 2016;16:48.
35. Lu FP, Lin KP, Kuo HK. Diabetes and the risk of multi-system aging phenotypes: a systematic review and meta-analysis. PLoS One. 2009;4:e4144.
36. Thabit H, Kyaw TT, McDermott J, et al. Executive function and diabetes mellitus—a stone left unturned? Curr Diabetes Rev. 2012;8:109-115.
37. McNally K, Rohan J, Pendley JS, et al. Executive functioning, treatment adherence, and glycemic control in children with type 1 diabetes. Diabetes Care. 2010;33:1159-1162.
38. Rucker JL, McDowd JM, Kluding PM. Executive function and type 2 diabetes: putting the pieces together. Phys Ther. 2012;92:454-462.
39. Kirkman MS, Briscoe VJ, Clark N, et al. Diabetes in older adults. Diabetes Care. 2012;35:2650-2664.
40. Durso SC. Using clinical guidelines designed for older adults with diabetes mellitus and complex health status. JAMA. 2006;295:1935-1940.
41. Oftedal B, Karlsen B, Bru E. Life values and self-regulation behaviours among adults with type 2 diabetes. J Clin Nurs. 2010;19:2548-2556.
42. Morrow AS, Haidet P, Skinner J, et al. Integrating diabetes self-management with the health goals of older adults: a qualitative exploration. Patient Educ Couns. 2008;72:418-423.
43. Huang ES, Gorawara-Bhat R, Chin MH. Self-reported goals of older patients with type 2 diabetes mellitus. J Am Geriatr Soc. 2005;53:306-311.
44. Beverly EA, Wray LA, LaCoe CL, et al. Listening to older adults’ values and preferences for type 2 diabetes care: a qualitative study. Diabetes Spectr. 2014;27:44-49.
45. American Association of Diabetes Educators. Why refer for diabetes education? American Association of Diabetes Educators. www.diabeteseducator.org/practice/provider-resources/why-refer-for-diabetes-education. Accessed May 16, 2017.
46. Ismail K, Winkley K, Rabe-Hesketh S. Systematic review and meta-analysis of randomised controlled trials of psychological interventions to improve glycaemic control in patients with type 2 diabetes. Lancet. 2004;363:1589-1597.
DMD use during pregnancy low, study finds
NEW ORLEANS – The proportion of women with multiple sclerosis with a live birth receiving disease-modifying drug therapy was low and declined during the prepregnancy and pregnancy periods, results from a large analysis of national claims data found.
“Multiple sclerosis is up to three times more common in women than in men, and the clinical onset is often during childbearing years,” researchers led by Maria K. Houtchens, MD, wrote in an abstract presented during the annual meeting of the Consortium of Multiple Sclerosis Centers. “A better understanding of the ‘real world’ disease-modifying drug treatment patterns in women with MS and a pregnancy is essential in order to improve available clinical support, health care services, and quality of life for women with MS of childbearing age.”

Dr. Houtchens, a neurologist at Brigham and Women’s Hospital, Boston, and her associates reported results from 2,518 women who were included in the final analysis. Their mean age was 30 years, and 99% had commercial health insurance.
Overall, the proportion of women with MS and a live birth receiving DMD treatment was low, ranging from 1.9% to 25.5%, and the rate of treatment declined during the prepregnancy and pregnancy periods.
During pregnancy, the proportion of women treated with a DMD decreased to 12.05% during the first trimester and to 1.90% during the second trimester, and then increased to 2.97% during the third trimester. At 9-12 months postpartum, the proportion of women treated with a DMD was 25.5%. Most patients were treated with self-injectable DMDs (from 1.7% to 19.6%), while the use of oral and infusion agents was low (0.1%-3.1% and 0%-0.2%, respectively).
The researchers also found that the proportion of women with DMD treatment before and after pregnancy increased significantly with the number of relapses experienced prepregnancy. A greater number of relapses before pregnancy led to more patients treated with DMDs.
They acknowledged certain limitations of the study, including its reliance on information from patients with health insurance administered by regional health plans. “Results may not be generalizable to patients who self-pay or patients without employer-sponsored commercial health insurance.”
The study was supported by EMD Serono. Dr. Houtchens reported that she has received funding support from EMD Serono and that she serves on the scientific advisory boards for Biogen, Novartis, Sanofi Genzyme, and Teva Neuroscience. She also has received research support from Sanofi Genzyme.
NEW ORLEANS – The proportion of women with multiple sclerosis with a live birth receiving disease-modifying drug therapy was low and declined during the prepregnancy and pregnancy periods, results from a large analysis of national claims data found.
“Multiple sclerosis is up to three times more common in women than in men, and the clinical onset is often during childbearing years,” researchers led by Maria K. Houtchens, MD, wrote in an abstract presented during the annual meeting of the Consortium of Multiple Sclerosis Centers. “A better understanding of the ‘real world’ disease-modifying drug treatment patterns in women with MS and a pregnancy is essential in order to improve available clinical support, health care services, and quality of life for women with MS of childbearing age.”
Dr. Houtchens, a neurologist at Brigham and Women’s Hospital, Boston, and her associates reported results from 2,518 women who were included in the final analysis. Their mean age was 30 years, and 99% had commercial health insurance.
Overall, the proportion of women with MS and a live birth receiving DMD treatment was low, ranging from 1.9% to 25.5%, and the rate of treatment declined during the prepregnancy and pregnancy periods.
During pregnancy, the proportion of women treated with a DMD decreased to 12.05% during the first trimester and to 1.90% during the second trimester, and then increased to 2.97% during the third trimester. At 9-12 months postpartum, the proportion of women treated with a DMD was 25.5%. Most patients were treated with self-injectable DMDs (from 1.7% to 19.6%), while the use of oral and infusion agents was low (0.1%-3.1% and 0%-0.2%, respectively).
The researchers also found that the proportion of women with DMD treatment before and after pregnancy increased significantly with the number of relapses experienced prepregnancy. A greater number of relapses before pregnancy led to more patients treated with DMDs.
They acknowledged certain limitations of the study, including its reliance on information from patients with health insurance administered by regional health plans. “Results may not be generalizable to patients who self-pay or patients without employer-sponsored commercial health insurance.”
The study was supported by EMD Serono. Dr. Houtchens reported that she has received funding support from EMD Serono and that she serves on the scientific advisory boards for Biogen, Novartis, Sanofi Genzyme, and Teva Neuroscience. She also has received research support from Sanofi Genzyme.
AT THE CMSC ANNUAL MEETING
Key clinical point:
Major finding: Overall, the proportion of women with multiple sclerosis and a live birth receiving DMD treatment was low, ranging from 1.9% to 25.5%.
Data source: A retrospective analysis of claims data from 2,518 women with MS.
Disclosures: The study was supported by EMD Serono. Dr. Houtchens reported that she has received funding support from EMD Serono and that she serves on the scientific advisory boards for Biogen, Novartis, Sanofi Genzyme, and Teva Neuroscience. She also has received research support from Sanofi Genzyme.
Supreme Court rules to speed biosimilar drugs to market
The U.S. Supreme Court has ruled that biosimilar companies can take their versions of biological drugs to the market 6 months sooner in a precedential ruling that could mean quicker access to less expensive medications.
The unanimous ruling overturns an appeals court ruling in favor California-based Amgen that had barred competitor Sandoz from selling its biosimilar of Neupogen (filgrastim) until 6 months after Food and Drug Administration approval. Justices held that the Biologics Price Competition and Innovation Act of 2009 (BPCIA) allows biosimilar applicants to provide notice of commercial marketing prior to obtaining licensure by the FDA.
Carol Lynch, global head of Biopharmaceuticals at Sandoz, said the ruling helps to eliminate unnecessary barriers so that patients can access more affordable medicine in a more timely manner.
“Biosimilars offer significant value to patients, providers, and payers, increasing the number of treatment options available to patients across many disease areas at a reduced cost to the health care system,” Ms. Lynch said in a statement. “The justices’ unanimous ruling on the notice of commercial marketing will help expedite patient access to life-enhancing treatments. We also appreciate the clarity provided on the patent dance, which will help the

In a statement, an Amgen spokeswoman said the company was “disappointed in the court’s decision on the notice of commercial marketing,” but that it will “continue to seek to enforce our intellectual property against those parties that infringe upon our rights.”
The “patent dance” referred to by Ms. Lynch is the often lengthy process by which companies marketing brand name and biosimilar medications spar and undergo legal proceedings before the biosimilar can enter the market.
In this case, Sandoz filed an application with the FDA in May 2014 seeking approval to market Zarxio (filgrastim-sndz) Neupogen as the reference product. Amgen has marketed Neupogen since 1991 and holds patents on methods of manufacturing and using filgrastim. In July 2014, the FDA accepted Sandoz’ application for review. In October 2014, Amgen sued for patent infringement, alleging that Sandoz failed to adhere to the BPCIA by unlawfully providing its notice of commercial marketing before FDA licensure, among other arguments.
The U.S. Court of Appeals for the Federal Circuit in Washington ruled in favor of Amgen, holding that Sandoz must wait for an FDA license before marketing its biosimilar, which meant another 6-month waiting period. The Supreme Court disagreed. Justices based their decision on the plain language of the BPCIA, ruling that the statute allows for applicants to provide marketing notice either before or after receiving FDA approval.
In a statement, the Pharmaceutical Care Management Association said the Supreme Court’s ruling on biosimilars will help create more competition among costly biologic medications, “which is the key to reducing overall prescription drug costs for consumers, employers, government programs, and others.”
[email protected]
On Twitter @legal_med
The U.S. Supreme Court has ruled that biosimilar companies can take their versions of biological drugs to the market 6 months sooner in a precedential ruling that could mean quicker access to less expensive medications.
The unanimous ruling overturns an appeals court ruling in favor California-based Amgen that had barred competitor Sandoz from selling its biosimilar of Neupogen (filgrastim) until 6 months after Food and Drug Administration approval. Justices held that the Biologics Price Competition and Innovation Act of 2009 (BPCIA) allows biosimilar applicants to provide notice of commercial marketing prior to obtaining licensure by the FDA.
Carol Lynch, global head of Biopharmaceuticals at Sandoz, said the ruling helps to eliminate unnecessary barriers so that patients can access more affordable medicine in a more timely manner.
“Biosimilars offer significant value to patients, providers, and payers, increasing the number of treatment options available to patients across many disease areas at a reduced cost to the health care system,” Ms. Lynch said in a statement. “The justices’ unanimous ruling on the notice of commercial marketing will help expedite patient access to life-enhancing treatments. We also appreciate the clarity provided on the patent dance, which will help the
In a statement, an Amgen spokeswoman said the company was “disappointed in the court’s decision on the notice of commercial marketing,” but that it will “continue to seek to enforce our intellectual property against those parties that infringe upon our rights.”
The “patent dance” referred to by Ms. Lynch is the often lengthy process by which companies marketing brand name and biosimilar medications spar and undergo legal proceedings before the biosimilar can enter the market.
In this case, Sandoz filed an application with the FDA in May 2014 seeking approval to market Zarxio (filgrastim-sndz) Neupogen as the reference product. Amgen has marketed Neupogen since 1991 and holds patents on methods of manufacturing and using filgrastim. In July 2014, the FDA accepted Sandoz’ application for review. In October 2014, Amgen sued for patent infringement, alleging that Sandoz failed to adhere to the BPCIA by unlawfully providing its notice of commercial marketing before FDA licensure, among other arguments.
The U.S. Court of Appeals for the Federal Circuit in Washington ruled in favor of Amgen, holding that Sandoz must wait for an FDA license before marketing its biosimilar, which meant another 6-month waiting period. The Supreme Court disagreed. Justices based their decision on the plain language of the BPCIA, ruling that the statute allows for applicants to provide marketing notice either before or after receiving FDA approval.
In a statement, the Pharmaceutical Care Management Association said the Supreme Court’s ruling on biosimilars will help create more competition among costly biologic medications, “which is the key to reducing overall prescription drug costs for consumers, employers, government programs, and others.”
[email protected]
On Twitter @legal_med
Vets with TBIs are more likely to develop Parkinson’s
BOSTON – New research finds that military veterans who suffered mild traumatic brain injuries (TBIs) faced more than 1.5 times the risk of developing Parkinson’s disease (PD), compared with other veterans over up to 12 years of follow-up. The risk doubled for those who suffered moderate to severe TBIs.
The findings don’t confirm a link between brain injury and PD, and the number of PD diagnoses remained small even among those who’d suffered the worst TBIs.
Still, the findings suggest that “mild TBI may have long-term consequences, including PD,” said study lead author Raquel C. Gardner, MD, a neurologist whose findings were released at the annual meeting of the American Academy of Neurology. “We need to ramp up efforts to prevent TBI and also make sure we are carefully screening TBI-exposed patients for some of these long-term consequences, for which we may be able to offer therapies to improve quality of life.”
Most recently, a 2016 study found signs of a link between previous TBIs that caused more than an hour of unconsciousness and PD (hazard ratio, 3.56; 95% confidence interval, 1.52-8.28; JAMA Neurol. 2016;73[9]:1062-9).
As for mild TBI, a 2014 systematic review examined five studies and found that only one linked it to PD (OR, 1.5; 95% CI, 1.4-1.7).
For the new study, researchers analyzed records of patients served by the Veterans Health Administration from 2002 to 2014. They age matched 162,935 veterans who had suffered TBIs (half mild, half moderate to severe) to 162,935 veterans who had not (a 2% sample of all veterans served by the VHA).
Mild TBIs are defined as those that caused loss of consciousness of less than 30 minutes. Mild to moderate TBIs caused more than 30 minutes of unconsciousness.
The study participants hadn’t been diagnosed with PD or dementia at baseline or over the following year. Their average age was 48 years.
Compared with those who hadn’t suffered TBIs, those who did were more likely to be male (92% vs. 85%) and to suffer from hypertension (12% vs. 8%), cerebrovascular disease (4% vs. 1%), posttraumatic stress disorder (21% vs. 4%), and depression (24% vs. 9%; P less than .001).
“Prior studies have determined that TBI is a risk factor for depression and PTSD,” Dr. Gardner said. “Thus, higher rates of these outcomes among the patient with TBI in our study may represent sequelae of the TBI.”
Indications of education and income were similar among the two groups (P = .94 and P = .29, respectively). Those who suffered TBIs were more likely to be white than those who didn’t (73% vs. 67%) and less likely to be of other or unknown race (7% vs. 13%; P less than .001).
The percentages of veterans who developed PD were 0.31% (no TBI), 0.58% (any TBI), 0.47% (mild TBI), and 0.75% (moderate/severe TBI).
The unadjusted hazard ratios for PD were 1.81 (1.63-2.01) for any TBI, 1.59 (1.39-1.82) for mild TBI, and 2.01 (1.78-2.26) for moderate/severe TBI (P less than .0001).
Hazard ratios adjusted for demographics and comorbidities were 1.71 (1.53-1.92) for any TBI, 1.56 (1.35-1.80) for mild TBI, and 1.83 (1.61-2.07) for mild/moderate TBI (P less than .0001).
“The vast majority of people in this study did not develop PD,” Dr. Gardner said. “However, those with TBI had about a 50%-60% increased risk of PD that was statistically significant. While the P value is very small, the important numbers are really the confidence intervals around the estimate. According to our confidence intervals, we are very confident that the true estimate is between about 35% and 80% increased risk.”
Researchers also found that TBI sufferers who developed PD were 2 years younger at diagnosis than those who didn’t suffer TBIs (70 vs. 72; P = .003).
To limit the possibility of reverse causation, researchers tried excluding veterans who were diagnosed with PD within 4 years after baseline. The results remained similar.
The study has limitations. It’s not clear when the TBIs occurred. Also, the study doesn’t take the causes of TBIs into account. “In this veteran population, particularly among the younger veterans of Operation Iraqi Freedom and Operation Enduring Freedom, many are likely blast-related TBIs,” Dr. Gardner said.
The study is also limited because of the sample, said Paul K. Crane, MD, of the University of Washington, Seattle, in an interview. He was lead author of a 2016 study into links between TBI and PD and other neurodegenerative conditions (JAMA Neurol. 2016;73[9]:1062-9).
“People treated at the VA are not a representative sample of anyone other than people treated at the VA,” he said. “The ability to generalize beyond the large convenience sample is difficult.”
He added that “many people who do not have a diagnosis of mild TBI in the VA medical system nevertheless have had a mild TBI. Medical records for TBI are very incomplete. Perhaps this is especially true for veterans, who are at extremely high risk of TBI.”
Still, the research “reinforces the idea that TBI, including so-called ‘mild’ TBI – and in this case, that means mild TBI that has resulted in electronic data codes in a health records system – is definitely not innocuous, and, in particular, there is a relationship between TBI exposure and risk for Parkinson’s disease.”
How could this research be useful? Dr. Crane said it shouldn’t change practice. “We should avoid head injuries, but we should have done so before. We should diagnose Parkinson’s disease because it can be treated,” he said. “The individual risk for PD is not tons more among those with a history of head injury as defined in this paper, so I doubt we would find that heightened awareness of PD in that group is warranted.”
However, he added that “this kind of research is useful in helping us to conceptualize the downstream consequences of TBI and reinforce a strong and growing literature that finds links between TBI exposure and PD risk. Much remains to be learned.”
The study was supported by the National Institute of Neurological Disorders and Stroke, the National Institute on Aging, the American Federation for Aging Research, the Weill Institute for Neurosciences, and the U.S. Departments of Defense and Veterans Affairs. Dr. Gardner reported no relevant disclosures. Dr. Lane reported receiving funding from the Alzheimer’s Association, the National Institutes of Health, and the Department of Defense.
AT AAN 2017
Key clinical point:
Major finding: Veterans who’d suffered any TBI were more likely to develop PD (adjusted HR, 1.71; 95% CI, 1.53-1.92; P less than .0001).
Data source: A retrospective cohort study of age-matched veterans (162,935 who had suffered TBIs and 162,935 who had not) who received care from the Veterans Health Administration from 2002 to 2014.
Disclosures: The study was supported by the National Institute of Neurological Disorders and Stroke, the National Institute on Aging, the American Federation for Aging Research, the Weill Institute for Neurosciences, and the U.S. Departments of Defense and Veterans Affairs. Dr. Gardner reports no relevant disclosures. Dr. Lane reported receiving funding from the Alzheimer’s Association, the National Institutes of Health, and the Department of Defense.
For chronic abdominal pain, THC resembled placebo
Seven weeks of treatment with delta-9-atetrahydrocannabinol (THC) did not improve chronic abdominal pain in a placebo-controlled trial of 65 adults.
Treatment “was safe and well tolerated,” but did not significantly reduce pain scores or secondary efficacy outcomes, Marjan de Vries, MSc, and her associates wrote in the July issue of Clinical Gastroenterology and Hepatology (doi: 10.1016/j.cgh.2016.09.147). Studies have not clearly shown that THC improves central pain sensitization, a key mechanism in chronic abdominal pain, they noted. Future studies of THC and central sensitization include quantitative sensory testing or electroencephalography, they added.
Source: American Gastroenterological Association
Treatment-refractory chronic abdominal pain is common after abdominal surgery or in chronic pancreatitis, wrote Ms. de Vries of Radboud University Medical Center, Nijmegen, the Netherlands. Affected patients tend to develop central sensitization, or hyper-responsive nociceptive central nervous system pathways. When this happens, pain no longer couples reliably with peripheral stimuli, and therapy targeting central nociceptive pathways is indicated. The main psychoactive compound of Cannabis sativa is THC, which interacts with CB1 receptors in the central nervous system, including in areas of the brain that help regulate emotions, such as the amygdala. Emotion-processing circuits are often overactive in chronic pain, and disrupting them might help modify pain perception, the investigators hypothesized. Therefore, they randomly assigned 65 adults with at least 3 months of abdominal pain related to chronic pancreatitis or abdominal surgery to receive oral placebo or THC tablets three times daily for 50-52 days. The 31 patients in the THC group received step-up dosing (3 mg per dose for 5 days, followed by 5 mg per dose for 5 days) followed by stable dosing at 8 mg. Both groups continued other prescribed analgesics as usual, including oxycontin, fentanyl, morphine, codeine, tramadol, paracetamol, anti-epileptics, and nonsteroidal anti-inflammatories. All but two study participants were white, 25 were male, and 24 were female.
At baseline, all patients reported pain of at least 3 on an 11-point visual analogue scale (VAS). By days 50-52, average VAS scores decreased by 1.6 points (40%) in the THC group and by 1.9 points (37%) in the placebo group (P = .9). Although a strong placebo effect is common in studies of visceral pain, that did not prevent pregabalin from significantly outperforming placebo in another similarly designed randomized clinical trial of patients from this study group with chronic pancreatitis, the investigators noted.
The THC and placebo groups also resembled each other on various secondary outcome measures, including patient global impression of change, pain catastrophizing, pain-related anxiety, measures of depression and generalized anxiety, and subjective impressions of alertness, mood, feeling “high,” drowsiness, and difficulties in controlling thoughts. The only exception was that the THC group showed a trend toward improvement on the Short Form 36, compared with the placebo group (P = .051).
Pharmacokinetic analysis showed good oral absorption of THC. Dizziness, somnolence, and headache were common in both groups, but were more frequent with THC than placebo, as was nausea, dry mouth, and visual impairment. There were no serious treatment-related adverse events, although seven patients stopped THC because they could not tolerate the maximum dose.
Some evidence suggests that the shift from acute to chronic pain entails a transition from nociceptive to cognitive, affective, and autonomic sensitization, the researchers noted. “Therefore, an agent targeting particular brain areas related to the cognitive emotional feature of chronic pain, such as THC, might be efficacious in our chronic pain population, but might be better measured by using affective outcomes of pain,” they concluded.
The trial was supported by a grant from the European Union, the European Fund for Regional Development, and the Province of Gelderland. The THC was provided by Echo Pharmaceuticals, Nijmegen, the Netherlands. The investigators reported having no conflicts of interest.
FROM CLINICAL GASTROENTEROLOGY AND HEPATOLOGY
Key clinical point: Tetrahydrocannabinol did not improve chronic abdominal pain more than did placebo.
Major finding: By days 50-52, average VAS scores decreased by 1.6 points (40%) in the THC group and by 1.9 points (37%) in the placebo group (P = .9).
Data source: A phase II, placebo-controlled study of 65 patients with chronic abdominal pain for at least 3 months who received either placebo or delta-9-atetrahydrocannabinol (THC), 8 mg three times daily.
Disclosures: The trial was supported by a grant from the European Union, the European Fund for Regional Development, and the Province of Gelderland. The THC was provided by Echo Pharmaceuticals, Nijmegen, the Netherlands. The investigators reported having no conflicts of interest.

Mesh use for lap paraesophageal hernia repair held steady
Utilization of mesh in laparoscopic paraesophageal hernia repair (PEHR) remained steady from 2011 to 2014, despite a lack of evidence supporting its use, according to Francisco Schlottmann, MD, and his associates.
In an analysis of 9,590 laparoscopic PEHR performed from 2011 to 2014, 60.6% procedures were done without mesh and 39.4% were done with mesh. Over the 3-year study period, mesh utilization fell only 1.2% overall, with laparoscopic PEHR with mesh accounting for 39.4% of procedures in 2011 and 38.2% in 2014.
Patients who received mesh were slightly older and significantly more likely to be an inpatient admission. Postoperative urinary tract infection was less common in patients with mesh, occurring in 1% of patients, compared with 1.5% of patients without mesh. No significant difference in demographics was seen, and 30-day risk of comorbidity and mortality was the same. Mean length of stay was 2.7 days for PEHR with mesh and 2.5 days for PEHR without mesh.
“The use of mesh is associated with high expenses, and biomedical technology continues to offer newer and more expensive mesh products on the market. Given the progressive aging of the U.S. population, PEHR are expected to increase in the future. The indiscriminate and not supported by evidence use of mesh may determine unnecessary costs for the health care system,” the investigators noted.
Find the full study in the Journal of Gastrointestinal Surgery (2017 May 26. doi: 10.1007/s11605-017-3452-8).
FROM THE JOURNAL OF GASTROINTESTINAL SURGERY
ADT+RT duration can safely be shortened in high risk PC
CHICAGO – Androgen deprivation therapy (ADT) combined with radiation therapy can safely be reduced from 36 to 18 months without compromising outcomes or quality of life in patients with high-risk localized prostate cancer, according to the final results of a randomized phase III trial.
At a median of 9.4 year follow-up of 630 patients who were randomized to receive pelvic and prostate radiotherapy combined with either 36 or 18 months of ADT, the 10-year overall survival rate was 62.4% and 62.0% in the treatment arms, respectively (global hazard ratio, 1.024), Abdenour Nabid, MD, reported at the annual meeting of the American Society of Clinical Oncology.
Disease-free survival was 44.5% and 39.2% in the groups, respectively (HR, 0.835). This difference did not reach statistical significance, said Dr. Nabid of Centre Hospitalier Regional Universitaire, Sherbrooke, Quebec, Canada.
The disease-free survival curves separated over the course of the study, mainly because of a significant difference in biochemical failure between the groups, which favored the 36-month arm (24.8% vs. 31.0%; HR, 0.714), but this is not an unexpected finding with longer treatment, he explained.
“Does this biochemical control give you more control of the disease? I’m not sure,” he said, noting that bone metastases alone occurred in 23 and 24 patients in the 36 and 18 month treatment groups, respectively, and bone plus other site metastases occurred in 11 patients in each group. “At the end of the day, the P value (for disease-free survival) is not significant (.0768).”
Further, a quality of life analysis showed that patients in the 18-month treatment arm performed significantly better on 6 of 21 scales and 13 of 55 items addressing various quality of life factors. On two of these items – hot flushes and enjoyable sex – a clinically relevant difference of 10 or more points in mean scores was noted, he said.
Long-term ADT combined with radiotherapy is a standard treatment for patients with high-risk prostate cancer, but the optimal duration of treatment has not been defined, Dr. Nabid said.
The current trial looked at treatment duration in patients 80 years and younger (median of 71 in both groups) with T3-T4 disease, PSA levels greater than 20 mg/ml, and Gleason score greater than 7, with normal hepatic function and no regional disease or distant metastases. ADT included a 50 mg initial dose of bicalutamide daily for 1 month plus 10.8 mg of subcutaneous goserelin every 3 months, as well as pelvic and prostate radiotherapy.
On both univariate and multivariate analyses including age, Gleason score greater than 7, treatment duration, prostate-specific antigen greater than 20, T3-T4 disease, and biochemical failure during follow-up, only age and Gleason score were significantly associated with overall survival (HR, 1.05 for age in both analyses, and 1.40 and 1.42, respectively for Gleason score greater than 7 on univariate and multivariate analyses).
“In localized high-risk prostate cancer treated with radiotherapy and androgen deprivation therapy, androgen deprivation therapy duration can be safely reduced from 36 to 18 months,” Dr. Nabid said, adding that 18 months could represent a threshold effect in ADT duration and that side effects and treatment costs can be reduced with shorter duration of therapy.
“Eighteen months of ADT represents a new standard of care,” he concluded.
This study was funded by AstraZeneca Pharmaceuticals. Dr. Nabid has been a speaker, advisory board member, and/or received financial support from Janssen Canada, Sanofi, Astellas, and Bayer.
Although it may seem reasonable to conclude based on the findings of this study that 18 months of ADT is similar to 36 months of ADT, the study was not designed to make this determination, according to Susan Halabi, PhD.
“In fact, a nonsignificant test result from a superiority comparison cannot be used to establish similarity,” Dr. Halabi said during a discussion of the findings at the meeting.
While she congratulated Dr. Nabid for his findings and long-term patient follow-up, she said questions remain.
“The optimal duration of ADT for high-risk localized prostate cancer is not known and remains a clinically important question,” she said.
Dr. Halabi is with Duke University, Durham, N.C. She reported consultant and/or advisory roles with Dendreon, Eisai, Genentech, Sanofi, and Tokai Pharmaceuticals and has received travel accommodations or expenses from Dendreon.
CHICAGO – Androgen deprivation therapy (ADT) combined with radiation therapy can safely be reduced from 36 to 18 months without compromising outcomes or quality of life in patients with high-risk localized prostate cancer, according to the final results of a randomized phase III trial.
At a median of 9.4 year follow-up of 630 patients who were randomized to receive pelvic and prostate radiotherapy combined with either 36 or 18 months of ADT, the 10-year overall survival rate was 62.4% and 62.0% in the treatment arms, respectively (global hazard ratio, 1.024), Abdenour Nabid, MD, reported at the annual meeting of the American Society of Clinical Oncology.
Disease-free survival was 44.5% and 39.2% in the groups, respectively (HR, 0.835). This difference did not reach statistical significance, said Dr. Nabid of Centre Hospitalier Regional Universitaire, Sherbrooke, Quebec, Canada.
The disease-free survival curves separated over the course of the study, mainly because of a significant difference in biochemical failure between the groups, which favored the 36-month arm (24.8% vs. 31.0%; HR, 0.714), but this is not an unexpected finding with longer treatment, he explained.
“Does this biochemical control give you more control of the disease? I’m not sure,” he said, noting that bone metastases alone occurred in 23 and 24 patients in the 36 and 18 month treatment groups, respectively, and bone plus other site metastases occurred in 11 patients in each group. “At the end of the day, the P value (for disease-free survival) is not significant (.0768).”
Further, a quality of life analysis showed that patients in the 18-month treatment arm performed significantly better on 6 of 21 scales and 13 of 55 items addressing various quality of life factors. On two of these items – hot flushes and enjoyable sex – a clinically relevant difference of 10 or more points in mean scores was noted, he said.
Long-term ADT combined with radiotherapy is a standard treatment for patients with high-risk prostate cancer, but the optimal duration of treatment has not been defined, Dr. Nabid said.
The current trial looked at treatment duration in patients 80 years and younger (median of 71 in both groups) with T3-T4 disease, PSA levels greater than 20 mg/ml, and Gleason score greater than 7, with normal hepatic function and no regional disease or distant metastases. ADT included a 50 mg initial dose of bicalutamide daily for 1 month plus 10.8 mg of subcutaneous goserelin every 3 months, as well as pelvic and prostate radiotherapy.
On both univariate and multivariate analyses including age, Gleason score greater than 7, treatment duration, prostate-specific antigen greater than 20, T3-T4 disease, and biochemical failure during follow-up, only age and Gleason score were significantly associated with overall survival (HR, 1.05 for age in both analyses, and 1.40 and 1.42, respectively for Gleason score greater than 7 on univariate and multivariate analyses).
“In localized high-risk prostate cancer treated with radiotherapy and androgen deprivation therapy, androgen deprivation therapy duration can be safely reduced from 36 to 18 months,” Dr. Nabid said, adding that 18 months could represent a threshold effect in ADT duration and that side effects and treatment costs can be reduced with shorter duration of therapy.
“Eighteen months of ADT represents a new standard of care,” he concluded.
This study was funded by AstraZeneca Pharmaceuticals. Dr. Nabid has been a speaker, advisory board member, and/or received financial support from Janssen Canada, Sanofi, Astellas, and Bayer.
AT THE 2017 ASCO ANNUAL MEETING
Key clinical point:
Major finding: Ten-year overall survival was 62.4% and 62.0% for patients randomized to receive pelvic and prostate radiotherapy combined with either 36 or 18 months of androgen deprivation therapy, respectively (global hazard ratio, 1.024).
Data source: A randomized phase III trial of 630 patients.
Disclosures: This study was funded by AstraZeneca Pharmaceuticals. Dr. Nabid has been a speaker, advisory board member, and/or received financial support from Janssen Canada, Sanofi, Astellas, and Bayer.
Novel CAR T cells drive high objective response rate in multiple myeloma
CHICAGO – CARs just keep getting better: In an early clinical trial, a chimeric antigen receptor (CAR) T-cell construct targeting B-cell maturation protein induced clinical remissions in 33 of 35 patients with relapsed/refractory multiple myeloma who were treated in an early clinical trial.
“In our current trials we have observed revolutionary, quick, and durable remissions in patients with multiple myeloma,” said Wanhong Zhao, MD, of the Second Affiliated Hospital of Xi’an (China) Jiaotong University.

“I think what you’re seeing here is the expansion of immunotherapy to cancers that really are refractory to chemotherapy and how immunotherapy is now providing hope to a lot of patients with cancers that were not really responding to our standard chemotherapies,” commented ASCO expert Michael S. Sabel, MD, of the University of Michigan, Ann Arbor. “What I also think is really fascinating about this and similar forms of research is that you are now seeing the merger of immunotherapy with personalized medicine.”
Current CAR T-cell technologies targeting CD19 or a similar antigen have shown efficacy against acute lymphoblastic leukemia and some forms of lymphoma, but it has been difficult to identify a suitable target in multiple myeloma.
B-cell maturation antigen (BCMA) was first described in myeloma in 2004 as a mechanism for the growth and survival of malignant plasma cells.
Several research groups are currently investigating CAR T cells or monoclonal antibodies targeted to BCMA.
In the study by Dr. Zhao and his colleagues, 19 patients had been followed for more than 4 months before the data cutoff in January 2017. Four months is the minimum established by the International Myeloma Working Group for efficacy assessment.
Of the 19 patients, 14 had achieved a stringent complete response (sCR), 4 had very good partial responses, and 1 had a partial response, for an objective response rate of 100%.
No patients who achieved an sCR have had relapses, and all five patients who have been in follow-up for more than a year have maintained their sCRs and are free of minimal residual disease, Dr. Zhao reported.
One patient with a very good partial response had disease progression, with recurrence of an extramedullary lesion that had previously disappeared.
The most common adverse event was cytokine release syndrome, which occurred in 85% of patients, but the condition was transient and manageable in a majority, Dr. Zhao said.
Two patients developed grade 3 cytokine release syndrome and were treated with tocilizumab (Actemra).
The investigators plan to enroll a total of 100 patients from participating hospitals in China and are planning a U.S. trial for launch in early 2018.
The investigators hope to look at BCMA CAR-T cell therapy in the frontline for patients with newly diagnosed multiple myeloma.
The study was funded by Legend Biotech. Coauthor Fran (Xiaohu) Fan, MD, PhD, is employed by the company. Dr. Zhao did not report disclosures. Dr. Sabel had no disclosures relevant to the study.
CHICAGO – CARs just keep getting better: In an early clinical trial, a chimeric antigen receptor (CAR) T-cell construct targeting B-cell maturation protein induced clinical remissions in 33 of 35 patients with relapsed/refractory multiple myeloma who were treated in an early clinical trial.
“In our current trials we have observed revolutionary, quick, and durable remissions in patients with multiple myeloma,” said Wanhong Zhao, MD, of the Second Affiliated Hospital of Xi’an (China) Jiaotong University.
“I think what you’re seeing here is the expansion of immunotherapy to cancers that really are refractory to chemotherapy and how immunotherapy is now providing hope to a lot of patients with cancers that were not really responding to our standard chemotherapies,” commented ASCO expert Michael S. Sabel, MD, of the University of Michigan, Ann Arbor. “What I also think is really fascinating about this and similar forms of research is that you are now seeing the merger of immunotherapy with personalized medicine.”
Current CAR T-cell technologies targeting CD19 or a similar antigen have shown efficacy against acute lymphoblastic leukemia and some forms of lymphoma, but it has been difficult to identify a suitable target in multiple myeloma.
B-cell maturation antigen (BCMA) was first described in myeloma in 2004 as a mechanism for the growth and survival of malignant plasma cells.
Several research groups are currently investigating CAR T cells or monoclonal antibodies targeted to BCMA.
In the study by Dr. Zhao and his colleagues, 19 patients had been followed for more than 4 months before the data cutoff in January 2017. Four months is the minimum established by the International Myeloma Working Group for efficacy assessment.
Of the 19 patients, 14 had achieved a stringent complete response (sCR), 4 had very good partial responses, and 1 had a partial response, for an objective response rate of 100%.
No patients who achieved an sCR have had relapses, and all five patients who have been in follow-up for more than a year have maintained their sCRs and are free of minimal residual disease, Dr. Zhao reported.
One patient with a very good partial response had disease progression, with recurrence of an extramedullary lesion that had previously disappeared.
The most common adverse event was cytokine release syndrome, which occurred in 85% of patients, but the condition was transient and manageable in a majority, Dr. Zhao said.
Two patients developed grade 3 cytokine release syndrome and were treated with tocilizumab (Actemra).
The investigators plan to enroll a total of 100 patients from participating hospitals in China and are planning a U.S. trial for launch in early 2018.
The investigators hope to look at BCMA CAR-T cell therapy in the frontline for patients with newly diagnosed multiple myeloma.
The study was funded by Legend Biotech. Coauthor Fran (Xiaohu) Fan, MD, PhD, is employed by the company. Dr. Zhao did not report disclosures. Dr. Sabel had no disclosures relevant to the study.
AT THE 2017 ASCO ANNUAL MEETING
Key clinical point: All of 19 patients treated with the CAR T-cell construct targeting B-cell maturation antigen had an objective response.
Major finding: Of 35 patients with relapsed/refractory multiple myeloma treated with BCMA, 33 had remissions.
Data source: A prospective single-arm study of 35 patients, with enrollment planned for 100.
Disclosures: The study was funded by Legend Biotech. Coauthor Fran (Xiaohu) Fan, MD, PhD, is employed by the company. Dr. Zhao did not report disclosures. Dr. Sabel had no disclosures relevant to the study.