User login
Company pauses enrollment on 2 trials of pembrolizumab in MM
Merck announced that it is pausing enrollment onto 2 phase 3 trials of pembrolizumab (Keytruda®) in combination with other agents to treat multiple myeloma (MM).
An external Data Monitoring Committee recommended the trial be interrupted “to allow for additional information be collected to better understand more reports of death” in the pembrolizumab groups in the KEYNOTE-183 and KEYNOTE-185 trials.
Patients currently enrolled on the trials can continue to receive treatment. Other pembrolizumab trials are continuing without changes.
Merck in its statement did not disclose the number of deaths nor provide any other details on the deaths.
Pembrolizumab is a humanized monoclonal antibody that blocks interaction between the programmed cell death protein 1 (PD-1) and its receptor ligands, PD-L1 and PD-L2.
The US Food & Drug Administration approved pembrolizumab to treat unresectable or metastatic melanoma after ipilimumab treatment.
Pembrolizumab has also been approved to treat non-small cell lung cancer, head and neck squamous cell cancer, classical Hodgkin lymphoma, urothelial carcinoma, and microsatellite instability-high solid tumors.
KEYNOTE-183 (NCT02576977), which has an estimated enrollment of 300 patients, is comparing the combination of pembrolizumab, pomalidomide, and low-dose dexamethasone to pomalidomide and low-dose dexamethasone alone in patients with relapsed or refractory MM who have undergone at least 2 lines of prior therapy.
KEYNOTE-185 (NCT02579863), which has an estimated enrollment of 640 patients, is comparing the combination of pembrolizumab, lenalidomide, and low-dose dexamethasone to lenalidomide and low-dose desamethasone alone in patients with newly diagnosed and treatment-native MM who are ineligible for autologous stem cell transplant.
The comparator agents pomalidomide (Pomalyst®) and lenalidomide (Revlimid®) are products of Celgene Corporation. ![]()
BM-MSCs may be an option for AA patients refractory to IST

Researchers report that infusions of bone marrow-derived mesenchymal stromal cells (BM-MSCs) may be a treatment option for patients with aplastic anemia (AA) who are refractory to immunosuppressive therapy (IST).
They conducted a phase 2, non-comparative multicenter study to assess the safety and efficacy of this approach and found that after 12 months, 28.4% of patients responded, with 6.8% achieving a complete response (CR) and 21.6% a partial response (PR).
The trial involved 74 patients at 7 centers in China. The research team reported its findings in Stem Cells Translational Medicine.
About 30% to 40% of patients with severe AA (sAA) don’t respond well to IST and continue to have abnormally low levels of red blood cells, white blood cells, and platelets.
The benefit of treatment with BM-MSCs is they support hematopoiesis, express low levels of major histocompatibility (MHC)-I, and lack expression of MHC-II surface molecules.
And BM-MSCs have been reported to cure diseases, including graft-versus-host disease, arthritis, lupus, and other immune and non-immune disorders.
The current study, led by Yan Pang, MD, and Yang Xiao, MD, PhD, of Guangzhou General Hospital of Guangzhou Military Command in China, is based on their previous data evaluating intravenous administration of MSCs from a related donor in 18 patients with refractory AA.
This earlier data showed that 33% of patients with AA refractory to IST achieved a CR or PR to BM-MSC treatment.
So the team undertook to further investigate the use of BM-MSCs in AA.
Study design
Each of the 74 patients received 4 doses of BM-MSCs over a period of 4 weeks. If patients responded after the first month, they continued to receive 4 doses.
Investigators obtained the BM-MSCs from 74 healthy donors—48 males and 26 females. Forty were related donors, 27 haploidentical donors, and 7 unrelated donors.
Patients with AA by standard criteria had to be 16 years or older, had an incomplete response to antithymocyte globulin (ATG) and cyclosporine for at leas 6 months or cyclosporine alone for at least 12 months, did not have a donor available for bone marrow transplantation, and had at least one of the following: hemoglobin <70 g/L, neutrophilic granulocytes <1 × 10⁹/L, or platelet count <30 × 109/L.
Almost half the patients (47%) were between 20 and 40 years, 54% were male, and 32% had severe aplastic anemia.
Patients’ previous therapy for aplastic anemia included cyclosporine and andriol (65%) cyclosporine and ATG (19%), and cyclosporine (16%).
Patients could continue cyclosporine, but no immunosuppressive agents were permitted.
Fifty-three patients (71.6%) completed 1 course of therapy, and 21 patients (18.4%) completed 2 courses.
Response
At 1 year, the overall response rate was 28.4% (n=21) and the PR rate was 21.6% (n=16).
The median time to a leukocyte response was 19 days (range, 11 – 29), to an erythrocyte response 17 days (range, 12 – 25), and to a megakaryocyte response 31 days (range, 26 – 84).
Ten of the patients with hematologic response had normalization of cellularity for more than 1 year.
The median follow-up among survivors was 17 months (range, 3 – 24). The 2-year overall survival was 87.8%.
Three patients progressed to myelodysplasia, 1 with refractory anemia with excess blasts (RAEB)-I and 2 with RAEB-II.
The median time to progression was 11 months (range, 8 – 12).
Nine patients died, all of whom had severe AA. One patient with RAEB-II died of disease progression, two patients died of intracranial hemorrhage, and six patients died of serious infection.
Safety
Adverse events included grade 1 (n=5) and grade 2 (n=2) fever. Two of these patients also had grade 1 headache.
The investigators observed no other adverse events.
Response predictors
The investigators determined that 2 factors predicted response in patients: prior treatment with antithymocyte globulin (ATG) and absence of infection throughout the treatment.
The odds ratio for patients treated with ATG was 1.41 (95% CI: -0.50, 3.31) and for patients without infection, 2.19 (95% CI: 0.50, 3.87).
“Our study strongly indicates that MSC infusion is a promising therapy for severe AA," Dr Pang said, “but improved MSC cultures in vitro and the MSC doses need further study to maximize their therapeutic potential." ![]()
Supportive parenting program reduced African American teen smoking
Particularly in high-risk populations, participation in a family-centered parenting intervention can reduce adolescent and early adult smoking, according to results of a randomized controlled trial of the Strong African American Families (SAAF) program published in Pediatrics June 14.
African Americans have the “highest mortality rates for coronary heart disease and stroke,” compared with other racial groups, and the high rate of smoking among young adult African Americans is of concern, wrote Yi-fu Chen, PhD, of National Taipei University, New Taipei City, Taiwan, and his coinvestigators.
In a study of 424 African American adolescents from small towns in nine rural counties of southern Georgia, the 257 who were randomized to SAAF at age 11 years overall displayed significantly lower cotinine scores a
The SAAF families each attended seven meetings that consisted of both a separate session for the youth and the parent, and a joint session in which they practiced the skills they learned separately. The parents focused on “consistent provision of instrumental and emotional support, along with high levels of monitoring, consistent discipline that is not harsh, predictable family routines, and the establishment of clear norms and expectations for the use of drugs,” while the youth focused on “the importance of having and abiding by household rules, adaptive behaviors to use when encountering racism, and the importance of forming goals for the future and making plans to attain them,” the researchers explained.
These results “may provide a strategy for reducing health vulnerabilities associated with smoking among African American youth who grow up in challenging rural contexts,” the authors wrote.
Read more in Pediatrics (doi: 10.1542/peds.2016-4162).
FROM PEDIATRICS
The Man With No Medical History
ANSWER
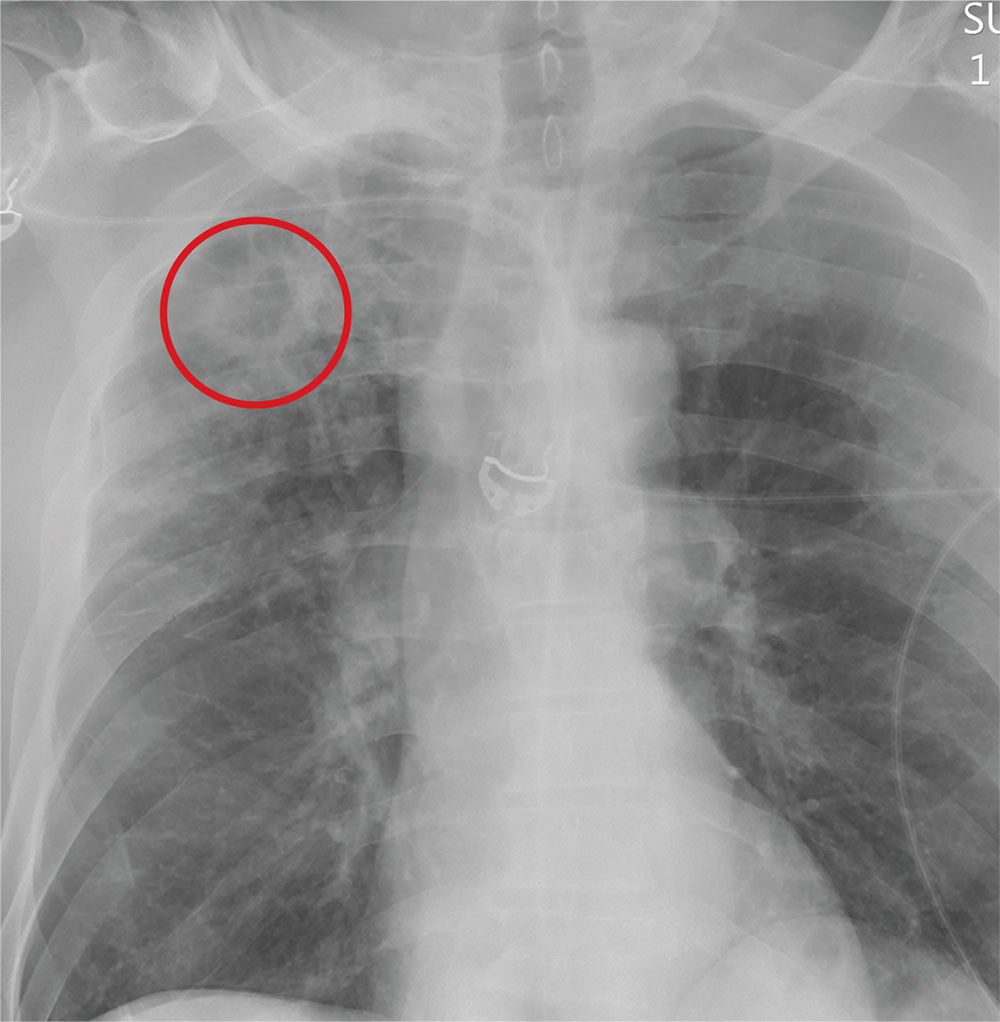
The radiograph demonstrates no acute fractures or pneumothorax. Of note is a right upper lobe infiltrate, which is a rounded cavitary lesion measuring approximately 4 cm. The differential includes pulmonary malignancy, active or previous pulmonary infection (eg, tuberculosis), or pneumatocele. Further evaluation with CT and a pulmonary consultation was coordinated.
ANSWER
The radiograph demonstrates no acute fractures or pneumothorax. Of note is a right upper lobe infiltrate, which is a rounded cavitary lesion measuring approximately 4 cm. The differential includes pulmonary malignancy, active or previous pulmonary infection (eg, tuberculosis), or pneumatocele. Further evaluation with CT and a pulmonary consultation was coordinated.
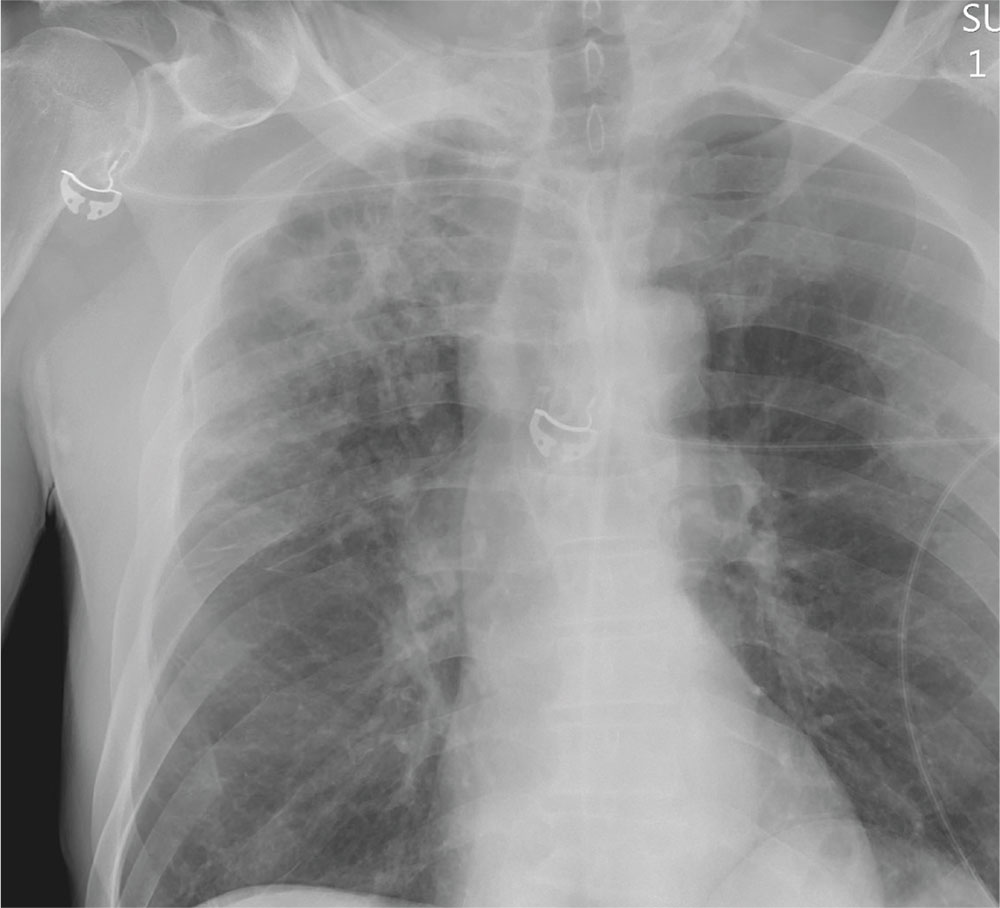
Following a motor vehicle collision, a 60-year-old man is brought to the emergency department via ambulance. He was an unrestrained front-seat passenger in a vehicle that lost control on the roadway and went into a ditch. The patient complains of headache, chest wall pain, and left arm pain. He does not believe he lost consciousness.
He denies any medical history and adds that he does not seek regular medical treatment. He admits to tobacco use and frequent alcohol use.
On physical exam, you note an elderly-appearing male in no obvious distress with a Glasgow Coma Scale score of 15. His vital signs are all within normal limits. Other than slight swelling on the left side of his head, tenderness in the anterior chest wall, and pain in his left humerus, his exam is normal.
You order trauma lab tests and appropriate radiographic studies; a portable chest radiograph is completed (shown). What is your impression?

Endometriosis after menopause: Weigh the treatment risks
VANCOUVER – Endometriosis, while generally considered a premenopausal condition, can also occur in women following surgical or natural menopause, and can undergo malignant transformation, although this risk is likely very small.
That was the main message from a new meta-analysis presented at the World Congress on Endometriosis. “We wanted to synthesize the case reports out there to show some common factors so physicians can be aware of them,” said Laura Gemmell, a second-year medical student at Case Western Reserve University, Cleveland, who presented the research.
The researchers surveyed the literature for studies in postmenopausal women with a confirmed or clinically suspected history of endometriosis, and who discussed the management of their menopausal symptoms. They included 33 case reports and case series (42 patients, 36 surgical menopause, 4 natural, 2 presumed natural with later oophorectomy), as well as 6 observational studies and clinical trials.
In the case reports, patients were on HT for a mean of 7.8 years, and 17 of 42 women experienced a recurrence of endometriosis. Also, 25 women had a malignant transformation and there was some overlap with the recurrence group.
Among 17 patients with recurrence, 6 had “severe” or “extensive” endometriosis, and 14 had surgical menopause, with a mean of 7.1 years between surgical menopause and presentation. Twelve of 17 received unopposed estrogen. Following surgical excision (16 of 17 cases), 10 had symptom regression without relapses.
When the researchers looked at the 25 cases of malignant transformation, they found that 13 women had endometriosis at more than one site, 22 had undergone surgical menopause, 19 were on unopposed estrogen, and the mean duration of HT was 6.7 years. Seven women presented with vaginal bleeding and nine with masses. Three died from the disease. These three women had severe endometriosis complicating factors, including older age and multiple malignancies.
The analysis also included six observational studies and clinical trials that explored recurrence of endometriosis, and whether HT should be given to women with a history of endometriosis, whether it should be given immediately after surgical menopause, and the most appropriate menopause treatments.
Predictably, the evidence could not be summed up neatly, but Ms. Gemmell emphasized the need to individually weigh the risks and benefits of HT in each patient, with consideration of characteristics such as age, previous disease severity, family history, comorbidities, and body mass index.
She also suggested that patients should be active participants in decision making.
Finally, if the decision is to go forward or continue with HT, she suggested that clinicians consider a combined treatment rather than estrogen-only, though she pointed out the increased risk for breast cancer that this presents.
Tommaso Falcone, MD, chairman of obstetrics and gynecology at the Cleveland Clinic, sounded a note of caution about the use of progestins during the question-and-answer session. “The data are not strong that it actually prevents the development of cancer in the residual disease, if there is any. Even if you take the hypothesis that progestins are going to prevent cancer of residual disease, which is a low-level risk, the main worry that women have is breast cancer, and progestin is strongly associated with breast cancer,” Dr. Falcone said in an interview.
Ms. Gemmell and Dr. Falcone reported having no financial disclosures.
EXPERT ANALYSIS AT WCE 2017
Maryland passes generic drug anti–price gouging law
Maryland has become the first state to prohibit unreasonable price increases on essential off-patent or generic drugs.
The anti–price gouging law authorizes Maryland’s Attorney General to take legal action against manufacturers or distributors that raise drug prices in noncompetitive drug markets if the firms can’t prove the legitimacy of their price increases. Companies could face a civil penalty of up to $10,000 for each violation, according to the law, which goes into effect in October.
Stephen Rockower, MD, president of MedChi, the Maryland State Medical Society, said the medical society has long supported the bill and hailed its passage as beneficial for doctors and their patients.
“It’s been a long time coming,” Dr. Rockower said in an interview. “There have been lots of problems with the huge rising costs of drugs. Manufacturers and pharmacy benefit managers are completely uncontrolled in terms of their pricing. [With this law], we’ll be able to take care of our patients better. It’s hard to prescribe things if it’s going to cost patients $700 a day [for] a drug that used to cost $5 a day. Patients have to be able to afford their medicine, or they don’t take it.”

Chester “Chip” Davis, Jr. president and CEO of the Association for Accessible Medicines, a trade association for manufacturers and distributors of generic drugs, criticized the law.
“By giving the Attorney General unbounded and unprecedented authority to control pricing in a competitive free market, generic companies will be exposed to a level of risk in Maryland that will require them to evaluate whether they want to continue to market affordable medicines within the state,” Mr. Davis said in a statement. “One day, in the not too distant future, [Maryland lawmakers] should be prepared to defend why Maryland was the first state to lead the nation in creating less market-based competition, higher overall prescription drug costs, while also simultaneously increasing the risk of future drug shortages for Maryland’s patients.”
The law has two provisions. It prevents a generic drug manufacturer or wholesale distributor from engaging in price gouging in the sale of an essential off-patent or generic drug, defined as a prescription drug that no longer has market exclusivity and has been designated as essential for treating a life-threatening or chronic health condition by the Maryland Secretary of Health and Mental Hygiene, is actively marketed in the United States by three or fewer manufacturers, and is available for sale in Maryland.
The law also authorizes the Maryland Medical Assistance Program to notify the Attorney General of a price increase when the wholesale acquisition cost of a prescription drug increases by at least 50% in a given year for medications that cost more than $80 per 30-day course.
This first-of-its-kind law is a way to deter manufacturers from exploiting noncompetitive drug markets for short-term profit through unconscionable behavior that “imperils public health and individual welfare,” according to Jeremy A. Greene, MD, PhD, and William V. Padula, PhD.
“Perhaps, [the law will] help reestablish public trust in U.S. policy’s balancing of innovation and access, by reaffirming that older drugs of proven value should be accessible and subject to competition so that they are priced as the commodities they’ve become,” the authors wrote in a perspective published in the New England Journal of Medicine (doi: 10.1056/NEJMp1704907).
Maryland’s law is part of a growing movement among states to address unreasonable pricing spikes in prescription drugs, noted Dr. Greene and Dr. Padula, both of Johns Hopkins University in Baltimore. In April, Louisiana health officials requested feedback about the possibility of invoking an obscure U.S. patent and copyright law to ensure better affordability of hepatitis drugs. In May, the Nevada Senate passed a bill that would force drug makers to publish the list prices they set and the profits they make on insulin, as well as the amount of insulin discounts they give third parties. Additional pharmaceutical price-transparency laws have been proposed in 16 states and Puerto Rico.

“My first concern relates to the provisions of the legislation which directly regulate interstate commerce and pricing by prohibiting and penalizing manufacturer pricing which may occur outside of Maryland,” Gov. Hogan wrote. “These provisions would likely violate the dormant commerce clause of the Constitution. I am also concerned that the definition of ‘unconscionable increase’ and ‘excessive’ are vague, and would likely not stand a ‘vagueness challenge’ under the procedural due process concepts of the 14th Amendment.”
Gov. Hogan added that he is not convinced that the legislation is a solution to Marylanders having better access to medications and that the law may even have the unintended consequences of harming patients by restricting drug access.
[email protected]
On Twitter @legal_med
Maryland has become the first state to prohibit unreasonable price increases on essential off-patent or generic drugs.
The anti–price gouging law authorizes Maryland’s Attorney General to take legal action against manufacturers or distributors that raise drug prices in noncompetitive drug markets if the firms can’t prove the legitimacy of their price increases. Companies could face a civil penalty of up to $10,000 for each violation, according to the law, which goes into effect in October.
Stephen Rockower, MD, president of MedChi, the Maryland State Medical Society, said the medical society has long supported the bill and hailed its passage as beneficial for doctors and their patients.
“It’s been a long time coming,” Dr. Rockower said in an interview. “There have been lots of problems with the huge rising costs of drugs. Manufacturers and pharmacy benefit managers are completely uncontrolled in terms of their pricing. [With this law], we’ll be able to take care of our patients better. It’s hard to prescribe things if it’s going to cost patients $700 a day [for] a drug that used to cost $5 a day. Patients have to be able to afford their medicine, or they don’t take it.”
Chester “Chip” Davis, Jr. president and CEO of the Association for Accessible Medicines, a trade association for manufacturers and distributors of generic drugs, criticized the law.
“By giving the Attorney General unbounded and unprecedented authority to control pricing in a competitive free market, generic companies will be exposed to a level of risk in Maryland that will require them to evaluate whether they want to continue to market affordable medicines within the state,” Mr. Davis said in a statement. “One day, in the not too distant future, [Maryland lawmakers] should be prepared to defend why Maryland was the first state to lead the nation in creating less market-based competition, higher overall prescription drug costs, while also simultaneously increasing the risk of future drug shortages for Maryland’s patients.”
The law has two provisions. It prevents a generic drug manufacturer or wholesale distributor from engaging in price gouging in the sale of an essential off-patent or generic drug, defined as a prescription drug that no longer has market exclusivity and has been designated as essential for treating a life-threatening or chronic health condition by the Maryland Secretary of Health and Mental Hygiene, is actively marketed in the United States by three or fewer manufacturers, and is available for sale in Maryland.
The law also authorizes the Maryland Medical Assistance Program to notify the Attorney General of a price increase when the wholesale acquisition cost of a prescription drug increases by at least 50% in a given year for medications that cost more than $80 per 30-day course.
This first-of-its-kind law is a way to deter manufacturers from exploiting noncompetitive drug markets for short-term profit through unconscionable behavior that “imperils public health and individual welfare,” according to Jeremy A. Greene, MD, PhD, and William V. Padula, PhD.
“Perhaps, [the law will] help reestablish public trust in U.S. policy’s balancing of innovation and access, by reaffirming that older drugs of proven value should be accessible and subject to competition so that they are priced as the commodities they’ve become,” the authors wrote in a perspective published in the New England Journal of Medicine (doi: 10.1056/NEJMp1704907).
Maryland’s law is part of a growing movement among states to address unreasonable pricing spikes in prescription drugs, noted Dr. Greene and Dr. Padula, both of Johns Hopkins University in Baltimore. In April, Louisiana health officials requested feedback about the possibility of invoking an obscure U.S. patent and copyright law to ensure better affordability of hepatitis drugs. In May, the Nevada Senate passed a bill that would force drug makers to publish the list prices they set and the profits they make on insulin, as well as the amount of insulin discounts they give third parties. Additional pharmaceutical price-transparency laws have been proposed in 16 states and Puerto Rico.
“My first concern relates to the provisions of the legislation which directly regulate interstate commerce and pricing by prohibiting and penalizing manufacturer pricing which may occur outside of Maryland,” Gov. Hogan wrote. “These provisions would likely violate the dormant commerce clause of the Constitution. I am also concerned that the definition of ‘unconscionable increase’ and ‘excessive’ are vague, and would likely not stand a ‘vagueness challenge’ under the procedural due process concepts of the 14th Amendment.”
Gov. Hogan added that he is not convinced that the legislation is a solution to Marylanders having better access to medications and that the law may even have the unintended consequences of harming patients by restricting drug access.
[email protected]
On Twitter @legal_med
Elastrographic ultrasound could guide adenomyosis treatment
VANCOUVER – Transvaginal elastrographic (TVEG) ultrasound appears to be a better way to diagnose adenomyosis, outperforming transvaginal ultrasound in identifying lesions, according to new findings.
Researchers at Fudan University in Shanghai compared TVEG results in 152 women with adenomyosis, 89 women with fibroids, and 136 healthy controls. None of the women had received hormone therapy in the previous 6 months. Imaging was performed with both TVEG and transvaginal ultrasound, and tissue samples were taken to test for estrogen receptor (ER)-beta, progesterone receptor (PR), epithelial cadherin, and alpha–smooth muscle actin (SMA).
Image analysis showed that TVEG readily distinguished adenomyosis from fibroids or normal uterine tissue. The elastic value, representing stiffness, was highest in adenomyosis patients (3.74 plus or minus 1.01, P less than .001), followed by fibrosis (2.87 plus or minus 0.74; P less than .001), and normal tissue (1.43 plus or minus 0.59).
Elastic values correlated positively to the extent of fibrosis (r = 0.91; P less than .001), and staining levels of alpha-SMA and ER-beta (r = 0.84; P less than .001). Elasticity correlated negatively with epithelial cadherin and PR (r = –0.86; P less than .001).
The researchers concluded that TVEG outperforms transvaginal ultrasound in diagnosing adenomyosis, and that the close correlation between measurements of stiffness and fibrosis and hormone response markers suggests that it could one day help physicians choose between hormone therapy and hysterectomy.
“If we find more elastic values, maybe that means there is more fibrosis in the lesion, and it may be not as sensitive to hormone treatment, so maybe we should move on to hysterectomy,” Ding Ding, MD, PhD, associate professor of gynecology at Fudan University, said at the World Congress on Endometriosis.
But the current research does not provide those answers yet, since the elastic values weren’t linked to a clinical outcome. “We want to verify in the next step, in women who have higher elastic values, whether they are sensitive to progesterone treatment,” Dr. Ding said.
The study was sponsored by the Chinese government. Dr. Ding reported having no financial disclosures.
AT WCE 2017
Key clinical point:
Major finding: Elastic values correlated with fibrosis (r = 0.91), alpha-SMA and ER-beta (r = 0.84), and epithelial cadherin and PR (r = –0.86).
Data source: Prospective case-controlled study of 152 women with adenomyosis, 89 with fibroids, and 136 controls.
Disclosures: The study was sponsored by the Chinese government. Dr. Ding reported having no financial disclosures.
This month in CHEST: Editor’s picks
Giants in Chest MedicineKarlman Wasserman, MD, PhD, FCCP. By Dr. T. Kisaka, et al.
Original ResearchHydrocortisone, Vitamin C, and Thiamine for the Treatment of Severe Sepsis and Septic Shock: A Retrospective Before-After Study. By Dr. P. Marik, et al.

Quantitative CT Measures of Bronchiectasis in Smokers. By Dr. A. A. Diaz, et al.
Giants in Chest MedicineKarlman Wasserman, MD, PhD, FCCP. By Dr. T. Kisaka, et al.
Original ResearchHydrocortisone, Vitamin C, and Thiamine for the Treatment of Severe Sepsis and Septic Shock: A Retrospective Before-After Study. By Dr. P. Marik, et al.
Quantitative CT Measures of Bronchiectasis in Smokers. By Dr. A. A. Diaz, et al.

ABIM Internal Medicine Summit
On April 7, four members of CHEST staff and leadership, along with staff and leadership from other medical specialty societies, participated in the Internal Medicine Summit, hosted by the American Board of Internal Medicine, in Philadelphia. The meeting covered an array of topics related to certification and maintenance of certification (MOC), including the alternative assessment model announced in December 2016, quality improvement (QI) as part of MOC, and practicing medicine in an ever-changing political landscape.
The meeting began with Dr. Richard Baron, President and CEO of the ABIM, explaining how the notion of certification has changed over the years. According to Dr. Baron, the concept of lifetime certification no longer makes sense in the rapidly changing field of medicine. As part of the evolution of certification, the ABIM has moved away from “rules to follow” toward something, co-created with societies, that is more relevant and less burdensome. This shift includes aligning certification and MOC requirements with things physicians are already required to do by their states and institutions. Dr. Baron also stressed that in today’s cultural and political landscape, along with the prevalence of “fake news,” the need for trust in the doctor-patient relationship is increasing; trust is no longer a “given.” Therefore, in an age when credentials can be purchased online, there’s an increasing need for an external certification to build trust and boost credibility.
Dr. Marianne Green, member of the ABIM Board of Directors and the ABIM Council, gave an update on the recertification assessment options. While currently, only an every 2-year assessment option will be offered as an alternative to a 10-year higher stakes exam, the ABIM is looking to partner with societies to deliver education, based on the needs identified via the assessment. Furthermore, in addition to partnering with societies to address the identified knowledge gaps, the ABIM plans to collaborate with societies in future alternatives to both the 2-year and 10-year assessments, with the shared goal of “maintenance and support of a community of life-long learners who hold ourselves accountable to peer-defined standards.” Initially, the 2-year lower stakes assessment will cover the breadth of the knowledge in the specialty/subspecialty, but the ABIM is committed to taking a more modular approach in the future. When asked about the fee structure for the new assessment options, Dr. Green communicated that details regarding fees would be announced in fall 2017.
While the first part of the meeting focused on MOC Part 2, the conversation turned toward quality improvement, or QI, later part of the meeting. The practice improvement, or MOC Part 4, requirement is on hold through the end of 2018. Both the ABIM and represented societies value the importance of quality measures. Dr. Graham McMahon, president and CEO of Accreditation Council for Continuing Medical Education (ACCME), laid the framework for QI as being “activities that address a quality or safety gap with interventions intended to result in improvement and with specific, measurable goals. QI activities are learner-driven, as learner engagement is a key target of ACCME’s standard. Representatives from the Heart Rhythm Society, the Society of Hospital Medicine, the Arthritis Foundation, and the American College of Rheumatology shared their organization’s initiatives related to QI.
Apart from the focus on certification and MOC, the meeting also focused on the needs arising from a changing political world, including what is at stake with the repeal of the Affordable Care Act (ACA) and the challenges arising with the wide dissemination of questionable news and the general disregard of science. Stephen Welch, CHEST EVP/CEO, participated in a panel entitled “Practicing Medicine in a Fact-Free World.” He, along with other media professionals, discussed the challenges that physicians, patients, and physician educators encounter in a time when false facts are published as truth and information is sensationalized to attract more attention.
Since the meeting, CHEST leadership sent a letter to the ABIM leadership noting a desire to be one of the societies with whom the ABIM collaborates for both alternative assessment methods and the open-book resources selected. Additionally, CHEST expressed interest in receiving the data that are culled from the assessments, an interest aligned with CHEST’s current data analytics initiatives. CHEST will continue to collaborate with the ABIM to ensure CHEST members’ needs are represented and prioritized in future discussions.
Learn What’s New at CHEST Annual Meeting 2017
We’ve listened and considered all of your feedback to enhance your experience at CHEST 2017, Oct 28-Nov 1, Toronto, Canada. This year, we have changed the format of our postgraduate courses, updated our interdisciplinary sessions, and added new ways to register. Take a look at what’s new.
Postgraduate courses
New this year at CHEST 2017 is the option to attend a half-day or full-day course for a more flexible experience. There are nine, half-day sessions that include lunch, and the afternoon sessions allow people to fly in that morning to avoid an extra hotel night and missing work.
Interdisciplinary sessions

These sessions are free but require a ticket.
Monday, October 30
- The State of PAH in 2017: An Update on the Science, New Therapies, and the Changing Treatment Algorithm
- Critical Skills for ICU Directors and Their Leadership Team
- Interstitial Lung Disease: 2017 Update on Patient-Centered Management
- Lung Cancer: 2017 Update in Diagnosis and Management
Tuesday, October 31
- Challenges in ICU Management
Wednesday, November 1
- Enhancing Quality of Pulmonary Rehabilitation Programs and Integrated COPD Disease Management
Don’t forget to register for CHEST 2017!
You can now register as a group! Ten or more health-care professionals from your team can register as a group for discounted tuition rates. Group registration is open through October 22 and will not be offered on-site. Learn more about CHEST 2017 updates and how to register at chestmeeting.chestnet.org.
We’ve listened and considered all of your feedback to enhance your experience at CHEST 2017, Oct 28-Nov 1, Toronto, Canada. This year, we have changed the format of our postgraduate courses, updated our interdisciplinary sessions, and added new ways to register. Take a look at what’s new.
Postgraduate courses
New this year at CHEST 2017 is the option to attend a half-day or full-day course for a more flexible experience. There are nine, half-day sessions that include lunch, and the afternoon sessions allow people to fly in that morning to avoid an extra hotel night and missing work.
Interdisciplinary sessions
These sessions are free but require a ticket.
Monday, October 30
- The State of PAH in 2017: An Update on the Science, New Therapies, and the Changing Treatment Algorithm
- Critical Skills for ICU Directors and Their Leadership Team
- Interstitial Lung Disease: 2017 Update on Patient-Centered Management
- Lung Cancer: 2017 Update in Diagnosis and Management
Tuesday, October 31
- Challenges in ICU Management
Wednesday, November 1
- Enhancing Quality of Pulmonary Rehabilitation Programs and Integrated COPD Disease Management
Don’t forget to register for CHEST 2017!
You can now register as a group! Ten or more health-care professionals from your team can register as a group for discounted tuition rates. Group registration is open through October 22 and will not be offered on-site. Learn more about CHEST 2017 updates and how to register at chestmeeting.chestnet.org.