User login
Cognitive declines tied to stress in older African Americans
Higher levels of perceived stress appear to be associated with faster declines in two cognitive domains – episodic memory and visuospatial ability – among older African Americans without dementia, results from a longitudinal study of 467 participants suggest.
“To our knowledge, this is the first study to examine the relationship between perceived stress and cognition in specific cognitive domains in general and in a minority population in particular,” reported Arlener D. Turner, PhD, of the Rush Alzheimer’s Disease Center and the department of behavioral sciences at Rush University, Chicago, and her associates.
Each participant took a battery of neuropsychological tests, including the MMSE, annually for up to 9 years. The participants’ stress levels were assessed using a 4-item version of Cohen’s Perceived Stress Scale (PSS), “an index of the degree to which a person finds their lives unpredictable, uncontrollable, and overloading – characteristics central to the evaluation of stress” (Am J Geriatr Psychiatry. 2017;25[1]:25-34).
Dr. Turner and her associates found that participants with a mean age and education level, and a PSS score 1 point above the mean experienced annual declines in episodic memory of 0.022 points (P = .047) and in visuospatial ability of 0.021 points (P = .017). No such associations were found for semantic or working memory or for perceptual speed.
The investigators said that the study did not pinpoint the mechanisms that link stress to cognition. “The well-established mechanism of hypothalamic-pituitary-adrenal-axis dysregulation in chronic stress may play a role,” they wrote. Another contributing factor could be inflammation, they said, citing research showing that discrimination is “a persistent stressor in African Americans and that perceived discrimination is associated with elevated levels of C-reactive protein.” Future studies are needed, they said, to test which mechanisms might be pathways between perceived stress and cognitive decline.
They cited several limitations. For example, because less educational attainment is associated with higher levels of stress and this cohort had achieved educational levels that were relatively high, this cohort’s reports of perceived stress might have been modest. In addition, “perception of stress is, by nature, a self-report measure,” the investigators wrote.
The National Institute on Aging and the Illinois Department of Public Health funded the study. Neither Dr. Turner nor her associates had any conflicts of interest.
[email protected]
On Twitter @ginahenderson
FROM THE AMERICAN JOURNAL OF GERIATRIC PSYCHIATRY
Key clinical point:
Major finding: Participants with a mean age of 73.4 years and education level of 15 years and a score 1 point above the mean on Cohen’s Perceived Stress Scale experienced annual declines in episodic memory of 0.022 points (P = .047) and in visuospatial ability of 0.021 points (P = .017).
Data source: An analysis of 467 African Americans enrolled in the longitudinal Minority Aging Research Study.
Disclosures: The National Institute on Aging and the Illinois Department of Public Health funded the study. Neither Dr. Turner nor her associates had any conflicts of interest.
Low-fat diet reduces risk of death if breast cancer is diagnosed
Women can reduce their risk of dying should they receive a breast cancer diagnosis by following a low-fat diet, suggests an analysis from the phase III multicenter randomized Women’s Health Initiative Dietary Modification trial.
Investigators led by Rowan T. Chlebowski, MD, PhD, formerly of the Los Angeles Biomedical Research Institute at Harbor-UCLA Medical Center, Torrance, California, and now at City of Hope National Medical Center, Duarte, California, analyzed data from 48,835 postmenopausal women who had never had breast cancer and had normal mammograms. The women were randomly assigned 2:3 to a diet aimed at reducing fat intake to 20% of energy and increasing intake of fruits, vegetables, and grains or to a usual diet.

However, the rate of deaths after breast cancer from any cause was 0.025% per year in the former group and 0.038% per year in the latter group, a difference that translated to a more than one-third reduction in risk (hazard ratio, 0.65; P = .02).
Similarly, during the median 16.1-year total follow-up, the rate of deaths attributed to breast cancer was 0.035% per year in the low-fat diet group and 0.039% per year in the usual diet group, a difference that was not significant (P =. 41). However, the rate of deaths after breast cancer from any cause was 0.085% per year in the former group and 0.11% per year in the latter group, a difference that translated to a nearly one-fifth reduction in the risk of death (HR, 0.82; P = .01).
In subgroup analyses, there were significant interactions whereby benefit was greater for women who had a baseline waist circumference of at least 88 cm and increased with the baseline percentage of total energy from fat.
“The lower risk of poor prognosis, ER+, PR– breast cancers … in the dietary group contributed to the favorable dietary effect on death after breast cancer,” the investigators noted. “An additional factor that potentially influenced deaths after breast cancer could be a favorable dietary influence on mortality as a result of other causes, including cardiovascular disease.”
“Future studies of other lifestyle interventions on breast cancer incidence and outcome could incorporate some form of a low-fat dietary pattern as a base,” they concluded.
Women can reduce their risk of dying should they receive a breast cancer diagnosis by following a low-fat diet, suggests an analysis from the phase III multicenter randomized Women’s Health Initiative Dietary Modification trial.
Investigators led by Rowan T. Chlebowski, MD, PhD, formerly of the Los Angeles Biomedical Research Institute at Harbor-UCLA Medical Center, Torrance, California, and now at City of Hope National Medical Center, Duarte, California, analyzed data from 48,835 postmenopausal women who had never had breast cancer and had normal mammograms. The women were randomly assigned 2:3 to a diet aimed at reducing fat intake to 20% of energy and increasing intake of fruits, vegetables, and grains or to a usual diet.
However, the rate of deaths after breast cancer from any cause was 0.025% per year in the former group and 0.038% per year in the latter group, a difference that translated to a more than one-third reduction in risk (hazard ratio, 0.65; P = .02).
Similarly, during the median 16.1-year total follow-up, the rate of deaths attributed to breast cancer was 0.035% per year in the low-fat diet group and 0.039% per year in the usual diet group, a difference that was not significant (P =. 41). However, the rate of deaths after breast cancer from any cause was 0.085% per year in the former group and 0.11% per year in the latter group, a difference that translated to a nearly one-fifth reduction in the risk of death (HR, 0.82; P = .01).
In subgroup analyses, there were significant interactions whereby benefit was greater for women who had a baseline waist circumference of at least 88 cm and increased with the baseline percentage of total energy from fat.
“The lower risk of poor prognosis, ER+, PR– breast cancers … in the dietary group contributed to the favorable dietary effect on death after breast cancer,” the investigators noted. “An additional factor that potentially influenced deaths after breast cancer could be a favorable dietary influence on mortality as a result of other causes, including cardiovascular disease.”
“Future studies of other lifestyle interventions on breast cancer incidence and outcome could incorporate some form of a low-fat dietary pattern as a base,” they concluded.
FROM THE JOURNAL OF CLINICAL ONCOLOGY
Key clinical point:
Major finding: Compared with peers assigned to a usual diet, women assigned to a low-fat diet were less likely to die after breast cancer diagnosis from any cause during both the 8.5-year intervention (HR 0.65) and the 16.1-year total follow-up (HR, 0.82).
Data source: A posthoc analysis of a phase III randomized controlled trial among 48,835 postmenopausal women who had never had breast cancer and had normal mammograms (Women’s Health Initiative Dietary Modification trial).
Disclosures: Dr. Chlebowski disclosed consulting or advisory roles with Novartis, Genentech, Amgen, Pfizer, and AstraZeneca. He is also on the Speakers’ Bureau for Novartis and Genentech.
Phototherapy Coding and Documentation in the Time of Biologics
In this era of biologics for psoriasis with ever-increasing effectiveness and safety as well as patients who have less and less time to visit the physician's office, it would seem that the days of in-office UV treatments would be numbered. However, rumors of the demise of phototherapy may be greatly exaggerated. Phototherapy is still one of the safest and most cost-effective treatments for psoriasis and other dermatoses.1 Its use often is a prerequisite for biologic therapy, and it may be the only therapeutic option for certain subsets of patients, such as children, pregnant women, and immunosuppressed patients. Moreover, narrowband UVB technology has breathed new life into phototherapy, with better efficacy and less long-term risk. Although the utilization of psoralen plus UVA (PUVA) light therapy has indeed decreased over the last 2 decades, the use of UVB therapies continues to increase dramatically.2
Phototherapy Codes
There are 4 chief Current Procedural Terminology (CPT) codes for reporting phototherapy services: (1) 96900: actinotherapy (UV light treatment); (2) 96910: photochemotherapy, tar, and UVB (Goeckerman treatment) or petrolatum and UVB; (3) 96912: photochemotherapy and PUVA; and (4) 96913: photochemotherapy (Goeckerman and/or PUVA) for severe photoresponsive dermatoses requiring at least 4 to 8 hours of care under direct supervision of the physician.3
There is lack of specificity of the CPT code descriptions for phototherapy. Moreover, insurer guidance for documentation for phototherapy is vague to nonexistent, and of course whenever the use of any medical service increases, insurer scrutiny is sure to follow. Therefore, it is not surprising that dermatology practices have reported that private insurers as well as Medicare are auditing medical records for phototherapy treatments.4 In fact, recently we have seen a Midwest private insurer demand payment from dermatologists for hundreds of 96910 phototherapy services, which the insurer asserted should have been coded as 96900 because topical therapies were not applied by the dermatology staff. The insurer did not just evaluate medical records but also contacted patients directly and asked how services had been provided. Clearly, more detailed guidance for dermatologists and insurers on documentation and performance standards for each phototherapy service is needed.
Existing coding guidance for phototherapy indicates that actinotherapy (96900) defines the basic service of treating a patient with a UV light unit.5 Actinotherapy does not involve application of topical medications while the patient is in the office.
In contrast, photochemotherapy (96910) implies addition of a chemo agent to phototherapy. Despite the somewhat nonspecific nature of the code descriptor, it is apparent that application of photoenhancing agents such as tar, petrolatum, or distillates of petrolatum meet the requirements of 96910. The Coder's Desk Reference for Procedures 2017 describes 96910 as "the physician uses photosensitizing chemicals and light rays to treat skin ailments."6 Application of light-enhancing topical products should occur within the office by either staff or the patient. In fact, examination of practice expense data from the Centers for Medicare & Medicaid Services indicated that the 96910 code includes payment for clinical staff time to apply topical products as well as the cost of the topical agent(s).7
The PUVA code 96912 is defined by the use of photosensitizing psoralen medication, which can be administered topically or orally, followed by UVA treatment. In my experience, PUVA has similar performance standards with in-office application of psoralen, if applicable. If application of topical photoenhancing products occurs outside the office, the requirements of photochemotherapy are not met, and 96900 should be reported.
The 96913 code defines prolonged phototherapy service with intensive topical therapy requirements and multiple phototherapy sessions per day.3 This code is rarely reported (average of fewer than 100 times in the Medicare population per year), and most insurers do not reimburse this service.
Protecting Yourself From an Audit
In my experience, review of private insurer audits of phototherapy services has yielded important lessons. First, having a written standard operating procedure in place regarding the performance of phototherapy services and how application of topicals will be handled has been helpful in audit defense. The other key to beating audits for phototherapy services is to have detailed documentation or a flowchart in the medical record regarding the topical agent and the light administration. The medical record should include what topical agent was applied, if any; whether the topical agent was applied in the office; where the topical product was applied; and who applied the topical product. Sometimes topical product application by a physician or staff is not feasible because of patient preference or the site of application. If the patient applied the topical, document that assistance was offered and refused, along with what type of UV light was used and the dosage. Inclusion of these elements in the medical record provides a clear picture of the delivery of the phototherapy service and will aid in responding to medical record audit.
Final Thoughts
Phototherapy is a critical treatment modality that continues to be utilized frequently in the expanding armamentarium of treatments for dermatoses. Phototherapy is performed almost exclusively by dermatologists and allows dermatologists to offer a unique level of care and value in the treatment of skin disease. Careful documentation, a written standard operating procedure, and adherence to proper performance standards will allow dermatologists to be compensated fairly for this important treatment modality and pass audits that are likely to occur.
- Lapolla W, Yentzer BA, Bagel J, et al. A review of phototherapy protocols for psoriasis treatment. J Am Acad Dermatol. 2011;64:936-949.
- Simpson GL, Yelverton CB, Rittenberg S, et al. Do utilization management controls for phototherapy increase the prescription of biologics? J Dermatolog Treat. 2006;17:359-361.
- Current Procedural Terminology 2017, Professional Edition. Chicago IL: American Medical Association; 2016.
- American Academy of Dermatology Association. Insurers review billing for photochemotherapy (CPT 96910). Derm Coding Consult. Spring 2009;13:4.
- American Academy of Dermatology Association. Coding Q&A's. Derm Coding Consult. Spring 2007;11:5, 7, 8.
- Coders' Desk Reference for Procedures 2017. Chicago, IL: Optum360; 2017.
- Relative Value Scale Update Committee Database. Chicago, IL: American Medical Association; 2016.
In this era of biologics for psoriasis with ever-increasing effectiveness and safety as well as patients who have less and less time to visit the physician's office, it would seem that the days of in-office UV treatments would be numbered. However, rumors of the demise of phototherapy may be greatly exaggerated. Phototherapy is still one of the safest and most cost-effective treatments for psoriasis and other dermatoses.1 Its use often is a prerequisite for biologic therapy, and it may be the only therapeutic option for certain subsets of patients, such as children, pregnant women, and immunosuppressed patients. Moreover, narrowband UVB technology has breathed new life into phototherapy, with better efficacy and less long-term risk. Although the utilization of psoralen plus UVA (PUVA) light therapy has indeed decreased over the last 2 decades, the use of UVB therapies continues to increase dramatically.2
Phototherapy Codes
There are 4 chief Current Procedural Terminology (CPT) codes for reporting phototherapy services: (1) 96900: actinotherapy (UV light treatment); (2) 96910: photochemotherapy, tar, and UVB (Goeckerman treatment) or petrolatum and UVB; (3) 96912: photochemotherapy and PUVA; and (4) 96913: photochemotherapy (Goeckerman and/or PUVA) for severe photoresponsive dermatoses requiring at least 4 to 8 hours of care under direct supervision of the physician.3
There is lack of specificity of the CPT code descriptions for phototherapy. Moreover, insurer guidance for documentation for phototherapy is vague to nonexistent, and of course whenever the use of any medical service increases, insurer scrutiny is sure to follow. Therefore, it is not surprising that dermatology practices have reported that private insurers as well as Medicare are auditing medical records for phototherapy treatments.4 In fact, recently we have seen a Midwest private insurer demand payment from dermatologists for hundreds of 96910 phototherapy services, which the insurer asserted should have been coded as 96900 because topical therapies were not applied by the dermatology staff. The insurer did not just evaluate medical records but also contacted patients directly and asked how services had been provided. Clearly, more detailed guidance for dermatologists and insurers on documentation and performance standards for each phototherapy service is needed.
Existing coding guidance for phototherapy indicates that actinotherapy (96900) defines the basic service of treating a patient with a UV light unit.5 Actinotherapy does not involve application of topical medications while the patient is in the office.
In contrast, photochemotherapy (96910) implies addition of a chemo agent to phototherapy. Despite the somewhat nonspecific nature of the code descriptor, it is apparent that application of photoenhancing agents such as tar, petrolatum, or distillates of petrolatum meet the requirements of 96910. The Coder's Desk Reference for Procedures 2017 describes 96910 as "the physician uses photosensitizing chemicals and light rays to treat skin ailments."6 Application of light-enhancing topical products should occur within the office by either staff or the patient. In fact, examination of practice expense data from the Centers for Medicare & Medicaid Services indicated that the 96910 code includes payment for clinical staff time to apply topical products as well as the cost of the topical agent(s).7
The PUVA code 96912 is defined by the use of photosensitizing psoralen medication, which can be administered topically or orally, followed by UVA treatment. In my experience, PUVA has similar performance standards with in-office application of psoralen, if applicable. If application of topical photoenhancing products occurs outside the office, the requirements of photochemotherapy are not met, and 96900 should be reported.
The 96913 code defines prolonged phototherapy service with intensive topical therapy requirements and multiple phototherapy sessions per day.3 This code is rarely reported (average of fewer than 100 times in the Medicare population per year), and most insurers do not reimburse this service.
Protecting Yourself From an Audit
In my experience, review of private insurer audits of phototherapy services has yielded important lessons. First, having a written standard operating procedure in place regarding the performance of phototherapy services and how application of topicals will be handled has been helpful in audit defense. The other key to beating audits for phototherapy services is to have detailed documentation or a flowchart in the medical record regarding the topical agent and the light administration. The medical record should include what topical agent was applied, if any; whether the topical agent was applied in the office; where the topical product was applied; and who applied the topical product. Sometimes topical product application by a physician or staff is not feasible because of patient preference or the site of application. If the patient applied the topical, document that assistance was offered and refused, along with what type of UV light was used and the dosage. Inclusion of these elements in the medical record provides a clear picture of the delivery of the phototherapy service and will aid in responding to medical record audit.
Final Thoughts
Phototherapy is a critical treatment modality that continues to be utilized frequently in the expanding armamentarium of treatments for dermatoses. Phototherapy is performed almost exclusively by dermatologists and allows dermatologists to offer a unique level of care and value in the treatment of skin disease. Careful documentation, a written standard operating procedure, and adherence to proper performance standards will allow dermatologists to be compensated fairly for this important treatment modality and pass audits that are likely to occur.
- Lapolla W, Yentzer BA, Bagel J, et al. A review of phototherapy protocols for psoriasis treatment. J Am Acad Dermatol. 2011;64:936-949.
- Simpson GL, Yelverton CB, Rittenberg S, et al. Do utilization management controls for phototherapy increase the prescription of biologics? J Dermatolog Treat. 2006;17:359-361.
- Current Procedural Terminology 2017, Professional Edition. Chicago IL: American Medical Association; 2016.
- American Academy of Dermatology Association. Insurers review billing for photochemotherapy (CPT 96910). Derm Coding Consult. Spring 2009;13:4.
- American Academy of Dermatology Association. Coding Q&A's. Derm Coding Consult. Spring 2007;11:5, 7, 8.
- Coders' Desk Reference for Procedures 2017. Chicago, IL: Optum360; 2017.
- Relative Value Scale Update Committee Database. Chicago, IL: American Medical Association; 2016.

How to raise HPV vaccine rates: Work together
Despite widespread availability of the human papillomavirus vaccine over the last 11 years, vaccination rates continue to lag behind national targets and are far behind other vaccines routinely administered in adolescence, such as the meningococcal and tetanus vaccines.
Better collaboration among pediatricians and obstetrician-gynecologists to promote the HPV vaccine may be one answer to turning the tide, said David W. Kimberlin, MD, codirector of the division of pediatric infectious diseases at the University of Alabama at Birmingham and president of the Pediatric Infectious Diseases Society.

As of 2015, just 63% of eligible U.S. girls completed the first dose of the HPV vaccination, 52% completed two doses, and 42% finished the three-dose series, according to a recent “Call to Action” paper in the American Journal of Obstetrics and Gynecology (doi: 10.1016/j.ajog.2017.02.026). Although the HPV vaccine has been recommended for boys since 2011, just half of eligible boys completed the first dose, 39% completed two doses, and 28% finished the full series. By contrast, 86% of adolescents received the tetanus, diphtheria, and acellular pertussis vaccine, and 81% received the first dose of the meningococcal vaccine. The federal government’s Office of Disease Prevention and Health Promotion aims for an 80% HPV vaccination completion rate for girls and boys aged 13-15 years by 2020.
[polldaddy:{"method":"iframe","type":"survey","src":"//newspolls2017.polldaddy.com/s/how-to-raise-hpv-vaccine-rates?iframe=1"}]The CDC now recommends that 11- to 12-year-olds get two doses of the HPV vaccine, rather than three, with the second dose given 6-12 months after the first (MMWR. 2016;65:1405-8).
The common ways in which the HPV vaccine is introduced to parents likely contributes to the low vaccination rates, said Beth Auslander, PhD, a clinical psychologist and associate professor in the department of pediatrics at the University of Texas Medical Branch in Galveston. Some pediatricians may tell parents about school-mandated vaccines first and then as a side note, mention the HPV vaccine.
“The way it’s presented at times is being separate from the other vaccines,” Dr. Auslander said. “Sometimes it sounds optional.”
Parents often are uncertain about the safety and efficacy of the HPV vaccine, she added, and some wrongly assume the vaccine will lead to sexual activity among their children.

“Sometimes it can take a little longer to talk about,” Dr. Yoost said in an interview. “A lot of times, parents will bring up questions or concerns about the HPV vaccine. If physicians aren’t comfortable talking about those topics, they may not give the best recommendation. Pediatricians are not dealing with cervical cancer, so they may have a harder time recommending a vaccine based on outcomes they don’t deal with.”
Ob.gyns. are in a unique position to reach out to their pediatric counterparts and discuss strategies for catching more patients eligible for the HPV vaccine, said Sarah Dilley, MD, a gynecologic oncology fellow at the University of Alabama at Birmingham and the lead author of the recent Call to Action paper.
“We offer a unique perspective in that we are treating the conditions that the HPV vaccine is preventing, so we have more of a sense of urgency and an understanding of why that is so important,” Dr. Dilley said in an interview. “Obviously, pediatricians understand this as well, but it’s not something they see every day in their practice. We, as ob.gyns., have the opportunity to talk to our pediatric colleagues about the importance and really how devastating these conditions can be and how important it is to prevent them.”
In the recent paper, Dr. Dilley and her colleagues recommend that ob.gyns. speak to pediatricians and primary care physicians in their community to promote the vaccine and encourage them to view the Centers for Disease Control and Prevention’s You Are the Key presentation. The CDC resources include tips for how to discuss the burden of HPV-related diseases and effective communication with parents, an update on state vaccination rates, and the latest HPV vaccination recommendations.
Dr. Dilley encourages ob.gyns. and pediatricians to find different opportunities and venues to discuss the HPV vaccine. Ask about the pediatrician’s current approach to the vaccine, the doctor’s communication with parents, and how such practices could be improved, she said.
“People like to hear from their colleagues,” Dr. Dilley said. “Hearing from ob.gyns. [about] their experiences could be really helpful, whether it’s doing lunch and learns, formal education, grand rounds, or even more informal talks at the hospital.”
Ob.gyns. and pediatricians also need to better coordinate their messaging so that there is more consistent emphasis during each patient encounter about the need of the HPV vaccination, Dr. Kimberlin said. There needs to be a renewed focus on the vaccine as a cancer vaccination, he said.
“The nuances of HPV and the way that HPV is acquired, namely sexually transmitted, has taken too much of a front row consideration in the conversations that parents sometimes want to have with their child’s health care providers,” Dr. Kimberlin said. “We have to stress this is a cancer vaccine. This is a vaccine that prevents the deaths of thousands of women and men. We simply need to get that message out more forcefully.”
In addition, there’s a need for joint action to debunk myths about the vaccine and work toward eliminating the stigma surrounding it, Dr. Dilley said.
“I talk to a lot parents about the HPV vaccine and there’s so much misinformation online,” she said. “But a lot of patients do look at websites of their ob.gyn. or their pediatrician, [and] if they see something reputable coming from one of those sites, they might listen. We have a lot of patients who are mothers or grandmothers of kids; that’s also an opportunity for us to say, ‘Hey while we’re screening you for cervical cancer, let’s talk about the HPV vaccine.’ That’s a really good opportunity to help our [pediatric] colleagues out.”
5 steps to increase HPV vaccination
Melissa Kottke, MD, director of the Jane Fonda Center for Adolescent Reproductive Health at Emory University offered her practice steps for increased HPV vaccination rates.
1. Be clear about your recommendation. For example, “I recommend the HPV vaccine. It can help prevent cancer.”

3. Educate the entire clinical team (front desk staff, nursing, medical assistants, etc.) about the HPV vaccine so there is consistent messaging and delivery.
4. Establish streamlined systems. The vaccine recommendation, order, and follow-up should be streamlined and automated, if possible. Systems should also ensure documentation of vaccine receipt.
5. Make time for conversations with patients who are mothers and grandmothers. Recommend the HPV vaccine for males and females aged 9-26 years old. Encourage parents/grandparents to follow-up with the child’s doctor or offer to provide the vaccine in your office.
*This story was updated 8/22/2017.
[email protected]
On Twitter @legal_med
Despite widespread availability of the human papillomavirus vaccine over the last 11 years, vaccination rates continue to lag behind national targets and are far behind other vaccines routinely administered in adolescence, such as the meningococcal and tetanus vaccines.
Better collaboration among pediatricians and obstetrician-gynecologists to promote the HPV vaccine may be one answer to turning the tide, said David W. Kimberlin, MD, codirector of the division of pediatric infectious diseases at the University of Alabama at Birmingham and president of the Pediatric Infectious Diseases Society.
As of 2015, just 63% of eligible U.S. girls completed the first dose of the HPV vaccination, 52% completed two doses, and 42% finished the three-dose series, according to a recent “Call to Action” paper in the American Journal of Obstetrics and Gynecology (doi: 10.1016/j.ajog.2017.02.026). Although the HPV vaccine has been recommended for boys since 2011, just half of eligible boys completed the first dose, 39% completed two doses, and 28% finished the full series. By contrast, 86% of adolescents received the tetanus, diphtheria, and acellular pertussis vaccine, and 81% received the first dose of the meningococcal vaccine. The federal government’s Office of Disease Prevention and Health Promotion aims for an 80% HPV vaccination completion rate for girls and boys aged 13-15 years by 2020.
[polldaddy:{"method":"iframe","type":"survey","src":"//newspolls2017.polldaddy.com/s/how-to-raise-hpv-vaccine-rates?iframe=1"}]The CDC now recommends that 11- to 12-year-olds get two doses of the HPV vaccine, rather than three, with the second dose given 6-12 months after the first (MMWR. 2016;65:1405-8).
The common ways in which the HPV vaccine is introduced to parents likely contributes to the low vaccination rates, said Beth Auslander, PhD, a clinical psychologist and associate professor in the department of pediatrics at the University of Texas Medical Branch in Galveston. Some pediatricians may tell parents about school-mandated vaccines first and then as a side note, mention the HPV vaccine.
“The way it’s presented at times is being separate from the other vaccines,” Dr. Auslander said. “Sometimes it sounds optional.”
Parents often are uncertain about the safety and efficacy of the HPV vaccine, she added, and some wrongly assume the vaccine will lead to sexual activity among their children.
“Sometimes it can take a little longer to talk about,” Dr. Yoost said in an interview. “A lot of times, parents will bring up questions or concerns about the HPV vaccine. If physicians aren’t comfortable talking about those topics, they may not give the best recommendation. Pediatricians are not dealing with cervical cancer, so they may have a harder time recommending a vaccine based on outcomes they don’t deal with.”
Ob.gyns. are in a unique position to reach out to their pediatric counterparts and discuss strategies for catching more patients eligible for the HPV vaccine, said Sarah Dilley, MD, a gynecologic oncology fellow at the University of Alabama at Birmingham and the lead author of the recent Call to Action paper.
“We offer a unique perspective in that we are treating the conditions that the HPV vaccine is preventing, so we have more of a sense of urgency and an understanding of why that is so important,” Dr. Dilley said in an interview. “Obviously, pediatricians understand this as well, but it’s not something they see every day in their practice. We, as ob.gyns., have the opportunity to talk to our pediatric colleagues about the importance and really how devastating these conditions can be and how important it is to prevent them.”
In the recent paper, Dr. Dilley and her colleagues recommend that ob.gyns. speak to pediatricians and primary care physicians in their community to promote the vaccine and encourage them to view the Centers for Disease Control and Prevention’s You Are the Key presentation. The CDC resources include tips for how to discuss the burden of HPV-related diseases and effective communication with parents, an update on state vaccination rates, and the latest HPV vaccination recommendations.
Dr. Dilley encourages ob.gyns. and pediatricians to find different opportunities and venues to discuss the HPV vaccine. Ask about the pediatrician’s current approach to the vaccine, the doctor’s communication with parents, and how such practices could be improved, she said.
“People like to hear from their colleagues,” Dr. Dilley said. “Hearing from ob.gyns. [about] their experiences could be really helpful, whether it’s doing lunch and learns, formal education, grand rounds, or even more informal talks at the hospital.”
Ob.gyns. and pediatricians also need to better coordinate their messaging so that there is more consistent emphasis during each patient encounter about the need of the HPV vaccination, Dr. Kimberlin said. There needs to be a renewed focus on the vaccine as a cancer vaccination, he said.
“The nuances of HPV and the way that HPV is acquired, namely sexually transmitted, has taken too much of a front row consideration in the conversations that parents sometimes want to have with their child’s health care providers,” Dr. Kimberlin said. “We have to stress this is a cancer vaccine. This is a vaccine that prevents the deaths of thousands of women and men. We simply need to get that message out more forcefully.”
In addition, there’s a need for joint action to debunk myths about the vaccine and work toward eliminating the stigma surrounding it, Dr. Dilley said.
“I talk to a lot parents about the HPV vaccine and there’s so much misinformation online,” she said. “But a lot of patients do look at websites of their ob.gyn. or their pediatrician, [and] if they see something reputable coming from one of those sites, they might listen. We have a lot of patients who are mothers or grandmothers of kids; that’s also an opportunity for us to say, ‘Hey while we’re screening you for cervical cancer, let’s talk about the HPV vaccine.’ That’s a really good opportunity to help our [pediatric] colleagues out.”
5 steps to increase HPV vaccination
Melissa Kottke, MD, director of the Jane Fonda Center for Adolescent Reproductive Health at Emory University offered her practice steps for increased HPV vaccination rates.
1. Be clear about your recommendation. For example, “I recommend the HPV vaccine. It can help prevent cancer.”
3. Educate the entire clinical team (front desk staff, nursing, medical assistants, etc.) about the HPV vaccine so there is consistent messaging and delivery.
4. Establish streamlined systems. The vaccine recommendation, order, and follow-up should be streamlined and automated, if possible. Systems should also ensure documentation of vaccine receipt.
5. Make time for conversations with patients who are mothers and grandmothers. Recommend the HPV vaccine for males and females aged 9-26 years old. Encourage parents/grandparents to follow-up with the child’s doctor or offer to provide the vaccine in your office.
*This story was updated 8/22/2017.
[email protected]
On Twitter @legal_med
Start ART in first 3 months in infants with perinatal HIV
MADRID – Infants with perinatal HIV infection are significantly more likely to achieve viral suppression by age 12 months if they start antiretroviral therapy (ART) before age 3 months than if physicians wait until 3-6 months of age, Paolo Palma, MD, reported at the annual meeting of the European Society for Paediatric Infectious Diseases.
He presented a study of the factors associated with time to virologic sup

The purpose of this study was to identify the key factors involved in attaining early virologic control of perinatally acquired HIV. This information is necessary to lay the groundwork for planned future investigations of immunotherapeutic strategies designed to achieve sustained ART-free remission. Such strategies are most likely to be successful in very young children who have not yet built up a massive viral load, explained Dr. Palma of Bambino Gesù Children’s Hospital in Rome.
“A major obstacle to curing HIV infection is persistence of virus as integrated proviral DNA in long-lived cells even after many years on ART. ART-free HIV remission is more likely to occur if viral suppression is achieved very early in infection,” he said.
The median age of the 420 subjects at the time ART was initiated was 2.9 months. Their CD4 cell percentage was 34%, with a median CD4 cell count of 1,780 and an average viral load at baseline of 316,228 copies/mL.
At 12 months of age, 84% of patients had achieved viral suppression. In multivariate analyses adjusted for initial ART regimen and geographic location, three factors were associated with this outcome: younger age at ART onset, a lower baseline viral load, and a higher per

Indeed, for each 1-month increase in age at onset of ART, the likelihood of virologic response at age 12 months decreased by 16%. Similarly, the rate of virologic response at 1 year of age decreased by 15% for each 10 copies/mL increase in viral load at the start of ART. In contrast, the likelihood of virologic suppression at age 12 months increased by 10% for each 10% increase in CD4 cell percentage at the start of treatment.
Among the variables that proved unrelated to virologic suppression at 1 year of age were gender, AIDS status, feeding style (breastfed versus bottle-fed), and ethnicity.
Dr. Palma reported having no relevant financial disclosures.
MADRID – Infants with perinatal HIV infection are significantly more likely to achieve viral suppression by age 12 months if they start antiretroviral therapy (ART) before age 3 months than if physicians wait until 3-6 months of age, Paolo Palma, MD, reported at the annual meeting of the European Society for Paediatric Infectious Diseases.
He presented a study of the factors associated with time to virologic sup
The purpose of this study was to identify the key factors involved in attaining early virologic control of perinatally acquired HIV. This information is necessary to lay the groundwork for planned future investigations of immunotherapeutic strategies designed to achieve sustained ART-free remission. Such strategies are most likely to be successful in very young children who have not yet built up a massive viral load, explained Dr. Palma of Bambino Gesù Children’s Hospital in Rome.
“A major obstacle to curing HIV infection is persistence of virus as integrated proviral DNA in long-lived cells even after many years on ART. ART-free HIV remission is more likely to occur if viral suppression is achieved very early in infection,” he said.
The median age of the 420 subjects at the time ART was initiated was 2.9 months. Their CD4 cell percentage was 34%, with a median CD4 cell count of 1,780 and an average viral load at baseline of 316,228 copies/mL.
At 12 months of age, 84% of patients had achieved viral suppression. In multivariate analyses adjusted for initial ART regimen and geographic location, three factors were associated with this outcome: younger age at ART onset, a lower baseline viral load, and a higher per
Indeed, for each 1-month increase in age at onset of ART, the likelihood of virologic response at age 12 months decreased by 16%. Similarly, the rate of virologic response at 1 year of age decreased by 15% for each 10 copies/mL increase in viral load at the start of ART. In contrast, the likelihood of virologic suppression at age 12 months increased by 10% for each 10% increase in CD4 cell percentage at the start of treatment.
Among the variables that proved unrelated to virologic suppression at 1 year of age were gender, AIDS status, feeding style (breastfed versus bottle-fed), and ethnicity.
Dr. Palma reported having no relevant financial disclosures.
AT ESPID 2017
Key clinical point:
Major finding: With each 1-month delay in starting antiretroviral therapy, the likelihood of attaining viral suppression by age 12 months drops by 16%.
Data source: This observational study included 420 infants with perinatally acquired HIV infection who began antiretroviral therapy prior to age 6 months.
Disclosures: Dr. Palma reported having no relevant financial disclosures.
Lack of Significant Anti-inflammatory Activity With Clindamycin in the Treatment of Rosacea: Results of 2 Randomized, Vehicle-Controlled Trials
Rosacea is a chronic inflammatory skin disease characterized by central facial erythema with or without intermittent papules and pustules (described as the inflammatory lesions of rosacea). Although twice-daily clindamycin 1% solution or gel has been used in the treatment of acne, few studies have investigated the use of clindamycin in rosacea.1,2 In one study comparing twice-daily clindamycin lotion 1% with oral tetracycline in 43 rosacea patients, clindamycin was found to be superior in the eradication of pustules.3 A combination therapy of clindamycin 1% and benzoyl peroxide 5% was found to be more effective than the vehicle in inflammatory lesions and erythema of rosacea in a 12-week randomized controlled trial; however, a definitive advantage over US Food and Drug Administration-approved topical agents used to treat papulopustular rosacea was not established.4,5 Two further studies evaluated clindamycin phosphate 1.2%-tretinoin 0.025% combination gel in the treatment of rosacea, but only 1 showed any effect on papulopustular lesions.6-8 The objective of the studies reported here was to evaluate the efficacy and safety of clindamycin in the treatment of patients with moderate to severe rosacea.
Methods
Study Design
Two multicenter (study A, 20 centers; study B, 10 centers), randomized, investigator-blinded, vehicle-controlled studies were conducted in the United States between 1999 and 2002 in accordance with the Declaration of Helsinki, International Conference on Harmonisation Good Clinical Practice guidelines, and local regulatory requirements. The studies were reviewed and approved by the respective institutional review boards, and all participants provided written informed consent.
In study A, moderate to severe rosacea patients with erythema, telangiectasia, and at least 8 inflammatory lesions were randomized to receive clindamycin cream 1% or vehicle cream once (in the evening) or twice daily (in the morning and evening) or clindamycin cream 0.3% once daily (in the evening) for 12 weeks (1:1:1:1:1 ratio). All study treatments were supplied in identical tubes with blinded labels.
In study B, patients with moderate to severe rosacea and at least 8 inflammatory lesions were randomized in a 1:1 ratio with instructions to apply clindamycin gel 1% or vehicle gel to the affected areas twice daily (morning and evening) for 12 weeks.
Efficacy Evaluation
Evaluations were performed at baseline and weeks 2, 4, 8, and 12 on the intention-to-treat population with the last observation carried forward.
Efficacy assessments in both studies included inflammatory lesion counts (papules and pustules) of 5 facial regions--forehead, chin, nose, right cheek, left cheek--counted separately and then combined to give the total inflammatory lesion count (both studies), as well as improvement in the investigator global rosacea severity score (0=none/clear; 1=mild, detectable erythema with ≤7 papules/pustules; 2=moderate, prominent erythema with ≥8 papules/pustules; 3=severe, intense erythema with ≥10 to <50 papules/pustules; 3.5 [study A] or 4 [study B]=very severe, intense erythema with >50 papules/pustules). In study B, the proportion of participants dichotomized to success (a score of 0 [none/clear] or 1 [mild/almost clear]) or failure (a score of ≥2) on the 5-point investigator global rosacea severity scale at week 12 was evaluated. In study A, investigator global improvement assessment at week 12, based on photographs taken at baseline, was graded on a 7-point scale (from -1 [worse], 0 [no change], and 1 [minimal improvement] to 5 [clear]). In both studies, erythema severity was graded on a 7-point scale in increments of 0.5 (from 0=no erythema to 3.5=very severe redness, very intense redness). Skin irritation also was graded as none, mild, moderate, or severe.
Safety Evaluation
Safety was assessed by the incidence of adverse events (AEs).
Statistical Analysis
Studies were powered assuming 60% reduction in inflammatory lesion counts with active and 40% with vehicle, based on historical data from a prior study with metronidazole cream 0.75% versus vehicle; 64 participants were required in each treatment group to detect this effect using a 2-sided t test (α=.017). Pairwise comparisons (clindamycin vs respective vehicle) were performed using the Cochran-Mantel-Haenszel test for combined lesion count percentage change.
Results
Participant Disposition and Baseline Characteristics
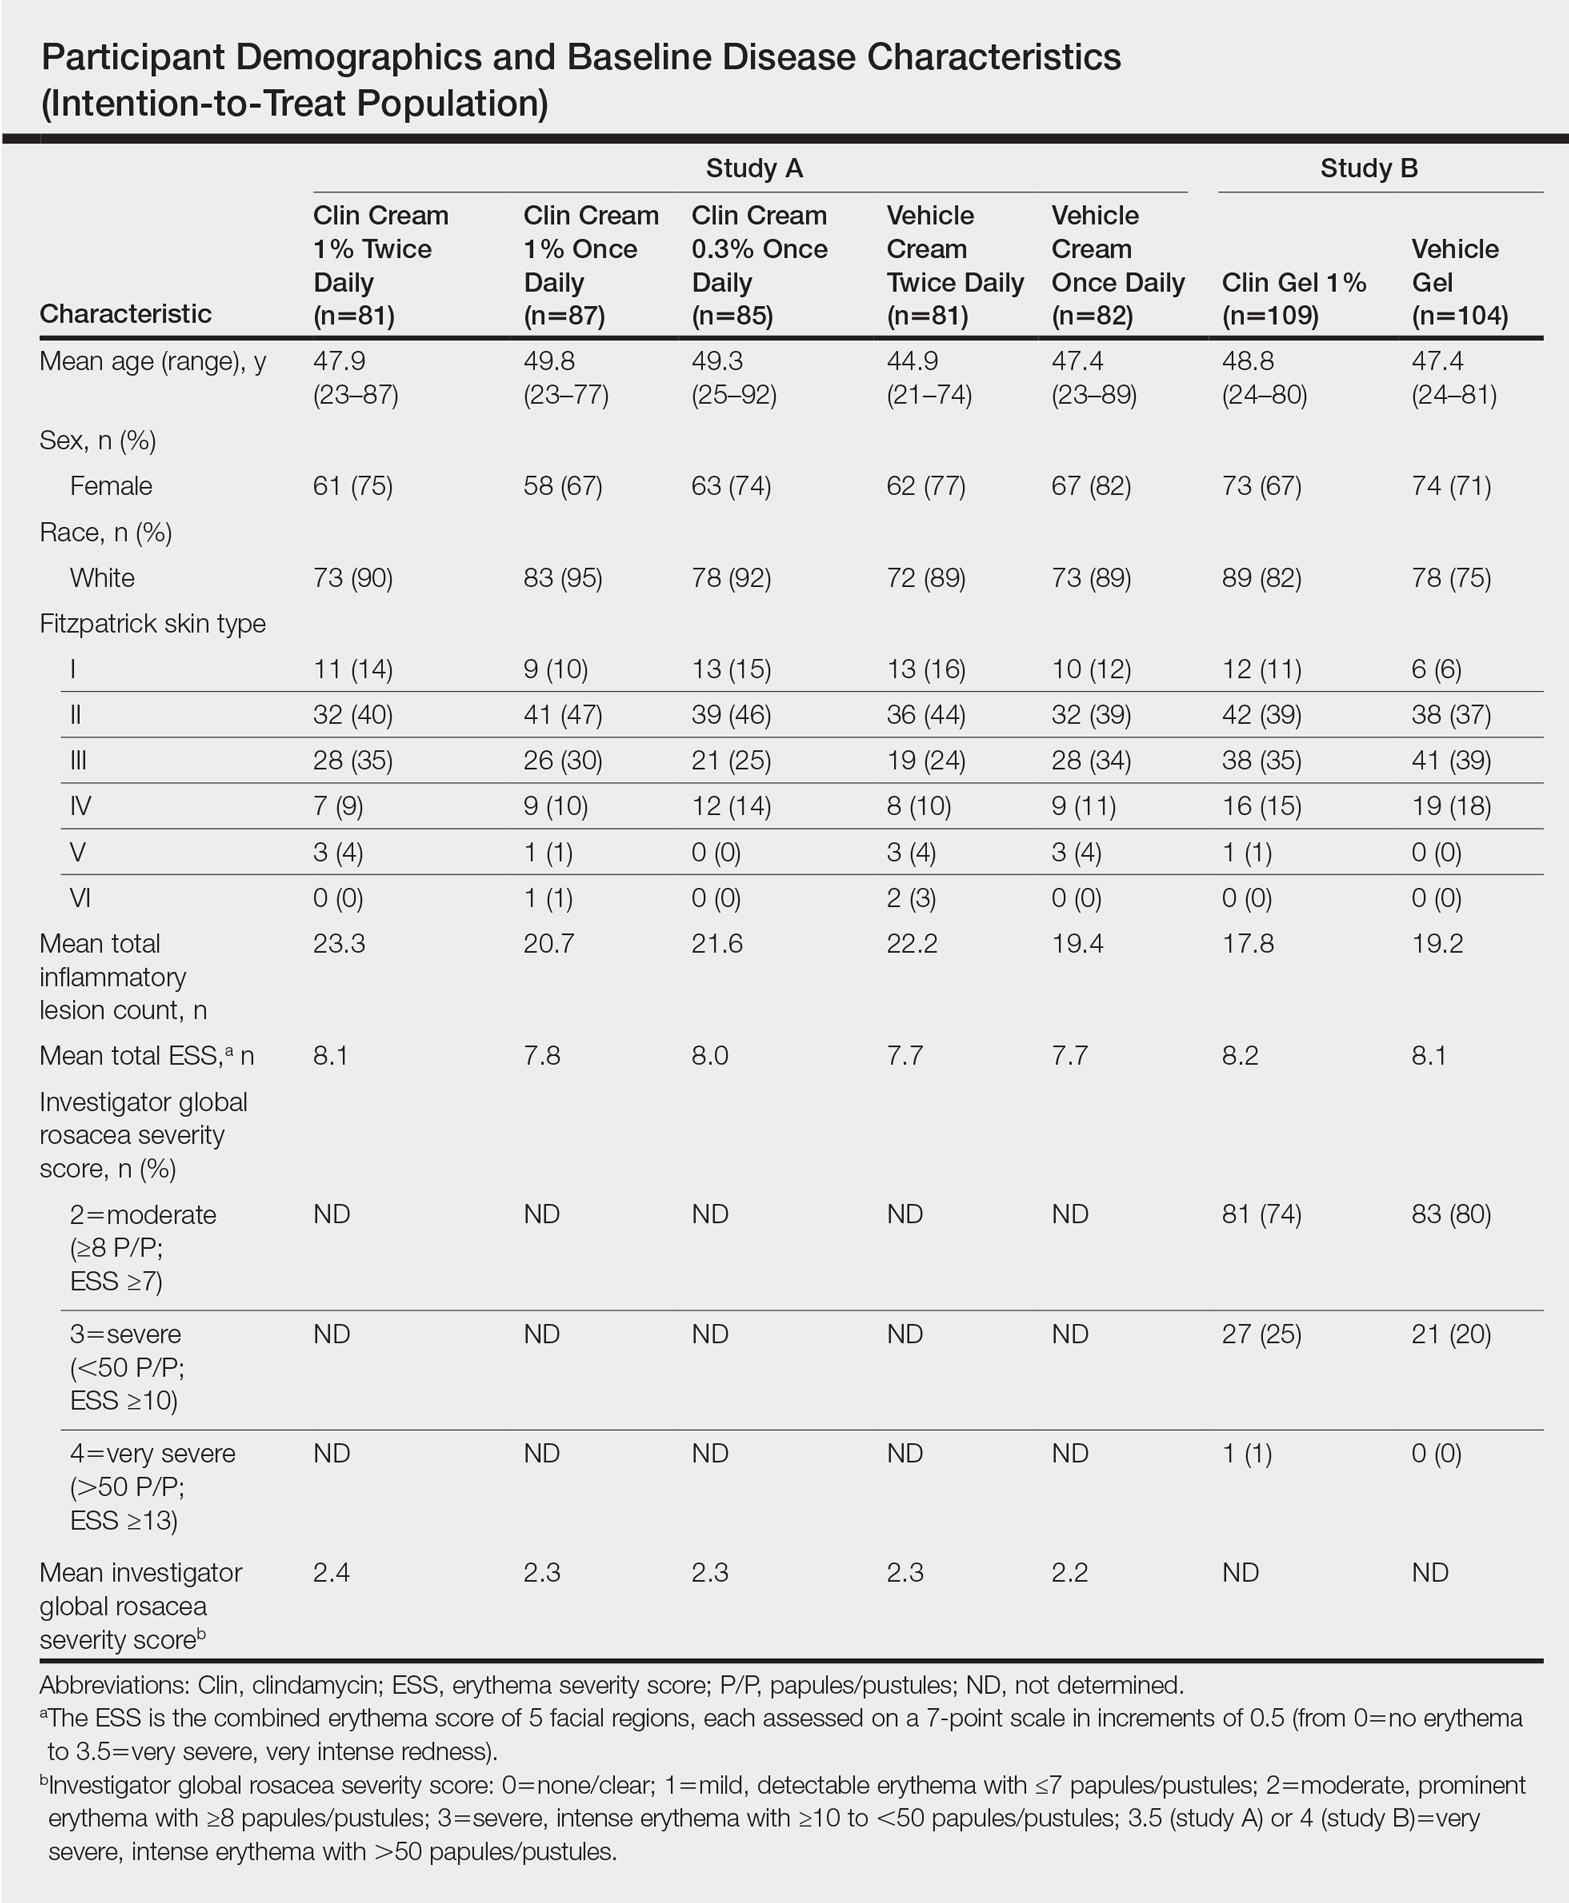
Overall, a total of 629 participants were randomized across both studies. In study A, a total of 416 participants were randomized into 5 treatment arms, with 369 participants (88.7%) completing the study; 47 (11.3%) participants discontinued study A, mainly due to participant request (19/47 [40.4%]) or lost to follow-up (11/47 [23.4%]). In study B, a total of 213 participants were randomized to receive either clindamycin gel 1% (n=109 [51.2%]) twice daily or vehicle gel (n=104 [48.8%]) twice daily, with 193 participants (90.6%) completing the study; 20 (9.4%) participants discontinued study B, mainly due to participant request (6/20 [30%]) or lost to follow-up (4/20 [20%]). Participants in studies A and B were similar in demographics and baseline disease characteristics (Table). The majority of participants were white females.
Efficacy
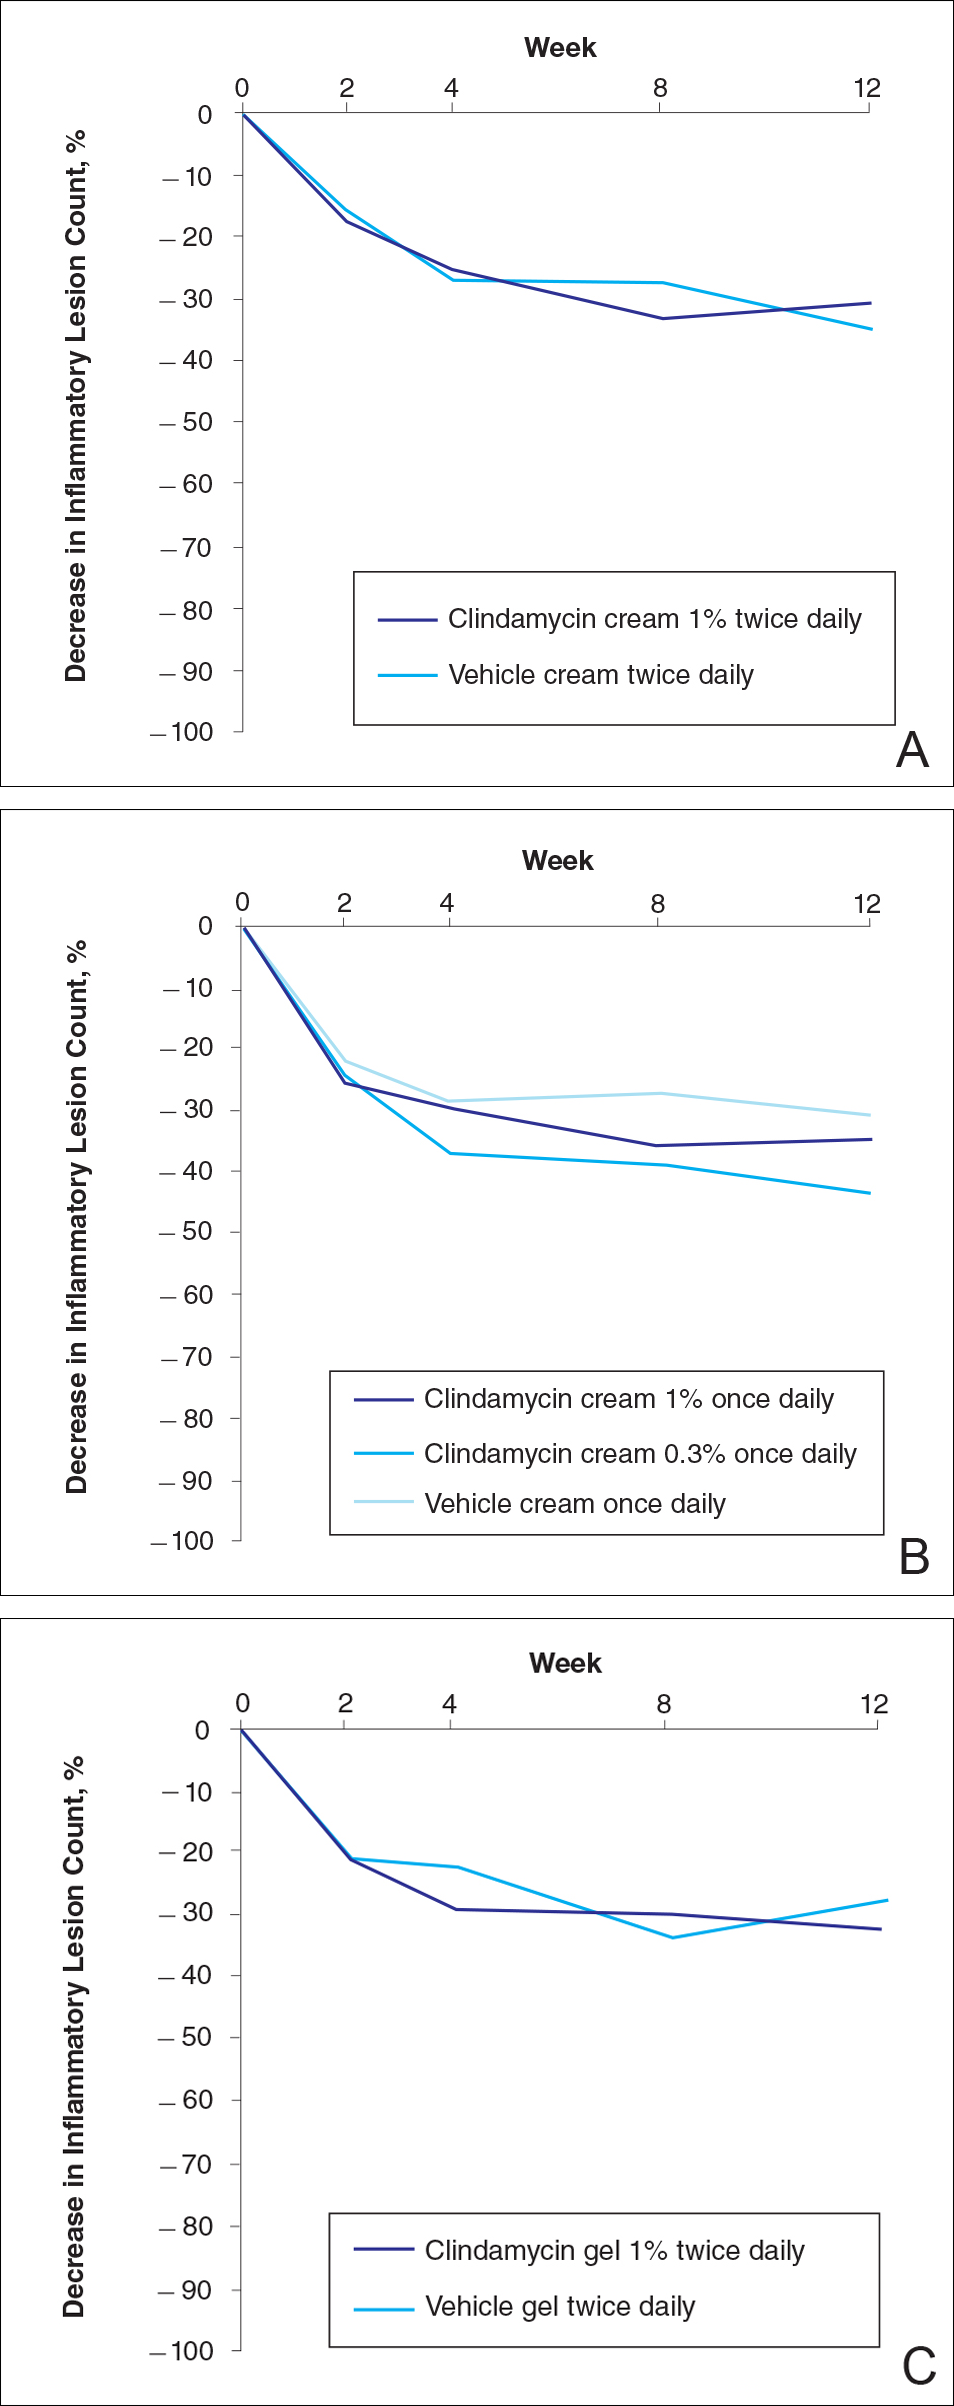
No statistically significant difference was observed in all pairwise comparisons (clindamycin cream twice daily vs vehicle twice daily, clindamycin cream once daily vs vehicle once daily, clindamycin gel vs vehicle gel) for the primary end point of mean percentage change from baseline in inflammatory lesion counts at week 12 (Figure 1; P>.5 for all pairwise comparisons).
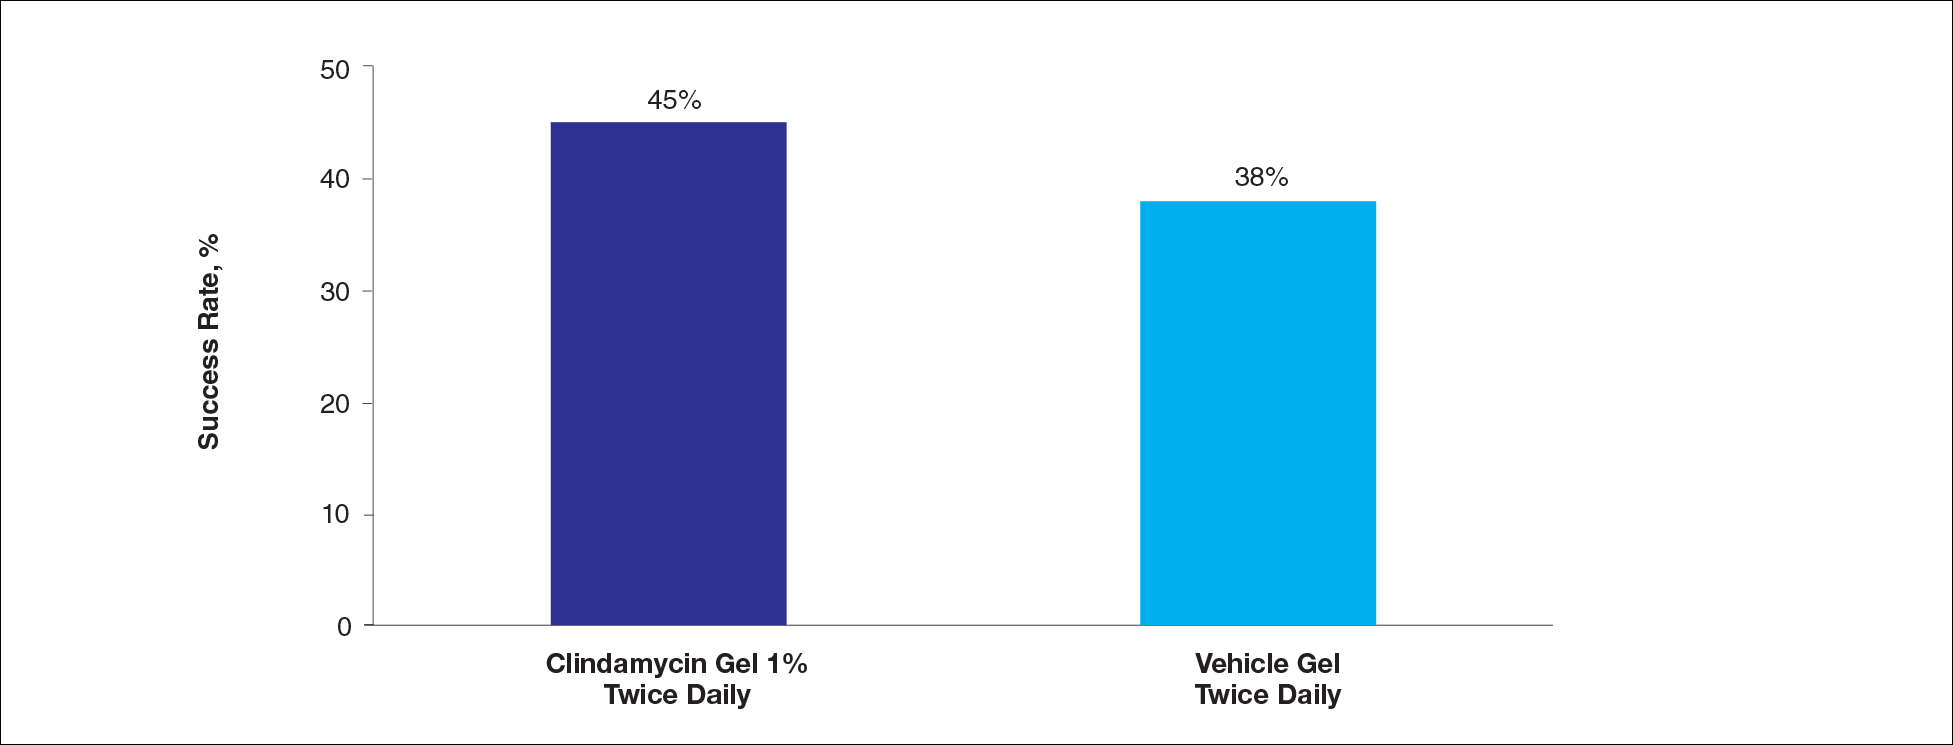
At week 12, the proportion of participants in study B deemed as a success (none/clear or mild/almost clear [investigator global rosacea severity score of 0 or 1]) in the clindamycin gel 1% and vehicle gel groups were 45% versus 38%, respectively (P=.347) (Figure 2).
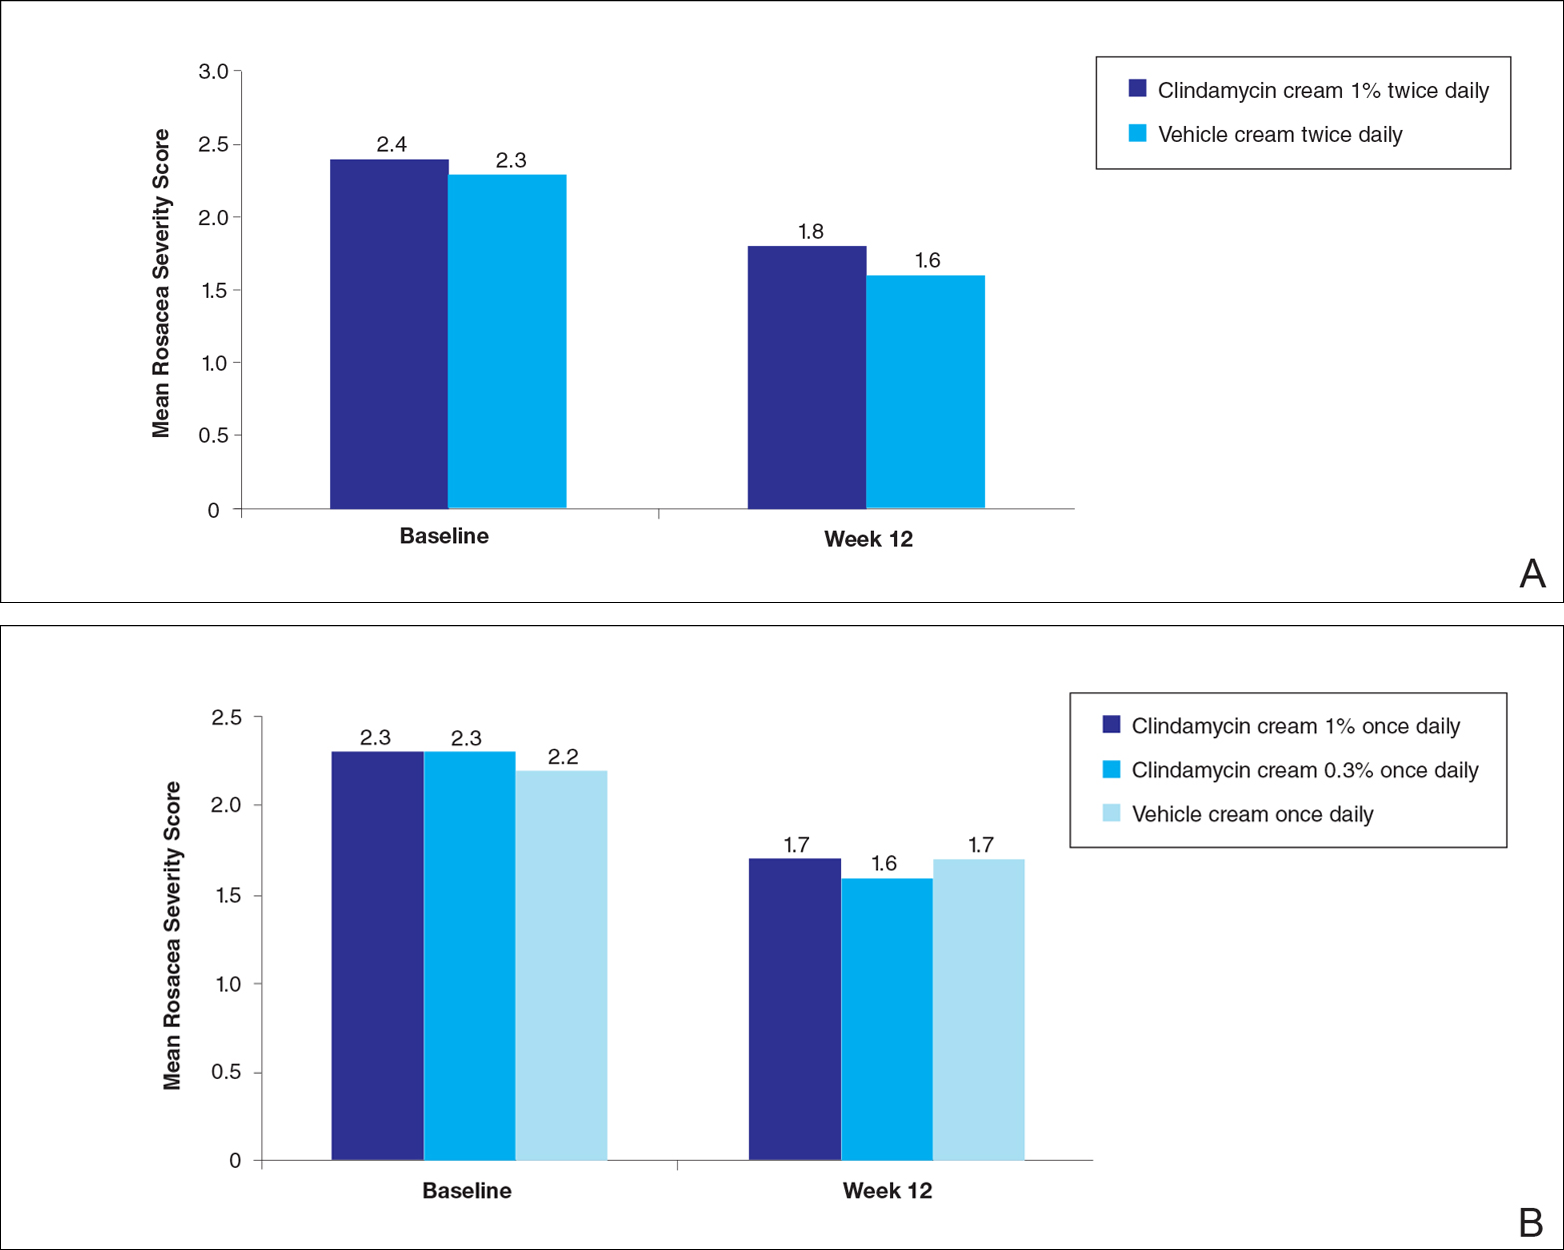
For the secondary end point of mean investigator global rosacea severity assessment at week 12 (study A), there were no significant differences between the active and vehicle control groups (P>.5 for all pairwise comparisons)(Figure 3). Also, the proportion of participants with at least a moderate investigator global improvement assessment from baseline to week 12 ranged from 45% for clindamycin cream 1% twice daily to 56% for clindamycin cream 0.3% cream once daily and from 45% for vehicle cream once daily to 51% for vehicle cream twice daily (P>.5 for all pairwise comparisons).
There were no significant differences in the mean total erythema severity scores at week 12 for clindamycin cream 1% twice daily versus vehicle cream twice daily (6.3 vs 6.0; P>.5), clindamycin cream 1% once daily versus vehicle cream once daily (6.2 vs 6.0; P>.5), clindamycin cream 0.3% once daily versus vehicle cream once daily (5.9 vs 6.0; P>.5), and clindamycin gel 1% twice daily versus vehicle gel twice daily (6.7 vs 6.2; P>.5).
There were no relevant differences between any of the clindamycin cream groups and their respective vehicle group at week 12 for skin irritation, including desquamation, edema, dryness, pruritus, and stinging/burning.
Safety
In study A, the majority of AEs in all 5 treatment arms were nondermatologic, mild in intensity, and not considered to be related to the study treatment by the investigator. Overall, 12 participants had AEs considered by the investigator as possibly or probably related to the study treatment: 4.9% in the clindamycin cream 1% twice daily group, 4.6% in the clindamycin cream 1% once daily group, 3.7% in the vehicle cream twice daily group, 1.2% in the clindamycin cream 0.3% once daily group, and 0% in the vehicle cream once daily group. Two treatment-related AEs led to treatment discontinuation, including dermatitis in 1 participant from the clindamycin cream 1% once daily group and contact dermatitis in 1 participant from the clindamycin cream 1% twice daily group.
Comment
No evidence of increased efficacy over the respective vehicles was observed with clindamycin cream or gel, whatever the regimen, in the treatment of rosacea patients in either of these well-designed and well-powered, blinded studies. Slight improvements in the various efficacy criteria were observed, even in the vehicle groups, highlighting the importance of using a good basic skin care regimen in the management of rosacea.9 In contrast to our observations of lack of efficacy in the treatment of rosacea, clinical efficacy of clindamycin has been demonstrated in acne,10-12 albeit with low efficacy for clindamycin monotherapy.13 It is noteworthy that oral or topical antibiotics are no longer recommended as monotherapy for acne to prevent and minimize antibiotic resistance and to preserve the therapeutic value of antibiotics.14
Acne and rosacea are both chronic inflammatory disorders of the skin associated with papules and pustules, and they share some common inflammatory patterns.15-19 Furthermore, the intrinsic anti-inflammatory activity of clindamycin in addition to its antibiotic effects has been suggested by some authors as the main reason for treating acne with clindamycin.20 However, the relative contributions of antibacterial and/or anti-inflammatory properties remain to be fully elucidated, and evidence for direct anti-inflammatory effects of clindamycin remains heterogeneous.21,22 Several pathophysiological factors have been implicated in acne, including hormonal effects, abnormal keratinocyte function, increased sebum production, and microbial components (eg, hypercolonization of the skin follicles by Propionibacterium acnes).23,24 The antibiotic activity of clindamycin against P acnes may be the key factor responsible for the clinical effects in acne.25,26 Although clindamycin may have anti-inflammatory effects in acne via a different inflammatory pathway not shared by rosacea, a purely antibiotic mechanism of action of clindamycin also could explain why we observed no evidence of efficacy in the treatment of rosacea, as no causative bacterial component has been clearly demonstrated in rosacea.27
Conclusion
In these studies, clindamycin cream 0.3% once daily, clindamycin cream 1% once or twice daily, and clindamycin gel 1% twice daily were all well tolerated; however, they were no more effective than the vehicles in the treatment of moderate to severe rosacea.
Acknowledgment
The authors would like to thank Helen Simpson, PhD, of Galderma R&D (Sophia Antipolis, France), for editorial and medical writing assistance.
- Whitney KM, Ditre CM. Anti-inflammatory properties of clindamycin: a review of its use in the treatment of acne vulgaris. Clinical Medicine Insights: Dermatology. 2011;4:27-41.
- Mays RM, Gordon RA, Wilson JM, et al. New antibiotic therapies for acne and rosacea. Dermatol Ther. 2012;25:23-37.
- Wilkin JK, DeWitt S. Treatment of rosacea: topical clindamycin versus oral tetracycline. Int J Dermatol. 1993;32:65-67.
- Breneman D, Savin R, VandePol C, et al. Double-blind, randomized, vehicle-controlled clinical trial of once-daily benzoyl peroxide/clindamycin topical gel in the treatment of patients with moderate to severe rosacea. Int J Dermatol. 2004;43:381-387.
- Leyden JJ, Thiboutot D, Shalita A. Photographic review of results from a clinical study comparing benzoyl peroxide 5%/clindamycin 1% topical gel with vehicle in the treatment of rosacea. Cutis. 2004;73(6 suppl):11-17.
- Chang AL, Alora-Palli M, Lima XT, et al. A randomized, double-blind, placebo-controlled, pilot study to assess the efficacy and safety of clindamycin 1.2% and tretinoin 0.025% combination gel for the treatment of acne rosacea over 12 weeks. J Drugs Dermatol. 2012;11:333-339.
- Freeman SA, Moon SD, Spencer JM. Clindamycin phosphate 1.2% and tretinoin 0.025% gel for rosacea: summary of a placebo-controlled, double-blind trial. J Drugs Dermatol. 2012;11:1410-1414.
- van Zuuren EJ, Fedorowicz Z, Carter B, et al. Interventions for rosacea. Cochrane Database Syst Rev. 2015;4:CD003262.
- Laquieze S, Czernielewski J, Baltas E. Beneficial use of Cetaphil moisturizing cream as part of a daily skin care regimen for individuals with rosacea. J Dermatolog Treat. 2007;18:158-162.
- Lookingbill DP, Chalker DK, Lindholm JS, et al. Treatment of acne with a combination clindamycin/benzoyl peroxide gel compared with clindamycin gel, benzoyl peroxide gel and vehicle gel: combined results of two double-blind investigations. J Am Acad Dermatol. 1997;37:590-595.
- Alirezaï M, Gerlach B, Horvath A, et al. Results of a randomised, multicentre study comparing a new water-based gel of clindamycin 1% versus clindamycin 1% topical solution in the treatment of acne vulgaris. Eur J Dermatol. 2005;15:274-278.
- Jarratt MT, Brundage T. Efficacy and safety of clindamycin-tretinoin gel versus clindamycin or tretinoin alone in acne vulgaris: a randomized, double-blind, vehicle-controlled study. J Drugs Dermatol. 2012;11:318-326.
- Benzaclin. Med Library website. http://medlibrary.org/lib/rx/meds/benzaclin-3. Updated May 8, 2013. Accessed January 24, 2017.
- Walsh TR, Efthimiou J, Dréno B. Systematic review of antibiotic resistance in acne: an increasing topical and oral threat. Lancet Infect Dis. 2016;16:E23-E33.
- Jeremy AH, Holland DB, Roberts SG, et al. Inflammatory events are involved in acne lesion initiation. J Invest Dermatol. 2003;121:20-27.
- Kircik LH. Re-evaluating treatment targets in acne vulgaris: adapting to a new understanding of pathophysiology. J Drugs Dermatol. 2014;13:S57-S60.
- Salzer S, Kresse S, Hirai Y, et al. Cathelicidin peptide LL-37 increases UVB-triggered inflammasome activation: possible implications for rosacea. J Dermatol Sci. 2014;76:173-179.
- Buhl T, Sulk M, Nowak P, et al. Molecular and morphological characterization of inflammatory infiltrate in rosacea reveals activation of Th1/Th17 pathways. J Invest Dermatol. 2015;135:2198-2208.
- Kistowska M, Meier B, Proust T, et al. Propionibacterium acnes promotes Th17 and Th17/Th1 responses in acne patients. J Invest Dermatol. 2015;135:110-118.
- Zeichner JA. Inflammatory acne treatment: review of current and new topical therapeutic options. J Drugs Dermatol. 2016;15(1 suppl 1):S11-S16.
- Nakano T, Hiramatsu K, Kishi K, et al. Clindamycin modulates inflammatory-cytokine induction in lipopolysaccharide-stimulated mouse peritoneal macrophages. Antimicrob Agents Chemother. 2003;47:363-367.
- Orman KL, English BK. Effects of antibiotic class on the macrophage inflammatory response to Streptococcus pneumoniae. J Infect Dis. 2000;182:1561-1565.
- Taylor M, Gonzalez M, Porter R. Pathways to inflammation: acne pathophysiology. Eur J Dermatol. 2011;21:323-333.
- Del Rosso JQ, Kircik LH. The sequence of inflammation, relevant biomarkers, and the pathogenesis of acne vulgaris: what does recent research show and what does it mean to the clinician? J Drugs Dermatol. 2013;12(8 suppl):S109-S115.
- Leyden J, Kaidbey K, Levy SF. The combination formulation of clindamycin 1% plus benzoyl peroxide 5% versus 3 different formulations of topical clindamycin alone in the reduction of Propionibacterium acnes. an in vivo comparative study. Am J Clin Dermatol. 2001;2:263-266.
- Wang WL, Everett ED, Johnson M, et al. Susceptibility of Propionibacterium acnes to seventeen antibiotics. Antimicrob Agents Chemother. 1977;11:171-173.
- Steinhoff M, Schauber J, Leyden JJ. New insights into rosacea pathophysiology: a review of recent findings. J Am Acad Dermatol. 2013;69(6 suppl 1):S15-S26.
Rosacea is a chronic inflammatory skin disease characterized by central facial erythema with or without intermittent papules and pustules (described as the inflammatory lesions of rosacea). Although twice-daily clindamycin 1% solution or gel has been used in the treatment of acne, few studies have investigated the use of clindamycin in rosacea.1,2 In one study comparing twice-daily clindamycin lotion 1% with oral tetracycline in 43 rosacea patients, clindamycin was found to be superior in the eradication of pustules.3 A combination therapy of clindamycin 1% and benzoyl peroxide 5% was found to be more effective than the vehicle in inflammatory lesions and erythema of rosacea in a 12-week randomized controlled trial; however, a definitive advantage over US Food and Drug Administration-approved topical agents used to treat papulopustular rosacea was not established.4,5 Two further studies evaluated clindamycin phosphate 1.2%-tretinoin 0.025% combination gel in the treatment of rosacea, but only 1 showed any effect on papulopustular lesions.6-8 The objective of the studies reported here was to evaluate the efficacy and safety of clindamycin in the treatment of patients with moderate to severe rosacea.
Methods
Study Design
Two multicenter (study A, 20 centers; study B, 10 centers), randomized, investigator-blinded, vehicle-controlled studies were conducted in the United States between 1999 and 2002 in accordance with the Declaration of Helsinki, International Conference on Harmonisation Good Clinical Practice guidelines, and local regulatory requirements. The studies were reviewed and approved by the respective institutional review boards, and all participants provided written informed consent.
In study A, moderate to severe rosacea patients with erythema, telangiectasia, and at least 8 inflammatory lesions were randomized to receive clindamycin cream 1% or vehicle cream once (in the evening) or twice daily (in the morning and evening) or clindamycin cream 0.3% once daily (in the evening) for 12 weeks (1:1:1:1:1 ratio). All study treatments were supplied in identical tubes with blinded labels.
In study B, patients with moderate to severe rosacea and at least 8 inflammatory lesions were randomized in a 1:1 ratio with instructions to apply clindamycin gel 1% or vehicle gel to the affected areas twice daily (morning and evening) for 12 weeks.
Efficacy Evaluation
Evaluations were performed at baseline and weeks 2, 4, 8, and 12 on the intention-to-treat population with the last observation carried forward.
Efficacy assessments in both studies included inflammatory lesion counts (papules and pustules) of 5 facial regions--forehead, chin, nose, right cheek, left cheek--counted separately and then combined to give the total inflammatory lesion count (both studies), as well as improvement in the investigator global rosacea severity score (0=none/clear; 1=mild, detectable erythema with ≤7 papules/pustules; 2=moderate, prominent erythema with ≥8 papules/pustules; 3=severe, intense erythema with ≥10 to <50 papules/pustules; 3.5 [study A] or 4 [study B]=very severe, intense erythema with >50 papules/pustules). In study B, the proportion of participants dichotomized to success (a score of 0 [none/clear] or 1 [mild/almost clear]) or failure (a score of ≥2) on the 5-point investigator global rosacea severity scale at week 12 was evaluated. In study A, investigator global improvement assessment at week 12, based on photographs taken at baseline, was graded on a 7-point scale (from -1 [worse], 0 [no change], and 1 [minimal improvement] to 5 [clear]). In both studies, erythema severity was graded on a 7-point scale in increments of 0.5 (from 0=no erythema to 3.5=very severe redness, very intense redness). Skin irritation also was graded as none, mild, moderate, or severe.
Safety Evaluation
Safety was assessed by the incidence of adverse events (AEs).
Statistical Analysis
Studies were powered assuming 60% reduction in inflammatory lesion counts with active and 40% with vehicle, based on historical data from a prior study with metronidazole cream 0.75% versus vehicle; 64 participants were required in each treatment group to detect this effect using a 2-sided t test (α=.017). Pairwise comparisons (clindamycin vs respective vehicle) were performed using the Cochran-Mantel-Haenszel test for combined lesion count percentage change.
Results
Participant Disposition and Baseline Characteristics
Overall, a total of 629 participants were randomized across both studies. In study A, a total of 416 participants were randomized into 5 treatment arms, with 369 participants (88.7%) completing the study; 47 (11.3%) participants discontinued study A, mainly due to participant request (19/47 [40.4%]) or lost to follow-up (11/47 [23.4%]). In study B, a total of 213 participants were randomized to receive either clindamycin gel 1% (n=109 [51.2%]) twice daily or vehicle gel (n=104 [48.8%]) twice daily, with 193 participants (90.6%) completing the study; 20 (9.4%) participants discontinued study B, mainly due to participant request (6/20 [30%]) or lost to follow-up (4/20 [20%]). Participants in studies A and B were similar in demographics and baseline disease characteristics (Table). The majority of participants were white females.
Efficacy
No statistically significant difference was observed in all pairwise comparisons (clindamycin cream twice daily vs vehicle twice daily, clindamycin cream once daily vs vehicle once daily, clindamycin gel vs vehicle gel) for the primary end point of mean percentage change from baseline in inflammatory lesion counts at week 12 (Figure 1; P>.5 for all pairwise comparisons).
At week 12, the proportion of participants in study B deemed as a success (none/clear or mild/almost clear [investigator global rosacea severity score of 0 or 1]) in the clindamycin gel 1% and vehicle gel groups were 45% versus 38%, respectively (P=.347) (Figure 2).
For the secondary end point of mean investigator global rosacea severity assessment at week 12 (study A), there were no significant differences between the active and vehicle control groups (P>.5 for all pairwise comparisons)(Figure 3). Also, the proportion of participants with at least a moderate investigator global improvement assessment from baseline to week 12 ranged from 45% for clindamycin cream 1% twice daily to 56% for clindamycin cream 0.3% cream once daily and from 45% for vehicle cream once daily to 51% for vehicle cream twice daily (P>.5 for all pairwise comparisons).
There were no significant differences in the mean total erythema severity scores at week 12 for clindamycin cream 1% twice daily versus vehicle cream twice daily (6.3 vs 6.0; P>.5), clindamycin cream 1% once daily versus vehicle cream once daily (6.2 vs 6.0; P>.5), clindamycin cream 0.3% once daily versus vehicle cream once daily (5.9 vs 6.0; P>.5), and clindamycin gel 1% twice daily versus vehicle gel twice daily (6.7 vs 6.2; P>.5).
There were no relevant differences between any of the clindamycin cream groups and their respective vehicle group at week 12 for skin irritation, including desquamation, edema, dryness, pruritus, and stinging/burning.
Safety
In study A, the majority of AEs in all 5 treatment arms were nondermatologic, mild in intensity, and not considered to be related to the study treatment by the investigator. Overall, 12 participants had AEs considered by the investigator as possibly or probably related to the study treatment: 4.9% in the clindamycin cream 1% twice daily group, 4.6% in the clindamycin cream 1% once daily group, 3.7% in the vehicle cream twice daily group, 1.2% in the clindamycin cream 0.3% once daily group, and 0% in the vehicle cream once daily group. Two treatment-related AEs led to treatment discontinuation, including dermatitis in 1 participant from the clindamycin cream 1% once daily group and contact dermatitis in 1 participant from the clindamycin cream 1% twice daily group.
Comment
No evidence of increased efficacy over the respective vehicles was observed with clindamycin cream or gel, whatever the regimen, in the treatment of rosacea patients in either of these well-designed and well-powered, blinded studies. Slight improvements in the various efficacy criteria were observed, even in the vehicle groups, highlighting the importance of using a good basic skin care regimen in the management of rosacea.9 In contrast to our observations of lack of efficacy in the treatment of rosacea, clinical efficacy of clindamycin has been demonstrated in acne,10-12 albeit with low efficacy for clindamycin monotherapy.13 It is noteworthy that oral or topical antibiotics are no longer recommended as monotherapy for acne to prevent and minimize antibiotic resistance and to preserve the therapeutic value of antibiotics.14
Acne and rosacea are both chronic inflammatory disorders of the skin associated with papules and pustules, and they share some common inflammatory patterns.15-19 Furthermore, the intrinsic anti-inflammatory activity of clindamycin in addition to its antibiotic effects has been suggested by some authors as the main reason for treating acne with clindamycin.20 However, the relative contributions of antibacterial and/or anti-inflammatory properties remain to be fully elucidated, and evidence for direct anti-inflammatory effects of clindamycin remains heterogeneous.21,22 Several pathophysiological factors have been implicated in acne, including hormonal effects, abnormal keratinocyte function, increased sebum production, and microbial components (eg, hypercolonization of the skin follicles by Propionibacterium acnes).23,24 The antibiotic activity of clindamycin against P acnes may be the key factor responsible for the clinical effects in acne.25,26 Although clindamycin may have anti-inflammatory effects in acne via a different inflammatory pathway not shared by rosacea, a purely antibiotic mechanism of action of clindamycin also could explain why we observed no evidence of efficacy in the treatment of rosacea, as no causative bacterial component has been clearly demonstrated in rosacea.27
Conclusion
In these studies, clindamycin cream 0.3% once daily, clindamycin cream 1% once or twice daily, and clindamycin gel 1% twice daily were all well tolerated; however, they were no more effective than the vehicles in the treatment of moderate to severe rosacea.
Acknowledgment
The authors would like to thank Helen Simpson, PhD, of Galderma R&D (Sophia Antipolis, France), for editorial and medical writing assistance.
- Whitney KM, Ditre CM. Anti-inflammatory properties of clindamycin: a review of its use in the treatment of acne vulgaris. Clinical Medicine Insights: Dermatology. 2011;4:27-41.
- Mays RM, Gordon RA, Wilson JM, et al. New antibiotic therapies for acne and rosacea. Dermatol Ther. 2012;25:23-37.
- Wilkin JK, DeWitt S. Treatment of rosacea: topical clindamycin versus oral tetracycline. Int J Dermatol. 1993;32:65-67.
- Breneman D, Savin R, VandePol C, et al. Double-blind, randomized, vehicle-controlled clinical trial of once-daily benzoyl peroxide/clindamycin topical gel in the treatment of patients with moderate to severe rosacea. Int J Dermatol. 2004;43:381-387.
- Leyden JJ, Thiboutot D, Shalita A. Photographic review of results from a clinical study comparing benzoyl peroxide 5%/clindamycin 1% topical gel with vehicle in the treatment of rosacea. Cutis. 2004;73(6 suppl):11-17.
- Chang AL, Alora-Palli M, Lima XT, et al. A randomized, double-blind, placebo-controlled, pilot study to assess the efficacy and safety of clindamycin 1.2% and tretinoin 0.025% combination gel for the treatment of acne rosacea over 12 weeks. J Drugs Dermatol. 2012;11:333-339.
- Freeman SA, Moon SD, Spencer JM. Clindamycin phosphate 1.2% and tretinoin 0.025% gel for rosacea: summary of a placebo-controlled, double-blind trial. J Drugs Dermatol. 2012;11:1410-1414.
- van Zuuren EJ, Fedorowicz Z, Carter B, et al. Interventions for rosacea. Cochrane Database Syst Rev. 2015;4:CD003262.
- Laquieze S, Czernielewski J, Baltas E. Beneficial use of Cetaphil moisturizing cream as part of a daily skin care regimen for individuals with rosacea. J Dermatolog Treat. 2007;18:158-162.
- Lookingbill DP, Chalker DK, Lindholm JS, et al. Treatment of acne with a combination clindamycin/benzoyl peroxide gel compared with clindamycin gel, benzoyl peroxide gel and vehicle gel: combined results of two double-blind investigations. J Am Acad Dermatol. 1997;37:590-595.
- Alirezaï M, Gerlach B, Horvath A, et al. Results of a randomised, multicentre study comparing a new water-based gel of clindamycin 1% versus clindamycin 1% topical solution in the treatment of acne vulgaris. Eur J Dermatol. 2005;15:274-278.
- Jarratt MT, Brundage T. Efficacy and safety of clindamycin-tretinoin gel versus clindamycin or tretinoin alone in acne vulgaris: a randomized, double-blind, vehicle-controlled study. J Drugs Dermatol. 2012;11:318-326.
- Benzaclin. Med Library website. http://medlibrary.org/lib/rx/meds/benzaclin-3. Updated May 8, 2013. Accessed January 24, 2017.
- Walsh TR, Efthimiou J, Dréno B. Systematic review of antibiotic resistance in acne: an increasing topical and oral threat. Lancet Infect Dis. 2016;16:E23-E33.
- Jeremy AH, Holland DB, Roberts SG, et al. Inflammatory events are involved in acne lesion initiation. J Invest Dermatol. 2003;121:20-27.
- Kircik LH. Re-evaluating treatment targets in acne vulgaris: adapting to a new understanding of pathophysiology. J Drugs Dermatol. 2014;13:S57-S60.
- Salzer S, Kresse S, Hirai Y, et al. Cathelicidin peptide LL-37 increases UVB-triggered inflammasome activation: possible implications for rosacea. J Dermatol Sci. 2014;76:173-179.
- Buhl T, Sulk M, Nowak P, et al. Molecular and morphological characterization of inflammatory infiltrate in rosacea reveals activation of Th1/Th17 pathways. J Invest Dermatol. 2015;135:2198-2208.
- Kistowska M, Meier B, Proust T, et al. Propionibacterium acnes promotes Th17 and Th17/Th1 responses in acne patients. J Invest Dermatol. 2015;135:110-118.
- Zeichner JA. Inflammatory acne treatment: review of current and new topical therapeutic options. J Drugs Dermatol. 2016;15(1 suppl 1):S11-S16.
- Nakano T, Hiramatsu K, Kishi K, et al. Clindamycin modulates inflammatory-cytokine induction in lipopolysaccharide-stimulated mouse peritoneal macrophages. Antimicrob Agents Chemother. 2003;47:363-367.
- Orman KL, English BK. Effects of antibiotic class on the macrophage inflammatory response to Streptococcus pneumoniae. J Infect Dis. 2000;182:1561-1565.
- Taylor M, Gonzalez M, Porter R. Pathways to inflammation: acne pathophysiology. Eur J Dermatol. 2011;21:323-333.
- Del Rosso JQ, Kircik LH. The sequence of inflammation, relevant biomarkers, and the pathogenesis of acne vulgaris: what does recent research show and what does it mean to the clinician? J Drugs Dermatol. 2013;12(8 suppl):S109-S115.
- Leyden J, Kaidbey K, Levy SF. The combination formulation of clindamycin 1% plus benzoyl peroxide 5% versus 3 different formulations of topical clindamycin alone in the reduction of Propionibacterium acnes. an in vivo comparative study. Am J Clin Dermatol. 2001;2:263-266.
- Wang WL, Everett ED, Johnson M, et al. Susceptibility of Propionibacterium acnes to seventeen antibiotics. Antimicrob Agents Chemother. 1977;11:171-173.
- Steinhoff M, Schauber J, Leyden JJ. New insights into rosacea pathophysiology: a review of recent findings. J Am Acad Dermatol. 2013;69(6 suppl 1):S15-S26.
Practice Points
- Clindamycin cream 0.3% and 1% and clindamycin gel 1% were no more effective than their respective vehicles in the treatment of moderate to severe rosacea.
- Clindamycin may have no intrinsic anti-inflammatory activity in rosacea.
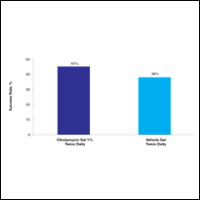
Adult diabetes up 35% over 25 years
The overall prevalence of diabetes increased 35% from 1988-1994 to 2011-2014 among adults aged 20 years and over, according the National Center for Health Statistics.
During 2011-2014, the age-adjusted prevalence of diabetes was 11.9% in adults aged 20 years and over, compared with 8.8% in 1988-1994. That 35% increase came despite a decrease in undiagnosed diabetes from 3.6% to 2.9% over that time period, which was not enough to offset a jump in physician-diagnosed disease from 5.2% to 9%, the NCHS reported in “Health, United States, 2016.”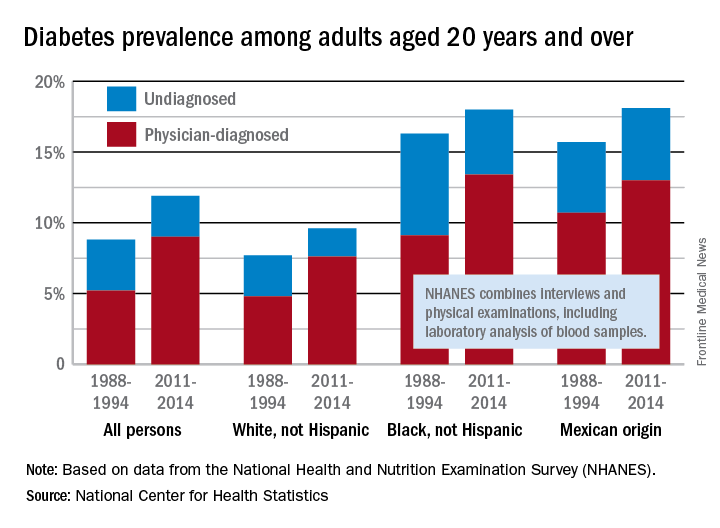
Undiagnosed diabetes dropped from 2.9% to 2% in whites and from 7.2% to 4.6% in blacks, but adults of Mexican origin saw a slight increase from 5% in 1988-1994 to 5.1% in 2011-2014. The physician-diagnosed side of the equation rose from 4.8% to 7.6% in whites, 9.1% to 13.4% in blacks, and 10.7% to 13% in those of Mexican origin, according to data from the National Health and Nutrition Examination Survey, which combines interviews and physical examinations, including laboratory analysis of blood samples.
Cosmetic Corner: Dermatologists Weigh in on Redness-Reducing Products
To improve patient care and outcomes, leading dermatologists offered their recommendations on redness-reducing products. Consideration must be given to:
- Avène Antirougeurs FORT Relief Concentrate
Pierre Fabre Dermo-Cosmetique USA
“This formula has medical-grade ruscus extract to support microcirculation and soothe skin reactivity and redness, as well as soothing Avène Thermal Spring Water.” — Jeannette Graf, MD, New York, New York
- Eucerin Redness Relief
Beiersdorf Inc
“Eucerin’s Redness Relief product line has worked well for some of my patients.” — Gary Goldenberg, MD, New York, New York
- Redness Solutions Daily Protective Base Broad Spectrum SPF 15
Clinique Laboratories, LLC
“This oil-free makeup primer has a sheer green tint that camouflages redness while also protecting from UV rays.” — Shari Lipner, MD, PhD, New York, New York
Cutis invites readers to send us their recommendations. Athlete’s foot treatments, cleansing devices, and men’s products will be featured in upcoming editions of Cosmetic Corner. Please email your recommendation(s) to the Editorial Office.
Disclaimer: Opinions expressed herein do not necessarily reflect those of Cutis or Frontline Medical Communications Inc. and shall not be used for product endorsement purposes. Any reference made to a specific commercial product does not indicate or imply that Cutis or Frontline Medical Communications Inc. endorses, recommends, or favors the product mentioned. No guarantee is given to the effects of recommended products.
Foreign Body Insertions: A Review
Anorectal and urethral foreign body insertions (polyembolokoilamania) are not infrequent presentations to the ED. The motivations behind these insertions vary, ranging from autoeroticism to reckless behavior. These insertions can lead to major complications and even death. Though ED staff members are used to the unpredictability of human behavior, foreign body insertions bring a mixture of responses from the staff, ranging from awe and incredulousness to anger and frustration. A knowledge and comfort in managing these cases includes a nonjudgmental triage assessment, collective professionalism, and self-awareness of the staff’s reaction.
Case 1
A 58-year-old man presented to the ED for evaluation of a foreign body in his rectum. He admitted to placing a beer bottle in his rectum, but was unable to remove it at home. The staff reported that the patient was previously seen in the ED for removal of a vibrator from his rectum.
Radiographic evaluation in the form of an acute abdominal series was obtained and confirmed a beer bottle in the rectum (Figures 1 and 2).


Case 2
A 55-year-old man presented to the ED after he inserted a pen cap into his urethra to aid in obtaining an erection. A pelvic X-ray was obtained and showed a radiolucent structure in the penis (Figure 3). 

The patient was admitted to the hospital and taken to the OR by the consulting urologist. Using a rigid cystoscope and flexible graspers, the pen cap was removed from the proximal urethra under monitored anesthesia control. The procedure went without any complications.
A psychiatrist was consulted, and during the encounter, the patient admitted that his behavior was pathological. He revealed that he was a victim of child abuse and reported he had been having mixed emotions of anxiety, guilt, and embarrassment because of his behavior.

Discussion
Foreign body insertions are seen in patients with a wide variety of backgrounds, ages, and lifestyles. Approximately 80,000 cases of foreign body ingestion are seen annually in children under age 20 years. Young males have a higher predilection of swallowing foreign bodies when compared to young females,1 and rectal foreign body insertions are seen more commonly in males than in females.2 In this age group, intentional foreign body insertion may be an initial manifestation of psychiatric illness.

Rectal Insertions
The earliest published report of a rectal foreign body insertion was in 1919 by Smiley.6 The typical age at presentation ranges from 20 to 90 years old, with a mean age of 44 years old.2 Household objects such as bottles and glasses are the most commonly seen, but a long list of other items have also been reported in the literature, including toothbrushes, knives, deodorant bottles, food articles, sports equipment, cell phones, flashlights, wooden rods, broomsticks, sex toys, light bulbs, construction tools, nails, ornaments, aerosol canisters, cocaine packets, jewelry, batteries, guitar picks, and many other items.1,2,7
In nearly half of the reported cases, the reasons for rectal insertion was for sexual arousal/stimulation.1,7 Other reasons include nonsuicidal injurious behavior (eg, borderline personality disorder); suicide attempt; psychosis; depression; factitious disorder; malingering; cognitive disorders, including dementia and delirium; treatment of constipation and hemorrhoids; concealment; attention-seeking behavior; “accidental”; assault; and the consequences of drunken wagers.1,2 Additionally, abuse should be considered, especially in patients with developmental delay and/or psychiatric illness.
Close to 20% of all traumatic rectal injuries are due to foreign body insertions. In most cases, foreign bodies fail to cause significant anorectal injuries. Complications, however, can result from the process of insertion, removal, or from the contents introduced into the orifice.1 Any rectal examination should be preceded by an anatomical survey utilizing radiographic modalities to evaluate the integrity and orientation of the object in question. Any sharp object can injure the examining physician if this is not done prior. All examinations should be chaperoned.2,7 The most obvious and dangerous complication is perforation, and the patient’s care should proceed in the same manner as any other trauma patient. Additionally, resulting sepsis should be managed with the same standards as any other septic patient.7
Treatment. The method of object removal is determined by the presence or absence of a surgical abdomen and the need for general anesthesia. The location and shape of the object, however, may not equate with successful retrieval. Objects placed in the sigmoid colon are more than twice as likely to require surgical intervention compared to items placed distally.2 Once it is determined that the patient is clinically stable and does not have an acute abdomen, attempts in removing the rectal foreign object can be done in the ED or, if anesthesia is needed, in the OR. Any attempts at transanal removal require optimal patient relaxation, which can be achieved via procedural sedation. The patient should be placed in a lithotomy or left lateral decubitus position to allow palpation of the object in the lower gastrointestinal tract. From here, several methods of removal can be employed. Blunt objects can be grasped and removed by a gloved hand or with a clamp. A Foley catheter can also be passed alongside the object and the balloon inflated above the foreign body to aid in extraction as the Foley is pulled out slowly. Sengstaken-Blakemore tubes, obstetric forceps, and vacuum extractors have also been utilized.7
While bedside extraction is advocated by many authors, Cawich et al8 recently reported that transanal extraction in the ED failed in 89% of cases. Additionally, these researchers reported that in 63% of the failed extractions, the objects were inadvertently pushed higher into the rectosigmoid region, and therefore recommended early mobilization of the OR team so that exploration under anesthesia can be performed under optimal conditions.8
Once the foreign body is successfully removed, follow-up imaging or postextraction endoscopy is warranted. Close observation in the hospital is recommended to facilitate serial abdominal examination.7
Urethral Insertions
Sexual exploration, efforts at contraception, transport of illicit drugs, assault or sexual violence, and accidental insertion have all been described as reasons for genitourinary (GU) insertion.1 The motives, however, mirror those who insert foreign bodies rectally.
Most presentations are due to pain or inability to void. Aggressive treatment should be undertaken because even when the penis appears dark or necrotic, salvage rates have been high. Complications include urinary tract infections, hematuria, urinary retention, urethral tears, abscess, ascending GU infections, and diverticula and fistula formations.1,3 In women, vaginal insertions can lead to pelvic pain and septic shock.1 Foreign bodies can also lead to a condition first described in the ancient literature as strangury—the process of slow and painful discharge of urine due to a significant inflammatory component or stricture. The term strangury has been replaced with the more general term bladder spasms.9
Treatment. Removal of urethral foreign bodies typically is done in conjunction with a urologist. A cystoscopic procedure is usually successful in removing the foreign body and is an effective method to minimize urethral and bladder injuries. However, more invasive surgical options, including perineal urethrotomy, suprapubic cystostomy, cystolithotomy, and external urethrotomy, have been used in more complicated cases or when the foreign body prevents urethral access of an endoscopic instrument.10
Patient and Staff Reactions
When patients realize they are unable to remove the inserted object, some present immediately to the ED for evaluation. Interestingly, others may wait up to 2 weeks after insertion before seeking help.2 Patients report feelings of being ashamed and report a feeling of being despised, frowned upon, and being talked about during the course of their ED evaluation. As a consequence, these patients may not readily come to the ED or if they do come, may not be open to conversation and hide the true reason of why they came in the first place.1,4 The amplified paranoia and perceived prejudice may delay diagnosis and lifesaving measures, or worse, lead patients to leave prior to a medical screening examination. Therefore, creating a nonjudgmental environment is essential, even when the presenting story appears to be fabricated.2
Once the patient’s foreign body is removed, and complications are excluded or properly managed, the goal is to understand the motivation behind the insertion, mitigate the consequences of the behavior, and prevent future recurrence. A psychiatric evaluation should be obtained in the ED, or if the patient is admitted, during hospitalization. Psychiatric behavior leading to insertions can be unmasked, treated, and harm-reduction strategies can be taught and instituted.1,3
Experienced ED staff members are used to the unpredictability of human behavior. However, patients who present with foreign body insertions can elicit a mixture of responses, ranging from awe and incredulousness to anger and frustration. It is not unusual for staff members to not understand or recognize their own reactions. The unique nature of the presentation, along with the astonishing radiographic images, can lead to a breach of privacy and dissemination of the digital photographs by cell phones and into social media sites.1 Staff members should be encouraged to foster open-mindedness and indifference. Ensuring privacy, professionalism, and empathy can go a long way to helping these patients. Moreover, ED staff members should be educated about countertransference reactions,1 as these actions are necessary to ensure the singular purpose of optimum patient-staff relationship.
Conclusion
Patients with foreign body insertions challenge the ED staff, as the presenting complaint not only tests the collective technical know-how of the staff, but also their emotional competencies. A nonjudgmental and open-minded approach is crucial, with the tone set during triage. Coordination with surgical specialties should be done early to ensure safe removal and to identify and manage complications. Psychiatric evaluation should be strongly considered prior to disposition in an attempt to prevent future recurrences.
1. Unruh BT, Nejad SH, Stern TW, Stern TA. Insertion of foreign bodies (polyembolokoilamania): underpinnings and management strategies. Prim Care Companion CNS Disord. 2012;14(1). doi:10.4088/PCC.11f01192.
2. Cologne KG, Ault GT. Rectal foreign bodies: what is the current standard? Clin Colon Rectal Surg. 2012;25(4):214-218. doi:10.1055/s-0032-1329392.3. Naidu K, Chung A, Mulcahy M. An unusual urethral foreign body. Int J Surg Case Rep. 2013;4(11):1052-1054. doi:10.1016/j.ijscr.2013.07.017.4. Rahman NU, Elliott SP, McAninch JW. Self-inflicted male urethral foreign body insertion: endoscopic management and complications. BJU Int. 2004;94(7):1051-1053. 10.1111/j.1464-410X.2004.05103.x.
5. SaiSwaroop Y, Darakh P, Amlani D. Self insertion of urethral foreign body in a child: a rare case report. Int J Curr Med Appl Sci. 2015;9(1):22-24.
6. Smiley O. A glass tumbler in the rectum. JAMA. 1919;72:1285.
7. Coskun A, Erkan N, Yakan S, Yıldirim M, Cengiz F. Management of rectal foreign bodies. World J Emerg Surg. 2013;8(1):11. doi:10.1186/1749-7922-8-11.
8. Cawich SO, Thomas DA, Mohammed F, Bobb NJ, Williams D, Naraynsingh V. A management algorithm for retained rectal foreign bodies. Am J Mens Health. 2017;11(3):684-692. doi:10.1177/1557988316680929.
9. Wright B, Husbands E. Strangury: the case of a symptom with ancient origins. BMJ Support Palliat Care. 2011;1(1):49-50. doi:10.1136/bmjspcare-2011-000030.
10. Moon SJ, Kim DH, Chung JH, et al. Unusual foreign bodies in the urinary bladder and urethra due to autoerotism. Int Neurourol J. 2010;14(3):186-189. doi:10.5213/inj.2010.14.3.186.
Anorectal and urethral foreign body insertions (polyembolokoilamania) are not infrequent presentations to the ED. The motivations behind these insertions vary, ranging from autoeroticism to reckless behavior. These insertions can lead to major complications and even death. Though ED staff members are used to the unpredictability of human behavior, foreign body insertions bring a mixture of responses from the staff, ranging from awe and incredulousness to anger and frustration. A knowledge and comfort in managing these cases includes a nonjudgmental triage assessment, collective professionalism, and self-awareness of the staff’s reaction.
Case 1
A 58-year-old man presented to the ED for evaluation of a foreign body in his rectum. He admitted to placing a beer bottle in his rectum, but was unable to remove it at home. The staff reported that the patient was previously seen in the ED for removal of a vibrator from his rectum.
Radiographic evaluation in the form of an acute abdominal series was obtained and confirmed a beer bottle in the rectum (Figures 1 and 2).
Case 2
A 55-year-old man presented to the ED after he inserted a pen cap into his urethra to aid in obtaining an erection. A pelvic X-ray was obtained and showed a radiolucent structure in the penis (Figure 3).
The patient was admitted to the hospital and taken to the OR by the consulting urologist. Using a rigid cystoscope and flexible graspers, the pen cap was removed from the proximal urethra under monitored anesthesia control. The procedure went without any complications.
A psychiatrist was consulted, and during the encounter, the patient admitted that his behavior was pathological. He revealed that he was a victim of child abuse and reported he had been having mixed emotions of anxiety, guilt, and embarrassment because of his behavior.
Discussion
Foreign body insertions are seen in patients with a wide variety of backgrounds, ages, and lifestyles. Approximately 80,000 cases of foreign body ingestion are seen annually in children under age 20 years. Young males have a higher predilection of swallowing foreign bodies when compared to young females,1 and rectal foreign body insertions are seen more commonly in males than in females.2 In this age group, intentional foreign body insertion may be an initial manifestation of psychiatric illness.
Rectal Insertions
The earliest published report of a rectal foreign body insertion was in 1919 by Smiley.6 The typical age at presentation ranges from 20 to 90 years old, with a mean age of 44 years old.2 Household objects such as bottles and glasses are the most commonly seen, but a long list of other items have also been reported in the literature, including toothbrushes, knives, deodorant bottles, food articles, sports equipment, cell phones, flashlights, wooden rods, broomsticks, sex toys, light bulbs, construction tools, nails, ornaments, aerosol canisters, cocaine packets, jewelry, batteries, guitar picks, and many other items.1,2,7
In nearly half of the reported cases, the reasons for rectal insertion was for sexual arousal/stimulation.1,7 Other reasons include nonsuicidal injurious behavior (eg, borderline personality disorder); suicide attempt; psychosis; depression; factitious disorder; malingering; cognitive disorders, including dementia and delirium; treatment of constipation and hemorrhoids; concealment; attention-seeking behavior; “accidental”; assault; and the consequences of drunken wagers.1,2 Additionally, abuse should be considered, especially in patients with developmental delay and/or psychiatric illness.
Close to 20% of all traumatic rectal injuries are due to foreign body insertions. In most cases, foreign bodies fail to cause significant anorectal injuries. Complications, however, can result from the process of insertion, removal, or from the contents introduced into the orifice.1 Any rectal examination should be preceded by an anatomical survey utilizing radiographic modalities to evaluate the integrity and orientation of the object in question. Any sharp object can injure the examining physician if this is not done prior. All examinations should be chaperoned.2,7 The most obvious and dangerous complication is perforation, and the patient’s care should proceed in the same manner as any other trauma patient. Additionally, resulting sepsis should be managed with the same standards as any other septic patient.7
Treatment. The method of object removal is determined by the presence or absence of a surgical abdomen and the need for general anesthesia. The location and shape of the object, however, may not equate with successful retrieval. Objects placed in the sigmoid colon are more than twice as likely to require surgical intervention compared to items placed distally.2 Once it is determined that the patient is clinically stable and does not have an acute abdomen, attempts in removing the rectal foreign object can be done in the ED or, if anesthesia is needed, in the OR. Any attempts at transanal removal require optimal patient relaxation, which can be achieved via procedural sedation. The patient should be placed in a lithotomy or left lateral decubitus position to allow palpation of the object in the lower gastrointestinal tract. From here, several methods of removal can be employed. Blunt objects can be grasped and removed by a gloved hand or with a clamp. A Foley catheter can also be passed alongside the object and the balloon inflated above the foreign body to aid in extraction as the Foley is pulled out slowly. Sengstaken-Blakemore tubes, obstetric forceps, and vacuum extractors have also been utilized.7
While bedside extraction is advocated by many authors, Cawich et al8 recently reported that transanal extraction in the ED failed in 89% of cases. Additionally, these researchers reported that in 63% of the failed extractions, the objects were inadvertently pushed higher into the rectosigmoid region, and therefore recommended early mobilization of the OR team so that exploration under anesthesia can be performed under optimal conditions.8
Once the foreign body is successfully removed, follow-up imaging or postextraction endoscopy is warranted. Close observation in the hospital is recommended to facilitate serial abdominal examination.7
Urethral Insertions
Sexual exploration, efforts at contraception, transport of illicit drugs, assault or sexual violence, and accidental insertion have all been described as reasons for genitourinary (GU) insertion.1 The motives, however, mirror those who insert foreign bodies rectally.
Most presentations are due to pain or inability to void. Aggressive treatment should be undertaken because even when the penis appears dark or necrotic, salvage rates have been high. Complications include urinary tract infections, hematuria, urinary retention, urethral tears, abscess, ascending GU infections, and diverticula and fistula formations.1,3 In women, vaginal insertions can lead to pelvic pain and septic shock.1 Foreign bodies can also lead to a condition first described in the ancient literature as strangury—the process of slow and painful discharge of urine due to a significant inflammatory component or stricture. The term strangury has been replaced with the more general term bladder spasms.9
Treatment. Removal of urethral foreign bodies typically is done in conjunction with a urologist. A cystoscopic procedure is usually successful in removing the foreign body and is an effective method to minimize urethral and bladder injuries. However, more invasive surgical options, including perineal urethrotomy, suprapubic cystostomy, cystolithotomy, and external urethrotomy, have been used in more complicated cases or when the foreign body prevents urethral access of an endoscopic instrument.10
Patient and Staff Reactions
When patients realize they are unable to remove the inserted object, some present immediately to the ED for evaluation. Interestingly, others may wait up to 2 weeks after insertion before seeking help.2 Patients report feelings of being ashamed and report a feeling of being despised, frowned upon, and being talked about during the course of their ED evaluation. As a consequence, these patients may not readily come to the ED or if they do come, may not be open to conversation and hide the true reason of why they came in the first place.1,4 The amplified paranoia and perceived prejudice may delay diagnosis and lifesaving measures, or worse, lead patients to leave prior to a medical screening examination. Therefore, creating a nonjudgmental environment is essential, even when the presenting story appears to be fabricated.2
Once the patient’s foreign body is removed, and complications are excluded or properly managed, the goal is to understand the motivation behind the insertion, mitigate the consequences of the behavior, and prevent future recurrence. A psychiatric evaluation should be obtained in the ED, or if the patient is admitted, during hospitalization. Psychiatric behavior leading to insertions can be unmasked, treated, and harm-reduction strategies can be taught and instituted.1,3
Experienced ED staff members are used to the unpredictability of human behavior. However, patients who present with foreign body insertions can elicit a mixture of responses, ranging from awe and incredulousness to anger and frustration. It is not unusual for staff members to not understand or recognize their own reactions. The unique nature of the presentation, along with the astonishing radiographic images, can lead to a breach of privacy and dissemination of the digital photographs by cell phones and into social media sites.1 Staff members should be encouraged to foster open-mindedness and indifference. Ensuring privacy, professionalism, and empathy can go a long way to helping these patients. Moreover, ED staff members should be educated about countertransference reactions,1 as these actions are necessary to ensure the singular purpose of optimum patient-staff relationship.
Conclusion
Patients with foreign body insertions challenge the ED staff, as the presenting complaint not only tests the collective technical know-how of the staff, but also their emotional competencies. A nonjudgmental and open-minded approach is crucial, with the tone set during triage. Coordination with surgical specialties should be done early to ensure safe removal and to identify and manage complications. Psychiatric evaluation should be strongly considered prior to disposition in an attempt to prevent future recurrences.
1. Unruh BT, Nejad SH, Stern TW, Stern TA. Insertion of foreign bodies (polyembolokoilamania): underpinnings and management strategies. Prim Care Companion CNS Disord. 2012;14(1). doi:10.4088/PCC.11f01192.
2. Cologne KG, Ault GT. Rectal foreign bodies: what is the current standard? Clin Colon Rectal Surg. 2012;25(4):214-218. doi:10.1055/s-0032-1329392.3. Naidu K, Chung A, Mulcahy M. An unusual urethral foreign body. Int J Surg Case Rep. 2013;4(11):1052-1054. doi:10.1016/j.ijscr.2013.07.017.4. Rahman NU, Elliott SP, McAninch JW. Self-inflicted male urethral foreign body insertion: endoscopic management and complications. BJU Int. 2004;94(7):1051-1053. 10.1111/j.1464-410X.2004.05103.x.
5. SaiSwaroop Y, Darakh P, Amlani D. Self insertion of urethral foreign body in a child: a rare case report. Int J Curr Med Appl Sci. 2015;9(1):22-24.
6. Smiley O. A glass tumbler in the rectum. JAMA. 1919;72:1285.
7. Coskun A, Erkan N, Yakan S, Yıldirim M, Cengiz F. Management of rectal foreign bodies. World J Emerg Surg. 2013;8(1):11. doi:10.1186/1749-7922-8-11.
8. Cawich SO, Thomas DA, Mohammed F, Bobb NJ, Williams D, Naraynsingh V. A management algorithm for retained rectal foreign bodies. Am J Mens Health. 2017;11(3):684-692. doi:10.1177/1557988316680929.
9. Wright B, Husbands E. Strangury: the case of a symptom with ancient origins. BMJ Support Palliat Care. 2011;1(1):49-50. doi:10.1136/bmjspcare-2011-000030.
10. Moon SJ, Kim DH, Chung JH, et al. Unusual foreign bodies in the urinary bladder and urethra due to autoerotism. Int Neurourol J. 2010;14(3):186-189. doi:10.5213/inj.2010.14.3.186.
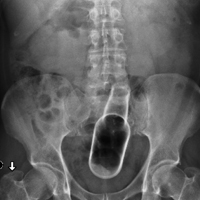
Telomere length predicts FCR response in CLL patients
NEW YORK – Telomere length reliably predicts response to fludarabine-cyclophosphamide-rituximab (FCR) treatment in patients with chronic lymphocytic leukemia, according to an analysis of 278 samples from the ARCTIC and ADMIRE clinical trials of FCR in previously untreated CLL.
The findings were particularly pronounced in the immunoglobulin heavy-chain variable region gene (IGHV)–mutated patients and suggest a role for telomere measurement as a predictive tool in risk-adapted clinical trials, Kevin Norris reported in a poster at the annual International Workshop on Chronic Lymphocytic Leukemia.
Short telomere length was associated with quicker time to progression (median of 3.9 years vs. 5.5 years; hazard ratio[HR], 2.04) and reduced overall survival (OS) (median of 5.5 years vs. OS not reached; HR, 2.1), compared with long telomere length. IGHV-mutated patients with short telomeres were more than five times more likely to relapse (median progression-free survival 2.97 vs. PFS not reached; HR, 5.1), and more than four times more likely to die than were patients with long telomere length (median OS, 4.15 years vs. OS not reached; HR, 4.16), said Mr. Norris, a research associate at Cardiff (Wales) University.
The association between telomere length and FCR response was less pronounced among IGHV-unmutated patients, but those with short telomeres in this group still had an inferior response and shorter survival, compared with those with long telomeres (HR, 1.6 and 1.6, respectively), he noted.
Mr. Norris also noted that in contrast to the telomere length findings, CD38 expression and b2-microglobulin were not predictive of time to progression or OS.
“In multivariate analysis, telomere length was the dominant covariable for both PFS (HR, 2.58) and OS (HR, 2.84); when telomere length was entered into the model no other variable retained independent prognostic significance,” he and his colleagues wrote.
Telomere length in this analysis was assessed by use of the high throughput single telomere length analysis (HT-STELA) assay.
It has recently been shown that a proportion of IGHV-mutated CLL patients treated with FCR can achieve long-term remissions. The current findings demonstrate that these patients can be accurately identified by measuring telomere length, the investigators said, noting that they saw a similar pattern in patients in the UK CLL4 trial who were treated with fludarabine and cyclophosphamide
“Our results demonstrate that telomere length is the major determinant of response and survival following treatment with FCR,” they wrote. “IGHV-mutated patients with longer telomeres have a high probability of achieving a long-term remission following treatment with FCR (greater than 81% survival after 5 years). Equally, IGHV-mutated patients with short dysfunctional telomeres show a markedly inferior response to FCR and should be considered for alternative treatment options in the frontline setting.”
Patient material for this study was obtained from the UK CLL Trials Biobank, University of Liverpool, which is funded by Bloodwise. The authors reported having no other disclosures.
AT THE iwCLL MEETING
Key clinical point:
Major finding: Short vs. long telomere length was associated with quicker time to progression and reduced overall survival (hazard ratios, 2.04 and 2.1, respectively).
Data source: An analysis of 278 samples from the ARCTIC and ADMIRE trials.
Disclosures: Patient material for this study was obtained from the UK CLL Trials Biobank, University of Liverpool, which is funded by Bloodwise. The authors reported having no other disclosures.