User login
Applying Military Strategy to Complex Knee Reconstruction: Tips for Planning and Executing Advanced Surgery
Take-Home Points
- Thorough preoperative planning is imperative and inclusive of history, physical examination, radiographs, and MRI and potentially CT scan.
- Plan carefully for needed graft sources (autografts and allografts).
- Rehabilitation starts preoperatively and a detailed individualized plan is often warranted.
- Indicated ligamentous repair or augmented repair with reconstruction is more likely to succeed when performed within 2 weeks of injury.
- Complex combined knee restoration surgery can be safely performed in an outpatient setting.
Complex combined knee restoration surgery can be safely performed in an outpatient setting. The term complex knee restoration is used to describe management of knee injuries that are more involved—that is, there is damage to the menisci, cartilage, ligaments, and bones. Management entails not only determining the best treatment options but navigating the more complex logistics of making sure all necessary grafts (fresh and frozen allografts and autografts), implants, and instrumentation are readily available as these cases come to fruition.
The military healthcare paradigm often involves the added logistics of transporting the service member to the correct military treatment facility at the correct time and ensuring the patient’s work-up is complete before he or she arrives for the complex knee restoration. Such cases require significant rehabilitation and time away from family and work, so anything that reduces the morbidity of the surgical undertaking and the overall “morbidity footprint” of time away and that helps the patient return to normal function are value-added and worthy of our attention and diligence in developing an efficient system for managing complex cases.
The globally integrated military healthcare system that is in place has matured over the past decades to allow for the significant majority of the necessary preoperative work-up to be performed at a soldier’s current duty station, wherever in the world that may be, under the guidance of local healthcare providers with specific inputs from the knee restoration surgeon who eventually receives the patient for the planned surgical intervention.
Algorithm for Knee Restoration Planning
Alignment Issues
The first task is to confirm the realignment indication. Realignment may be performed with a proximal opening-wedge medial tibial osteotomy (OWMTO), a distal opening-wedge lateral femoral osteotomy (OWLFO), or a tibial tubercle osteotomy (TTO).1 Given the reproducible clinical improvement achieved and the robust nature of the fixation, these osteotomies are often the first surgical step in complex knee restorations.2 The final determination, made by the surgeon in consultation with the patient, is whether to perform the indicated osteotomy alone or in combination with the rest of the planned restoration surgery. In the vast majority of cases I have managed over the past 2 decades, I have performed the entire knee restoration in a single operation.3 Within the past 5 years, combining the procedures has become even more feasible with the important progress made in multimodal pain management and with the close collaboration of anesthesiologists.4
Meniscus and Cartilage Status
The integration status of meniscus and cartilage within the medial and lateral tibiofemoral compartments is crucial to the comprehensive restoration plan. In fact, the success of the restoration can be said to be dependent on the functional status and health of meniscus and cartilage—which either succeed together or fail apart.
Important covariables are age, prior surgical interventions, activity level expected or allowed after surgery, and size, location, and depth of cartilage injury.5 Whether a cartilage injury is monopolar or bipolar is determined with advanced imaging (magnetic resonance imaging [MRI], computed tomography [CT], weight-bearing radiography) along with analysis of a thorough history (including a review of prior operative reports and arthroscopic images) and a knee examination. Bipolar injuries that involve the condyle and juxtaposed plateau often bode poorly for good clinical outcomes—compared with unipolar lesions, which usually involve the condylar surfaces in isolation. The same thinking regarding the patellofemoral compartment is appropriate. Cartilage lesions that involve the juxtaposed surfaces of the patellar and trochlear groove do poorer than isolated lesions, which are more amenable to cartilage restoration options. The literature on potential cartilage restoration options for the patella and trochlea is expanding. I use the 3-dimensional cartilage restoration option of a fresh patellar osteochondral allograft (OCA) for high-grade cartilage lesions thought to be clinically significant. Other options, such as microfracture, cell-based cartilage restoration, and Osteochondral Autograft Transfer System (Arthrex) procedures (from the thinner condylar cartilage), have varied in their outcomes for patellar lesions. According to more recent literature and a review of my clinical results, fresh patellar OCAs are a good option for patellar lesions.6 Similarly, trochlear lesions can be managed with microfracture, cell-based therapies, or fresh OCAs, depending on surgeon preference.
Functional total or subtotal meniscectomies are often best managed with meniscal allograft transplantation (MAT). An intact or replaced medial or lateral meniscus works synergistically with any planned anterior cruciate ligament (ACL) reconstruction. Again, the adage that meniscus and cartilage succeed together or fail apart is appropriate when planning complex knee restoration. Signs of extrusion or joint-space narrowing and root avulsion or significant loss of meniscal tissue, visualized on MRI or on prior surgical images, often help substantiate a MAT plan. MAT has had the best long-term results when performed in compartments with cartilage damage limited to grade I and grade II changes, in stable knees, and in knees that can be concurrently stabilized.5 Technological advances have increased the value of MAT by limiting the morbidity of the operation and thus allowing for other surgery to be performed concomitantly and safely as part of comprehensive knee restoration. Over the past 20 years, I have arthroscopically performed MAT with bone plugs for medial and lateral procedures, and my results with active-duty soldiers have been promising, paralleling the clinic success reported in the literature.5 Alignment must be considered when performing MAT or cartilage restoration. If the addition of meniscal transplantation or cartilage restoration leaves the knee with residual malalignment of 6° or more, corrective osteotomy is performed.
My view and practice have been to plan for an unloading chondroprotective osteotomy. The goal is a balanced mechanical axis, whether achieved with mere joint-space restoration or with an osteotomy added.
Ligament Status
A comprehensive plan for establishing ligamentous stability is paramount to the overall clinical success of complex knee restorations. Meniscus and cartilage restoration efforts are wasted if clinically significant ligamentous laxity is not concomitantly treated with reconstruction surgery. Revision ACL surgery is by far the most commonly performed surgery in complex knee cases. Diligence in interpreting advanced MRI and physical examination findings is required to make sure there are no concomitant patholaxities in the medial, lateral, posterior, posteromedial, and posterolateral ligamentous complexes. Appropriate ligamentous reconstruction is warranted to maximize clinical results in complex knee restorations. Such cases more commonly require allograft tissue, as the availability of autograft tissue is the limiting issue with 2 or more ligament reconstructions. Military treatment facilities, in which comprehensive knee restorations are performed, have soft-tissue allografts on hand at all times. Having tissue readily available makes it less imperative to determine the most appropriate combined ligamentous reconstruction surgery before the patient arrives—a process that is often difficult. This situation is in contradistinction to the need for specific matched-for-size allograft frozen meniscus and fresh cartilage tissues, both of which require tissue-form procurement in advance of planned restoration surgery.
Rehabilitation Plan
The rehabilitation plan is driven by the part of the complex knee restoration that demands the most caution with respect to weight-bearing and range of motion (ROM) during the first 6 weeks after surgery. The most limiting restorative surgeries involve meniscus and cartilage. Recent clinical trial results support weight-bearing soon after tibial osteotomy performed in the absence of meniscus and cartilage restoration that would otherwise limit weight-bearing for 6 weeks.7 Therefore, most of these complex knee restorations are appropriately managed with a hinged brace locked in extension for toe-touch weight-bearing ambulation, with ROM usually limited to 0° to 90° during the first 6 weeks. Quadriceps rehabilitation with straight-leg raises and isometric contractions is prescribed with a focus on maintaining full extension as the default resting knee position until normalized resting quadriceps tone returns. Full weight-bearing and advancement to full flexion are routinely allowed by 6 weeks.
Case Report
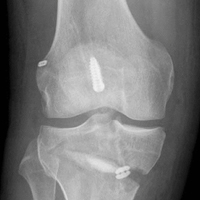
A 41-year-old male service member who was overseas was referred to my clinic for high tibial osteotomy consideration and possible revision ACL reconstruction. His symptoms were medial pain, recurrent instability, and patellofemoral crepitance. Three years earlier, he underwent autograft transtibial ACL reconstruction with significant débridement of the medial meniscus. Before his trip to the United States, I asked that new MRI scans, full-length standing hip–knee–ankle bilateral alignment radiographs, and a 4-view weight-bearing knee series (including a posteroanterior Rosenberg view) be obtained and sent for my review (Figure 1). 
Review of the patient’s detailed preoperative imaging work-up and electronic medical record (available through the military’s healthcare system) made it clear that far more surgical intervention was needed than originally assumed. A significant full-thickness chondral lesion of the patella and a subtotal medial meniscectomy would necessitate patellar cartilage restoration and medial MAT in addition to the high tibial osteotomy and revision ACL reconstruction.
Had this patient been sent through the military medical evacuation system, he would have had to make 2 overseas trips—one trip for preoperative evaluation and advanced imaging, whereby he would have been placed on a match list and had to wait for a requested meniscal allograft and an appropriate graft for his patella, and the other trip for his complex surgery. Fortunately, the military’s integrated healthcare network with true 2-way communication and the collaborative use of integrated electronic medical records proved extremely valuable in making management of this complex knee restoration as efficient as possible. From the perspective of the soldier and his military unit, only 1 big overseas trip was needed; from the perspective of the military healthcare system, responsible use of healthcare personnel and monetary resources and well-planned complex knee restoration surgery saved a knee and allowed a soldier-athlete to rejoin the fields of friendly strife.
This patient had undergone functional complete medial meniscectomy and had significant medial compartment pain, varus alignment, and minimal medial joint-space narrowing (assumed grossly intact cartilage about plateau and condyle), plus patellofemoral pain and crepitance with a large high-grade posttraumatic patellar chondral lesion with normal patellofemoral alignment. He also had an isolated failed ACL graft from prior ACL reconstruction. The previous hardware placement was analyzed, and it was determined that the femoral interference screw could be left in place and that the tibial interference screw most likely would be removed. The mechanical axis determined from the bilateral long-leg standing images dictated a need for proximal OWMTO for correction up to 8° to allow the axis to cross the center of the knee. The 8° correction is the measured correction needed to move the axis from its pass through the medial compartment to a more balanced position across the middle of the knee.
The overall plan encompassed major concomitant corrective and restorative surgery: tibial osteotomy, medial MAT, revision ACL reconstruction, and fresh mega-patellar OCA. Once the frozen meniscus and eventually the fresh patella (both matched for size) were obtained, arrangements for the patient’s trip for the complex surgery were finalized.
Surgery was started with brief arthroscopic evaluation to confirm the overall appropriateness of the planned procedure and to determine if any other minor deficiencies would warrant operative intervention. Once confirmed, the restoration proceeded as planned. The OWMTO was performed with a PEEK (polyetheretherketone) wedge implant (iBalance; Arthrex) followed by arthroscopic preparation for medial MAT with removal of any meniscal remnants and placement of passing sutures (Figure 2A).


When the arthroscopic portion of the surgery was finished, a medial parapatellar arthrotomy was made to allow the patella to be inverted and complete fresh mega-patellar OCA placement (Figure 4).


The knee was placed in a ROM brace locked in full extension. The patient was able to do straight-leg raises and calf pumps in the recovery room and was discharged home with a saphenous nerve block and an iPACK (Interspace between the Popliteal Artery and the Capsule of the posterior Knee) nerve block in place. Home-based therapy was started immediately. After the patient’s first postoperative visit, formal therapy (discussed earlier) was initiated (Figure 6).

Discussion
All-inside GraftLink ACL reconstruction with cortical suspensory fixation appears well suited to combined medial and lateral MAT and/or cartilage restoration—whether it be large fresh OCA combined with medial MAT (as in this patient’s case) or another form of cartilage restoration. Arthroscopic MAT with anatomically fashioned and placed bone plugs minimizes the morbidity within the notch footprints and allows for discrete revision socket formation for both femoral and tibial ACL graft placement. In this case, preparation for the medial MAT and ACL sockets was followed by MAT/ACL construct implantation and secure fixation. The arthrotomy was thereby minimized and placed to allow for efficient mega-patellar OCA graft placement.
Over the past decade, I have performed similar concomitant procedures using the same surgical principles that allow for efficient and reproducible complex knee restoration (Figure 7).
Although use of an algorithm for the management of complex knee restorations is not universally feasible, I offer guidelines for complex knee injuries:
- At each decision point, determine whether the knee and the patient can withstand the planned surgical intervention.
- After deciding to proceed with knee restoration, list the meniscus, cartilage, and ligament injuries that must be addressed.
- Determine which repairs (meniscus, cartilage, ligament) are warranted. Repairs generally are best performed within a period of 7 to 14 days.
- Determine which ligament injuries warrant reconstruction. Allograft tissue typically is used for multiligament reconstruction.
- Rank-order the ligament reconstruction requirements. It is fine to proceed with all of the reconstructions if the case is moving smoothly, if there are no developing tourniquet-time issues, and if the soft-tissue envelope is responding as expected.
- Consider autograft and/or allograft tissue needs for concomitant or staged meniscus and cartilage restoration options/requirements.
Am J Orthop. 2017;46(4):170-175, 202. Copyright Frontline Medical Communications Inc. 2017. All rights reserved.
1. Uquillas C, Rossy W, Nathasingh CK, Strauss E, Jazrawi L, Gonzalez-Lomas G. Osteotomies about the knee: AAOS exhibit selection. J Bone Joint Surg Am. 2014;96(24):e199.
2. Mehl J, Paul J, Feucht MJ, et al. ACL deficiency and varus osteoarthritis: high tibial osteotomy alone or combined with ACL reconstruction? Arch Orthop Trauma Surg. 2017;137(2):233-240.
3. Scordino LE, DeBerardino TM. Surgical treatment of osteoarthritis in the middle-aged athlete: new horizons in high tibial osteotomies. Sports Med Arthrosc. 2013;21(1):47-51.
4. Ferrari D, Lopes TJ, França PF, Azevedo FM, Pappas E. Outpatient versus inpatient anterior cruciate ligament reconstruction: a systematic review with meta-analysis. Knee. 2017;24(2):197-206.
5. Weber AE, Gitelis ME, McCarthy MA, Yanke AB, Cole BJ. Malalignment: a requirement for cartilage and organ restoration. Sports Med Arthrosc. 2016;24(2):e14-e22.
6. Prince MR, King AH, Stuart MJ, Dahm DL, Krych AJ. Treatment of patellofemoral cartilage lesions in the young, active patient. J Knee Surg. 2015;28(4):285-295.
7. Scordino LE, DeBerardino TM. Surgical treatment of osteoarthritis in the middle-aged athlete: new horizons in high tibial osteotomies. Sports Med Arthrosc. 2013;21(1):47-51.
Take-Home Points
- Thorough preoperative planning is imperative and inclusive of history, physical examination, radiographs, and MRI and potentially CT scan.
- Plan carefully for needed graft sources (autografts and allografts).
- Rehabilitation starts preoperatively and a detailed individualized plan is often warranted.
- Indicated ligamentous repair or augmented repair with reconstruction is more likely to succeed when performed within 2 weeks of injury.
- Complex combined knee restoration surgery can be safely performed in an outpatient setting.
Complex combined knee restoration surgery can be safely performed in an outpatient setting. The term complex knee restoration is used to describe management of knee injuries that are more involved—that is, there is damage to the menisci, cartilage, ligaments, and bones. Management entails not only determining the best treatment options but navigating the more complex logistics of making sure all necessary grafts (fresh and frozen allografts and autografts), implants, and instrumentation are readily available as these cases come to fruition.
The military healthcare paradigm often involves the added logistics of transporting the service member to the correct military treatment facility at the correct time and ensuring the patient’s work-up is complete before he or she arrives for the complex knee restoration. Such cases require significant rehabilitation and time away from family and work, so anything that reduces the morbidity of the surgical undertaking and the overall “morbidity footprint” of time away and that helps the patient return to normal function are value-added and worthy of our attention and diligence in developing an efficient system for managing complex cases.
The globally integrated military healthcare system that is in place has matured over the past decades to allow for the significant majority of the necessary preoperative work-up to be performed at a soldier’s current duty station, wherever in the world that may be, under the guidance of local healthcare providers with specific inputs from the knee restoration surgeon who eventually receives the patient for the planned surgical intervention.
Algorithm for Knee Restoration Planning
Alignment Issues
The first task is to confirm the realignment indication. Realignment may be performed with a proximal opening-wedge medial tibial osteotomy (OWMTO), a distal opening-wedge lateral femoral osteotomy (OWLFO), or a tibial tubercle osteotomy (TTO).1 Given the reproducible clinical improvement achieved and the robust nature of the fixation, these osteotomies are often the first surgical step in complex knee restorations.2 The final determination, made by the surgeon in consultation with the patient, is whether to perform the indicated osteotomy alone or in combination with the rest of the planned restoration surgery. In the vast majority of cases I have managed over the past 2 decades, I have performed the entire knee restoration in a single operation.3 Within the past 5 years, combining the procedures has become even more feasible with the important progress made in multimodal pain management and with the close collaboration of anesthesiologists.4
Meniscus and Cartilage Status
The integration status of meniscus and cartilage within the medial and lateral tibiofemoral compartments is crucial to the comprehensive restoration plan. In fact, the success of the restoration can be said to be dependent on the functional status and health of meniscus and cartilage—which either succeed together or fail apart.
Important covariables are age, prior surgical interventions, activity level expected or allowed after surgery, and size, location, and depth of cartilage injury.5 Whether a cartilage injury is monopolar or bipolar is determined with advanced imaging (magnetic resonance imaging [MRI], computed tomography [CT], weight-bearing radiography) along with analysis of a thorough history (including a review of prior operative reports and arthroscopic images) and a knee examination. Bipolar injuries that involve the condyle and juxtaposed plateau often bode poorly for good clinical outcomes—compared with unipolar lesions, which usually involve the condylar surfaces in isolation. The same thinking regarding the patellofemoral compartment is appropriate. Cartilage lesions that involve the juxtaposed surfaces of the patellar and trochlear groove do poorer than isolated lesions, which are more amenable to cartilage restoration options. The literature on potential cartilage restoration options for the patella and trochlea is expanding. I use the 3-dimensional cartilage restoration option of a fresh patellar osteochondral allograft (OCA) for high-grade cartilage lesions thought to be clinically significant. Other options, such as microfracture, cell-based cartilage restoration, and Osteochondral Autograft Transfer System (Arthrex) procedures (from the thinner condylar cartilage), have varied in their outcomes for patellar lesions. According to more recent literature and a review of my clinical results, fresh patellar OCAs are a good option for patellar lesions.6 Similarly, trochlear lesions can be managed with microfracture, cell-based therapies, or fresh OCAs, depending on surgeon preference.
Functional total or subtotal meniscectomies are often best managed with meniscal allograft transplantation (MAT). An intact or replaced medial or lateral meniscus works synergistically with any planned anterior cruciate ligament (ACL) reconstruction. Again, the adage that meniscus and cartilage succeed together or fail apart is appropriate when planning complex knee restoration. Signs of extrusion or joint-space narrowing and root avulsion or significant loss of meniscal tissue, visualized on MRI or on prior surgical images, often help substantiate a MAT plan. MAT has had the best long-term results when performed in compartments with cartilage damage limited to grade I and grade II changes, in stable knees, and in knees that can be concurrently stabilized.5 Technological advances have increased the value of MAT by limiting the morbidity of the operation and thus allowing for other surgery to be performed concomitantly and safely as part of comprehensive knee restoration. Over the past 20 years, I have arthroscopically performed MAT with bone plugs for medial and lateral procedures, and my results with active-duty soldiers have been promising, paralleling the clinic success reported in the literature.5 Alignment must be considered when performing MAT or cartilage restoration. If the addition of meniscal transplantation or cartilage restoration leaves the knee with residual malalignment of 6° or more, corrective osteotomy is performed.
My view and practice have been to plan for an unloading chondroprotective osteotomy. The goal is a balanced mechanical axis, whether achieved with mere joint-space restoration or with an osteotomy added.
Ligament Status
A comprehensive plan for establishing ligamentous stability is paramount to the overall clinical success of complex knee restorations. Meniscus and cartilage restoration efforts are wasted if clinically significant ligamentous laxity is not concomitantly treated with reconstruction surgery. Revision ACL surgery is by far the most commonly performed surgery in complex knee cases. Diligence in interpreting advanced MRI and physical examination findings is required to make sure there are no concomitant patholaxities in the medial, lateral, posterior, posteromedial, and posterolateral ligamentous complexes. Appropriate ligamentous reconstruction is warranted to maximize clinical results in complex knee restorations. Such cases more commonly require allograft tissue, as the availability of autograft tissue is the limiting issue with 2 or more ligament reconstructions. Military treatment facilities, in which comprehensive knee restorations are performed, have soft-tissue allografts on hand at all times. Having tissue readily available makes it less imperative to determine the most appropriate combined ligamentous reconstruction surgery before the patient arrives—a process that is often difficult. This situation is in contradistinction to the need for specific matched-for-size allograft frozen meniscus and fresh cartilage tissues, both of which require tissue-form procurement in advance of planned restoration surgery.
Rehabilitation Plan
The rehabilitation plan is driven by the part of the complex knee restoration that demands the most caution with respect to weight-bearing and range of motion (ROM) during the first 6 weeks after surgery. The most limiting restorative surgeries involve meniscus and cartilage. Recent clinical trial results support weight-bearing soon after tibial osteotomy performed in the absence of meniscus and cartilage restoration that would otherwise limit weight-bearing for 6 weeks.7 Therefore, most of these complex knee restorations are appropriately managed with a hinged brace locked in extension for toe-touch weight-bearing ambulation, with ROM usually limited to 0° to 90° during the first 6 weeks. Quadriceps rehabilitation with straight-leg raises and isometric contractions is prescribed with a focus on maintaining full extension as the default resting knee position until normalized resting quadriceps tone returns. Full weight-bearing and advancement to full flexion are routinely allowed by 6 weeks.
Case Report
A 41-year-old male service member who was overseas was referred to my clinic for high tibial osteotomy consideration and possible revision ACL reconstruction. His symptoms were medial pain, recurrent instability, and patellofemoral crepitance. Three years earlier, he underwent autograft transtibial ACL reconstruction with significant débridement of the medial meniscus. Before his trip to the United States, I asked that new MRI scans, full-length standing hip–knee–ankle bilateral alignment radiographs, and a 4-view weight-bearing knee series (including a posteroanterior Rosenberg view) be obtained and sent for my review (Figure 1).
Review of the patient’s detailed preoperative imaging work-up and electronic medical record (available through the military’s healthcare system) made it clear that far more surgical intervention was needed than originally assumed. A significant full-thickness chondral lesion of the patella and a subtotal medial meniscectomy would necessitate patellar cartilage restoration and medial MAT in addition to the high tibial osteotomy and revision ACL reconstruction.
Had this patient been sent through the military medical evacuation system, he would have had to make 2 overseas trips—one trip for preoperative evaluation and advanced imaging, whereby he would have been placed on a match list and had to wait for a requested meniscal allograft and an appropriate graft for his patella, and the other trip for his complex surgery. Fortunately, the military’s integrated healthcare network with true 2-way communication and the collaborative use of integrated electronic medical records proved extremely valuable in making management of this complex knee restoration as efficient as possible. From the perspective of the soldier and his military unit, only 1 big overseas trip was needed; from the perspective of the military healthcare system, responsible use of healthcare personnel and monetary resources and well-planned complex knee restoration surgery saved a knee and allowed a soldier-athlete to rejoin the fields of friendly strife.
This patient had undergone functional complete medial meniscectomy and had significant medial compartment pain, varus alignment, and minimal medial joint-space narrowing (assumed grossly intact cartilage about plateau and condyle), plus patellofemoral pain and crepitance with a large high-grade posttraumatic patellar chondral lesion with normal patellofemoral alignment. He also had an isolated failed ACL graft from prior ACL reconstruction. The previous hardware placement was analyzed, and it was determined that the femoral interference screw could be left in place and that the tibial interference screw most likely would be removed. The mechanical axis determined from the bilateral long-leg standing images dictated a need for proximal OWMTO for correction up to 8° to allow the axis to cross the center of the knee. The 8° correction is the measured correction needed to move the axis from its pass through the medial compartment to a more balanced position across the middle of the knee.
The overall plan encompassed major concomitant corrective and restorative surgery: tibial osteotomy, medial MAT, revision ACL reconstruction, and fresh mega-patellar OCA. Once the frozen meniscus and eventually the fresh patella (both matched for size) were obtained, arrangements for the patient’s trip for the complex surgery were finalized.
Surgery was started with brief arthroscopic evaluation to confirm the overall appropriateness of the planned procedure and to determine if any other minor deficiencies would warrant operative intervention. Once confirmed, the restoration proceeded as planned. The OWMTO was performed with a PEEK (polyetheretherketone) wedge implant (iBalance; Arthrex) followed by arthroscopic preparation for medial MAT with removal of any meniscal remnants and placement of passing sutures (Figure 2A).
When the arthroscopic portion of the surgery was finished, a medial parapatellar arthrotomy was made to allow the patella to be inverted and complete fresh mega-patellar OCA placement (Figure 4).
The knee was placed in a ROM brace locked in full extension. The patient was able to do straight-leg raises and calf pumps in the recovery room and was discharged home with a saphenous nerve block and an iPACK (Interspace between the Popliteal Artery and the Capsule of the posterior Knee) nerve block in place. Home-based therapy was started immediately. After the patient’s first postoperative visit, formal therapy (discussed earlier) was initiated (Figure 6).
Discussion
All-inside GraftLink ACL reconstruction with cortical suspensory fixation appears well suited to combined medial and lateral MAT and/or cartilage restoration—whether it be large fresh OCA combined with medial MAT (as in this patient’s case) or another form of cartilage restoration. Arthroscopic MAT with anatomically fashioned and placed bone plugs minimizes the morbidity within the notch footprints and allows for discrete revision socket formation for both femoral and tibial ACL graft placement. In this case, preparation for the medial MAT and ACL sockets was followed by MAT/ACL construct implantation and secure fixation. The arthrotomy was thereby minimized and placed to allow for efficient mega-patellar OCA graft placement.
Over the past decade, I have performed similar concomitant procedures using the same surgical principles that allow for efficient and reproducible complex knee restoration (Figure 7).
Although use of an algorithm for the management of complex knee restorations is not universally feasible, I offer guidelines for complex knee injuries:
- At each decision point, determine whether the knee and the patient can withstand the planned surgical intervention.
- After deciding to proceed with knee restoration, list the meniscus, cartilage, and ligament injuries that must be addressed.
- Determine which repairs (meniscus, cartilage, ligament) are warranted. Repairs generally are best performed within a period of 7 to 14 days.
- Determine which ligament injuries warrant reconstruction. Allograft tissue typically is used for multiligament reconstruction.
- Rank-order the ligament reconstruction requirements. It is fine to proceed with all of the reconstructions if the case is moving smoothly, if there are no developing tourniquet-time issues, and if the soft-tissue envelope is responding as expected.
- Consider autograft and/or allograft tissue needs for concomitant or staged meniscus and cartilage restoration options/requirements.
Am J Orthop. 2017;46(4):170-175, 202. Copyright Frontline Medical Communications Inc. 2017. All rights reserved.
1. Uquillas C, Rossy W, Nathasingh CK, Strauss E, Jazrawi L, Gonzalez-Lomas G. Osteotomies about the knee: AAOS exhibit selection. J Bone Joint Surg Am. 2014;96(24):e199.
2. Mehl J, Paul J, Feucht MJ, et al. ACL deficiency and varus osteoarthritis: high tibial osteotomy alone or combined with ACL reconstruction? Arch Orthop Trauma Surg. 2017;137(2):233-240.
3. Scordino LE, DeBerardino TM. Surgical treatment of osteoarthritis in the middle-aged athlete: new horizons in high tibial osteotomies. Sports Med Arthrosc. 2013;21(1):47-51.
4. Ferrari D, Lopes TJ, França PF, Azevedo FM, Pappas E. Outpatient versus inpatient anterior cruciate ligament reconstruction: a systematic review with meta-analysis. Knee. 2017;24(2):197-206.
5. Weber AE, Gitelis ME, McCarthy MA, Yanke AB, Cole BJ. Malalignment: a requirement for cartilage and organ restoration. Sports Med Arthrosc. 2016;24(2):e14-e22.
6. Prince MR, King AH, Stuart MJ, Dahm DL, Krych AJ. Treatment of patellofemoral cartilage lesions in the young, active patient. J Knee Surg. 2015;28(4):285-295.
7. Scordino LE, DeBerardino TM. Surgical treatment of osteoarthritis in the middle-aged athlete: new horizons in high tibial osteotomies. Sports Med Arthrosc. 2013;21(1):47-51.
Home of the Brave
This Memorial Day, with all that is taking place in the world, it was hard not to think about the brave men and women who have sacrificed so much to preserve our freedom. They are away from their families, sometimes for years at a time, and they operate in the most dangerous places in the world. A safe return is not guaranteed. I am thankful for these intrepid men and women whose sacrifices and commitment to their country allow me to live comfortably at home with my family and practice orthopedic surgery.
A few years ago, my wife and I traveled to Normandy and visited the American cemetery. It was a moving experience that I will never forget. We then toured Pointe du Hoc, the elevated peninsula separating Omaha and Utah beach and the location of German gun emplacements covering both beaches. The bunkers, and even the craters from the bombs, are still there. Army Rangers were tasked with launching an amphibious assault on the beach and then scaling the 100-foot cliffs using grappling hooks, ropes, and ladders. Once at the top, they faced a heavily fortified German force that was dug in. Looking down at the beach and out over the ocean from above, I thought of the troops who landed there and the impossible task they faced. Despite the overwhelming odds stacked against them, the Rangers took Pointe du Hoc in 25 minutes and then repelled multiple counterattacks with their backs against the cliff. In my opinion, it’s one of the greatest testaments to the incredible determination and ability of our military personnel.
Speaking of incredible ability, AJO would like to recognize our military orthopedists. They are often deployed in combat zones and provide the best of care for our soldiers while working in the most stressful of conditions, and doing it all on a government salary. In their spare time, they’ve contributed so much to the orthopedic literature, authoring numerous landmark articles.
In this issue, AJO looks at classic military injuries: shoulder instability, stress fractures, and multi-ligamentous knee injuries. Provencher and colleagues authored a comprehensive review of instability with current guidelines for determining surgical approach. DeBerardino shows our readers how to take a military approach to multi-ligament and complex knee injuries, and Owens and colleagues provide a guide to the diagnosis and treatment of stress injuries to bone.
We also take a moment to recognize 3 members of our military orthopedic family whose lives were tragically cut short. Warren R. Kadrmas, Brian Allgood, and Benjamin Whetstone Schmidt’s memorials are included on the following pages. Benjamin Whetstone Schmidt, son of orthopedist David R. Schmidt from San Antonio, was a Marine Sniper killed in action in Afghanistan after volunteering for a second tour. After his death, the LCpl Benjamin Whetstone Schmidt Endowed Professorship in History was created at the Texas Christian University. Contributions can be made in his memory at www.heartofpurple.com.
As Independence Day is celebrated, AJO is pleased to present “Military Orthopedics” to honor our troops and the military doctors who support them. As you read this issue, take a moment to reflect on the freedoms you enjoy because America is truly the Home of the Brave.
Am J Orthop. 2017;46(4):166. Copyright Frontline Medical Communications Inc. 2017. All rights reserved.

Segregated Neighborhoods Can Raise Blood Pressure
Living in a racially segregated neighborhood can be bad for the blood pressure (BP) if you are a black adult, according to Northwestern University researchers. They found that simply moving away from that neighborhood is enough to reduce systolic blood pressure 1 to 5 points.
In the study, which was partly funded by the NIH, the researchers examined BP readings for 2,280 black adults who participated in the Coronary Artery Risk Development in Young Adults (CARDIA) study. The participants were initially screened in 1985 and 1986 then reexamined several times over the next 25 years. The Northwestern study is the first to look at the longitudinal effects of segregation on BP compare the effect within the same individuals. Previous research had looked at single points in time.
The researchers categorized neighborhood segregation as high, medium, or low, using a scale that compareed the percentage of black residents in a neighborhood to the surrounding area. When neighborhoods were more segregated, the participants had small but statistically significant increases in systolic BP. Less segregation equaled a “notable” drop in BP.
Participants who lived in a highly segregated neighborhood and moved to a less segregated one saw the most significant improvements. Those who moved temporarily saw a 1 mm Hg drop. A permanent move equaled 3 to 5 mm Hg. That’s a “powerful effect,” said lead author Kiarri Kershaw, assistant professor of preventive medicine at Northwestern. Just 1 mm Hg lower at the population level, she notes, could mean “meaningful” reductions in heart attacks, strokes, and heart failure. The associations persisted even after the researchers accounted for marital status, body mass index, smoking history, physical activity, and socioeconomic status of the community.
The changes in blood pressure were not related to poverty or household income. Kershaw says less stress, achieved by reducing exposure to violence and improving opportunities for socioeconomic mobility, is “likely a key factor.” Other factors that could help include improving access to health-promoting resources, such as full-service grocery stores, recreation centers, and health care clinics.
Zollinger-Ellison Syndrome: Not Your Average Peptic Ulcer Disease
IN THIS ARTICLE
- Diagnostic criteria
- Pharmacologic management
- Patient education
A more severe variant of peptic ulcer disease, Zollinger-Ellison syndrome (ZES) is a rare, chronic, and potentially life-threatening ulcerative disorder. Because the syndrome can be easily misdiagnosed based on clinical presentation alone, primary care clinicians need to be aware of its diagnostic features and know when referral to a gastroenterologist is necessary. Clinicians should suspect ZES in patients with peptic ulcer disease that is refractory to traditional medications.
Caused by a gastrin-secreting neuroendocrine tumor of the pancreas or duodenum called a gastrinoma, ZES can be benign or malignant. It typically manifests in white men ages 30 to 50.1 Due to the significant number of patients treated for a benign cause of peptic ulcer disease (eg, Helicobacter pylori or NSAID-induced ulcers) who are never tested for ZES, the exact incidence is difficult to determine.2 However, it is estimated that approximately 0.1 to 3 people per million develop the disease annually.3
PATHOPHYSIOLOGY
Approximately 80% of gastrinomas occur in the “gastrinoma triangle,” outlined by the hepatic portal vein, neck and body of the pancreas, and latter two-thirds of the duodenum (see Figure).1,4,5 Most gastrinomas involved in ZES occur sporadically, but there is a hereditary component associated with multiple endocrine neoplasia type 1 (MEN1), an autosomal dominant disorder.4

The overproduction and secretion of gastrin by the gastrinoma stimulates hypersecretion of hydrochloric acid.4 This is distinguished from high gastrin levels in the setting of fasting hypochlorhydria or achlorhydria, which may be caused by chronic atrophic gastritis, proton pump inhibitor (PPI) use, or pernicious anemia.5 The chronic hypersecretion of acid causes ulcerations to form. Most commonly, a single ulcer forms in the first portion of the duodenum.3
CLINICAL PRESENTATION
Patients with ZES often report vague abdominal pain that may mimic peptic ulcer disease on initial presentation. The widespread use of PPIs can mask symptoms, and one-fourth of patients present with no abdominal pain at all.6 Patients may also present with
The physical exam may be within normal limits, and no physical finding is considered pathognomonic for ZES. Findings may include epigastric tenderness; pallor, due to an ulcer-related anemia or GI bleed; jaundice, if there is liver involvement; and esophageal or dental erosions, due to excessive acid.8

DIAGNOSIS
Patients with symptoms refractory to medical management should be referred to a specialist for further testing. Once a patient is referred, a gastroenterologist will perform lab tests and imaging studies. In order to be diagnosed with ZES, the patient must exhibit an acidic environment with a pH less than 2 and an inappropriate release of gastrin with a basal acid output greater than 15 mEq/h (or > 5 mEq/h in a patient with prior acid reduction surgery).5,6
Fasting serum gastrin (FSG) is the initial study of choice, followed by a secretin-stimulating test when necessary.9 Diagnosis is established by an FSG level greater than 100 pg/mL; if more than 10-fold the normal level, no further testing is needed. However, results often range from 100 to 1,000 pg/mL.6,10 At these values, further testing with secretin stimulation is warranted.9 The test is performed with an IV injection of secretin, and blood samples are obtained to measure serum gastrin levels.10 An increase greater than 100 pg/mL is considered positive; one greater than 200 pg/mL is diagnostic.3
Once lab tests have been performed, a series of imaging studies are indicated. Endoscopy is used to identify active ulcers and erosions due to long-term acid secretion.3 CT, MRI, and somatostatin receptor scintigraphy (a specialized form of imaging that is the study of choice for localizing gastrinomas) are performed to localize primary tumors and identify any metastatic disease that may be present.10 Finally, after lab tests and imaging studies have been completed, genetic screening for MEN1 is used to determine if the patient has a sporadic or hereditary gastrinoma.3
MANAGEMENT
Once ZES has been diagnosed, the specialist will refer the patient for surgical opinion. The main objectives of surgery are to determine whether the tumor is malignant via biopsy, and to resect the tumor to suppress the acid hypersecretion, if indicated in the absence of liver metastasis and large pancreatic tumor size. Medical management should begin immediately to prevent any further damage from prolonged gastric hypersecretion.1
Pharmacologic options include PPIs, H2-receptor antagonists, and somatostatin analogues; PPIs are considered firstline therapy. Many patients with ZES require a higher dosage than is needed with typical GERD (60-100 mg/d vs 20-40 mg/d). Somatostatin analogues can be used in conjunction with PPIs and have been shown to inhibit tumor growth in patients with malignant ZES.1
Once a ZES diagnosis has been made, the tumor(s) resected (if appropriate), and vagotomy considered or performed, patients will need routine follow-up with their gastroenterologist and their primary care provider, who can manage medications and recommend any lifestyle changes.5
PROGNOSIS
The most important prognostic factor of patients with ZES is whether the gastrinoma is benign or malignant. There are two patterns: aggressive disease (25%) and nonaggressive disease (75%).5 At diagnosis, 40% to 70% of patients with sporadic ZES present with lymph node metastases, and 20% to 40% present with liver metastases. Patients with liver metastases have a 10-year survival rate of 30%, compared to a 15-year survival rate of 83% in patients without liver metastases.11,12
Along with the tumor itself, another prognostic factor to consider is the FSG level at diagnosis. Patients with higher FSG levels have decreased five- and 10-year survival rates compared to patients with lower FSG values. The 10-year survival rate for patients with a lower FSG value (0-499 pg/mL) is 86%, while the 10-year survival rate for those with a greater FSG value (> 1,000 pg/mL) is 73%.11,12 Overall, the prognosis is good for patients with ZES. The 10-year survival rate is high, and management is possible with medications and surgical resection of the gastrinoma.
PATIENT EDUCATION
Once patients are diagnosed, treatment with PPIs is typically lifelong unless they are considered cured by surgical resection. Patients need to understand that compliance is necessary to properly manage symptoms; certain foods, alcohol, and tobacco can affect the condition, and lifestyle modifications should be made, as they would with typical GERD or peptic ulcer disease.
CONCLUSION
ZES is frequently overlooked, and patients often continue to experience unresolved symptoms related to hypergastrinemia. Due to its complexity and ability to mimic other disorders—as well as the implications of duodenal versus pancreatic location, and other disorders of the kidney or endocrine system suggestive of MEN1—ZES should be ruled out in any patient with unexplained persistent GERD, peptic ulcer disease, elevated FSG, chronic diarrhea, and/or abdominal pain.5
The gastrinoma itself is a well-differentiated and slow-growing tumor in the majority of cases, making the prognosis for ZES favorable for long-term survival. Proper pharmacologic management is instrumental for controlling symptoms and decreasing acid production. Surgical resection offers patients the best chance for a complete cure. Clinicians and patients should be well educated about ZES in order to successfully manage the disorder.
1. Tomassetti P, Campana D, Piscitelli L, et al. Treatment of Zollinger-Ellison syndrome. World J Gastroenterol. 2005; 11(35):5423-5432.
2. Metz DC. Diagnosis of the Zollinger-Ellison syndrome. Clin Gastroenterol Hepatol. 2016;10(2):126-130.
3. Epelboym I, Mazeh H. Zollinger-Ellison syndrome: classical considerations and current controversies. Oncologist. 2014; 19(1):44-50.
4. Papadakis M, McPhee S, Rabow M. Current Medical Diagnosis and Treatment 2014. New York, NY: McGraw-Hill Education; 2014:600-601.
5. Feldman M, Friedman LS, Lawrence BJ. Sleisenger and Fordtran’s Gastrointestinal and Liver Disease. Philadelphia, PA: Saunders/Elsevier; 2016:511-515.
6. Ito T, Cadiot G, Jensen RT. Diagnosis of Zollinger-Ellison syndrome: increasingly difficult. World J Gastroenterol. 2012; 18(39):5495-5503.
7. Blonski WC, Katzka DA, Lichtenstein GR, Metz DC. Idiopathic gastric acid hypersecretion presenting as a diarrheal disorder and mimicking both Zollinger-Ellison syndrome and Crohn’s disease. Eur J Gastroenterol Hepatol. 2005;17(4):441-444.
8. Roy PK. Zollinger-Ellison syndrome clinical presentation. http://emedicine.medscape.com/article/183555-clinical#b4. Accessed June 14, 2017.
9. Berna MJ, Hoffmann KM, Serrano J, et al. Serum gastrin in Zollinger-Ellison syndrome: I. prospective study of fasting serum gastrin in 309 patients from the National Institutes of Health and comparison with 2229 cases from the literature. Medicine (Baltimore). 2006;85(6):295-330.
10. Moore AR, Varro A, Pritchard M. Zollinger-Ellison syndrome. Gastrointestinal Nursing. 2012;10(5):44-49.
11. Weber HC, Venzon DJ, Lin JT, et al. Determinants of metastatic rate and survival in patients with Zollinger-Ellison syndrome: a prospective long-term study. Gastroenterology. 1995;108(6):1637-1649.
12. Berger AC, Gibril F, Venzon DJ, et al. Prognostic value of initial fasting serum gastrin levels in patients with Zollinger-Ellison syndrome. J Clin Oncol. 2001;19(12):3051-3057.
IN THIS ARTICLE
- Diagnostic criteria
- Pharmacologic management
- Patient education
A more severe variant of peptic ulcer disease, Zollinger-Ellison syndrome (ZES) is a rare, chronic, and potentially life-threatening ulcerative disorder. Because the syndrome can be easily misdiagnosed based on clinical presentation alone, primary care clinicians need to be aware of its diagnostic features and know when referral to a gastroenterologist is necessary. Clinicians should suspect ZES in patients with peptic ulcer disease that is refractory to traditional medications.
Caused by a gastrin-secreting neuroendocrine tumor of the pancreas or duodenum called a gastrinoma, ZES can be benign or malignant. It typically manifests in white men ages 30 to 50.1 Due to the significant number of patients treated for a benign cause of peptic ulcer disease (eg, Helicobacter pylori or NSAID-induced ulcers) who are never tested for ZES, the exact incidence is difficult to determine.2 However, it is estimated that approximately 0.1 to 3 people per million develop the disease annually.3
PATHOPHYSIOLOGY
Approximately 80% of gastrinomas occur in the “gastrinoma triangle,” outlined by the hepatic portal vein, neck and body of the pancreas, and latter two-thirds of the duodenum (see Figure).1,4,5 Most gastrinomas involved in ZES occur sporadically, but there is a hereditary component associated with multiple endocrine neoplasia type 1 (MEN1), an autosomal dominant disorder.4
The overproduction and secretion of gastrin by the gastrinoma stimulates hypersecretion of hydrochloric acid.4 This is distinguished from high gastrin levels in the setting of fasting hypochlorhydria or achlorhydria, which may be caused by chronic atrophic gastritis, proton pump inhibitor (PPI) use, or pernicious anemia.5 The chronic hypersecretion of acid causes ulcerations to form. Most commonly, a single ulcer forms in the first portion of the duodenum.3
CLINICAL PRESENTATION
Patients with ZES often report vague abdominal pain that may mimic peptic ulcer disease on initial presentation. The widespread use of PPIs can mask symptoms, and one-fourth of patients present with no abdominal pain at all.6 Patients may also present with
The physical exam may be within normal limits, and no physical finding is considered pathognomonic for ZES. Findings may include epigastric tenderness; pallor, due to an ulcer-related anemia or GI bleed; jaundice, if there is liver involvement; and esophageal or dental erosions, due to excessive acid.8
DIAGNOSIS
Patients with symptoms refractory to medical management should be referred to a specialist for further testing. Once a patient is referred, a gastroenterologist will perform lab tests and imaging studies. In order to be diagnosed with ZES, the patient must exhibit an acidic environment with a pH less than 2 and an inappropriate release of gastrin with a basal acid output greater than 15 mEq/h (or > 5 mEq/h in a patient with prior acid reduction surgery).5,6
Fasting serum gastrin (FSG) is the initial study of choice, followed by a secretin-stimulating test when necessary.9 Diagnosis is established by an FSG level greater than 100 pg/mL; if more than 10-fold the normal level, no further testing is needed. However, results often range from 100 to 1,000 pg/mL.6,10 At these values, further testing with secretin stimulation is warranted.9 The test is performed with an IV injection of secretin, and blood samples are obtained to measure serum gastrin levels.10 An increase greater than 100 pg/mL is considered positive; one greater than 200 pg/mL is diagnostic.3
Once lab tests have been performed, a series of imaging studies are indicated. Endoscopy is used to identify active ulcers and erosions due to long-term acid secretion.3 CT, MRI, and somatostatin receptor scintigraphy (a specialized form of imaging that is the study of choice for localizing gastrinomas) are performed to localize primary tumors and identify any metastatic disease that may be present.10 Finally, after lab tests and imaging studies have been completed, genetic screening for MEN1 is used to determine if the patient has a sporadic or hereditary gastrinoma.3
MANAGEMENT
Once ZES has been diagnosed, the specialist will refer the patient for surgical opinion. The main objectives of surgery are to determine whether the tumor is malignant via biopsy, and to resect the tumor to suppress the acid hypersecretion, if indicated in the absence of liver metastasis and large pancreatic tumor size. Medical management should begin immediately to prevent any further damage from prolonged gastric hypersecretion.1
Pharmacologic options include PPIs, H2-receptor antagonists, and somatostatin analogues; PPIs are considered firstline therapy. Many patients with ZES require a higher dosage than is needed with typical GERD (60-100 mg/d vs 20-40 mg/d). Somatostatin analogues can be used in conjunction with PPIs and have been shown to inhibit tumor growth in patients with malignant ZES.1
Once a ZES diagnosis has been made, the tumor(s) resected (if appropriate), and vagotomy considered or performed, patients will need routine follow-up with their gastroenterologist and their primary care provider, who can manage medications and recommend any lifestyle changes.5
PROGNOSIS
The most important prognostic factor of patients with ZES is whether the gastrinoma is benign or malignant. There are two patterns: aggressive disease (25%) and nonaggressive disease (75%).5 At diagnosis, 40% to 70% of patients with sporadic ZES present with lymph node metastases, and 20% to 40% present with liver metastases. Patients with liver metastases have a 10-year survival rate of 30%, compared to a 15-year survival rate of 83% in patients without liver metastases.11,12
Along with the tumor itself, another prognostic factor to consider is the FSG level at diagnosis. Patients with higher FSG levels have decreased five- and 10-year survival rates compared to patients with lower FSG values. The 10-year survival rate for patients with a lower FSG value (0-499 pg/mL) is 86%, while the 10-year survival rate for those with a greater FSG value (> 1,000 pg/mL) is 73%.11,12 Overall, the prognosis is good for patients with ZES. The 10-year survival rate is high, and management is possible with medications and surgical resection of the gastrinoma.
PATIENT EDUCATION
Once patients are diagnosed, treatment with PPIs is typically lifelong unless they are considered cured by surgical resection. Patients need to understand that compliance is necessary to properly manage symptoms; certain foods, alcohol, and tobacco can affect the condition, and lifestyle modifications should be made, as they would with typical GERD or peptic ulcer disease.
CONCLUSION
ZES is frequently overlooked, and patients often continue to experience unresolved symptoms related to hypergastrinemia. Due to its complexity and ability to mimic other disorders—as well as the implications of duodenal versus pancreatic location, and other disorders of the kidney or endocrine system suggestive of MEN1—ZES should be ruled out in any patient with unexplained persistent GERD, peptic ulcer disease, elevated FSG, chronic diarrhea, and/or abdominal pain.5
The gastrinoma itself is a well-differentiated and slow-growing tumor in the majority of cases, making the prognosis for ZES favorable for long-term survival. Proper pharmacologic management is instrumental for controlling symptoms and decreasing acid production. Surgical resection offers patients the best chance for a complete cure. Clinicians and patients should be well educated about ZES in order to successfully manage the disorder.
1. Tomassetti P, Campana D, Piscitelli L, et al. Treatment of Zollinger-Ellison syndrome. World J Gastroenterol. 2005; 11(35):5423-5432.
2. Metz DC. Diagnosis of the Zollinger-Ellison syndrome. Clin Gastroenterol Hepatol. 2016;10(2):126-130.
3. Epelboym I, Mazeh H. Zollinger-Ellison syndrome: classical considerations and current controversies. Oncologist. 2014; 19(1):44-50.
4. Papadakis M, McPhee S, Rabow M. Current Medical Diagnosis and Treatment 2014. New York, NY: McGraw-Hill Education; 2014:600-601.
5. Feldman M, Friedman LS, Lawrence BJ. Sleisenger and Fordtran’s Gastrointestinal and Liver Disease. Philadelphia, PA: Saunders/Elsevier; 2016:511-515.
6. Ito T, Cadiot G, Jensen RT. Diagnosis of Zollinger-Ellison syndrome: increasingly difficult. World J Gastroenterol. 2012; 18(39):5495-5503.
7. Blonski WC, Katzka DA, Lichtenstein GR, Metz DC. Idiopathic gastric acid hypersecretion presenting as a diarrheal disorder and mimicking both Zollinger-Ellison syndrome and Crohn’s disease. Eur J Gastroenterol Hepatol. 2005;17(4):441-444.
8. Roy PK. Zollinger-Ellison syndrome clinical presentation. http://emedicine.medscape.com/article/183555-clinical#b4. Accessed June 14, 2017.
9. Berna MJ, Hoffmann KM, Serrano J, et al. Serum gastrin in Zollinger-Ellison syndrome: I. prospective study of fasting serum gastrin in 309 patients from the National Institutes of Health and comparison with 2229 cases from the literature. Medicine (Baltimore). 2006;85(6):295-330.
10. Moore AR, Varro A, Pritchard M. Zollinger-Ellison syndrome. Gastrointestinal Nursing. 2012;10(5):44-49.
11. Weber HC, Venzon DJ, Lin JT, et al. Determinants of metastatic rate and survival in patients with Zollinger-Ellison syndrome: a prospective long-term study. Gastroenterology. 1995;108(6):1637-1649.
12. Berger AC, Gibril F, Venzon DJ, et al. Prognostic value of initial fasting serum gastrin levels in patients with Zollinger-Ellison syndrome. J Clin Oncol. 2001;19(12):3051-3057.

Deprescribing: A simple method for reducing polypharmacy
CASE An 82-year-old woman with a history of hypertension, diabetes, hyperlipidemia, stage 3 chronic kidney disease, anxiety, urge urinary incontinence, constipation, and bilateral knee osteoarthritis presents to her primary care physician’s office after a fall. She reports that she visited the emergency department (ED) a week ago after falling in the middle of the night on her way to the bathroom. This is the third fall she’s had this year. On chart review, she had a blood pressure (BP) of 112/60 mm Hg and a blood glucose level of 65 mg/dL in the ED. All other testing (head imaging, chest x-ray, urinalysis) was normal. The ED physician recommended that she stop taking her lisinopril-hydrochlorothiazide (HCTZ) and glipizide extended release (XL) until her follow-up appointment. Today, she asks about the need to restart these medications.
Polypharmacy is common among older adults due to a high prevalence of chronic conditions that often require multiple medications for optimal management. Cut points of 5 or 9 medications are frequently used to define polypharmacy. However, some define polypharmacy as taking a medication that lacks an indication, is ineffective, or is duplicating treatment provided by another medication.
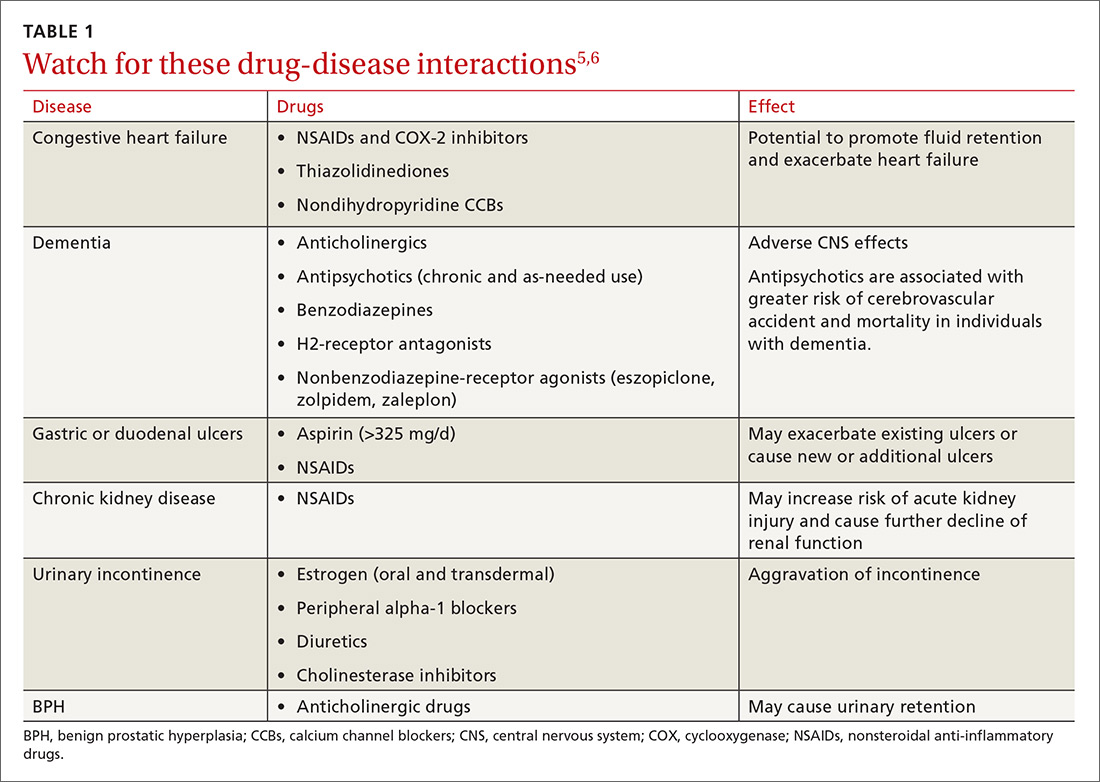
Either way, polypharmacy is associated with multiple negative consequences, including an increased risk for adverse drug events (ADEs),1-4 drug-drug and drug-disease interactions (TABLE 15,6),7 reduced functional capacity,8 multiple geriatric syndromes (TABLE 25,9-12), medication non-adherence,13 and increased mortality.14 Polypharmacy also contributes to increased health care costs for both the patient and the health care system.15

Taking a step back. Polypharmacy often results from prescribing cascades, which occur when an adverse drug effect is misinterpreted as a new medical problem, leading to the prescribing of more medication to treat the initial drug-induced symptom. Potentially inappropriate medications (PIMs), which are medications that should be avoided in older adults and in those with certain conditions, are also more likely to be prescribed in the setting of polypharmacy.16
Deprescribing is the process of identifying and discontinuing medications that are unnecessary, ineffective, and/or inappropriate in order to reduce polypharmacy and improve health outcomes. Deprescribing is a collaborative process that involves weighing the benefits and harms of medications in the context of a patient’s care goals, current level of functioning, life expectancy, values, and preferences. This article reviews polypharmacy and discusses safe and effective deprescribing strategies for older adults in the primary care setting.
[polldaddy:9781245]
How many people on how many meds?
According to a 2016 study, 36% of community-dwelling older adults (ages 62-85 years) were taking 5 or more prescription medications in 2010 to 2011—up from 31% in 2005 to 2006.17 When one narrows the population to older adults in the United States who are hospitalized, almost half (46%) take 7 or more medications.18 Among frail, older US veterans at hospital discharge, 40% were prescribed 9 or more medications, with 44% of these patients receiving at least one unnecessary drug.19
The challenges of multimorbidity
In the United States, 80% of those 65 and older have 2 or more chronic conditions, or multimorbidity.20 Clinical practice guidelines making recommendations for the management of single conditions, such as heart failure, hypertension, or diabetes, often suggest the use of 2 or more medications to achieve optimal management and fail to provide guidance in the setting of multimorbidity. Following treatment recommendations for multiple conditions predictably leads to polypharmacy, with complicated, costly, and burdensome regimens.
Further, the research contributing to the development of clinical practice guidelines frequently excludes older adults and those with multimorbidity, reducing applicability in this population. As a result, many treatment recommendations have uncertain benefit and may be harmful in the multimorbid older patient.21
CASE In addition to the patient’s multimorbidity, she had a stroke at age 73 and has some mild residual left-sided weakness. Functionally, she is independent and able to perform her activities of daily living and her instrumental activities of daily living. She lives alone, quit smoking at age 65, and has an occasional glass of wine during family parties. The patient’s daughter and granddaughter live 2 blocks away.
Her current medications include glipizide XL 10 mg/d and lisinopril-HCTZ 20-25 mg/d, which she has temporarily discontinued at the ED doctor’s recommendation, as well as: amlodipine 10 mg/d, metformin 1000 mg BID, senna 8.6 mg/d, docusate 100 mg BID, furosemide 40 mg/d, and ibuprofen 600 mg/d (for knee pain). She reports taking omeprazole 20 mg/d “for almost 20 years,” even though she has not had any reflux symptoms in recent memory. After her stroke, she began taking atorvastatin 10 mg/d, aspirin 81 mg/d, and clopidogrel 75 mg/d, which she continues to take today. About a year ago, she started oxybutynin 5 mg/d for urinary incontinence, but she has not noticed significant relief. Additionally, she takes lorazepam 1 mg for insomnia most nights of the week.

A review of systems reveals issues with chronic constipation and intermittent dizziness, but is otherwise negative. The physical examination reveals a well-appearing woman with a body mass index of 26. Her temperature is 98.5° F, her heart rate is 78 beats/min and regular, her respirations are 14 breaths/min, and her BP is 117/65 mm Hg. Orthostatic testing is negative. Her heart, lung, and abdominal exams are within normal limits. Her timed up and go test is 14 seconds. Her blood glucose level today in the office after eating breakfast 2 hours ago is 135 mg/dL (normal: <140 mg/dL). Laboratory tests performed at the time of the ED visit show a creatinine level of 1.2 mg/dL (normal range: 0.6 to 1.1 mg/dL), a glomerular filtration rate (GFR) of 44 units (normal range: >60 units), a hemoglobin level of 9.8 g/dL (normal range: 12-15.5 g/dL), and a thyroid stimulating hormone level of 1.4 mIU/L (normal range: 0.5-8.9 mIU/L). A recent hemoglobin A1C is 6.8% (normal: <5.7%), low-density lipoprotein (LDL) level is 103 mg/dL (optimal <100 mg/dL), and high-density lipoprotein (HDL) level is 65 mg/dL (optimal >60 mg/dL). An echocardiogram performed a year ago showed mild aortic stenosis with normal systolic and diastolic function.
Starting the deprescribing process: Several approaches to choose from
The goal of deprescribing is to reduce polypharmacy and improve health outcomes. It is a process defined as, “reviewing all current medications; identifying medications to be ceased, substituted, or reduced; planning a deprescribing regimen in partnership with the patient; and frequently reviewing and supporting the patient.”22 A medication review should include prescription, over-the-counter (OTC), and complementary/alternative medicine (CAM) agents.
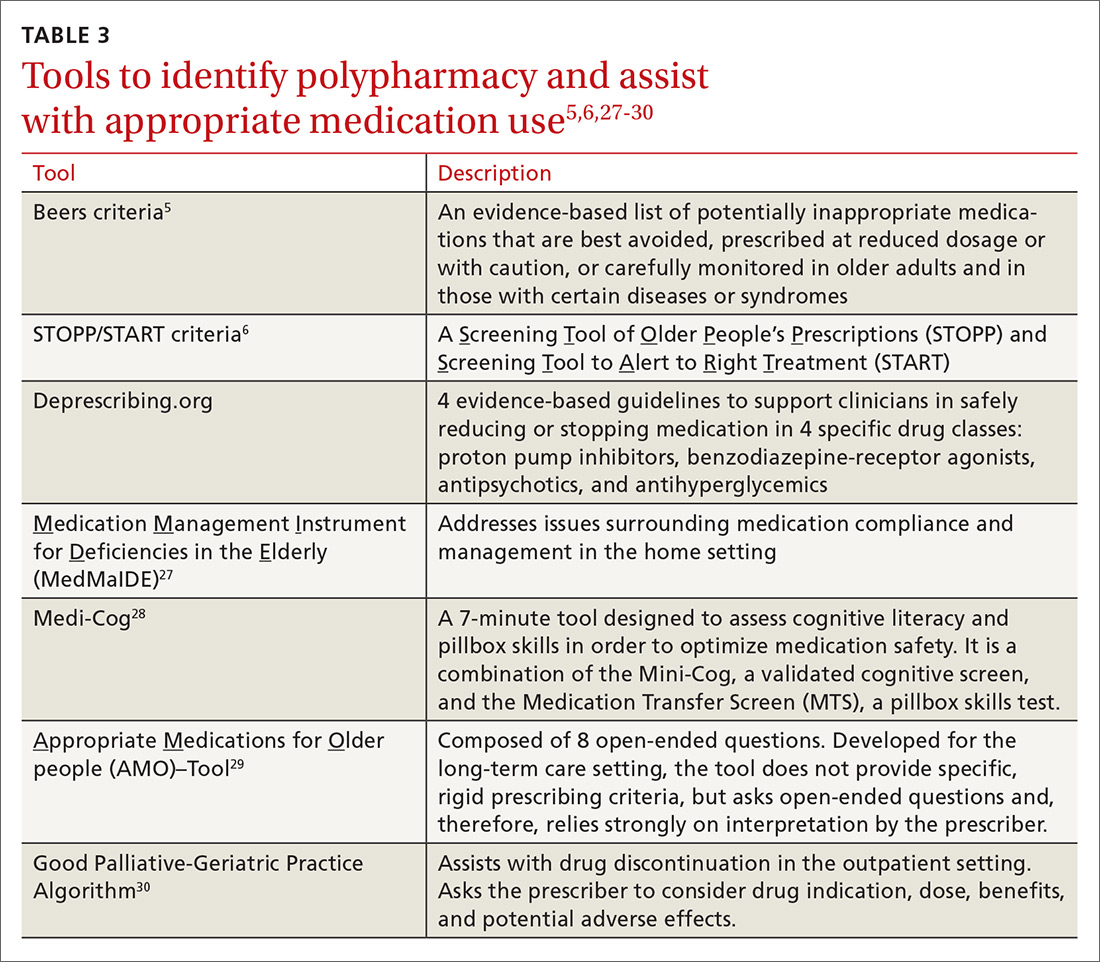
Until recently, studies evaluating the process of deprescribing across drug classes and disease conditions were limited, but new research is beginning to show its potential impact. After deprescribing, patients experience fewer falls and show improvements in cognition.23 While there have not yet been large randomized trials to evaluate deprescribing, a recent systematic review and meta-analysis showed that use of patient-specific deprescribing interventions is associated with improved survival.24 Importantly, there have been no reported adverse drug withdrawal events or deaths associated with deprescribing.23

Smaller studies have reported additional benefits including decreases in health care costs, reductions in drug-drug interactions and PIMs, improvements in medication adherence, and increases in patient satisfaction.25 In addition, the removal of unnecessary medications may allow for increased consideration of prescribing appropriate medications with known benefit.25
Practically speaking, every encounter between a patient and health care provider is an opportunity to reduce unnecessary medications. Electronic alert systems at pharmacies and those embedded within electronic health record (EHR) systems can also prompt a medication review and an effort to deprescribe.26 Evidence-based tools to identify polypharmacy and guide appropriate medication use are listed in TABLE 3.5,6,27-30 In addition, suggested approaches to beginning the deprescribing process are included in TABLE 4.5,31-33 And a medication class-based approach to deprescribing is provided in TABLE 5.5,34-45
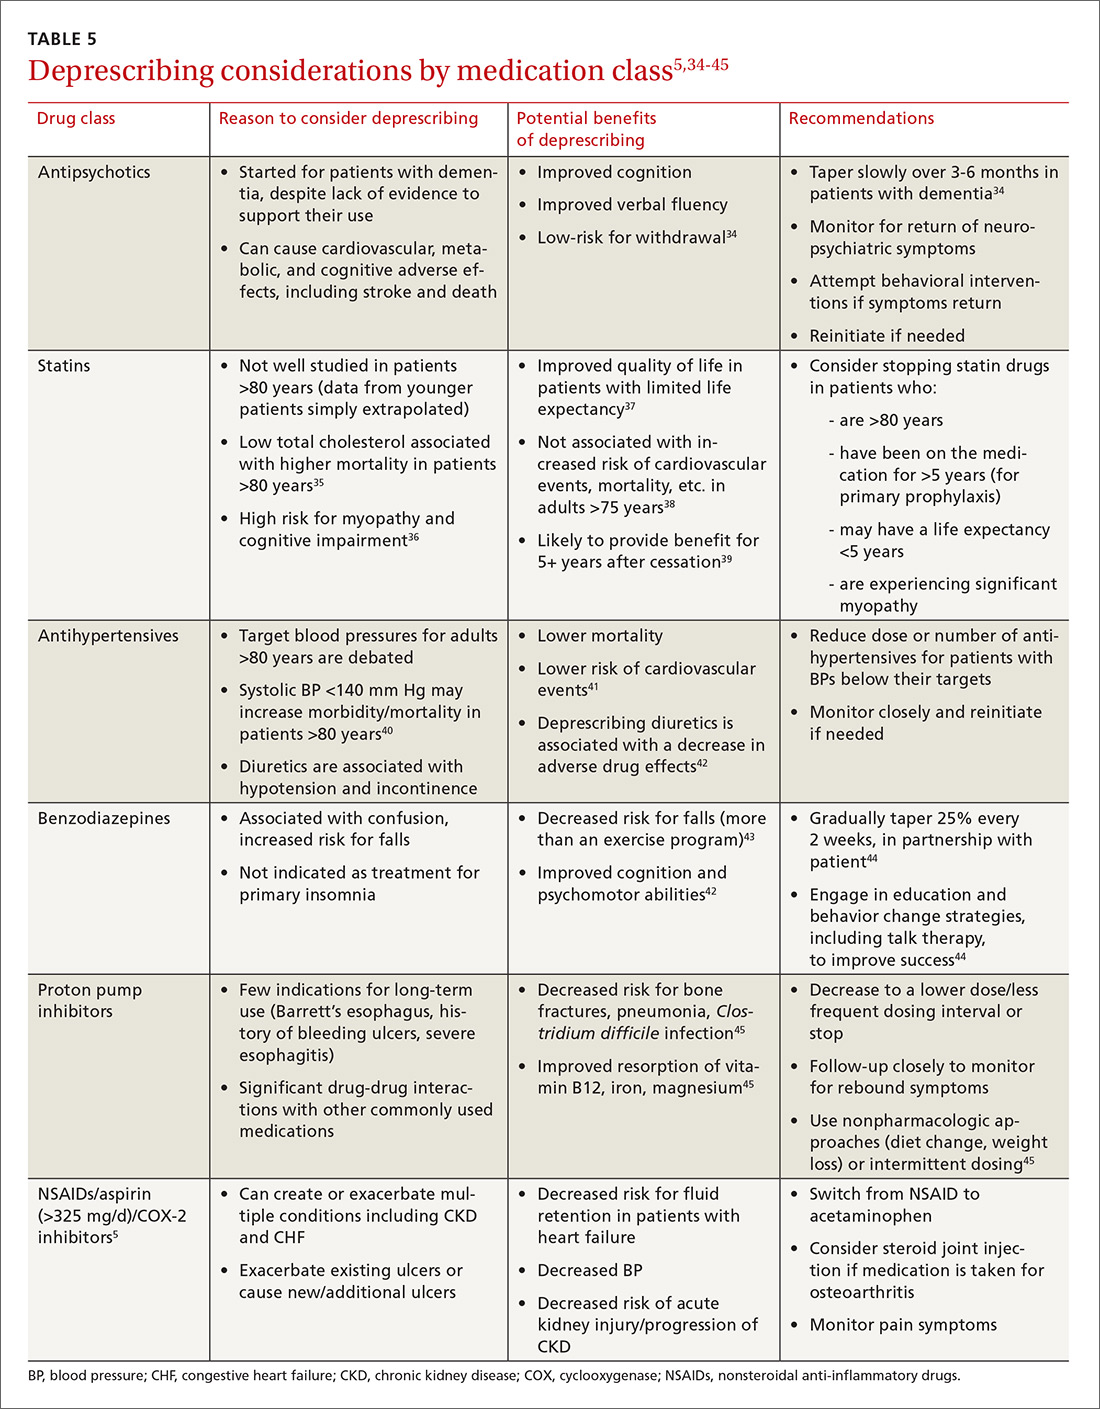
Although no gold standard process exists for deprescribing, experts suggest that any deprescribing protocol should include the following steps:32,46
1. Start with a “brown bag” review of the patient’s medications.
Have the patient bring all of his/her medications in a bag to the visit; review them together or have the medication history taken by a pharmacist. Determine and discuss the indication for each medication and its effectiveness for that indication. Consider the potential benefits and harms of each medication in the context of the patient’s care goals and preferences. Assess whether the patient is taking all of the medications that have been prescribed, and identify any reasons for missed pills (eg, adverse effects, dosing regimens, understanding, cognitive issues).
2. Talk to the patient about the deprescribing process.
Talk with the patient about the risks and benefits of deprescribing, and prioritize which medications to address in the process. Prioritize the medications by balancing patient preferences with available pharmacologic evidence. If there is a lack of evidence supporting the benefits for a particular medication, consider known or suspected adverse effects, the ease or burden of the dosing regimen, the patient’s preferences and goals of care, remaining life expectancy, the time until drug benefit is appreciated, and the length of drug benefit after discontinuation.
3. Deprescribe medications.
If you are going to taper a medication, develop a schedule in partnership with the patient. Stop one medication at a time so that you can monitor for withdrawal symptoms or for the return of a condition.
Acknowledging potential barriers to deprescribing may help structure conversations and provide anticipatory guidance to patients and their families. Working to overcome these barriers will help maximize the benefits of deprescribing and help to build trust with patients.
Patient-driven barriers include fear of a condition worsening or returning, lack of a suitable alternative, lack of ongoing support to manage a particular condition, a previous bad experience with medication cessation, and influence from other care providers (eg, family, home caregivers, nurses, specialists, friends). Patients and family members sometimes cling to the hope of future effectiveness of a treatment, especially in the case of medications like donepezil for dementia.47 Utilizing a team-based and stepwise patient approach to deprescribing aims to provide hesitant patients with appropriate amounts of education and support to begin to reduce unnecessary medicines.
Provider-driven barriers include feeling uneasy about contradicting a specialist’s recommendations for initiation/continuation of specific medications, fear of causing withdrawal symptoms or disease relapse, and lack of specific data to adequately understand and assess benefits and harms in the older adult population. Primary care physicians have also acknowledged worry about discussing life expectancy and that patients will feel their care is being reduced or “downgraded.”48 Finally, there is limited time in which these complex shared decision-making conversations can take place. Thus, if medications are not causing a noticeable problem, it is often easier to just continue them.
One way to overcome some of these concerns is to consider working with a clinical pharmacist. By gaining information regarding medication-specific factors, such as half-life and expected withdrawal patterns, you can feel more confident deprescribing or continuing medications.
Additionally, communicating closely with specialists, ideally with the help of an integrated EHR, can allow you to discuss indications for particular medications or concerns about adverse effects, limited benefits, or difficulty with compliance, so that you can develop a collaborative, cohesive, and patient-centered plan. This, in turn, may improve patient understanding and compliance.
4. Create a follow-up plan.
At the time of deprescribing a medication, develop a plan with the patient for monitoring and assessment. Ensure that the patient understands which symptoms may occur in the event of drug withdrawal and which symptoms may suggest the return of a condition. Make sure that other supports are in place if needed (eg, cognitive behavioral therapy, physical therapy, social support or assistance) to help ensure that medication cessation is successful.
CASE During the office visit, you advise the patient that her BP looks normal, her blood sugar is within an appropriate range, and she is lucky to have not sustained any injuries after her most recent fall. In addition to discussing the benefits of some outpatient physical therapy to help with her balance, you ask if she would like to discuss reducing her medications. She is agreeable and asks for your recommendations.
You are aware of several resources that can help you with your recommendations, among them the STOPP/START6 and Beers criteria,5 as well as the Good Geriatric-Palliative Algorithm.30
If you were to use the STOPP/START and Beers criteria, you might consider stopping:
- lorazepam, which increases the risk of falls and confusion.
- ibuprofen, since this patient has only mild osteoarthritis pain, and ibuprofen has the potential for renal, cardiac, and gastrointestinal toxicities.
- oxybutynin, because it could be contributing to the patient’s constipation and cause confusion and falls.
- furosemide, since the patient has no clinical heart failure.
- omeprazole, since the indication is unknown and the patient has no history of ulceration, esophagitis, or symptomatic gastroesophageal reflux disease.
After reviewing the Good Geriatric-Palliative Algorithm,30 you might consider stopping:
- clopidogrel, as there is no clear indication for this medication in combination with aspirin in this patient.
- glipizide XL, as this patient’s A1c is below goal and this medication puts her at risk of hypoglycemia and its associated morbidities.
- metformin, as it increases her risk of lactic acidosis because her GFR is <45 units.
- docusate, as the evidence to show clear benefit in improving chronic constipation in older adults is lacking.
You tell your patient that there are multiple medications to consider stopping. In order to monitor any symptoms of withdrawal or return of a condition, it would be best to stop one at a time and follow-up closely. Since she has done well for the past week without the glipizide and lisinopril-HCTZ combination, she can remain off the glipizide and the HCTZ. Lisinopril, however, may provide renal protection in the setting of diabetes and will be continued at this time.
You ask her about adverse effects from her other medications. She indicates that the furosemide makes her run to the bathroom all the time, so she would like to try stopping it. You agree and make a plan for her to monitor her weight, watch for edema, and return in 4 weeks for a follow-up visit.
On follow-up, she is feeling well, has no edema on exam, and is happy to report her urinary incontinence has resolved. You therefore suggest her next deprescribing trial be discontinuation of her oxybutynin. She thanks you for your recommendations about her medications and heads off to her physical therapy appointment.
CORRESPONDENCE
Kathryn McGrath, MD, Department of Family and Community Medicine, Division of Geriatric Medicine and Palliative Care, Thomas Jefferson University, 2422 S Broad St, 2nd Floor, Philadelphia, PA 19145; [email protected].
1. Bourgeois FT, Shannon MW, Valim C, et al. Adverse drug events in the outpatient setting: an 11-year national analysis. Pharmacoepidemiol Drug Saf. 2010;19:901-910.
2. Nair NP, Chalmers L, Peterson GM, et al. Hospitalization in older patients due to adverse drug reactions–the need for a prediction tool. Clin Interv Aging. 2016;11:497-506.
3. Nguyen JK, Fouts MM, Kotabe SE, et al. Polypharmacy as a risk factor for adverse drug reactions in geriatric nursing home residents. Am J Geriatr Pharmacother. 2006; 4:36-41.
4. Hohl CM, Dankoff J, Colacone A, et al. Polypharmacy, adverse drug-related events, and potential adverse drug interactions in elderly patients presenting to an emergency department. Ann Emerg Med. 2001;38:666-671.
5. American Geriatrics Society 2015 Beers Criteria Update Expert Panel. American Geriatrics Society 2015 updated Beers criteria for potentially inappropriate medication use in older adults. J Am Geriatr Soc. 2015;63:2227-2246.
6. O’Mahony D, O’Sullivan D, Byrne S, et al. STOPP/START criteria for potentially inappropriate prescribing in older people: version 2. Age Ageing. 2015;44:213-218.
7. Shah BM, Hajjar ER. Polypharmacy, adverse drug reactions, and geriatric syndromes. Clin Geriatr Med. 2012;28:173-186.
8. Magaziner J, Cadigan DA, Fedder DO, et al. Medication use and functional decline among community-dwelling older women. J Aging Health. 1989;1:470-484.
9. Maher RL, Hanlon J, Hajjar ER. Clinical consequences of polypharmacy in elderly. Expert Opin Drug Saf. 2014;13:57-65.
10. Tinetti ME, Han L, Lee DS, et al. Antihypertensive medications and serious fall injuries in a nationally representative sample of older adults. JAMA Intern Med. 2014;174:588-595.
11. Weiss BD. Diagnostic evaluation of urinary incontinence in geriatric patients. Am Fam Physician. 1998;57:2675-2694.
12. Syed Q, Hendler KT, Koncilja K. The impact of aging and medical status on dysgeusia. Am J Med. 2016;129:753, E1-E6.
13. Vik SA, Maxwell CJ, Hogan DB. Measurement, correlates, and health outcomes of medication adherence among seniors. Ann Pharmacother. 2004;38:303-312.
14. Espino DV, Bazaldua OV, Palmer RF, et al. Suboptimal medication use and mortality in an older adult community-based cohort: results from the Hispanic EPESE Study. J Gerontol A Biol Sci Med Sci. 2006;61:170-175.
15. Akazawa M, Imai H, Igarashi A, et al. Potentially inappropriate medication use in elderly Japanese patients. Am J Geriatr Pharmacother. 2010; 8:146-160.
16. Steinman MA, Landefeld CS, Rosenthal GE, et al. Polypharmacy and prescribing quality in older people. J Am Geriatr Soc. 2006;54:1516-1523.
17. Qato DM, Wilder J, Schumm LP, et al. Changes in prescription and over-the-counter medication and dietary supplement use among older adults in the United States, 2005 vs 2011. JAMA Intern Med. 2016;176:473-482.
18. Flaherty JH, Perry HM 3rd, Lynchard GS, et al. Polypharmacy and hospitalization among older home care patients. J Gerontol A Biol Sci Med Sci. 2000;55:554-559.
19. Hajjar ER, Hanlon JT, Sloane RJ, et al. Unnecessary drug use in frail older people at hospital discharge. J Am Geriatr Soc. 2005;53:1518-1523.
20. Gerteis J, Izrael D, Deitz D, et al. Multiple chronic conditions chartbook. Rockville, MD: Agency for Healthcare Research and Quality. 2014.
21. American Geriatrics Society Expert Panel on the Care of Older Adults with Multimorbidity. Guiding principles for the care of older adults with multimorbidity: an approach for clinicians. J Am Geriatr Soc. 2012;60:E1-E25.
22. Woodward M. Deprescribing: achieving better health outcomes for older people through reducing medications. J Pharm Pract Res. 2003;33:323-328.
23. Garfinkel D, Mangin D. Feasibility study of a systematic approach for discontinuation of multiple medications in older adults: addressing polypharmacy. Arch Intern Med. 2010;170:1648-1654.
24. Page AT, Clifford RM, Potter K, et al. The feasibility and effect of deprescribing in older adults on mortality and health: a systematic review and meta‐analysis. Br J Clin Pharmacol. 2016;82:583-623.
25. Reeve E, Shakib S, Hendrix I, et al. The benefits and harms of deprescribing. Med J Aust. 2014;201:386-389.
26. Walsh K, Kwan D, Marr P, et al. Deprescribing in a family health team: a study of chronic proton pump inhibitor use. J Prim Health Care. 2016;8:164-171.
27. Orwig D, Brandt N, Gruber-Baldini AL. Medication management assessment for older adults in the community. Gerontologist. 2006;46:661-668.
28. Anderson K, Jue SG, Madaras-Kelly KJ. Identifying patients at risk for medication mismanagement: using cognitive screens to predict a patient’s accuracy in filling a pillbox. Consult Pharm. 2008;23:459-472.
29. Lenaerts E, De Knijf F, Schoenmakers B. Appropriate prescribing for older people: a new tool for the general practitioner. J Frailty & Aging. 2013;2:8-14.
30. Garfinkel D, Zur-Gil S, Ben-Israel J. The war against polypharmacy: a new cost-effective geriatric-palliative approach for improving drug therapy in disabled elderly people. IMAJ. 2007;9:430-434.
31. Holmes HM, Todd A. Evidence-based deprescribing of statins in patients with advanced illness. JAMA Intern Med. 2015;175:701-702.
32. Scott IA, Hilmer SN, Reeve E, et al. Reducing inappropriate polypharmacy: the process of deprescribing. JAMA Intern Med. 2015;175:827-834.
33. Guirguis-Blake JM, Evans CV,Senger CA, et al. Aspirin for the primary prevention of cardiovascular events: a systematic evidence review for the U.S. Preventive Services Task Force. Ann Intern Med. 2016;164:804-813.
34. Declercq T, Petrovic M, Azermai M, et al. Withdrawal versus continuation of chronic antipsychotic drugs for behavioural and psychological symptoms in older people with dementia. Cochrane Database Syst Rev. 2013;3:CD007726.
35. Petersen LK, Christensen K, Kragstrup J. Lipid-lowering treatment to the end? A review of observational studies and RCTs on cholesterol and mortality in 80+-year olds. Age Ageing. 2010;39:674-680.
36. Banach M, Serban MC. Discussion around statin discontinuation in older adults and patients with wasting diseases. J Cachexia Sarcopenia Muscle. 2016;7:396-399.
37. Goldstein MR, Mascitelli L, Pezzetta F. Statin therapy in the elderly: misconceptions. J Am Geriatr Soc. 2008;56:1365.
38. Han BH, Sutin D, Williamson JD, et al, for the ALLHAT Collaborative Research Group. Effect of statin treatment vs usual care on primary cardiovascular prevention among older adults. The ALLHAT-LLT Randomized Clinical Trial. JAMA Intern Med. Published online May 22, 2017.
39. Sever PS, Chang CL, Gupta AK, et al. The Anglo-Scandinavian Cardiac Outcomes Trial: 11-year mortality follow-up of the lipid-lowering arm in the U.K. Eur Heart J. 2011;32:2525-2532.
40. Denardo SJ, Gong Y, Nichols WW, et al. Blood pressure and outcomes in very old hypertensive coronary artery disease patients: an INVEST substudy. Am J Med. 2010;123:719-726.
41. Ekbom T, Lindholm LH, Oden A, et al. A 5‐year prospective, observational study of the withdrawal of antihypertensive treatment in elderly people. J Intern Med. 1994;235:581-588.
42. Iyer S, Naganathan V, McLachlan AJ, et al. Medication withdrawal trials in people aged 65 years and older. Drugs Aging. 2008;25:1021-1031.
43. Campbell AJ, Robertson MC, Gardner MM, et al. Psychotropic medication withdrawal and a home‐based exercise program to prevent falls: a randomized, controlled trial. J Am Geriatr Soc. 1999;47:850-853.
44. Pollmann AS, Murphy AL, Bergman JC, et al. Deprescribing benzodiazepines and Z-drugs in community-dwelling adults: a scoping review. BMC Pharmacol Toxicol. 2015;16:19.
45. Farrell B, Pottie K, Thompson W, et al. Deprescribing proton pump inhibitors. Can Fam Phys. 2017; 63:354-364.
46. Duncan P, Duerden M, Payne RA. Deprescribing: a primary care perspective. Eur J Hosp Pharm. 2017;24:37-42.
47. Schuling J, Gebben H, Veehof LJ, et al. Deprescribing medication in very elderly patients with multimorbidity: the view of Dutch GPs. A qualitative study. BMC Fam Pract. 2012;13:56.
48. Scott I, Anderson K, Freeman CR, et al. First do no harm: a real need to deprescribe in older patients. Med J Aust. 2014;201:390-392.
CASE An 82-year-old woman with a history of hypertension, diabetes, hyperlipidemia, stage 3 chronic kidney disease, anxiety, urge urinary incontinence, constipation, and bilateral knee osteoarthritis presents to her primary care physician’s office after a fall. She reports that she visited the emergency department (ED) a week ago after falling in the middle of the night on her way to the bathroom. This is the third fall she’s had this year. On chart review, she had a blood pressure (BP) of 112/60 mm Hg and a blood glucose level of 65 mg/dL in the ED. All other testing (head imaging, chest x-ray, urinalysis) was normal. The ED physician recommended that she stop taking her lisinopril-hydrochlorothiazide (HCTZ) and glipizide extended release (XL) until her follow-up appointment. Today, she asks about the need to restart these medications.
Polypharmacy is common among older adults due to a high prevalence of chronic conditions that often require multiple medications for optimal management. Cut points of 5 or 9 medications are frequently used to define polypharmacy. However, some define polypharmacy as taking a medication that lacks an indication, is ineffective, or is duplicating treatment provided by another medication.
Either way, polypharmacy is associated with multiple negative consequences, including an increased risk for adverse drug events (ADEs),1-4 drug-drug and drug-disease interactions (TABLE 15,6),7 reduced functional capacity,8 multiple geriatric syndromes (TABLE 25,9-12), medication non-adherence,13 and increased mortality.14 Polypharmacy also contributes to increased health care costs for both the patient and the health care system.15
Taking a step back. Polypharmacy often results from prescribing cascades, which occur when an adverse drug effect is misinterpreted as a new medical problem, leading to the prescribing of more medication to treat the initial drug-induced symptom. Potentially inappropriate medications (PIMs), which are medications that should be avoided in older adults and in those with certain conditions, are also more likely to be prescribed in the setting of polypharmacy.16
Deprescribing is the process of identifying and discontinuing medications that are unnecessary, ineffective, and/or inappropriate in order to reduce polypharmacy and improve health outcomes. Deprescribing is a collaborative process that involves weighing the benefits and harms of medications in the context of a patient’s care goals, current level of functioning, life expectancy, values, and preferences. This article reviews polypharmacy and discusses safe and effective deprescribing strategies for older adults in the primary care setting.
[polldaddy:9781245]
How many people on how many meds?
According to a 2016 study, 36% of community-dwelling older adults (ages 62-85 years) were taking 5 or more prescription medications in 2010 to 2011—up from 31% in 2005 to 2006.17 When one narrows the population to older adults in the United States who are hospitalized, almost half (46%) take 7 or more medications.18 Among frail, older US veterans at hospital discharge, 40% were prescribed 9 or more medications, with 44% of these patients receiving at least one unnecessary drug.19
The challenges of multimorbidity
In the United States, 80% of those 65 and older have 2 or more chronic conditions, or multimorbidity.20 Clinical practice guidelines making recommendations for the management of single conditions, such as heart failure, hypertension, or diabetes, often suggest the use of 2 or more medications to achieve optimal management and fail to provide guidance in the setting of multimorbidity. Following treatment recommendations for multiple conditions predictably leads to polypharmacy, with complicated, costly, and burdensome regimens.
Further, the research contributing to the development of clinical practice guidelines frequently excludes older adults and those with multimorbidity, reducing applicability in this population. As a result, many treatment recommendations have uncertain benefit and may be harmful in the multimorbid older patient.21
CASE In addition to the patient’s multimorbidity, she had a stroke at age 73 and has some mild residual left-sided weakness. Functionally, she is independent and able to perform her activities of daily living and her instrumental activities of daily living. She lives alone, quit smoking at age 65, and has an occasional glass of wine during family parties. The patient’s daughter and granddaughter live 2 blocks away.
Her current medications include glipizide XL 10 mg/d and lisinopril-HCTZ 20-25 mg/d, which she has temporarily discontinued at the ED doctor’s recommendation, as well as: amlodipine 10 mg/d, metformin 1000 mg BID, senna 8.6 mg/d, docusate 100 mg BID, furosemide 40 mg/d, and ibuprofen 600 mg/d (for knee pain). She reports taking omeprazole 20 mg/d “for almost 20 years,” even though she has not had any reflux symptoms in recent memory. After her stroke, she began taking atorvastatin 10 mg/d, aspirin 81 mg/d, and clopidogrel 75 mg/d, which she continues to take today. About a year ago, she started oxybutynin 5 mg/d for urinary incontinence, but she has not noticed significant relief. Additionally, she takes lorazepam 1 mg for insomnia most nights of the week.
A review of systems reveals issues with chronic constipation and intermittent dizziness, but is otherwise negative. The physical examination reveals a well-appearing woman with a body mass index of 26. Her temperature is 98.5° F, her heart rate is 78 beats/min and regular, her respirations are 14 breaths/min, and her BP is 117/65 mm Hg. Orthostatic testing is negative. Her heart, lung, and abdominal exams are within normal limits. Her timed up and go test is 14 seconds. Her blood glucose level today in the office after eating breakfast 2 hours ago is 135 mg/dL (normal: <140 mg/dL). Laboratory tests performed at the time of the ED visit show a creatinine level of 1.2 mg/dL (normal range: 0.6 to 1.1 mg/dL), a glomerular filtration rate (GFR) of 44 units (normal range: >60 units), a hemoglobin level of 9.8 g/dL (normal range: 12-15.5 g/dL), and a thyroid stimulating hormone level of 1.4 mIU/L (normal range: 0.5-8.9 mIU/L). A recent hemoglobin A1C is 6.8% (normal: <5.7%), low-density lipoprotein (LDL) level is 103 mg/dL (optimal <100 mg/dL), and high-density lipoprotein (HDL) level is 65 mg/dL (optimal >60 mg/dL). An echocardiogram performed a year ago showed mild aortic stenosis with normal systolic and diastolic function.
Starting the deprescribing process: Several approaches to choose from
The goal of deprescribing is to reduce polypharmacy and improve health outcomes. It is a process defined as, “reviewing all current medications; identifying medications to be ceased, substituted, or reduced; planning a deprescribing regimen in partnership with the patient; and frequently reviewing and supporting the patient.”22 A medication review should include prescription, over-the-counter (OTC), and complementary/alternative medicine (CAM) agents.
Until recently, studies evaluating the process of deprescribing across drug classes and disease conditions were limited, but new research is beginning to show its potential impact. After deprescribing, patients experience fewer falls and show improvements in cognition.23 While there have not yet been large randomized trials to evaluate deprescribing, a recent systematic review and meta-analysis showed that use of patient-specific deprescribing interventions is associated with improved survival.24 Importantly, there have been no reported adverse drug withdrawal events or deaths associated with deprescribing.23
Smaller studies have reported additional benefits including decreases in health care costs, reductions in drug-drug interactions and PIMs, improvements in medication adherence, and increases in patient satisfaction.25 In addition, the removal of unnecessary medications may allow for increased consideration of prescribing appropriate medications with known benefit.25
Practically speaking, every encounter between a patient and health care provider is an opportunity to reduce unnecessary medications. Electronic alert systems at pharmacies and those embedded within electronic health record (EHR) systems can also prompt a medication review and an effort to deprescribe.26 Evidence-based tools to identify polypharmacy and guide appropriate medication use are listed in TABLE 3.5,6,27-30 In addition, suggested approaches to beginning the deprescribing process are included in TABLE 4.5,31-33 And a medication class-based approach to deprescribing is provided in TABLE 5.5,34-45
Although no gold standard process exists for deprescribing, experts suggest that any deprescribing protocol should include the following steps:32,46
1. Start with a “brown bag” review of the patient’s medications.
Have the patient bring all of his/her medications in a bag to the visit; review them together or have the medication history taken by a pharmacist. Determine and discuss the indication for each medication and its effectiveness for that indication. Consider the potential benefits and harms of each medication in the context of the patient’s care goals and preferences. Assess whether the patient is taking all of the medications that have been prescribed, and identify any reasons for missed pills (eg, adverse effects, dosing regimens, understanding, cognitive issues).
2. Talk to the patient about the deprescribing process.
Talk with the patient about the risks and benefits of deprescribing, and prioritize which medications to address in the process. Prioritize the medications by balancing patient preferences with available pharmacologic evidence. If there is a lack of evidence supporting the benefits for a particular medication, consider known or suspected adverse effects, the ease or burden of the dosing regimen, the patient’s preferences and goals of care, remaining life expectancy, the time until drug benefit is appreciated, and the length of drug benefit after discontinuation.
3. Deprescribe medications.
If you are going to taper a medication, develop a schedule in partnership with the patient. Stop one medication at a time so that you can monitor for withdrawal symptoms or for the return of a condition.
Acknowledging potential barriers to deprescribing may help structure conversations and provide anticipatory guidance to patients and their families. Working to overcome these barriers will help maximize the benefits of deprescribing and help to build trust with patients.
Patient-driven barriers include fear of a condition worsening or returning, lack of a suitable alternative, lack of ongoing support to manage a particular condition, a previous bad experience with medication cessation, and influence from other care providers (eg, family, home caregivers, nurses, specialists, friends). Patients and family members sometimes cling to the hope of future effectiveness of a treatment, especially in the case of medications like donepezil for dementia.47 Utilizing a team-based and stepwise patient approach to deprescribing aims to provide hesitant patients with appropriate amounts of education and support to begin to reduce unnecessary medicines.
Provider-driven barriers include feeling uneasy about contradicting a specialist’s recommendations for initiation/continuation of specific medications, fear of causing withdrawal symptoms or disease relapse, and lack of specific data to adequately understand and assess benefits and harms in the older adult population. Primary care physicians have also acknowledged worry about discussing life expectancy and that patients will feel their care is being reduced or “downgraded.”48 Finally, there is limited time in which these complex shared decision-making conversations can take place. Thus, if medications are not causing a noticeable problem, it is often easier to just continue them.
One way to overcome some of these concerns is to consider working with a clinical pharmacist. By gaining information regarding medication-specific factors, such as half-life and expected withdrawal patterns, you can feel more confident deprescribing or continuing medications.
Additionally, communicating closely with specialists, ideally with the help of an integrated EHR, can allow you to discuss indications for particular medications or concerns about adverse effects, limited benefits, or difficulty with compliance, so that you can develop a collaborative, cohesive, and patient-centered plan. This, in turn, may improve patient understanding and compliance.
4. Create a follow-up plan.
At the time of deprescribing a medication, develop a plan with the patient for monitoring and assessment. Ensure that the patient understands which symptoms may occur in the event of drug withdrawal and which symptoms may suggest the return of a condition. Make sure that other supports are in place if needed (eg, cognitive behavioral therapy, physical therapy, social support or assistance) to help ensure that medication cessation is successful.
CASE During the office visit, you advise the patient that her BP looks normal, her blood sugar is within an appropriate range, and she is lucky to have not sustained any injuries after her most recent fall. In addition to discussing the benefits of some outpatient physical therapy to help with her balance, you ask if she would like to discuss reducing her medications. She is agreeable and asks for your recommendations.
You are aware of several resources that can help you with your recommendations, among them the STOPP/START6 and Beers criteria,5 as well as the Good Geriatric-Palliative Algorithm.30
If you were to use the STOPP/START and Beers criteria, you might consider stopping:
- lorazepam, which increases the risk of falls and confusion.
- ibuprofen, since this patient has only mild osteoarthritis pain, and ibuprofen has the potential for renal, cardiac, and gastrointestinal toxicities.
- oxybutynin, because it could be contributing to the patient’s constipation and cause confusion and falls.
- furosemide, since the patient has no clinical heart failure.
- omeprazole, since the indication is unknown and the patient has no history of ulceration, esophagitis, or symptomatic gastroesophageal reflux disease.
After reviewing the Good Geriatric-Palliative Algorithm,30 you might consider stopping:
- clopidogrel, as there is no clear indication for this medication in combination with aspirin in this patient.
- glipizide XL, as this patient’s A1c is below goal and this medication puts her at risk of hypoglycemia and its associated morbidities.
- metformin, as it increases her risk of lactic acidosis because her GFR is <45 units.
- docusate, as the evidence to show clear benefit in improving chronic constipation in older adults is lacking.
You tell your patient that there are multiple medications to consider stopping. In order to monitor any symptoms of withdrawal or return of a condition, it would be best to stop one at a time and follow-up closely. Since she has done well for the past week without the glipizide and lisinopril-HCTZ combination, she can remain off the glipizide and the HCTZ. Lisinopril, however, may provide renal protection in the setting of diabetes and will be continued at this time.
You ask her about adverse effects from her other medications. She indicates that the furosemide makes her run to the bathroom all the time, so she would like to try stopping it. You agree and make a plan for her to monitor her weight, watch for edema, and return in 4 weeks for a follow-up visit.
On follow-up, she is feeling well, has no edema on exam, and is happy to report her urinary incontinence has resolved. You therefore suggest her next deprescribing trial be discontinuation of her oxybutynin. She thanks you for your recommendations about her medications and heads off to her physical therapy appointment.
CORRESPONDENCE
Kathryn McGrath, MD, Department of Family and Community Medicine, Division of Geriatric Medicine and Palliative Care, Thomas Jefferson University, 2422 S Broad St, 2nd Floor, Philadelphia, PA 19145; [email protected].
1. Bourgeois FT, Shannon MW, Valim C, et al. Adverse drug events in the outpatient setting: an 11-year national analysis. Pharmacoepidemiol Drug Saf. 2010;19:901-910.
2. Nair NP, Chalmers L, Peterson GM, et al. Hospitalization in older patients due to adverse drug reactions–the need for a prediction tool. Clin Interv Aging. 2016;11:497-506.
3. Nguyen JK, Fouts MM, Kotabe SE, et al. Polypharmacy as a risk factor for adverse drug reactions in geriatric nursing home residents. Am J Geriatr Pharmacother. 2006; 4:36-41.
4. Hohl CM, Dankoff J, Colacone A, et al. Polypharmacy, adverse drug-related events, and potential adverse drug interactions in elderly patients presenting to an emergency department. Ann Emerg Med. 2001;38:666-671.
5. American Geriatrics Society 2015 Beers Criteria Update Expert Panel. American Geriatrics Society 2015 updated Beers criteria for potentially inappropriate medication use in older adults. J Am Geriatr Soc. 2015;63:2227-2246.
6. O’Mahony D, O’Sullivan D, Byrne S, et al. STOPP/START criteria for potentially inappropriate prescribing in older people: version 2. Age Ageing. 2015;44:213-218.
7. Shah BM, Hajjar ER. Polypharmacy, adverse drug reactions, and geriatric syndromes. Clin Geriatr Med. 2012;28:173-186.
8. Magaziner J, Cadigan DA, Fedder DO, et al. Medication use and functional decline among community-dwelling older women. J Aging Health. 1989;1:470-484.
9. Maher RL, Hanlon J, Hajjar ER. Clinical consequences of polypharmacy in elderly. Expert Opin Drug Saf. 2014;13:57-65.
10. Tinetti ME, Han L, Lee DS, et al. Antihypertensive medications and serious fall injuries in a nationally representative sample of older adults. JAMA Intern Med. 2014;174:588-595.
11. Weiss BD. Diagnostic evaluation of urinary incontinence in geriatric patients. Am Fam Physician. 1998;57:2675-2694.
12. Syed Q, Hendler KT, Koncilja K. The impact of aging and medical status on dysgeusia. Am J Med. 2016;129:753, E1-E6.
13. Vik SA, Maxwell CJ, Hogan DB. Measurement, correlates, and health outcomes of medication adherence among seniors. Ann Pharmacother. 2004;38:303-312.
14. Espino DV, Bazaldua OV, Palmer RF, et al. Suboptimal medication use and mortality in an older adult community-based cohort: results from the Hispanic EPESE Study. J Gerontol A Biol Sci Med Sci. 2006;61:170-175.
15. Akazawa M, Imai H, Igarashi A, et al. Potentially inappropriate medication use in elderly Japanese patients. Am J Geriatr Pharmacother. 2010; 8:146-160.
16. Steinman MA, Landefeld CS, Rosenthal GE, et al. Polypharmacy and prescribing quality in older people. J Am Geriatr Soc. 2006;54:1516-1523.
17. Qato DM, Wilder J, Schumm LP, et al. Changes in prescription and over-the-counter medication and dietary supplement use among older adults in the United States, 2005 vs 2011. JAMA Intern Med. 2016;176:473-482.
18. Flaherty JH, Perry HM 3rd, Lynchard GS, et al. Polypharmacy and hospitalization among older home care patients. J Gerontol A Biol Sci Med Sci. 2000;55:554-559.
19. Hajjar ER, Hanlon JT, Sloane RJ, et al. Unnecessary drug use in frail older people at hospital discharge. J Am Geriatr Soc. 2005;53:1518-1523.
20. Gerteis J, Izrael D, Deitz D, et al. Multiple chronic conditions chartbook. Rockville, MD: Agency for Healthcare Research and Quality. 2014.
21. American Geriatrics Society Expert Panel on the Care of Older Adults with Multimorbidity. Guiding principles for the care of older adults with multimorbidity: an approach for clinicians. J Am Geriatr Soc. 2012;60:E1-E25.
22. Woodward M. Deprescribing: achieving better health outcomes for older people through reducing medications. J Pharm Pract Res. 2003;33:323-328.
23. Garfinkel D, Mangin D. Feasibility study of a systematic approach for discontinuation of multiple medications in older adults: addressing polypharmacy. Arch Intern Med. 2010;170:1648-1654.
24. Page AT, Clifford RM, Potter K, et al. The feasibility and effect of deprescribing in older adults on mortality and health: a systematic review and meta‐analysis. Br J Clin Pharmacol. 2016;82:583-623.
25. Reeve E, Shakib S, Hendrix I, et al. The benefits and harms of deprescribing. Med J Aust. 2014;201:386-389.
26. Walsh K, Kwan D, Marr P, et al. Deprescribing in a family health team: a study of chronic proton pump inhibitor use. J Prim Health Care. 2016;8:164-171.
27. Orwig D, Brandt N, Gruber-Baldini AL. Medication management assessment for older adults in the community. Gerontologist. 2006;46:661-668.
28. Anderson K, Jue SG, Madaras-Kelly KJ. Identifying patients at risk for medication mismanagement: using cognitive screens to predict a patient’s accuracy in filling a pillbox. Consult Pharm. 2008;23:459-472.
29. Lenaerts E, De Knijf F, Schoenmakers B. Appropriate prescribing for older people: a new tool for the general practitioner. J Frailty & Aging. 2013;2:8-14.
30. Garfinkel D, Zur-Gil S, Ben-Israel J. The war against polypharmacy: a new cost-effective geriatric-palliative approach for improving drug therapy in disabled elderly people. IMAJ. 2007;9:430-434.
31. Holmes HM, Todd A. Evidence-based deprescribing of statins in patients with advanced illness. JAMA Intern Med. 2015;175:701-702.
32. Scott IA, Hilmer SN, Reeve E, et al. Reducing inappropriate polypharmacy: the process of deprescribing. JAMA Intern Med. 2015;175:827-834.
33. Guirguis-Blake JM, Evans CV,Senger CA, et al. Aspirin for the primary prevention of cardiovascular events: a systematic evidence review for the U.S. Preventive Services Task Force. Ann Intern Med. 2016;164:804-813.
34. Declercq T, Petrovic M, Azermai M, et al. Withdrawal versus continuation of chronic antipsychotic drugs for behavioural and psychological symptoms in older people with dementia. Cochrane Database Syst Rev. 2013;3:CD007726.
35. Petersen LK, Christensen K, Kragstrup J. Lipid-lowering treatment to the end? A review of observational studies and RCTs on cholesterol and mortality in 80+-year olds. Age Ageing. 2010;39:674-680.
36. Banach M, Serban MC. Discussion around statin discontinuation in older adults and patients with wasting diseases. J Cachexia Sarcopenia Muscle. 2016;7:396-399.
37. Goldstein MR, Mascitelli L, Pezzetta F. Statin therapy in the elderly: misconceptions. J Am Geriatr Soc. 2008;56:1365.
38. Han BH, Sutin D, Williamson JD, et al, for the ALLHAT Collaborative Research Group. Effect of statin treatment vs usual care on primary cardiovascular prevention among older adults. The ALLHAT-LLT Randomized Clinical Trial. JAMA Intern Med. Published online May 22, 2017.
39. Sever PS, Chang CL, Gupta AK, et al. The Anglo-Scandinavian Cardiac Outcomes Trial: 11-year mortality follow-up of the lipid-lowering arm in the U.K. Eur Heart J. 2011;32:2525-2532.
40. Denardo SJ, Gong Y, Nichols WW, et al. Blood pressure and outcomes in very old hypertensive coronary artery disease patients: an INVEST substudy. Am J Med. 2010;123:719-726.
41. Ekbom T, Lindholm LH, Oden A, et al. A 5‐year prospective, observational study of the withdrawal of antihypertensive treatment in elderly people. J Intern Med. 1994;235:581-588.
42. Iyer S, Naganathan V, McLachlan AJ, et al. Medication withdrawal trials in people aged 65 years and older. Drugs Aging. 2008;25:1021-1031.
43. Campbell AJ, Robertson MC, Gardner MM, et al. Psychotropic medication withdrawal and a home‐based exercise program to prevent falls: a randomized, controlled trial. J Am Geriatr Soc. 1999;47:850-853.
44. Pollmann AS, Murphy AL, Bergman JC, et al. Deprescribing benzodiazepines and Z-drugs in community-dwelling adults: a scoping review. BMC Pharmacol Toxicol. 2015;16:19.
45. Farrell B, Pottie K, Thompson W, et al. Deprescribing proton pump inhibitors. Can Fam Phys. 2017; 63:354-364.
46. Duncan P, Duerden M, Payne RA. Deprescribing: a primary care perspective. Eur J Hosp Pharm. 2017;24:37-42.
47. Schuling J, Gebben H, Veehof LJ, et al. Deprescribing medication in very elderly patients with multimorbidity: the view of Dutch GPs. A qualitative study. BMC Fam Pract. 2012;13:56.
48. Scott I, Anderson K, Freeman CR, et al. First do no harm: a real need to deprescribe in older patients. Med J Aust. 2014;201:390-392.
From The Journal of Family Practice | 2017;66(7):436-445.
PRACTICE RECOMMENDATIONS
› Avoid medications that are inappropriate for older adults because of adverse effects, lack of efficacy, and/or potential for interactions. A
› Discontinue medications when the harms outweigh the benefits in the context of the patient’s care goals, life expectancy, and/or preferences. C
› Utilize resources such as the STOPP/START and Beers criteria to help you decide where to begin the deprescribing process. B
Strength of recommendation (SOR)
A Good-quality patient-oriented evidence
B Inconsistent or limited-quality patient-oriented evidence
C Consensus, usual practice, opinion, disease-oriented evidence, case series

Consider this probiotic for functional abdominal pain
In the article, “When can infants and children benefit from probiotics?” (J Fam Pract. 2016;65:789-794), Dassow et al recommended probiotics as a therapeutic tool for reducing abdominal pain associated with pediatric irritable bowel syndrome (IBS). There are several types of functional disorders in childhood with related abdominal pain, the most common of which are IBS and functional abdominal pain (FAP).1,2
Several recent randomized placebo-controlled trials—one of which I led—have shown that Lactobacillus reuteri DSM 17938 is a beneficial treatment for FAP in children.3-5 When compared with placebo, this probiotic agent significantly reduced the frequency and intensity of FAP in children.
Family physicians should consider this probiotic microorganism as a potential therapeutic tool for IBS, as well as childhood FAP.
Zvi Weizman, MD
Beer-Sheva, Israel
1. Childhood functional GI disorders: child/adolescent. In: Drossman DA CE, Delvaux M, Spiller RC, et al, eds. Rome III: the functional gastrointestinal disorders. 3rd ed. McLean, VA: Degnon Associates, Inc; 2006:895-897.
2. Brown LK, Beattie RM, Tighe MP. Practical management of functional abdominal pain in children. Arch Dis Child. 2016;101:677-683.
3. Romano C, Ferrau’ V, Cavataio F, et al. Lactobacillus reuteri in children with functional abdominal pain (FAP). J Paediatr Child Health. 2014;50:E68-E71.
4. Weizman Z, Abu-Abed J, Binsztok M. Lactobacillus reuteri DSM 17938 for the management of functional abdominal pain in childhood: A randomized, double-blind, placebo-controlled trial. J Pediatr. 2016;174:160-164.e1.
5. Jadrešin O, Hojsak I, Mišak Z, et al. Lactobacillus reuteri DSM 17938 in the treatment of functional abdominal pain in children - RCT study. J Pediatr Gastroenterol Nutr. 2017;64:925-929.
In the article, “When can infants and children benefit from probiotics?” (J Fam Pract. 2016;65:789-794), Dassow et al recommended probiotics as a therapeutic tool for reducing abdominal pain associated with pediatric irritable bowel syndrome (IBS). There are several types of functional disorders in childhood with related abdominal pain, the most common of which are IBS and functional abdominal pain (FAP).1,2
Several recent randomized placebo-controlled trials—one of which I led—have shown that Lactobacillus reuteri DSM 17938 is a beneficial treatment for FAP in children.3-5 When compared with placebo, this probiotic agent significantly reduced the frequency and intensity of FAP in children.
Family physicians should consider this probiotic microorganism as a potential therapeutic tool for IBS, as well as childhood FAP.
Zvi Weizman, MD
Beer-Sheva, Israel
1. Childhood functional GI disorders: child/adolescent. In: Drossman DA CE, Delvaux M, Spiller RC, et al, eds. Rome III: the functional gastrointestinal disorders. 3rd ed. McLean, VA: Degnon Associates, Inc; 2006:895-897.
2. Brown LK, Beattie RM, Tighe MP. Practical management of functional abdominal pain in children. Arch Dis Child. 2016;101:677-683.
3. Romano C, Ferrau’ V, Cavataio F, et al. Lactobacillus reuteri in children with functional abdominal pain (FAP). J Paediatr Child Health. 2014;50:E68-E71.
4. Weizman Z, Abu-Abed J, Binsztok M. Lactobacillus reuteri DSM 17938 for the management of functional abdominal pain in childhood: A randomized, double-blind, placebo-controlled trial. J Pediatr. 2016;174:160-164.e1.
5. Jadrešin O, Hojsak I, Mišak Z, et al. Lactobacillus reuteri DSM 17938 in the treatment of functional abdominal pain in children - RCT study. J Pediatr Gastroenterol Nutr. 2017;64:925-929.
Gradual vs abrupt smoking cessation: Each has its place
In the article by Smith et al, “ ‘Cold turkey’ works best for smoking cessation” (J Fam Pract. 2017;66:174-176), the authors highlighted a study by Lindson-Hawley et al showing that abrupt cessation was as
While I agree with Smith et al’s assessment of abrupt cessation for patients in the preparation and action stages of change as created by DiClemente and Prochaska,2 most clinical patients are in the pre-contemplative and contemplative stages of change. A bias of the study was that all recruited participants were willing to quit within 2 weeks.
A systematic review by the same authors (Lindson-Hawley et al) compared gradual reduction of smoking with abrupt cessation and found comparable quit rates.3 Smith et al commented that the reason for this conclusion was limitations in the studies, including differences in patient populations, outcome definitions, and types of interventions.
Because a large subset of clinical patients are in the pre-contemplative and contemplative stages of change, I believe gradual cessation remains an important technique to use while patients transition their beliefs.
Jeff Ebel, DO
Toledo, Ohio
Author’s response:
I appreciate Dr. Ebel’s input and perspective. My co-authors and I acknowledge that the previous systematic review noted comparable quit rates, but there were significant limitations to the studies, which Dr. Ebel noted. The highlight from the 2016 randomized, controlled trial by Lindson-Hawley et al is that patients are more likely to quit from abrupt cessation, even if they initially prefer gradual cessation. As Dr. Ebel notes (and we highlighted in the PURL), our role as family physicians is to inform patients of the data, but support them in whatever method of cessation they choose.
Dustin K. Smith, DO
Jacksonville, Fla.
1. Lindson-Hawley N, Banting M, West R, et al. Gradual versus abrupt smoking cessation: a randomized, controlled noninferiority trial. Ann Intern Med. 2016;164:585-592.
2. DiClemente CC, Prochaska JO. Self-change and therapy change of smoking behavior: a comparison of processes of change in cessation and maintenance. Addict Behav. 1982;7:133-142.
3. Lindson-Hawley N, Aveyard P, Hughes JR. Reduction versus abrupt cessation in smokers who want to quit. Cochrane Database Syst Rev. 2012;11:CD008033.
In the article by Smith et al, “ ‘Cold turkey’ works best for smoking cessation” (J Fam Pract. 2017;66:174-176), the authors highlighted a study by Lindson-Hawley et al showing that abrupt cessation was as
While I agree with Smith et al’s assessment of abrupt cessation for patients in the preparation and action stages of change as created by DiClemente and Prochaska,2 most clinical patients are in the pre-contemplative and contemplative stages of change. A bias of the study was that all recruited participants were willing to quit within 2 weeks.
A systematic review by the same authors (Lindson-Hawley et al) compared gradual reduction of smoking with abrupt cessation and found comparable quit rates.3 Smith et al commented that the reason for this conclusion was limitations in the studies, including differences in patient populations, outcome definitions, and types of interventions.
Because a large subset of clinical patients are in the pre-contemplative and contemplative stages of change, I believe gradual cessation remains an important technique to use while patients transition their beliefs.
Jeff Ebel, DO
Toledo, Ohio
Author’s response:
I appreciate Dr. Ebel’s input and perspective. My co-authors and I acknowledge that the previous systematic review noted comparable quit rates, but there were significant limitations to the studies, which Dr. Ebel noted. The highlight from the 2016 randomized, controlled trial by Lindson-Hawley et al is that patients are more likely to quit from abrupt cessation, even if they initially prefer gradual cessation. As Dr. Ebel notes (and we highlighted in the PURL), our role as family physicians is to inform patients of the data, but support them in whatever method of cessation they choose.
Dustin K. Smith, DO
Jacksonville, Fla.
1. Lindson-Hawley N, Banting M, West R, et al. Gradual versus abrupt smoking cessation: a randomized, controlled noninferiority trial. Ann Intern Med. 2016;164:585-592.
2. DiClemente CC, Prochaska JO. Self-change and therapy change of smoking behavior: a comparison of processes of change in cessation and maintenance. Addict Behav. 1982;7:133-142.
3. Lindson-Hawley N, Aveyard P, Hughes JR. Reduction versus abrupt cessation in smokers who want to quit. Cochrane Database Syst Rev. 2012;11:CD008033.
What effects—if any—does marijuana use during pregnancy have on the fetus or child?
EVIDENCE SUMMARY
A large systematic review of prospective and retrospective cohort studies found little or no effect of maternal marijuana use on birth weight, stillbirths, preterm births, or congenital anomalies (TABLE1-8). Some studies found lower birth weights and some found higher birth weights. The authors couldn’t perform a meta-analysis because of heterogeneity, but estimated a clinically insignificant difference of 100 g. Most studies were limited by failure to account for concurrent maternal tobacco smoking.
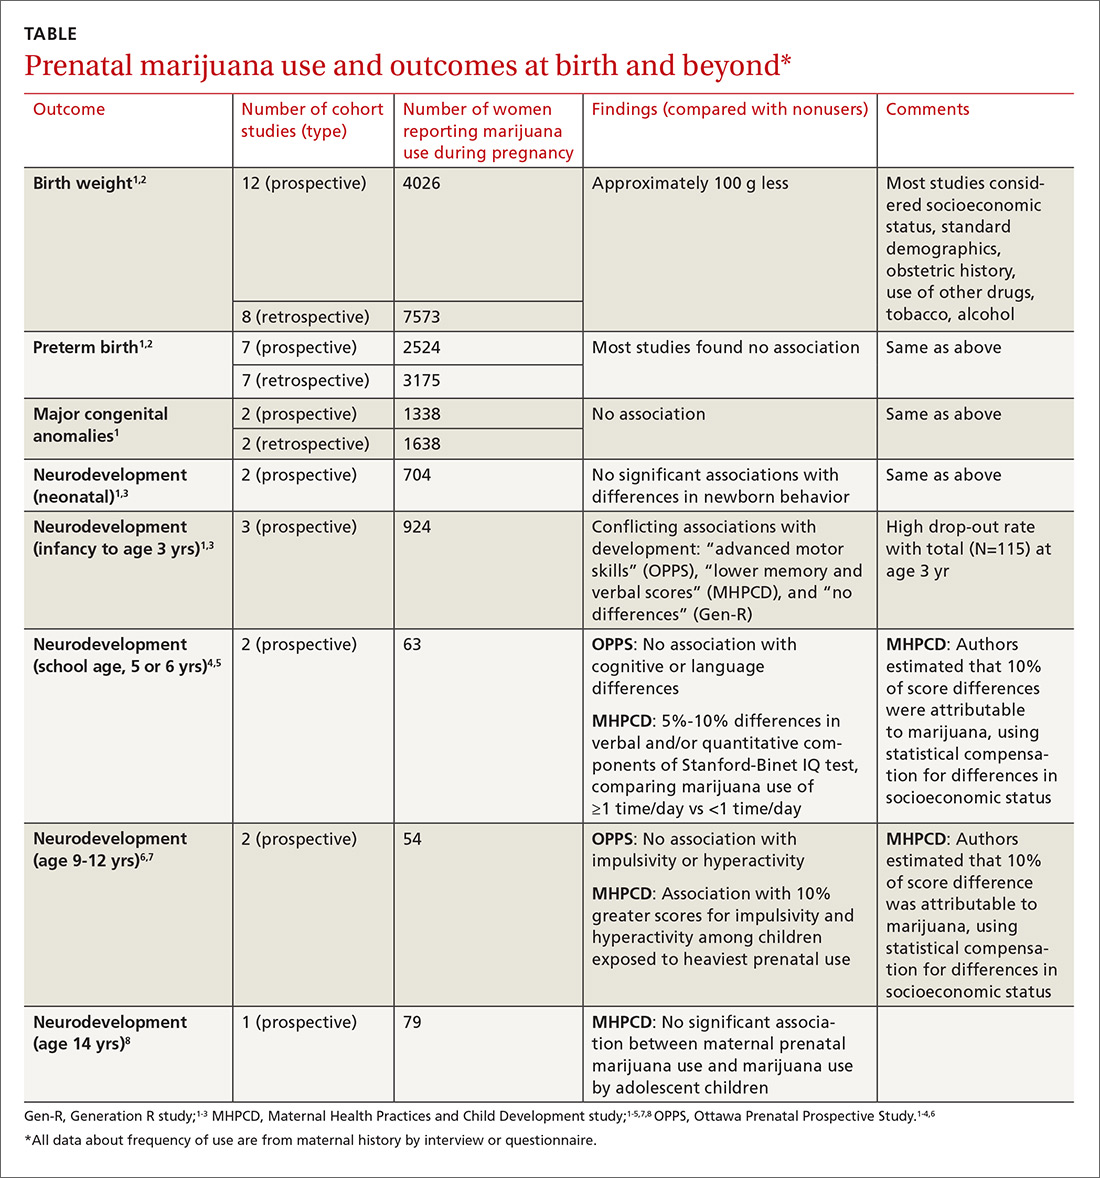
Moreover, all studies used interview data to determine maternal prenatal marijuana use, which can be subject to large recall bias. A multicenter prospective study of 585 pregnant women that compared interview data with serum screening to identify tetrahydrocannabinol (THC) found poor correlation between history and laboratory validation, for example.1 Only 31% of pregnant women with positive THC testing self-reported marijuana use (31% sensitivity), and only 43% of women who reported marijuana use had a positive THC screen (43% specificity). Most studies didn’t quantify marijuana use well and didn’t associate use with trimester of exposure.
The authors also point out that marijuana potency has increased substantially since the 1980s when many of the studies were done (THC content was 3.2% in 1983 and 13% in 2008); prenatal marijuana use in the present day may expose the fetus to larger amounts of THC.1
A 2016 retrospective cohort study of 56 mothers who reported prenatal marijuana use found no differences in preterm birth, low birth weight, or Apgar scores.2
Neurodevelopmental effects on infants, long-term effects on children, teens
Three prospective cohort studies evaluated neurodevelopmental outcomes in neonates and infants, and 2 studies continued to follow children into adolescence.1,3 All found essentially no differences associated with prenatal marijuana at birth, throughout infancy, and through age 3 years. The studies had the same limitations as those described previously (potential recall bias for identifying which children were exposed to marijuana prenatally and poorly quantified marijuana use not well-associated with trimester of exposure).
The Ottawa Prenatal Prospective Study (OPPS) examined 140 low-risk pregnancies in white women of higher socioeconomic status who used marijuana during pregnancy.1,3-7 Investigators considered: socioeconomic status, standard demographics, obstetric history, and use of other drugs, tobacco, and alcohol. Using a standardized newborn assessment scale, they found subtle behavioral differences at one week but not 9 days. Investigators evaluated children again at 3 years of age, school entry (5 or 6 years), and 9 to 12 years.
The Maternal Health Practices and Child Development study (MHPCD) of 564 high-risk pregnancies in predominantly minority women of low socioeconomic status followed infants from birth through 14 years of age.1,3-5,7,8 It found some small differences in outcomes among children exposed to marijuana prenatally. Of note, when investigators evaluated marijuana use at age 14 years, they compared adolescent self-report history with urine THC testing (specificity 78%).
The MHPCD study was limited because, compared with the nonusing group, mothers who used marijuana were also 20% to 25% more likely to be single and poor, to live in poorer quality homes, and to use alcohol, tobacco, and other drugs. Investigators used statistical modeling to account for these environmental differences and estimated that 10% of the difference in outcomes was attributable to prenatal marijuana exposure.
The Generation R study (Gen R) enrolled 220 lower-risk pregnancies in multiethnic European women of higher socioeconomic status, followed children to 3 years of age, and found no marijuana-associated differences in any parameter.1,3,4 The final assessment included only 51 children.
RECOMMENDATIONS
The American College of Obstetricians and Gynecologists (ACOG) recommends screening all women for tobacco, alcohol, and drug use (including marijuana) during early pregnancy.9 Women who report marijuana use should be counseled regarding potential adverse consequences to fetal health and be encouraged to discontinue use.
ACOG says that insufficient data exist to evaluate the effects of marijuana use on infants during lactation and breastfeeding and recommends against it.
The American Society of Addiction Medicine also recommends screening pregnant women for drug use and making appropriate referrals for substance use treatment.10
1. Metz TD, Stickrath EH. Marijuana use in pregnancy and lactation: a review of the evidence. Am J Obstet Gynecol. 2015;213:761-778.
2. Chabarria KC, Racusin DA, Antony KM, et al. Marijuana use and its effects in pregnancy. Am J Obstet Gynecol. 2016;215:506.e1-e7.
3. Warner TD, Roussos-Ross D, Behnke M. It’s not your mother’s marijuana: effects on maternal-fetal health and the developing child. Clinical Perinatology. 2014;41:877-894.
4. Huizink AC. Prenatal cannabis exposure and infant outcomes: overview of studies. Prog Neuro-Psychopharmacol Biol Psychiatry. 2014;52:45-52.
5. Goldschmidt L, Richardson GA, Willford J, et al. Prenatal marijuana exposure and intelligence test performance at age 6. J Am Acad Child Adolesc Psychiatry. 2008;47:254-263.
6. Fried PA. The Ottawa Prenatal Prospective Study (OPPS): methodological issues and findings—it’s easy to throw the baby out with the bath water. Life Sci. 1995;56:2159-2168.
7. Goldschmidt L, Day NL, Richardson GA. Effects of prenatal marijuana exposure on child behavior problems at age 10. Neurotoxicol Teratol. 2000;22:325-336.
8. Day NL, Goldschmidt L, Thomas CA. Prenatal marijuana exposure contributes to the prediction of marijuana use at age 14. Addiction. 2006;101:1313-1322.
9. American College of Obstetricians and Gynecologists Committee on Obstetric Practice. Committee Opinion No. 637: Marijuana use during pregnancy and lactation. Obstet Gynecol. 2015;126:234-238.
10. American Society of Addiction Medicine. Public policy statement on women, alcohol and other drugs, and pregnancy. Chevy Chase MD: American Society of Addiction Medicine; 2011. Available at: http://www.asam.org/docs/default-source/public-policy-statements/1womenandpregnancy_7-11.pdf. Accessed July 5, 2016.
EVIDENCE SUMMARY
A large systematic review of prospective and retrospective cohort studies found little or no effect of maternal marijuana use on birth weight, stillbirths, preterm births, or congenital anomalies (TABLE1-8). Some studies found lower birth weights and some found higher birth weights. The authors couldn’t perform a meta-analysis because of heterogeneity, but estimated a clinically insignificant difference of 100 g. Most studies were limited by failure to account for concurrent maternal tobacco smoking.
Moreover, all studies used interview data to determine maternal prenatal marijuana use, which can be subject to large recall bias. A multicenter prospective study of 585 pregnant women that compared interview data with serum screening to identify tetrahydrocannabinol (THC) found poor correlation between history and laboratory validation, for example.1 Only 31% of pregnant women with positive THC testing self-reported marijuana use (31% sensitivity), and only 43% of women who reported marijuana use had a positive THC screen (43% specificity). Most studies didn’t quantify marijuana use well and didn’t associate use with trimester of exposure.
The authors also point out that marijuana potency has increased substantially since the 1980s when many of the studies were done (THC content was 3.2% in 1983 and 13% in 2008); prenatal marijuana use in the present day may expose the fetus to larger amounts of THC.1
A 2016 retrospective cohort study of 56 mothers who reported prenatal marijuana use found no differences in preterm birth, low birth weight, or Apgar scores.2
Neurodevelopmental effects on infants, long-term effects on children, teens
Three prospective cohort studies evaluated neurodevelopmental outcomes in neonates and infants, and 2 studies continued to follow children into adolescence.1,3 All found essentially no differences associated with prenatal marijuana at birth, throughout infancy, and through age 3 years. The studies had the same limitations as those described previously (potential recall bias for identifying which children were exposed to marijuana prenatally and poorly quantified marijuana use not well-associated with trimester of exposure).
The Ottawa Prenatal Prospective Study (OPPS) examined 140 low-risk pregnancies in white women of higher socioeconomic status who used marijuana during pregnancy.1,3-7 Investigators considered: socioeconomic status, standard demographics, obstetric history, and use of other drugs, tobacco, and alcohol. Using a standardized newborn assessment scale, they found subtle behavioral differences at one week but not 9 days. Investigators evaluated children again at 3 years of age, school entry (5 or 6 years), and 9 to 12 years.
The Maternal Health Practices and Child Development study (MHPCD) of 564 high-risk pregnancies in predominantly minority women of low socioeconomic status followed infants from birth through 14 years of age.1,3-5,7,8 It found some small differences in outcomes among children exposed to marijuana prenatally. Of note, when investigators evaluated marijuana use at age 14 years, they compared adolescent self-report history with urine THC testing (specificity 78%).
The MHPCD study was limited because, compared with the nonusing group, mothers who used marijuana were also 20% to 25% more likely to be single and poor, to live in poorer quality homes, and to use alcohol, tobacco, and other drugs. Investigators used statistical modeling to account for these environmental differences and estimated that 10% of the difference in outcomes was attributable to prenatal marijuana exposure.
The Generation R study (Gen R) enrolled 220 lower-risk pregnancies in multiethnic European women of higher socioeconomic status, followed children to 3 years of age, and found no marijuana-associated differences in any parameter.1,3,4 The final assessment included only 51 children.
RECOMMENDATIONS
The American College of Obstetricians and Gynecologists (ACOG) recommends screening all women for tobacco, alcohol, and drug use (including marijuana) during early pregnancy.9 Women who report marijuana use should be counseled regarding potential adverse consequences to fetal health and be encouraged to discontinue use.
ACOG says that insufficient data exist to evaluate the effects of marijuana use on infants during lactation and breastfeeding and recommends against it.
The American Society of Addiction Medicine also recommends screening pregnant women for drug use and making appropriate referrals for substance use treatment.10
1. Metz TD, Stickrath EH. Marijuana use in pregnancy and lactation: a review of the evidence. Am J Obstet Gynecol. 2015;213:761-778.
2. Chabarria KC, Racusin DA, Antony KM, et al. Marijuana use and its effects in pregnancy. Am J Obstet Gynecol. 2016;215:506.e1-e7.
3. Warner TD, Roussos-Ross D, Behnke M. It’s not your mother’s marijuana: effects on maternal-fetal health and the developing child. Clinical Perinatology. 2014;41:877-894.
4. Huizink AC. Prenatal cannabis exposure and infant outcomes: overview of studies. Prog Neuro-Psychopharmacol Biol Psychiatry. 2014;52:45-52.
5. Goldschmidt L, Richardson GA, Willford J, et al. Prenatal marijuana exposure and intelligence test performance at age 6. J Am Acad Child Adolesc Psychiatry. 2008;47:254-263.
6. Fried PA. The Ottawa Prenatal Prospective Study (OPPS): methodological issues and findings—it’s easy to throw the baby out with the bath water. Life Sci. 1995;56:2159-2168.
7. Goldschmidt L, Day NL, Richardson GA. Effects of prenatal marijuana exposure on child behavior problems at age 10. Neurotoxicol Teratol. 2000;22:325-336.
8. Day NL, Goldschmidt L, Thomas CA. Prenatal marijuana exposure contributes to the prediction of marijuana use at age 14. Addiction. 2006;101:1313-1322.
9. American College of Obstetricians and Gynecologists Committee on Obstetric Practice. Committee Opinion No. 637: Marijuana use during pregnancy and lactation. Obstet Gynecol. 2015;126:234-238.
10. American Society of Addiction Medicine. Public policy statement on women, alcohol and other drugs, and pregnancy. Chevy Chase MD: American Society of Addiction Medicine; 2011. Available at: http://www.asam.org/docs/default-source/public-policy-statements/1womenandpregnancy_7-11.pdf. Accessed July 5, 2016.
Evidence-based answers from the Family Physicians Inquiries Network
EVIDENCE-BASED ANSWER:
The effects are unclear. Marijuana use during pregnancy is associated with clinically unimportant lower birth weights (growth differences of approximately 100 g), but no differences in preterm births or congenital anomalies (strength of recommendation [SOR]: B, prospective and retrospective cohort studies with methodologic flaws).
Similarly, prenatal marijuana use isn’t associated with differences in neurodevelopmental outcomes (behavior problems, intellect, visual perception, language, or sustained attention and memory tasks) at birth, in the neonatal period, or in childhood through age 3 years. However, it may be associated with minimally lower verbal/quantitative IQ scores (1%) at age 6 years and increased impulsivity and hyperactivity (1%) at 10 years. Prenatal use isn’t linked to increased substance use at age 14 years (SOR: B, conflicting long-term prospective and retrospective cohort studies with methodologic flaws).

Rewriting the script on polypharmacy
Drugs are valuable when they effectively relieve symptoms or prevent illness, but we all know they are double-edged swords when it comes to cost, adverse effects, and drug interactions. This “downside” is not lost on older Americans—especially when you consider that more than a third of Americans, ages 62 to 85 years, take 5 or more prescription medications daily.1
Too often patients take prescription drugs that they either don’t need or that are harming them. That’s where deprescribing comes in. As this month’s feature article by McGrath and colleagues explains, deprescribing is the process of reducing or stopping unnecessary prescription medications.
The power of deprescribing. About a decade ago, a geriatrician/family physician friend of mine took over as medical director of a 160-bed nursing home. He lamented that the average number of prescription medications taken by the patients in the nursing home was 9.5. He and his team went to work deprescribing, and one year later, the average number of prescription medications per patient was 5.3. As far as he and the nursing staff could tell, the patients were doing just fine and were more alert and functional.
Another specialist, another Rx. In clinic, I saw a 54-year-old woman with the chief complaint of chronic, dry cough for which she had been on a specialist pilgrimage. A GI specialist prescribed omeprazole, an ENT physician prescribed fluticasone nasal spray and cetirizine, and a pulmonologist added an inhaled corticosteroid to the mix. (I’m not making this up!) I reviewed her medication list carefully and noted she had been placed on amitriptyline for insomnia shortly before the cough began. I was suspicious because the properties of anticholinergics can contribute to a cough. At my suggestion, she agreed to stop the amitriptyline (and endure some sleeplessness). Two weeks later, she returned with no cough. Over the next month, she stopped all 4 other medications, and the cough did not return.
Today in the office, a 64-year-old man complained of lightheadedness and fatigue and told me his blood pressure on home monitoring was consistently around 105/50 mm Hg. In addition to taking 3 antihypertensive medications, I discovered he had been prescribed doxazosin—an alpha blocker, which also lowers blood pressure—
I’m certain that you, too, have stories of successful deprescribing. Let’s remain alert to the problem of polypharmacy, keep meticulous medication lists, and deprescribe whenever it makes good sense. Doing so is essential to our roles as family physicians.
1. Qato DM, Wilder J, Schumm LP, et al. Changes in prescription and over-the-counter medication and dietary supplement use among older adults in the United States, 2005 vs 2011. JAMA Intern Med. 2016;176:473-482.
Editor-in-Chief

Editor-in-Chief
Editor-in-Chief
Drugs are valuable when they effectively relieve symptoms or prevent illness, but we all know they are double-edged swords when it comes to cost, adverse effects, and drug interactions. This “downside” is not lost on older Americans—especially when you consider that more than a third of Americans, ages 62 to 85 years, take 5 or more prescription medications daily.1
Too often patients take prescription drugs that they either don’t need or that are harming them. That’s where deprescribing comes in. As this month’s feature article by McGrath and colleagues explains, deprescribing is the process of reducing or stopping unnecessary prescription medications.
The power of deprescribing. About a decade ago, a geriatrician/family physician friend of mine took over as medical director of a 160-bed nursing home. He lamented that the average number of prescription medications taken by the patients in the nursing home was 9.5. He and his team went to work deprescribing, and one year later, the average number of prescription medications per patient was 5.3. As far as he and the nursing staff could tell, the patients were doing just fine and were more alert and functional.
Another specialist, another Rx. In clinic, I saw a 54-year-old woman with the chief complaint of chronic, dry cough for which she had been on a specialist pilgrimage. A GI specialist prescribed omeprazole, an ENT physician prescribed fluticasone nasal spray and cetirizine, and a pulmonologist added an inhaled corticosteroid to the mix. (I’m not making this up!) I reviewed her medication list carefully and noted she had been placed on amitriptyline for insomnia shortly before the cough began. I was suspicious because the properties of anticholinergics can contribute to a cough. At my suggestion, she agreed to stop the amitriptyline (and endure some sleeplessness). Two weeks later, she returned with no cough. Over the next month, she stopped all 4 other medications, and the cough did not return.
Today in the office, a 64-year-old man complained of lightheadedness and fatigue and told me his blood pressure on home monitoring was consistently around 105/50 mm Hg. In addition to taking 3 antihypertensive medications, I discovered he had been prescribed doxazosin—an alpha blocker, which also lowers blood pressure—
I’m certain that you, too, have stories of successful deprescribing. Let’s remain alert to the problem of polypharmacy, keep meticulous medication lists, and deprescribe whenever it makes good sense. Doing so is essential to our roles as family physicians.
1. Qato DM, Wilder J, Schumm LP, et al. Changes in prescription and over-the-counter medication and dietary supplement use among older adults in the United States, 2005 vs 2011. JAMA Intern Med. 2016;176:473-482.
1. Qato DM, Wilder J, Schumm LP, et al. Changes in prescription and over-the-counter medication and dietary supplement use among older adults in the United States, 2005 vs 2011. JAMA Intern Med. 2016;176:473-482.
HCV on the Rise Among Women Giving Birth
Between 2009 and 2014, hepatitis C virus (HCV) infection among women giving birth rose 89%, from 1.8 to 3.4 per live births, according to a study published in Morbidity and Mortality Weekly Report. The researchers say, geographically, the increase in maternal HCV infection mirrors increases in HCV incidence among adults. The highest infection rate was in West Virginia, which had 22.6 per 1,000 live births. Next was Tennessee with 10.1. State infection rates varied widely: Hawaii had the lowest rate, of 0.7.
In Tennessee, the prevalence of maternal HCV infection increased 163%, from 3.8 per 1,000 in 2009 to 10 in 2014. But even among the 95 Tennessee counties, rates varied substantially. The highest rates were in the 52 Appalachian counties. Campbell County had 78 per 1,000 births. Compared with women in urban areas, pregnant women from rural areas had triple the odds of HCV infection. The rise in infection among pregnant women coincides with the rises in heroin and prescription opioid epidemics, which also disproportionately affect rural populations.
Analyzing the Tennessee births, researchers found that the odds of HCV infection were about 5 times higher among women who smoked cigarettes during pregnancy. Concurrent infections were another serious risk factor, with hepatitis B virus infection boosting the odds of HCV infection by nearly 17 times.
HCV infection is a growing—but modifiable—threat among pregnant women, the researchers say. The rise in infection is “particularly concerning,” in light of recent research that has found poor follow-up of HCV-exposed infants. The researchers cite a Philadelphia study that found only 16% of HCV-exposed infants were appropriately followed. That could mean that infected infants are going undetected, the researchers say. The rate of transmission from mothers to infants is estimated at 6%; it’s important for exposed infants to be followed for evidence of seroconversion. But anti-HCV antibody tests can’t be completed until 18 months because passively acquired maternal antibodies can persist. Testing for HCV ribonucleic acid can be performed earlier.
The CDC and the American College of Obstetricians and Gynecologists recommend selective screening of pregnant women at high risk for HCV infection, particularly those with a history of injection drug use or long-term hemodialysis.