User login
Comparison of Salicylic Acid 30% Peel and Pneumatic Broadband Light in the Treatment of Mild to Moderately Severe Facial Acne Vulgaris
Facial acne vulgaris is a common skin disease among teenagers and adolescents that may negatively affect self-esteem, perceived facial attractiveness, and social participation.1 Treatments for acne often are multimodal and require the utmost adherence. For these reasons, acne treatments have been challenging to clinicians and patients alike, as patient compliance in maintaining the use of prescribed topical and oral medications remains essential to attain improvement in quality of life (QOL).
Salicylic acid is a popular medicament for acne treatment that frequently is used as monotherapy or as an adjuvant for other acne treatments, especially in patients with oily skin.2 Salicylic acid has a keratolytic effect, causing corneocyte discohesion in clogged pores or congested follicles,2 and it is effective in treating both inflammatory and noninflammatory acne.3,4
Light therapy, particularly with visible light, has been demonstrated to improve acne outcomes.5 Pneumatic broadband light (PBBL) is a therapeutic light treatment in the broadband range (400–1200 nm) that is combined with vacuum suction, which creates a mechanical lysis of thin-walled pustules and dislodges pore impaction. Additionally, the blue light portion of the PBBL spectrum targets endogenous porphyrins in Propionibacterium acnes, resulting in bacterial destruction.6-8
The purpose of this study was to compare the efficacy, tolerability, and safety of salicylic acid 30% peel versus PBBL in the treatment of mild to moderately severe facial acne vulgaris.
METHODS
Study Design
This single-blind, randomized, split-face pilot study was approved by the institutional review board of the University of Pennsylvania (Philadelphia, Pennsylvania). All patients provided informed consent before entering the study. The single-blind evaluation was performed by one dermatologist (C.T.) who examined the participants on every visit prior to PBBL treatment.
Before the study started, participants were randomized for which side of the face was to be treated with PBBL using a number assigned to each participant. Participants received both treatments—salicylic acid 30% peel on one side of the face and PBBL treatment on the other side of the face—once weekly for a total of 6 treatments. They were then asked to return for 2 follow-up evaluations at weeks 3 and 6 following the last treatment session and were instructed not to use any topical or oral acne medications during these follow-up periods.
Inclusion and Exclusion Criteria
Patients aged 18 years and older of any race and sex with noninflammatory papules, some inflammatory papules, and no more than 1 nodule (considered as mild to moderately severe facial acne) were included in the study. Participants had not been on any topical acne medications for at least 1 month and/or oral retinoids for at least 1 year prior to the study period. All women completed urine pregnancy tests prior to the study and were advised to utilize birth control during the study period.
Study Treatments
Salicylic Acid 30% Peel
The participant’s face was cleansed thoroughly before application of salicylic acid 30% (1.5 g/2.5 mL) to half of the face and left on for 5 minutes before being carefully rinsed off by spraying with spring water. Prior to initiating PBBL therapy, the peeled side of the participant’s face was covered with a towel.
Pneumatic Broadband Light
On the other side of the face, PBBL was performed to deliver broadband light within the spectrum range of 400 to 1200 nm at a setting approximately equivalent to a fluence of 4 to 6 J/cm2 and a vacuum setting approximately equivalent to a negative pressure of 3 lb/in2. The power setting was increased on each subsequent visit depending on each participant’s tolerability.
Participants were required to apply a moisturizer and sunscreen to the face and avoid excessive sun exposure between study visits.
Efficacy Evaluation
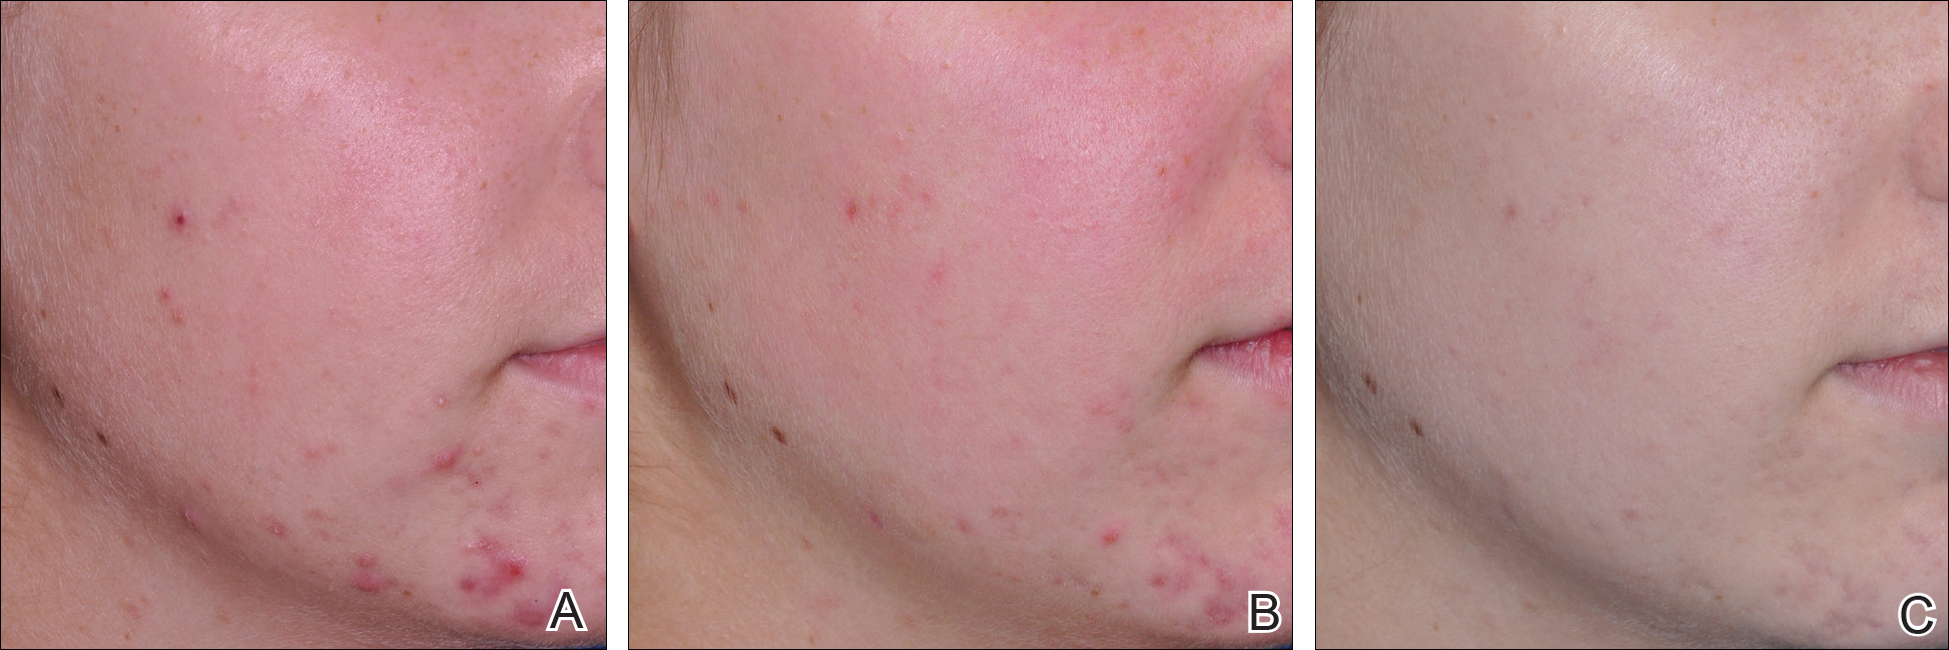
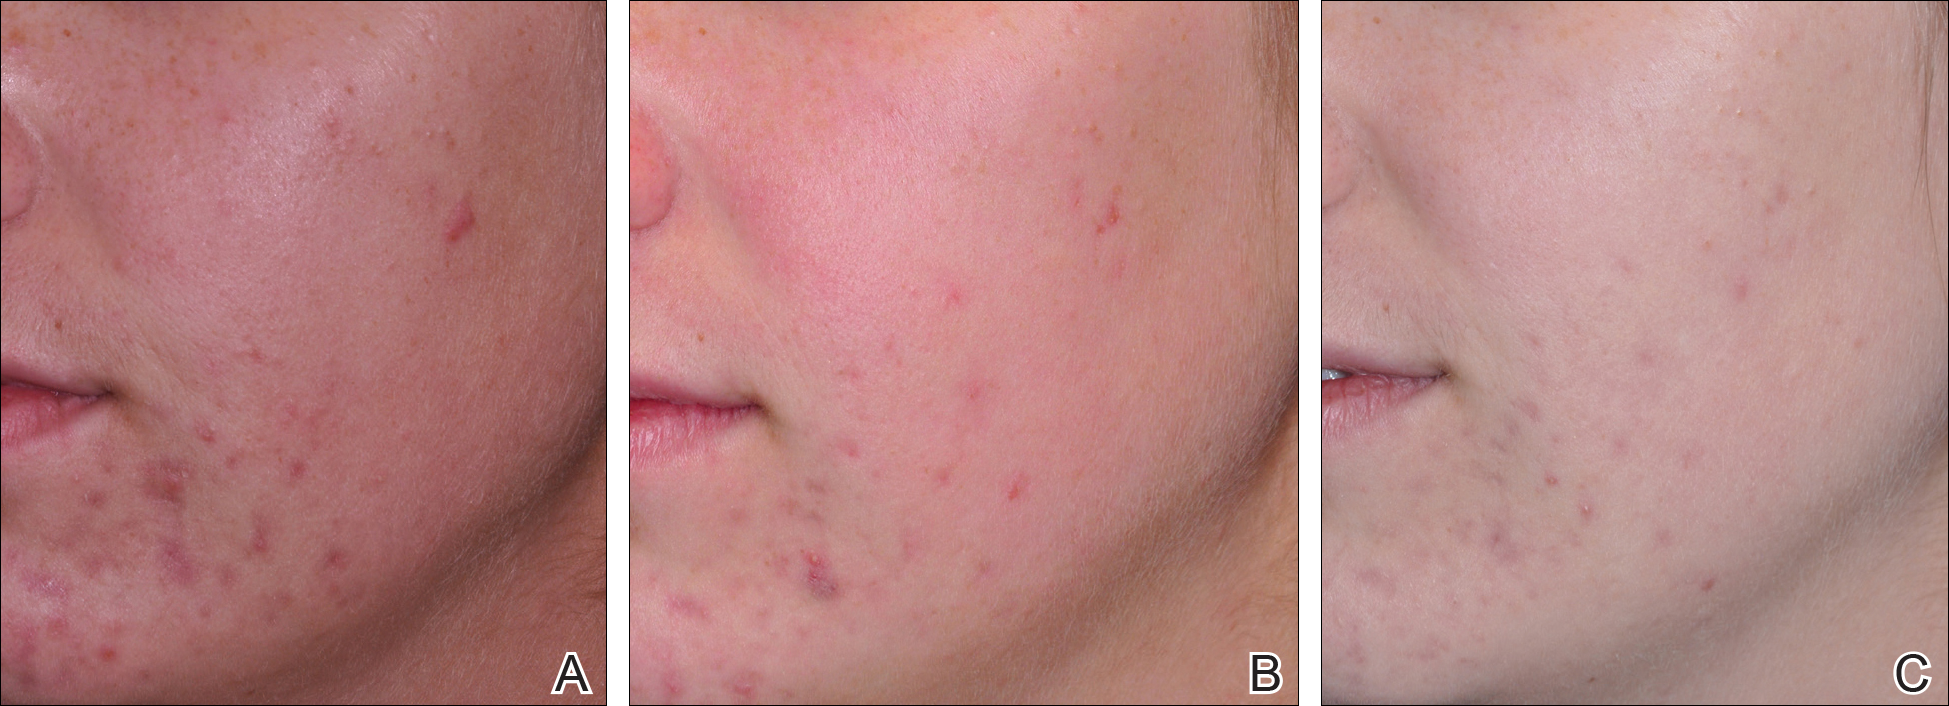
A comparison of the efficacy of the treatments was determined by clinical evaluation and examining the results of the outcome measurements with the modified Global Acne Grading Score (mGAGS) and Acne QOL Scale during each treatment visit. Facial photographs were taken at each visit.
Modified Global Acne Grading Score
The mGAGS is a modification of the Global Acne Grading Scale (GAGS) that has been used to evaluate acne severity in many studies.9-11 The GAGS considers 6 locations on the face with a grading factor for each location. The local score is obtained by multiplying the factor rated by location with the factor of clinical assessment: local score = factor rated by location × factor rated by clinical assessment. The total score is the sum of the individual local scores (Table 1).

Although the original GAGS incorporated the type and location of the lesions in its calculation, we felt that the number of lesions also was important to add to our grading score. Therefore, we modified the GAGS by adding a factor rated by the number of lesions to improve the accuracy of the test. Accordingly, the local mGAGS scores were calculated by multiplying the location factor by the lesion type and number of lesions factors: local score = location factor × lesion type factor × number of lesions factor.
Acne QOL Questionnaire
Acne QOL was assessed during each visit to demonstrate if the treatment results affected participants’ socialization due to appearance.12 Participants were asked to complete the questionnaire, which consisted of 9 questions with 4 rating answers (0=not affected; 1=mildly affected; 2=moderately affected; 3=markedly affected). A total score of 9 or higher (high score) indicated that acne had a substantial negative impact on the participant, while a total score below 9 (low score) meant acne scarcely impacted social aspects and daily activities of the patient.
Safety Evaluation
The safety of the treatments was evaluated by clinical inspection and by comparing the results of the Wong-Baker FACES Pain Rating Scale (WBPRS)13 after treatment. The WBPRS is used worldwide among researchers to assess pain, particularly in children.14,15 It is composed of 6 faces expressing pain with word descriptions with a corresponding number range reflecting pain severity from 0 to 5 (0=no hurt; 1=hurts little bit; 2=hurts little more; 3=hurts even more; 4=hurts whole lot; 5=hurts worst).13
Statistical Analysis
All variables were presented as the median (range). A Wilcoxon signed rank test was used to compare clinical responses between the salicylic acid 30% peel and PBBL therapies. SPSS software version 12.0 was used for all statistical analysis. A 2-tailed P value of ≤.05 was considered statistically significant.
RESULTS
Study Population
Twelve participants (2 males, 10 females) aged 17 to 36 years (median age, 22 years; mean age [SD], 23.33 [1.65] years) with both comedonal and inflammatory acne were enrolled into this study for 6 split-face treatments of salicylic acid 30% peel and PBBL at 1-week intervals for 6 weeks, with 2 subsequent follow-up sessions at weeks 3 and 6 posttreatment. Of the 12 participants, 11 were white and 1 was Asian American, with Fitzpatrick skin types II to IV. Nine participants (75%) completed the study. One participant dropped out of the study after the fourth treatment due to a scheduling conflict, and the other 2 participants did not return for follow-up. No participants withdrew from the study because of adverse therapeutic events.
Efficacy Evaluation
Comparisons between the salicylic acid 30% peel and PBBL procedures for mGAGS at each visit are shown in Table 2. There was no significant difference in treatment efficacy between the salicylic acid 30% peel and PBBL therapies during the study’s treatment and follow-up events; however, both procedures contributed to a major improvement in acne symptoms by the third treatment session and through to the last follow-up session (P≤.05). Clinical photographs at baseline, at last treatment visit (week 6), and at last follow-up (week 12) are shown in Figures 1 and 2.
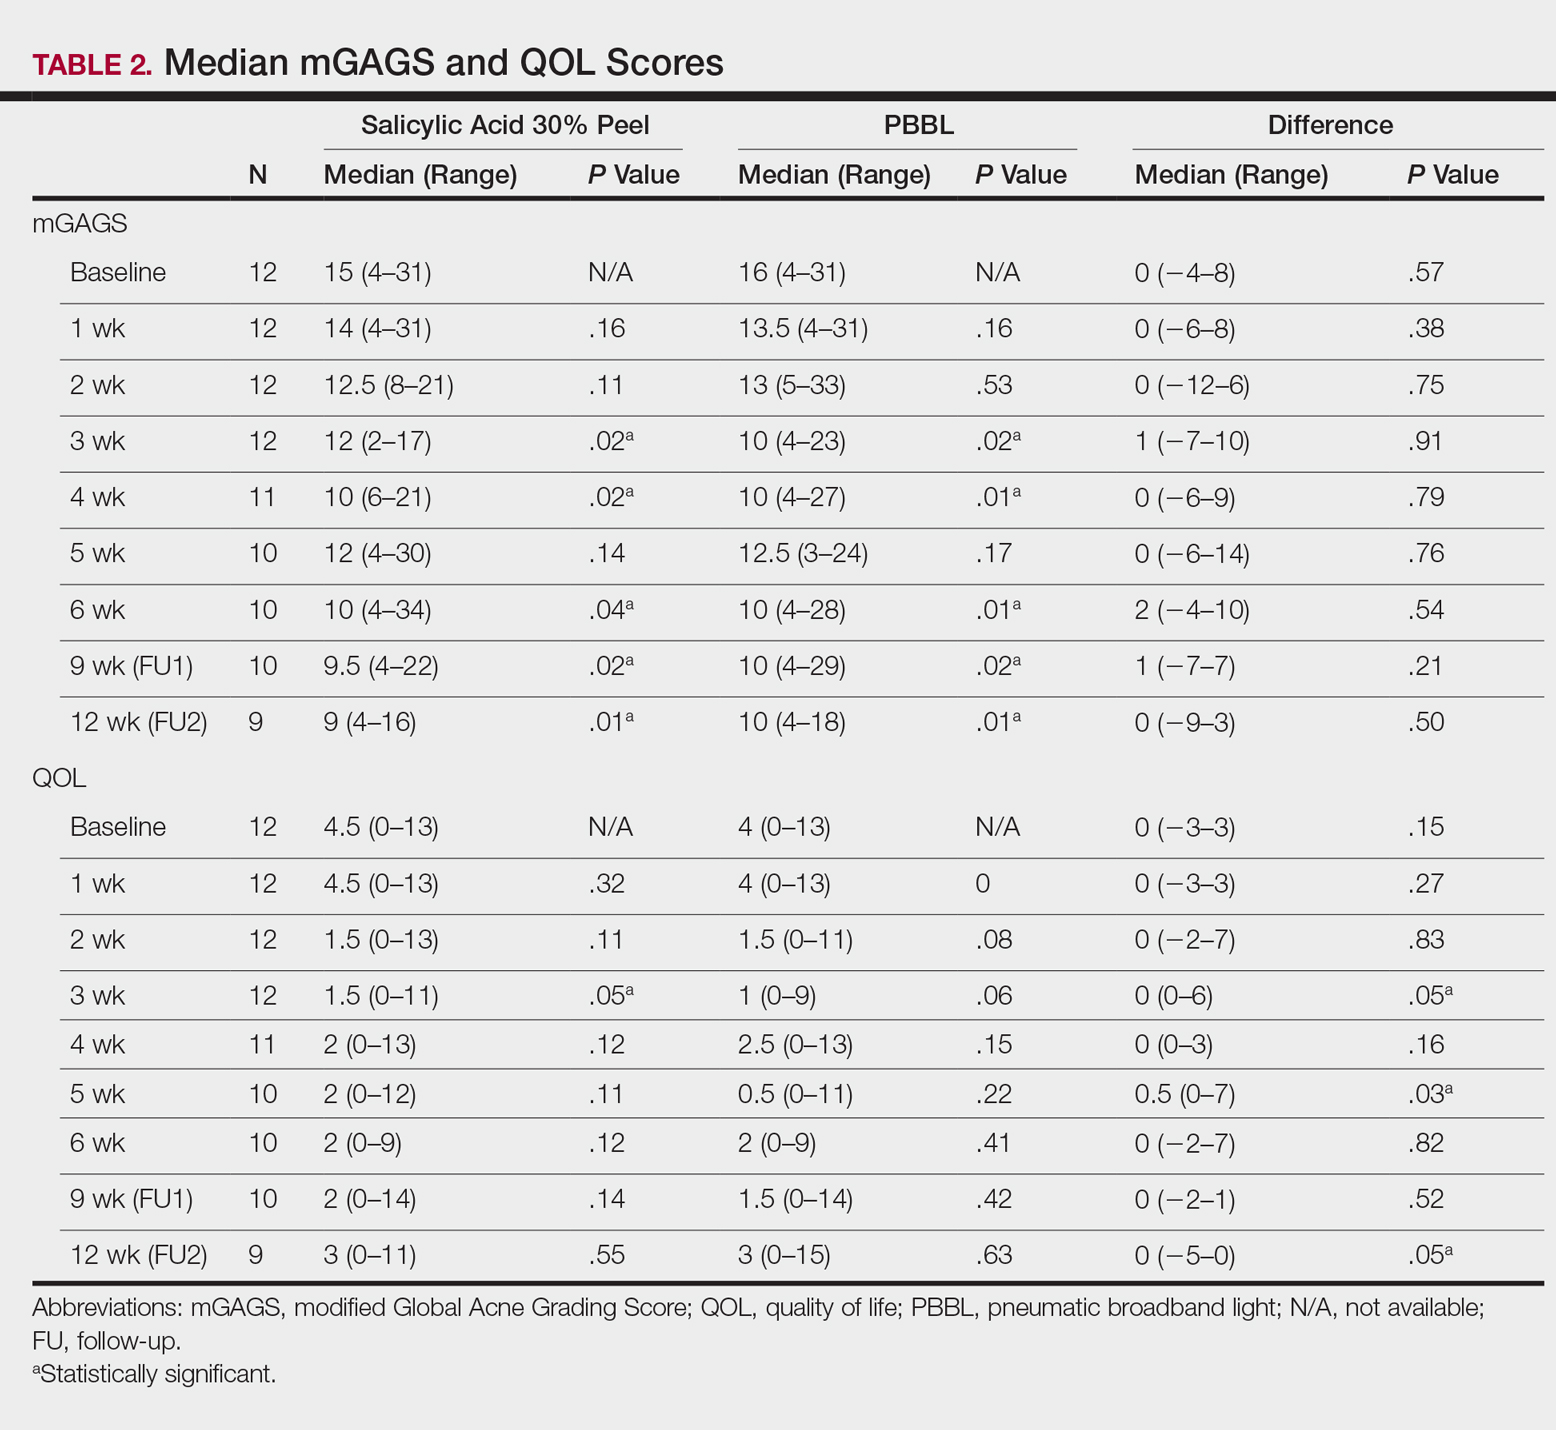
The results of the acne QOL questionnaire are shown in Table 2. Lower scores reflect a higher QOL. Median QOL scores at each visit ranged from 0.5 to 4.5. There was no significant difference found between the peel agent or PBBL based on the baseline QOL and subsequent visit assessments; however, the differences between the 2 treatments were significant at weeks 3 (P=.05) and 5 (P=.03) of treatment as well as at the last follow-up visit (P=.05).
According to the QOL scores, by the third treatment session participants were more satisfied with their improved acne condition from the PBBL procedure than the salicylic acid 30% peel as demonstrated by a positive range of the QOL assessments between PBBL and salicylic acid 30% peel (as shown in the difference in QOL in Table 2: week 3, 0–6; week 4, 0–3; week 5, 0–7). On the other hand, participants saw more improvement from the salicylic acid 30% peel than from PBBL by the last follow-up evaluation, as the differences in QOL scores between the 2 treatments resulted in a negative range (−5–0).
Safety
Pain assessment by the WBPRS at every visit showed a low pain rating associated with both salicylic acid 30% peel (range, 0–0.5) and PBBL (range, 1.0–1.5) treatments. The median pain score of the salicylic acid 30% peel appeared higher compared to the PBBL treatment, yet a significant difference between both treatments was seen only at weeks 1, 3, and 6 of treatment (P≤.05).
There were no unexpected therapeutic reactions reported in our study, and no participants withdrew from the study due to adverse events. Most participants experienced only mild adverse reactions, including redness, stinging, and a burning sensation on the salicylic acid 30% peel side, which were transient and disappeared in minutes; only redness occurred on the PBBL-treated side.
Comment
Facial acne treatment is challenging, as prolonged and/or severe acne contributes to scarring, declining self-confidence, and undesirable financial consequences. Even though salicylic acid peel is a commonly used acne treatment choice, the PBBL methodology was approved by the US Food and Drug Administration6 and has become an alternative procedure for acne treatment.
The pharmacological effects of salicylic acid are related to its corneocyte desquamation and exfoliative actions, thereby reducing corneocyte cohesion and unclogging follicular pores.16 Salicylic acid has been demonstrated to ameliorate inflammatory acne by its effects on the arachidonic acid cascade.2,4,17 In our study, salicylic acid 30% peel met participants’ satisfaction in acne improvement similar to a study showing a 50% improvement in acne scores after just 2 treatments.18 Our data support and corroborate that salicylic acid 30% peel renders an improvement in acne sequelae reported in several other studies.2,17,18
Pneumatic broadband light has been known to treat acne by the mechanism of pneumatic suction combined with photodynamic therapy using broadband-pulsed light (400–1200 nm).6-8 By applying the pneumatic device, a vacuum is created on the skin to remove sebum contents from follicles, whereas broadband light is emitted simultaneously to destroy bacteria and decrease the inflammatory process.7 During the vacuum process, the skin is stretched to reduce pain and avoid competitive chromophores (eg, hemoglobin), while the broadband light is administered.7 Broadband light encompasses 2 main light spectrums: blue light (415 nm) activates coproporphyrin III, which induces reactive free radicals and singlet oxygen species and has been reported to be the cause of bacterial cell death,19 and red light (633 nm), which renders an increase of fibroblast growth factors to work against the inflammatory processes.20 There are numerous studies showing a reduction of acne lesions after photopneumatic therapy with minimal side effects.6-8
In our study, we compared the efficacy of salicylic acid 30% peel with PBBL in the treatment of acne. Both treatments showed significant reduction of mGAGS compared to baseline starting from week 3 and lasting until week 12. Remarkably, although there were some participants who reported acne recurrence after completing all treatments at week 6, which could have happened when the treatments were ended, the final acne score at week 12 was still significantly lower than baseline. It is clear that the participants continued their acne improvement up to the 6-week follow-up period without any topical or oral medication. We do not propose that either salicylic acid peel or PBBL treatment is a solitary option but speculate that the combination of both treatments may initiate a faster resolution in the disappearance of acne.
Although there was no statistically significant difference in efficacy between salicylic acid 30% peel and PBBL procedures at each visit, QOL assessments related to treatment satisfaction did yield significant differences between baseline and the end of treatment. We noticed that participants had more positive attitudes toward the PBBL side at week 3 and week 5 but only mild satisfaction at week 4, as the differences in QOL scores between both treatments showed positive ranging values. This finding is most likely related to the immediate reduction of acne pustules by the PBBL vacuum lysis of these lesions. The differences in the QOL scores between both treatments at week 12 (the last follow-up evaluation) provided opposite findings, which meant patients had nearly even improvement in both PBBL method and salicylic acid 30% peel. Therefore, according to QOL data, acne disappeared quickly with the application of PBBL therapy but reappeared on the PBBL-treated side by the follow-up evaluations, though the acne score between both sides showed no statistically significant difference.
We reason that the PBBL therapy works better than salicylic acid 30% peel because the pneumatic system may help to unclog the pores through mechanical debridement via suctioning versus desquamation from salicylic acid 30% peel. Nonetheless, salicylic acid 30% peel sustained improvement when compared to PBBL through the follow-up periods. Both salicylic acid 30% peel and PBBL treatments are well tolerated and may initiate a faster resolution in the improvement of acne when incorporated with a medical program.
Because of the recurrence of acne after treatments were stopped, additional medical therapies are advised to be used along with this study’s clinical treatments to help mitigate the acne symptoms. These treatments should be considered in patients concerned about antibiotic resistance or those who cannot take oral antibiotics or retinoids. Salicylic acid peel is more accessible and affordable than PBBL, whereas PBBL is slightly more tolerable and less irritating than salicylic acid peel. Nevertheless, the cost of investment in PBBL is quite high—as much as $70,000—and does not include disposable, single-use tips, which cost $30 each. The machine is easy to set up, weighs about 40 lb, and requires little space to store. The average cost per visit of PBBL treatment in office is $150.00 and $75.00 for salicylic acid peel (unpublished data, Hospital of the University of Pennsylvania, 2010). Most patients may select salicylic acid peel over PBBL due to the cost and convenience of the treatment. Neither procedure should be considered as a solitary treatment option but rather as adjunctive procedures combined with oral and/or topical acne medications. After this study’s treatments were stopped and without other medications to maintain treatment effectiveness, the lesions reappeared, trending back toward baseline.
Conclusion
Both salicylic acid 30% peel and PBBL procedures are effective, safe, and well tolerated in treating acne. Although there was no significant difference in the efficacy between both treatments in this study, the small sample size and short follow-up intervals warrant further studies to support the observed outstanding outcomes and should be considered in combination with other medical treatment options. These procedures may be beneficial in holding the patient compliant until their medical therapies have an opportunity to work.
Acknowledgment
The authors would like to thank Joyce Okawa, RN (Philadelphia, Pennsylvania), for her assistance in the submission to the institutional review board of the University of Pennsylvania.
- Rapp DA, Brenes GA, Feldman SR, et al. Anger and acne: implications for quality of life, patient satisfaction and clinical care. Br J Dermatol. 2004;151:183-189.
- Zakopoulou N, Kontochristopoulos G. Superficial chemical peels. J Cosmet Dermatol. 2006;5:246-253.
- Berson DS, Cohen JL, Rendon MI, et al. Clinical role and application of superficial chemical peels in today’s practice. J Drugs Dermatol. 2009;8:803-811.
- Shalita AR. Treatment of mild and moderate acne vulgaris with salicylic acid in an alcohol-detergent vehicle. Cutis. 1981;28:556-558, 561.
- Sakamoto FH, Lopes JD, Anderson RR. Photodynamic therapy for acne vulgaris: a critical review from basics to clinical practice: part I. acne vulgaris: when and why consider photodynamic therapy? J Am Acad Dermatol. 2010;63:183-193; quiz 93-94.
- Gold MH, Biron J. Efficacy of a novel combination of pneumatic energy and broadband light for the treatment of acne. J Drugs Dermatol. 2008;7:639-642.
- Shamban AT, Enokibori M, Narurkar V, et al. Photopneumatic technology for the treatment of acne vulgaris. J Drugs Dermatol. 2008;7:139-145.
- Wanitphakdeedecha R, Tanzi EL, Alster TS. Photopneumatic therapy for the treatment of acne. J Drugs Dermatol. 2009;8:239-241.
- Doshi A, Zaheer A, Stiller MJ. A comparison of current acne grading systems and proposal of a novel system. Int J Dermatol. 1997;36:416-418.
- Weiss JW, Shavin J, Davis M. Preliminary results of a nonrandomized, multicenter, open-label study of patient satisfaction after treatment with combination benzoyl peroxide/clindamycin topical gel for mild to moderate acne. Clin Ther. 2002;24:1706-1717.
- Demircay Z, Kus S, Sur H. Predictive factors for acne flare during isotretinoin treatment. Eur J Dermatol. 2008;18:452-456.
- Gupta MA, Johnson AM, Gupta AK. The development of an Acne Quality of Life scale: reliability, validity, and relation to subjective acne severity in mild to moderate acne vulgaris. Acta Derm Venereol. 1998;78:451-456.
- Wong DL, Baker CM. Pain in children: comparison of assessment scales. Pediatr Nurs. 1988;14:9-17.
- Wong DL, Hockenberry-Eaton M, Wilson D, et al. Wong’s Essentials of Pediatric Nursing. 6th ed. St. Louis, MO: Mosby; 2001:1301.
- Zempsky WT, Robbins B, McKay K. Reduction of topical anesthetic onset time using ultrasound: a randomized controlled trial prior to venipuncture in young children. Pain Med. 2008;9:795-802.
- Imayama S, Ueda S, Isoda M. Histologic changes in the skin of hairless mice following peeling with salicylic acid. Arch Dermatol. 2000;136:1390-1395.
- Lee H, Kim I. Salicylic acid peels for the treatment of acne vulgaris in Asian patients. Dermatol Surg. 2003;29:1196-1199.
- Kessler E, Flanagan K, Chia C, et al. Comparison of alpha- and beta-hydroxy acid chemical peels in the treatment of mild to moderately severe facial acne vulgaris. Dermatol Surg. 2008;34:45-50.
- Omi T, Munavalli GS, Kawana S, et al. Ultrastructural evidencefor thermal injury to pilosebaceous units during the treatment of acne using photopneumatic (PPX) therapy. J Cosmet Laser Ther. 2008;10:7-11.
- Papageorgiou P, Katsambas A, Chu A. Phototherapy with blue (415 nm) and red (660 nm) light in the treatment of acne vulgaris. Br J Dermatol. 2000;142:973-978.
Facial acne vulgaris is a common skin disease among teenagers and adolescents that may negatively affect self-esteem, perceived facial attractiveness, and social participation.1 Treatments for acne often are multimodal and require the utmost adherence. For these reasons, acne treatments have been challenging to clinicians and patients alike, as patient compliance in maintaining the use of prescribed topical and oral medications remains essential to attain improvement in quality of life (QOL).
Salicylic acid is a popular medicament for acne treatment that frequently is used as monotherapy or as an adjuvant for other acne treatments, especially in patients with oily skin.2 Salicylic acid has a keratolytic effect, causing corneocyte discohesion in clogged pores or congested follicles,2 and it is effective in treating both inflammatory and noninflammatory acne.3,4
Light therapy, particularly with visible light, has been demonstrated to improve acne outcomes.5 Pneumatic broadband light (PBBL) is a therapeutic light treatment in the broadband range (400–1200 nm) that is combined with vacuum suction, which creates a mechanical lysis of thin-walled pustules and dislodges pore impaction. Additionally, the blue light portion of the PBBL spectrum targets endogenous porphyrins in Propionibacterium acnes, resulting in bacterial destruction.6-8
The purpose of this study was to compare the efficacy, tolerability, and safety of salicylic acid 30% peel versus PBBL in the treatment of mild to moderately severe facial acne vulgaris.
METHODS
Study Design
This single-blind, randomized, split-face pilot study was approved by the institutional review board of the University of Pennsylvania (Philadelphia, Pennsylvania). All patients provided informed consent before entering the study. The single-blind evaluation was performed by one dermatologist (C.T.) who examined the participants on every visit prior to PBBL treatment.
Before the study started, participants were randomized for which side of the face was to be treated with PBBL using a number assigned to each participant. Participants received both treatments—salicylic acid 30% peel on one side of the face and PBBL treatment on the other side of the face—once weekly for a total of 6 treatments. They were then asked to return for 2 follow-up evaluations at weeks 3 and 6 following the last treatment session and were instructed not to use any topical or oral acne medications during these follow-up periods.
Inclusion and Exclusion Criteria
Patients aged 18 years and older of any race and sex with noninflammatory papules, some inflammatory papules, and no more than 1 nodule (considered as mild to moderately severe facial acne) were included in the study. Participants had not been on any topical acne medications for at least 1 month and/or oral retinoids for at least 1 year prior to the study period. All women completed urine pregnancy tests prior to the study and were advised to utilize birth control during the study period.
Study Treatments
Salicylic Acid 30% Peel
The participant’s face was cleansed thoroughly before application of salicylic acid 30% (1.5 g/2.5 mL) to half of the face and left on for 5 minutes before being carefully rinsed off by spraying with spring water. Prior to initiating PBBL therapy, the peeled side of the participant’s face was covered with a towel.
Pneumatic Broadband Light
On the other side of the face, PBBL was performed to deliver broadband light within the spectrum range of 400 to 1200 nm at a setting approximately equivalent to a fluence of 4 to 6 J/cm2 and a vacuum setting approximately equivalent to a negative pressure of 3 lb/in2. The power setting was increased on each subsequent visit depending on each participant’s tolerability.
Participants were required to apply a moisturizer and sunscreen to the face and avoid excessive sun exposure between study visits.
Efficacy Evaluation
A comparison of the efficacy of the treatments was determined by clinical evaluation and examining the results of the outcome measurements with the modified Global Acne Grading Score (mGAGS) and Acne QOL Scale during each treatment visit. Facial photographs were taken at each visit.
Modified Global Acne Grading Score
The mGAGS is a modification of the Global Acne Grading Scale (GAGS) that has been used to evaluate acne severity in many studies.9-11 The GAGS considers 6 locations on the face with a grading factor for each location. The local score is obtained by multiplying the factor rated by location with the factor of clinical assessment: local score = factor rated by location × factor rated by clinical assessment. The total score is the sum of the individual local scores (Table 1).
Although the original GAGS incorporated the type and location of the lesions in its calculation, we felt that the number of lesions also was important to add to our grading score. Therefore, we modified the GAGS by adding a factor rated by the number of lesions to improve the accuracy of the test. Accordingly, the local mGAGS scores were calculated by multiplying the location factor by the lesion type and number of lesions factors: local score = location factor × lesion type factor × number of lesions factor.
Acne QOL Questionnaire
Acne QOL was assessed during each visit to demonstrate if the treatment results affected participants’ socialization due to appearance.12 Participants were asked to complete the questionnaire, which consisted of 9 questions with 4 rating answers (0=not affected; 1=mildly affected; 2=moderately affected; 3=markedly affected). A total score of 9 or higher (high score) indicated that acne had a substantial negative impact on the participant, while a total score below 9 (low score) meant acne scarcely impacted social aspects and daily activities of the patient.
Safety Evaluation
The safety of the treatments was evaluated by clinical inspection and by comparing the results of the Wong-Baker FACES Pain Rating Scale (WBPRS)13 after treatment. The WBPRS is used worldwide among researchers to assess pain, particularly in children.14,15 It is composed of 6 faces expressing pain with word descriptions with a corresponding number range reflecting pain severity from 0 to 5 (0=no hurt; 1=hurts little bit; 2=hurts little more; 3=hurts even more; 4=hurts whole lot; 5=hurts worst).13
Statistical Analysis
All variables were presented as the median (range). A Wilcoxon signed rank test was used to compare clinical responses between the salicylic acid 30% peel and PBBL therapies. SPSS software version 12.0 was used for all statistical analysis. A 2-tailed P value of ≤.05 was considered statistically significant.
RESULTS
Study Population
Twelve participants (2 males, 10 females) aged 17 to 36 years (median age, 22 years; mean age [SD], 23.33 [1.65] years) with both comedonal and inflammatory acne were enrolled into this study for 6 split-face treatments of salicylic acid 30% peel and PBBL at 1-week intervals for 6 weeks, with 2 subsequent follow-up sessions at weeks 3 and 6 posttreatment. Of the 12 participants, 11 were white and 1 was Asian American, with Fitzpatrick skin types II to IV. Nine participants (75%) completed the study. One participant dropped out of the study after the fourth treatment due to a scheduling conflict, and the other 2 participants did not return for follow-up. No participants withdrew from the study because of adverse therapeutic events.
Efficacy Evaluation
Comparisons between the salicylic acid 30% peel and PBBL procedures for mGAGS at each visit are shown in Table 2. There was no significant difference in treatment efficacy between the salicylic acid 30% peel and PBBL therapies during the study’s treatment and follow-up events; however, both procedures contributed to a major improvement in acne symptoms by the third treatment session and through to the last follow-up session (P≤.05). Clinical photographs at baseline, at last treatment visit (week 6), and at last follow-up (week 12) are shown in Figures 1 and 2.
The results of the acne QOL questionnaire are shown in Table 2. Lower scores reflect a higher QOL. Median QOL scores at each visit ranged from 0.5 to 4.5. There was no significant difference found between the peel agent or PBBL based on the baseline QOL and subsequent visit assessments; however, the differences between the 2 treatments were significant at weeks 3 (P=.05) and 5 (P=.03) of treatment as well as at the last follow-up visit (P=.05).
According to the QOL scores, by the third treatment session participants were more satisfied with their improved acne condition from the PBBL procedure than the salicylic acid 30% peel as demonstrated by a positive range of the QOL assessments between PBBL and salicylic acid 30% peel (as shown in the difference in QOL in Table 2: week 3, 0–6; week 4, 0–3; week 5, 0–7). On the other hand, participants saw more improvement from the salicylic acid 30% peel than from PBBL by the last follow-up evaluation, as the differences in QOL scores between the 2 treatments resulted in a negative range (−5–0).
Safety
Pain assessment by the WBPRS at every visit showed a low pain rating associated with both salicylic acid 30% peel (range, 0–0.5) and PBBL (range, 1.0–1.5) treatments. The median pain score of the salicylic acid 30% peel appeared higher compared to the PBBL treatment, yet a significant difference between both treatments was seen only at weeks 1, 3, and 6 of treatment (P≤.05).
There were no unexpected therapeutic reactions reported in our study, and no participants withdrew from the study due to adverse events. Most participants experienced only mild adverse reactions, including redness, stinging, and a burning sensation on the salicylic acid 30% peel side, which were transient and disappeared in minutes; only redness occurred on the PBBL-treated side.
Comment
Facial acne treatment is challenging, as prolonged and/or severe acne contributes to scarring, declining self-confidence, and undesirable financial consequences. Even though salicylic acid peel is a commonly used acne treatment choice, the PBBL methodology was approved by the US Food and Drug Administration6 and has become an alternative procedure for acne treatment.
The pharmacological effects of salicylic acid are related to its corneocyte desquamation and exfoliative actions, thereby reducing corneocyte cohesion and unclogging follicular pores.16 Salicylic acid has been demonstrated to ameliorate inflammatory acne by its effects on the arachidonic acid cascade.2,4,17 In our study, salicylic acid 30% peel met participants’ satisfaction in acne improvement similar to a study showing a 50% improvement in acne scores after just 2 treatments.18 Our data support and corroborate that salicylic acid 30% peel renders an improvement in acne sequelae reported in several other studies.2,17,18
Pneumatic broadband light has been known to treat acne by the mechanism of pneumatic suction combined with photodynamic therapy using broadband-pulsed light (400–1200 nm).6-8 By applying the pneumatic device, a vacuum is created on the skin to remove sebum contents from follicles, whereas broadband light is emitted simultaneously to destroy bacteria and decrease the inflammatory process.7 During the vacuum process, the skin is stretched to reduce pain and avoid competitive chromophores (eg, hemoglobin), while the broadband light is administered.7 Broadband light encompasses 2 main light spectrums: blue light (415 nm) activates coproporphyrin III, which induces reactive free radicals and singlet oxygen species and has been reported to be the cause of bacterial cell death,19 and red light (633 nm), which renders an increase of fibroblast growth factors to work against the inflammatory processes.20 There are numerous studies showing a reduction of acne lesions after photopneumatic therapy with minimal side effects.6-8
In our study, we compared the efficacy of salicylic acid 30% peel with PBBL in the treatment of acne. Both treatments showed significant reduction of mGAGS compared to baseline starting from week 3 and lasting until week 12. Remarkably, although there were some participants who reported acne recurrence after completing all treatments at week 6, which could have happened when the treatments were ended, the final acne score at week 12 was still significantly lower than baseline. It is clear that the participants continued their acne improvement up to the 6-week follow-up period without any topical or oral medication. We do not propose that either salicylic acid peel or PBBL treatment is a solitary option but speculate that the combination of both treatments may initiate a faster resolution in the disappearance of acne.
Although there was no statistically significant difference in efficacy between salicylic acid 30% peel and PBBL procedures at each visit, QOL assessments related to treatment satisfaction did yield significant differences between baseline and the end of treatment. We noticed that participants had more positive attitudes toward the PBBL side at week 3 and week 5 but only mild satisfaction at week 4, as the differences in QOL scores between both treatments showed positive ranging values. This finding is most likely related to the immediate reduction of acne pustules by the PBBL vacuum lysis of these lesions. The differences in the QOL scores between both treatments at week 12 (the last follow-up evaluation) provided opposite findings, which meant patients had nearly even improvement in both PBBL method and salicylic acid 30% peel. Therefore, according to QOL data, acne disappeared quickly with the application of PBBL therapy but reappeared on the PBBL-treated side by the follow-up evaluations, though the acne score between both sides showed no statistically significant difference.
We reason that the PBBL therapy works better than salicylic acid 30% peel because the pneumatic system may help to unclog the pores through mechanical debridement via suctioning versus desquamation from salicylic acid 30% peel. Nonetheless, salicylic acid 30% peel sustained improvement when compared to PBBL through the follow-up periods. Both salicylic acid 30% peel and PBBL treatments are well tolerated and may initiate a faster resolution in the improvement of acne when incorporated with a medical program.
Because of the recurrence of acne after treatments were stopped, additional medical therapies are advised to be used along with this study’s clinical treatments to help mitigate the acne symptoms. These treatments should be considered in patients concerned about antibiotic resistance or those who cannot take oral antibiotics or retinoids. Salicylic acid peel is more accessible and affordable than PBBL, whereas PBBL is slightly more tolerable and less irritating than salicylic acid peel. Nevertheless, the cost of investment in PBBL is quite high—as much as $70,000—and does not include disposable, single-use tips, which cost $30 each. The machine is easy to set up, weighs about 40 lb, and requires little space to store. The average cost per visit of PBBL treatment in office is $150.00 and $75.00 for salicylic acid peel (unpublished data, Hospital of the University of Pennsylvania, 2010). Most patients may select salicylic acid peel over PBBL due to the cost and convenience of the treatment. Neither procedure should be considered as a solitary treatment option but rather as adjunctive procedures combined with oral and/or topical acne medications. After this study’s treatments were stopped and without other medications to maintain treatment effectiveness, the lesions reappeared, trending back toward baseline.
Conclusion
Both salicylic acid 30% peel and PBBL procedures are effective, safe, and well tolerated in treating acne. Although there was no significant difference in the efficacy between both treatments in this study, the small sample size and short follow-up intervals warrant further studies to support the observed outstanding outcomes and should be considered in combination with other medical treatment options. These procedures may be beneficial in holding the patient compliant until their medical therapies have an opportunity to work.
Acknowledgment
The authors would like to thank Joyce Okawa, RN (Philadelphia, Pennsylvania), for her assistance in the submission to the institutional review board of the University of Pennsylvania.
- Rapp DA, Brenes GA, Feldman SR, et al. Anger and acne: implications for quality of life, patient satisfaction and clinical care. Br J Dermatol. 2004;151:183-189.
- Zakopoulou N, Kontochristopoulos G. Superficial chemical peels. J Cosmet Dermatol. 2006;5:246-253.
- Berson DS, Cohen JL, Rendon MI, et al. Clinical role and application of superficial chemical peels in today’s practice. J Drugs Dermatol. 2009;8:803-811.
- Shalita AR. Treatment of mild and moderate acne vulgaris with salicylic acid in an alcohol-detergent vehicle. Cutis. 1981;28:556-558, 561.
- Sakamoto FH, Lopes JD, Anderson RR. Photodynamic therapy for acne vulgaris: a critical review from basics to clinical practice: part I. acne vulgaris: when and why consider photodynamic therapy? J Am Acad Dermatol. 2010;63:183-193; quiz 93-94.
- Gold MH, Biron J. Efficacy of a novel combination of pneumatic energy and broadband light for the treatment of acne. J Drugs Dermatol. 2008;7:639-642.
- Shamban AT, Enokibori M, Narurkar V, et al. Photopneumatic technology for the treatment of acne vulgaris. J Drugs Dermatol. 2008;7:139-145.
- Wanitphakdeedecha R, Tanzi EL, Alster TS. Photopneumatic therapy for the treatment of acne. J Drugs Dermatol. 2009;8:239-241.
- Doshi A, Zaheer A, Stiller MJ. A comparison of current acne grading systems and proposal of a novel system. Int J Dermatol. 1997;36:416-418.
- Weiss JW, Shavin J, Davis M. Preliminary results of a nonrandomized, multicenter, open-label study of patient satisfaction after treatment with combination benzoyl peroxide/clindamycin topical gel for mild to moderate acne. Clin Ther. 2002;24:1706-1717.
- Demircay Z, Kus S, Sur H. Predictive factors for acne flare during isotretinoin treatment. Eur J Dermatol. 2008;18:452-456.
- Gupta MA, Johnson AM, Gupta AK. The development of an Acne Quality of Life scale: reliability, validity, and relation to subjective acne severity in mild to moderate acne vulgaris. Acta Derm Venereol. 1998;78:451-456.
- Wong DL, Baker CM. Pain in children: comparison of assessment scales. Pediatr Nurs. 1988;14:9-17.
- Wong DL, Hockenberry-Eaton M, Wilson D, et al. Wong’s Essentials of Pediatric Nursing. 6th ed. St. Louis, MO: Mosby; 2001:1301.
- Zempsky WT, Robbins B, McKay K. Reduction of topical anesthetic onset time using ultrasound: a randomized controlled trial prior to venipuncture in young children. Pain Med. 2008;9:795-802.
- Imayama S, Ueda S, Isoda M. Histologic changes in the skin of hairless mice following peeling with salicylic acid. Arch Dermatol. 2000;136:1390-1395.
- Lee H, Kim I. Salicylic acid peels for the treatment of acne vulgaris in Asian patients. Dermatol Surg. 2003;29:1196-1199.
- Kessler E, Flanagan K, Chia C, et al. Comparison of alpha- and beta-hydroxy acid chemical peels in the treatment of mild to moderately severe facial acne vulgaris. Dermatol Surg. 2008;34:45-50.
- Omi T, Munavalli GS, Kawana S, et al. Ultrastructural evidencefor thermal injury to pilosebaceous units during the treatment of acne using photopneumatic (PPX) therapy. J Cosmet Laser Ther. 2008;10:7-11.
- Papageorgiou P, Katsambas A, Chu A. Phototherapy with blue (415 nm) and red (660 nm) light in the treatment of acne vulgaris. Br J Dermatol. 2000;142:973-978.
Practice Points
- Salicylic acid peel and pneumatic broadband light (PBBL) are good alternative options in treating acne in addition to regular oral and topical treatments.
- Both salicylic acid peel and PBBL are effective, safe, and tolerable.
U.S. goals for earlier HIV diagnosis and treatment may be out of reach
In 2015, only 66% of U.S. youth who were diagnosed with HIV in a Centers for Disease Control and Prevention program were introduced to proper care within 90 days of diagnosis, falling far short of the 2020 national goal to introduce 85% of HIV-affected youth to proper care within 30 days.
In an analysis of data from a CDC-funded program covering 61 state and local health departments and 123 community-based organizations in the United States, Puerto Rico, and the U.S. Virgin Islands, the CDC looked at HIV tests, new positive diagnoses, and linkage between patient and care within 90 days of diagnosis. Of 2,973 youths who were newly diagnosed with HIV, 1,955 (66%) were connected to care within 90 days, and 1,871 were interviewed for partner services, according to the CDC. Of 1,911 youths who had been previously diagnosed, 1,749 (92%) were not in medical care at the time of CDC testing.![]()
“A health care provider’s testing recommendation is the most important predictor of testing among adolescents at risk for HIV infection,” the researchers said. “Increasing the number of HIV tests among youths at risk for HIV and increasing regular retesting among these youths is essential for reducing HIV infection in this vulnerable population.”
No conflicts of interest were reported by the authors.
Read more in MMWR (2017 Jun 23. doi: 10.15585/mmwr.mm6624a2).
FROM MMWR
Maintenance of Certification: How Physician Self-regulation Can Improve Quality of Care


QI enthusiast to QI leader: John Bulger, DO
Editor’s Note: This SHM series highlights the professional pathways of quality improvement leaders. This month features the story of John Bulger, DO, chief medical officer for Geisinger Health Plan.
As chief medical officer for Geisinger Health Plan, John Bulger, DO, MBA, is intimately acquainted with the daily challenges that intersect with the delivery of safe, quality-driven care in the hospital system.
He’s also very familiar with the intricacies of carving out a professional road map. When Dr. Bulger began practicing as an internist at Geisinger Health System in the late 1990s, there wasn’t a formal hospitalist designation. He created one and became director of the hospital medicine program. Years later, when the opportunity arose to become chief quality officer, Dr. Bulger was a natural fit for the position, having led many improvement-centered committees and projects while running the hospital medicine group.

Early in his QI immersion, Dr. Bulger sought training where available from sources such as ACP and SHM, while familiarizing himself with methodologies such as PDSA and Lean. There are far more QI training opportunities available to hospitalists today than when Dr. Bulger began his journey, but the fundamentals of success come back to finding the right mentors, team building, and implementing projects built around SMART goals.
Getting started, Dr. Bulger suggests to “pick something within your scope, like medical reconciliation for every patient, or ensuring that every patient who leaves the hospital gets an appointment with their primary physician within 7 days. Early on, we were working on issues like pneumonia core measures and providing discharge instructions.”
He cautions those starting out in QI against viewing unintended outcomes or project setbacks as failure. “If your goal is to take a (scenario) from bad to perfect, you’ll end up getting discouraged. Any effort toward making things better is helpful. If it doesn’t work you try something else.”
While Dr. Bulger is fully supportive of the impact that quality improvement projects make at the institutional level, he encourages clinicians and researchers to always keep the Institute for Healthcare Improvement Triple Aim in sight.
“We need better measures and more discussion about what is best for patients,” Dr. Bulger said. “The things we talk about in (health care) – readmission rates, glycemic control – have a minimal impact on people’s health, but the social determinants of health – the patient’s housing and economic situation – play a bigger role than anything else. As we move from provider- to patient-centric communities by fixing the Triple Aim, the experience will be better for both providers and patients.”
Claudia Stahl is content manager for the Society of Hospital Medicine.
Editor’s Note: This SHM series highlights the professional pathways of quality improvement leaders. This month features the story of John Bulger, DO, chief medical officer for Geisinger Health Plan.
As chief medical officer for Geisinger Health Plan, John Bulger, DO, MBA, is intimately acquainted with the daily challenges that intersect with the delivery of safe, quality-driven care in the hospital system.
He’s also very familiar with the intricacies of carving out a professional road map. When Dr. Bulger began practicing as an internist at Geisinger Health System in the late 1990s, there wasn’t a formal hospitalist designation. He created one and became director of the hospital medicine program. Years later, when the opportunity arose to become chief quality officer, Dr. Bulger was a natural fit for the position, having led many improvement-centered committees and projects while running the hospital medicine group.
Early in his QI immersion, Dr. Bulger sought training where available from sources such as ACP and SHM, while familiarizing himself with methodologies such as PDSA and Lean. There are far more QI training opportunities available to hospitalists today than when Dr. Bulger began his journey, but the fundamentals of success come back to finding the right mentors, team building, and implementing projects built around SMART goals.
Getting started, Dr. Bulger suggests to “pick something within your scope, like medical reconciliation for every patient, or ensuring that every patient who leaves the hospital gets an appointment with their primary physician within 7 days. Early on, we were working on issues like pneumonia core measures and providing discharge instructions.”
He cautions those starting out in QI against viewing unintended outcomes or project setbacks as failure. “If your goal is to take a (scenario) from bad to perfect, you’ll end up getting discouraged. Any effort toward making things better is helpful. If it doesn’t work you try something else.”
While Dr. Bulger is fully supportive of the impact that quality improvement projects make at the institutional level, he encourages clinicians and researchers to always keep the Institute for Healthcare Improvement Triple Aim in sight.
“We need better measures and more discussion about what is best for patients,” Dr. Bulger said. “The things we talk about in (health care) – readmission rates, glycemic control – have a minimal impact on people’s health, but the social determinants of health – the patient’s housing and economic situation – play a bigger role than anything else. As we move from provider- to patient-centric communities by fixing the Triple Aim, the experience will be better for both providers and patients.”
Claudia Stahl is content manager for the Society of Hospital Medicine.
Knotless Arthroscopic Reduction and Internal Fixation of a Displaced Anterior Cruciate Ligament Tibial Eminence Avulsion Fracture
Take-Home Points
- Technique provides optimal fixation while simultaneously protecting open growth plates.
- Self tensioning feature insures both optimal ACL tension and fracture reduction.
- No need for future hardware removal.
- 10Cross suture configuration optimizes strength of fixation for highly consistent results.
- Use fluoroscopy to avoid violation of tibial physis.
Generally occurring in the 8- to 14-year-old population, tibial eminence avulsion (TEA) fractures are a common variant of anterior cruciate ligament (ACL) ruptures and represent 2% to 5% of all knee injuries in skeletally immature individuals.1,2 Compared with adults, children likely experience this anomaly more often because of the weakness of their incompletely ossified tibial plateau relative to the strength of their native ACL.3
The open repair techniques that have been described have multiple disadvantages, including open incisions, difficult visualization of the fracture owing to the location of the fat pad, and increased risk for arthrofibrosis. Arthroscopic fixation is considered the treatment of choice for TEA fractures because it allows for direct visualization of injury, accurate reduction of fracture fragments, removal of loose fragments, and easy treatment of associated soft-tissue injuries.4-6Several fixation techniques for ACL-TEA fractures were recently described: arthroscopic reduction and internal fixation (ARIF) with Kirschner wires,7 cannulated screws,4 the Meniscus Arrow device (Bionx Implants),8 pull-out sutures,9,10 bioabsorbable nails,11 Herbert screws,12 TightRope fixation (Arthrex),13 and various other rotator cuff and meniscal repair systems.14,15 These approaches tend to have good outcomes for TEA fractures, but there are risks associated with ACL tensioning and potential tibial growth plate violation or hardware problems. Likewise, there are no studies with large numbers of patients treated with these new techniques, so the optimal method of reduction and fixation is still unknown.
In this article, we describe a new ARIF technique that involves 2 absorbable anchors with adjustable suture-tensioning technology. This technique optimizes reduction and helps surgeons avoid proximal tibial physeal damage, procedure-related morbidity, and additional surgery.
Case Report
History
The patient, an 8-year-old boy, sustained a noncontact twisting injury of the left knee during a cutting maneuver in a flag football game. He experienced immediate pain and subsequent swelling. Clinical examination revealed a moderate effusion with motion limitations secondary to swelling and irritability. The patient’s Lachman test result was 2+. Pivot shift testing was not possible because of guarding. The knee was stable to varus and valgus stress at 0° and 30° of flexion. Limited knee flexion prohibited placement of the patient in the position needed for anterior and posterior drawer testing. His patella was stable on lateral stress testing at 20° of flexion with no apprehension. Neurovascular status was intact throughout the lower extremity.
Anteroposterior and lateral radiographs showed a minimally displaced Meyers-McKeever type II TEA fracture (Figures 1A, 1B). 

After discussing potential treatment options with the parents, Dr. Smith proceeded with arthroscopic surgery for definitive reduction and internal fixation of the patient’s left knee displaced ACL-TEA fracture. The new adjustable suture-tensioning fixation technique was used. The patient’s guardian provided written informed consent for print and electronic publication of this case report.
Examination Under Anesthesia
Examination with the patient under general anesthesia revealed 3+ Lachman, 2+ pivot shift with foot in internal and external rotation, and 1+ anterior drawer with foot in neutral and internal rotation. The knee was stable to varus and valgus stress testing.
Surgical Technique
Proper patient positioning and padding of bony prominences were ensured, and the limb was sterilely prepared and draped. 

Given the young age of the patient, it was imperative to avoid the open proximal tibial growth plate. The surgical plan for stabilization involved use of two 3.0-mm BioComposite Knotless SutureTak anchors (Arthrex). This anchor configuration is based on a No. 2 FiberWire suture shuttled through itself to create a locking splice mechanism that allows for adjustable tensioning. The anchors were placed on each side of the tibial bony avulsion site with two No. 2 FiberWire sutures and were then crossed about the avulsion fracture fragment in an “x-type” configuration to secure the ACL back down to the bony bed.
First, a curette was used to débride fibrous tissue on the underside of the fracture fragment and on the fracture bed. Minimal amounts of cancellous bone were débrided from the tibial fracture bed to optimize fracture reduction by slightly recessing the fracture fragment to ensure optimal ACL tensioning (Figure 5). 

Next, from the accessory superior medial portal, the end of the wire that had been passed through the medial aspect of the bony avulsion was retrieved through the lateral portal. This wire was used to shuttle the repair suture from the laterally positioned SutureTak anchor over and through the medial aspect of the bony fragment out of the accessory superior medial (Figure 7).


Follow-Up
Two weeks after surgery, the patient returned to clinic for suture removal. Four weeks after surgery, radiographs confirmed anatomical reduction of the TEA fracture, and outpatient physical therapy (range-of-motion exercises as tolerated) and isometric quadriceps strengthening were instituted. Twelve weeks after surgery, examination revealed full knee motion, negative Lachman and pivot shift test results, and residual quadriceps muscle atrophy, and radiographs confirmed complete fracture healing with maintenance of a normal proximal tibial growth plate (Figures 10A, 10B).
Discussion
The highlight of this case is the simplicity of an excellent reduction of a displaced ACL-TEA fracture. Minimally invasive absorbable implants did not violate the proximal tibial physis, and the unique adjustable suture-tensioning technology allowed the degree of reduction and ACL tension to be “dialed in.” SutureTak implants have strong No. 2 FiberWire suture for excellent stability with an overall small suture load, and their small size avoids the risk of violating the proximal tibial physis and avoids potential growth disturbances.
Despite the obvious risks it poses to the open proximal tibial physis, surgical reduction of Meyers-McKeever type II and type III fractures is the norm for restoring ACL stability. Screws and suture fixation are the most common and reliable methods of TEA fracture reduction.16,17 In recent systematic reviews, however, Osti and colleagues17 and Gans and colleagues18 noted there is not enough evidence to warrant a “gold standard” in pediatric tibial avulsion cases.
Other fixation methods for TEA fractures must be investigated. Anderson and colleagues19 described the biomechanics of 4 different physeal-sparing avulsion fracture reduction techniques: an ultra-high-molecular-weight polyethylene (UHMWPE) suture-suture button, a suture anchor, a polydioxanone suture-suture button, and screw fixation. Using techniques described by Kocher and colleagues,4 Berg,20 Mah and colleagues,21 Vega and colleagues,22 and Lu and colleagues,23 Anderson and colleagues19 reduced TEA fractures in skeletally immature porcine knees. Compared with suture anchors, UHMWPE suture-suture buttons provided biomechanically superior cyclic and load-to-failure results as well as more consistent fixation.
Screw fixation has shown good results but has disadvantages. Incorrect positioning of a screw can lead to impingement and articular cartilage damage, and screw removal may be needed if discomfort at the fixation site persists.24,25 Likewise, screws generally are an option only for large fracture fragments, as there is an inherent risk of fracturing small TEA fractures, which can be common in skeletally immature patients.
Brunner and colleagues26 recently found that TEA fracture repair with absorbable sutures and distal bone bridge fixation yielded 3-month radiographic and clinical healing rates similar to those obtained with nonabsorbable sutures tied around a screw. However, other authors have reported growth disturbances with use of a similar technique, owing to a disturbance of the open proximal tibial growth plate.9 In that regard, a major advantage of this new knotless suturing technique is that distal fixation is not necessary.
The minimally invasive TEA fraction reduction technique described in this article has 6 advantages: It provides excellent fixation while avoiding proximal tibial growth plate injury; the degree of tensioning is easily controlled during reduction; it uses strong suture instead of metal screws or pins; the reduction construct is low-profile; distal fixation is unnecessary; and implant removal is unnecessary, thus limiting subsequent surgical intervention. With respect to long-term outcomes, however, it is not known how this procedure will compare with other commonly used ARIF methods in physeal-sparing techniques for TEA fracture fixation.
This case report highlights a novel pediatric displaced ACL-TEA fracture reduction technique that allows for adjustable reduction and resultant ACL tensioning with excellent strong suture fixation without violating the proximal tibial physis, which could make it invaluable in the surgical treatment of this injury in skeletally immature patients.
Am J Orthop. 2017;46(4):203-208. Copyright Frontline Medical Communications Inc. 2017. All rights reserved.
1. Eiskjaer S, Larsen ST, Schmidt MB. The significance of hemarthrosis of the knee in children. Arch Orthop Trauma Surg. 1988;107(2):96-98.
2. Luhmann SJ. Acute traumatic knee effusions in children and adolescents. J Pediatr Orthop. 2003;23(2):199-202.
3. Woo SL, Hollis JM, Adams DJ, Lyon RM, Takai S. Tensile properties of the human femur-anterior cruciate ligament-tibia complex. The effects of specimen age and orientation. Am J Sports Med. 1991;19(3):217-225.
4. Kocher MS, Foreman ES, Micheli LJ. Laxity and functional outcome after arthroscopic reduction and internal fixation of displaced tibial spine fractures in children. Arthroscopy. 2003;19(10):1085-1090.
5. Lubowitz JH, Elson WS, Guttmann D. Part II: arthroscopic treatment of tibial plateau fractures: intercondylar eminence avulsion fractures. Arthroscopy. 2005;21(1):86-92.
6. Vargas B, Lutz N, Dutoit M, Zambelli PY. Nonunion after fracture of the anterior tibial spine: case report and review of the literature. J Pediatr Orthop B. 2009;18(2):90-92.
7. Sommerfeldt DW. Arthroscopically assisted internal fixation of avulsion fractures of the anterior cruciate ligament during childhood and adolescence [in German]. Oper Orthop Traumatol. 2008;20(4-5):310-320.
8. Wouters DB, de Graaf JS, Hemmer PH, Burgerhof JG, Kramer WL. The arthroscopic treatment of displaced tibial spine fractures in children and adolescents using Meniscus Arrows®. Knee Surg Sports Traumatol Arthrosc. 2011;19(5):736-739.
9. Ahn JH, Yoo JC. Clinical outcome of arthroscopic reduction and suture for displaced acute and chronic tibial spine fractures. Knee Surg Sports Traumatol Arthrosc. 2005;13(2):116-121.
10. Huang TW, Hsu KY, Cheng CY, et al. Arthroscopic suture fixation of tibial eminence avulsion fractures. Arthroscopy. 2008;24(11):1232-1238.
11. Liljeros K, Werner S, Janarv PM. Arthroscopic fixation of anterior tibial spine fractures with bioabsorbable nails in skeletally immature patients. Am J Sports Med. 2009;37(5):923-928.
12. Wiegand N, Naumov I, Vamhidy L, Not LG. Arthroscopic treatment of tibial spine fracture in children with a cannulated Herbert screw. Knee. 2014;21(2):481-485.
13. Faivre B, Benea H, Klouche S, Lespagnol F, Bauer T, Hardy P. An original arthroscopic fixation of adult’s tibial eminence fractures using the Tightrope® device: a report of 8 cases and review of literature. Knee. 2014;21(4):833-839.
14. Kluemper CT, Snyder GM, Coats AC, Johnson DL, Mair SD. Arthroscopic suture fixation of tibial eminence fractures. Orthopedics. 2013;36(11):e1401-e1406.
15. Ochiai S, Hagino T, Watanabe Y, Senga S, Haro H. One strategy for arthroscopic suture fixation of tibial intercondylar eminence fractures using the Meniscal Viper Repair System. Sports Med Arthrosc Rehabil Ther Technol. 2011;3:17.
16. Bogunovic L, Tarabichi M, Harris D, Wright R. Treatment of tibial eminence fractures: a systematic review. J Knee Surg. 2015;28(3):255-262.
17. Osti L, Buda M, Soldati F, Del Buono A, Osti R, Maffulli N. Arthroscopic treatment of tibial eminence fracture: a systematic review of different fixation methods. Br Med Bull. 2016;118(1):73-90.
18. Gans I, Baldwin KD, Ganley TJ. Treatment and management outcomes of tibial eminence fractures in pediatric patients: a systematic review. Am J Sports Med. 2014;42(7):1743-1750.
19. Anderson CN, Nyman JS, McCullough KA, et al. Biomechanical evaluation of physeal-sparing fixation methods in tibial eminence fractures. Am J Sports Med. 2013;41(7):1586-1594.
20. Berg EE. Pediatric tibial eminence fractures: arthroscopic cannulated screw fixation. Arthroscopy. 1995;11(3):328-331.
21. Mah JY, Otsuka NY, McLean J. An arthroscopic technique for the reduction and fixation of tibial-eminence fractures. J Pediatr Orthop. 1996;16(1):119-121.
22. Vega JR, Irribarra LA, Baar AK, Iniguez M, Salgado M, Gana N. Arthroscopic fixation of displaced tibial eminence fractures: a new growth plate-sparing method. Arthroscopy. 2008;24(11):1239-1243.
23. Lu XW, Hu XP, Jin C, Zhu T, Ding Y, Dai LY. Reduction and fixation of the avulsion fracture of the tibial eminence using mini-open technique. Knee Surg Sports Traumatol Arthrosc. 2010;18(11):1476-1480.
24. Bonin N, Jeunet L, Obert L, Dejour D. Adult tibial eminence fracture fixation: arthroscopic procedure using K-wire folded fixation. Knee Surg Sports Traumatol Arthrosc. 2007;15(7):857-862.
25. Senekovic V, Veselko M. Anterograde arthroscopic fixation of avulsion fractures of the tibial eminence with a cannulated screw: five-year results. Arthroscopy. 2003;19(1):54-61.
26. Brunner S, Vavken P, Kilger R, et al. Absorbable and non-absorbable suture fixation results in similar outcomes for tibial eminence fractures in children and adolescents. Knee Surg Sports Traumatol Arthrosc. 2016;24(3):723-729.
Take-Home Points
- Technique provides optimal fixation while simultaneously protecting open growth plates.
- Self tensioning feature insures both optimal ACL tension and fracture reduction.
- No need for future hardware removal.
- 10Cross suture configuration optimizes strength of fixation for highly consistent results.
- Use fluoroscopy to avoid violation of tibial physis.
Generally occurring in the 8- to 14-year-old population, tibial eminence avulsion (TEA) fractures are a common variant of anterior cruciate ligament (ACL) ruptures and represent 2% to 5% of all knee injuries in skeletally immature individuals.1,2 Compared with adults, children likely experience this anomaly more often because of the weakness of their incompletely ossified tibial plateau relative to the strength of their native ACL.3
The open repair techniques that have been described have multiple disadvantages, including open incisions, difficult visualization of the fracture owing to the location of the fat pad, and increased risk for arthrofibrosis. Arthroscopic fixation is considered the treatment of choice for TEA fractures because it allows for direct visualization of injury, accurate reduction of fracture fragments, removal of loose fragments, and easy treatment of associated soft-tissue injuries.4-6Several fixation techniques for ACL-TEA fractures were recently described: arthroscopic reduction and internal fixation (ARIF) with Kirschner wires,7 cannulated screws,4 the Meniscus Arrow device (Bionx Implants),8 pull-out sutures,9,10 bioabsorbable nails,11 Herbert screws,12 TightRope fixation (Arthrex),13 and various other rotator cuff and meniscal repair systems.14,15 These approaches tend to have good outcomes for TEA fractures, but there are risks associated with ACL tensioning and potential tibial growth plate violation or hardware problems. Likewise, there are no studies with large numbers of patients treated with these new techniques, so the optimal method of reduction and fixation is still unknown.
In this article, we describe a new ARIF technique that involves 2 absorbable anchors with adjustable suture-tensioning technology. This technique optimizes reduction and helps surgeons avoid proximal tibial physeal damage, procedure-related morbidity, and additional surgery.
Case Report
History
The patient, an 8-year-old boy, sustained a noncontact twisting injury of the left knee during a cutting maneuver in a flag football game. He experienced immediate pain and subsequent swelling. Clinical examination revealed a moderate effusion with motion limitations secondary to swelling and irritability. The patient’s Lachman test result was 2+. Pivot shift testing was not possible because of guarding. The knee was stable to varus and valgus stress at 0° and 30° of flexion. Limited knee flexion prohibited placement of the patient in the position needed for anterior and posterior drawer testing. His patella was stable on lateral stress testing at 20° of flexion with no apprehension. Neurovascular status was intact throughout the lower extremity.
Anteroposterior and lateral radiographs showed a minimally displaced Meyers-McKeever type II TEA fracture (Figures 1A, 1B).
After discussing potential treatment options with the parents, Dr. Smith proceeded with arthroscopic surgery for definitive reduction and internal fixation of the patient’s left knee displaced ACL-TEA fracture. The new adjustable suture-tensioning fixation technique was used. The patient’s guardian provided written informed consent for print and electronic publication of this case report.
Examination Under Anesthesia
Examination with the patient under general anesthesia revealed 3+ Lachman, 2+ pivot shift with foot in internal and external rotation, and 1+ anterior drawer with foot in neutral and internal rotation. The knee was stable to varus and valgus stress testing.
Surgical Technique
Proper patient positioning and padding of bony prominences were ensured, and the limb was sterilely prepared and draped.
Given the young age of the patient, it was imperative to avoid the open proximal tibial growth plate. The surgical plan for stabilization involved use of two 3.0-mm BioComposite Knotless SutureTak anchors (Arthrex). This anchor configuration is based on a No. 2 FiberWire suture shuttled through itself to create a locking splice mechanism that allows for adjustable tensioning. The anchors were placed on each side of the tibial bony avulsion site with two No. 2 FiberWire sutures and were then crossed about the avulsion fracture fragment in an “x-type” configuration to secure the ACL back down to the bony bed.
First, a curette was used to débride fibrous tissue on the underside of the fracture fragment and on the fracture bed. Minimal amounts of cancellous bone were débrided from the tibial fracture bed to optimize fracture reduction by slightly recessing the fracture fragment to ensure optimal ACL tensioning (Figure 5).
Next, from the accessory superior medial portal, the end of the wire that had been passed through the medial aspect of the bony avulsion was retrieved through the lateral portal. This wire was used to shuttle the repair suture from the laterally positioned SutureTak anchor over and through the medial aspect of the bony fragment out of the accessory superior medial (Figure 7).
Follow-Up
Two weeks after surgery, the patient returned to clinic for suture removal. Four weeks after surgery, radiographs confirmed anatomical reduction of the TEA fracture, and outpatient physical therapy (range-of-motion exercises as tolerated) and isometric quadriceps strengthening were instituted. Twelve weeks after surgery, examination revealed full knee motion, negative Lachman and pivot shift test results, and residual quadriceps muscle atrophy, and radiographs confirmed complete fracture healing with maintenance of a normal proximal tibial growth plate (Figures 10A, 10B).
Discussion
The highlight of this case is the simplicity of an excellent reduction of a displaced ACL-TEA fracture. Minimally invasive absorbable implants did not violate the proximal tibial physis, and the unique adjustable suture-tensioning technology allowed the degree of reduction and ACL tension to be “dialed in.” SutureTak implants have strong No. 2 FiberWire suture for excellent stability with an overall small suture load, and their small size avoids the risk of violating the proximal tibial physis and avoids potential growth disturbances.
Despite the obvious risks it poses to the open proximal tibial physis, surgical reduction of Meyers-McKeever type II and type III fractures is the norm for restoring ACL stability. Screws and suture fixation are the most common and reliable methods of TEA fracture reduction.16,17 In recent systematic reviews, however, Osti and colleagues17 and Gans and colleagues18 noted there is not enough evidence to warrant a “gold standard” in pediatric tibial avulsion cases.
Other fixation methods for TEA fractures must be investigated. Anderson and colleagues19 described the biomechanics of 4 different physeal-sparing avulsion fracture reduction techniques: an ultra-high-molecular-weight polyethylene (UHMWPE) suture-suture button, a suture anchor, a polydioxanone suture-suture button, and screw fixation. Using techniques described by Kocher and colleagues,4 Berg,20 Mah and colleagues,21 Vega and colleagues,22 and Lu and colleagues,23 Anderson and colleagues19 reduced TEA fractures in skeletally immature porcine knees. Compared with suture anchors, UHMWPE suture-suture buttons provided biomechanically superior cyclic and load-to-failure results as well as more consistent fixation.
Screw fixation has shown good results but has disadvantages. Incorrect positioning of a screw can lead to impingement and articular cartilage damage, and screw removal may be needed if discomfort at the fixation site persists.24,25 Likewise, screws generally are an option only for large fracture fragments, as there is an inherent risk of fracturing small TEA fractures, which can be common in skeletally immature patients.
Brunner and colleagues26 recently found that TEA fracture repair with absorbable sutures and distal bone bridge fixation yielded 3-month radiographic and clinical healing rates similar to those obtained with nonabsorbable sutures tied around a screw. However, other authors have reported growth disturbances with use of a similar technique, owing to a disturbance of the open proximal tibial growth plate.9 In that regard, a major advantage of this new knotless suturing technique is that distal fixation is not necessary.
The minimally invasive TEA fraction reduction technique described in this article has 6 advantages: It provides excellent fixation while avoiding proximal tibial growth plate injury; the degree of tensioning is easily controlled during reduction; it uses strong suture instead of metal screws or pins; the reduction construct is low-profile; distal fixation is unnecessary; and implant removal is unnecessary, thus limiting subsequent surgical intervention. With respect to long-term outcomes, however, it is not known how this procedure will compare with other commonly used ARIF methods in physeal-sparing techniques for TEA fracture fixation.
This case report highlights a novel pediatric displaced ACL-TEA fracture reduction technique that allows for adjustable reduction and resultant ACL tensioning with excellent strong suture fixation without violating the proximal tibial physis, which could make it invaluable in the surgical treatment of this injury in skeletally immature patients.
Am J Orthop. 2017;46(4):203-208. Copyright Frontline Medical Communications Inc. 2017. All rights reserved.
1. Eiskjaer S, Larsen ST, Schmidt MB. The significance of hemarthrosis of the knee in children. Arch Orthop Trauma Surg. 1988;107(2):96-98.
2. Luhmann SJ. Acute traumatic knee effusions in children and adolescents. J Pediatr Orthop. 2003;23(2):199-202.
3. Woo SL, Hollis JM, Adams DJ, Lyon RM, Takai S. Tensile properties of the human femur-anterior cruciate ligament-tibia complex. The effects of specimen age and orientation. Am J Sports Med. 1991;19(3):217-225.
4. Kocher MS, Foreman ES, Micheli LJ. Laxity and functional outcome after arthroscopic reduction and internal fixation of displaced tibial spine fractures in children. Arthroscopy. 2003;19(10):1085-1090.
5. Lubowitz JH, Elson WS, Guttmann D. Part II: arthroscopic treatment of tibial plateau fractures: intercondylar eminence avulsion fractures. Arthroscopy. 2005;21(1):86-92.
6. Vargas B, Lutz N, Dutoit M, Zambelli PY. Nonunion after fracture of the anterior tibial spine: case report and review of the literature. J Pediatr Orthop B. 2009;18(2):90-92.
7. Sommerfeldt DW. Arthroscopically assisted internal fixation of avulsion fractures of the anterior cruciate ligament during childhood and adolescence [in German]. Oper Orthop Traumatol. 2008;20(4-5):310-320.
8. Wouters DB, de Graaf JS, Hemmer PH, Burgerhof JG, Kramer WL. The arthroscopic treatment of displaced tibial spine fractures in children and adolescents using Meniscus Arrows®. Knee Surg Sports Traumatol Arthrosc. 2011;19(5):736-739.
9. Ahn JH, Yoo JC. Clinical outcome of arthroscopic reduction and suture for displaced acute and chronic tibial spine fractures. Knee Surg Sports Traumatol Arthrosc. 2005;13(2):116-121.
10. Huang TW, Hsu KY, Cheng CY, et al. Arthroscopic suture fixation of tibial eminence avulsion fractures. Arthroscopy. 2008;24(11):1232-1238.
11. Liljeros K, Werner S, Janarv PM. Arthroscopic fixation of anterior tibial spine fractures with bioabsorbable nails in skeletally immature patients. Am J Sports Med. 2009;37(5):923-928.
12. Wiegand N, Naumov I, Vamhidy L, Not LG. Arthroscopic treatment of tibial spine fracture in children with a cannulated Herbert screw. Knee. 2014;21(2):481-485.
13. Faivre B, Benea H, Klouche S, Lespagnol F, Bauer T, Hardy P. An original arthroscopic fixation of adult’s tibial eminence fractures using the Tightrope® device: a report of 8 cases and review of literature. Knee. 2014;21(4):833-839.
14. Kluemper CT, Snyder GM, Coats AC, Johnson DL, Mair SD. Arthroscopic suture fixation of tibial eminence fractures. Orthopedics. 2013;36(11):e1401-e1406.
15. Ochiai S, Hagino T, Watanabe Y, Senga S, Haro H. One strategy for arthroscopic suture fixation of tibial intercondylar eminence fractures using the Meniscal Viper Repair System. Sports Med Arthrosc Rehabil Ther Technol. 2011;3:17.
16. Bogunovic L, Tarabichi M, Harris D, Wright R. Treatment of tibial eminence fractures: a systematic review. J Knee Surg. 2015;28(3):255-262.
17. Osti L, Buda M, Soldati F, Del Buono A, Osti R, Maffulli N. Arthroscopic treatment of tibial eminence fracture: a systematic review of different fixation methods. Br Med Bull. 2016;118(1):73-90.
18. Gans I, Baldwin KD, Ganley TJ. Treatment and management outcomes of tibial eminence fractures in pediatric patients: a systematic review. Am J Sports Med. 2014;42(7):1743-1750.
19. Anderson CN, Nyman JS, McCullough KA, et al. Biomechanical evaluation of physeal-sparing fixation methods in tibial eminence fractures. Am J Sports Med. 2013;41(7):1586-1594.
20. Berg EE. Pediatric tibial eminence fractures: arthroscopic cannulated screw fixation. Arthroscopy. 1995;11(3):328-331.
21. Mah JY, Otsuka NY, McLean J. An arthroscopic technique for the reduction and fixation of tibial-eminence fractures. J Pediatr Orthop. 1996;16(1):119-121.
22. Vega JR, Irribarra LA, Baar AK, Iniguez M, Salgado M, Gana N. Arthroscopic fixation of displaced tibial eminence fractures: a new growth plate-sparing method. Arthroscopy. 2008;24(11):1239-1243.
23. Lu XW, Hu XP, Jin C, Zhu T, Ding Y, Dai LY. Reduction and fixation of the avulsion fracture of the tibial eminence using mini-open technique. Knee Surg Sports Traumatol Arthrosc. 2010;18(11):1476-1480.
24. Bonin N, Jeunet L, Obert L, Dejour D. Adult tibial eminence fracture fixation: arthroscopic procedure using K-wire folded fixation. Knee Surg Sports Traumatol Arthrosc. 2007;15(7):857-862.
25. Senekovic V, Veselko M. Anterograde arthroscopic fixation of avulsion fractures of the tibial eminence with a cannulated screw: five-year results. Arthroscopy. 2003;19(1):54-61.
26. Brunner S, Vavken P, Kilger R, et al. Absorbable and non-absorbable suture fixation results in similar outcomes for tibial eminence fractures in children and adolescents. Knee Surg Sports Traumatol Arthrosc. 2016;24(3):723-729.
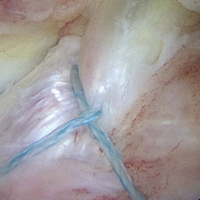
A New Option for Glenoid Reconstruction in Recurrent Anterior Shoulder Instability
Take-Home Points
- Repair anterior bone defect on the glenoid related to recurrent anterior instability with preshaped, predrilled allograft.
- Avoid graft harvest complications related to coracoid (Latarjet) or iliac crest autograft.
- Simple guide system to allow for appropriate graft and screw placement.
- Soft tissues can be repaired to the allograft in predrilled suture holes either inside or outside of the graft
- Position the graft without step at the anterior glenoid.
Anteroinferior glenoid bone loss plays a significant role in recurrent glenohumeral instability. Arthroscopic capsulolabral reconstruction has been associated with a recurrence rate of 4% in the absence of significant glenoid bone loss but 67% in patients with either bone loss of more than 25% of the inferior glenoid diameter or an engaging Hill-Sachs lesion.1,2 Anteroinferior glenoid rim deficiency has been reported in up to 90% of cases of recurrent instability.3 Glenoid reconstruction is therefore recommended in patients with bone loss of more than 25% and in certain revision cases.4 Surgical strategies in these cases include coracoid transfer, iliac crest autograft, and allograft (osteochondral and iliac crest). These procedures all successfully restore stability of the glenohumeral joint. However, they carry the drawbacks of technical complexity with increased operative time or risk of neurovascular damage, or they create a nonanatomical reconstruction, which may contribute to subsequent instability arthropathy. In this article, we introduce a technique in which a preshaped allograft (Glenojet; Arthrosurface, Inc.) is used to match the contour of the glenoid defect. The graft is simple to insert and can reduce operative time.
Graft Preparation
The shaped human tissue cortical bone allograft is usually prepared from proximal or distal tibia or femur. There is no cartilage on the graft. It can be ordered in 2 sizes, 10 mm × 29 mm and 13 mm × 34 mm, for different amounts of bone loss. The more commonly used smaller graft reconstructs defects of 20% to 30% of the glenoid. 
The sutures through this allograft can be prepared on the back table while the rest of the equipment is set up. Start by tying a No. 2 FiberWire (or equivalent) over a small thin object, such as a Freer elevator. Once the knot is secure, remove the Freer and trim the knot tails short. Thread another suture through the loop that has been created and pull to make the 2 tails even. Then thread these tails through one of the small holes of the graft, going from the flat side to the concave side. Pull the suture tails all the way through, including through the loop of the prior suture. The knot of the loop prevents the entire construct from pulling through. The suture tails are then able to slide as if attached to an anchor. Repeat these steps for the other 2 small holes to get a total of 3 sutures exiting the concave side of the graft (Figure 1). Alternatively, pass the suture the opposite way, if tying the capsule inside the graft is preferred.
Surgical Technique
A standard deltopectoral approach is used to expose the anterior glenoid. The subscapularis can either be split in line with its fibers or tenotomized with 1 cm to 2 cm attached to the tuberosity for later repair. In either instance, it is important to separate the muscle from the underlying capsule layer, as the capsule is what is directly repaired to the graft.
The capsule is carefully peeled off the anterior glenoid. A Fukuda or similar retractor may be used on the humerus, and a glenoid retractor is placed on the anterior glenoid, under the capsule and subscapularis, for optimal exposure. Once the anterior glenoid surface is exposed, the drill guide is placed flush against the surface of the glenoid. 
The guide is removed. The cannulated reamer is introduced and advanced until the guide pin appears in the viewing window of the reamer and hits the stop—approximating the correct amount of bone to remove. This step is repeated for the second guide pin. Reaming flattens the anterior glenoid and allows for maximal stable apposition of the graft to the glenoid. The allograft is then inserted onto the pins in the correct orientation to match the surface of the native glenoid.
The length of the superior guide pin is measured with the depth gauge device. It is then removed, and the appropriate-length 3.5-mm cortical bone screw is inserted (alternatively, the guide pin is removed, and a standard depth gauge is used to measure screw length). Once the superior guide pin is secure, the process is repeated for the inferior guide pin (Figure 3). 
Once the graft is secure, the capsule is attached to the graft with the use of a free needle on the suture of the graft (Figure 4). 
Outcomes
Coracoid bone transfer or the Bristow-Latarjet technique has become more popular since bone loss was recognized as an important cause of failure of soft-tissue repair for anterior instability. This procedure, however, is not without complications. In a recent systematic review of 45 studies (1904 shoulders), Griesser and colleagues5 found an overall complication rate of 30% and a reoperation rate of 7%.
Given the potential complications of coracoid bone transfer, allograft reconstruction of the anteroinferior glenoid has become increasingly popular and proved successful at short- and medium-term follow-up. Allograft reconstruction avoids the drawbacks of traditional coracoid bone transfer—namely, high rates of neurovascular injury, and nonanatomical reconstruction with high rates of graft resorption and arthritis.5,6 At average 45-month follow-up after fresh distal tibia allograft reconstruction, Provencher and colleagues7 found an 89% radiographic union rate (average lysis, 3%), significantly improved patient-reported outcomes, and no recurrent instability. Similarly, in a study of iliac crest allograft reconstruction in 10 patients with an average 4-year follow-up, Mascarenhas and colleagues8 found an 80% radiographic union rate at 6 months, significantly improved patient-reported outcomes, and no recurrent shoulder instability.
The advantage of Glenojet over other allografts is that it is preshaped and predrilled and saves the surgeon the time and effort of preparing graft in the operating room. The surgical technologist can place the sutures before the patient enters the room. The 2 allograft sizes (10 mm × 29 mm, 13 mm × 34 mm) accommodate the spectrum of bone loss in glenoid deficiency, and graft contour fits the native glenoid well. So far we have implanted this allograft in 15 patients, and at short-term follow-up there are no known cases of recurrent instability.
The potential disadvantages of Glenojet are similar to those of other allografts. Care must be taken with retractor placement to avoid damaging the axillary and musculocutaneous nerves. There are concerns about graft union and subsequent resorption, but this will require long-term follow-up to determine. At 9-month follow-up, we had 1 fracture at the superior corner of the graft, which may have resulted from overtightening the screws in the graft, creating a stress concentration. After removal of this fragment arthroscopically, the patient has done very well clinically with no pain, instability and has returned to all activities. Although the graft does not have an articular surface, the capsular repair covers much of the articular side of the graft, and therefore we do not anticipate that the absence of articular cartilage will contribute to glenohumeral arthritis, though long-term follow-up is lacking. The other question many have is related to the lack of the sling effect since there is no conjoined tendon on the graft. Yamamoto and colleagues9 have reported that the conjoined tendon is the major stabilizing force at time zero in a cadaver model. However, other authors7,8 have successfully reconstructed glenoid defects in these difficult cases without the “sling effect” of the conjoined tendon with excellent clinical results. Our experience has been similar. It is likely that long-term studies will be necessary to answer this question. We have also done some cases with the tendon attached after releasing it from the coracoid, but the series is too small to make any comment about whether this is important or not.
The main limitation of this allograft technique is the lack of long-term outcome studies. However, short-term results are promising, and the ease of the procedure makes it an attractive option for either glenoid reconstruction of bony Bankart lesions or failed bone reconstruction, such as Bristow-Latarjet reconstruction.
Glenojetallograft is a new glenoid reconstruction option that is technically easy and simple to perform in cases of glenoid bone loss, while still creating an anatomical buttress with less surgical dissection than traditional coracoid bone transfer. Short-term outcomes are reassuring, though more research is needed for long-term graft follow-up and recurrent instability.
Am J Orthop. 2017;46(4):199-202. Copyright Frontline Medical Communications Inc. 2017. All rights reserved.
1. Burkhart SS, De Beer JF. Traumatic glenohumeral bone defects and their relationship to failure of arthroscopic Bankart repairs: significance of the inverted-pear glenoid and the humeral engaging Hill-Sachs lesion. Arthroscopy. 2000;16(7):677-694.
2. Rowe CR, Sakellarides HT. Factors related to recurrences of anterior dislocations of the shoulder. Clin Orthop. 1961;(20):40-48.
3. Piasecki DP, Verma NN, Romeo AA, Levine WN, Bach BR Jr, Provencher MT. Glenoid bone deficiency in recurrent anterior shoulder instability: diagnosis and management. J Am Acad Orthop Surg. 2009;17(8):482-493.
4. Sayegh ET, Mascarenhas R, Chalmers PN, Cole BJ, Verma NN, Romeo AA. Allograft reconstruction for glenoid bone loss in glenohumeral instability: a systematic review. Arthroscopy. 2014;30(12):1642-1649.
5. Griesser MJ, Harris JD, McCoy BW, et al. Complications and re-operati ons after Bristow-Latarjet shoulder stabilization: a systematic review. J Shoulder Elbow Surg. 2013;22(2):286-292.
6. Young DC, Rockwood CA Jr. Complications of a failed Bristow procedure and their management. J Bone Joint Surg Am. 1991;73(7):969-981.
7. Provencher MT, Frank RM, Golijanin P, et al. Distal tibia allograft glenoid reconstruction in recurrent anterior shoulder instability: clinical and radiographic outcomes. Arthroscopy. 2017;33(5):891-897.
8. Mascarenhas R, Raleigh E, McRae S, Leiter J, Saltzman B, MacDonald PB. Iliac crest allograft glenoid reconstruction for recurrent anterior shoulder instability in athletes: surgical technique and results. Int J Shoulder Surg. 2014;8(4):127-132.
9. Yamamoto N, Muraki T, An KN, et al. The stabilizing mechanism of the Latarjet procedure: a cadaveric study. J Bone Joint Surg Am. 2013;95(15):1390-1397.
Take-Home Points
- Repair anterior bone defect on the glenoid related to recurrent anterior instability with preshaped, predrilled allograft.
- Avoid graft harvest complications related to coracoid (Latarjet) or iliac crest autograft.
- Simple guide system to allow for appropriate graft and screw placement.
- Soft tissues can be repaired to the allograft in predrilled suture holes either inside or outside of the graft
- Position the graft without step at the anterior glenoid.
Anteroinferior glenoid bone loss plays a significant role in recurrent glenohumeral instability. Arthroscopic capsulolabral reconstruction has been associated with a recurrence rate of 4% in the absence of significant glenoid bone loss but 67% in patients with either bone loss of more than 25% of the inferior glenoid diameter or an engaging Hill-Sachs lesion.1,2 Anteroinferior glenoid rim deficiency has been reported in up to 90% of cases of recurrent instability.3 Glenoid reconstruction is therefore recommended in patients with bone loss of more than 25% and in certain revision cases.4 Surgical strategies in these cases include coracoid transfer, iliac crest autograft, and allograft (osteochondral and iliac crest). These procedures all successfully restore stability of the glenohumeral joint. However, they carry the drawbacks of technical complexity with increased operative time or risk of neurovascular damage, or they create a nonanatomical reconstruction, which may contribute to subsequent instability arthropathy. In this article, we introduce a technique in which a preshaped allograft (Glenojet; Arthrosurface, Inc.) is used to match the contour of the glenoid defect. The graft is simple to insert and can reduce operative time.
Graft Preparation
The shaped human tissue cortical bone allograft is usually prepared from proximal or distal tibia or femur. There is no cartilage on the graft. It can be ordered in 2 sizes, 10 mm × 29 mm and 13 mm × 34 mm, for different amounts of bone loss. The more commonly used smaller graft reconstructs defects of 20% to 30% of the glenoid.
The sutures through this allograft can be prepared on the back table while the rest of the equipment is set up. Start by tying a No. 2 FiberWire (or equivalent) over a small thin object, such as a Freer elevator. Once the knot is secure, remove the Freer and trim the knot tails short. Thread another suture through the loop that has been created and pull to make the 2 tails even. Then thread these tails through one of the small holes of the graft, going from the flat side to the concave side. Pull the suture tails all the way through, including through the loop of the prior suture. The knot of the loop prevents the entire construct from pulling through. The suture tails are then able to slide as if attached to an anchor. Repeat these steps for the other 2 small holes to get a total of 3 sutures exiting the concave side of the graft (Figure 1). Alternatively, pass the suture the opposite way, if tying the capsule inside the graft is preferred.
Surgical Technique
A standard deltopectoral approach is used to expose the anterior glenoid. The subscapularis can either be split in line with its fibers or tenotomized with 1 cm to 2 cm attached to the tuberosity for later repair. In either instance, it is important to separate the muscle from the underlying capsule layer, as the capsule is what is directly repaired to the graft.
The capsule is carefully peeled off the anterior glenoid. A Fukuda or similar retractor may be used on the humerus, and a glenoid retractor is placed on the anterior glenoid, under the capsule and subscapularis, for optimal exposure. Once the anterior glenoid surface is exposed, the drill guide is placed flush against the surface of the glenoid.
The guide is removed. The cannulated reamer is introduced and advanced until the guide pin appears in the viewing window of the reamer and hits the stop—approximating the correct amount of bone to remove. This step is repeated for the second guide pin. Reaming flattens the anterior glenoid and allows for maximal stable apposition of the graft to the glenoid. The allograft is then inserted onto the pins in the correct orientation to match the surface of the native glenoid.
The length of the superior guide pin is measured with the depth gauge device. It is then removed, and the appropriate-length 3.5-mm cortical bone screw is inserted (alternatively, the guide pin is removed, and a standard depth gauge is used to measure screw length). Once the superior guide pin is secure, the process is repeated for the inferior guide pin (Figure 3).
Once the graft is secure, the capsule is attached to the graft with the use of a free needle on the suture of the graft (Figure 4).
Outcomes
Coracoid bone transfer or the Bristow-Latarjet technique has become more popular since bone loss was recognized as an important cause of failure of soft-tissue repair for anterior instability. This procedure, however, is not without complications. In a recent systematic review of 45 studies (1904 shoulders), Griesser and colleagues5 found an overall complication rate of 30% and a reoperation rate of 7%.
Given the potential complications of coracoid bone transfer, allograft reconstruction of the anteroinferior glenoid has become increasingly popular and proved successful at short- and medium-term follow-up. Allograft reconstruction avoids the drawbacks of traditional coracoid bone transfer—namely, high rates of neurovascular injury, and nonanatomical reconstruction with high rates of graft resorption and arthritis.5,6 At average 45-month follow-up after fresh distal tibia allograft reconstruction, Provencher and colleagues7 found an 89% radiographic union rate (average lysis, 3%), significantly improved patient-reported outcomes, and no recurrent instability. Similarly, in a study of iliac crest allograft reconstruction in 10 patients with an average 4-year follow-up, Mascarenhas and colleagues8 found an 80% radiographic union rate at 6 months, significantly improved patient-reported outcomes, and no recurrent shoulder instability.
The advantage of Glenojet over other allografts is that it is preshaped and predrilled and saves the surgeon the time and effort of preparing graft in the operating room. The surgical technologist can place the sutures before the patient enters the room. The 2 allograft sizes (10 mm × 29 mm, 13 mm × 34 mm) accommodate the spectrum of bone loss in glenoid deficiency, and graft contour fits the native glenoid well. So far we have implanted this allograft in 15 patients, and at short-term follow-up there are no known cases of recurrent instability.
The potential disadvantages of Glenojet are similar to those of other allografts. Care must be taken with retractor placement to avoid damaging the axillary and musculocutaneous nerves. There are concerns about graft union and subsequent resorption, but this will require long-term follow-up to determine. At 9-month follow-up, we had 1 fracture at the superior corner of the graft, which may have resulted from overtightening the screws in the graft, creating a stress concentration. After removal of this fragment arthroscopically, the patient has done very well clinically with no pain, instability and has returned to all activities. Although the graft does not have an articular surface, the capsular repair covers much of the articular side of the graft, and therefore we do not anticipate that the absence of articular cartilage will contribute to glenohumeral arthritis, though long-term follow-up is lacking. The other question many have is related to the lack of the sling effect since there is no conjoined tendon on the graft. Yamamoto and colleagues9 have reported that the conjoined tendon is the major stabilizing force at time zero in a cadaver model. However, other authors7,8 have successfully reconstructed glenoid defects in these difficult cases without the “sling effect” of the conjoined tendon with excellent clinical results. Our experience has been similar. It is likely that long-term studies will be necessary to answer this question. We have also done some cases with the tendon attached after releasing it from the coracoid, but the series is too small to make any comment about whether this is important or not.
The main limitation of this allograft technique is the lack of long-term outcome studies. However, short-term results are promising, and the ease of the procedure makes it an attractive option for either glenoid reconstruction of bony Bankart lesions or failed bone reconstruction, such as Bristow-Latarjet reconstruction.
Glenojetallograft is a new glenoid reconstruction option that is technically easy and simple to perform in cases of glenoid bone loss, while still creating an anatomical buttress with less surgical dissection than traditional coracoid bone transfer. Short-term outcomes are reassuring, though more research is needed for long-term graft follow-up and recurrent instability.
Am J Orthop. 2017;46(4):199-202. Copyright Frontline Medical Communications Inc. 2017. All rights reserved.
1. Burkhart SS, De Beer JF. Traumatic glenohumeral bone defects and their relationship to failure of arthroscopic Bankart repairs: significance of the inverted-pear glenoid and the humeral engaging Hill-Sachs lesion. Arthroscopy. 2000;16(7):677-694.
2. Rowe CR, Sakellarides HT. Factors related to recurrences of anterior dislocations of the shoulder. Clin Orthop. 1961;(20):40-48.
3. Piasecki DP, Verma NN, Romeo AA, Levine WN, Bach BR Jr, Provencher MT. Glenoid bone deficiency in recurrent anterior shoulder instability: diagnosis and management. J Am Acad Orthop Surg. 2009;17(8):482-493.
4. Sayegh ET, Mascarenhas R, Chalmers PN, Cole BJ, Verma NN, Romeo AA. Allograft reconstruction for glenoid bone loss in glenohumeral instability: a systematic review. Arthroscopy. 2014;30(12):1642-1649.
5. Griesser MJ, Harris JD, McCoy BW, et al. Complications and re-operati ons after Bristow-Latarjet shoulder stabilization: a systematic review. J Shoulder Elbow Surg. 2013;22(2):286-292.
6. Young DC, Rockwood CA Jr. Complications of a failed Bristow procedure and their management. J Bone Joint Surg Am. 1991;73(7):969-981.
7. Provencher MT, Frank RM, Golijanin P, et al. Distal tibia allograft glenoid reconstruction in recurrent anterior shoulder instability: clinical and radiographic outcomes. Arthroscopy. 2017;33(5):891-897.
8. Mascarenhas R, Raleigh E, McRae S, Leiter J, Saltzman B, MacDonald PB. Iliac crest allograft glenoid reconstruction for recurrent anterior shoulder instability in athletes: surgical technique and results. Int J Shoulder Surg. 2014;8(4):127-132.
9. Yamamoto N, Muraki T, An KN, et al. The stabilizing mechanism of the Latarjet procedure: a cadaveric study. J Bone Joint Surg Am. 2013;95(15):1390-1397.
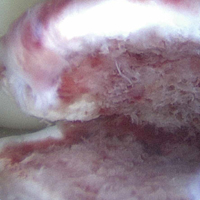
Systematic Review of Novel Synovial Fluid Markers and Polymerase Chain Reaction in the Diagnosis of Prosthetic Joint Infection
Take-Home Points
- Novel synovial markers and PCR have the potential to improve the detection of PJIs.
- 10Difficult-to-detect infections of prosthetic joints pose a diagnostic problem to surgeons and can lead to suboptimal outcomes.
- AD is a highly sensitive and specific synovial fluid marker for detecting PJIs.
- AD has shown promising results in detecting low virulence organisms.
- Studies are needed to determine how to best incorporate novel synovial markers and PCR to current diagnostic criteria in order to improve diagnostic accuracy.
Approximately 7 million Americans are living with a hip or knee replacement.1 According to projections, primary hip arthroplasties will increase by 174% and knee arthroplasties by 673% by 2030. Revision arthroplasties are projected to increase by 137% for hips and 601% for knees during the same time period.2 Infection and aseptic loosening are the most common causes of implant failure.3 The literature shows that infection is the most common cause of failure within 2 years after surgery and that aseptic loosening is the most common cause for late revision.3
Recent studies suggest that prosthetic joint infection (PJI) may be underreported because of difficulty making a diagnosis and that cases of aseptic loosening may in fact be attributable to infections with low-virulence organisms.2,3 These findings have led to new efforts to develop uniform criteria for diagnosing PJIs. In 2011, the Musculoskeletal Infection Society (MSIS) offered a new definition for PJI diagnosis, based on clinical and laboratory criteria, to increase the accuracy of PJI diagnosis.4 The MSIS committee acknowledged that PJI may be present even if these criteria are not met, particularly in the case of low-virulence organisms, as patients may not present with clinical signs of infection and may have normal inflammatory markers and joint aspirates. Reports of PJI cases misdiagnosed as aseptic loosening suggest that current screening and diagnostic tools are not sensitive enough to detect all infections and that PJI is likely underdiagnosed.
According to MSIS criteria, the diagnosis of PJI can be made when there is a sinus tract communicating with the prosthesis, when a pathogen is isolated by culture from 2 or more separate tissue or fluid samples obtained from the affected prosthetic joint, or when 4 of 6 criteria are met. The 6 criteria are (1) elevated serum erythrocyte sedimentation rate (ESR) (>30 mm/hour) and elevated C-reactive protein (CRP) level (>10 mg/L); (2) elevated synovial white blood cell (WBC) count (1100-4000 cells/μL); (3) elevated synovial polymorphonuclear leukocytes (>64%); (4) purulence in affected joint; (5) isolation of a microorganism in a culture of periprosthetic tissue or fluid; and (6) more than 5 neutrophils per high-power field in 5 high-power fields observed.
In this review article, we discuss recently developed novel synovial biomarkers and polymerase chain reaction (PCR) technologies that may help increase the sensitivity and specificity of diagnostic guidelines for PJI.
Methods
Using PRISMA (Preferred Reporting Items for Systematic Reviews and Meta-Analyses), we performed a systematic review of specific synovial fluid markers and PCR used in PJI diagnosis. In May 2016, we searched the PubMed database for these criteria: ((((((PCR[Text Word]) OR IL-6[Text Word]) OR leukocyte esterase[Text Word]) OR alpha defensin[Text Word]) AND ((“infection/diagnosis”[MeSH Terms] OR “infection/surgery”[MeSH Terms])))) AND (prosthetic joint infection[MeSH Terms] OR periprosthetic joint infection[MeSH Terms]).
We included patients who had undergone total hip, knee, or shoulder arthroplasty (THA, TKA, TSA). Index tests were PCR and the synovial fluid markers α-defensin (AD), interleukin 6 (IL-6), and leukocyte esterase (LE). Reference tests included joint fluid/serum analysis or tissue analysis (ESR/CRP level, cell count, culture, frozen section), which defined the MSIS criteria for PJI. Primary outcomes of interest were sensitivity and specificity, and secondary outcomes of interest included positive predictive value (PPV), negative predictive value (NPV), positive likelihood ratio (+LR), and negative likelihood ratio (–LR). Randomized controlled trials and controlled cohort studies in humans published within the past 10 years were included.
Results
Our full-text review yielded 15 papers that met our study inclusion criteria (Figure 1).
α-Defensin
One of the novel synovial biomarkers that has shown significant promise in diagnosing PJIs, even with difficult-to-detect organisms, is AD. 
AD has shown even more impressive results as a biomarker for PJI in the hip and knee, where infection with low virulence organism is less common. In 2014, Deirmengian and colleagues6 conducted a prospective clinical study of 149 patients who underwent revision THA or TKA for aseptic loosening (n = 112) or PJI (n = 37) as defined by MSIS criteria. Aseptic loosening was diagnosed when there was no identifiable reason for pain, and MSIS criteria were not met. Synovial fluid aspirates were collected before or during surgery. AD correctly identified 143 of the 149 patients with confirmed infection with sensitivity of 97.3% (95% confidence interval [CI], 85.8%-99.6%) and specificity of 95.5% (95% CI, 89.9%-98.5%). Similarly, Bingham and colleagues7 conducted a retrospective clinical study of 61 assays done on 57 patients who underwent revision arthroplasty for PJI as defined by MSIS criteria. Synovial fluid aspirates were collected before or during surgery. AD correctly identified all 19 PJIs with sensitivity of 100% (95% CI, 79%-100%) and specificity of 95% (95% CI, 83%-99%). Sensitivity and specificity of the AD assay more accurately predicted infection than synovial cell count or serum ESR/CRP level did.
These results are supported by another prospective study by Deirmengian and colleagues8 differentiating aseptic failures and PJIs in THA or TKA. The sensitivity and specificity of AD in diagnosing PJI were 100% (95% CI, 85.05%-100%). 
In a prospective study of 102 patients who underwent revision THA or TKA secondary to aseptic loosening or PJI, Frangiamore and colleagues9 also demonstrated the value of AD as a diagnostic for PJI in primary and revision hip and knee arthroplasty. 
Table 1 and Figure 2 provide a concise review of the findings of each study.
Interleukin 6
Another synovial fluid biomarker that has shown promise in PJI diagnosis is IL-6. In 2015, Frangiamore and colleagues10 conducted a prospective clinical study of 32 patients who underwent revision TSA. Synovial fluid aspiration was obtained before or during surgery. MSIS criteria were used to establish the diagnosis of PJI. IL-6 had sensitivity of 87% and specificity of 90%, with +LR of 8.45 and –LR of 0.15 in predicting PJI. Synovial fluid IL-6 had strong associations with frozen section histology and growth of P acnes. Frangiamore and colleagues10 recommended an ideal IL-6 cutoff of 359.1 pg/mL and reported that, though not as accurate as AD, synovial fluid IL-6 levels can help predict positive cultures in patients who undergo revision TSA.
Lenski and Scherer11 conducted another retrospective clinical study of the diagnostic value of IL-6 in PJI. 
Randau and colleagues12 conducted a prospective clinical study of 120 patients who presented with painful THA or TKA and underwent revision for PJI, aseptic failure, or aseptic revision without signs of infection or loosening. Synovial fluid aspirate was collected before or during surgery. 
Table 2 and Figure 3 provide a concise review of the findings of each study.
Leukocyte Esterase
LE strips are an inexpensive screening tool for PJI, according to some studies. In a prospective clinical study of 364 endoprosthetic joint (hip, knee, shoulder) interventions, Guenther and colleagues13 collected synovial fluid before surgery. Samples were tested with graded LE strips using PJI criteria set by the authors. Results were correlated with preoperative synovial fluid aspirations, serum CRP level, serum WBC count, and intraoperative histopathologic and microbiological findings. Whereas 293 (93.31%) of the 314 aseptic cases had negative test strip readings, 100% of the 50 infected cases were positive. LE had sensitivity of 100%, specificity of 96.5%, PPV of 82%, and NPV of 100%.
Wetters et al14 performed a prospective clinical study on 223 patients who underwent TKAs and THAs for suspected PJI based on having criteria defined by the authors of the study. Synovial fluid samples were collected either preoperatively or intraoperatively. 
Other authors have reported different findings that LE is an unreliable marker in PJI diagnosis. In one prospective clinical study of 85 patients who underwent primary or revision TSA, synovial fluid was collected during surgery.15 According to MSIS criteria, only 5 positive LE results predicted PJI among 21 primary and revision patients with positive cultures. Of the 7 revision patients who met the MSIS criteria for PJI, only 2 had a positive LE test. LE had sensitivity of 28.6%, specificity of 63.6%, PPV of 28.6%, and NPV of 87.5%. Six of the 7 revision patients grew P acnes. These results showed that LE was unreliable in detecting shoulder PJI.15
In another prospective clinical study, Tischler and colleagues16 enrolled 189 patients who underwent revision TKA or THA for aseptic failure or PJI as defined by the MSIS criteria. Synovial fluid was collected intraoperatively. 
Table 3 and Figure 4 provide a concise review of the findings of each study.
Polymerase Chain Reaction
Studies have found that PCR analysis of synovial fluid is effective in detecting bacteria on the surface of implants removed during revision arthroplasties. Comparison of the 16S rRNA gene sequences of bacterial genomes showed a diverse range of bacterial species within biofilms on the surface of clinical and subclinical infections.17 These findings, along with those of other studies, suggest that PCR analysis of synovial fluid is useful in diagnosing PJI and identifying organisms and their sensitivities to antibiotics.
Gallo and colleagues18 performed a prospective clinical study on 115 patients who underwent revision TKAs or THAs. Synovial fluid was collected intraoperatively. PCR assays targeting the 16S rDNA were carried out on 101 patients. PJIs were classified based on criteria of the authors of this study, of which there were 42. The sensitivity, specificity, PPV, NPV, +LR, and -LR for PCR were 71.4% (95% CI, 61.5%-75.5%), 97% (95% CI, 91.7%-99.1%), 92.6% (95% CI, 79.8%-97.9%), 86.5% (95% CI, 81.8%-88.4%), 23.6 (95% CI, 5.9%-93.8%), and 0.29 (95% CI, 0.17%-0.49%), respectively. Of note the most common organism detected in 42 PJIs was coagulase-negative Staphylococcus.
Marin and colleagues19 conducted a prospective study of 122 patients who underwent arthroplasty for suspected infection or aseptic loosening as defined by the authors’ clinicohistopathologic criteria. Synovial fluid and biopsy specimens were collected during surgery, and 40 patients met the infection criteria. The authors concluded that 16S PCR is more specific and has better PPV than culture does as one positive 16S PCR resulted in a specificity and PPV of PJI of 96.3% and 91.7%, respectively. However, they noted that culture was more sensitive in diagnosing PJI.
Jacovides and colleagues20 conducted a prospective study on 82 patients undergoing primary TKA, revision TKA, and revision THA.
The low PCR sensitivities reported in the literature were explained in a review by Hartley and Harris.21 They wrote that BR 16S rDNA and sequencing of PJI samples inherently have low sensitivity because of the contamination that can occur from the PCR reagents themselves or from sample mishandling. Techniques that address contaminant (extraneous DNA) removal, such as ultraviolet irradiation and DNase treatment, reduce Taq DNA polymerase activity, which reduces PCR sensitivity. 
Table 4 and Figure 5 provide a concise review of the findings of each study.
Discussion
Although there is no gold standard for the diagnosis of PJIs, several clinical and laboratory criteria guidelines are currently used to help clinicians diagnose infections of prosthetic joints. However, despite standardization of diagnostic criteria, PJI continue to be a diagnostic challenge.
AD is a highly sensitive and specific synovial fluid biomarker in detecting common PJIs. 

In summary, 5 AD studies5-9 had sensitivity ranging from 63% to 100% and specificity ranging from 95% to 100%; 3 IL-6 studies10-12 had sensitivity ranging from 46.8% to 90.9% and specificity ranging from 85.7% to 97.6%; 4 LE studies13-16 had sensitivity ranging from 28.6% to 100% and specificity ranging from 63.6% to 96.5%; and 3 PCR studies18-20 had sensitivity ranging from 67.1% to 95.7% and specificity ranging from 12.3% to 97.8%. Sensitivity and specificity were consistently higher for AD than for IL-6, LE, and PCR, though there was significant overlap, heterogeneity, and variation across all the included studies. 
Although the overall incidence of PJI is low, infected revisions remain a substantial financial burden to hospitals, as annual costs of infected revisions is estimated to exceed $1.62 billion by 2020.25 The usefulness of novel biomarkers and PCR in diagnosing PJI can be found in their ability to diagnose infections and facilitate appropriate early treatment. Several of these tests are readily available commercially and have the potential to be cost-effective diagnostic tools. The price to perform an AD test from Synovasure TM (Zimmer Biomet) ranges from $93 to $143. LE also provides an economic option for diagnosing PJI, as LE strips are commercially available for the cost of about 25 cents. PCR has also become an economic option, as costs can average $15.50 per sample extraction or PCR assay and $42.50 per amplicon sequence as reported in a study by Vandercam and colleagues.26 Future studies are needed to determine a diagnostic algorithm which incorporates these novel synovial markers to improve diagnostic accuracy of PJI in the most cost effective manner.
The current literature supports that AD can potentially be used to screen for PJI. Our findings suggest novel synovial fluid biomarkers may become of significant diagnostic use when combined with current laboratory and clinical diagnostic criteria. We recommend use of AD in cases in which pain, stiffness, and poor TJA outcome cannot be explained by errors in surgical technique, and infection is suspected despite MSIS criteria not being met.
The studies reviewed in this manuscript were limited in that none presented level I evidence (12 had level II evidence, and 3 had level III evidence), and there was significant heterogeneity (some studies used their own diagnostic standard, and others used the MSIS criteria). Larger scale prospective studies comparing serum ESR/CRP level and synovial fluid analysis to novel synovial markers are needed.
Am J Orthop. 2017;46(4):190-198. Copyright Frontline Medical Communications Inc. 2017. All rights reserved.
1. Maradit Kremers H, Larson DR, Crowson CS, et al. Prevalence of total hip and knee replacement in the United States. J Bone Joint Surg Am. 2015;97(17):1386-1397.
2. Kurtz S, Ong K, Lau E, Mowat F, Halpern M. Projections of primary and revision hip and knee arthroplasty in the United States from 2005 to 2030. J Bone Joint Surg Am. 2007;89(4):780-785.
3. Sharkey PF, Lichstein PM, Shen C, Tokarski AT, Parvizi J. Why are total knee arthroplasties failing today—has anything changed after 10 years? J Arthroplasty. 2014;29(9):1774-1778.
4. Butler-Wu SM, Burns EM, Pottinger PS, et al. Optimization of periprosthetic culture for diagnosis of Propionibacterium acnes prosthetic joint infection. J Clin Microbiol. 2011;49(7):2490-2495.
5. Frangiamore SJ, Saleh A, Grosso MJ, et al. α-Defensin as a predictor of periprosthetic shoulder infection. J Shoulder Elbow Surg. 2015;24(7):1021-1027.
6. Deirmengian C, Kardos K, Kilmartin P, Cameron A, Schiller K, Parvizi J. Combined measurement of synovial fluid α-defensin and C-reactive protein levels: highly accurate for diagnosing periprosthetic joint infection. J Bone Joint Surg Am. 2014;96(17):1439-1445.
7. Bingham J, Clarke H, Spangehl M, Schwartz A, Beauchamp C, Goldberg B. The alpha defensin-1 biomarker assay can be used to evaluate the potentially infected total joint arthroplasty. Clin Orthop Relat Res. 2014;472(12):4006-4009.
8. Deirmengian C, Kardos K, Kilmartin P, et al. The alpha-defensin test for periprosthetic joint infection outperforms the leukocyte esterase test strip. Clin Orthop Relat Res. 2015;473(1):198-203.
9. Frangiamore SJ, Gajewski ND, Saleh A, Farias-Kovac M, Barsoum WK, Higuera CA. α-Defensin accuracy to diagnose periprosthetic joint infection—best available test? J Arthroplasty. 2016;31(2):456-460.
10. Frangiamore SJ, Saleh A, Kovac MF, et al. Synovial fluid interleukin-6 as a predictor of periprosthetic shoulder infection. J Bone Joint Surg Am. 2015;97(1):63-70.
11. Lenski M, Scherer MA. Synovial IL-6 as inflammatory marker in periprosthetic joint infections. J Arthroplasty. 2014;29(6):1105-1109.
12. Randau TM, Friedrich MJ, Wimmer MD, et al. Interleukin-6 in serum and in synovial fluid enhances the differentiation between periprosthetic joint infection and aseptic loosening. PLoS One. 2014;9(2):e89045.
13. Guenther D, Kokenge T, Jacobs O, et al. Excluding infections in arthroplasty using leucocyte esterase test. Int Orthop. 2014;38(11):2385-2390.
14. Wetters NG, Berend KR, Lombardi AV, Morris MJ, Tucker TL, Della Valle CJ. Leukocyte esterase reagent strips for the rapid diagnosis of periprosthetic joint infection. J Arthroplasty. 2012;27(8 suppl):8-11.
15. Nelson GN, Paxton ES, Narzikul A, Williams G, Lazarus MD, Abboud JA. Leukocyte esterase in the diagnosis of shoulder periprosthetic joint infection. J Shoulder Elbow Surg. 2015;24(9):1421-1426.
16. Tischler EH, Cavanaugh PK, Parvizi J. Leukocyte esterase strip test: matched for Musculoskeletal Infection Society criteria. J Bone Joint Surg Am. 2014;96(22):1917-1920.
17. Dempsey KE, Riggio MP, Lennon A, et al. Identification of bacteria on the surface of clinically infected and non-infected prosthetic hip joints removed during revision arthroplasties by 16S rRNA gene sequencing and by microbiological culture. Arthritis Res Ther. 2007;9(3):R46.
18. Gallo J, Kolar M, Dendis M, et al. Culture and PCR analysis of joint fluid in the diagnosis of prosthetic joint infection. New Microbiol. 2008;31(1):97-104.
19. Marin M, Garcia-Lechuz JM, Alonso P, et al. Role of universal 16S rRNA gene PCR and sequencing in diagnosis of prosthetic joint infection. J Clin Microbiol. 2012;50(3):583-589.
20. Jacovides CL, Kreft R, Adeli B, Hozack B, Ehrlich GD, Parvizi J. Successful identification of pathogens by polymerase chain reaction (PCR)-based electron spray ionization time-of-flight mass spectrometry (ESI-TOF-MS) in culture-negative periprosthetic joint infection. J Bone Joint Surg Am. 2012;94(24):2247-2254.
21. Hartley JC, Harris KA. Molecular techniques for diagnosing prosthetic joint infections. J Antimicrob Chemother. 2014;69(suppl 1):i21-i24.
22. Zappe B, Graf S, Ochsner PE, Zimmerli W, Sendi P. Propionibacterium spp. in prosthetic joint infections: a diagnostic challenge. Arch Orthop Trauma Surg. 2008;128(10):1039-1046.
23. Rasouli MR, Harandi AA, Adeli B, Purtill JJ, Parvizi J. Revision total knee arthroplasty: infection should be ruled out in all cases. J Arthroplasty. 2012;27(6):1239-1243.e1-e2.
24. Hunt RW, Bond MJ, Pater GD. Psychological responses to cancer: a case for cancer support groups. Community Health Stud. 1990;14(1):35-38.
25. Kurtz SM, Lau E, Schmier J, Ong KL, Zhao K, Parvizi J. Infection burden for hip and knee arthroplasty in the United States. J Arthroplasty. 2008;23(7):984-991.
26. Vandercam B, Jeumont S, Cornu O, et al. Amplification-based DNA analysis in the diagnosis of prosthetic joint infection. J Mol Diagn. 2008;10(6):537-543.
Take-Home Points
- Novel synovial markers and PCR have the potential to improve the detection of PJIs.
- 10Difficult-to-detect infections of prosthetic joints pose a diagnostic problem to surgeons and can lead to suboptimal outcomes.
- AD is a highly sensitive and specific synovial fluid marker for detecting PJIs.
- AD has shown promising results in detecting low virulence organisms.
- Studies are needed to determine how to best incorporate novel synovial markers and PCR to current diagnostic criteria in order to improve diagnostic accuracy.
Approximately 7 million Americans are living with a hip or knee replacement.1 According to projections, primary hip arthroplasties will increase by 174% and knee arthroplasties by 673% by 2030. Revision arthroplasties are projected to increase by 137% for hips and 601% for knees during the same time period.2 Infection and aseptic loosening are the most common causes of implant failure.3 The literature shows that infection is the most common cause of failure within 2 years after surgery and that aseptic loosening is the most common cause for late revision.3
Recent studies suggest that prosthetic joint infection (PJI) may be underreported because of difficulty making a diagnosis and that cases of aseptic loosening may in fact be attributable to infections with low-virulence organisms.2,3 These findings have led to new efforts to develop uniform criteria for diagnosing PJIs. In 2011, the Musculoskeletal Infection Society (MSIS) offered a new definition for PJI diagnosis, based on clinical and laboratory criteria, to increase the accuracy of PJI diagnosis.4 The MSIS committee acknowledged that PJI may be present even if these criteria are not met, particularly in the case of low-virulence organisms, as patients may not present with clinical signs of infection and may have normal inflammatory markers and joint aspirates. Reports of PJI cases misdiagnosed as aseptic loosening suggest that current screening and diagnostic tools are not sensitive enough to detect all infections and that PJI is likely underdiagnosed.
According to MSIS criteria, the diagnosis of PJI can be made when there is a sinus tract communicating with the prosthesis, when a pathogen is isolated by culture from 2 or more separate tissue or fluid samples obtained from the affected prosthetic joint, or when 4 of 6 criteria are met. The 6 criteria are (1) elevated serum erythrocyte sedimentation rate (ESR) (>30 mm/hour) and elevated C-reactive protein (CRP) level (>10 mg/L); (2) elevated synovial white blood cell (WBC) count (1100-4000 cells/μL); (3) elevated synovial polymorphonuclear leukocytes (>64%); (4) purulence in affected joint; (5) isolation of a microorganism in a culture of periprosthetic tissue or fluid; and (6) more than 5 neutrophils per high-power field in 5 high-power fields observed.
In this review article, we discuss recently developed novel synovial biomarkers and polymerase chain reaction (PCR) technologies that may help increase the sensitivity and specificity of diagnostic guidelines for PJI.
Methods
Using PRISMA (Preferred Reporting Items for Systematic Reviews and Meta-Analyses), we performed a systematic review of specific synovial fluid markers and PCR used in PJI diagnosis. In May 2016, we searched the PubMed database for these criteria: ((((((PCR[Text Word]) OR IL-6[Text Word]) OR leukocyte esterase[Text Word]) OR alpha defensin[Text Word]) AND ((“infection/diagnosis”[MeSH Terms] OR “infection/surgery”[MeSH Terms])))) AND (prosthetic joint infection[MeSH Terms] OR periprosthetic joint infection[MeSH Terms]).
We included patients who had undergone total hip, knee, or shoulder arthroplasty (THA, TKA, TSA). Index tests were PCR and the synovial fluid markers α-defensin (AD), interleukin 6 (IL-6), and leukocyte esterase (LE). Reference tests included joint fluid/serum analysis or tissue analysis (ESR/CRP level, cell count, culture, frozen section), which defined the MSIS criteria for PJI. Primary outcomes of interest were sensitivity and specificity, and secondary outcomes of interest included positive predictive value (PPV), negative predictive value (NPV), positive likelihood ratio (+LR), and negative likelihood ratio (–LR). Randomized controlled trials and controlled cohort studies in humans published within the past 10 years were included.
Results
Our full-text review yielded 15 papers that met our study inclusion criteria (Figure 1).
α-Defensin
One of the novel synovial biomarkers that has shown significant promise in diagnosing PJIs, even with difficult-to-detect organisms, is AD.
AD has shown even more impressive results as a biomarker for PJI in the hip and knee, where infection with low virulence organism is less common. In 2014, Deirmengian and colleagues6 conducted a prospective clinical study of 149 patients who underwent revision THA or TKA for aseptic loosening (n = 112) or PJI (n = 37) as defined by MSIS criteria. Aseptic loosening was diagnosed when there was no identifiable reason for pain, and MSIS criteria were not met. Synovial fluid aspirates were collected before or during surgery. AD correctly identified 143 of the 149 patients with confirmed infection with sensitivity of 97.3% (95% confidence interval [CI], 85.8%-99.6%) and specificity of 95.5% (95% CI, 89.9%-98.5%). Similarly, Bingham and colleagues7 conducted a retrospective clinical study of 61 assays done on 57 patients who underwent revision arthroplasty for PJI as defined by MSIS criteria. Synovial fluid aspirates were collected before or during surgery. AD correctly identified all 19 PJIs with sensitivity of 100% (95% CI, 79%-100%) and specificity of 95% (95% CI, 83%-99%). Sensitivity and specificity of the AD assay more accurately predicted infection than synovial cell count or serum ESR/CRP level did.
These results are supported by another prospective study by Deirmengian and colleagues8 differentiating aseptic failures and PJIs in THA or TKA. The sensitivity and specificity of AD in diagnosing PJI were 100% (95% CI, 85.05%-100%).
In a prospective study of 102 patients who underwent revision THA or TKA secondary to aseptic loosening or PJI, Frangiamore and colleagues9 also demonstrated the value of AD as a diagnostic for PJI in primary and revision hip and knee arthroplasty.
Table 1 and Figure 2 provide a concise review of the findings of each study.
Interleukin 6
Another synovial fluid biomarker that has shown promise in PJI diagnosis is IL-6. In 2015, Frangiamore and colleagues10 conducted a prospective clinical study of 32 patients who underwent revision TSA. Synovial fluid aspiration was obtained before or during surgery. MSIS criteria were used to establish the diagnosis of PJI. IL-6 had sensitivity of 87% and specificity of 90%, with +LR of 8.45 and –LR of 0.15 in predicting PJI. Synovial fluid IL-6 had strong associations with frozen section histology and growth of P acnes. Frangiamore and colleagues10 recommended an ideal IL-6 cutoff of 359.1 pg/mL and reported that, though not as accurate as AD, synovial fluid IL-6 levels can help predict positive cultures in patients who undergo revision TSA.
Lenski and Scherer11 conducted another retrospective clinical study of the diagnostic value of IL-6 in PJI.
Randau and colleagues12 conducted a prospective clinical study of 120 patients who presented with painful THA or TKA and underwent revision for PJI, aseptic failure, or aseptic revision without signs of infection or loosening. Synovial fluid aspirate was collected before or during surgery.
Table 2 and Figure 3 provide a concise review of the findings of each study.
Leukocyte Esterase
LE strips are an inexpensive screening tool for PJI, according to some studies. In a prospective clinical study of 364 endoprosthetic joint (hip, knee, shoulder) interventions, Guenther and colleagues13 collected synovial fluid before surgery. Samples were tested with graded LE strips using PJI criteria set by the authors. Results were correlated with preoperative synovial fluid aspirations, serum CRP level, serum WBC count, and intraoperative histopathologic and microbiological findings. Whereas 293 (93.31%) of the 314 aseptic cases had negative test strip readings, 100% of the 50 infected cases were positive. LE had sensitivity of 100%, specificity of 96.5%, PPV of 82%, and NPV of 100%.
Wetters et al14 performed a prospective clinical study on 223 patients who underwent TKAs and THAs for suspected PJI based on having criteria defined by the authors of the study. Synovial fluid samples were collected either preoperatively or intraoperatively.
Other authors have reported different findings that LE is an unreliable marker in PJI diagnosis. In one prospective clinical study of 85 patients who underwent primary or revision TSA, synovial fluid was collected during surgery.15 According to MSIS criteria, only 5 positive LE results predicted PJI among 21 primary and revision patients with positive cultures. Of the 7 revision patients who met the MSIS criteria for PJI, only 2 had a positive LE test. LE had sensitivity of 28.6%, specificity of 63.6%, PPV of 28.6%, and NPV of 87.5%. Six of the 7 revision patients grew P acnes. These results showed that LE was unreliable in detecting shoulder PJI.15
In another prospective clinical study, Tischler and colleagues16 enrolled 189 patients who underwent revision TKA or THA for aseptic failure or PJI as defined by the MSIS criteria. Synovial fluid was collected intraoperatively.
Table 3 and Figure 4 provide a concise review of the findings of each study.
Polymerase Chain Reaction
Studies have found that PCR analysis of synovial fluid is effective in detecting bacteria on the surface of implants removed during revision arthroplasties. Comparison of the 16S rRNA gene sequences of bacterial genomes showed a diverse range of bacterial species within biofilms on the surface of clinical and subclinical infections.17 These findings, along with those of other studies, suggest that PCR analysis of synovial fluid is useful in diagnosing PJI and identifying organisms and their sensitivities to antibiotics.
Gallo and colleagues18 performed a prospective clinical study on 115 patients who underwent revision TKAs or THAs. Synovial fluid was collected intraoperatively. PCR assays targeting the 16S rDNA were carried out on 101 patients. PJIs were classified based on criteria of the authors of this study, of which there were 42. The sensitivity, specificity, PPV, NPV, +LR, and -LR for PCR were 71.4% (95% CI, 61.5%-75.5%), 97% (95% CI, 91.7%-99.1%), 92.6% (95% CI, 79.8%-97.9%), 86.5% (95% CI, 81.8%-88.4%), 23.6 (95% CI, 5.9%-93.8%), and 0.29 (95% CI, 0.17%-0.49%), respectively. Of note the most common organism detected in 42 PJIs was coagulase-negative Staphylococcus.
Marin and colleagues19 conducted a prospective study of 122 patients who underwent arthroplasty for suspected infection or aseptic loosening as defined by the authors’ clinicohistopathologic criteria. Synovial fluid and biopsy specimens were collected during surgery, and 40 patients met the infection criteria. The authors concluded that 16S PCR is more specific and has better PPV than culture does as one positive 16S PCR resulted in a specificity and PPV of PJI of 96.3% and 91.7%, respectively. However, they noted that culture was more sensitive in diagnosing PJI.
Jacovides and colleagues20 conducted a prospective study on 82 patients undergoing primary TKA, revision TKA, and revision THA.
The low PCR sensitivities reported in the literature were explained in a review by Hartley and Harris.21 They wrote that BR 16S rDNA and sequencing of PJI samples inherently have low sensitivity because of the contamination that can occur from the PCR reagents themselves or from sample mishandling. Techniques that address contaminant (extraneous DNA) removal, such as ultraviolet irradiation and DNase treatment, reduce Taq DNA polymerase activity, which reduces PCR sensitivity.
Table 4 and Figure 5 provide a concise review of the findings of each study.
Discussion
Although there is no gold standard for the diagnosis of PJIs, several clinical and laboratory criteria guidelines are currently used to help clinicians diagnose infections of prosthetic joints. However, despite standardization of diagnostic criteria, PJI continue to be a diagnostic challenge.
AD is a highly sensitive and specific synovial fluid biomarker in detecting common PJIs.
In summary, 5 AD studies5-9 had sensitivity ranging from 63% to 100% and specificity ranging from 95% to 100%; 3 IL-6 studies10-12 had sensitivity ranging from 46.8% to 90.9% and specificity ranging from 85.7% to 97.6%; 4 LE studies13-16 had sensitivity ranging from 28.6% to 100% and specificity ranging from 63.6% to 96.5%; and 3 PCR studies18-20 had sensitivity ranging from 67.1% to 95.7% and specificity ranging from 12.3% to 97.8%. Sensitivity and specificity were consistently higher for AD than for IL-6, LE, and PCR, though there was significant overlap, heterogeneity, and variation across all the included studies.
Although the overall incidence of PJI is low, infected revisions remain a substantial financial burden to hospitals, as annual costs of infected revisions is estimated to exceed $1.62 billion by 2020.25 The usefulness of novel biomarkers and PCR in diagnosing PJI can be found in their ability to diagnose infections and facilitate appropriate early treatment. Several of these tests are readily available commercially and have the potential to be cost-effective diagnostic tools. The price to perform an AD test from Synovasure TM (Zimmer Biomet) ranges from $93 to $143. LE also provides an economic option for diagnosing PJI, as LE strips are commercially available for the cost of about 25 cents. PCR has also become an economic option, as costs can average $15.50 per sample extraction or PCR assay and $42.50 per amplicon sequence as reported in a study by Vandercam and colleagues.26 Future studies are needed to determine a diagnostic algorithm which incorporates these novel synovial markers to improve diagnostic accuracy of PJI in the most cost effective manner.
The current literature supports that AD can potentially be used to screen for PJI. Our findings suggest novel synovial fluid biomarkers may become of significant diagnostic use when combined with current laboratory and clinical diagnostic criteria. We recommend use of AD in cases in which pain, stiffness, and poor TJA outcome cannot be explained by errors in surgical technique, and infection is suspected despite MSIS criteria not being met.
The studies reviewed in this manuscript were limited in that none presented level I evidence (12 had level II evidence, and 3 had level III evidence), and there was significant heterogeneity (some studies used their own diagnostic standard, and others used the MSIS criteria). Larger scale prospective studies comparing serum ESR/CRP level and synovial fluid analysis to novel synovial markers are needed.
Am J Orthop. 2017;46(4):190-198. Copyright Frontline Medical Communications Inc. 2017. All rights reserved.
1. Maradit Kremers H, Larson DR, Crowson CS, et al. Prevalence of total hip and knee replacement in the United States. J Bone Joint Surg Am. 2015;97(17):1386-1397.
2. Kurtz S, Ong K, Lau E, Mowat F, Halpern M. Projections of primary and revision hip and knee arthroplasty in the United States from 2005 to 2030. J Bone Joint Surg Am. 2007;89(4):780-785.
3. Sharkey PF, Lichstein PM, Shen C, Tokarski AT, Parvizi J. Why are total knee arthroplasties failing today—has anything changed after 10 years? J Arthroplasty. 2014;29(9):1774-1778.
4. Butler-Wu SM, Burns EM, Pottinger PS, et al. Optimization of periprosthetic culture for diagnosis of Propionibacterium acnes prosthetic joint infection. J Clin Microbiol. 2011;49(7):2490-2495.
5. Frangiamore SJ, Saleh A, Grosso MJ, et al. α-Defensin as a predictor of periprosthetic shoulder infection. J Shoulder Elbow Surg. 2015;24(7):1021-1027.
6. Deirmengian C, Kardos K, Kilmartin P, Cameron A, Schiller K, Parvizi J. Combined measurement of synovial fluid α-defensin and C-reactive protein levels: highly accurate for diagnosing periprosthetic joint infection. J Bone Joint Surg Am. 2014;96(17):1439-1445.
7. Bingham J, Clarke H, Spangehl M, Schwartz A, Beauchamp C, Goldberg B. The alpha defensin-1 biomarker assay can be used to evaluate the potentially infected total joint arthroplasty. Clin Orthop Relat Res. 2014;472(12):4006-4009.
8. Deirmengian C, Kardos K, Kilmartin P, et al. The alpha-defensin test for periprosthetic joint infection outperforms the leukocyte esterase test strip. Clin Orthop Relat Res. 2015;473(1):198-203.
9. Frangiamore SJ, Gajewski ND, Saleh A, Farias-Kovac M, Barsoum WK, Higuera CA. α-Defensin accuracy to diagnose periprosthetic joint infection—best available test? J Arthroplasty. 2016;31(2):456-460.
10. Frangiamore SJ, Saleh A, Kovac MF, et al. Synovial fluid interleukin-6 as a predictor of periprosthetic shoulder infection. J Bone Joint Surg Am. 2015;97(1):63-70.
11. Lenski M, Scherer MA. Synovial IL-6 as inflammatory marker in periprosthetic joint infections. J Arthroplasty. 2014;29(6):1105-1109.
12. Randau TM, Friedrich MJ, Wimmer MD, et al. Interleukin-6 in serum and in synovial fluid enhances the differentiation between periprosthetic joint infection and aseptic loosening. PLoS One. 2014;9(2):e89045.
13. Guenther D, Kokenge T, Jacobs O, et al. Excluding infections in arthroplasty using leucocyte esterase test. Int Orthop. 2014;38(11):2385-2390.
14. Wetters NG, Berend KR, Lombardi AV, Morris MJ, Tucker TL, Della Valle CJ. Leukocyte esterase reagent strips for the rapid diagnosis of periprosthetic joint infection. J Arthroplasty. 2012;27(8 suppl):8-11.
15. Nelson GN, Paxton ES, Narzikul A, Williams G, Lazarus MD, Abboud JA. Leukocyte esterase in the diagnosis of shoulder periprosthetic joint infection. J Shoulder Elbow Surg. 2015;24(9):1421-1426.
16. Tischler EH, Cavanaugh PK, Parvizi J. Leukocyte esterase strip test: matched for Musculoskeletal Infection Society criteria. J Bone Joint Surg Am. 2014;96(22):1917-1920.
17. Dempsey KE, Riggio MP, Lennon A, et al. Identification of bacteria on the surface of clinically infected and non-infected prosthetic hip joints removed during revision arthroplasties by 16S rRNA gene sequencing and by microbiological culture. Arthritis Res Ther. 2007;9(3):R46.
18. Gallo J, Kolar M, Dendis M, et al. Culture and PCR analysis of joint fluid in the diagnosis of prosthetic joint infection. New Microbiol. 2008;31(1):97-104.
19. Marin M, Garcia-Lechuz JM, Alonso P, et al. Role of universal 16S rRNA gene PCR and sequencing in diagnosis of prosthetic joint infection. J Clin Microbiol. 2012;50(3):583-589.
20. Jacovides CL, Kreft R, Adeli B, Hozack B, Ehrlich GD, Parvizi J. Successful identification of pathogens by polymerase chain reaction (PCR)-based electron spray ionization time-of-flight mass spectrometry (ESI-TOF-MS) in culture-negative periprosthetic joint infection. J Bone Joint Surg Am. 2012;94(24):2247-2254.
21. Hartley JC, Harris KA. Molecular techniques for diagnosing prosthetic joint infections. J Antimicrob Chemother. 2014;69(suppl 1):i21-i24.
22. Zappe B, Graf S, Ochsner PE, Zimmerli W, Sendi P. Propionibacterium spp. in prosthetic joint infections: a diagnostic challenge. Arch Orthop Trauma Surg. 2008;128(10):1039-1046.
23. Rasouli MR, Harandi AA, Adeli B, Purtill JJ, Parvizi J. Revision total knee arthroplasty: infection should be ruled out in all cases. J Arthroplasty. 2012;27(6):1239-1243.e1-e2.
24. Hunt RW, Bond MJ, Pater GD. Psychological responses to cancer: a case for cancer support groups. Community Health Stud. 1990;14(1):35-38.
25. Kurtz SM, Lau E, Schmier J, Ong KL, Zhao K, Parvizi J. Infection burden for hip and knee arthroplasty in the United States. J Arthroplasty. 2008;23(7):984-991.
26. Vandercam B, Jeumont S, Cornu O, et al. Amplification-based DNA analysis in the diagnosis of prosthetic joint infection. J Mol Diagn. 2008;10(6):537-543.
Traumatic Anterior Shoulder Instability: The US Military Experience
Take-Home Points
- Arthroscopic stabilization performed early results in better outcomes in patients with Bankart lesions.
- A subcritical level of bone loss of 13.5% has been shown to have a significant effect on outcomes, in addition to the established “critical amount”.
- Bone loss is a bipolar issue. Both sides must be considered in order to properly address shoulder instability.
- Off-track measurement has been shown to be even more positively predictive of outcomes than glenoid bone loss assessment.
- There are several bone loss management options including, the most common coracoid transfer, as well as distal tibial allograft and distal clavicular autograft.
Given its relatively young age, high activity level, and centralized medical care system, the US military population is ideal for studying traumatic anterior shoulder instability. There is a long history of military surgeons who have made significant contributions that have advanced our understanding of this pathology and its treatment and results. In this article, we describe the scope, treatment, and results of this pathology in the US military population.
Incidence and Pathology
At the United States Military Academy (USMA), Owens and colleagues1 studied the incidence of shoulder instability, including dislocation and subluxation, and found anterior instability events were far more common than in civilian populations. The incidence of shoulder instability was 0.08 per 1000 person-years in the general US population vs 1.69 per 1000 person-years in US military personnel. The factors associated with increased risk of shoulder instability injury in the military population were male sex, white race, junior enlisted rank, and age under 30 years. Owens and colleagues2 noted that subluxation accounted for almost 85% of the total anterior instability events. Owens and colleagues3 found the pathology in subluxation events was similar to that in full dislocations, with a soft-tissue anterior Bankart lesion and a Hill-Sachs lesion detected on magnetic resonance imaging in more than 90% of patients. In another study at the USMA, DeBerardino and colleagues4 noted that 97% of arthroscopically assessed shoulders in first-time dislocators involved complete detachment of the capsuloligamentous complex from the anterior glenoid rim and neck—a so-called Bankart lesion. Thus, in a military population, anterior instability resulting from subluxation or dislocation is a common finding that is often represented by a soft-tissue Bankart lesion and a Hill-Sachs defect.
Natural History of Traumatic Anterior Shoulder Instability in the Military
Several studies have evaluated the outcomes of nonoperative and operative treatment of shoulder instability. Although most have found better outcomes with operative intervention, Aronen and Regan5 reported good results (25% recurrence at nearly 3-year follow-up) with nonoperative treatment and adherence to a strict rehabilitation program. Most other comparative studies in this population have published contrary results. Wheeler and colleagues6 studied the natural history of anterior shoulder dislocations in a USMA cadet cohort and found recurrent instability after shoulder dislocation in 92% of cadets who had nonoperative treatment. Similarly, DeBerardino and colleagues4 found that, in the USMA, 90% of first-time traumatic anterior shoulder dislocations managed nonoperatively experienced recurrent instability. In a series of Army soldiers with shoulder instability, Bottoni and colleagues7 reported that 75% of nonoperatively managed patients had recurrent instability, and, of these, 67% progressed to surgical intervention. Nonoperative treatment for a first-time dislocation is still reasonable if a cadet or soldier needs to quickly return to functional duties. Athletes who develop shoulder instability during their playing season have been studied in a military population as well. In a multicenter study of service academy athletes with anterior instability, Dickens and colleagues8 found that, with conservative management and accelerated rehabilitation of in-season shoulder instability, 73% of athletes returned to sport by a mean of 5 days. However, the durability of this treatment should be questioned, as 64% later experienced recurrence.
Arthroscopic Stabilization of Acute Anterior Shoulder Dislocations
In an early series of cases of traumatic anterior shoulder instability in USMA cadets, Wheeler and colleagues6 found that, at 14 months, 78% of arthroscopically stabilized cases and 92% of nonoperatively treated cases were successful. Then, in the 1990s, DeBerardino and colleagues4 studied a series of young, active patients in the USMA and noted significantly better results with arthroscopic treatment, vs nonoperative treatment, at 2- to 5-year follow-up. Of the arthroscopically treated shoulders, 88% remained stable during the study and returned to preinjury activity levels, and 12% experienced recurrent instability (risk factors included 2+ sulcus sign, poor capsular labral tissue, and history of bilateral shoulder instability). In a long-term follow-up (mean, 11.7 years; range, 9.1-13.9 years) of the same cohort, Owens and colleagues9 found that 14% of patients available for follow-up had undergone revision stabilization surgery, and, of these, 21% reported experiencing subluxation events. The authors concluded that, in first-time dislocators in this active military population, acute arthroscopic Bankart repair resulted in excellent return to athletics and subjective function, and had acceptable recurrence and reoperation rates. Bottoni and colleagues,7 in a prospective, randomized evaluation of arthroscopic stabilization of acute, traumatic, first-time shoulder dislocations in the Army, noted an 89% success rate for arthroscopic treatment at an average follow-up of 36 months, with no recurrent instability. DeBerardino and colleagues10 compared West Point patients treated nonoperatively with those arthroscopically treated with staples, transglenoid sutures, or bioabsorbable anchors. Recurrence rates were 85% for nonoperative treatment, 22% for staples, 14% for transglenoid sutures, and 10% for bioabsorbable anchors.
Arthroscopic Versus Open Stabilization of Anterior Shoulder Instability
In a prospective, randomized clinical trial comparing open and arthroscopic shoulder stabilization for recurrent anterior instability in active-duty Army personnel, Bottoni and colleagues11 found comparable clinical outcomes. Stabilization surgery failed clinically in only 3 cases, 2 open and 1 arthroscopic. The authors concluded that arthroscopic stabilization can be safely performed for recurrent shoulder instability and that arthroscopic outcomes are similar to open outcomes. In a series of anterior shoulder subluxations in young athletes with Bankart lesions, Owens and colleagues12 found that open and arthroscopic stabilization performed early resulted in better outcomes, regardless of technique used. Recurrent subluxation occurred at a mean of 17 months in 3 of the 10 patients in the open group and 3 of the 9 patients in the arthroscopic group, for an overall recurrence rate of 31%. The authors concluded that, in this patient population with Bankart lesions caused by anterior subluxation events, surgery should be performed early.
Bone Lesions
Burkhart and De Beer13 first noted that bone loss has emerged as one of the most important considerations in the setting of shoulder instability in active patients. Other authors have found this to be true in military populations.14,15
The diagnosis of bone loss may include historical findings, such as increased number and ease of dislocations, as well as dislocation in lower positions of abduction. Physical examination findings may include apprehension in the midrange of motion. Advanced imaging, such as magnetic resonance arthrography, has since been validated as equivalent to 3-dimensional computed tomography (3-D CT) in determining glenoid bone loss.16 In 2007, Mologne and colleagues15 studied the amount of glenoid bone loss and the presence of fragmented bone or attritional bone loss and its effect on outcomes. They evaluated 21 patients who had arthroscopic treatment for anterior instability with anteroinferior glenoid bone loss between 20% and 30%. Average follow-up was 34 months. All patients received 3 or 4 anterior anchors. No patient with a bone fragment incorporated into the repair experienced recurrence or subluxation, whereas 30% of patients with attritional bone loss had recurrent instability.15
Classifying Bone Loss and Recognizing Its Effects
Burkhart and De Beer13 helped define the role and significance of bone loss in the setting of shoulder instability. They defined significant bone loss as an engaging Hill-Sachs lesion of the humerus in an abducted and externally rotated position or an “inverted pear” lesion of the glenoid. Overall analysis revealed recurrence in 4% of cases without significant bone loss and 65% of cases with significant bone loss. In a subanalysis of contact-sport athletes in the setting of bone loss, the failure rate increased to 89%, from 6.5%. Aiding in the quantitative assessment of glenoid bone loss, Itoi and colleagues17 showed that 21% glenoid bone loss resulted in instability that would not be corrected by a soft-tissue procedure alone. Bone loss of 20% to 25% has since been considered a “critical amount,” above which an arthroscopic Bankart has been questioned. More recently, several authors have shown that even less bone loss can have a significant effect on outcomes. Shaha and colleagues18 established that a subcritical level of bone loss (13.5%) on the anteroinferior glenoid resulted in clinical failure (as determined with the Western Ontario Shoulder Instability Index) even in cases in which frank recurrence or subluxation was avoided. It is thought that, in recurrent instability, glenoid bone loss incident rate is as high as 90%, and the corresponding percentage of patients with Hill-Sachs lesions is almost 100%.19,20 Thus, it is increasingly understood that bone loss is a bipolar issue and that both sides must be considered in order to properly address shoulder instability in this setting. In 2007, Yamamoto and colleagues21 introduced the glenoid track, a method for predicting whether a Hill-Sachs lesion will engage. Di Giacomo and colleagues22 refined the track concept to quantitatively determine which lesions will engage in the setting of both glenoid and humeral bone loss. Metzger and colleagues,23 confirming the track concept arthroscopically, found that manipulation with anesthesia and arthroscopic visualization was well predicted by preoperative track measurements, and thus these measurements can be a good guide for surgical management (Figures 1A, 1B). 

Strategies for Addressing Bone Loss in Anterior Shoulder Instability
Several approaches for managing bone loss in shoulder instability have been described—the most common being coracoid transfer (Latarjet procedure). Waterman and colleagues25 recently studied the effects of coracoid transfer, distal tibial allograft, and iliac crest augmentation on anterior shoulder instability in US military patients treated between 2006 and 2012. Of 64 patients who underwent a bone block procedure, 16 (25%) had a complication during short-term follow-up. Complications included neurologic injury, pain, infection, hardware failure, and recurrent instability. 

Conclusion
Traumatic anterior shoulder instability is a common pathology that continues to significantly challenge the readiness of the US military. Military surgeon-researchers have a long history of investigating approaches to the treatment of this pathology—applying good science to a large controlled population, using a single medical record, and demonstrating a commitment to return service members to the ready defense of the nation.
Am J Orthop. 2017;46(4):184-189. Copyright Frontline Medical Communications Inc. 2017. All rights reserved.
1. Owens BD, Dawson L, Burks R, Cameron KL. Incidence of shoulder dislocation in the United States military: demographic considerations from a high-risk population. J Bone Joint Surg Am. 2009;91(4):791-796.
2. Owens BD, Duffey ML, Nelson BJ, DeBerardino TM, Taylor DC, Mountcastle SB. The incidence and characteristics of shoulder instability at the United States Military Academy. Am J Sports Med. 2007;35(7):1168-1173.
3. Owens BD, Nelson BJ, Duffey ML, et al. Pathoanatomy of first-time, traumatic, anterior glenohumeral subluxation events. J Bone Joint Surg Am. 2010;92(7):1605-1611.
4. DeBerardino TM, Arciero RA, Taylor DC, Uhorchak JM. Prospective evaluation of arthroscopic stabilization of acute, initial anterior shoulder dislocations in young athletes. Two- to five-year follow-up. Am J Sports Med. 2001;29(5):586-592.
5. Aronen JG, Regan K. Decreasing the incidence of recurrence of first time anterior shoulder dislocations with rehabilitation. Am J Sports Med. 1984;12(4):283-291.
6. Wheeler JH, Ryan JB, Arciero RA, Molinari RN. Arthroscopic versus nonoperative treatment of acute shoulder dislocations in young athletes. Arthroscopy. 1989;5(3):213-217.
7. Bottoni CR, Wilckens JH, DeBerardino TM, et al. A prospective, randomized evaluation of arthroscopic stabilization versus nonoperative treatment in patients with acute, traumatic, first-time shoulder dislocations. Am J Sports Med. 2002;30(4):576-580.
8. Dickens JF, Owens BD, Cameron KL, et al. Return to play and recurrent instability after in-season anterior shoulder instability: a prospective multicenter study. Am J Sports Med. 2014;42(12):2842-2850.
9. Owens BD, DeBerardino TM, Nelson BJ, et al. Long-term follow-up of acute arthroscopic Bankart repair for initial anterior shoulder dislocations in young athletes. Am J Sports Med. 2009;37(4):669-673.
10. DeBerardino TM, Arciero RA, Taylor DC. Arthroscopic stabilization of acute initial anterior shoulder dislocation: the West Point experience. J South Orthop Assoc. 1996;5(4):263-271.
11. Bottoni CR, Smith EL, Berkowitz MJ, Towle RB, Moore JH. Arthroscopic versus open shoulder stabilization for recurrent anterior instability: a prospective randomized clinical trial. Am J Sports Med. 2006;34(11):1730-1737.
12. Owens BD, Cameron KL, Peck KY, et al. Arthroscopic versus open stabilization for anterior shoulder subluxations. Orthop J Sports Med. 2015;3(1):2325967115571084.
13. Burkhart SS, De Beer JF. Traumatic glenohumeral bone defects and their relationship to failure of arthroscopic Bankart repairs: significance of the inverted-pear glenoid and the humeral engaging Hill-Sachs lesion. Arthroscopy. 2000;16(7):677-694.14. Shaha JS, Cook JB, Rowles DJ, Bottoni CR, Shaha SH, Tokish JM. Clinical validation of the glenoid track concept in anterior glenohumeral instability. J Bone Joint Surg Am. 2016;98(22):1918-1923.
15. Mologne TS, Provencher MT, Menzel KA, Vachon TA, Dewing CB. Arthroscopic stabilization in patients with an inverted pear glenoid: results in patients with bone loss of the anterior glenoid. Am J Sports Med. 2007;35(8):1276-1283.
16. Markenstein JE, Jaspars KC, van der Hulst VP, Willems WJ. The quantification of glenoid bone loss in anterior shoulder instability; MR-arthro compared to 3D-CT. Skeletal Radiol. 2014;43(4):475-483.
17. Itoi E, Lee SB, Berglund LJ, Berge LL, An KN. The effect of a glenoid defect on anteroinferior stability of the shoulder after Bankart repair: a cadaveric study. J Bone Joint Surg Am. 2000;82(1):35-46.
18. Shaha JS, Cook JB, Song DJ, et al. Redefining “critical” bone loss in shoulder instability: functional outcomes worsen with “subcritical” bone loss. Am J Sports Med. 2015;43(7):1719-1725.
19. Piasecki DP, Verma NN, Romeo AA, Levine WN, Bach BR Jr, Provencher MT. Glenoid bone deficiency in recurrent anterior shoulder instability: diagnosis and management. J Am Acad Orthop Surg. 2009;17(8):482-493.
20. Provencher MT, Frank RM, Leclere LE, et al. The Hill-Sachs lesion: diagnosis, classification, and management. J Am Acad Orthop Surg. 2012;20(4):242-252.
21. Yamamoto N, Itoi E, Abe H, et al. Contact between the glenoid and the humeral head in abduction, external rotation, and horizontal extension: a new concept of glenoid track. J Shoulder Elbow Surg. 2007;16(5):649-656.
22. Di Giacomo G, Itoi E, Burkhart SS. Evolving concept of bipolar bone loss and the Hill-Sachs lesion: from “engaging/non-engaging” lesion to “on-track/off-track” lesion. Arthroscopy. 2014;30(1):90-98.
23. Metzger PD, Barlow B, Leonardelli D, Peace W, Solomon DJ, Provencher MT. Clinical application of the “glenoid track” concept for defining humeral head engagement in anterior shoulder instability: a preliminary report. Orthop J Sports Med. 2013;1(2):2325967113496213.
24. Arciero RA, Parrino A, Bernhardson AS, et al. The effect of a combined glenoid and Hill-Sachs defect on glenohumeral stability: a biomechanical cadaveric study using 3-dimensional modeling of 142 patients. Am J Sports Med. 2015;43(6):1422-1429.
25. Waterman BR, Chandler PJ, Teague E, Provencher MT, Tokish JM, Pallis MP. Short-term outcomes of glenoid bone block augmentation for complex anterior shoulder instability in a high-risk population. Arthroscopy. 2016;32(9):1784-1790.
26. Schroder DT, Provencher MT, Mologne TS, Muldoon MP, Cox JS. The modified Bristow procedure for anterior shoulder instability: 26-year outcomes in Naval Academy midshipmen. Am J Sports Med. 2006;34(5):778-786.
27. Provencher MT, Frank RM, Golijanin P, et al. Distal tibia allograft glenoid reconstruction in recurrent anterior shoulder instability: clinical and radiographic outcomes. Arthroscopy. 2017;33(5):891-897.
28. Tokish JM, Fitzpatrick K, Cook JB, Mallon WJ. Arthroscopic distal clavicular autograft for treating shoulder instability with glenoid bone loss. Arthrosc Tech. 2014;3(4):e475-e481.
Take-Home Points
- Arthroscopic stabilization performed early results in better outcomes in patients with Bankart lesions.
- A subcritical level of bone loss of 13.5% has been shown to have a significant effect on outcomes, in addition to the established “critical amount”.
- Bone loss is a bipolar issue. Both sides must be considered in order to properly address shoulder instability.
- Off-track measurement has been shown to be even more positively predictive of outcomes than glenoid bone loss assessment.
- There are several bone loss management options including, the most common coracoid transfer, as well as distal tibial allograft and distal clavicular autograft.
Given its relatively young age, high activity level, and centralized medical care system, the US military population is ideal for studying traumatic anterior shoulder instability. There is a long history of military surgeons who have made significant contributions that have advanced our understanding of this pathology and its treatment and results. In this article, we describe the scope, treatment, and results of this pathology in the US military population.
Incidence and Pathology
At the United States Military Academy (USMA), Owens and colleagues1 studied the incidence of shoulder instability, including dislocation and subluxation, and found anterior instability events were far more common than in civilian populations. The incidence of shoulder instability was 0.08 per 1000 person-years in the general US population vs 1.69 per 1000 person-years in US military personnel. The factors associated with increased risk of shoulder instability injury in the military population were male sex, white race, junior enlisted rank, and age under 30 years. Owens and colleagues2 noted that subluxation accounted for almost 85% of the total anterior instability events. Owens and colleagues3 found the pathology in subluxation events was similar to that in full dislocations, with a soft-tissue anterior Bankart lesion and a Hill-Sachs lesion detected on magnetic resonance imaging in more than 90% of patients. In another study at the USMA, DeBerardino and colleagues4 noted that 97% of arthroscopically assessed shoulders in first-time dislocators involved complete detachment of the capsuloligamentous complex from the anterior glenoid rim and neck—a so-called Bankart lesion. Thus, in a military population, anterior instability resulting from subluxation or dislocation is a common finding that is often represented by a soft-tissue Bankart lesion and a Hill-Sachs defect.
Natural History of Traumatic Anterior Shoulder Instability in the Military
Several studies have evaluated the outcomes of nonoperative and operative treatment of shoulder instability. Although most have found better outcomes with operative intervention, Aronen and Regan5 reported good results (25% recurrence at nearly 3-year follow-up) with nonoperative treatment and adherence to a strict rehabilitation program. Most other comparative studies in this population have published contrary results. Wheeler and colleagues6 studied the natural history of anterior shoulder dislocations in a USMA cadet cohort and found recurrent instability after shoulder dislocation in 92% of cadets who had nonoperative treatment. Similarly, DeBerardino and colleagues4 found that, in the USMA, 90% of first-time traumatic anterior shoulder dislocations managed nonoperatively experienced recurrent instability. In a series of Army soldiers with shoulder instability, Bottoni and colleagues7 reported that 75% of nonoperatively managed patients had recurrent instability, and, of these, 67% progressed to surgical intervention. Nonoperative treatment for a first-time dislocation is still reasonable if a cadet or soldier needs to quickly return to functional duties. Athletes who develop shoulder instability during their playing season have been studied in a military population as well. In a multicenter study of service academy athletes with anterior instability, Dickens and colleagues8 found that, with conservative management and accelerated rehabilitation of in-season shoulder instability, 73% of athletes returned to sport by a mean of 5 days. However, the durability of this treatment should be questioned, as 64% later experienced recurrence.
Arthroscopic Stabilization of Acute Anterior Shoulder Dislocations
In an early series of cases of traumatic anterior shoulder instability in USMA cadets, Wheeler and colleagues6 found that, at 14 months, 78% of arthroscopically stabilized cases and 92% of nonoperatively treated cases were successful. Then, in the 1990s, DeBerardino and colleagues4 studied a series of young, active patients in the USMA and noted significantly better results with arthroscopic treatment, vs nonoperative treatment, at 2- to 5-year follow-up. Of the arthroscopically treated shoulders, 88% remained stable during the study and returned to preinjury activity levels, and 12% experienced recurrent instability (risk factors included 2+ sulcus sign, poor capsular labral tissue, and history of bilateral shoulder instability). In a long-term follow-up (mean, 11.7 years; range, 9.1-13.9 years) of the same cohort, Owens and colleagues9 found that 14% of patients available for follow-up had undergone revision stabilization surgery, and, of these, 21% reported experiencing subluxation events. The authors concluded that, in first-time dislocators in this active military population, acute arthroscopic Bankart repair resulted in excellent return to athletics and subjective function, and had acceptable recurrence and reoperation rates. Bottoni and colleagues,7 in a prospective, randomized evaluation of arthroscopic stabilization of acute, traumatic, first-time shoulder dislocations in the Army, noted an 89% success rate for arthroscopic treatment at an average follow-up of 36 months, with no recurrent instability. DeBerardino and colleagues10 compared West Point patients treated nonoperatively with those arthroscopically treated with staples, transglenoid sutures, or bioabsorbable anchors. Recurrence rates were 85% for nonoperative treatment, 22% for staples, 14% for transglenoid sutures, and 10% for bioabsorbable anchors.
Arthroscopic Versus Open Stabilization of Anterior Shoulder Instability
In a prospective, randomized clinical trial comparing open and arthroscopic shoulder stabilization for recurrent anterior instability in active-duty Army personnel, Bottoni and colleagues11 found comparable clinical outcomes. Stabilization surgery failed clinically in only 3 cases, 2 open and 1 arthroscopic. The authors concluded that arthroscopic stabilization can be safely performed for recurrent shoulder instability and that arthroscopic outcomes are similar to open outcomes. In a series of anterior shoulder subluxations in young athletes with Bankart lesions, Owens and colleagues12 found that open and arthroscopic stabilization performed early resulted in better outcomes, regardless of technique used. Recurrent subluxation occurred at a mean of 17 months in 3 of the 10 patients in the open group and 3 of the 9 patients in the arthroscopic group, for an overall recurrence rate of 31%. The authors concluded that, in this patient population with Bankart lesions caused by anterior subluxation events, surgery should be performed early.
Bone Lesions
Burkhart and De Beer13 first noted that bone loss has emerged as one of the most important considerations in the setting of shoulder instability in active patients. Other authors have found this to be true in military populations.14,15
The diagnosis of bone loss may include historical findings, such as increased number and ease of dislocations, as well as dislocation in lower positions of abduction. Physical examination findings may include apprehension in the midrange of motion. Advanced imaging, such as magnetic resonance arthrography, has since been validated as equivalent to 3-dimensional computed tomography (3-D CT) in determining glenoid bone loss.16 In 2007, Mologne and colleagues15 studied the amount of glenoid bone loss and the presence of fragmented bone or attritional bone loss and its effect on outcomes. They evaluated 21 patients who had arthroscopic treatment for anterior instability with anteroinferior glenoid bone loss between 20% and 30%. Average follow-up was 34 months. All patients received 3 or 4 anterior anchors. No patient with a bone fragment incorporated into the repair experienced recurrence or subluxation, whereas 30% of patients with attritional bone loss had recurrent instability.15
Classifying Bone Loss and Recognizing Its Effects
Burkhart and De Beer13 helped define the role and significance of bone loss in the setting of shoulder instability. They defined significant bone loss as an engaging Hill-Sachs lesion of the humerus in an abducted and externally rotated position or an “inverted pear” lesion of the glenoid. Overall analysis revealed recurrence in 4% of cases without significant bone loss and 65% of cases with significant bone loss. In a subanalysis of contact-sport athletes in the setting of bone loss, the failure rate increased to 89%, from 6.5%. Aiding in the quantitative assessment of glenoid bone loss, Itoi and colleagues17 showed that 21% glenoid bone loss resulted in instability that would not be corrected by a soft-tissue procedure alone. Bone loss of 20% to 25% has since been considered a “critical amount,” above which an arthroscopic Bankart has been questioned. More recently, several authors have shown that even less bone loss can have a significant effect on outcomes. Shaha and colleagues18 established that a subcritical level of bone loss (13.5%) on the anteroinferior glenoid resulted in clinical failure (as determined with the Western Ontario Shoulder Instability Index) even in cases in which frank recurrence or subluxation was avoided. It is thought that, in recurrent instability, glenoid bone loss incident rate is as high as 90%, and the corresponding percentage of patients with Hill-Sachs lesions is almost 100%.19,20 Thus, it is increasingly understood that bone loss is a bipolar issue and that both sides must be considered in order to properly address shoulder instability in this setting. In 2007, Yamamoto and colleagues21 introduced the glenoid track, a method for predicting whether a Hill-Sachs lesion will engage. Di Giacomo and colleagues22 refined the track concept to quantitatively determine which lesions will engage in the setting of both glenoid and humeral bone loss. Metzger and colleagues,23 confirming the track concept arthroscopically, found that manipulation with anesthesia and arthroscopic visualization was well predicted by preoperative track measurements, and thus these measurements can be a good guide for surgical management (Figures 1A, 1B).
Strategies for Addressing Bone Loss in Anterior Shoulder Instability
Several approaches for managing bone loss in shoulder instability have been described—the most common being coracoid transfer (Latarjet procedure). Waterman and colleagues25 recently studied the effects of coracoid transfer, distal tibial allograft, and iliac crest augmentation on anterior shoulder instability in US military patients treated between 2006 and 2012. Of 64 patients who underwent a bone block procedure, 16 (25%) had a complication during short-term follow-up. Complications included neurologic injury, pain, infection, hardware failure, and recurrent instability.
Conclusion
Traumatic anterior shoulder instability is a common pathology that continues to significantly challenge the readiness of the US military. Military surgeon-researchers have a long history of investigating approaches to the treatment of this pathology—applying good science to a large controlled population, using a single medical record, and demonstrating a commitment to return service members to the ready defense of the nation.
Am J Orthop. 2017;46(4):184-189. Copyright Frontline Medical Communications Inc. 2017. All rights reserved.
1. Owens BD, Dawson L, Burks R, Cameron KL. Incidence of shoulder dislocation in the United States military: demographic considerations from a high-risk population. J Bone Joint Surg Am. 2009;91(4):791-796.
2. Owens BD, Duffey ML, Nelson BJ, DeBerardino TM, Taylor DC, Mountcastle SB. The incidence and characteristics of shoulder instability at the United States Military Academy. Am J Sports Med. 2007;35(7):1168-1173.
3. Owens BD, Nelson BJ, Duffey ML, et al. Pathoanatomy of first-time, traumatic, anterior glenohumeral subluxation events. J Bone Joint Surg Am. 2010;92(7):1605-1611.
4. DeBerardino TM, Arciero RA, Taylor DC, Uhorchak JM. Prospective evaluation of arthroscopic stabilization of acute, initial anterior shoulder dislocations in young athletes. Two- to five-year follow-up. Am J Sports Med. 2001;29(5):586-592.
5. Aronen JG, Regan K. Decreasing the incidence of recurrence of first time anterior shoulder dislocations with rehabilitation. Am J Sports Med. 1984;12(4):283-291.
6. Wheeler JH, Ryan JB, Arciero RA, Molinari RN. Arthroscopic versus nonoperative treatment of acute shoulder dislocations in young athletes. Arthroscopy. 1989;5(3):213-217.
7. Bottoni CR, Wilckens JH, DeBerardino TM, et al. A prospective, randomized evaluation of arthroscopic stabilization versus nonoperative treatment in patients with acute, traumatic, first-time shoulder dislocations. Am J Sports Med. 2002;30(4):576-580.
8. Dickens JF, Owens BD, Cameron KL, et al. Return to play and recurrent instability after in-season anterior shoulder instability: a prospective multicenter study. Am J Sports Med. 2014;42(12):2842-2850.
9. Owens BD, DeBerardino TM, Nelson BJ, et al. Long-term follow-up of acute arthroscopic Bankart repair for initial anterior shoulder dislocations in young athletes. Am J Sports Med. 2009;37(4):669-673.
10. DeBerardino TM, Arciero RA, Taylor DC. Arthroscopic stabilization of acute initial anterior shoulder dislocation: the West Point experience. J South Orthop Assoc. 1996;5(4):263-271.
11. Bottoni CR, Smith EL, Berkowitz MJ, Towle RB, Moore JH. Arthroscopic versus open shoulder stabilization for recurrent anterior instability: a prospective randomized clinical trial. Am J Sports Med. 2006;34(11):1730-1737.
12. Owens BD, Cameron KL, Peck KY, et al. Arthroscopic versus open stabilization for anterior shoulder subluxations. Orthop J Sports Med. 2015;3(1):2325967115571084.
13. Burkhart SS, De Beer JF. Traumatic glenohumeral bone defects and their relationship to failure of arthroscopic Bankart repairs: significance of the inverted-pear glenoid and the humeral engaging Hill-Sachs lesion. Arthroscopy. 2000;16(7):677-694.14. Shaha JS, Cook JB, Rowles DJ, Bottoni CR, Shaha SH, Tokish JM. Clinical validation of the glenoid track concept in anterior glenohumeral instability. J Bone Joint Surg Am. 2016;98(22):1918-1923.
15. Mologne TS, Provencher MT, Menzel KA, Vachon TA, Dewing CB. Arthroscopic stabilization in patients with an inverted pear glenoid: results in patients with bone loss of the anterior glenoid. Am J Sports Med. 2007;35(8):1276-1283.
16. Markenstein JE, Jaspars KC, van der Hulst VP, Willems WJ. The quantification of glenoid bone loss in anterior shoulder instability; MR-arthro compared to 3D-CT. Skeletal Radiol. 2014;43(4):475-483.
17. Itoi E, Lee SB, Berglund LJ, Berge LL, An KN. The effect of a glenoid defect on anteroinferior stability of the shoulder after Bankart repair: a cadaveric study. J Bone Joint Surg Am. 2000;82(1):35-46.
18. Shaha JS, Cook JB, Song DJ, et al. Redefining “critical” bone loss in shoulder instability: functional outcomes worsen with “subcritical” bone loss. Am J Sports Med. 2015;43(7):1719-1725.
19. Piasecki DP, Verma NN, Romeo AA, Levine WN, Bach BR Jr, Provencher MT. Glenoid bone deficiency in recurrent anterior shoulder instability: diagnosis and management. J Am Acad Orthop Surg. 2009;17(8):482-493.
20. Provencher MT, Frank RM, Leclere LE, et al. The Hill-Sachs lesion: diagnosis, classification, and management. J Am Acad Orthop Surg. 2012;20(4):242-252.
21. Yamamoto N, Itoi E, Abe H, et al. Contact between the glenoid and the humeral head in abduction, external rotation, and horizontal extension: a new concept of glenoid track. J Shoulder Elbow Surg. 2007;16(5):649-656.
22. Di Giacomo G, Itoi E, Burkhart SS. Evolving concept of bipolar bone loss and the Hill-Sachs lesion: from “engaging/non-engaging” lesion to “on-track/off-track” lesion. Arthroscopy. 2014;30(1):90-98.
23. Metzger PD, Barlow B, Leonardelli D, Peace W, Solomon DJ, Provencher MT. Clinical application of the “glenoid track” concept for defining humeral head engagement in anterior shoulder instability: a preliminary report. Orthop J Sports Med. 2013;1(2):2325967113496213.
24. Arciero RA, Parrino A, Bernhardson AS, et al. The effect of a combined glenoid and Hill-Sachs defect on glenohumeral stability: a biomechanical cadaveric study using 3-dimensional modeling of 142 patients. Am J Sports Med. 2015;43(6):1422-1429.
25. Waterman BR, Chandler PJ, Teague E, Provencher MT, Tokish JM, Pallis MP. Short-term outcomes of glenoid bone block augmentation for complex anterior shoulder instability in a high-risk population. Arthroscopy. 2016;32(9):1784-1790.
26. Schroder DT, Provencher MT, Mologne TS, Muldoon MP, Cox JS. The modified Bristow procedure for anterior shoulder instability: 26-year outcomes in Naval Academy midshipmen. Am J Sports Med. 2006;34(5):778-786.
27. Provencher MT, Frank RM, Golijanin P, et al. Distal tibia allograft glenoid reconstruction in recurrent anterior shoulder instability: clinical and radiographic outcomes. Arthroscopy. 2017;33(5):891-897.
28. Tokish JM, Fitzpatrick K, Cook JB, Mallon WJ. Arthroscopic distal clavicular autograft for treating shoulder instability with glenoid bone loss. Arthrosc Tech. 2014;3(4):e475-e481.
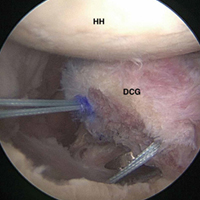
Bone Stress Injuries in the Military: Diagnosis, Management, and Prevention
Take-Home Points
- Stress injuries, specifically of the lower extremity, are very common in new military trainees.
- Stress injury can range from benign periosteal reaction to displaced fracture.
- Stress injury should be treated on a case-by-case basis, depending on the severity of injury, the location of the injury, and the likelihood of healing with nonoperative management.
- Modifiable risk factors such as nutritional status, training regiment, and even footwear should be investigated to determine potential causes of injury.
- Prevention is a crucial part of the treatment of these injuries, and early intervention such as careful pre-enrollment physicals and vitamin supplementation can be essential in lowering injury rates.
Bone stress injuries, which are common in military recruits, present in weight-bearing (WB) areas as indolent pain caused by repetitive stress and microtrauma. They were first reported in the metatarsals of Prussian soldiers in 1855.1 Today, stress injuries are increasingly common. One study estimated they account for 10% of patients seen by sports medicine practitioners.2 This injury most commonly affects military members, endurance athletes, and dancers.3-5 Specifically, the incidence of stress fractures in military members has been reported to range from 0.8% to 6.9% for men and from 3.4% to 21.0% for women.4 Because of repetitive vigorous lower extremity loading, stress fractures typically occur in the pelvis, femoral neck, tibial shaft, and metatarsals. Delayed diagnosis and the subsequent duration of treatment required for adequate healing can result in significant morbidity. In a 2009 to 2012 study of US military members, Waterman and colleagues6 found an incidence rate of 5.69 stress fractures per 1000 person-years. Fractures most frequently involved the tibia/fibula (2.26/1000), followed by the metatarsals (0.92/1000) and the femoral neck (0.49/1000).6 In addition, these injuries were most commonly encountered in new recruits, who were less accustomed to the high-volume, high-intensity training required during basic training.4,7 Enlisted junior service members have been reported to account for 77.5% of all stress fractures.6 Age under 20 years or over 40 years and white race have also been found to be risk factors for stress injury.6
The pathogenesis of stress injury is controversial. Stanitski and colleagues8 theorized that multiple submaximal mechanical insults create cumulative stress greater than bone capacity, eventually leading to fracture. Johnson9 conducted a biopsy study and postulated that an accelerated remodeling phase was responsible, whereas Friedenberg10 argued that stress injuries are a form of reduced healing, not an attempt to increase healing, caused by the absence of callous formation in the disease process.
Various other nonmodifiable and modifiable risk factors predispose military service members to stress injury. Nonmodifiable risk factors include sex, bone geometry, limb alignment, race, age, and anatomy. Lower extremity movement biomechanics resulting from dynamic limb alignment during activity may be important. Cameron and colleagues11 examined 1843 patients and found that those with knees in >5° of valgus or >5° of external rotation had higher injury rates. Although variables such as sex and limb alignment cannot be changed, proper identification of modifiable risk factors can assist with injury prevention, and nonmodifiable risk factors can help clinicians and researchers target injury prevention interventions to patients at highest risk.
Metabolic, hormonal, and nutritional status is crucial to overall bone health. Multiple studies have found that low body mass index (BMI) is a significant risk factor for stress fracture.7,12,13 Although low BMI is a concern, patients with abnormally high BMI may also be at increased risk for bone stress injury. In a recently released consensus statement on relative energy deficiency in sport (RED-S), the International Olympic Committee addressed the complex interplay of impairments in physiologic function—including metabolic rate, menstrual function, bone health, immunity, protein synthesis, and cardiovascular health—caused by relative energy deficiency.14 The committee stated that the cause of this syndrome is energy deficiency relative to the balance between dietary energy intake and energy expenditure required for health and activities of daily living, growth, and sporting activities. This finding reveals that conditions such as stress injury often may represent a much broader systemic deficit that may be influenced by a patient’s overall physiologic imbalance.
Diagnosis
History and Physical Examination
The onset of stress reaction typically is insidious, with the classic presentation being a new military recruit who is experiencing a sudden increase in pain during physical activity.15 Pain typically is initially present only during activity, and is relieved with rest, but with disease progression this evolves to pain at rest. It is crucial that the physician elicit the patient’s history of training and physical activity. Hsu and colleagues7 reported increased prevalence of overweight civilian recruits, indicating an increase in the number of new recruits having limited experience with the repetitive physical activity encountered in basic training. Stress injury should be suspected in the setting of worsening, indolent lower extremity pain that has been present for several days, especially in the higher-risk patient populations mentioned. Diet should be assessed, with specific attention given to the intake of fruits, vegetables, and foods high in vitamin D and calcium and, most important, the energy balance between intake and output.16 Special attention should also be given to female patients, who may experience the female athlete triad, a spectrum of low energy availability, menstrual dysfunction, and impaired bone turnover (high amount of resorption relative to formation). A key part of the RED-S consensus statement14 alerted healthcare providers that metabolic derangements do not solely affect female patients. These types of patients sustain a major insult to the homeostatic balance of the hormones that sustain adequate bone health. Beck and colleagues17 found that women with disrupted menstrual cycles are 2 to 4 times more likely to sustain a stress fracture than women without disrupted menstrual cycles, making this abnormality an important part of the history.
Examination should begin with careful evaluation of limb alignment and specific attention given to varus or valgus alignment of the knees.11 The feet should also be inspected, as pes planus or cavus foot may increase the risk of stress fracture.18 Identification of the area of maximal tenderness is important. The area in question may also be erythematous or warm secondary to the inflammatory response associated with attempted fracture healing. In chronic fractures in superficial areas such as the metatarsals, callus may be palpable. Although there are few specific tests for stress injury, pain may be reproducible with deep palpation and WB. 
Laboratory Testing
When a pathology is thought to have a nutritional or metabolic cause, particularly in a low-weight or underweight patient, a laboratory workup should be obtained. Specific laboratory tests that all patients should undergo are 25-hydroxyvitamin D3, complete blood cell count, and basic chemistry panel, including calcium and thyroid-stimulating hormone levels. Although not necessary for diagnosis, phosphate, parathyroid hormone, albumin, and prealbumin should also be considered. Females should undergo testing of follicle stimulating hormone, luteinizing hormone, estradiol, and testosterone and have a urine pregnancy test. In patients with signs of excessive cortisone, a dexamethasone suppression test can be administered.21 In males, low testosterone is a documented risk factor for stress injury.22
Imaging
Given their low cost and availability, plain radiographs typically are used for initial examination of a suspected stress injury. However, they often lack sensitivity, particularly in the early stages of stress fracture development (Figure 2). 
Management
Management of bone stress injury depends on many factors, including symptom duration, fracture location and severity, and risk of progression or nonunion (Table).13 
Pelvis
Pelvic stress fractures are rare and represent only 1.6% to 7.1% of all stress fractures.13,27,28 Given the low frequency, physicians must have a high index of suspicion to make the correct diagnosis. These fractures typically occur in marathon runners and other patients who present with persistent pain and a history of high levels of activity. As pelvic stress fractures typically involve the superior or inferior pubic rami, or sacrum, and are at low risk for nonunion,13 most are managed with nonoperative treatment and activity modification for 8 to 12 weeks.27
Femur
Femoral stress fractures are also relatively uncommon, accounting for about 10% of all stress fractures. Depending on their location, these fractures can be at high risk for progression, nonunion, and significant morbidity.29 Especially concerning are femoral neck stress fractures, which can involve either the tension side (lateral cortex) or the compression side (medial cortex) of the bone. Suspicion of a femoral neck stress fracture should prompt immediate NWB.5 Early recognition of these injuries is crucial because once displacement occurs, their complication and morbidity rates become high.13 Patients with compression-side fractures should undergo NWB treatment for 4 to 6 weeks and then slow progression to WB activity. Most return to light-impact activity by 3 to 4 months. By contrast, tension-side fractures are less likely to heal without operative intervention.11 All tension-side fractures (and any compression-side fractures >50% of the width of the femoral neck) should be treated with percutaneous placement of cannulated screws (Figure 3). 
Stress fractures of the femoral shaft are less common than those of the femoral neck and represent as little as 3% of all stress fractures.32 However, femoral shaft stress fractures are more common in military populations. In French military recruits, Niva and colleagues33 found an 18% incidence. Similar to femoral neck fractures, femoral shaft fractures typically are diagnosed with advanced imaging, though the fulcrum test and pain on WB can aid in the diagnosis.19 These injuries are often managed nonoperatively with NWB for a period. Weishaar and colleagues34 described US military cadets treated with progressive rehabilitation who returned to full activity within 12 weeks. Displaced femoral shaft fractures associated with bone stress injury are even less common, and should be managed operatively. Salminen and colleagues35 found an incidence of 1.5 fractures per 100,000 years of military service. Over a 20-year period, they surgically treated 10 of these fractures. Average time from intramedullary nailing to union was 3.5 months.
Tibia
The tibia is one of the more common locations for stress injury and fracture. In a prospective study with members of the military, Giladi and colleagues36 found that 71% of stress fractures were tibia fractures. In addition, a large study of 320 athletes with stress fractures found 49.1% in the tibia.37 Fractures typically are diaphyseal and transverse, usually occurring along the posteromedial cortex, where the bone experiences maximal compressive forces (Figure 4).5,13

Compression-side fractures often heal with nonoperative management, though healing may take several months. Swenson and colleagues40 studied the effects of pneumatic bracing on conservative management and return to play in athletes with tibial stress fractures. Patients with bracing returned to light activity within 7 days and full activity within 21 days, whereas those without bracing returned to light activity within 21 days and full activity within 77 days. Pulsed electromagnetic therapy is of controversial benefit in the management of these injuries. Rettig
Metatarsals
Stress fractures were first discovered by Briethaupt1 in the painful swollen feet of Prussian army members in 1855 and were initially named march fractures. Waterman and colleagues6 reported that metatarsal stress fractures accounted for 16% of all stress fractures in the US military between 2009 and 2012. The second metatarsal neck is the most common location for stress fractures, followed by the third and fourth metatarsals, with the fifth metatarsal being the least common.5 The second metatarsal is thought to sustain these injuries more often than the other metatarsals because of its relative lack of immobility. Donahue and Sharkey43 found that the dorsal aspect of the second metatarsal experiences twice the amount of strain experienced by the fifth metatarsal during gait, and that peak strain in the second metatarsal was further increased by simulated muscle fatigue. The risk of stress fracture can be additionally increased with use of minimalist footwear, as shown by Giuliani and colleagues,44 particularly in the absence of a progressive transition in gait and training volume with a change toward minimalist footwear. In patients with a suspected or confirmed fracture of the second, third, or fourth metatarsal, treatment typically is NWB and immobilization for at least 4 weeks.5 Fifth metatarsal stress injuries (Figure 2) typically are treated differently because of their higher risk of nonunion. Patients with a fifth metatarsal stress fracture complain of lateral midfoot pain with running and jumping. For those who present with this fracture early, acceptable treatment consists of 6 weeks of casting and NWB.5 In cases of failed nonoperative therapy, or presentation with radiographic evidence of nonunion, treatment should be intramedullary screw fixation, with bone graft supplementation based on surgeon preference. DeLee and colleagues45 reported on the results of 10 athletes with fifth metatarsal stress fractures treated with intramedullary screw fixation without bone grafting. All 10 experienced fracture union, at a mean of 7.5 weeks, and returned to sport within 8.5 weeks. One complication with this procedure is pain at the screw insertion site, but this can be successfully managed with footwear modification.45
Prevention
Proper identification of patients at high risk for stress injuries has the potential of reducing the incidence of these injuries. Lappe and colleagues46 prospectively examined female army recruits before and after 8 weeks of basic training and found that those who developed a stress fracture were more likely to have a smoking history, to drink more than 10 alcoholic beverages a week, to have a history of corticosteroid or depot medroxyprogesterone use, and to have lower body weight. In addition, the authors found that a history of prolonged exercise before enrollment was protective against fracture. This finding identifies the importance of having new recruits undergo risk factor screening, which could result in adjusting training regimens to try to reduce injury. The RED-S consensus statement14 offers a comprehensive description of the physiologic factors that can contribute to such injury. Similar to proper risk factor identification, implementation of proper exercise progression programs is a simple, modifiable method of limiting stress injuries. For new recruits or athletes who are resuming activity, injury can be effectively prevented by adjusting the frequency, duration, and intensity of training and the training loads used.47
Vitamin D and calcium supplementation is a simple intervention that can be helpful in injury prevention, and its use has very little downside. A double-blind study found a 20% lower incidence of stress fracture in female navy recruits who took 2000 mg of calcium and 800 IU of vitamin D as daily supplemention.48 Of importance, a meta-analysis of more than 65,000 patients found vitamin D supplementation was effective in reducing fracture risk only when combined with calcium, irrespective of age, sex, or prior fracture.49 In female patients with the female athlete triad, psychological counseling and nutritional consultation are essential in bone health maintenance and long-term prevention.50 Other therapies have been evaluated as well. Use of bisphosphonates is controversial for both treatment and prevention of stress fractures. In a randomized, double-blind study of the potential prophylactic effects of risedronate in 324 new infantry recruits, Milgrom and colleagues51 found no statistically significant differences in tibial, femoral, metatarsal, or total stress fracture incidence between the treatment and placebo groups. Therefore, bisphosphonates are seldom recommended as prevention or in primary management of stress fracture.
In addition to nutritional and pharmacologic therapy, activity modification may have a role in injury prevention. Gait retraining has been identified as a potential intervention for reducing stress fractures in patients with poor biomechanics.47 Crowell and Davis52 investigated the effect of gait retraining on the forces operating in the tibia in runners. After 1 month of gait retraining, tibial acceleration while running decreased by 50%, vertical force loading rate by 30%, and peak vertical force impact by 20%. Such studies indicate the importance of proper mechanics during repetitive activity, especially in patients not as accustomed to the rigorous training methods used with new military recruits. However, whether these reduced loads translate into reduced risk of stress fracture remains unclear. In addition, biomechanical shoe orthoses may lower the stress fracture risk in military recruits by reducing peak tibial strain.53 Warden and colleagues54 found a mechanical loading program was effective in enchaining the structural properties of bone in rats, leading the authors to hypothesize that a similar program aimed at modifying bone structure in humans could help prevent stress fracture. Although there have been no studies of such a strategy in humans, pretraining may be an area for future research, especially for military recruits.
Conclusion
Compared with the general population, members of the military (new recruits in particular) are at increased risk for bone stress injuries. Most of these injuries occur during basic training, when recruits significantly increase their repetitive physical activity. Although the exact pathophysiology of stress injury is debated, nutritional and metabolic abnormalities are contributors. The indolent nature of these injuries, and their high rate of false-negative plain radiographs, may result in a significant delay in diagnosis in the absence of advanced imaging studies. Although a majority of injuries heal with nonoperative management and NWB, several patterns, especially those on the tension side of the bone, are at high risk for progression to fracture and nonunion. These include lateral femoral cortex stress injuries and anterior tibial cortex fractures. There should be a low threshold for operative management in the setting of delayed union or failed nonoperative therapy. Of equal importance to orthopedic management of these injuries is the management of underlying systemic deficits, which may have subjected the patient to injury in the first place. Supplementation with vitamin D and calcium can be an important prophylaxis against stress injury. In addition, military recruits and athletes with underlying metabolic or hormonal deficiencies should receive proper attention with a focus on balancing energy intake and energy expenditure. Stress injury leading to fracture—increasingly common in military populations—often requires a multimodal approach for treatment and subsequent prevention.
Am J Orthop. 2017;46(4):176-183. Copyright Frontline Medical Communications Inc. 2017. All rights reserved.
1. Briethaupt MD. Zur Pathologie des menschlichen Fusses [To the pathology of the human foot]. Med Zeitung. 1855;24:169-177.
2. Berger FH, de Jonge MC, Maas M. Stress fractures in the lower extremity. Eur J Radiol. 2007;62(1):16-26.
3. Almeida SA, Williams KM, Shaffer RA, Brodine SK. Epidemiological patterns of musculoskeletal injuries and physical training. Med Sci Sports Exerc. 1999;31(8):1176-1182.
4. Jones BH, Thacker SB, Gilchrist J, Kimsey CD, Sosin DM. Prevention of lower extremity stress fractures in athletes and soldiers: a systematic review. Epidemiol Rev. 2002;24(2):228-247.
5. Jacobs JM, Cameron KL, Bojescul JA. Lower extremity stress fractures in the military. Clin Sports Med. 2014;33(4):591-613.
6. Waterman BR, Gun B, Bader JO, Orr JD, Belmont PJ. Epidemiology of lower extremity stress fractures in the United States military. Mil Med. 2016;181(10):1308-1313.
7. Hsu LL, Nevin RL, Tobler SK, Rubertone MV. Trends in overweight and obesity among 18-year-old applicants to the United States military, 1993–2006. J Adolesc Health. 2007;41(6):610-612.
8. Stanitski CL, McMaster JH, Scranton PE. On the nature of stress fractures. Am J Sports Med. 1978;6(6):391-396.
9. Johnson LC. Histogenesis of stress fractures [annual lecture]. Washington, DC: Armed Forces Institute of Pathology; 1963.
10. Friedenberg ZB. Fatigue fractures of the tibia. Clin Orthop Relat Res. 1971;(76):111-115.
11. Cameron KL, Peck KY, Owens BD, et al. Biomechanical risk factors for lower extremity stress fracture. Orthop J Sports Med. 2013;1(4 suppl).
12. Knapik J, Montain S, McGraw S, Grier T, Ely M, Jones B. Stress fracture risk factors in basic combat training. Int J Sports Med. 2012;33(11):940-946.
13. Behrens SB, Deren ME, Matson A, Fadale PD, Monchik KO. Stress fractures of the pelvis and legs in athletes. Sports Health. 2013;5(2):165-174.
14. Mountjoy M, Sundgot-Borgen J, Burke L, et al. The IOC consensus statement: beyond the female athlete triad—relative energy deficiency in sport (RED-S). Br J Sports Med. 2014;48(7):491-497.
15. Maitra RS, Johnson DL. Stress fractures. Clinical history and physical examination. Clin Sports Med. 1997;16(2):259-274.
16. Nieves JW, Melsop K, Curtis M, et al. Nutritional factors that influence change in bone density and stress fracture risk among young female cross-country runners. PM R. 2010;2(8):740-750.
17. Beck BR, Matheson GO, Bergman G, et al. Do capacitively coupled electric fields accelerate tibial stress fracture healing? Am J Sports Med. 2008;36(3):545-553.
18. Simkin A, Leichter I, Giladi M, Stein M, Milgrom C. Combined effect of foot arch structure and an orthotic device on stress fractures. Foot Ankle. 1989;10(1):25-29.
19. Johnson AW, Weiss CB, Wheeler DL. Stress fractures of the femoral shaft in athletes—more common than expected: a new clinical test. Am J Sports Med. 1994;22(2):248-256.
20. Clement D, Ammann W, Taunton J, et al. Exercise-induced stress injuries to the femur. Int J Sports Med. 1993;14(6):347-352.
21. Wood PJ, Barth JH, Freedman DB, Perry L, Sheridan B. Evidence for the low dose dexamethasone suppression test to screen for Cushing’s syndrome—recommendations for a protocol for biochemistry laboratories. Ann Clin Biochem. 1997;34(pt 3):222-229.
22. Bennell K, Matheson G, Meeuwisse W, Brukner P. Risk factors for stress fractures. Sports Med. 1999;28(2):91-122.
23. Prather JL, Nusynowitz ML, Snowdy HA, Hughes AD, McCartney WH, Bagg RJ. Scintigraphic findings in stress fractures. J Bone Joint Surg Am. 1977;59(7):869-874.
24. Arendt EA, Griffiths HJ. The use of MR imaging in the assessment and clinical management of stress reactions of bone in high-performance athletes. Clin Sports Med. 1997;16(2):291-306.
25. Boden BP, Osbahr DC. High-risk stress fractures: evaluation and treatment. J Am Acad Orthop Surg. 2000;8(6):344-353.
26. Gaeta M, Minutoli F, Scribano E, et al. CT and MR imaging findings in athletes with early tibial stress injuries: comparison with bone scintigraphy findings and emphasis on cortical abnormalities. Radiology. 2005;235(2):553-561.
27. Matheson GO, Clement DB, Mckenzie DC, Taunton JE, Lloyd-Smith DR, Macintyre JG. Stress fractures in athletes. Am J Sports Med. 1987;15(1):46-58.
28. Iwamoto J, Takeda T. Stress fractures in athletes: review of 196 cases. J Orthop Sci. 2003;8(3):273-278.
29. Noakes TD, Smith JA, Lindenberg G, Wills CE. Pelvic stress fractures in long distance runners. Am J Sports Med. 1985;13(2):120-123.
30. Neubauer T, Brand J, Lidder S, Krawany M. Stress fractures of the femoral neck in runners: a review. Res Sports Med. 2016;24(3):283-297.
31. Evans JT, Guyver PM, Kassam AM, Hubble MJW. Displaced femoral neck stress fractures in Royal Marine recruits—management and results of operative treatment. J R Nav Med Serv. 2012;98(2):3-5.
32. Orava S. Stress fractures. Br J Sports Med. 1980;14(1):40-44.
33. Niva MH, Kiuru MJ, Haataja R, Pihlajamäki HK. Fatigue injuries of the femur. J Bone Joint Surg Br. 2005;87(10):1385-1390.
34. Weishaar MD, McMillian DJ, Moore JH. Identification and management of 2 femoral shaft stress injuries. J Orthop Sports Phys Ther. 2005;35(10):665-673.
35. Salminen ST, Pihlajamäki HK, Visuri TI, Böstman OM. Displaced fatigue fractures of the femoral shaft. Clin Orthop Relat Res. 2003;(409):250-259.
36. Giladi M, Ahronson Z, Stein M, Danon YL, Milgrom C. Unusual distribution and onset of stress fractures in soldiers. Clin Orthop Relat Res. 1985;(192):142-146.
37. Matheson GO, Clement DB, Mckenzie DC, Taunton JE, Lloyd-Smith DR, Macintyre JG. Stress fractures in athletes. Am J Sports Med. 1987;15(1):46-58.
38. Green NE, Rogers RA, Lipscomb AB. Nonunions of stress fractures of the tibia. Am J Sports Med. 1985;13(3):171-176.
39. Orava S, Hulkko A. Stress fracture of the mid-tibial shaft. Acta Orthop Scand. 1984;55(1):35-37.
40. Swenson EJ Jr, DeHaven KE, Sebastianelli WJ, Hanks G, Kalenak A, Lynch JM. The effect of a pneumatic leg brace on return to play in athletes with tibial stress fractures. Am J Sports Med. 1997;25(3):322-328.
41. Rettig AC, Shelbourne KD, McCarroll JR, Bisesi M, Watts J. The natural history and treatment of delayed union stress fractures of the anterior cortex of the tibia. Am J Sports Med. 1988;16(3):250-255.
42. Varner KE, Younas SA, Lintner DM, Marymont JV. Chronic anterior midtibial stress fractures in athletes treated with reamed intramedullary nailing. Am J Sports Med. 2005;33(7):1071-1076.
43. Donahue SW, Sharkey NA. Strains in the metatarsals during the stance phase of gait: implications for stress fractures. J Bone Joint Surg Am. 1999;81(9):1236-1244.
44. Giuliani J, Masini B, Alitz C, Owens BD. Barefoot-simulating footwear associated with metatarsal stress injury in 2 runners. Orthopedics. 2011;34(7):e320-e323.
45. DeLee JC, Evans JP, Julian J. Stress fracture of the fifth metatarsal. Am J Sports Med. 1983;11(5):349-353.
46. Lappe JM, Stegman MR, Recker RR. The impact of lifestyle factors on stress fractures in female army recruits. Osteoporos Int. 2001;12(1):35-42.
47. Friedl KE, Evans RK, Moran DS. Stress fracture and military medical readiness: bridging basic and applied research. Med Sci Sports Exerc. 2008;40(11 suppl):S609-S622.
48. Lappe J, Cullen D, Haynatzki G, Recker R, Ahlf R, Thompson K. Calcium and vitamin D supplementation decreases incidence of stress fractures in female navy recruits. J Bone Miner Res. 2008;23(5):741-749.
49. DIPART (Vitamin D Individual Patient Analysis of Randomized Trials) Group. Patient level pooled analysis of 68 500 patients from seven major vitamin D fracture trials in US and Europe. BMJ. 2010;340:b5463.
50. Duckham RL, Peirce N, Meyer C, Summers GD, Cameron N, Brooke-Wavell K. Risk factors for stress fracture in female endurance athletes: a cross-sectional study. BMJ Open. 2012;2(6).
51. Milgrom C, Finestone A, Novack V, et al. The effect of prophylactic treatment with risedronate on stress fracture incidence among infantry recruits. Bone. 2004;35(2):418-424.
52. Crowell HP, Davis IS. Gait retraining to reduce lower extremity loading in runners. Clin Biomech. 2011;26(1):78-83.
53. Ekenman I, Milgrom C, Finestone A, et al. The role of biomechanical shoe orthoses in tibial stress fracture prevention. Am J Sports Med. 2002;30(6):866-870.
54. Warden SJ, Hurst JA, Sanders MS, Turner CH, Burr DB, Li J. Bone adaptation to a mechanical loading program significantly increases skeletal fatigue resistance. J Bone Miner Res. 2005;20(5):809-816.
Take-Home Points
- Stress injuries, specifically of the lower extremity, are very common in new military trainees.
- Stress injury can range from benign periosteal reaction to displaced fracture.
- Stress injury should be treated on a case-by-case basis, depending on the severity of injury, the location of the injury, and the likelihood of healing with nonoperative management.
- Modifiable risk factors such as nutritional status, training regiment, and even footwear should be investigated to determine potential causes of injury.
- Prevention is a crucial part of the treatment of these injuries, and early intervention such as careful pre-enrollment physicals and vitamin supplementation can be essential in lowering injury rates.
Bone stress injuries, which are common in military recruits, present in weight-bearing (WB) areas as indolent pain caused by repetitive stress and microtrauma. They were first reported in the metatarsals of Prussian soldiers in 1855.1 Today, stress injuries are increasingly common. One study estimated they account for 10% of patients seen by sports medicine practitioners.2 This injury most commonly affects military members, endurance athletes, and dancers.3-5 Specifically, the incidence of stress fractures in military members has been reported to range from 0.8% to 6.9% for men and from 3.4% to 21.0% for women.4 Because of repetitive vigorous lower extremity loading, stress fractures typically occur in the pelvis, femoral neck, tibial shaft, and metatarsals. Delayed diagnosis and the subsequent duration of treatment required for adequate healing can result in significant morbidity. In a 2009 to 2012 study of US military members, Waterman and colleagues6 found an incidence rate of 5.69 stress fractures per 1000 person-years. Fractures most frequently involved the tibia/fibula (2.26/1000), followed by the metatarsals (0.92/1000) and the femoral neck (0.49/1000).6 In addition, these injuries were most commonly encountered in new recruits, who were less accustomed to the high-volume, high-intensity training required during basic training.4,7 Enlisted junior service members have been reported to account for 77.5% of all stress fractures.6 Age under 20 years or over 40 years and white race have also been found to be risk factors for stress injury.6
The pathogenesis of stress injury is controversial. Stanitski and colleagues8 theorized that multiple submaximal mechanical insults create cumulative stress greater than bone capacity, eventually leading to fracture. Johnson9 conducted a biopsy study and postulated that an accelerated remodeling phase was responsible, whereas Friedenberg10 argued that stress injuries are a form of reduced healing, not an attempt to increase healing, caused by the absence of callous formation in the disease process.
Various other nonmodifiable and modifiable risk factors predispose military service members to stress injury. Nonmodifiable risk factors include sex, bone geometry, limb alignment, race, age, and anatomy. Lower extremity movement biomechanics resulting from dynamic limb alignment during activity may be important. Cameron and colleagues11 examined 1843 patients and found that those with knees in >5° of valgus or >5° of external rotation had higher injury rates. Although variables such as sex and limb alignment cannot be changed, proper identification of modifiable risk factors can assist with injury prevention, and nonmodifiable risk factors can help clinicians and researchers target injury prevention interventions to patients at highest risk.
Metabolic, hormonal, and nutritional status is crucial to overall bone health. Multiple studies have found that low body mass index (BMI) is a significant risk factor for stress fracture.7,12,13 Although low BMI is a concern, patients with abnormally high BMI may also be at increased risk for bone stress injury. In a recently released consensus statement on relative energy deficiency in sport (RED-S), the International Olympic Committee addressed the complex interplay of impairments in physiologic function—including metabolic rate, menstrual function, bone health, immunity, protein synthesis, and cardiovascular health—caused by relative energy deficiency.14 The committee stated that the cause of this syndrome is energy deficiency relative to the balance between dietary energy intake and energy expenditure required for health and activities of daily living, growth, and sporting activities. This finding reveals that conditions such as stress injury often may represent a much broader systemic deficit that may be influenced by a patient’s overall physiologic imbalance.
Diagnosis
History and Physical Examination
The onset of stress reaction typically is insidious, with the classic presentation being a new military recruit who is experiencing a sudden increase in pain during physical activity.15 Pain typically is initially present only during activity, and is relieved with rest, but with disease progression this evolves to pain at rest. It is crucial that the physician elicit the patient’s history of training and physical activity. Hsu and colleagues7 reported increased prevalence of overweight civilian recruits, indicating an increase in the number of new recruits having limited experience with the repetitive physical activity encountered in basic training. Stress injury should be suspected in the setting of worsening, indolent lower extremity pain that has been present for several days, especially in the higher-risk patient populations mentioned. Diet should be assessed, with specific attention given to the intake of fruits, vegetables, and foods high in vitamin D and calcium and, most important, the energy balance between intake and output.16 Special attention should also be given to female patients, who may experience the female athlete triad, a spectrum of low energy availability, menstrual dysfunction, and impaired bone turnover (high amount of resorption relative to formation). A key part of the RED-S consensus statement14 alerted healthcare providers that metabolic derangements do not solely affect female patients. These types of patients sustain a major insult to the homeostatic balance of the hormones that sustain adequate bone health. Beck and colleagues17 found that women with disrupted menstrual cycles are 2 to 4 times more likely to sustain a stress fracture than women without disrupted menstrual cycles, making this abnormality an important part of the history.
Examination should begin with careful evaluation of limb alignment and specific attention given to varus or valgus alignment of the knees.11 The feet should also be inspected, as pes planus or cavus foot may increase the risk of stress fracture.18 Identification of the area of maximal tenderness is important. The area in question may also be erythematous or warm secondary to the inflammatory response associated with attempted fracture healing. In chronic fractures in superficial areas such as the metatarsals, callus may be palpable. Although there are few specific tests for stress injury, pain may be reproducible with deep palpation and WB.
Laboratory Testing
When a pathology is thought to have a nutritional or metabolic cause, particularly in a low-weight or underweight patient, a laboratory workup should be obtained. Specific laboratory tests that all patients should undergo are 25-hydroxyvitamin D3, complete blood cell count, and basic chemistry panel, including calcium and thyroid-stimulating hormone levels. Although not necessary for diagnosis, phosphate, parathyroid hormone, albumin, and prealbumin should also be considered. Females should undergo testing of follicle stimulating hormone, luteinizing hormone, estradiol, and testosterone and have a urine pregnancy test. In patients with signs of excessive cortisone, a dexamethasone suppression test can be administered.21 In males, low testosterone is a documented risk factor for stress injury.22
Imaging
Given their low cost and availability, plain radiographs typically are used for initial examination of a suspected stress injury. However, they often lack sensitivity, particularly in the early stages of stress fracture development (Figure 2).
Management
Management of bone stress injury depends on many factors, including symptom duration, fracture location and severity, and risk of progression or nonunion (Table).13
Pelvis
Pelvic stress fractures are rare and represent only 1.6% to 7.1% of all stress fractures.13,27,28 Given the low frequency, physicians must have a high index of suspicion to make the correct diagnosis. These fractures typically occur in marathon runners and other patients who present with persistent pain and a history of high levels of activity. As pelvic stress fractures typically involve the superior or inferior pubic rami, or sacrum, and are at low risk for nonunion,13 most are managed with nonoperative treatment and activity modification for 8 to 12 weeks.27
Femur
Femoral stress fractures are also relatively uncommon, accounting for about 10% of all stress fractures. Depending on their location, these fractures can be at high risk for progression, nonunion, and significant morbidity.29 Especially concerning are femoral neck stress fractures, which can involve either the tension side (lateral cortex) or the compression side (medial cortex) of the bone. Suspicion of a femoral neck stress fracture should prompt immediate NWB.5 Early recognition of these injuries is crucial because once displacement occurs, their complication and morbidity rates become high.13 Patients with compression-side fractures should undergo NWB treatment for 4 to 6 weeks and then slow progression to WB activity. Most return to light-impact activity by 3 to 4 months. By contrast, tension-side fractures are less likely to heal without operative intervention.11 All tension-side fractures (and any compression-side fractures >50% of the width of the femoral neck) should be treated with percutaneous placement of cannulated screws (Figure 3).
Stress fractures of the femoral shaft are less common than those of the femoral neck and represent as little as 3% of all stress fractures.32 However, femoral shaft stress fractures are more common in military populations. In French military recruits, Niva and colleagues33 found an 18% incidence. Similar to femoral neck fractures, femoral shaft fractures typically are diagnosed with advanced imaging, though the fulcrum test and pain on WB can aid in the diagnosis.19 These injuries are often managed nonoperatively with NWB for a period. Weishaar and colleagues34 described US military cadets treated with progressive rehabilitation who returned to full activity within 12 weeks. Displaced femoral shaft fractures associated with bone stress injury are even less common, and should be managed operatively. Salminen and colleagues35 found an incidence of 1.5 fractures per 100,000 years of military service. Over a 20-year period, they surgically treated 10 of these fractures. Average time from intramedullary nailing to union was 3.5 months.
Tibia
The tibia is one of the more common locations for stress injury and fracture. In a prospective study with members of the military, Giladi and colleagues36 found that 71% of stress fractures were tibia fractures. In addition, a large study of 320 athletes with stress fractures found 49.1% in the tibia.37 Fractures typically are diaphyseal and transverse, usually occurring along the posteromedial cortex, where the bone experiences maximal compressive forces (Figure 4).5,13
Compression-side fractures often heal with nonoperative management, though healing may take several months. Swenson and colleagues40 studied the effects of pneumatic bracing on conservative management and return to play in athletes with tibial stress fractures. Patients with bracing returned to light activity within 7 days and full activity within 21 days, whereas those without bracing returned to light activity within 21 days and full activity within 77 days. Pulsed electromagnetic therapy is of controversial benefit in the management of these injuries. Rettig
Metatarsals
Stress fractures were first discovered by Briethaupt1 in the painful swollen feet of Prussian army members in 1855 and were initially named march fractures. Waterman and colleagues6 reported that metatarsal stress fractures accounted for 16% of all stress fractures in the US military between 2009 and 2012. The second metatarsal neck is the most common location for stress fractures, followed by the third and fourth metatarsals, with the fifth metatarsal being the least common.5 The second metatarsal is thought to sustain these injuries more often than the other metatarsals because of its relative lack of immobility. Donahue and Sharkey43 found that the dorsal aspect of the second metatarsal experiences twice the amount of strain experienced by the fifth metatarsal during gait, and that peak strain in the second metatarsal was further increased by simulated muscle fatigue. The risk of stress fracture can be additionally increased with use of minimalist footwear, as shown by Giuliani and colleagues,44 particularly in the absence of a progressive transition in gait and training volume with a change toward minimalist footwear. In patients with a suspected or confirmed fracture of the second, third, or fourth metatarsal, treatment typically is NWB and immobilization for at least 4 weeks.5 Fifth metatarsal stress injuries (Figure 2) typically are treated differently because of their higher risk of nonunion. Patients with a fifth metatarsal stress fracture complain of lateral midfoot pain with running and jumping. For those who present with this fracture early, acceptable treatment consists of 6 weeks of casting and NWB.5 In cases of failed nonoperative therapy, or presentation with radiographic evidence of nonunion, treatment should be intramedullary screw fixation, with bone graft supplementation based on surgeon preference. DeLee and colleagues45 reported on the results of 10 athletes with fifth metatarsal stress fractures treated with intramedullary screw fixation without bone grafting. All 10 experienced fracture union, at a mean of 7.5 weeks, and returned to sport within 8.5 weeks. One complication with this procedure is pain at the screw insertion site, but this can be successfully managed with footwear modification.45
Prevention
Proper identification of patients at high risk for stress injuries has the potential of reducing the incidence of these injuries. Lappe and colleagues46 prospectively examined female army recruits before and after 8 weeks of basic training and found that those who developed a stress fracture were more likely to have a smoking history, to drink more than 10 alcoholic beverages a week, to have a history of corticosteroid or depot medroxyprogesterone use, and to have lower body weight. In addition, the authors found that a history of prolonged exercise before enrollment was protective against fracture. This finding identifies the importance of having new recruits undergo risk factor screening, which could result in adjusting training regimens to try to reduce injury. The RED-S consensus statement14 offers a comprehensive description of the physiologic factors that can contribute to such injury. Similar to proper risk factor identification, implementation of proper exercise progression programs is a simple, modifiable method of limiting stress injuries. For new recruits or athletes who are resuming activity, injury can be effectively prevented by adjusting the frequency, duration, and intensity of training and the training loads used.47
Vitamin D and calcium supplementation is a simple intervention that can be helpful in injury prevention, and its use has very little downside. A double-blind study found a 20% lower incidence of stress fracture in female navy recruits who took 2000 mg of calcium and 800 IU of vitamin D as daily supplemention.48 Of importance, a meta-analysis of more than 65,000 patients found vitamin D supplementation was effective in reducing fracture risk only when combined with calcium, irrespective of age, sex, or prior fracture.49 In female patients with the female athlete triad, psychological counseling and nutritional consultation are essential in bone health maintenance and long-term prevention.50 Other therapies have been evaluated as well. Use of bisphosphonates is controversial for both treatment and prevention of stress fractures. In a randomized, double-blind study of the potential prophylactic effects of risedronate in 324 new infantry recruits, Milgrom and colleagues51 found no statistically significant differences in tibial, femoral, metatarsal, or total stress fracture incidence between the treatment and placebo groups. Therefore, bisphosphonates are seldom recommended as prevention or in primary management of stress fracture.
In addition to nutritional and pharmacologic therapy, activity modification may have a role in injury prevention. Gait retraining has been identified as a potential intervention for reducing stress fractures in patients with poor biomechanics.47 Crowell and Davis52 investigated the effect of gait retraining on the forces operating in the tibia in runners. After 1 month of gait retraining, tibial acceleration while running decreased by 50%, vertical force loading rate by 30%, and peak vertical force impact by 20%. Such studies indicate the importance of proper mechanics during repetitive activity, especially in patients not as accustomed to the rigorous training methods used with new military recruits. However, whether these reduced loads translate into reduced risk of stress fracture remains unclear. In addition, biomechanical shoe orthoses may lower the stress fracture risk in military recruits by reducing peak tibial strain.53 Warden and colleagues54 found a mechanical loading program was effective in enchaining the structural properties of bone in rats, leading the authors to hypothesize that a similar program aimed at modifying bone structure in humans could help prevent stress fracture. Although there have been no studies of such a strategy in humans, pretraining may be an area for future research, especially for military recruits.
Conclusion
Compared with the general population, members of the military (new recruits in particular) are at increased risk for bone stress injuries. Most of these injuries occur during basic training, when recruits significantly increase their repetitive physical activity. Although the exact pathophysiology of stress injury is debated, nutritional and metabolic abnormalities are contributors. The indolent nature of these injuries, and their high rate of false-negative plain radiographs, may result in a significant delay in diagnosis in the absence of advanced imaging studies. Although a majority of injuries heal with nonoperative management and NWB, several patterns, especially those on the tension side of the bone, are at high risk for progression to fracture and nonunion. These include lateral femoral cortex stress injuries and anterior tibial cortex fractures. There should be a low threshold for operative management in the setting of delayed union or failed nonoperative therapy. Of equal importance to orthopedic management of these injuries is the management of underlying systemic deficits, which may have subjected the patient to injury in the first place. Supplementation with vitamin D and calcium can be an important prophylaxis against stress injury. In addition, military recruits and athletes with underlying metabolic or hormonal deficiencies should receive proper attention with a focus on balancing energy intake and energy expenditure. Stress injury leading to fracture—increasingly common in military populations—often requires a multimodal approach for treatment and subsequent prevention.
Am J Orthop. 2017;46(4):176-183. Copyright Frontline Medical Communications Inc. 2017. All rights reserved.
1. Briethaupt MD. Zur Pathologie des menschlichen Fusses [To the pathology of the human foot]. Med Zeitung. 1855;24:169-177.
2. Berger FH, de Jonge MC, Maas M. Stress fractures in the lower extremity. Eur J Radiol. 2007;62(1):16-26.
3. Almeida SA, Williams KM, Shaffer RA, Brodine SK. Epidemiological patterns of musculoskeletal injuries and physical training. Med Sci Sports Exerc. 1999;31(8):1176-1182.
4. Jones BH, Thacker SB, Gilchrist J, Kimsey CD, Sosin DM. Prevention of lower extremity stress fractures in athletes and soldiers: a systematic review. Epidemiol Rev. 2002;24(2):228-247.
5. Jacobs JM, Cameron KL, Bojescul JA. Lower extremity stress fractures in the military. Clin Sports Med. 2014;33(4):591-613.
6. Waterman BR, Gun B, Bader JO, Orr JD, Belmont PJ. Epidemiology of lower extremity stress fractures in the United States military. Mil Med. 2016;181(10):1308-1313.
7. Hsu LL, Nevin RL, Tobler SK, Rubertone MV. Trends in overweight and obesity among 18-year-old applicants to the United States military, 1993–2006. J Adolesc Health. 2007;41(6):610-612.
8. Stanitski CL, McMaster JH, Scranton PE. On the nature of stress fractures. Am J Sports Med. 1978;6(6):391-396.
9. Johnson LC. Histogenesis of stress fractures [annual lecture]. Washington, DC: Armed Forces Institute of Pathology; 1963.
10. Friedenberg ZB. Fatigue fractures of the tibia. Clin Orthop Relat Res. 1971;(76):111-115.
11. Cameron KL, Peck KY, Owens BD, et al. Biomechanical risk factors for lower extremity stress fracture. Orthop J Sports Med. 2013;1(4 suppl).
12. Knapik J, Montain S, McGraw S, Grier T, Ely M, Jones B. Stress fracture risk factors in basic combat training. Int J Sports Med. 2012;33(11):940-946.
13. Behrens SB, Deren ME, Matson A, Fadale PD, Monchik KO. Stress fractures of the pelvis and legs in athletes. Sports Health. 2013;5(2):165-174.
14. Mountjoy M, Sundgot-Borgen J, Burke L, et al. The IOC consensus statement: beyond the female athlete triad—relative energy deficiency in sport (RED-S). Br J Sports Med. 2014;48(7):491-497.
15. Maitra RS, Johnson DL. Stress fractures. Clinical history and physical examination. Clin Sports Med. 1997;16(2):259-274.
16. Nieves JW, Melsop K, Curtis M, et al. Nutritional factors that influence change in bone density and stress fracture risk among young female cross-country runners. PM R. 2010;2(8):740-750.
17. Beck BR, Matheson GO, Bergman G, et al. Do capacitively coupled electric fields accelerate tibial stress fracture healing? Am J Sports Med. 2008;36(3):545-553.
18. Simkin A, Leichter I, Giladi M, Stein M, Milgrom C. Combined effect of foot arch structure and an orthotic device on stress fractures. Foot Ankle. 1989;10(1):25-29.
19. Johnson AW, Weiss CB, Wheeler DL. Stress fractures of the femoral shaft in athletes—more common than expected: a new clinical test. Am J Sports Med. 1994;22(2):248-256.
20. Clement D, Ammann W, Taunton J, et al. Exercise-induced stress injuries to the femur. Int J Sports Med. 1993;14(6):347-352.
21. Wood PJ, Barth JH, Freedman DB, Perry L, Sheridan B. Evidence for the low dose dexamethasone suppression test to screen for Cushing’s syndrome—recommendations for a protocol for biochemistry laboratories. Ann Clin Biochem. 1997;34(pt 3):222-229.
22. Bennell K, Matheson G, Meeuwisse W, Brukner P. Risk factors for stress fractures. Sports Med. 1999;28(2):91-122.
23. Prather JL, Nusynowitz ML, Snowdy HA, Hughes AD, McCartney WH, Bagg RJ. Scintigraphic findings in stress fractures. J Bone Joint Surg Am. 1977;59(7):869-874.
24. Arendt EA, Griffiths HJ. The use of MR imaging in the assessment and clinical management of stress reactions of bone in high-performance athletes. Clin Sports Med. 1997;16(2):291-306.
25. Boden BP, Osbahr DC. High-risk stress fractures: evaluation and treatment. J Am Acad Orthop Surg. 2000;8(6):344-353.
26. Gaeta M, Minutoli F, Scribano E, et al. CT and MR imaging findings in athletes with early tibial stress injuries: comparison with bone scintigraphy findings and emphasis on cortical abnormalities. Radiology. 2005;235(2):553-561.
27. Matheson GO, Clement DB, Mckenzie DC, Taunton JE, Lloyd-Smith DR, Macintyre JG. Stress fractures in athletes. Am J Sports Med. 1987;15(1):46-58.
28. Iwamoto J, Takeda T. Stress fractures in athletes: review of 196 cases. J Orthop Sci. 2003;8(3):273-278.
29. Noakes TD, Smith JA, Lindenberg G, Wills CE. Pelvic stress fractures in long distance runners. Am J Sports Med. 1985;13(2):120-123.
30. Neubauer T, Brand J, Lidder S, Krawany M. Stress fractures of the femoral neck in runners: a review. Res Sports Med. 2016;24(3):283-297.
31. Evans JT, Guyver PM, Kassam AM, Hubble MJW. Displaced femoral neck stress fractures in Royal Marine recruits—management and results of operative treatment. J R Nav Med Serv. 2012;98(2):3-5.
32. Orava S. Stress fractures. Br J Sports Med. 1980;14(1):40-44.
33. Niva MH, Kiuru MJ, Haataja R, Pihlajamäki HK. Fatigue injuries of the femur. J Bone Joint Surg Br. 2005;87(10):1385-1390.
34. Weishaar MD, McMillian DJ, Moore JH. Identification and management of 2 femoral shaft stress injuries. J Orthop Sports Phys Ther. 2005;35(10):665-673.
35. Salminen ST, Pihlajamäki HK, Visuri TI, Böstman OM. Displaced fatigue fractures of the femoral shaft. Clin Orthop Relat Res. 2003;(409):250-259.
36. Giladi M, Ahronson Z, Stein M, Danon YL, Milgrom C. Unusual distribution and onset of stress fractures in soldiers. Clin Orthop Relat Res. 1985;(192):142-146.
37. Matheson GO, Clement DB, Mckenzie DC, Taunton JE, Lloyd-Smith DR, Macintyre JG. Stress fractures in athletes. Am J Sports Med. 1987;15(1):46-58.
38. Green NE, Rogers RA, Lipscomb AB. Nonunions of stress fractures of the tibia. Am J Sports Med. 1985;13(3):171-176.
39. Orava S, Hulkko A. Stress fracture of the mid-tibial shaft. Acta Orthop Scand. 1984;55(1):35-37.
40. Swenson EJ Jr, DeHaven KE, Sebastianelli WJ, Hanks G, Kalenak A, Lynch JM. The effect of a pneumatic leg brace on return to play in athletes with tibial stress fractures. Am J Sports Med. 1997;25(3):322-328.
41. Rettig AC, Shelbourne KD, McCarroll JR, Bisesi M, Watts J. The natural history and treatment of delayed union stress fractures of the anterior cortex of the tibia. Am J Sports Med. 1988;16(3):250-255.
42. Varner KE, Younas SA, Lintner DM, Marymont JV. Chronic anterior midtibial stress fractures in athletes treated with reamed intramedullary nailing. Am J Sports Med. 2005;33(7):1071-1076.
43. Donahue SW, Sharkey NA. Strains in the metatarsals during the stance phase of gait: implications for stress fractures. J Bone Joint Surg Am. 1999;81(9):1236-1244.
44. Giuliani J, Masini B, Alitz C, Owens BD. Barefoot-simulating footwear associated with metatarsal stress injury in 2 runners. Orthopedics. 2011;34(7):e320-e323.
45. DeLee JC, Evans JP, Julian J. Stress fracture of the fifth metatarsal. Am J Sports Med. 1983;11(5):349-353.
46. Lappe JM, Stegman MR, Recker RR. The impact of lifestyle factors on stress fractures in female army recruits. Osteoporos Int. 2001;12(1):35-42.
47. Friedl KE, Evans RK, Moran DS. Stress fracture and military medical readiness: bridging basic and applied research. Med Sci Sports Exerc. 2008;40(11 suppl):S609-S622.
48. Lappe J, Cullen D, Haynatzki G, Recker R, Ahlf R, Thompson K. Calcium and vitamin D supplementation decreases incidence of stress fractures in female navy recruits. J Bone Miner Res. 2008;23(5):741-749.
49. DIPART (Vitamin D Individual Patient Analysis of Randomized Trials) Group. Patient level pooled analysis of 68 500 patients from seven major vitamin D fracture trials in US and Europe. BMJ. 2010;340:b5463.
50. Duckham RL, Peirce N, Meyer C, Summers GD, Cameron N, Brooke-Wavell K. Risk factors for stress fracture in female endurance athletes: a cross-sectional study. BMJ Open. 2012;2(6).
51. Milgrom C, Finestone A, Novack V, et al. The effect of prophylactic treatment with risedronate on stress fracture incidence among infantry recruits. Bone. 2004;35(2):418-424.
52. Crowell HP, Davis IS. Gait retraining to reduce lower extremity loading in runners. Clin Biomech. 2011;26(1):78-83.
53. Ekenman I, Milgrom C, Finestone A, et al. The role of biomechanical shoe orthoses in tibial stress fracture prevention. Am J Sports Med. 2002;30(6):866-870.
54. Warden SJ, Hurst JA, Sanders MS, Turner CH, Burr DB, Li J. Bone adaptation to a mechanical loading program significantly increases skeletal fatigue resistance. J Bone Miner Res. 2005;20(5):809-816.
In Memoriam
Warren R. Kadrmas, MD, COL, MC, USAF

November 6, 1969-May 8, 2014
Matthew T. Provencher, MD, CAPT, MC, USNR, and John M. Tokish, MD
A Selfless Leader and Former Head of Air Force Orthopedics
In 2014, we tragically lost a true friend, outstanding clinician, great family man, and incredible human being. As one of the preeminent sports orthopedists in the military, Dr. Kadrmas was beloved by all and heralded for his many selfless contributions to military musculoskeletal medicine and injury prevention. He was known for his humble nature and steadfast integrity, and served as an exemplary role model whom we all aspired to emulate. We all remember our time with Warren fondly, and he left us all with lasting memories to cherish and countless stories sure to regale.
Warren Kadrmas was born in 1969 in Vermillion, South Dakota and grew up in Sheridan, Wyoming. Dr. Kadrmas graduated with distinction from both the US Air Force Academy in 1992 and Duke University School of Medicine in 1996. He then went on to complete his residency in 2003 at the Hospital for Special Surgery (HSS) in New York City and was recognized with the Jean C. McDaniel Outstanding Resident Award. He began his Air Force orthopedic career at Wilford Hall Ambulatory Surgical Center on the grounds of Lackland Air Force Base in San Antonio, Texas as part of the 59th Medical Wing. Warren was deployed and served as 1 of 5 people on the mobile-field surgical team assigned to the 379th Expeditionary Medical Group. Subsequently, he returned to HSS, where he excelled in sports medicine and shoulder service subspecialty training.
After his fellowship, Warren returned to San Antonio to continue his work as a top military sports surgeon, serving as a mentor, educator, and leader for all of Air Force orthopedics. During this time he served several tours overseas, becoming an invaluable member of the 332nd Expeditionary Medical Group operating out of the Air Force Theater Hospital at Balad Air Base, Iraq. Warren served as the Program Director of the Orthopedic Residency Program at Wilford Hall Ambulatory Surgical Center. He held the position of Head of Orthopedics for the Air Force as Orthopedic Surgery Consultant to the Air Force Surgeon General for 5 years, a role that entailed coordinating all orthopedic assets for the Global War on Terror for the Air Force. Selfless to a fault, he would never ask anything of anyone that he had not done himself. He completed 6 deployments away from family, loved ones, and work in San Antonio.
A true innovator and visionary, Warren was a pioneer in the integration of high-caliber hip arthroscopy, as well as cutting-edge shoulder and knee care for our active-duty military personnel. He was a prominent member of the American Orthopaedic Society for Sports Medicine (AOSSM) and Arthroscopy Association of North America, and was in line to be the incoming President of the Society of Military Orthopaedic Surgeons, after having previously served as the society’s 2nd Vice President. He was selected for and was scheduled to participate in the AOSSM Traveling Fellowship touring Asia just prior to his untimely accident.
One of Warren’s favorite quotes was on the topic of leading from behind. Nelson Mandela said, “It is better to lead from behind and to put others in front, especially when you celebrate victory when nice things occur. You take the front line when there is danger. Then people will appreciate your leadership.” Warren was the embodiment of this quote. He led from the front, and by example, in times of danger to inspire those he led. But he also honed the skill of leading from behind, with quiet self-sacrifice, to celebrate the success of those he led. His tireless dedication was prominent in all the facets of his life, whether as a father, son, brother, surgeon, educator, mentor, or friend. We miss him dearly, and try to embody his spirit by living our lives through what he taught us all.
Brian Allgood, MD, COL
1960-2007
Dean Taylor, MD
An Exemplary Selfless Leader in Orthopedics and Medicine
When people ask me what effective, ethical healthcare leadership looks like, I think of Brian Allgood. Brian was the epitome of leadership. He led quietly, by example and selflessly–always putting the interests of patients and those on his team ahead of his own.
Brian was a 1982 graduate of the United States Military Academy at West Point, and received a Doctor of Medicine degree from the University of Oklahoma. He completed his orthopedic training at Brooke Army Medical Center in San Antonio. I first met Brian in 1994 when he was practicing as an orthopedic surgeon at Womack Army Medical Center at Ft. Bragg, North Carolina, where he also served at the Division Surgeon for the 82nd Airborne Division. At the time, I was extremely impressed with Brian’s outstanding orthopedic skills, and his unwavering commitment to leadership in orthopedics, military medicine, and medicine.
Brian’s role as the 82nd Airborne Division Surgeon was on the leadership track in Army medicine, a track that many of us who enjoyed and were good at patient care shunned because it was structured to limit the amount of time an administrative leader could spend in patient care. Brian was certainly a skilled orthopedic surgeon who loved caring for patients; however, he was courageous enough to put his responsibility to military medicine and the medical profession ahead of his own clinical interests. He realized that he could provide exceptional leadership that would benefit many instead of only those in his sphere of care. And what an exceptional leader he was!
From 2002 to 2004, I saw firsthand Brian’s extraordinary leadership when he served as the hospital commander of Keller Army Community Hospital at West Point. He was the best hospital commander I worked with during my 11 years at West Point. I saw the sacrifices he made for the rest of us. He gave up something he loved–orthopedic surgery–so that he could effectively lead our hospital. While we operated, he occasionally would look longingly through the operating room (OR) windows. When we saw him, we would invite him to scrub in, much to his delight. He would also show up in other services’ ORs and the hospital’s clinics, staying connected to patients and patient care. This patient-centeredness contributed significantly to the beloved leader he was.
Brian’s final assignment was in 2006 as the Command Surgeon of Multi-National Forces, the highest-ranking medical officer in Iraq. On January 20, 2007, Brian Allgood—on the verge of promotion to brigadier general and on the fast track to Surgeon General of the Army—was killed along with 11 other American service members when their helicopter was shot down.
In his life, Brian was an exemplary leader. After his death, he lives on in our memories as an example to which we should all aspire–an ethical, selfless leader who cared for all patients, always striving to do the right thing.
LCpl Benjamin Whetstone Schmidt
1987-2011
David R. Schmidt, MD
A Fallen Hero’s Legacy
On September 11, 2011, LCpl Benjamin Whetstone Schmidt posted on his Facebook page, “I guess you can use today as a reason for us to be here in Afghanistan. Just know I am fighting for myself, but most of all for my friends and family who read this. Everyone, it’s an honor to be your ambassador.”
Benjamin was a Marine Scout Sniper on his second tour to Afghanistan, this time voluntarily. Not one member of his platoon had combat experience. He felt called to lead, to be with his boys. During his first deployment to Afghanistan he was awarded the Navy/USMC Achievement Medal with Valor for his action in combat.
Less than a month later, on October 6, 2011, he was killed while on patrol in Helmand Province. Even now, 6 years after his death, his comrades continue to hail his virtues as a leader, a friend, a patriot, and an inspiration. He was also a fine athlete and a courageous, energetic young man with bold plans for his future.
Other than his family, few knew what Benjamin would inspire in his death. He left $200,000 of his life insurance to establish a scholarship in the History Department at his beloved Texas Christian University (TCU). With a matching gift from his father, orthopedic surgeon David R. Schmidt, MD, and stepmom Teresa, the scholarship provides annual funding for a graduate student. Asked why he chose to support graduate students, Benjamin replied with his signature humor and wisdom, “I wouldn’t invest in a freshman like myself.” Benjamin had spent 2 years at TCU prior to enlisting in the Marine Corps, and intended to return to TCU to complete his undergraduate and graduate degrees.
Certainly not many young men at age 24 years, prior to going to war, have the foresight to envision and implement a legacy bigger than themselves, with the promise of influencing generations into the future. For his actions, Benjamin was a finalist for a Congressional Medal of Honor Society “Citizen Service Before Self” award.
David and Teresa Schmidt subsequently raised $1 million dollars to endow the LCpl Benjamin W. Schmidt Professor of War, Conflict and Society. It is truly inspirational to know that a young man’s selfless vision and his friends’ and family’s support could produce such a lasting legacy.
Warren R. Kadrmas, MD, COL, MC, USAF
November 6, 1969-May 8, 2014
Matthew T. Provencher, MD, CAPT, MC, USNR, and John M. Tokish, MD
A Selfless Leader and Former Head of Air Force Orthopedics
In 2014, we tragically lost a true friend, outstanding clinician, great family man, and incredible human being. As one of the preeminent sports orthopedists in the military, Dr. Kadrmas was beloved by all and heralded for his many selfless contributions to military musculoskeletal medicine and injury prevention. He was known for his humble nature and steadfast integrity, and served as an exemplary role model whom we all aspired to emulate. We all remember our time with Warren fondly, and he left us all with lasting memories to cherish and countless stories sure to regale.
Warren Kadrmas was born in 1969 in Vermillion, South Dakota and grew up in Sheridan, Wyoming. Dr. Kadrmas graduated with distinction from both the US Air Force Academy in 1992 and Duke University School of Medicine in 1996. He then went on to complete his residency in 2003 at the Hospital for Special Surgery (HSS) in New York City and was recognized with the Jean C. McDaniel Outstanding Resident Award. He began his Air Force orthopedic career at Wilford Hall Ambulatory Surgical Center on the grounds of Lackland Air Force Base in San Antonio, Texas as part of the 59th Medical Wing. Warren was deployed and served as 1 of 5 people on the mobile-field surgical team assigned to the 379th Expeditionary Medical Group. Subsequently, he returned to HSS, where he excelled in sports medicine and shoulder service subspecialty training.
After his fellowship, Warren returned to San Antonio to continue his work as a top military sports surgeon, serving as a mentor, educator, and leader for all of Air Force orthopedics. During this time he served several tours overseas, becoming an invaluable member of the 332nd Expeditionary Medical Group operating out of the Air Force Theater Hospital at Balad Air Base, Iraq. Warren served as the Program Director of the Orthopedic Residency Program at Wilford Hall Ambulatory Surgical Center. He held the position of Head of Orthopedics for the Air Force as Orthopedic Surgery Consultant to the Air Force Surgeon General for 5 years, a role that entailed coordinating all orthopedic assets for the Global War on Terror for the Air Force. Selfless to a fault, he would never ask anything of anyone that he had not done himself. He completed 6 deployments away from family, loved ones, and work in San Antonio.
A true innovator and visionary, Warren was a pioneer in the integration of high-caliber hip arthroscopy, as well as cutting-edge shoulder and knee care for our active-duty military personnel. He was a prominent member of the American Orthopaedic Society for Sports Medicine (AOSSM) and Arthroscopy Association of North America, and was in line to be the incoming President of the Society of Military Orthopaedic Surgeons, after having previously served as the society’s 2nd Vice President. He was selected for and was scheduled to participate in the AOSSM Traveling Fellowship touring Asia just prior to his untimely accident.
One of Warren’s favorite quotes was on the topic of leading from behind. Nelson Mandela said, “It is better to lead from behind and to put others in front, especially when you celebrate victory when nice things occur. You take the front line when there is danger. Then people will appreciate your leadership.” Warren was the embodiment of this quote. He led from the front, and by example, in times of danger to inspire those he led. But he also honed the skill of leading from behind, with quiet self-sacrifice, to celebrate the success of those he led. His tireless dedication was prominent in all the facets of his life, whether as a father, son, brother, surgeon, educator, mentor, or friend. We miss him dearly, and try to embody his spirit by living our lives through what he taught us all.
Brian Allgood, MD, COL
1960-2007
Dean Taylor, MD
An Exemplary Selfless Leader in Orthopedics and Medicine
When people ask me what effective, ethical healthcare leadership looks like, I think of Brian Allgood. Brian was the epitome of leadership. He led quietly, by example and selflessly–always putting the interests of patients and those on his team ahead of his own.
Brian was a 1982 graduate of the United States Military Academy at West Point, and received a Doctor of Medicine degree from the University of Oklahoma. He completed his orthopedic training at Brooke Army Medical Center in San Antonio. I first met Brian in 1994 when he was practicing as an orthopedic surgeon at Womack Army Medical Center at Ft. Bragg, North Carolina, where he also served at the Division Surgeon for the 82nd Airborne Division. At the time, I was extremely impressed with Brian’s outstanding orthopedic skills, and his unwavering commitment to leadership in orthopedics, military medicine, and medicine.
Brian’s role as the 82nd Airborne Division Surgeon was on the leadership track in Army medicine, a track that many of us who enjoyed and were good at patient care shunned because it was structured to limit the amount of time an administrative leader could spend in patient care. Brian was certainly a skilled orthopedic surgeon who loved caring for patients; however, he was courageous enough to put his responsibility to military medicine and the medical profession ahead of his own clinical interests. He realized that he could provide exceptional leadership that would benefit many instead of only those in his sphere of care. And what an exceptional leader he was!
From 2002 to 2004, I saw firsthand Brian’s extraordinary leadership when he served as the hospital commander of Keller Army Community Hospital at West Point. He was the best hospital commander I worked with during my 11 years at West Point. I saw the sacrifices he made for the rest of us. He gave up something he loved–orthopedic surgery–so that he could effectively lead our hospital. While we operated, he occasionally would look longingly through the operating room (OR) windows. When we saw him, we would invite him to scrub in, much to his delight. He would also show up in other services’ ORs and the hospital’s clinics, staying connected to patients and patient care. This patient-centeredness contributed significantly to the beloved leader he was.
Brian’s final assignment was in 2006 as the Command Surgeon of Multi-National Forces, the highest-ranking medical officer in Iraq. On January 20, 2007, Brian Allgood—on the verge of promotion to brigadier general and on the fast track to Surgeon General of the Army—was killed along with 11 other American service members when their helicopter was shot down.
In his life, Brian was an exemplary leader. After his death, he lives on in our memories as an example to which we should all aspire–an ethical, selfless leader who cared for all patients, always striving to do the right thing.
LCpl Benjamin Whetstone Schmidt
1987-2011
David R. Schmidt, MD
A Fallen Hero’s Legacy
On September 11, 2011, LCpl Benjamin Whetstone Schmidt posted on his Facebook page, “I guess you can use today as a reason for us to be here in Afghanistan. Just know I am fighting for myself, but most of all for my friends and family who read this. Everyone, it’s an honor to be your ambassador.”
Benjamin was a Marine Scout Sniper on his second tour to Afghanistan, this time voluntarily. Not one member of his platoon had combat experience. He felt called to lead, to be with his boys. During his first deployment to Afghanistan he was awarded the Navy/USMC Achievement Medal with Valor for his action in combat.
Less than a month later, on October 6, 2011, he was killed while on patrol in Helmand Province. Even now, 6 years after his death, his comrades continue to hail his virtues as a leader, a friend, a patriot, and an inspiration. He was also a fine athlete and a courageous, energetic young man with bold plans for his future.
Other than his family, few knew what Benjamin would inspire in his death. He left $200,000 of his life insurance to establish a scholarship in the History Department at his beloved Texas Christian University (TCU). With a matching gift from his father, orthopedic surgeon David R. Schmidt, MD, and stepmom Teresa, the scholarship provides annual funding for a graduate student. Asked why he chose to support graduate students, Benjamin replied with his signature humor and wisdom, “I wouldn’t invest in a freshman like myself.” Benjamin had spent 2 years at TCU prior to enlisting in the Marine Corps, and intended to return to TCU to complete his undergraduate and graduate degrees.
Certainly not many young men at age 24 years, prior to going to war, have the foresight to envision and implement a legacy bigger than themselves, with the promise of influencing generations into the future. For his actions, Benjamin was a finalist for a Congressional Medal of Honor Society “Citizen Service Before Self” award.
David and Teresa Schmidt subsequently raised $1 million dollars to endow the LCpl Benjamin W. Schmidt Professor of War, Conflict and Society. It is truly inspirational to know that a young man’s selfless vision and his friends’ and family’s support could produce such a lasting legacy.