User login
Underlying peripheral arterial or venous disease in patients with lower extremity SSTIs
Clinical case
A 56-year-old woman with type 2 diabetes, morbid obesity, and hypertension presents with right lower extremity erythema, weeping, and exquisite tenderness associated with chills. She reports a 2-year history of chronic lower extremity swelling and cramps with a more recent development of scaling and two superficial ulcers on lower third of her leg. For 1 month, she has noted significant pain circumferentially around the ankles with focal tautness and pallor of the skin. She has tried acetaminophen and oxycodone with little relief.
Over the past week, she noted foul smelling discharge from one of the superficial ulcers with redness extending up to the knee prompting presentation to the emergency department. She had a fever to 101.2° F, tachycardia to 105 beats per minute, and leukocytosis to 14.7. She is admitted to the hospitalist service for sepsis secondary to right lower extremity cellulitis.
Introduction
Skin and soft tissue infections (SSTIs) remain among the most common inpatient diagnoses cared for by hospitalists. Most patients admitted to a hospitalist service with an SSTI meet the criteria for either moderate or severe infection as outlined by the Infectious Disease Society of America – systemic signs of infection by SIRS criteria or a high likelihood of an immunocompromised state, methicillin-resistant Staphylococcus aureus infection, trauma, or wounds.1
Often these patients have several comorbid conditions such as diabetes, morbid obesity, or peripheral arterial and venous disease. Though most hospitalists are adept at managing diabetes, blood pressure, and other comorbidities, the ability to recognize and manage peripheral vascular disease can be challenging. This article will discuss ways to help providers better identify and manage underlying peripheral arterial disease (PAD) and/or chronic venous insufficiency (CVI) in patients admitted with lower extremity SSTIs.
1. In addition to an infection, could there also be underlying peripheral arterial or venous disease?
Patients with peripheral edema and vascular disease are predisposed to recurrent lower extremity SSTIs. When assessing for vascular disease, it is important to consider PAD and CVI separately.
CVI refers to the spectrum of syndromes caused by venous valvular incompetency, venous obstruction, or decreased muscle contraction. Veins cannot maximally deliver venous blood back to the heart resulting in venous pooling in the lower extremities. The exact mechanism of the skin changes that accompany venous insufficiency is unknown but may be related to cytokine cascades that result in perivascular inflammation and a weakening of the dermal barrier. Over time, this can develop into spontaneous ulceration of the skin.2,3
PAD refers to atherosclerosis of the noncerebral, noncoronary arteries, which leads to ischemic symptoms and atrophy of the supplied territory. Ulceration usually results from mild trauma due to poor wound healing.4,5 A thorough history, assessment of risk factors, and physical exam are essential to identifying these two potential diagnoses in patients admitted with SSTIs.
First, the provider should assess risk factors for underlying vascular disease. For PAD, these include risk factors similar to those of coronary artery disease (CAD): hypertension, hyperlipidemia, history of smoking, and poorly-controlled diabetes. Chronic kidney disease and family history are also associated with PAD. Since PAD and CAD share similar risk factors, it is often common for patients with CAD (as well as patients with cerebrovascular disease) to have PAD. Risk factors for CVI include obesity, chronic sedentary lifestyle, multiple pregnancies, family history, and prior superficial or deep venous thrombosis.2,4
Next, the provider should ask the patient about symptoms experienced prior to the onset of the current SSTI. Patients with either arterial or venous disease will typically report lower extremity symptoms that have been occurring for months to years, long before the acute SSTI. The classic symptom for PAD is claudication – leg pain or cramping that occurs on exertion and improves with rest. This is due to decreased arterial blood flow to the affected limb, felt most acutely during exercise. Other symptoms include numbness, a cool lower extremity, and lower extremity hair loss. As PAD progresses, a patient may also have rest pain, which may indicate more critical ischemia, as well nonhealing wounds after mild trauma.
In contrast, symptoms of CVI present more variably. CVI can be associated with heaviness, cramping, and pain that are usually worse in the dependent position and relieved with elevation. Patients may also report dry skin, edema, pruritus, scaling, skin tightness, and indolent ulcers at advanced stages.2-6
The physical exam can help the provider distinguish between venous and arterial disease. Patients with PAD often have diminished or nonpalpable distal pulses, bruits in proximal arteries, pallor, hair loss, nail thickening, decreased capillary refill time, and ulceration of the toes. CVI shares some common characteristics but can be distinguished by evidence of varicose veins, telangiectasia, edema (which spares the foot), lipodermatosclerosis, and atrophie blanche (white scarring around the ankle). Patients with venous disease tend to have warm lower extremities and palpable pulses. Often, there is hyperpigmentation, especially around the ankles, and associated eczematous changes with scaling, erythema, and weeping. CVI can also present with ulcers. In addition, if the SSTI is not responding to appropriate antibiotics in the typical time frame, this may be a clue that there is an underlying vascular issue.2-6
Ulcers, whether arterial or venous, comprise a break in the skin’s protective barrier and give bacteria a point of entry. Thus, ulcers often get superinfected, leading to an SSTI rather than SSTIs causing ulcers. The anatomic location can help differentiate between venous and arterial ulcers. Arterial ulcers tend to occur on the toes, heels, and lateral and medial malleoli. Venous ulcers are classically present above the medial malleolus but can occur anywhere on the medial lower third of the leg. Venous ulcers are more superficial and have an irregular shape, while arterial ulcers are deeper, have smoother edges and a “punched-out” shape. Both arterial and venous ulcers can be exudative though venous ulcers are rarely necrotic. Both arterial and venous ulcers can be painful.7-9
2. There are signs and symptoms of underlying vascular disease in a patient with a lower extremity SSTI. Now what?
Neither PAD nor CVI is a clinical diagnosis, thus further work-up is required to confirm the diagnosis and accurately classify disease severity. The timing of this work-up is of unique interest to hospitalists.
Most patients who are hospitalized with cellulitis or a superficial wound infection do not need urgent inpatient work-up of suspected peripheral arterial or venous disease. The one notable exception to this is patients with diabetic foot infections or infected arterial ulcers that need prompt evaluation for possible critical limb ischemia. Barring cases of critical limb ischemia, the main objective of identifying PAD or CVI in patients hospitalized for SSTIs is to appropriately arrange testing and follow-up after discharge.
To address specific management strategies, it is useful to stratify patients by symptom and exam severity as follows: mild/moderate PAD symptoms without ulcer; infected ulcer with PAD features; mild/moderate CVI symptoms without ulcer; and infected ulcer with CVI features. As specific guidelines for the inpatient work-up and management of suspected peripheral arterial and venous disease are sparse, we rely on guidelines and best practices used in the outpatient setting and adapt them to these potential inpatient presentations.
Mild/Moderate PAD symptoms with superimposed cellulitis but no ulceration
In a patient admitted for cellulitis without open wounds, history and review of systems might reveal the presence of claudication or other symptoms suspicious for PAD. While the U.S. Preventative Services Task Force and American College of Cardiology discourages the routine screening of asymptomatic patients for PAD, patients with risk factors who endorse symptoms should undergo initial testing for PAD with an ankle-brachial index (ABI).10
The ABI is the ratio of ankle blood pressure to arm blood pressure, and is measured via sphygmomanometry with a Doppler probe. The ABI remains the simplest, most inexpensive first-line test for PAD. An ABI value of less than 0.9 is considered diagnostic for PAD and has been found to be more than 95% specific for arterial stenoses of greater than 50% on angiography across multiple studies.11
In an inpatient with risk factors for PAD and claudication symptoms, referral for outpatient ABIs with subsequent follow-up by a primary care physician should be arranged. If a diagnosis of PAD is made via ABI, the PCP should reinforce risk factor modification (tobacco cessation, diet, exercise, and aggressive lipid, blood pressure and blood glucose control) and start medical management with a single anti-platelet agent to reduce the risk of MI, stroke, or “vascular death.” The most recent ACC guidelines recommend either aspirin or clopidogrel as an acceptable anti-platelet agent (grade 1A).12 Cilostazol may be considered if claudication symptoms are significantly interfering with lifestyle. If this management fails, the patient may be referred to a vascular specialist for consideration of revascularization.
Infected ulcer with PAD features
Unlike cellulitis, arterial ulcers are a direct sequela of arterial insufficiency and represent the far end of the spectrum of disease severity and in certain cases treatment failure. Patients who present with advanced ischemic and/or diabetic foot ulcers may have never been evaluated for PAD as an outpatient. Prompt work-up and management is required given the high degree of morbidity and mortality associated with arterial ulcers. Whether an urgent inpatient evaluation is indicated depends on the clinical evaluation.
The first step is to determine the depth of the ulceration. Critical limb ischemia may be present if the ulcer is deep, gangrenous, overlies a bony prominence, or is associated with systemic signs of sepsis. A physical exam should include an assessment of the pulses including femoral, popliteal, PT and DP, preferably with bedside Doppler ultrasound. If pulses are absent, urgent vascular surgery evaluation is warranted to prevent loss of limb; the work-up generally involves imaging such as computed tomography angiography or magnetic resonance angiography to identify culprit lesions, or if sufficiently suspicious, immediate invasive angiogram with the potential for endovascular intervention.
While palpable pulses can be reassuring and raise the possibility of a nonarterial etiology of ulceration – such as a microvascular, neuropathic or venous disease – it is important to remember that pulse exams are often unreliable and provider dependent.13 Moreover, the presence of pulses does not effectively exclude severe PAD or critical limb ischemia in patients with a high pretest probability.14 Thus, in cases of deep, complex lower extremity and foot ulcers, it is prudent to obtain urgent evaluation by a surgical wound specialist, which depending on the institution may be podiatry, vascular surgery, or wound care. This may lead to a better clinical assessment of the wound and clearer recommendations regarding the need for additional testing, such as imaging, to rule out osteomyelitis, surgical debridement, or amputation.
Inpatient ABIs in this situation may help diagnose and quantify the severity of PAD. Newer classification schemes such as the Society of Vascular Surgery Wound Ischemia Foot Infection score take into account clinical findings as well as ABI scores to better prognosticate limb loss and select patients for intervention.15 If the clinical picture is deemed sufficiently suspicious for critical limb ischemia, the patient may be taken directly for invasive testing with possible intervention.
If an infected ulcer is superficial, shows no signs of gangrene, and has been present for less than 30 days, further work-up for suspected PAD can generally be deferred to an outpatient setting after resolution of the acute infection. Management of the wound is highly institution dependent. When available, a wound care specialist (physician or nurse) or a plastic surgeon can be consulted as an inpatient to give specific recommendations that can range anywhere from enzymatic debridement to simple dressing. If this service is unavailable, we recommend dressing the wound with moist nonocclusive dressings with frequent changes. Referrals for ABI testing and follow up in podiatry, wound care, or vascular clinic should be arranged. Finally, educating the patient on what to expect can increase compliance with the outpatient treatment plan.
Mild to moderate CVI symptoms with superimposed cellulitis but no ulceration
Chronic venous insufficiency is a syndrome that has variable presentations based on the location and degree of valvular incompetence in the superficial or, less commonly, deep venous systems. For a patient with cellulitis and CVI, the clinical exam findings may be associated with venous hypertension syndrome – in which there is deep axial reflux and possible obstruction – and could also represent complex varicose disease which is usually caused by superficial reflux of the greater saphenous vein.3 The lack of advanced skin changes and ulceration raises the suspicion of mild to moderate CVI.
Guidelines from the American Venous Forum and the Society for Vascular Surgery recommend that all patients with suspected CVI, regardless of severity, undergo venous duplex ultrasound scanning as a first diagnostic test (grade 1A) to accurately classify the disease according to the Clinical Etiological Anatomical Pathophysiology (CEAP) system (Table 1).16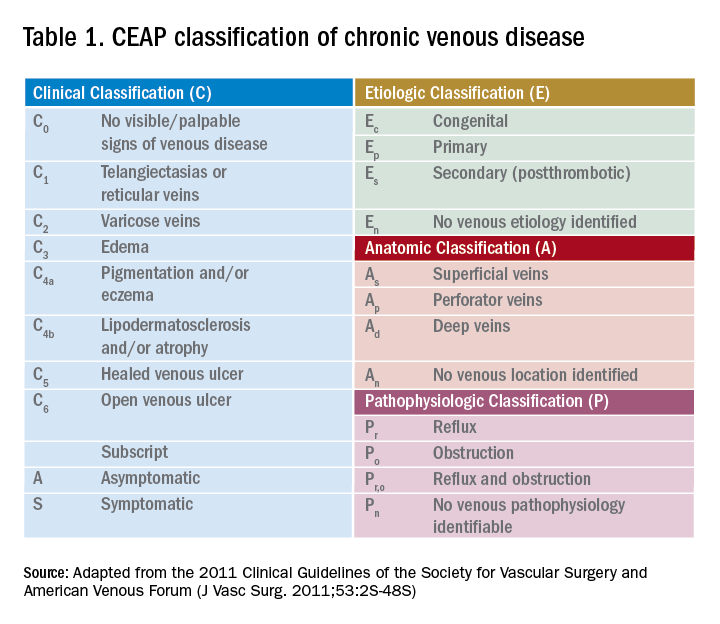
Compression therapy is commonly accepted as a noninvasive treatment option for all levels of CVI, yet most of the evidence comes from secondary prevention studies in patients with advanced CVI with venous ulcers.18 Strong evidence for the role of compression stockings in mild to moderate CVI is lacking. In fact, recent guidelines from the Society of Vascular Surgery, reviewed by the American Heart Association, do not recommend compression therapy as a primary treatment modality in patients with symptomatic varicose veins (without ulcers) if the patient is a candidate for saphenous vein ablation.19 This recommendation is based on clinical trial data that showed greater efficacy and cost-effectiveness of surgery versus conservative management in patients with CEAP2 (low severity) CVI as well as studies noting noncompliance with compression therapy as high as 75%.20-21
However, determining a patient’s candidacy for ablative or surgical therapy requires ultrasound data for accurate CEAP scoring, which is often not achieved as an inpatient. Given the potential benefit and lack of severe adverse effects, hospitalists can consider initiating compression therapy at the time of discharge in a patient with mild to moderate signs of CVI and a low risk profile for severe PAD. The prescription should specify knee-length elastic stockings with graduated compression between 20 to 30 mm Hg.22 The patient should also be encouraged to complete the outpatient duplex ultrasound testing prior to the PCP visit so that he or she can be referred to a vascular specialist appropriately.
Infected ulcer with CVI features
If the patient’s exam is suspicious for advanced venous disease with ulceration, the clinician should evaluate for the presence of scarring. This would indicate that there has been long-standing venous disease with recurrent ulceration. This patient should be asked about a previous diagnosis of CVI, prior compression therapy, and barriers to compliance with compression therapy such as poor fit or difficulty of use due to obesity or immobility. It is important to note that mixed ulcers are present in up to 20% of patients; a careful assessment of risk factors for PAD, pulse exam, and referral for outpatient ABI testing is warranted to rule out arterial insufficiency in this patient with likely venous ulcer.23
The AHA recommends prompt specialist evaluation for CEAP scores greater than or equal to 4; based on physical exam alone, this patient’s active venous ulcer yields the highest possible score of 6.2 If not previously done, this patient with advanced CVI and ulceration should be referred for an outpatient venous duplex ultrasound as well as urgent follow-up with a vascular specialist soon after discharge.
There is significant consensus in the literature that multilayer compression therapy between 30 and 40 mm Hg is the first-line treatment in patients with venous ulcers as it has been shown to promote ulcer healing and prevent recurrence.24-25 In addition, superficial venous surgery, including minimally invasive ablation, can reduce the recurrence of ulcers if used as adjunctive therapy in selected patients.26 However, compressive therapy should generally not be prescribed in patients with venous ulcers until PAD has been ruled out.
If ABI results are available, the clinician can consider compression at 30-40 mm Hg for ABI values greater than 0.8 and reduced compression at 20-30 mm Hg for values of 0.5-0.8; compression is contraindicated if the ABI is less than 0.5. Prompt follow-up with a vascular specialist can help direct compressive and/or surgical therapy. Wound care consultation as an inpatient can assist with dressing recommendations, though the evidence has not shown that dressings of any type worn under compressive garments improve ulcer healing.27
Bottom line
Hospitalists are in a unique position to identify patients with underlying peripheral arterial and venous disease when they are admitted for lower extremity skin and soft tissue infections. A focused history and physical exam can yield significant clinical clues and should prompt either inpatient or outpatient work-up.
In patients with deep ulcers and concern for critical limb ischemia, inpatient consultation should be sought. In patients with superficial venous or arterial ulcers, referral for outpatient ABI, color duplex ultrasound, or both should be made; most of these patients should also be directly referred to a vascular and/or wound specialist. Patients with more benign forms of disease who endorse chronic symptoms suspicious for mild to moderate PAD or CVI can be seen by a PCP for further management. All patients should be educated about the importance of follow-up as it remains their best chance to curb the progression of disease, reduce the risks for recurrent infection, and improve overall quality of life.
Back to the original case
Our patient’s lower extremity erythema, fever, and leukocytosis improved with 3 days of IV vancomycin treatment. Her wound was kept clean with moist dressings and showed no signs of deep infection; with elevation, her bilateral lower extremity edema also improved. Her physical exam findings and clinical history were highly suspicious for long-standing CVI. She was discharged with oral antibiotics and a referral to wound care for ongoing management of her superficial ulcers. An outpatient venous duplex ultrasound and ABI were scheduled prior to her vascular surgery appointment to effectively rule out PAD before consideration of further therapy for severe CVI.

Key Points
- Hospitalists are in a unique position to identify patients with peripheral vascular disease when they are admitted with SSTIs.
- When assessing patients, it is important to consider peripheral arterial disease (PAD) and chronic venous insufficiency (CVI) separately.
- The classic symptom for PAD is claudication. In contrast, symptoms of CVI present more variably.
- Barring cases of critical limb ischemia, the main objective of identifying PAD or CVI is to arrange testing and follow-up after discharge.
References
1. Stevens, DL, et al. Practice guidelines for the diagnosis and management of skin and soft tissue infections: 2014 Update by the Infectious Diseases Society of America. Clin Infect Dis. 2014;59(2):147-59.
2. Eberhardt, RT, et al. Chronic venous insufficiency. Circulation. 2014;130:333-46.
3. Raju, S, et al. Chronic venous insufficiency and varicose veins. N Engl J Med. 2009;360:2319-27.
4. Kullo, IJ, et al. Peripheral artery disease. N Engl J Med. 2016;374(9):861-71.
5. Hennion D, et al. Diagnosis and treatment of peripheral arterial disease. Am Fam Physician. 2013 Sep 1;88(5):306-10.
6. Henke P, et al. ACP Observer Extra: Peripheral arterial disease. June 2007.
7. Vivas A. Venous leg ulcers. Ann Intern Med. 2016;165(3):ITC17-32.
8. Sumpio BE. Foot ulcers. N Engl J Med. 2000;343(11):787-93.
9. Bazari H, et al. Case 7–2007. 59-year-old woman with diabetic renal disease and nonhealing skin ulcers. N Engl J Med. 2007 Mar 8; 356(10):1049-57.
10. Moyer VA. Screening for peripheral artery disease and cardiovascular disease risk assessment with the ankle-brachial index in adults: U.S. Preventive Services Task Force recommendation statement. Ann Intern Med. 2013 Sep 3.159(5):342-8.
11. Khan TH, et al. Critical review of the ankle brachial index. Curr Cardiol Rev. 2008 May;4(2):101-6.
12. Gerhard-Herman MD, et al. 2016 AHA/ACC guideline on the management of patients with lower extremity peripheral artery disease. A Report of the American College of Cardiology/American Heart Association Task Force on Clinical Practice Guidelines. 2016.
13. Brearley S, et al. Peripheral pulse palpation: An unreliable physical sign. Ann R Coll Surg Engl. 1992;74:169-71.
14. Khan NA, et al. Does the clinical examination predict lower extremity peripheral arterial disease? JAMA. 2006;295(5):536-46.
15. Mills JL Sr., et al. The Society for Vascular Surgery Lower Extremity Threatened Limb Classification System: Risk stratification based on wound, ischemia, and foot infection (WIfI). J Vasc Surg. 2014 Jan;59(1):220-34.e1-2.
16. Gloviczki P, et al. The care of patients with varicose veins and associated chronic venous diseases: Clinical practice guidelines of the Society for Vascular Surgery and the American Venous Forum. J Vasc Surg. 2011;53(5, Suppl):2S-48S.
17. Hamper UM,et al. Ultrasound evaluation of the lower extremity veins. Radiol Clin North Am. 2007 May;45(3):525-47.
18. Vivas A. Venous leg ulcers. Ann Intern Med. 2016;165(3):ITC17-32.
19. Gloviczki P, et al. The care of patients with varicose veins and associated chronic venous diseases: Clinical practice guidelines of the Society for Vascular Surgery and the American Venous Forum. J Vasc Surg. 2011;53(5, Suppl):2S-48S.
20. Michaels JA, et al. Randomized clinical trial comparing surgery with conservative treatment for uncomplicated varicose veins. Br J Surg. 2006 Feb;93(2):175-81.
21. Raju S, et al. Use of compression stockings in chronic venous disease: Patient compliance and efficacy. Ann Vasc Surg. 2007 Nov;21(6):790-5.
22. Gloviczki P, et al. The care of patients with varicose veins and associated chronic venous diseases: Clinical practice guidelines of the Society for Vascular Surgery and the American Venous Forum. J Vasc Surg. 2011;53(5, Suppl):2S-48S.
23. Humphreys ML, et al. Management of mixed arterial and venous leg ulcers. Br J Surg. 2007 Sep;94(9):1104-7.
24. O’Meara S, et al. Compression for venous leg ulcers. Cochrane Database Syst Rev. 2012 Nov 14;11:CD000265.
25. Dolibog P, et al. A comparative clinical study on five types of compression therapy in patients with venous leg ulcers. Int J Med Sci. 2013;11(1):34-43.
26. Gohel MS, et al. Long term results of compression therapy alone versus compression plus surgery in chronic venous ulceration (ESCHAR): Randomised controlled trial. BMJ. 2007 Jul 14;335(7610):83.
27. Palfreyman S, et al. Dressings for venous leg ulcers: systematic review and meta-analysis. BMJ. 2007 Aug 4;335(7613):244.
Clinical case
A 56-year-old woman with type 2 diabetes, morbid obesity, and hypertension presents with right lower extremity erythema, weeping, and exquisite tenderness associated with chills. She reports a 2-year history of chronic lower extremity swelling and cramps with a more recent development of scaling and two superficial ulcers on lower third of her leg. For 1 month, she has noted significant pain circumferentially around the ankles with focal tautness and pallor of the skin. She has tried acetaminophen and oxycodone with little relief.
Over the past week, she noted foul smelling discharge from one of the superficial ulcers with redness extending up to the knee prompting presentation to the emergency department. She had a fever to 101.2° F, tachycardia to 105 beats per minute, and leukocytosis to 14.7. She is admitted to the hospitalist service for sepsis secondary to right lower extremity cellulitis.
Introduction
Skin and soft tissue infections (SSTIs) remain among the most common inpatient diagnoses cared for by hospitalists. Most patients admitted to a hospitalist service with an SSTI meet the criteria for either moderate or severe infection as outlined by the Infectious Disease Society of America – systemic signs of infection by SIRS criteria or a high likelihood of an immunocompromised state, methicillin-resistant Staphylococcus aureus infection, trauma, or wounds.1
Often these patients have several comorbid conditions such as diabetes, morbid obesity, or peripheral arterial and venous disease. Though most hospitalists are adept at managing diabetes, blood pressure, and other comorbidities, the ability to recognize and manage peripheral vascular disease can be challenging. This article will discuss ways to help providers better identify and manage underlying peripheral arterial disease (PAD) and/or chronic venous insufficiency (CVI) in patients admitted with lower extremity SSTIs.
1. In addition to an infection, could there also be underlying peripheral arterial or venous disease?
Patients with peripheral edema and vascular disease are predisposed to recurrent lower extremity SSTIs. When assessing for vascular disease, it is important to consider PAD and CVI separately.
CVI refers to the spectrum of syndromes caused by venous valvular incompetency, venous obstruction, or decreased muscle contraction. Veins cannot maximally deliver venous blood back to the heart resulting in venous pooling in the lower extremities. The exact mechanism of the skin changes that accompany venous insufficiency is unknown but may be related to cytokine cascades that result in perivascular inflammation and a weakening of the dermal barrier. Over time, this can develop into spontaneous ulceration of the skin.2,3
PAD refers to atherosclerosis of the noncerebral, noncoronary arteries, which leads to ischemic symptoms and atrophy of the supplied territory. Ulceration usually results from mild trauma due to poor wound healing.4,5 A thorough history, assessment of risk factors, and physical exam are essential to identifying these two potential diagnoses in patients admitted with SSTIs.
First, the provider should assess risk factors for underlying vascular disease. For PAD, these include risk factors similar to those of coronary artery disease (CAD): hypertension, hyperlipidemia, history of smoking, and poorly-controlled diabetes. Chronic kidney disease and family history are also associated with PAD. Since PAD and CAD share similar risk factors, it is often common for patients with CAD (as well as patients with cerebrovascular disease) to have PAD. Risk factors for CVI include obesity, chronic sedentary lifestyle, multiple pregnancies, family history, and prior superficial or deep venous thrombosis.2,4
Next, the provider should ask the patient about symptoms experienced prior to the onset of the current SSTI. Patients with either arterial or venous disease will typically report lower extremity symptoms that have been occurring for months to years, long before the acute SSTI. The classic symptom for PAD is claudication – leg pain or cramping that occurs on exertion and improves with rest. This is due to decreased arterial blood flow to the affected limb, felt most acutely during exercise. Other symptoms include numbness, a cool lower extremity, and lower extremity hair loss. As PAD progresses, a patient may also have rest pain, which may indicate more critical ischemia, as well nonhealing wounds after mild trauma.
In contrast, symptoms of CVI present more variably. CVI can be associated with heaviness, cramping, and pain that are usually worse in the dependent position and relieved with elevation. Patients may also report dry skin, edema, pruritus, scaling, skin tightness, and indolent ulcers at advanced stages.2-6
The physical exam can help the provider distinguish between venous and arterial disease. Patients with PAD often have diminished or nonpalpable distal pulses, bruits in proximal arteries, pallor, hair loss, nail thickening, decreased capillary refill time, and ulceration of the toes. CVI shares some common characteristics but can be distinguished by evidence of varicose veins, telangiectasia, edema (which spares the foot), lipodermatosclerosis, and atrophie blanche (white scarring around the ankle). Patients with venous disease tend to have warm lower extremities and palpable pulses. Often, there is hyperpigmentation, especially around the ankles, and associated eczematous changes with scaling, erythema, and weeping. CVI can also present with ulcers. In addition, if the SSTI is not responding to appropriate antibiotics in the typical time frame, this may be a clue that there is an underlying vascular issue.2-6
Ulcers, whether arterial or venous, comprise a break in the skin’s protective barrier and give bacteria a point of entry. Thus, ulcers often get superinfected, leading to an SSTI rather than SSTIs causing ulcers. The anatomic location can help differentiate between venous and arterial ulcers. Arterial ulcers tend to occur on the toes, heels, and lateral and medial malleoli. Venous ulcers are classically present above the medial malleolus but can occur anywhere on the medial lower third of the leg. Venous ulcers are more superficial and have an irregular shape, while arterial ulcers are deeper, have smoother edges and a “punched-out” shape. Both arterial and venous ulcers can be exudative though venous ulcers are rarely necrotic. Both arterial and venous ulcers can be painful.7-9
2. There are signs and symptoms of underlying vascular disease in a patient with a lower extremity SSTI. Now what?
Neither PAD nor CVI is a clinical diagnosis, thus further work-up is required to confirm the diagnosis and accurately classify disease severity. The timing of this work-up is of unique interest to hospitalists.
Most patients who are hospitalized with cellulitis or a superficial wound infection do not need urgent inpatient work-up of suspected peripheral arterial or venous disease. The one notable exception to this is patients with diabetic foot infections or infected arterial ulcers that need prompt evaluation for possible critical limb ischemia. Barring cases of critical limb ischemia, the main objective of identifying PAD or CVI in patients hospitalized for SSTIs is to appropriately arrange testing and follow-up after discharge.
To address specific management strategies, it is useful to stratify patients by symptom and exam severity as follows: mild/moderate PAD symptoms without ulcer; infected ulcer with PAD features; mild/moderate CVI symptoms without ulcer; and infected ulcer with CVI features. As specific guidelines for the inpatient work-up and management of suspected peripheral arterial and venous disease are sparse, we rely on guidelines and best practices used in the outpatient setting and adapt them to these potential inpatient presentations.
Mild/Moderate PAD symptoms with superimposed cellulitis but no ulceration
In a patient admitted for cellulitis without open wounds, history and review of systems might reveal the presence of claudication or other symptoms suspicious for PAD. While the U.S. Preventative Services Task Force and American College of Cardiology discourages the routine screening of asymptomatic patients for PAD, patients with risk factors who endorse symptoms should undergo initial testing for PAD with an ankle-brachial index (ABI).10
The ABI is the ratio of ankle blood pressure to arm blood pressure, and is measured via sphygmomanometry with a Doppler probe. The ABI remains the simplest, most inexpensive first-line test for PAD. An ABI value of less than 0.9 is considered diagnostic for PAD and has been found to be more than 95% specific for arterial stenoses of greater than 50% on angiography across multiple studies.11
In an inpatient with risk factors for PAD and claudication symptoms, referral for outpatient ABIs with subsequent follow-up by a primary care physician should be arranged. If a diagnosis of PAD is made via ABI, the PCP should reinforce risk factor modification (tobacco cessation, diet, exercise, and aggressive lipid, blood pressure and blood glucose control) and start medical management with a single anti-platelet agent to reduce the risk of MI, stroke, or “vascular death.” The most recent ACC guidelines recommend either aspirin or clopidogrel as an acceptable anti-platelet agent (grade 1A).12 Cilostazol may be considered if claudication symptoms are significantly interfering with lifestyle. If this management fails, the patient may be referred to a vascular specialist for consideration of revascularization.
Infected ulcer with PAD features
Unlike cellulitis, arterial ulcers are a direct sequela of arterial insufficiency and represent the far end of the spectrum of disease severity and in certain cases treatment failure. Patients who present with advanced ischemic and/or diabetic foot ulcers may have never been evaluated for PAD as an outpatient. Prompt work-up and management is required given the high degree of morbidity and mortality associated with arterial ulcers. Whether an urgent inpatient evaluation is indicated depends on the clinical evaluation.
The first step is to determine the depth of the ulceration. Critical limb ischemia may be present if the ulcer is deep, gangrenous, overlies a bony prominence, or is associated with systemic signs of sepsis. A physical exam should include an assessment of the pulses including femoral, popliteal, PT and DP, preferably with bedside Doppler ultrasound. If pulses are absent, urgent vascular surgery evaluation is warranted to prevent loss of limb; the work-up generally involves imaging such as computed tomography angiography or magnetic resonance angiography to identify culprit lesions, or if sufficiently suspicious, immediate invasive angiogram with the potential for endovascular intervention.
While palpable pulses can be reassuring and raise the possibility of a nonarterial etiology of ulceration – such as a microvascular, neuropathic or venous disease – it is important to remember that pulse exams are often unreliable and provider dependent.13 Moreover, the presence of pulses does not effectively exclude severe PAD or critical limb ischemia in patients with a high pretest probability.14 Thus, in cases of deep, complex lower extremity and foot ulcers, it is prudent to obtain urgent evaluation by a surgical wound specialist, which depending on the institution may be podiatry, vascular surgery, or wound care. This may lead to a better clinical assessment of the wound and clearer recommendations regarding the need for additional testing, such as imaging, to rule out osteomyelitis, surgical debridement, or amputation.
Inpatient ABIs in this situation may help diagnose and quantify the severity of PAD. Newer classification schemes such as the Society of Vascular Surgery Wound Ischemia Foot Infection score take into account clinical findings as well as ABI scores to better prognosticate limb loss and select patients for intervention.15 If the clinical picture is deemed sufficiently suspicious for critical limb ischemia, the patient may be taken directly for invasive testing with possible intervention.
If an infected ulcer is superficial, shows no signs of gangrene, and has been present for less than 30 days, further work-up for suspected PAD can generally be deferred to an outpatient setting after resolution of the acute infection. Management of the wound is highly institution dependent. When available, a wound care specialist (physician or nurse) or a plastic surgeon can be consulted as an inpatient to give specific recommendations that can range anywhere from enzymatic debridement to simple dressing. If this service is unavailable, we recommend dressing the wound with moist nonocclusive dressings with frequent changes. Referrals for ABI testing and follow up in podiatry, wound care, or vascular clinic should be arranged. Finally, educating the patient on what to expect can increase compliance with the outpatient treatment plan.
Mild to moderate CVI symptoms with superimposed cellulitis but no ulceration
Chronic venous insufficiency is a syndrome that has variable presentations based on the location and degree of valvular incompetence in the superficial or, less commonly, deep venous systems. For a patient with cellulitis and CVI, the clinical exam findings may be associated with venous hypertension syndrome – in which there is deep axial reflux and possible obstruction – and could also represent complex varicose disease which is usually caused by superficial reflux of the greater saphenous vein.3 The lack of advanced skin changes and ulceration raises the suspicion of mild to moderate CVI.
Guidelines from the American Venous Forum and the Society for Vascular Surgery recommend that all patients with suspected CVI, regardless of severity, undergo venous duplex ultrasound scanning as a first diagnostic test (grade 1A) to accurately classify the disease according to the Clinical Etiological Anatomical Pathophysiology (CEAP) system (Table 1).16
Compression therapy is commonly accepted as a noninvasive treatment option for all levels of CVI, yet most of the evidence comes from secondary prevention studies in patients with advanced CVI with venous ulcers.18 Strong evidence for the role of compression stockings in mild to moderate CVI is lacking. In fact, recent guidelines from the Society of Vascular Surgery, reviewed by the American Heart Association, do not recommend compression therapy as a primary treatment modality in patients with symptomatic varicose veins (without ulcers) if the patient is a candidate for saphenous vein ablation.19 This recommendation is based on clinical trial data that showed greater efficacy and cost-effectiveness of surgery versus conservative management in patients with CEAP2 (low severity) CVI as well as studies noting noncompliance with compression therapy as high as 75%.20-21
However, determining a patient’s candidacy for ablative or surgical therapy requires ultrasound data for accurate CEAP scoring, which is often not achieved as an inpatient. Given the potential benefit and lack of severe adverse effects, hospitalists can consider initiating compression therapy at the time of discharge in a patient with mild to moderate signs of CVI and a low risk profile for severe PAD. The prescription should specify knee-length elastic stockings with graduated compression between 20 to 30 mm Hg.22 The patient should also be encouraged to complete the outpatient duplex ultrasound testing prior to the PCP visit so that he or she can be referred to a vascular specialist appropriately.
Infected ulcer with CVI features
If the patient’s exam is suspicious for advanced venous disease with ulceration, the clinician should evaluate for the presence of scarring. This would indicate that there has been long-standing venous disease with recurrent ulceration. This patient should be asked about a previous diagnosis of CVI, prior compression therapy, and barriers to compliance with compression therapy such as poor fit or difficulty of use due to obesity or immobility. It is important to note that mixed ulcers are present in up to 20% of patients; a careful assessment of risk factors for PAD, pulse exam, and referral for outpatient ABI testing is warranted to rule out arterial insufficiency in this patient with likely venous ulcer.23
The AHA recommends prompt specialist evaluation for CEAP scores greater than or equal to 4; based on physical exam alone, this patient’s active venous ulcer yields the highest possible score of 6.2 If not previously done, this patient with advanced CVI and ulceration should be referred for an outpatient venous duplex ultrasound as well as urgent follow-up with a vascular specialist soon after discharge.
There is significant consensus in the literature that multilayer compression therapy between 30 and 40 mm Hg is the first-line treatment in patients with venous ulcers as it has been shown to promote ulcer healing and prevent recurrence.24-25 In addition, superficial venous surgery, including minimally invasive ablation, can reduce the recurrence of ulcers if used as adjunctive therapy in selected patients.26 However, compressive therapy should generally not be prescribed in patients with venous ulcers until PAD has been ruled out.
If ABI results are available, the clinician can consider compression at 30-40 mm Hg for ABI values greater than 0.8 and reduced compression at 20-30 mm Hg for values of 0.5-0.8; compression is contraindicated if the ABI is less than 0.5. Prompt follow-up with a vascular specialist can help direct compressive and/or surgical therapy. Wound care consultation as an inpatient can assist with dressing recommendations, though the evidence has not shown that dressings of any type worn under compressive garments improve ulcer healing.27
Bottom line
Hospitalists are in a unique position to identify patients with underlying peripheral arterial and venous disease when they are admitted for lower extremity skin and soft tissue infections. A focused history and physical exam can yield significant clinical clues and should prompt either inpatient or outpatient work-up.
In patients with deep ulcers and concern for critical limb ischemia, inpatient consultation should be sought. In patients with superficial venous or arterial ulcers, referral for outpatient ABI, color duplex ultrasound, or both should be made; most of these patients should also be directly referred to a vascular and/or wound specialist. Patients with more benign forms of disease who endorse chronic symptoms suspicious for mild to moderate PAD or CVI can be seen by a PCP for further management. All patients should be educated about the importance of follow-up as it remains their best chance to curb the progression of disease, reduce the risks for recurrent infection, and improve overall quality of life.
Back to the original case
Our patient’s lower extremity erythema, fever, and leukocytosis improved with 3 days of IV vancomycin treatment. Her wound was kept clean with moist dressings and showed no signs of deep infection; with elevation, her bilateral lower extremity edema also improved. Her physical exam findings and clinical history were highly suspicious for long-standing CVI. She was discharged with oral antibiotics and a referral to wound care for ongoing management of her superficial ulcers. An outpatient venous duplex ultrasound and ABI were scheduled prior to her vascular surgery appointment to effectively rule out PAD before consideration of further therapy for severe CVI.
Key Points
- Hospitalists are in a unique position to identify patients with peripheral vascular disease when they are admitted with SSTIs.
- When assessing patients, it is important to consider peripheral arterial disease (PAD) and chronic venous insufficiency (CVI) separately.
- The classic symptom for PAD is claudication. In contrast, symptoms of CVI present more variably.
- Barring cases of critical limb ischemia, the main objective of identifying PAD or CVI is to arrange testing and follow-up after discharge.
References
1. Stevens, DL, et al. Practice guidelines for the diagnosis and management of skin and soft tissue infections: 2014 Update by the Infectious Diseases Society of America. Clin Infect Dis. 2014;59(2):147-59.
2. Eberhardt, RT, et al. Chronic venous insufficiency. Circulation. 2014;130:333-46.
3. Raju, S, et al. Chronic venous insufficiency and varicose veins. N Engl J Med. 2009;360:2319-27.
4. Kullo, IJ, et al. Peripheral artery disease. N Engl J Med. 2016;374(9):861-71.
5. Hennion D, et al. Diagnosis and treatment of peripheral arterial disease. Am Fam Physician. 2013 Sep 1;88(5):306-10.
6. Henke P, et al. ACP Observer Extra: Peripheral arterial disease. June 2007.
7. Vivas A. Venous leg ulcers. Ann Intern Med. 2016;165(3):ITC17-32.
8. Sumpio BE. Foot ulcers. N Engl J Med. 2000;343(11):787-93.
9. Bazari H, et al. Case 7–2007. 59-year-old woman with diabetic renal disease and nonhealing skin ulcers. N Engl J Med. 2007 Mar 8; 356(10):1049-57.
10. Moyer VA. Screening for peripheral artery disease and cardiovascular disease risk assessment with the ankle-brachial index in adults: U.S. Preventive Services Task Force recommendation statement. Ann Intern Med. 2013 Sep 3.159(5):342-8.
11. Khan TH, et al. Critical review of the ankle brachial index. Curr Cardiol Rev. 2008 May;4(2):101-6.
12. Gerhard-Herman MD, et al. 2016 AHA/ACC guideline on the management of patients with lower extremity peripheral artery disease. A Report of the American College of Cardiology/American Heart Association Task Force on Clinical Practice Guidelines. 2016.
13. Brearley S, et al. Peripheral pulse palpation: An unreliable physical sign. Ann R Coll Surg Engl. 1992;74:169-71.
14. Khan NA, et al. Does the clinical examination predict lower extremity peripheral arterial disease? JAMA. 2006;295(5):536-46.
15. Mills JL Sr., et al. The Society for Vascular Surgery Lower Extremity Threatened Limb Classification System: Risk stratification based on wound, ischemia, and foot infection (WIfI). J Vasc Surg. 2014 Jan;59(1):220-34.e1-2.
16. Gloviczki P, et al. The care of patients with varicose veins and associated chronic venous diseases: Clinical practice guidelines of the Society for Vascular Surgery and the American Venous Forum. J Vasc Surg. 2011;53(5, Suppl):2S-48S.
17. Hamper UM,et al. Ultrasound evaluation of the lower extremity veins. Radiol Clin North Am. 2007 May;45(3):525-47.
18. Vivas A. Venous leg ulcers. Ann Intern Med. 2016;165(3):ITC17-32.
19. Gloviczki P, et al. The care of patients with varicose veins and associated chronic venous diseases: Clinical practice guidelines of the Society for Vascular Surgery and the American Venous Forum. J Vasc Surg. 2011;53(5, Suppl):2S-48S.
20. Michaels JA, et al. Randomized clinical trial comparing surgery with conservative treatment for uncomplicated varicose veins. Br J Surg. 2006 Feb;93(2):175-81.
21. Raju S, et al. Use of compression stockings in chronic venous disease: Patient compliance and efficacy. Ann Vasc Surg. 2007 Nov;21(6):790-5.
22. Gloviczki P, et al. The care of patients with varicose veins and associated chronic venous diseases: Clinical practice guidelines of the Society for Vascular Surgery and the American Venous Forum. J Vasc Surg. 2011;53(5, Suppl):2S-48S.
23. Humphreys ML, et al. Management of mixed arterial and venous leg ulcers. Br J Surg. 2007 Sep;94(9):1104-7.
24. O’Meara S, et al. Compression for venous leg ulcers. Cochrane Database Syst Rev. 2012 Nov 14;11:CD000265.
25. Dolibog P, et al. A comparative clinical study on five types of compression therapy in patients with venous leg ulcers. Int J Med Sci. 2013;11(1):34-43.
26. Gohel MS, et al. Long term results of compression therapy alone versus compression plus surgery in chronic venous ulceration (ESCHAR): Randomised controlled trial. BMJ. 2007 Jul 14;335(7610):83.
27. Palfreyman S, et al. Dressings for venous leg ulcers: systematic review and meta-analysis. BMJ. 2007 Aug 4;335(7613):244.
Hispanics trail blacks, whites in bariatric surgery rates
SAN DIEGO – A study of procedures at academic centers provides evidence that obese Hispanics in the United States undergo bariatric surgery at a much lower rate than whites and blacks. It also reveals marked regional variations in overall weight-loss surgery.
“Our findings do suggest that severely obese Hispanics are utilizing bariatric surgery much lower than other ethnic groups,” said study coauthor Ninh T. Nguyen, MD, FACS, chair of the department of surgery at the University of California Irvine Medical Center, in an interview. “Our research does not specifically address the reasons for this gap in the delivery of care. Further research will need to be done to understand the reasons and the ways to close this gap.”

According to Dr. Nguyen, the researchers undertook the study to better understand how bariatric surgery is delivered across ethnicities and geographic regions in the United States.
The researchers analyzed statistics from the Vizient health care performance database for the years 2013-2015. They focused on patients at about 120 academic centers who underwent 73,119 laparoscopic sleeve gastrectomy, laparoscopic Roux-en-Y gastric bypass, and laparoscopic adjustable gastric banding procedures. The patients were stratified by race and region.
Researchers found that bariatric procedures were performed at a much higher rate in the Northeast academic centers (2.21 per 1,000 obese persons), compared with the Midwest (0.73), South (0.50), and West (0.33).
In regard to race, the rates for blacks and whites were fairly similar in the Northeast (2.02 and 2.35 bariatric procedures per 1,000 obese persons, respectively), the South (0.59 and 0.63, respectively) and the West (0.45 and 0.43, respectively). There was a wider gap in the Midwest, with whites at 1.07 and blacks at 0.69.
Across the country, however, obese Hispanics were less likely than persons of the other two races to undergo weight-loss surgery. The gap was fairly small in the Northeast, where 1.74 per 1,000 obese Hispanics underwent weight-loss surgery, compared with rates of 2.02 and 2.35 among black and whites, respectively. But the disparity was much larger in the other parts of the country, with rates at 0.14 in the West, 0.11 in the South and 0.33 in the Midwest, compared with rates from 0.43 to 1.07 among blacks and whites.
The reasons for the surgery gap are unknown. Dr. Nguyen pointed to several possible explanations: “lack of education of obesity as a disease by the primary care providers and the need for referral to a bariatric surgeon for patients with body mass index greater than 40 kg/m2 or 35 kg/m2 with obesity-related comorbidities; poor understanding of the benefits of bariatric surgery and its low risk; lack of understanding of the urgency for treatment by the patient and provider; and hurdles in obtaining coverage for the operation by insurers.”
John Magaña Morton, MD, FACS, chief of bariatric and minimally invasive surgery at Stanford (Calif.) University School of Medicine and past president of the American Society for Metabolic and Bariatric Surgery, doesn’t think discrimination is causing the disparity.
“It’s probably a reflection of insurance status – Hispanics tend to be less insured than Caucasian or African American patients – as well as preference for patients to go to nonacademic centers,” he said.
Indeed, a Kaiser Family Foundation analysis found that 21% of the 52 million Hispanics younger than 65 years in the United States were uninsured in 2015, compared with 9% of whites and 13% of blacks. Only Native Americans/Alaska Natives had an uninsured rate as high as Hispanics.
“In terms of need [for weight-loss features], it’s certainly there for Hispanics,” said Dr. Morton. “[Hispanic patients] have high rates of obesity and diabetes, both of which are helped by bariatric surgery.”
He said about 40% of patients in his Palo Alto, Calif., practice are Hispanic, reflecting the high number in the local population.
It helps that Dr. Morton and several of his partners speak Spanish. “If you have a welcoming environment,” he said, “that can make a difference.”
The study authors and Dr. Morton report no relevant disclosures. No specific study funding is reported.
The AGA Obesity Practice Guide provides a comprehensive, multi-disciplinary process to personalize innovative obesity care for safe and effective weight management, including the use of bariatric endoscopy and surgery. Learn more at www.gastro.org/obesity.
SAN DIEGO – A study of procedures at academic centers provides evidence that obese Hispanics in the United States undergo bariatric surgery at a much lower rate than whites and blacks. It also reveals marked regional variations in overall weight-loss surgery.
“Our findings do suggest that severely obese Hispanics are utilizing bariatric surgery much lower than other ethnic groups,” said study coauthor Ninh T. Nguyen, MD, FACS, chair of the department of surgery at the University of California Irvine Medical Center, in an interview. “Our research does not specifically address the reasons for this gap in the delivery of care. Further research will need to be done to understand the reasons and the ways to close this gap.”
According to Dr. Nguyen, the researchers undertook the study to better understand how bariatric surgery is delivered across ethnicities and geographic regions in the United States.
The researchers analyzed statistics from the Vizient health care performance database for the years 2013-2015. They focused on patients at about 120 academic centers who underwent 73,119 laparoscopic sleeve gastrectomy, laparoscopic Roux-en-Y gastric bypass, and laparoscopic adjustable gastric banding procedures. The patients were stratified by race and region.
Researchers found that bariatric procedures were performed at a much higher rate in the Northeast academic centers (2.21 per 1,000 obese persons), compared with the Midwest (0.73), South (0.50), and West (0.33).
In regard to race, the rates for blacks and whites were fairly similar in the Northeast (2.02 and 2.35 bariatric procedures per 1,000 obese persons, respectively), the South (0.59 and 0.63, respectively) and the West (0.45 and 0.43, respectively). There was a wider gap in the Midwest, with whites at 1.07 and blacks at 0.69.
Across the country, however, obese Hispanics were less likely than persons of the other two races to undergo weight-loss surgery. The gap was fairly small in the Northeast, where 1.74 per 1,000 obese Hispanics underwent weight-loss surgery, compared with rates of 2.02 and 2.35 among black and whites, respectively. But the disparity was much larger in the other parts of the country, with rates at 0.14 in the West, 0.11 in the South and 0.33 in the Midwest, compared with rates from 0.43 to 1.07 among blacks and whites.
The reasons for the surgery gap are unknown. Dr. Nguyen pointed to several possible explanations: “lack of education of obesity as a disease by the primary care providers and the need for referral to a bariatric surgeon for patients with body mass index greater than 40 kg/m2 or 35 kg/m2 with obesity-related comorbidities; poor understanding of the benefits of bariatric surgery and its low risk; lack of understanding of the urgency for treatment by the patient and provider; and hurdles in obtaining coverage for the operation by insurers.”
John Magaña Morton, MD, FACS, chief of bariatric and minimally invasive surgery at Stanford (Calif.) University School of Medicine and past president of the American Society for Metabolic and Bariatric Surgery, doesn’t think discrimination is causing the disparity.
“It’s probably a reflection of insurance status – Hispanics tend to be less insured than Caucasian or African American patients – as well as preference for patients to go to nonacademic centers,” he said.
Indeed, a Kaiser Family Foundation analysis found that 21% of the 52 million Hispanics younger than 65 years in the United States were uninsured in 2015, compared with 9% of whites and 13% of blacks. Only Native Americans/Alaska Natives had an uninsured rate as high as Hispanics.
“In terms of need [for weight-loss features], it’s certainly there for Hispanics,” said Dr. Morton. “[Hispanic patients] have high rates of obesity and diabetes, both of which are helped by bariatric surgery.”
He said about 40% of patients in his Palo Alto, Calif., practice are Hispanic, reflecting the high number in the local population.
It helps that Dr. Morton and several of his partners speak Spanish. “If you have a welcoming environment,” he said, “that can make a difference.”
The study authors and Dr. Morton report no relevant disclosures. No specific study funding is reported.
The AGA Obesity Practice Guide provides a comprehensive, multi-disciplinary process to personalize innovative obesity care for safe and effective weight management, including the use of bariatric endoscopy and surgery. Learn more at www.gastro.org/obesity.
AT THE ACS CLINICAL CONGRESS
Key clinical point: At academic centers, obese Hispanics undergo bariatric surgery at a much lower rate than blacks and whites. U.S. regions outside the Northeast have lower rates of weight-loss procedures overall.
Major finding: Outside the Northeast, the bariatric surgery rate per 1,000 obese people is much lower for Hispanics (range, 0.11-0.33) than for blacks and whites (range, 0.43-1.07).
Data source: Analysis of 73,119 bariatric procedures from 2013-2015 at about 120 academic centers.
Disclosures: The study authors report no relevant disclosures. No specific study funding is reported.
Debunking Psoriasis Myths: Which Psoriasis Therapies Can Be Used in Pregnant Women?
Myth: Psoriasis Treatments Should Not Be Used During Pregnancy
It is likely that dermatologists will encounter female patients with psoriasis who are pregnant or wish to become pregnant during the course of their psoriasis treatment. Earlier this year Porter et al evaluated several psoriasis therapies and discussed their safety for patients with psoriasis during pregnancy. Because psoriasis is a risk factor for adverse pregnancy outcomes, control of disease prior to and during pregnancy may optimize maternal and fetal health, according to the authors. As a result, they outlined the following treatment recommendations:
- Consider anti–tumor necrosis factor (TNF) α agents over IL-12/IL-23 and IL-17 inhibitors.
- Anti–TNF-α agents can be used during the first half of pregnancy.
- Longer-term use of anti–TNF-α agents during pregnancy can be considered depending on psoriasis disease severity.
- If biologic therapy is required during pregnancy, use certolizumab because it does not cross the placenta in significant amounts; etanercept also may be a reasonable alternative.
- Babies born to mothers who are continually treated with biologic agents should not be administered live vaccinations for at least 6 months after birth due to the increased risk of infection; inactive vaccinations can be administered according to Centers for Disease Control and Prevention guidelines.
- Breastfeeding by mothers currently treated with anti–TNF-α agents is generally considered safe.
- Cotreatment with methotrexate and a biologic agent should be avoided.
However, the National Psoriasis Foundation guidelines for treating psoriasis in pregnant or breastfeeding women advise that topical treatments are the first choice of treatment, particularly moisturizers and emollients. Limited use of low- to moderate-potency topical steroids appears to be safe, but women should avoid applying topical steroids to the breasts. Second-line treatment is narrowband UVB phototherapy; if narrowband UVB is not available, use broadband UVB. Breastfeeding women should avoid psoralen plus UVA. The foundation also advises that systemic and biologic drugs should be avoided while pregnant or breastfeeding unless there is a clear medical need. Childbearing women should avoid oral retinoids, methotrexate, and cyclosporine due to a link to birth defects. A useful table of US Food and Drug Administration–approved psoriasis treatments and their category for use by pregnant and breastfeeding women is available online. Specifically, drugs that should absolutely be avoided in this patient population include acitretin, methotrexate, and tazarotene.
For some patients, discontinuing therapy may not be practical. Dermatologists should be prepared to weigh the risks and benefits of treatment to advise patients appropriately. According to Dr. Jeffrey M. Weinberg’s pearls for treating psoriasis in pregnant women in Cutis, “Most biologic therapies are pregnancy category B. We still use these drugs with caution in the setting of pregnancy. If a pregnant patient does wish to continue a biologic therapy, close monitoring and enrollment in a pregnancy registry would be good options.”
RELATED ARTICLE: How to Manage Psoriasis Safely in Pregnant Women
More research is necessary; however, pregnant women often are excluded from clinical trials. Therefore, adverse outcomes should be reported to registries such as the Organization of Teratology Information Specialists or others sponsored by drug manufacturers, which will aid in understanding the effects of psoriasis treatments in pregnant and breastfeeding women.
Expert Commentary
The treatment of psoriasis in pregnancy should be approached in a thoughtful manner. While we always want to minimize therapeutic interventions in pregnant individuals, we also want to maintain control of a disease such as psoriasis. As outlined in this article, there is good amount of flexibility in terms of therapies available to us. It is important to discuss the situation carefully, including the benefits and risks, with the patient and the obstetric professionals, in order to design the optimal regimen for each individual.
—Jeffrey M. Weinberg (New York, New York)
FDA determinations for pregnant and nursing women. National Psoriasis Foundation website. https://www.psoriasis.org/pregnancy/fda-determinations. Accessed December 4, 2017.
Porter ML, Lockwood SJ, Kimball AB. Update on biologic safety for patients with psoriasis during pregnancy. Int J Womens Dermatol. 2017;3:21-25.
Psoriasis and pregnancy: treatment options, psoriatic arthritis, and genetics. National Psoriasis Foundation website. https://www.psoriasis.org/pregnancy. Accessed December 4, 2017.
Weinberg JM. Treating psoriasis in pregnant women. Cutis. 2015;96:80.
Myth: Psoriasis Treatments Should Not Be Used During Pregnancy
It is likely that dermatologists will encounter female patients with psoriasis who are pregnant or wish to become pregnant during the course of their psoriasis treatment. Earlier this year Porter et al evaluated several psoriasis therapies and discussed their safety for patients with psoriasis during pregnancy. Because psoriasis is a risk factor for adverse pregnancy outcomes, control of disease prior to and during pregnancy may optimize maternal and fetal health, according to the authors. As a result, they outlined the following treatment recommendations:
- Consider anti–tumor necrosis factor (TNF) α agents over IL-12/IL-23 and IL-17 inhibitors.
- Anti–TNF-α agents can be used during the first half of pregnancy.
- Longer-term use of anti–TNF-α agents during pregnancy can be considered depending on psoriasis disease severity.
- If biologic therapy is required during pregnancy, use certolizumab because it does not cross the placenta in significant amounts; etanercept also may be a reasonable alternative.
- Babies born to mothers who are continually treated with biologic agents should not be administered live vaccinations for at least 6 months after birth due to the increased risk of infection; inactive vaccinations can be administered according to Centers for Disease Control and Prevention guidelines.
- Breastfeeding by mothers currently treated with anti–TNF-α agents is generally considered safe.
- Cotreatment with methotrexate and a biologic agent should be avoided.
However, the National Psoriasis Foundation guidelines for treating psoriasis in pregnant or breastfeeding women advise that topical treatments are the first choice of treatment, particularly moisturizers and emollients. Limited use of low- to moderate-potency topical steroids appears to be safe, but women should avoid applying topical steroids to the breasts. Second-line treatment is narrowband UVB phototherapy; if narrowband UVB is not available, use broadband UVB. Breastfeeding women should avoid psoralen plus UVA. The foundation also advises that systemic and biologic drugs should be avoided while pregnant or breastfeeding unless there is a clear medical need. Childbearing women should avoid oral retinoids, methotrexate, and cyclosporine due to a link to birth defects. A useful table of US Food and Drug Administration–approved psoriasis treatments and their category for use by pregnant and breastfeeding women is available online. Specifically, drugs that should absolutely be avoided in this patient population include acitretin, methotrexate, and tazarotene.
For some patients, discontinuing therapy may not be practical. Dermatologists should be prepared to weigh the risks and benefits of treatment to advise patients appropriately. According to Dr. Jeffrey M. Weinberg’s pearls for treating psoriasis in pregnant women in Cutis, “Most biologic therapies are pregnancy category B. We still use these drugs with caution in the setting of pregnancy. If a pregnant patient does wish to continue a biologic therapy, close monitoring and enrollment in a pregnancy registry would be good options.”
RELATED ARTICLE: How to Manage Psoriasis Safely in Pregnant Women
More research is necessary; however, pregnant women often are excluded from clinical trials. Therefore, adverse outcomes should be reported to registries such as the Organization of Teratology Information Specialists or others sponsored by drug manufacturers, which will aid in understanding the effects of psoriasis treatments in pregnant and breastfeeding women.
Expert Commentary
The treatment of psoriasis in pregnancy should be approached in a thoughtful manner. While we always want to minimize therapeutic interventions in pregnant individuals, we also want to maintain control of a disease such as psoriasis. As outlined in this article, there is good amount of flexibility in terms of therapies available to us. It is important to discuss the situation carefully, including the benefits and risks, with the patient and the obstetric professionals, in order to design the optimal regimen for each individual.
—Jeffrey M. Weinberg (New York, New York)
FDA determinations for pregnant and nursing women. National Psoriasis Foundation website. https://www.psoriasis.org/pregnancy/fda-determinations. Accessed December 4, 2017.
Porter ML, Lockwood SJ, Kimball AB. Update on biologic safety for patients with psoriasis during pregnancy. Int J Womens Dermatol. 2017;3:21-25.
Psoriasis and pregnancy: treatment options, psoriatic arthritis, and genetics. National Psoriasis Foundation website. https://www.psoriasis.org/pregnancy. Accessed December 4, 2017.
Weinberg JM. Treating psoriasis in pregnant women. Cutis. 2015;96:80.

Cosmetic Corner: Dermatologists Weigh in on Wet Skin Moisturizers
To improve patient care and outcomes, leading dermatologists offered their recommendations on wet skin moisturizers. Consideration must be given to:
- Eucerin In-Shower Body Lotion
Beiersdorf
“This product is inexpensive, hypoallergenic, and fragrance free.”—Gary Goldenberg, MD, New York, New York
- Jergens Wet Skin Moisturizer With Refreshing Coconut Oil
Kao USA Inc
“I like how quickly the skin absorbs this product, and coconut oil is an excellent moisturizing ingredient. You simply apply to wet skin straight out of the shower or bath, and gently pat dry.”—Jeannette Graf, MD, Great Neck, New York
- Olay Ultra Moisture In-Shower Body Lotion
Procter & Gamble
“This is a time-saving and nongreasy moisturizing product for patients who are noncompliant with regular moisturizers.”—Shari Lipner, MD, PhD, New York, New York
Cutis invites readers to send us their recommendations. Bar soaps, lip plumpers, and pigment correctors will be featured in upcoming editions of Cosmetic Corner. Please e-mail your recommendation(s) to the Editorial Office.
Disclaimer: Opinions expressed herein do not necessarily reflect those of Cutis or Frontline Medical Communications Inc. and shall not be used for product endorsement purposes. Any reference made to a specific commercial product does not indicate or imply that Cutis or Frontline Medical Communications Inc. endorses, recommends, or favors the product mentioned. No guarantee is given to the effects of recommended products.

Adolescents with chronic health conditions often undervaccinated
said Annika M. Hofstetter, MD, PhD, of Columbia University, New York, and her associates.
The National Health Interview Survey on Disability in 1994-1995 estimated that chronic conditions of any type affected 15%-18% of U.S. children and adolescents. The Advisory Committee on Immunization Practices recommends that all adolescents, whether or not they have chronic medical condition, be vaccinated with human papillomavirus (HPV), Tdap, meningococcal, and flu vaccines.
Fewer adolescents with CMCs had received one more doses of HPV (81%), than did those without CMCs (85%; P less than .01). Fewer adolescents with epilepsy (63%), mental retardation (58%), cerebral palsy (54%), and autism spectrum disorder (46%) had started HPV vaccination, compared with those without each of these conditions (84%; all comparisons, P less than .001). No differences were seen for asthma or congenital heart disease, the investigators said.
More adolescents with CMCs had gotten their flu shot than did those without CMCs during the 2011-2012 season (67% vs. 50%; P less than .001) or during the 2012-2013 season (74% vs. 65%; P less than .001). More adolescents with asthma got their flu shot than did those without asthma during the 2011-2012 season (69% vs. 51%; P less than .001) or during the 2012-2013 season (74% vs. 65%; P less than .001). No differences were seen for the other common CMCs.
Nonetheless, the mean number of missed opportunities was significantly higher among unvaccinated adolescents with CMCs, compared with those without CMCs, for the first HPV vaccination, meningococcal vaccination, and influenza vaccination in both seasons measured (P less than .001 for all).
“Missed opportunities for the third HPV vaccine dose or Tdap did not differ by CMC status,” Dr. Hofstetter and her associates said.
Read more in the American Journal of Preventive Medicine (2017 Nov;53[5]:680-8).
FROM THE AMERICAN JOURNAL OF PREVENTIVE MEDICINE
Ultrathin bronchoscopy plus radial EBUS unreliable at making diagnoses
TORONTO – Ultrathin bronchoscopy plus radial endobronchial ultrasound is not a great method for determining whether a suspicious lesion is cancerous or benign, suggests new research.
In this study of patients with CT-detected solid lung lesions, the researchers were able to make a diagnosis for only 49% of those whose nodules were evaluated using ultrathin bronchoscopy plus radial endobronchial ultrasound (EBUS).

“When you do CT-guided biopsies of lung lesions, the [diagnostic] yield is about 94%. So do the math” by comparing it to the roughly 50% yield from ultrathin bronchoscopy plus radial EBUS to decide whether the latter procedure is worth doing, she noted.
The study Dr. Tanner and her associates designed compared the diagnostic yield of ultrathin bronchoscopy plus radial EBUS with standard bronchoscopy and fluoroscopy in patients with CT-detected solid lung lesions 1.5-5.0 cm in size. It ran at five U.S. centers and randomized 221 patients: 85 evaluable patients were tested using the standard methods, and 112 evaluable patients were tested using ultrathin bronchoscopy plus radial EBUS. Patients averaged 65-68 years of age and were divided evenly between women and men. Their lesions averaged slightly more than 3 cm. The ultrathin device had a 4 mm wide diameter and had a 2 mm working channel.
The diagnostic yield was 38% among patients who underwent standard bronchoscopy and fluoroscopy, and 49% among those biopsied using ultrathin bronchoscopy and radial EBUS, Dr. Tanner reported. The between-group difference in yield fell short of being statistically significant.
Forty-six of the 53 patients who were not diagnosable using standard bronchoscopy and fluoroscopy crossed over to the investigational method, which produced a diagnosis for an additional seven patients (15% of the biopsied crossover patients).
The results showed that standard bronchoscopy plus fluoroscopy is “very poor” for distinguishing cancerous and benign pulmonary lesions, Dr. Tanner concluded. The yield from ultrathin bronchoscopy plus radial EBUS in her study was similar to the diagnostic yields reported in prior studies of guided bronchoscopy, even when also using radial EBUS, she added.
Given the limitations of ultrathin bronchoscopy plus radial EBUS, Dr. Tanner suggested that the best scenario for using this diagnostic method would be in patients who need a linear EBUS procedure for mediastinal lymph node staging. Such staging often requires a biopsy of the primary tumor to make a cancer diagnosis, and in such cases, “while you’re in the neighborhood, you could do bronchoscopy with an ultrathin scope,” she suggested.
The potential also exists to augment the diagnostic yield of ultrathin bronchoscopy by applying a navigational software platform and needle biopsy, two methods not included in the study, Dr. Tanner noted. “More studies should be done using this combination,” she said.
The study was funded by Olympus. Dr. Tanner has been a consultant to and has received research funding from Olympus. She has also been a consultant to Cook Medical, Integrated Diagnostics, Oncocyte, Veracyte, and Veran Medical Technologies, and she has also received research funding from Cook, Integrated Diagnostics, Oncocyte, Oncimmune, and Veracyte.
[email protected]
On Twitter @mitchelzoler
Although bronchoscopic tools are safe and accurate to evaluate both central and peripheral lung lesions, the diagnostic yield of the different available techniques is variable. In this study, a diagnostic yield of only 49% was achieved when ultrathin bronchoscopy with radial EBUS was performed for diagnosis of solid nodules. This yield is not much better than that obtained from conventional bronchoscopy with fluoroscopic guidance and much lower than the diagnostic yield from transthoracic needle biopsy. While there is no doubt that the advances in minimally invasive technologies for diagnosing lung nodules and diagnosing and staging lung cancer have revolutionized clinical practice, pulmonologists and thoracic surgeons need to recognize not only the utility but also the limitations of the available diagnostic procedures (as well as the cost). These technologies are complimentary and multidisciplinary discussions should facilitate selection of the best procedure for each individual case.

Although bronchoscopic tools are safe and accurate to evaluate both central and peripheral lung lesions, the diagnostic yield of the different available techniques is variable. In this study, a diagnostic yield of only 49% was achieved when ultrathin bronchoscopy with radial EBUS was performed for diagnosis of solid nodules. This yield is not much better than that obtained from conventional bronchoscopy with fluoroscopic guidance and much lower than the diagnostic yield from transthoracic needle biopsy. While there is no doubt that the advances in minimally invasive technologies for diagnosing lung nodules and diagnosing and staging lung cancer have revolutionized clinical practice, pulmonologists and thoracic surgeons need to recognize not only the utility but also the limitations of the available diagnostic procedures (as well as the cost). These technologies are complimentary and multidisciplinary discussions should facilitate selection of the best procedure for each individual case.
Although bronchoscopic tools are safe and accurate to evaluate both central and peripheral lung lesions, the diagnostic yield of the different available techniques is variable. In this study, a diagnostic yield of only 49% was achieved when ultrathin bronchoscopy with radial EBUS was performed for diagnosis of solid nodules. This yield is not much better than that obtained from conventional bronchoscopy with fluoroscopic guidance and much lower than the diagnostic yield from transthoracic needle biopsy. While there is no doubt that the advances in minimally invasive technologies for diagnosing lung nodules and diagnosing and staging lung cancer have revolutionized clinical practice, pulmonologists and thoracic surgeons need to recognize not only the utility but also the limitations of the available diagnostic procedures (as well as the cost). These technologies are complimentary and multidisciplinary discussions should facilitate selection of the best procedure for each individual case.
TORONTO – Ultrathin bronchoscopy plus radial endobronchial ultrasound is not a great method for determining whether a suspicious lesion is cancerous or benign, suggests new research.
In this study of patients with CT-detected solid lung lesions, the researchers were able to make a diagnosis for only 49% of those whose nodules were evaluated using ultrathin bronchoscopy plus radial endobronchial ultrasound (EBUS).
“When you do CT-guided biopsies of lung lesions, the [diagnostic] yield is about 94%. So do the math” by comparing it to the roughly 50% yield from ultrathin bronchoscopy plus radial EBUS to decide whether the latter procedure is worth doing, she noted.
The study Dr. Tanner and her associates designed compared the diagnostic yield of ultrathin bronchoscopy plus radial EBUS with standard bronchoscopy and fluoroscopy in patients with CT-detected solid lung lesions 1.5-5.0 cm in size. It ran at five U.S. centers and randomized 221 patients: 85 evaluable patients were tested using the standard methods, and 112 evaluable patients were tested using ultrathin bronchoscopy plus radial EBUS. Patients averaged 65-68 years of age and were divided evenly between women and men. Their lesions averaged slightly more than 3 cm. The ultrathin device had a 4 mm wide diameter and had a 2 mm working channel.
The diagnostic yield was 38% among patients who underwent standard bronchoscopy and fluoroscopy, and 49% among those biopsied using ultrathin bronchoscopy and radial EBUS, Dr. Tanner reported. The between-group difference in yield fell short of being statistically significant.
Forty-six of the 53 patients who were not diagnosable using standard bronchoscopy and fluoroscopy crossed over to the investigational method, which produced a diagnosis for an additional seven patients (15% of the biopsied crossover patients).
The results showed that standard bronchoscopy plus fluoroscopy is “very poor” for distinguishing cancerous and benign pulmonary lesions, Dr. Tanner concluded. The yield from ultrathin bronchoscopy plus radial EBUS in her study was similar to the diagnostic yields reported in prior studies of guided bronchoscopy, even when also using radial EBUS, she added.
Given the limitations of ultrathin bronchoscopy plus radial EBUS, Dr. Tanner suggested that the best scenario for using this diagnostic method would be in patients who need a linear EBUS procedure for mediastinal lymph node staging. Such staging often requires a biopsy of the primary tumor to make a cancer diagnosis, and in such cases, “while you’re in the neighborhood, you could do bronchoscopy with an ultrathin scope,” she suggested.
The potential also exists to augment the diagnostic yield of ultrathin bronchoscopy by applying a navigational software platform and needle biopsy, two methods not included in the study, Dr. Tanner noted. “More studies should be done using this combination,” she said.
The study was funded by Olympus. Dr. Tanner has been a consultant to and has received research funding from Olympus. She has also been a consultant to Cook Medical, Integrated Diagnostics, Oncocyte, Veracyte, and Veran Medical Technologies, and she has also received research funding from Cook, Integrated Diagnostics, Oncocyte, Oncimmune, and Veracyte.
[email protected]
On Twitter @mitchelzoler
AT CHEST 2017
Key clinical point:
Major finding: The diagnostic yield using ultrathin bronchoscopy with radial EBUS was 49%, while standard bronchoscopy had a 38% yield.
Data source: Multicenter, randomized study with 221 total patients and 197 evaluable patients.
Disclosures: The study was funded by Olympus. Dr. Tanner has been a consultant to and has received research funding from Olympus. She has also been a consultant to Cook Medical, Integrated Diagnostics, Oncocyte, Veracyte, and Veran Medical Technologies, and she has also received research funding from Cook, Integrated Diagnostics, Oncocyte, Oncimmune, and Veracyte.
Treat Hypertension Even Earlier, Guidelines Say
High blood pressure should be treated at 130/80 mm Hg, rather than 140/90, according to findings from a landmark study that support a key change in the 2017 Hypertension Clinical Practice Guidelines.
The American Heart Association and American College of Cardiology announced the update along with the new guidelines, the first comprehensive high blood pressure guidelines in more than a decade.
The changes were informed by results from the NIH-funded Systolic Blood Pressure Intervention Trial (SPRINT), which was designed to determine the best way to treat high blood pressure in adults aged ≥ 50 years who are at high risk for heart disease. The study included > 9,300 participants and remains the largest of its kind to date to examine the effects on cardiovascular and kidney disease of maintaining systolic blood pressure at a lower than previously recommended level.
System helps predict RFS, OS in BCP-ALL

Researchers say they have developed a more accurate risk scoring system for children with B-cell precursor acute lymphoblastic leukemia (BCP-ALL) who are typically thought to have standard- or medium-risk disease.
The scoring system includes 3 factors associated with higher-risk BCP-ALL—the presence of high-risk ALL gene microdeletions, having minimal residual disease (MRD) greater than 5 x 10⁻⁵ at day 33, and being high-risk according to National Cancer Institute (NCI) classification.
The researchers found that children with 2 or more of these characteristics were most likely to relapse or die within 7 years of treatment initiation.
On the other hand, children without any of the 3 characteristics had high rates of relapse-free survival (RFS) and overall survival (OS).
Rosemary Sutton, PhD, of Children’s Cancer Institute in Sydney, New South Wales, Australia, and her colleagues devised this risk scoring system and described it in the British Journal of Haematology.
The researchers created their system with the help of data from 475 patients (ages 1 to 18) who had BCP-ALL and were considered non-high-risk. The patients were enrolled on the ANZCHOG ALL8 trial.
Dr Sutton and her colleagues noted that children with standard- or medium-risk BCP-ALL typically receive less intensive treatment than children with high-risk BCP-ALL. However, some of the standard- and medium-risk patients do relapse.
“For the standard- to medium-risk group, we needed more information to get a better handle on the biology of the child’s cancer to better determine their risk,” Dr Sutton said. “So we supplemented MRD results with 2 other pieces of patient information—the presence or absence of specific gene microdeletions and a score called the NCI risk, based on age and white blood cell count.”
“We tested for microdeletions in 9 genes involved in leukemia and found that 2 of the genes—IKZF1 and P2RY8-CRLF2—were important predictors of relapse.”
The researchers combined patients with IKZF1 intragenic deletions, P2RY8-CRLF2 gene fusion, or both into a “high-risk deletion group.”
And the team based the scoring system on 3 factors—the high-risk deletion group, MRD >5 x 10⁻⁵ at day 33, and high risk according to NCI risk classification. Patients received 1 point for each of these factors.
The RFS rate was 93% for patients with a score of 0, 78% for those with a score of 1, and 49% for patients with a score of 2 or 3. The OS rate was 99%, 91%, and 71%, respectively.
The researchers said their scoring system provided greater discrimination than MRD-based risk stratification into a standard-risk group—which had an RFS of 89% and an OS of 96%—and a medium-risk group—which had an RFS of 79% and an OS of 91%.
Study author Toby Trahair, MBBS, PhD, of Sydney Children’s Hospital in Randwick, New South Wales, said this scoring system could make a big difference to the success of BCP-ALL treatment.
“We are always trying to improve how we diagnose and treat children with this most common childhood cancer,” Dr Trahair said. “This risk score will mean doctors can fine tune a child’s risk category and so fine tune their treatment. It will mean more kids can conquer this horrible disease, which, only 50 years ago, had survival rates of close to 0.” ![]()
FDA approves use of heparin products
The US Food and Drug Administration (FDA) has approved use of Mylan NV’s heparin products.
This includes Heparin Sodium Injection at 1000 USP/mL, 5000 USP/mL, 10,000 USP/mL, and 20,000 USP/mL, all of which are packaged in multi-dose vials.
These products should be available in the coming weeks, according to Rajiv Malik, the president of Mylan.
Mylan’s heparin products are approved for the same uses as other heparin products approved in the US.
This includes as prophylaxis and treatment for venous thrombosis and its extension, pulmonary embolism, and peripheral arterial embolism.
The heparin products can also be used to treat atrial fibrillation with embolization, prevent clotting in arterial and cardiac surgery, and diagnose/treat acute and chronic consumptive coagulopathies (disseminated intravascular coagulation).
Low-dose heparin can be used to prevent post-operative deep vein thrombosis and pulmonary embolism in patients undergoing major abdominothoracic surgery or who, for other reasons, are at risk of developing thromboembolic disease.
Heparin can also be used as an anticoagulant in blood transfusions, extracorporeal circulation, and dialysis procedures, as well as in blood samples for laboratory purposes.
“We are very proud of today’s FDA approval of Heparin Sodium Injection, as this approval adds yet another highly complex and difficult-to-manufacture product to our portfolio,” Malik said.
“We expect to make our heparin products available to US hospitals in the coming weeks, further supporting our institutional customers in meeting the needs of their patients who depend on high-quality anticoagulants.” ![]()
Cell-free DNA kit receives CE-IVD mark
Vela Diagnostics’ Sentosa® SX Cell-free DNA (cfDNA) Kit has received the CE-IVD mark, which means this kit is approved for in vitro diagnostics use in the European Union.
The Sentosa® SX cfDNA Kit is intended to extract free-circulating DNA from human plasma.
The kit was developed for use in next-generation sequencing and real-time polymerase chain reaction workflows.
The kit is designed to run on the Sentosa® SX101 instrument and works with whole blood samples collected in Cell-free DNA BCT from Streck, K2, or K3 EDTA tubes.
Automated sample extraction with the Sentosa® SX cfDNA Kit takes approximately 3.5 hours. It requires 20 minutes of operator hands-on time and 4 mL of plasma from the clinical sample.
The Sentosa® SX cfDNA Kit is able to recover low-frequency DNA variants in blood, according to Vela Diagnostics.
Results from a pilot study testing the kit were presented in a poster at the AMP 2016 Annual Meeting. ![]()