User login
Retinal changes may reflect brain changes in preclinical Alzheimer’s
BOSTON – Changes in the retina seem to mirror changes that begin to reshape the brain in preclinical Alzheimer’s disease.
Manifested as a reduction in volume in the retinal nerve fiber layer, these changes appear to track the aggregation of beta amyloid brain plaques well before cognitive problems arise – and can be easily measured with a piece of equipment already in many optometry offices, Peter J. Snyder, PhD, said at the Clinical Trials in Alzheimer’s Disease conference.

“If we are lucky enough to live past age 45, then it’s a given that we’re all going to develop some presbyopia. So we all have to go to the optometrist sometime, and that may become a point of entry for broad screening and to track changes over time, to keep an eye on at-risk patients, and to refer those with retinal changes that fit the preclinical AD profile to specialty care for more comprehensive diagnostic evaluations.”
The retina begins to form in the third week of embryologic life, arising from the neural tube cells that also form the brain and spinal cord. It makes sense then that very early neuronal changes in Alzheimer’s disease could be occurring in the retina as well, said Dr. Snyder, professor of neurology and surgery (ophthalmology) at Rhode Island Hospital and Brown University, Providence.
“The retina is really a protrusion of the brain, and it is part and parcel of the central nervous system. In terms of the neuronal structure, the retina develops in layers with very specific cell types that are neurochemically and physiologically the same as the nervous tissue in the brain. That’s why it is, potentially, literally a window that could let us see what’s happening in the brain in early Alzheimer’s disease.”
Other researchers have explored amyloid in the lens and retina as a possible early Alzheimer’s identification tool. But Dr. Snyder’s study is the first to demonstrate a longitudinal association between neuronal changes in the eye and amyloid burden in the brain among clinically normal subjects.
For 27 months, he followed 56 people who had normal cognition but were beginning to experience subjective memory complaints. All subjects had at least one parent with Alzheimer’s disease. Everyone underwent an amyloid PET scan at baseline. Of the cohort, 15 had PET imaging evidence of abnormal beta-amyloid protein aggregation in the neocortex. This group was deemed to have preclinical Alzheimer’s disease, while the remainder served as a control group.
Dr. Snyder imaged each subject’s retinas twice – once at baseline and once at 27 months, when everyone underwent a second amyloid PET scan as well. He examined the retina with spectral domain optical coherence tomography, a relatively new method of imaging the retina.
These scanners are becoming increasingly more common in optometry practices, Dr. Snyder said. “Graduate optometrists tell me they would not want to be in a practice without one.” The scanners are typically used to detect retinal and ocular changes associated with diabetes, macular degeneration, glaucoma and multiple sclerosis.
Dr. Snyder used the scanner to examine the optic nerve head and macula at both baseline and 27 months in his cohort. He was looking for volumetric changes in several of the retinal layers: the peripapillary retinal nerve fiber layer (pRNFL), macular RNFL (mRNFL), ganglion cell layer (GCL), inner plexiform layer (IPL), outer nuclear layer (ONL), outer plexiform layer (OPL), and inner nuclear layer (INL). He also computed changes in total retinal volume.
Even at baseline, he found a significant difference between the groups. Among the amyloid-positive subjects, the inner plexiform layer was slightly larger in volume. “This seems a bit counterintuitive, but I think it suggests that there may be some inflammatory processes going on in this early stage and that we are catching that inflammation.”
Dr. Snyder noted that this finding has recently been replicated by an independent research group in Perth, Australia – with a much larger sample of participants – and will be reported at international conferences this coming year.
At 27 months, both the total retinal volume and the macular retinal nerve fiber layer volume were significantly lower in the preclinical AD group than in the control group. There was also a volume reduction in the peripapillary retinal nerve fiber layer, although the between-group difference was not statistically significant.
In a multivariate linear regression model that controlled for age and total amyloid burden, the mean volume change in the macular retinal nerve fiber layer accounted for about 10% of the variation in PET binding to brain amyloid by 27 months. Volume reductions in all the other layers appeared to be associated only with age, representing normal age-related changes in the eye.
Dr. Snyder said this volume loss in the retinal nerve fiber layer probably represents early demyelination and/or degeneration of the axons coursing from the cell bodies in the ganglion cell layer, which project to the optic nerve head.
“This finding in the retina appears analogous, and possibly directly related to, a similar loss of white matter that is readily observable in the early stages of Alzheimer’s disease. At the same time, patients are beginning to experience both cholinergic changes in the basal forebrain and the abnormal aggregation of fibrillar beta-amyloid plaques. I don’t know to what extent these changes are mechanistically dependent on each other, but they appear to also be happening, in the earliest stages of the disease course, in the retina.”
There is a lot of work left to be done before retinal scanning could be employed as a risk-assessment tool, however. With every new biomarker – and especially with imaging – the ability to measure change occurs far in advance of an understanding of what those changes mean, and how to judge them accurately.
“Every time we have a major advance in imaging, the technical engineering breakthroughs precede our detailed understanding of what we’re looking at and what to measure. This is where we are right now with retinal imaging. Biologically, it makes sense to be looking at this as a marker of risk in those who are clinically healthy, and maybe later as a marker of disease progression. But there is a lot of work to be done here yet.”
Dr. Snyder’s project was funded in part by a research award from Pfizer, with PET imaging supported in part by a grant from Avid Radiopharmaceuticals. He has no financial ties to the company, or other financial interest related to the study.
[email protected]
On Twitter @Alz_Gal
BOSTON – Changes in the retina seem to mirror changes that begin to reshape the brain in preclinical Alzheimer’s disease.
Manifested as a reduction in volume in the retinal nerve fiber layer, these changes appear to track the aggregation of beta amyloid brain plaques well before cognitive problems arise – and can be easily measured with a piece of equipment already in many optometry offices, Peter J. Snyder, PhD, said at the Clinical Trials in Alzheimer’s Disease conference.
“If we are lucky enough to live past age 45, then it’s a given that we’re all going to develop some presbyopia. So we all have to go to the optometrist sometime, and that may become a point of entry for broad screening and to track changes over time, to keep an eye on at-risk patients, and to refer those with retinal changes that fit the preclinical AD profile to specialty care for more comprehensive diagnostic evaluations.”
The retina begins to form in the third week of embryologic life, arising from the neural tube cells that also form the brain and spinal cord. It makes sense then that very early neuronal changes in Alzheimer’s disease could be occurring in the retina as well, said Dr. Snyder, professor of neurology and surgery (ophthalmology) at Rhode Island Hospital and Brown University, Providence.
“The retina is really a protrusion of the brain, and it is part and parcel of the central nervous system. In terms of the neuronal structure, the retina develops in layers with very specific cell types that are neurochemically and physiologically the same as the nervous tissue in the brain. That’s why it is, potentially, literally a window that could let us see what’s happening in the brain in early Alzheimer’s disease.”
Other researchers have explored amyloid in the lens and retina as a possible early Alzheimer’s identification tool. But Dr. Snyder’s study is the first to demonstrate a longitudinal association between neuronal changes in the eye and amyloid burden in the brain among clinically normal subjects.
For 27 months, he followed 56 people who had normal cognition but were beginning to experience subjective memory complaints. All subjects had at least one parent with Alzheimer’s disease. Everyone underwent an amyloid PET scan at baseline. Of the cohort, 15 had PET imaging evidence of abnormal beta-amyloid protein aggregation in the neocortex. This group was deemed to have preclinical Alzheimer’s disease, while the remainder served as a control group.
Dr. Snyder imaged each subject’s retinas twice – once at baseline and once at 27 months, when everyone underwent a second amyloid PET scan as well. He examined the retina with spectral domain optical coherence tomography, a relatively new method of imaging the retina.
These scanners are becoming increasingly more common in optometry practices, Dr. Snyder said. “Graduate optometrists tell me they would not want to be in a practice without one.” The scanners are typically used to detect retinal and ocular changes associated with diabetes, macular degeneration, glaucoma and multiple sclerosis.
Dr. Snyder used the scanner to examine the optic nerve head and macula at both baseline and 27 months in his cohort. He was looking for volumetric changes in several of the retinal layers: the peripapillary retinal nerve fiber layer (pRNFL), macular RNFL (mRNFL), ganglion cell layer (GCL), inner plexiform layer (IPL), outer nuclear layer (ONL), outer plexiform layer (OPL), and inner nuclear layer (INL). He also computed changes in total retinal volume.
Even at baseline, he found a significant difference between the groups. Among the amyloid-positive subjects, the inner plexiform layer was slightly larger in volume. “This seems a bit counterintuitive, but I think it suggests that there may be some inflammatory processes going on in this early stage and that we are catching that inflammation.”
Dr. Snyder noted that this finding has recently been replicated by an independent research group in Perth, Australia – with a much larger sample of participants – and will be reported at international conferences this coming year.
At 27 months, both the total retinal volume and the macular retinal nerve fiber layer volume were significantly lower in the preclinical AD group than in the control group. There was also a volume reduction in the peripapillary retinal nerve fiber layer, although the between-group difference was not statistically significant.
In a multivariate linear regression model that controlled for age and total amyloid burden, the mean volume change in the macular retinal nerve fiber layer accounted for about 10% of the variation in PET binding to brain amyloid by 27 months. Volume reductions in all the other layers appeared to be associated only with age, representing normal age-related changes in the eye.
Dr. Snyder said this volume loss in the retinal nerve fiber layer probably represents early demyelination and/or degeneration of the axons coursing from the cell bodies in the ganglion cell layer, which project to the optic nerve head.
“This finding in the retina appears analogous, and possibly directly related to, a similar loss of white matter that is readily observable in the early stages of Alzheimer’s disease. At the same time, patients are beginning to experience both cholinergic changes in the basal forebrain and the abnormal aggregation of fibrillar beta-amyloid plaques. I don’t know to what extent these changes are mechanistically dependent on each other, but they appear to also be happening, in the earliest stages of the disease course, in the retina.”
There is a lot of work left to be done before retinal scanning could be employed as a risk-assessment tool, however. With every new biomarker – and especially with imaging – the ability to measure change occurs far in advance of an understanding of what those changes mean, and how to judge them accurately.
“Every time we have a major advance in imaging, the technical engineering breakthroughs precede our detailed understanding of what we’re looking at and what to measure. This is where we are right now with retinal imaging. Biologically, it makes sense to be looking at this as a marker of risk in those who are clinically healthy, and maybe later as a marker of disease progression. But there is a lot of work to be done here yet.”
Dr. Snyder’s project was funded in part by a research award from Pfizer, with PET imaging supported in part by a grant from Avid Radiopharmaceuticals. He has no financial ties to the company, or other financial interest related to the study.
[email protected]
On Twitter @Alz_Gal
AT CTAD
Key clinical point: Retinal scans might eventually be an easy, noninvasive, and inexpensive way to tag people who may be at elevated risk for Alzheimer’s disease.
Major finding: At 27 months, both the total retinal volume and the macular retinal nerve fiber layer volume were significantly lower in 15 patients in the preclinical AD group than in the 41 patients in the control group.
Data source: A follow-up study of 56 people who had at least one parent with Alzheimer’s disease and were beginning to experience subjective memory complaints.
Disclosures: Dr. Snyder’s project was funded in part by a research award from Pfizer, with PET imaging supported in part by a grant from Avid Radiopharmaceuticals. He has no financial ties to the company, or other financial interest related to the study.
Swarm and suspicion leadership
During your career, you serve as staff member and leader to many different professional groups. Some are collaborative, collegial, and supportive. Others are competitive, antagonistic, or even combative. What are the benefits and downsides of each of these cultures and what can you do, as a hospitalist leader, to influence the character of your workplace?

The field of “game theory” provides insights into the distinction. The first questions to ask are “What is the game you are playing?” and then “Who is the competition?” In a “winner-takes-all” scenario, such as a sporting event, each team seeks strategic advantage over the other team. In baseball terms, the winner gets more points when at bat and denies more points when on the field. However, when competing as a team, winning together requires collaboration to build strategy, execute plays, and reach victory. You compete against the other team and collaborate within your own team.
Scientists who study negotiation strategies and conflict resolution find that collaborative groups spend less time countering one another and, instead, investing that same effort into building constructive outcomes, a force multiplier.
In the winner-takes-all model, the baseball team that gets “outs,” makes plays, and advances team members to home plate, wins. If there is contest within the team, players invest that same effort into seeking their own gain at the expense of others. Benefits derived from shared effort are shunned in favor of benefits accrued to one player over the other. It is a distinction between “I won” versus “We won.”
Hospital medicine is not a win/lose sport, yet over the years, hospitalists have shared with me that their institution or group at times feels like a competitive field with winners and losers. If this distinction is placed on a continuum, what factors encourage a more collaborative environment and what factors do the opposite, toward the adversarial side of the continuum? It makes a substantive difference in the interactions and accomplishments that a group achieves.
My colleagues and I at Harvard study leaders in times of crisis. A crisis makes apparent what is often more subtle during routine times. Our study of leaders in the wake of the Boston Marathon bombings was among our most revealing.
During most crises, an operational leader is designated to oversee the whole of the response. This is an individual with organizational authority and subject-matter expertise appropriate to the situation at hand. In Boston, however, there were so many different jurisdictions – federal, state, and local – and so many different agencies, that no one leader stood above the others. They worked in a remarkably collaborative fashion. While the bombings themselves were tragic, the response itself was a success: All who survived the initial blasts lived, a function of remarkable emergency care, distribution to hospitals, and good medical care. The perpetrators were caught in 102 hours, and “Boston Strong” reflected a genuine city resilience.
These leaders worked together in ways that we had rarely seen before. What we discovered was a phenomenon we call “swarm leadership,” inspired by the ways ants, bees, and termites engage in collective work and decision making. These creatures have clear lines of communication and structures for judgment calls, often about food sources, nesting locations, and threats.
There are five principles of swarm leadership:
- Unity of mission – In Boston, that was to “save lives,” and it motivated and activated the whole of the response.
- Generosity of spirit and action – Across the community, people were eager to assist in the response.
- Everyone stayed in their own lanes of responsibility and helped others succeed in theirs – There were law enforcement, medical, and resilience activities and the theme across the leaders was “how can I help make you a success?”
- No ego and no blame – There was a level of emotional intelligence and maturity among the leaders.
- A foundation of trusting relations – These leaders had known one another for years and, though the decisions were tough, they were confident in the motives and actions of the others.
While the discovery emerged from our crisis research, the findings equally apply to other, more routine work and interactions. Conduct your own assessment. Have you worked in groups in which these principles of swarm leadership characterized the experience? People were focused on a shared mission: They were available to assist one another; accomplished their work in ways that were respectful and supportive of their different responsibilities; did not claim undue credit or swipe at each another; and knew one another well enough to trust the others’ actions and motives.
The flip side of this continuum of collaboration and competition we term “suspicion leadership.” This is characterized by selfish ambitions; narcissistic actions; grabs for authority and resources; credit taking for the good and accusations for the bad; and an environment of mistrust and back stabbing.
Leaders influence the tone and tenor of their own group’s interactions as well as interactions among different working groups. As role models, if they articulate and demonstrate a mission that others can rally around, they forge that critical unity of mission. By contrast, suspicion leaders make it clear that “it is all about me and my priorities.” There is much work to be done, and swarm leaders ensure that people have the resources, autonomy, and support necessary to get the job done. On the other end, the work environment is burdened by the uncertainties about who does what and who is responsible. Swarm leaders are focused on “we” and suspicion leaders are caught up on “me.” There is no trust when people are suspicious of one another. Much can be accomplished when people believe in themselves, their colleagues, and the reasons that bring them together.
As a hospitalist leader, you influence where on this continuum your group will lie. It is your choice to be a role model for the principles of swarm, encouraging the same among others. When those principles become the beacons by which you work and relate, you will find an environment that inspires people to be and to do their best.
In the next column, how to build trust within your teams.
Dr. Marcus is director, Program on Health Care Negotiation and Conflict Resolution, at the Harvard T.H. Chan School of Public Health, in Boston.
During your career, you serve as staff member and leader to many different professional groups. Some are collaborative, collegial, and supportive. Others are competitive, antagonistic, or even combative. What are the benefits and downsides of each of these cultures and what can you do, as a hospitalist leader, to influence the character of your workplace?
The field of “game theory” provides insights into the distinction. The first questions to ask are “What is the game you are playing?” and then “Who is the competition?” In a “winner-takes-all” scenario, such as a sporting event, each team seeks strategic advantage over the other team. In baseball terms, the winner gets more points when at bat and denies more points when on the field. However, when competing as a team, winning together requires collaboration to build strategy, execute plays, and reach victory. You compete against the other team and collaborate within your own team.
Scientists who study negotiation strategies and conflict resolution find that collaborative groups spend less time countering one another and, instead, investing that same effort into building constructive outcomes, a force multiplier.
In the winner-takes-all model, the baseball team that gets “outs,” makes plays, and advances team members to home plate, wins. If there is contest within the team, players invest that same effort into seeking their own gain at the expense of others. Benefits derived from shared effort are shunned in favor of benefits accrued to one player over the other. It is a distinction between “I won” versus “We won.”
Hospital medicine is not a win/lose sport, yet over the years, hospitalists have shared with me that their institution or group at times feels like a competitive field with winners and losers. If this distinction is placed on a continuum, what factors encourage a more collaborative environment and what factors do the opposite, toward the adversarial side of the continuum? It makes a substantive difference in the interactions and accomplishments that a group achieves.
My colleagues and I at Harvard study leaders in times of crisis. A crisis makes apparent what is often more subtle during routine times. Our study of leaders in the wake of the Boston Marathon bombings was among our most revealing.
During most crises, an operational leader is designated to oversee the whole of the response. This is an individual with organizational authority and subject-matter expertise appropriate to the situation at hand. In Boston, however, there were so many different jurisdictions – federal, state, and local – and so many different agencies, that no one leader stood above the others. They worked in a remarkably collaborative fashion. While the bombings themselves were tragic, the response itself was a success: All who survived the initial blasts lived, a function of remarkable emergency care, distribution to hospitals, and good medical care. The perpetrators were caught in 102 hours, and “Boston Strong” reflected a genuine city resilience.
These leaders worked together in ways that we had rarely seen before. What we discovered was a phenomenon we call “swarm leadership,” inspired by the ways ants, bees, and termites engage in collective work and decision making. These creatures have clear lines of communication and structures for judgment calls, often about food sources, nesting locations, and threats.
There are five principles of swarm leadership:
- Unity of mission – In Boston, that was to “save lives,” and it motivated and activated the whole of the response.
- Generosity of spirit and action – Across the community, people were eager to assist in the response.
- Everyone stayed in their own lanes of responsibility and helped others succeed in theirs – There were law enforcement, medical, and resilience activities and the theme across the leaders was “how can I help make you a success?”
- No ego and no blame – There was a level of emotional intelligence and maturity among the leaders.
- A foundation of trusting relations – These leaders had known one another for years and, though the decisions were tough, they were confident in the motives and actions of the others.
While the discovery emerged from our crisis research, the findings equally apply to other, more routine work and interactions. Conduct your own assessment. Have you worked in groups in which these principles of swarm leadership characterized the experience? People were focused on a shared mission: They were available to assist one another; accomplished their work in ways that were respectful and supportive of their different responsibilities; did not claim undue credit or swipe at each another; and knew one another well enough to trust the others’ actions and motives.
The flip side of this continuum of collaboration and competition we term “suspicion leadership.” This is characterized by selfish ambitions; narcissistic actions; grabs for authority and resources; credit taking for the good and accusations for the bad; and an environment of mistrust and back stabbing.
Leaders influence the tone and tenor of their own group’s interactions as well as interactions among different working groups. As role models, if they articulate and demonstrate a mission that others can rally around, they forge that critical unity of mission. By contrast, suspicion leaders make it clear that “it is all about me and my priorities.” There is much work to be done, and swarm leaders ensure that people have the resources, autonomy, and support necessary to get the job done. On the other end, the work environment is burdened by the uncertainties about who does what and who is responsible. Swarm leaders are focused on “we” and suspicion leaders are caught up on “me.” There is no trust when people are suspicious of one another. Much can be accomplished when people believe in themselves, their colleagues, and the reasons that bring them together.
As a hospitalist leader, you influence where on this continuum your group will lie. It is your choice to be a role model for the principles of swarm, encouraging the same among others. When those principles become the beacons by which you work and relate, you will find an environment that inspires people to be and to do their best.
In the next column, how to build trust within your teams.
Dr. Marcus is director, Program on Health Care Negotiation and Conflict Resolution, at the Harvard T.H. Chan School of Public Health, in Boston.
Urge PAs to Join New SVS Section
SVS members, please remember to urge your physician assistants -- and other PAs you know who work in a vascular setting -- to apply to become charter members of the new SVS section created for them. The first step is becoming an affiliate member of the SVS. For our new charter PA members, SVS is waiving the application fee. For more information, email [email protected] or call the SVS Membership Department at 312-334-2313.
We welcome nurses and nurse practitioners as well. Please consider becoming a part of the Society for Vascular Nursing, which makes its management home at SVS.
With CHIP in limbo, here are five takeaways on the congressional impasse
Two months past its deadline, Congress has yet to fund the Children’s Health Insurance Program, leaving several states scrambling for cash.
Lawmakers grappling with the failed repeal of the Affordable Care Act allowed authorization of the program to lapse on Sept. 30. Although CHIP has always had broad bipartisan support, the House and Senate cannot agree on how to continue federal funding. And the Trump administration has been mostly silent on the issue.
CHIP benefits 9 million children nationwide and 370,000 pregnant women a year. It helps lower- and middle-income families who otherwise earn too much to be eligible for Medicaid. Like Medicaid, CHIP is paid for with state and federal funds, but the federal government covers close to 90% of the cost.
To keep the program going, states with unspent federal CHIP money have seen their excess sent to a handful of states running low on funds. But that is a bureaucratic Band-Aid; some large states are warning families they may not be able to rely on CHIP for much longer.
All told, the CMS has given out $1.2 billion in redistribution dollars since October. To keep the program going would cost the federal government $8.5 billion over 5 years, the Congressional Budget Office estimates.
Dec. 2 marked the 25th anniversary of Pennsylvania approving the original CHIP program, which served as a model for the national law, established in 1997. Since then, CHIP has been left in the fiscal lurch only once before. In 2007, CHIP went several weeks without funding authorization from Congress.
Here’s a quick look at what the shortfall may mean to daily life.
1. Are any kids hurting because Congress has failed to fund CHIP?
No. But states such as California will run out of money within weeks. That state alone accounts for nearly 15% of all children benefiting from CHIP. Without federal money, state programs could freeze enrollment or suspend operation.
2. What are states doing since Congress missed the deadline?
Most states are doing little except looking for other unspent federal funds or asking the federal government to send some unspent funds from other states. But some, such as Colorado, are sending warning letters to beneficiaries to tell them that the program could soon end and to look for alternatives. This could mean exploring the ACA marketplace for coverage or researching if a child qualifies for Medicaid.
Colorado said it has only enough CHIP funding to last through January and then the program, without federal dollars, will end.
Arizona officials announced Nov. 30 that it will use Medicaid funding to fill in the shortage of CHIP dollars to extend the life of its CHIP program.
Virginia officials plan to send out a similar notice to parents of CHIP members by early December.
Minnesota is keeping CHIP alive by paying the federal share with state funds.
In Oregon, Democratic Gov. Kate Brown recently said that she is ready to spend $35 million in state funds to keep CHIP running through December.
Nevada announced on Nov. 30 it had been approved for extra funding from the Centers for Medicare & Medicaid Services – nearly $5.7 million – which could keep CHIP alive through December and possibly January.
California, which leads the nation in CHIP enrollment, has received the lion’s share of CMS redistribution funds since October: nearly $692 million.
“Approximately 98% of the 1.3 million population now covered using CHIP funding would continue to receive coverage under the Medicaid program because of a legal obligation to cover them through September 2019,” said California Medicaid/CHIP spokesman Tony Cava. “If CHIP is not reauthorized, the governor and Legislature would need to deliberate on how best to address the population no longer eligible for federal CHIP funding.”
3. When is Congress likely to act?
Not sure. CHIP reauthorization could be included in an appropriations bill that Congress must pass to fund the government into 2018. (Congress now has funded the government through Dec. 8.) A “continuing resolution” bill would have to be approved by then to avert a government shutdown.
4. If CHIP is so popular among Republicans and Democrats, what’s the problem?
There is little debate about its worth and value, but the momentum on CHIP was lost amid disagreements over the Affordable Care Act. The House did extend authorization with a vote – mostly along party lines – on Nov. 3. The Senate itself has yet to vote. The Senate Finance Committee on Oct. 3 approved a bipartisan bill to extend the program for 5 years.
The sticking point is not whether to keep CHIP running but how to raise the cash needed. The House agreed to charge higher premiums to wealthier Medicare beneficiaries, cut money from the ACA’s preventive health fund and shorten the grace period for ACA enrollees who fail to make monthly premium payments.
Like the House bill, the Senate committee bill eliminated an ACA provision to increase CHIP matching funds – to states – by 23%. The increased funding would continue through fiscal year 2019 and fall to 11.5 percent in fiscal year 2020. It would be cut entirely in the following fiscal year.
5. How does CHIP differ based on where you live?
CHIP income eligibility levels vary by state. About 90% of children who qualify are from families earning 200% of poverty or less ($40,840 for a family of three). CHIP covers children up to age 19. But states have the option to cover pregnant women, and 18 states plus the District of Columbia do so.
Some states call CHIP by different names. For example, it is known as Hoosier Healthwise in Indiana, PeachCare for Kids in Georgia and KidsCare in Arizona.
KHN’s coverage of children’s health care issues is supported in part by the Heising-Simons Foundation. Kaiser Health News is a nonprofit news service covering health issues. It is an editorially independent program of the Kaiser Family Foundation that is not affiliated with Kaiser Permanente.
ASCO larynx-preservation guidelines reflect important practice changes
The latest edition of the clinical practice guideline on larynx preservation strategies for the treatment of laryngeal cancer from the American Society of Clinical Oncology (ASCO) emphasizes that larynx preservation in patients with early stage disease does not compromise survival compared with total laryngectomy.
“The nuances of treatment selection, assessments of pretreatment voice and swallowing, and public awareness of new organ-preservation treatment and decision making have increased to the point that careful and individualized discussion with patients and families with the multidisciplinary treatment team is a critical element of modern care,” wrote Arlene A. Forastiere, MD, of Johns Hopkins Medicine in Baltimore, and her colleagues. The report was published in the Journal of Clinical Oncology.
Changes since the last guideline on the subject, issued in 2006, include evidence-based support for the use of endoscopic resection in patients with limited stage (T1 and T2) disease, and as an initial total laryngectomy therapy both in patients with stage T4a disease, and in those with severe laryngeal dysfunction prior to treatment.
Also new since the last guideline are recommendations for the use of positron-emission tomography imaging for evaluating the status of regional nodes after treatment, as well as guidance on the best techniques for evaluating voice and swallowing function.
While the initial recommendation that all patients with T1 and T2 laryngeal cancer should be treated with the intent to preserve the larynx has not changed, there is a new recommendation (1.3) stating that surgery may be more effective than radiotherapy for initial larynx preservation therapy, although this recommendation is based on retrospective data and may be affected by patient selection factors, the authors acknowledged. The new recommendation also notes that in an experienced operator’s hands, endoscopic resections can have outcomes that are equal to or better than those with open partial laryngectomy.
The initial recommendation stating that “[e]very effort should be made to avoid combining surgery with radiation therapy because functional outcomes may be compromised by combined-modality therapy; single-modality treatment is effective for limited-stage, invasive cancer of the larynx” remains unchanged.
There is also an updated recommendation that tumor-free margins should be the goal when surgery with larynx preservation intent is performed (1.4).
“Surgery that anticipates the need for postoperative [radiation therapy] to treat close or involved tumor margins or widespread dysplasia is not an acceptable treatment approach,” the guideline authors noted.
There are two other new recommendations including the opinion, based on evidence of benefits vs. harms, that total laryngectomy rather than larynx preservation may be associated with better survival and quality of life in patients with extensive T3 lesions, large T4 lesions, or in those who have poor pretreatment laryngeal function.
The third new recommendation is that “[a]s part of a comprehensive pretreatment evaluation, all patients should undergo a baseline assessment of voice and swallowing function, voice (use and requirements), and counseling with regard to the potential effect of treatment options on voice, swallowing, and quality of life.”
Among the updated recommendations are the following:
• An emphasis on the importance of considering a multiplicity of factors when choosing therapy for patients with limited-stage disease (1.7).
• The option of specialized organ-preservation procedures for a small number of patients with T3 or T4 primary site disease (2.4).
• A strong recommendation for the use of concurrent chemoradiotherapy compared with radiotherapy alone or sequential therapy (2.5).
• Elective neck dissection is not required for patients with clinically involved regional cervical nodes treated with definitive radiotherapy of chemoradiotherapy who have complete clinical, radiologic, and metabolic imaging (3.3).
• “Selection of therapy for an individual patient requires assessment by the multidisciplinary team as well as consideration of voice and swallowing function; patient comorbidity, psychosocial situation, and preferences; and local therapeutic expertise” (4.2).
The guideline development process was supported by ASCO. Dr, Forastiere disclosed employment and stock ownership in NantHealth. Many of her coauthors disclosed institutional funding, consultation/advising, travel support and expenses, honoraria, and or patents/royalties with multiple entities.
FROM JCO
Sjögren-Larsson Syndrome: Definitive Diagnosis on Magnetic Resonance Spectroscopy
Sjögren-Larsson syndrome (SLS) is a rare autosomal-recessive neurocutaneous disorder comprising a triad of ichthyosis, mental retardation, and spastic diplegia or quadriplegia.1 The disorder was first described by Sjögren and Larsson2 in 1957. Early reports of SLS were mainly in white patients, with a particularly high prevalence of 8.3 cases per 100,000 individuals in the county of Västerbotten in Sweden.3 Reports of SLS in Asian and Indian populations are rare.4,5 We report a case of SLS in an Indian boy.
Case Report
A 12-year-old Indian boy born to nonconsanguineous parents after a full-term pregnancy with normal vaginal delivery presented with generalized dry scaly skin that had been present since 2 months of age. He had a history of delayed milestones (ie, facial recognition, sitting without support at 3 years of age), inability to walk, dysarthria, mental retardation). He had never attended school due to subnormal intellectual functioning. He had a single episode of a tonic-clonic seizure at 4 years of age but was not on any regular antiepileptic medication. There was a history of similar skin lesions in one male sibling of the patient and in 2 maternal uncles. None of them survived beyond early childhood, but detailed information regarding the cutaneous and neurologic manifestations in these family members was not available.
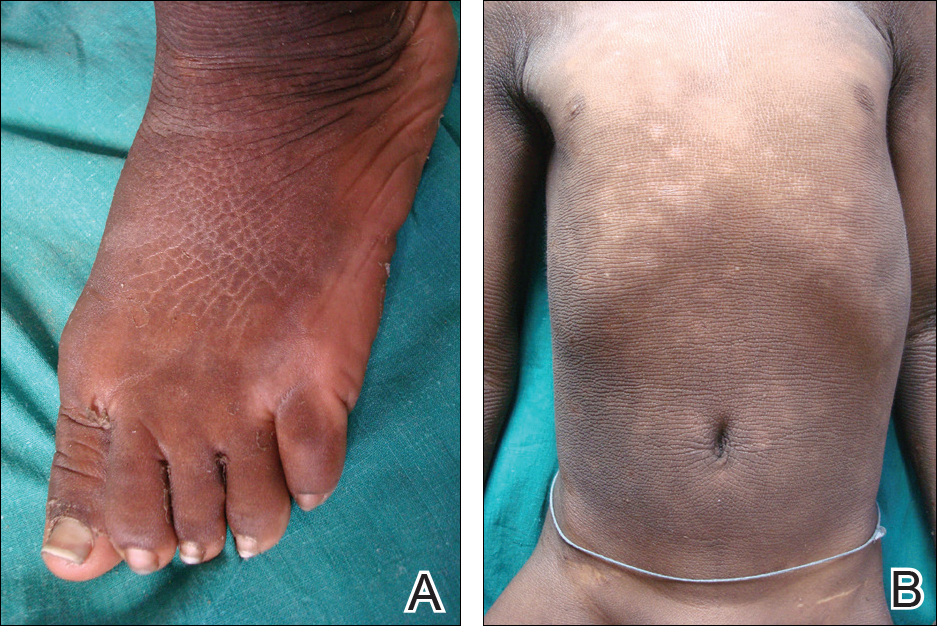
Cutaneous examination revealed lamellarlike ichthyosis on the dorsal aspects of the arms and legs (Figure 1A). Ichthyosis with lichenification was present on the neck, axillae, cubital and popliteal fossae, and abdomen (Figure 1B). The palms and soles showed keratoderma. Neurologic examination of the arms revealed mild rigidity and brisk reflexes. Examination of the legs showed marked rigidity, brisk knee jerks, ankle clonus, extensor plantar reflexes, flexion deformity with contractures, and scissor gait. A Goddard (Seguin) formboard test was performed and indicated a mental age of 4 years. The patient’s IQ was in the range of 25 to 30, indicating a severe degree of subnormality in intellectual functioning. The clinical presentation suggested a diagnosis of SLS.
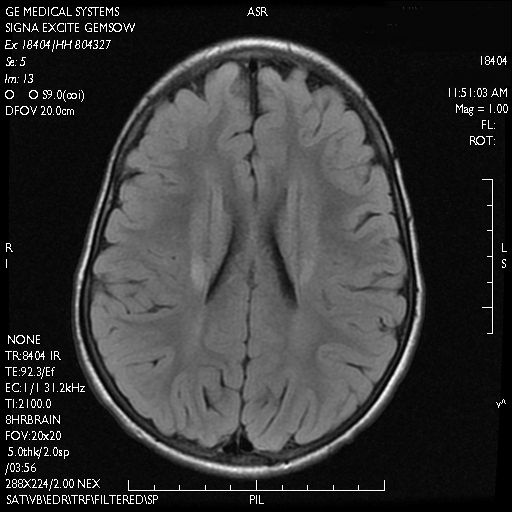
A skin biopsy from the ichthyotic lesion showed hyperkeratosis, acanthosis, and papillomatosis with sparse superficial perivascular lymphocytic infiltrate, thus confirming the diagnosis of lamellar ichthyosis. Fundus examination was normal. Magnetic resonance imaging (MRI) of the brain revealed confluent symmetrical signal abnormalities along the body of the lateral ventricles, white matter in the perioccipital horn, and in deep white matter of centrum semiovale (Figure 2). Magnetic resonance spectroscopy revealed a narrow lipid peak at approximately 1.3 ppm in the region of signal abnormality (Figure 3). Thus, the diagnosis of SLS was confirmed. Measurement of fatty aldehyde dehydrogenase (FALDH) activity and genetic analysis were not performed due to unavailability.
The patient was treated with topical emollients for the ichthyosis. To reduce his dietary intake of long-chain fatty acids and increase the intake of omega-3 and omega-6 fatty acids, the patient’s parents were advised to use canola, mustard, and/or coconut oil for cooking for the patient, and skim milk was recommended instead of whole milk. Neurodevelopmental techniques in the form of stretching exercises were given to maintain his range of movements. Gutter splints were given to maintain the knees in extension for physiological standing and to prevent osteoporosis. Subsequently, the patient also underwent a multilevel soft-tissue release (hip and knee joints) to relieve the contractures. These measures resulted in considerable improvement and the patient was able to walk with support.

Comment
Presentation
The characteristic clinical features of SLS begin to develop during the intranatal period and infancy.1,6 Pathologic skin involvement can be detected as early as week 23 of gestation. Preterm births associated with SLS have commonly been described.3 Ichthyosis often is evident at birth, but collodion membrane is uncommon. Severe pruritus is a marked feature unlike most other types of ichthyosis. The ichthyosis often is generalized with prominent involvement of the flexural areas and nape of the neck, varying from fine furfuraceous to larger lamellarlike scales. Velvety orange or brown lichenification often is a predominant feature in the flexures of the arms, legs, neck, and mid abdomen. Mental retardation, developmental delay, and spasticity usually become apparent at 1 to 2 years of age and subsequently are nonprogressive.6,7 However, patients rarely have been described with normal intellectual functioning.7 Spasticity often is more severe in the lower limbs and may lead to contractures, kyphoscoliosis, hip dislocation, and short stature. Delayed speech and dysarthria are common. Parafoveal glistening white dots on the retina are a pathognomonic feature and typically appear in the first 2 years of life; however, they are seen in approximately 30% of patients and increase slightly in number with age.6,8 There may be associated decreased visual acuity, photophobia, myopia, and astigmatism. Other clinical features include enamel hypoplasia, metaphyseal dysplasia, and epilepsy.1,6
Gene Mutations
Sjögren-Larsson syndrome is caused by mutation in the aldehyde dehydrogenase 3 family member A2 gene, ALDH3A2 (17p11.2), which codes for FALDH.1,6,7 The ALDH3A2 gene is 11 exons long and gives rise to 2 protein isoforms that differ in their carboxy-terminal domains; the major isoform, composed of 485 amino acids, localizes to the endoplasmic reticulum. The minor protein isoform (FALDHv) is composed of 508 amino acids, possesses a longer carboxy-terminal, and appears to be targeted to the peroxisome. Several mutations have been reported throughout the ALDH3A2 gene, including missense mutations (most common [38% of cases of SLS6]), deletions, insertions, splicing errors, and complex rearrangements. Although several of these mutations are private, several common mutations may be indicative of founder effects (ie, shared ancestry), consanguinity, or recurrent mutational events (mutation hotspots).6,7 Despite the wide spectrum of mutations, there is very little phenotypic variation, with consistently severe cutaneous and neurological involvement occurring in a majority of patients.7 However, Lossos et al9 described remarkable phenotypic variation in 6 siblings of an Arab family and suggested that additional unknown genetic or environmental factors may compensate for the biochemical defect.
Lipid Metabolism
Fatty aldehyde dehydrogenase is expressed in almost all cells and tissues and catalyzes the oxidation of fatty aldehydes to fatty acids (eFigure 1). It also is a part of the fatty alcohol:NAD oxidoreductase (FAO) enzyme complex, which catalyzes fatty alcohol oxidation to fatty acid. Fatty aldehyde dehydrogenase deficiency leads to accumulation of long-chain alcohols (eg, hexadecanol, octadecanol, octadecenol) and diversion of fatty alcohol into alternate biosynthetic pathways such as wax esters and 1-O-alkyl-2,3-diacylglycerol.10 Other lipids that are increased are illustrated in eFigure 2. Accumulation of these lipids, toxic effects of abnormal lipids (especially fatty aldehydes and Schiff base protein-lipid adducts), and lack of essential lipids (eg, polyunsaturated fatty acids, ceramides 1 and 6, triglycerides) are responsible for the classical cutaneous, neurologic, and ophthalmologic features of SLS.

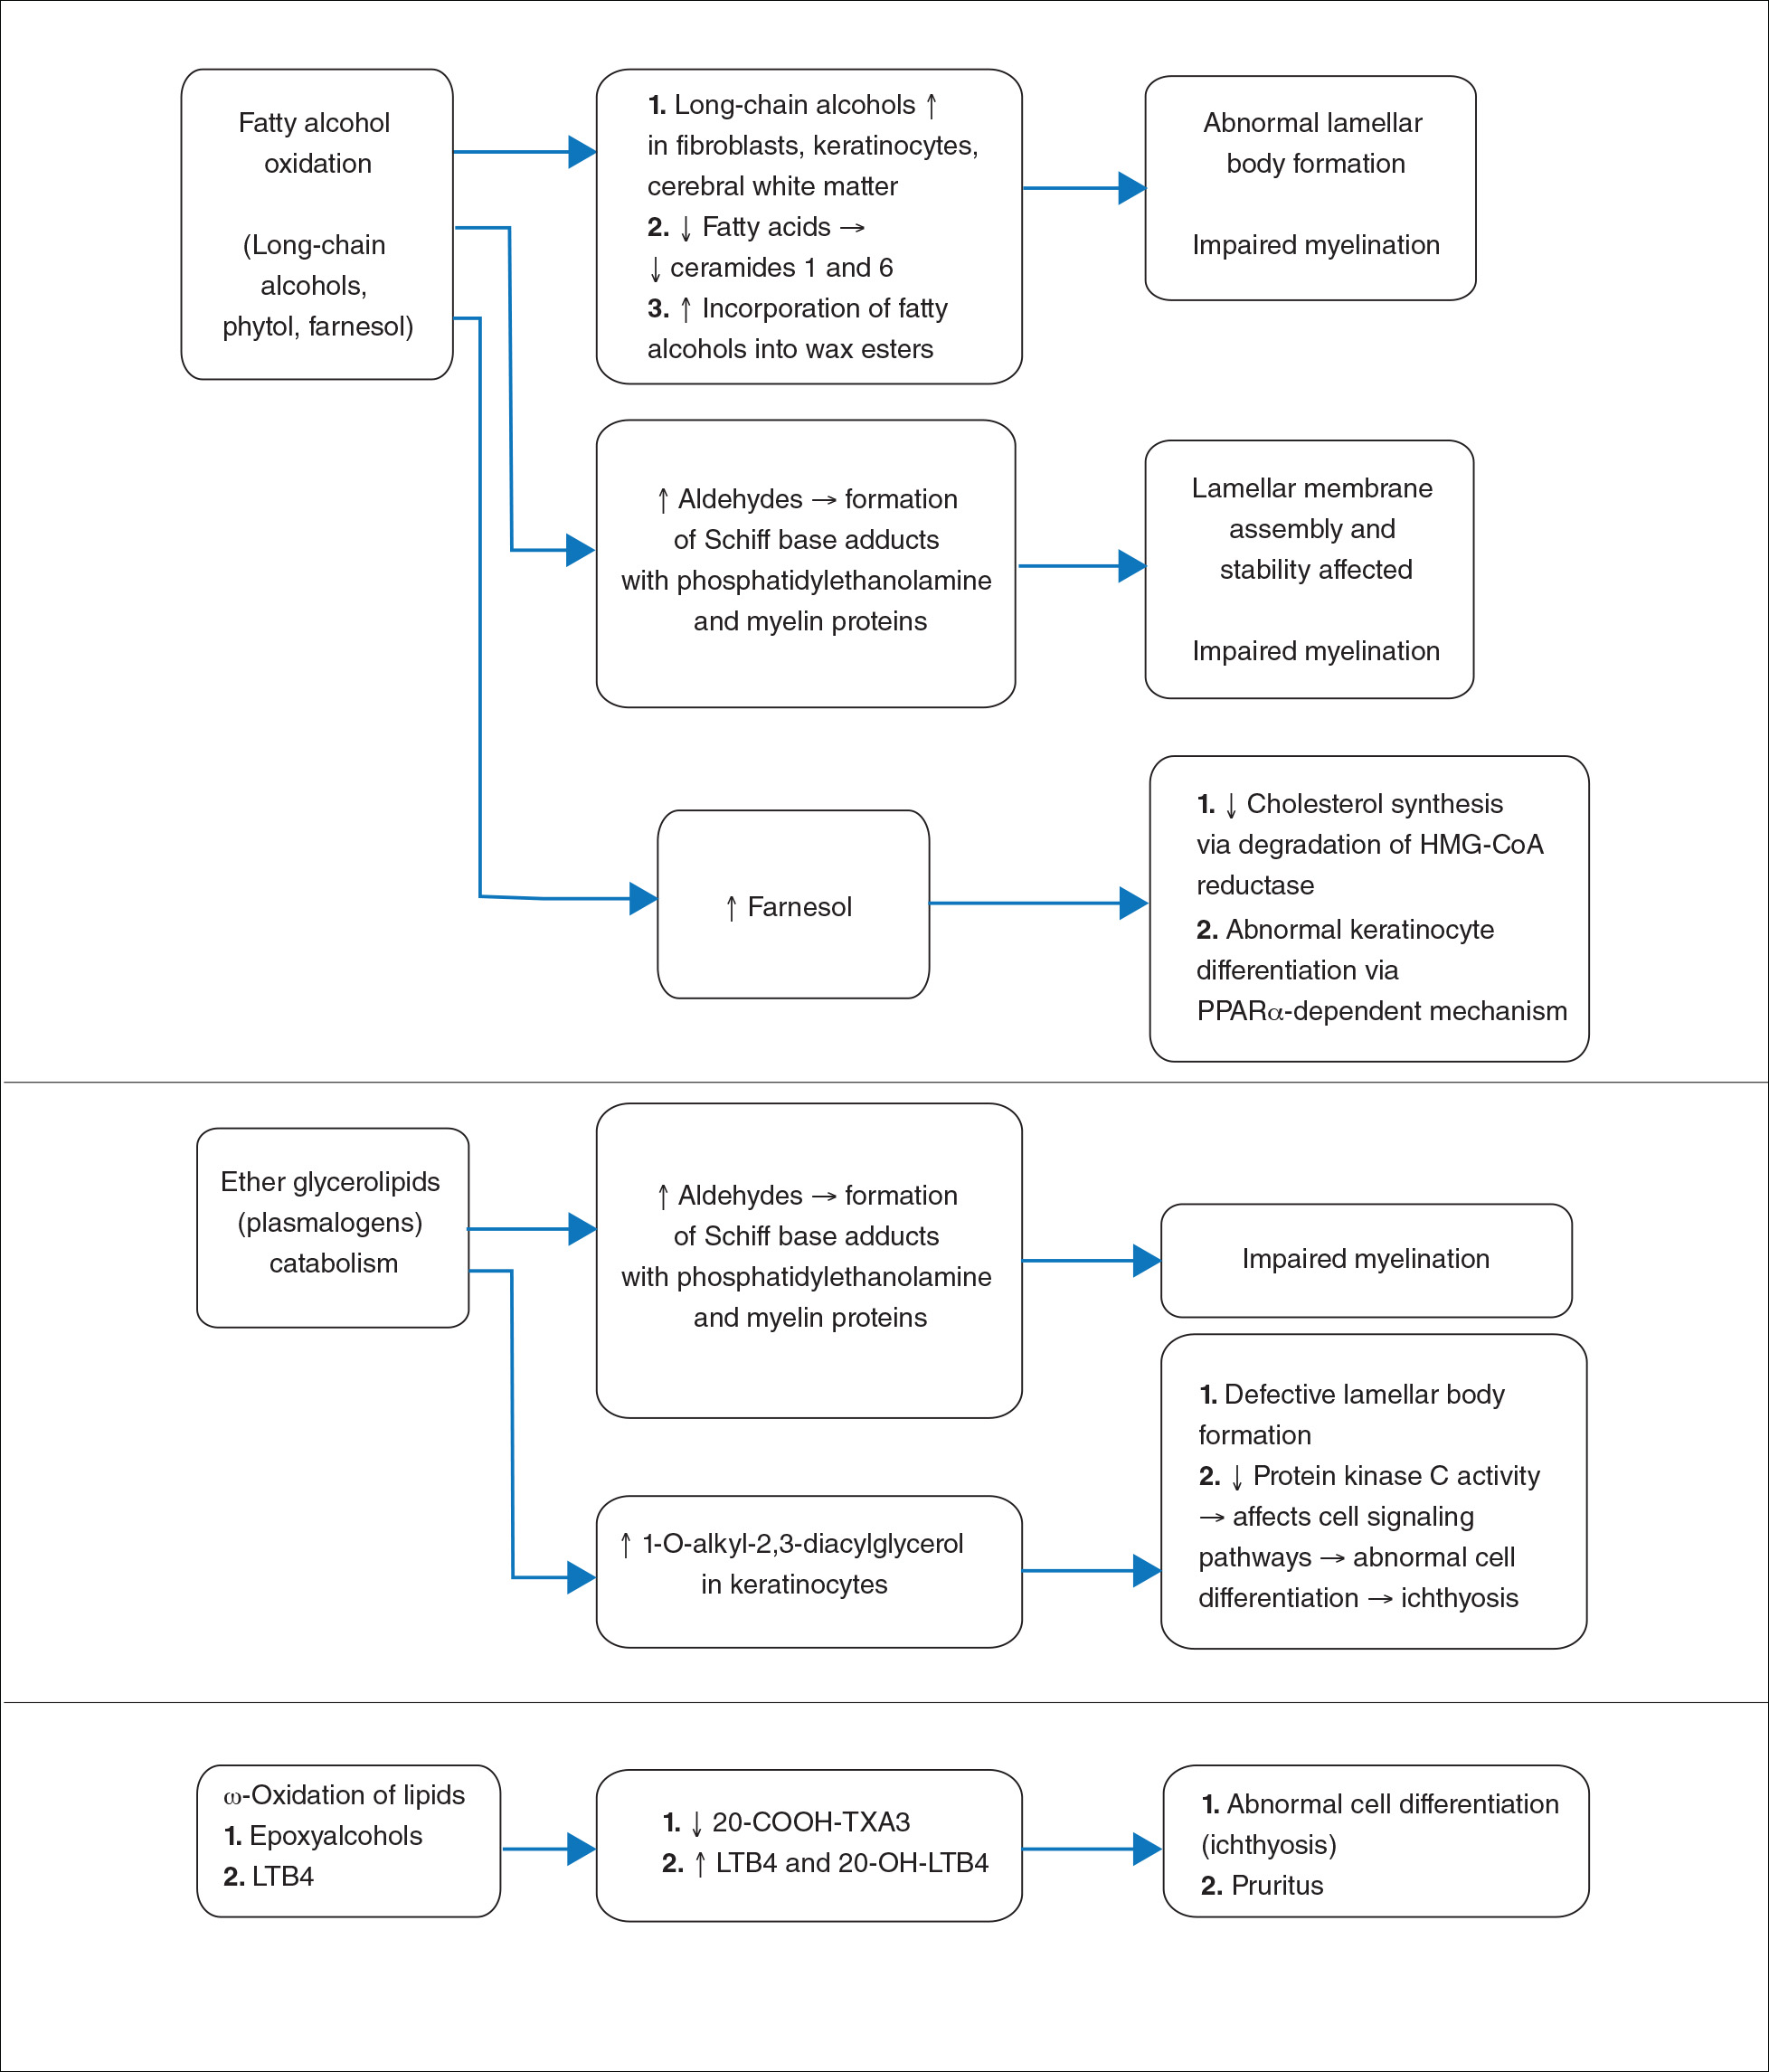
Histopathology
The epidermal permeability barrier is critically dependent on the appropriate lipid composition of the multilamellar stratum corneum intercellular membranes, an equimolar ratio of cholesterol, ceramides, and fatty acids. Histopathology of the skin in SLS generally shows hyperkeratosis, papillomatosis, acanthosis, and a mildly thickened granular layer. Ultrastructural studies of the skin reveal misshapen/empty lamellar bodies, abnormal cytoplasmic lamellar inclusions in the granular keratinocytes, lipid droplets in the stratum corneum with decreased lamellar bilayers, and lamellar/nonlamellar phase separation in the stratum corneum interstitium.11 These findings indicate that lipid metabolism dysfunction in SLS results in marked impairment in formation and secretion of lamellar bodies in the epidermis and consequent disorganization of the stratum corneum lamellar membranes. The resulting disruption of the skin barrier function leads to increased transepidermal water loss, resulting in ichthyosis.11,12 Another proposed mechanism for ichthyosis in SLS is disruption of the normal epidermal differentiation resulting from abnormal lipid metabolites (eFigure 2). Also, increased leukotriene B4 (LTB4) and 20-hydroxy-leukotriene B4 (20-OH-LTB4)(eFigure 1) may be responsible for the considerable pruritus seen in SLS.10
Neurologic Findings
Neurologic changes in SLS result from delayed and deficient myelination. Neuropathological studies have shown ballooning of myelin sheaths, extensive loss of myelin, axonal damage, and astrogliosis. The presence of lipoid material positive for periodic acid–Schiff that stains light rather than dark pink, dense distribution of round/ellipsoid bodies in the white matter of the cerebrum and brainstem positive for periodic acid–Schiff, and proliferation of perivascular macrophages containing lipofuscinlike pigments also have been described.13 Possibly, in the absence of FALDH, metabolism of plasmalogens (a major component of myelin) results in increased fatty aldehydes, which are either diverted to fatty alcohols or form adducts with phosphatidylethanolamine and myelin basic proteins (eFigure 1). Magnetic resonance imaging of the brain usually shows hypomyelination involving the periventricular white matter extending from the frontal to the occipital area.7,14 Mild ventricular enlargement may be an additional feature.14
A useful application of MRI is the proton magnetic resonance spectroscopy, which quantifies the brain metabolites noninvasively, displaying them as a spectrum on a graph. The spectrum comprises a set of resonances/peaks distributed along an x-axis. The resonances of these metabolites are obtained after suppressing the large signals from water protons. Proton magnetic resonance spectroscopy of the normal brain shows 3 prominent peaks: (1) N-acetylaspartate (NAA) at 2.02 ppm, (2) creatine at 3.02 ppm, and (3) choline at 3.22 ppm. In SLS, cerebral proton MRI spectroscopy reveals a characteristic abnormal, prominent, and narrow lipid peak at 1.3 ppm (corresponding to hexadecanol and octadecanol) and may offer a quantitative parameter for monitoring the effects of therapeutic interventions.7,14,15 The most intense lipid peaks are located in the periventricular regions in the anterior and posterior trigones. An abnormal but much smaller peak may be seen at 0.8 to 0.9 ppm, corresponding to phytol.14 Gradual emergence of these changes occurs in the first 2 years of life and then remains stable.15 Proton magnetic resonance spectroscopy also can be used for screening of SLS heterozygotes.16 Lipid peaks have been described in other disorders of lipid metabolism, but they are less intense, broader, and disappear on longer echo time sequences.14
Besides the characteristic parafoveal glistening white dots the retina, optical coherence tomography shows focal hyperreflectivitity in the perifoveal ganglion cell layer and inner plexiform layer of the retina as well as cystoid foveal degeneration.17 The intraretinal deposition of lipid metabolites probably leads to Müller cell degeneration with subsequent formation of cystoid spaces and atrophic changes in the fovea.
Measurement of FALDH or FAO activity in cultured skin fibroblasts and leukocytes using flurometric or gas chromatography mass spectrometry assays is a reliable biochemical test in cases of SLS as well as in heterozygotes.17 A decrease in FALDH/FAO activity also can be demonstrated by histochemical staining in skin biopsy.11 Pathologic urinary excretion of LTB4 and 20-OH-LTB4 also is a biochemical marker of SLS. Mutation analysis for a specific gene defect is diagnostic in cases of SLS as well as in heterozygotes. Prenatal diagnosis of SLS is possible by assessing FALDH activity or gene defects in cultured chorionic villus fibroblasts and amniocytes.18,19
Differential Diagnosis
The differential diagnosis of SLS includes congenital ichthyosiform erythroderma with neurological signs (Tay syndrome, Conradi-Hünermann-Happle syndrome) and neurocutaneous disorders such as neutral lipid storage disease and multiple sulfatase deficiency; however, the nature of the ichthyosis, presence of spastic diplegia/tetraplegia, characteristic parafoveal glistening white dots on the retina, and MRI and proton magnetic resonance spectroscopy findings help to easily differentiate SLS from these disorders.
Treatment
Treatment of SLS mainly is palliative. Ichthyosis can be treated with topical keratolytics, emollients, calcipotriol, and oral retinoids (acitretin).6 Zileuton, a 5-lipoxygenase inhibitor, inhibits synthesis of LTB4 and cysteinyl leukotrienes, thereby reducing the severity of pruritus and also has been shown to improve the speed of information processing.18 Similarly, montelukast, a leuko-triene antagonist, is helpful in relieving the agonizing pruritus.19 Experimental studies have shown that bezafibrate, a peroxisome proliferator-activated receptor α agonist, induces FALDH activity in fibroblasts of SLS patients that still have some residual FALDH activity, but further research is required to determine whether SLS patients could benefit from treatment.20 Physiotherapy helps in relieving the spasticity to some extent, such as in our case. Dietary intervention with reduced fat intake (up to 30% of total daily calorific requirement) and supplementation with omega-3 and omega-6 fatty acids has shown variable results in anecdotal reports.21-23 Gene therapy using recombinant adeno-associated virus 2 vectors to restore FALDH has been projected as a future treatment option.24 Despite lack of effective treatment options, most patients of SLS survive well into adulthood.
Conclusion
Because ichthyosis is one of the earliest and prominent symptoms of SLS, a dermatologist can play an important role in early diagnosis. Any child with the classical pattern of ichthyosis should be thoroughly examined for early neurologic signs and investigated to rule out SLS. Proton magnetic resonance spectroscopy serves as a useful adjunct in the diagnosis of SLS by confirming the accumulation of abnormal lipids in the periventricular white matter, especially when specific enzyme analysis and genetic analysis are not available in resource-restricted settings.
- Judge MR, McLean WHI, Munro CS. Disorders of keratinization. In: Burns T, Breathnach S, Cox N, eds. Rook’s Textbook of Dermatology. 7th ed. West Sussex, United Kingdom: Wiley & Sons; 2004:34.37-34.39.
- Sjögren T, Larsson T. Oligophrenia in association with congenital ichthyosis and spastic disorders. Acta Psychiatr Neurol Scand. 1957;32:1-113.
- Jagell S, Gustavson KH, Holmgren G. Sjögren-Larsson syndrome in Sweden. a clinical, genetic and epidemiological study. Clin Genet. 1981;19:233-256.
- Sood M, Trehan A, Dinakaran J, et al. Sjögren-Larsson syndrome. Indian J Pediatr. 2002;69:193-194.
- Uppal M, Srinivas CR, Thowfeeq KT. Sjögren-Larsson syndrome: report of two cases. Indian J Dermatol Venereol Leprol. 2004;70:110-111.
- Rizzo WB. Sjögren-Larsson syndrome: molecular genetics and biochemical pathogenesis of fatty aldehyde dehydrogenase deficiency. Mol Genet Metab. 2007;90:1-9.
- Willemsen MA, Ijlst L, Steijlen PM, et al. Clinical, biochemical and molecular genetic characteristics of 19 patients with the Sjögren-Larsson syndrome. Brain. 2001;124(pt 7):1426-1437.
- Willemsen MA, Cruysberg JR, Rotteveel JJ, et al. Juvenile macular dystrophy associated with deficient activity of fatty aldehyde dehydrogenase in Sjögren-Larsson syndrome. Am J Ophthalmol. 2000;130:782-789.
- Lossos A, Khoury M, Rizzo WB, et al. Phenotypic variability among adult siblings with Sjögren-Larsson syndrome. Arch Neurol. 2006;63:278-280.
- Rizzo WB, Craft DA, Somer T, et al. Abnormal fatty alcohol metabolism in cultured keratinocytes from patients with Sjögren-Larsson syndrome. J Lipid Res. 2008;49:410-419.
- Rizzo WB, S’Aulis D, Jennings MA, et al. Ichthyosis in Sjögren-Larsson syndrome reflects defective barrier function due to abnormal lamellar body structure and secretion. Arch Dermatol Res. 2010;302:443-451.
- Rizzo WB. The role of fatty aldehyde dehydrogenase in epidermal structure and function. Dermatoendocrinol. 2011;2:91-99.
- Yamaguchi K, Handa T. Sjögren-Larsson syndrome: postmortem brain abnormalities. Pediatr Neurol. 1998;18:338-341.
- Mano T, Ono J, Kaminaga T, et al. Proton MR spectroscopy of Sjögren-Larsson’s Syndrome. Am J Neuroradiol. 1999;20:1671-1673.
- Willemsen MA, van der Graf M, van der Knaap MS, et al. MR imaging and proton MR spectroscopic studies in Sjögren-Larsson syndrome: characterization of the leukoencephalopathy. Am J Neuroradiol. 2004;25:649-657.
- Kaminaga T, Mano T, Ono J, et al. Proton magnetic resonance spectroscopy of Sjögren-Larsson Syndrome. Magn Reson Med. 2001;45:1112-1115.
- Fuijkschot J, Cruysberg JR, Willemsen MA, et al. Subclinical changes in the juvenile crystalline macular dystrophy in Sjögren-Larsson syndrome detected by optical coherence tomography. Ophthalmology. 2008;115:870-875.
- Willemsen MA, Lutt MA, Steijlen PM, et al. Clinical and biochemical effects of zileuton in patients with the Sjögren-Larsson syndrome. Eur J Pediatr. 2001;160:711-717.
- Pirgon O, Aydin K, Atabek ME. Proton magnetic resonance spectroscopy findings and clinical effects of montelukast sodium in a case with Sjögren-Larsson syndrome. J Child Neurol. 2006;21:1092-1095.
- Gloerich J, Ijlst L, Wanders RJ, et al. Bezafibrate induces FALDH in human fibroblasts; implications for Sjögren-Larsson syndrome Mol Genet Metab. 2006;89:111-115.
- Auada MP, Taube MB, Collares EF, et al. Sjögren-Larsson syndrome: biochemical defects and follow up in three cases. Eur J Dermatol. 2002;12:263-266.
- Taube B, Billeaud C, Labreze C, et al. Sjögren-Larsson syndrome: early diagnosis, dietary management and biochemical studies in two cases. Dermatology. 1999;198:340-345.
- Rizzo WB. Genetics and prospective therapeutic targets for Sjögren-Larsson Syndrome. Expert Opin Orphan Drugs. 2016;4:395-406.
- Haug S, Braun-Falco M. Restoration of fatty aldehyde dehydrogenase deficiency in Sjögren-Larsson syndrome. Gene Ther. 2006;13:1021-1026.
Sjögren-Larsson syndrome (SLS) is a rare autosomal-recessive neurocutaneous disorder comprising a triad of ichthyosis, mental retardation, and spastic diplegia or quadriplegia.1 The disorder was first described by Sjögren and Larsson2 in 1957. Early reports of SLS were mainly in white patients, with a particularly high prevalence of 8.3 cases per 100,000 individuals in the county of Västerbotten in Sweden.3 Reports of SLS in Asian and Indian populations are rare.4,5 We report a case of SLS in an Indian boy.
Case Report
A 12-year-old Indian boy born to nonconsanguineous parents after a full-term pregnancy with normal vaginal delivery presented with generalized dry scaly skin that had been present since 2 months of age. He had a history of delayed milestones (ie, facial recognition, sitting without support at 3 years of age), inability to walk, dysarthria, mental retardation). He had never attended school due to subnormal intellectual functioning. He had a single episode of a tonic-clonic seizure at 4 years of age but was not on any regular antiepileptic medication. There was a history of similar skin lesions in one male sibling of the patient and in 2 maternal uncles. None of them survived beyond early childhood, but detailed information regarding the cutaneous and neurologic manifestations in these family members was not available.
Cutaneous examination revealed lamellarlike ichthyosis on the dorsal aspects of the arms and legs (Figure 1A). Ichthyosis with lichenification was present on the neck, axillae, cubital and popliteal fossae, and abdomen (Figure 1B). The palms and soles showed keratoderma. Neurologic examination of the arms revealed mild rigidity and brisk reflexes. Examination of the legs showed marked rigidity, brisk knee jerks, ankle clonus, extensor plantar reflexes, flexion deformity with contractures, and scissor gait. A Goddard (Seguin) formboard test was performed and indicated a mental age of 4 years. The patient’s IQ was in the range of 25 to 30, indicating a severe degree of subnormality in intellectual functioning. The clinical presentation suggested a diagnosis of SLS.
A skin biopsy from the ichthyotic lesion showed hyperkeratosis, acanthosis, and papillomatosis with sparse superficial perivascular lymphocytic infiltrate, thus confirming the diagnosis of lamellar ichthyosis. Fundus examination was normal. Magnetic resonance imaging (MRI) of the brain revealed confluent symmetrical signal abnormalities along the body of the lateral ventricles, white matter in the perioccipital horn, and in deep white matter of centrum semiovale (Figure 2). Magnetic resonance spectroscopy revealed a narrow lipid peak at approximately 1.3 ppm in the region of signal abnormality (Figure 3). Thus, the diagnosis of SLS was confirmed. Measurement of fatty aldehyde dehydrogenase (FALDH) activity and genetic analysis were not performed due to unavailability.
The patient was treated with topical emollients for the ichthyosis. To reduce his dietary intake of long-chain fatty acids and increase the intake of omega-3 and omega-6 fatty acids, the patient’s parents were advised to use canola, mustard, and/or coconut oil for cooking for the patient, and skim milk was recommended instead of whole milk. Neurodevelopmental techniques in the form of stretching exercises were given to maintain his range of movements. Gutter splints were given to maintain the knees in extension for physiological standing and to prevent osteoporosis. Subsequently, the patient also underwent a multilevel soft-tissue release (hip and knee joints) to relieve the contractures. These measures resulted in considerable improvement and the patient was able to walk with support.
Comment
Presentation
The characteristic clinical features of SLS begin to develop during the intranatal period and infancy.1,6 Pathologic skin involvement can be detected as early as week 23 of gestation. Preterm births associated with SLS have commonly been described.3 Ichthyosis often is evident at birth, but collodion membrane is uncommon. Severe pruritus is a marked feature unlike most other types of ichthyosis. The ichthyosis often is generalized with prominent involvement of the flexural areas and nape of the neck, varying from fine furfuraceous to larger lamellarlike scales. Velvety orange or brown lichenification often is a predominant feature in the flexures of the arms, legs, neck, and mid abdomen. Mental retardation, developmental delay, and spasticity usually become apparent at 1 to 2 years of age and subsequently are nonprogressive.6,7 However, patients rarely have been described with normal intellectual functioning.7 Spasticity often is more severe in the lower limbs and may lead to contractures, kyphoscoliosis, hip dislocation, and short stature. Delayed speech and dysarthria are common. Parafoveal glistening white dots on the retina are a pathognomonic feature and typically appear in the first 2 years of life; however, they are seen in approximately 30% of patients and increase slightly in number with age.6,8 There may be associated decreased visual acuity, photophobia, myopia, and astigmatism. Other clinical features include enamel hypoplasia, metaphyseal dysplasia, and epilepsy.1,6
Gene Mutations
Sjögren-Larsson syndrome is caused by mutation in the aldehyde dehydrogenase 3 family member A2 gene, ALDH3A2 (17p11.2), which codes for FALDH.1,6,7 The ALDH3A2 gene is 11 exons long and gives rise to 2 protein isoforms that differ in their carboxy-terminal domains; the major isoform, composed of 485 amino acids, localizes to the endoplasmic reticulum. The minor protein isoform (FALDHv) is composed of 508 amino acids, possesses a longer carboxy-terminal, and appears to be targeted to the peroxisome. Several mutations have been reported throughout the ALDH3A2 gene, including missense mutations (most common [38% of cases of SLS6]), deletions, insertions, splicing errors, and complex rearrangements. Although several of these mutations are private, several common mutations may be indicative of founder effects (ie, shared ancestry), consanguinity, or recurrent mutational events (mutation hotspots).6,7 Despite the wide spectrum of mutations, there is very little phenotypic variation, with consistently severe cutaneous and neurological involvement occurring in a majority of patients.7 However, Lossos et al9 described remarkable phenotypic variation in 6 siblings of an Arab family and suggested that additional unknown genetic or environmental factors may compensate for the biochemical defect.
Lipid Metabolism
Fatty aldehyde dehydrogenase is expressed in almost all cells and tissues and catalyzes the oxidation of fatty aldehydes to fatty acids (eFigure 1). It also is a part of the fatty alcohol:NAD oxidoreductase (FAO) enzyme complex, which catalyzes fatty alcohol oxidation to fatty acid. Fatty aldehyde dehydrogenase deficiency leads to accumulation of long-chain alcohols (eg, hexadecanol, octadecanol, octadecenol) and diversion of fatty alcohol into alternate biosynthetic pathways such as wax esters and 1-O-alkyl-2,3-diacylglycerol.10 Other lipids that are increased are illustrated in eFigure 2. Accumulation of these lipids, toxic effects of abnormal lipids (especially fatty aldehydes and Schiff base protein-lipid adducts), and lack of essential lipids (eg, polyunsaturated fatty acids, ceramides 1 and 6, triglycerides) are responsible for the classical cutaneous, neurologic, and ophthalmologic features of SLS.
Histopathology
The epidermal permeability barrier is critically dependent on the appropriate lipid composition of the multilamellar stratum corneum intercellular membranes, an equimolar ratio of cholesterol, ceramides, and fatty acids. Histopathology of the skin in SLS generally shows hyperkeratosis, papillomatosis, acanthosis, and a mildly thickened granular layer. Ultrastructural studies of the skin reveal misshapen/empty lamellar bodies, abnormal cytoplasmic lamellar inclusions in the granular keratinocytes, lipid droplets in the stratum corneum with decreased lamellar bilayers, and lamellar/nonlamellar phase separation in the stratum corneum interstitium.11 These findings indicate that lipid metabolism dysfunction in SLS results in marked impairment in formation and secretion of lamellar bodies in the epidermis and consequent disorganization of the stratum corneum lamellar membranes. The resulting disruption of the skin barrier function leads to increased transepidermal water loss, resulting in ichthyosis.11,12 Another proposed mechanism for ichthyosis in SLS is disruption of the normal epidermal differentiation resulting from abnormal lipid metabolites (eFigure 2). Also, increased leukotriene B4 (LTB4) and 20-hydroxy-leukotriene B4 (20-OH-LTB4)(eFigure 1) may be responsible for the considerable pruritus seen in SLS.10
Neurologic Findings
Neurologic changes in SLS result from delayed and deficient myelination. Neuropathological studies have shown ballooning of myelin sheaths, extensive loss of myelin, axonal damage, and astrogliosis. The presence of lipoid material positive for periodic acid–Schiff that stains light rather than dark pink, dense distribution of round/ellipsoid bodies in the white matter of the cerebrum and brainstem positive for periodic acid–Schiff, and proliferation of perivascular macrophages containing lipofuscinlike pigments also have been described.13 Possibly, in the absence of FALDH, metabolism of plasmalogens (a major component of myelin) results in increased fatty aldehydes, which are either diverted to fatty alcohols or form adducts with phosphatidylethanolamine and myelin basic proteins (eFigure 1). Magnetic resonance imaging of the brain usually shows hypomyelination involving the periventricular white matter extending from the frontal to the occipital area.7,14 Mild ventricular enlargement may be an additional feature.14
A useful application of MRI is the proton magnetic resonance spectroscopy, which quantifies the brain metabolites noninvasively, displaying them as a spectrum on a graph. The spectrum comprises a set of resonances/peaks distributed along an x-axis. The resonances of these metabolites are obtained after suppressing the large signals from water protons. Proton magnetic resonance spectroscopy of the normal brain shows 3 prominent peaks: (1) N-acetylaspartate (NAA) at 2.02 ppm, (2) creatine at 3.02 ppm, and (3) choline at 3.22 ppm. In SLS, cerebral proton MRI spectroscopy reveals a characteristic abnormal, prominent, and narrow lipid peak at 1.3 ppm (corresponding to hexadecanol and octadecanol) and may offer a quantitative parameter for monitoring the effects of therapeutic interventions.7,14,15 The most intense lipid peaks are located in the periventricular regions in the anterior and posterior trigones. An abnormal but much smaller peak may be seen at 0.8 to 0.9 ppm, corresponding to phytol.14 Gradual emergence of these changes occurs in the first 2 years of life and then remains stable.15 Proton magnetic resonance spectroscopy also can be used for screening of SLS heterozygotes.16 Lipid peaks have been described in other disorders of lipid metabolism, but they are less intense, broader, and disappear on longer echo time sequences.14
Besides the characteristic parafoveal glistening white dots the retina, optical coherence tomography shows focal hyperreflectivitity in the perifoveal ganglion cell layer and inner plexiform layer of the retina as well as cystoid foveal degeneration.17 The intraretinal deposition of lipid metabolites probably leads to Müller cell degeneration with subsequent formation of cystoid spaces and atrophic changes in the fovea.
Measurement of FALDH or FAO activity in cultured skin fibroblasts and leukocytes using flurometric or gas chromatography mass spectrometry assays is a reliable biochemical test in cases of SLS as well as in heterozygotes.17 A decrease in FALDH/FAO activity also can be demonstrated by histochemical staining in skin biopsy.11 Pathologic urinary excretion of LTB4 and 20-OH-LTB4 also is a biochemical marker of SLS. Mutation analysis for a specific gene defect is diagnostic in cases of SLS as well as in heterozygotes. Prenatal diagnosis of SLS is possible by assessing FALDH activity or gene defects in cultured chorionic villus fibroblasts and amniocytes.18,19
Differential Diagnosis
The differential diagnosis of SLS includes congenital ichthyosiform erythroderma with neurological signs (Tay syndrome, Conradi-Hünermann-Happle syndrome) and neurocutaneous disorders such as neutral lipid storage disease and multiple sulfatase deficiency; however, the nature of the ichthyosis, presence of spastic diplegia/tetraplegia, characteristic parafoveal glistening white dots on the retina, and MRI and proton magnetic resonance spectroscopy findings help to easily differentiate SLS from these disorders.
Treatment
Treatment of SLS mainly is palliative. Ichthyosis can be treated with topical keratolytics, emollients, calcipotriol, and oral retinoids (acitretin).6 Zileuton, a 5-lipoxygenase inhibitor, inhibits synthesis of LTB4 and cysteinyl leukotrienes, thereby reducing the severity of pruritus and also has been shown to improve the speed of information processing.18 Similarly, montelukast, a leuko-triene antagonist, is helpful in relieving the agonizing pruritus.19 Experimental studies have shown that bezafibrate, a peroxisome proliferator-activated receptor α agonist, induces FALDH activity in fibroblasts of SLS patients that still have some residual FALDH activity, but further research is required to determine whether SLS patients could benefit from treatment.20 Physiotherapy helps in relieving the spasticity to some extent, such as in our case. Dietary intervention with reduced fat intake (up to 30% of total daily calorific requirement) and supplementation with omega-3 and omega-6 fatty acids has shown variable results in anecdotal reports.21-23 Gene therapy using recombinant adeno-associated virus 2 vectors to restore FALDH has been projected as a future treatment option.24 Despite lack of effective treatment options, most patients of SLS survive well into adulthood.
Conclusion
Because ichthyosis is one of the earliest and prominent symptoms of SLS, a dermatologist can play an important role in early diagnosis. Any child with the classical pattern of ichthyosis should be thoroughly examined for early neurologic signs and investigated to rule out SLS. Proton magnetic resonance spectroscopy serves as a useful adjunct in the diagnosis of SLS by confirming the accumulation of abnormal lipids in the periventricular white matter, especially when specific enzyme analysis and genetic analysis are not available in resource-restricted settings.
- Judge MR, McLean WHI, Munro CS. Disorders of keratinization. In: Burns T, Breathnach S, Cox N, eds. Rook’s Textbook of Dermatology. 7th ed. West Sussex, United Kingdom: Wiley & Sons; 2004:34.37-34.39.
- Sjögren T, Larsson T. Oligophrenia in association with congenital ichthyosis and spastic disorders. Acta Psychiatr Neurol Scand. 1957;32:1-113.
- Jagell S, Gustavson KH, Holmgren G. Sjögren-Larsson syndrome in Sweden. a clinical, genetic and epidemiological study. Clin Genet. 1981;19:233-256.
- Sood M, Trehan A, Dinakaran J, et al. Sjögren-Larsson syndrome. Indian J Pediatr. 2002;69:193-194.
- Uppal M, Srinivas CR, Thowfeeq KT. Sjögren-Larsson syndrome: report of two cases. Indian J Dermatol Venereol Leprol. 2004;70:110-111.
- Rizzo WB. Sjögren-Larsson syndrome: molecular genetics and biochemical pathogenesis of fatty aldehyde dehydrogenase deficiency. Mol Genet Metab. 2007;90:1-9.
- Willemsen MA, Ijlst L, Steijlen PM, et al. Clinical, biochemical and molecular genetic characteristics of 19 patients with the Sjögren-Larsson syndrome. Brain. 2001;124(pt 7):1426-1437.
- Willemsen MA, Cruysberg JR, Rotteveel JJ, et al. Juvenile macular dystrophy associated with deficient activity of fatty aldehyde dehydrogenase in Sjögren-Larsson syndrome. Am J Ophthalmol. 2000;130:782-789.
- Lossos A, Khoury M, Rizzo WB, et al. Phenotypic variability among adult siblings with Sjögren-Larsson syndrome. Arch Neurol. 2006;63:278-280.
- Rizzo WB, Craft DA, Somer T, et al. Abnormal fatty alcohol metabolism in cultured keratinocytes from patients with Sjögren-Larsson syndrome. J Lipid Res. 2008;49:410-419.
- Rizzo WB, S’Aulis D, Jennings MA, et al. Ichthyosis in Sjögren-Larsson syndrome reflects defective barrier function due to abnormal lamellar body structure and secretion. Arch Dermatol Res. 2010;302:443-451.
- Rizzo WB. The role of fatty aldehyde dehydrogenase in epidermal structure and function. Dermatoendocrinol. 2011;2:91-99.
- Yamaguchi K, Handa T. Sjögren-Larsson syndrome: postmortem brain abnormalities. Pediatr Neurol. 1998;18:338-341.
- Mano T, Ono J, Kaminaga T, et al. Proton MR spectroscopy of Sjögren-Larsson’s Syndrome. Am J Neuroradiol. 1999;20:1671-1673.
- Willemsen MA, van der Graf M, van der Knaap MS, et al. MR imaging and proton MR spectroscopic studies in Sjögren-Larsson syndrome: characterization of the leukoencephalopathy. Am J Neuroradiol. 2004;25:649-657.
- Kaminaga T, Mano T, Ono J, et al. Proton magnetic resonance spectroscopy of Sjögren-Larsson Syndrome. Magn Reson Med. 2001;45:1112-1115.
- Fuijkschot J, Cruysberg JR, Willemsen MA, et al. Subclinical changes in the juvenile crystalline macular dystrophy in Sjögren-Larsson syndrome detected by optical coherence tomography. Ophthalmology. 2008;115:870-875.
- Willemsen MA, Lutt MA, Steijlen PM, et al. Clinical and biochemical effects of zileuton in patients with the Sjögren-Larsson syndrome. Eur J Pediatr. 2001;160:711-717.
- Pirgon O, Aydin K, Atabek ME. Proton magnetic resonance spectroscopy findings and clinical effects of montelukast sodium in a case with Sjögren-Larsson syndrome. J Child Neurol. 2006;21:1092-1095.
- Gloerich J, Ijlst L, Wanders RJ, et al. Bezafibrate induces FALDH in human fibroblasts; implications for Sjögren-Larsson syndrome Mol Genet Metab. 2006;89:111-115.
- Auada MP, Taube MB, Collares EF, et al. Sjögren-Larsson syndrome: biochemical defects and follow up in three cases. Eur J Dermatol. 2002;12:263-266.
- Taube B, Billeaud C, Labreze C, et al. Sjögren-Larsson syndrome: early diagnosis, dietary management and biochemical studies in two cases. Dermatology. 1999;198:340-345.
- Rizzo WB. Genetics and prospective therapeutic targets for Sjögren-Larsson Syndrome. Expert Opin Orphan Drugs. 2016;4:395-406.
- Haug S, Braun-Falco M. Restoration of fatty aldehyde dehydrogenase deficiency in Sjögren-Larsson syndrome. Gene Ther. 2006;13:1021-1026.
Practice Points
- Sjögren-Larsson syndrome (SLS) is characterized by a clinical triad of ichthyosis, mental retardation, and spastic diplegia or quadriplegia.
- A characteristic lipid peak at 1.3 ppm on magnetic resonance spectroscopy is diagnostic of SLS.
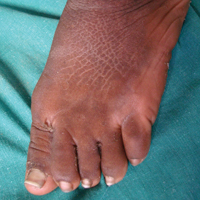
The Right and Wrong of 2017
It is customary at the end of the year for editors of journals and magazines to publish “the best and the worst of the year” or top 10 lists of events or articles of the year, or even the “most important” discoveries or people of the year. Some publications survey their readers; others invite experts to opine on the selection. What is nearly always missing from these newsworthy roundups are the criteria for determining what meets the mark. But this is a crucial piece of missing information, and without it, many of these rankings have little worth.
Words like important, best, and worst are not factual claims but value judgments. For a value judgment to have validity, there must be a substantive basis for making the determination. Put less ponderously, readers need to understand what makes a person, action, or decision valuable or important.
Being a medical ethicist, I tend to think in terms of good and bad, right and wrong—hence, the title of this editorial. But even these essential terms of evaluation in our language must have a frame of reference or at least a description to have meaning when applied, especially if the terms are to be compared. For moral philosophy, the parent of medical ethics, these frames or bases for making judgments about the rightness or wrongness of conduct are often found in ethical theories.
Three of the most recognized and significant ethical theories are consequentialist, deontology, and virtue ethics. It is important to understand these theories to grasp how I decided on my list of the right and wrong of 2017. However due to space limitations, I will only provide a nutshell summary of these theories. Readers interested in cracking the nut wider may want to consult the references on ethical theory at the end of the essay.1
Consequentialist theories—utilitarianism being the most well known in health care—argue that what makes an action right or good is what brings about the most happiness for the most people. What is determinative of rightness is the outcome.
In direct opposition to consequentialism is deontology. The consequences do not matter at all to the deontologist, right and good have to do with intent, and the only truly right intent is acting for the sake of duty alone.
Virtue ethics finds the core of right and good in the character of the virtuous person. Right actions and good intent each spring from the root of an individual of moral excellence.2
Establishing these ethical theories as the criteria for judgment, I now turn to my choice for the right and the good, the “best” of federal practice in 2017. (Next month my editorial will focus on the bad or the “worst” of 2017 federal health care.) Upfront, I acknowledge these choices are subjective, but I justify them by using the theories set forth. We welcome readers to send us their selections.
The Best
While journalists and politicians have widely criticized the White House response (or lack thereof) to the destructive storms that occurred during this hurricane season, little attention has been paid to the response of the 3 federal health care agencies, which was quick, dedicated, and caring. And it is this response that makes it my best of 2017. The vulnerability of areas from Houston to Puerto Rico, some of which still lack the basic services of civilization, are struggling with loss of life and hope, powerless to protect what is left in the wake of the storms, only amplifies the desperate need for the human and material resources that the DoD, VA, and PHS have committed.
Testifying before the Senate Homeland Security and Governmental Affairs Committee, Robert G. Salesses, deputy assistant secretary of defense, chronicled the outpouring of DoD aid. “Military units cleared critical roadways, transported life-sustaining commodities, provided fuel distribution, conducted assessments of civilian hospitals, and provided medical support to include evacuating patients back to the continental United States.”3
The VA Disaster Emergency Medical Personnel system also went into high gear. In my facility and in many others, there were so many volunteers that facility leaders had to balance their clinical needs with the selfless desire to help the veterans and fellow federal practitioners who were in harm’s way.
According to Susan Wentzell, VISN 8 deputy communication manager and content manager:
“Despite the destruction caused by these monster storms, Veterans continued to receive vital health care and other support, thanks to the selfless efforts of thousands of dedicated VA employees who rallied together to provide around-the-clock care for patients sheltered-in-place in the eight large, hurricane-constructed VA hospitals and to get services back up and running in dozens of outpatient clinics impacted in the Southeast corridor of the U.S. and the Caribbean.”4
When Hurricane Maria ravaged Puerto Rico, medical personnel from the VA and the PHS Commissioned Corps staffed Federal Medical Stations in Manati and Bayamon, Puerto Rico, which provided cared for up to 250 people at a time. The officers of the Commissioned Corps also helped support the civilian health care infrastructure.
From a utilitarian perspective, the benefit of these relief efforts is obvious. They were literally life-saving and health preserving for the thousands who were injured in the wreckage of wind and rain, ill from the collapse of public services, as well as those psychologically traumatized. And had these men and women of the VA, PHS, and DoD not come to the aid of the victims of these unprecedented national disasters, the toll of human suffering and bereavement would have been far worse.
Deontologically, each of these government employees did their duty; many volunteered, and even those who were ordered to assist did so with a compassion and dedication that went far beyond doing a job. None of the historic drives of humankind to place themselves in harm’s way—power, money, or fame—motivated those who answered the call; only a duty to serve and an intention to help.
Each person who left the security of home and the comfort of friends and family displayed the highest qualities of virtue ethics: altruism, professionalism, empathy, and integrity among other virtues.
In preparing for this column, I read stories of health care practitioners and nonclinical staff who not only reached out, but also reached beyond any expectation, clearly demonstrating outstanding professionalism and humanism.
I end with just one of these inspirational accounts. As Hurricane Irma approached the Florida coast, veteran employee Tim Myers braved the coming storm to get to work. That is far harder and braver than it seems, because Myers, who is a pharmacy technician and delivers medications to inpatients at the James A. Haley VA, is a quadriplegic in a wheelchair. The humility of his laconic description of his supererogatory conduct is equally impressive. “I appreciate that, but it really wasn’t that big of a deal to me,” Myers said. “I mean, I had to get here.”5
1. Vaughn L. Bioethics Principles, Issues, and Cases. 3rd ed. New York, NY: Oxford University Press, 2017.
2. Kuhse H, Singer P, eds. A Companion to Bioethics. 2nd ed. Malden, MA: Wiley-Blackwell, 2012.
3. Garamone J. Officials detail DOD support during unprecedented hurricane season. https://www.defense.gov/News/Article/Article/1360033/officials-detail-dod-support-during-unprecedented-hurricane-season. Published November 1, 2017. Accessed November 18, 2017.
4. Wentzell S. Through hurricanes, VA continues efforts to care for Veterans. https://www.blogs.va.gov/VAntage/41864/through-hurricanes-va-continues-efforts-to-care-for-veterans/. Published October 3, 2017. Accessed November 19, 2017.
5. Drohan E. Dedication in the face of the storm. September 18, 2017. https://www.tampa.va.gov/TAMPA/features/Wheelchair_Through_Irma.asp. Published September 18, 2017. November 19, 2017.
It is customary at the end of the year for editors of journals and magazines to publish “the best and the worst of the year” or top 10 lists of events or articles of the year, or even the “most important” discoveries or people of the year. Some publications survey their readers; others invite experts to opine on the selection. What is nearly always missing from these newsworthy roundups are the criteria for determining what meets the mark. But this is a crucial piece of missing information, and without it, many of these rankings have little worth.
Words like important, best, and worst are not factual claims but value judgments. For a value judgment to have validity, there must be a substantive basis for making the determination. Put less ponderously, readers need to understand what makes a person, action, or decision valuable or important.
Being a medical ethicist, I tend to think in terms of good and bad, right and wrong—hence, the title of this editorial. But even these essential terms of evaluation in our language must have a frame of reference or at least a description to have meaning when applied, especially if the terms are to be compared. For moral philosophy, the parent of medical ethics, these frames or bases for making judgments about the rightness or wrongness of conduct are often found in ethical theories.
Three of the most recognized and significant ethical theories are consequentialist, deontology, and virtue ethics. It is important to understand these theories to grasp how I decided on my list of the right and wrong of 2017. However due to space limitations, I will only provide a nutshell summary of these theories. Readers interested in cracking the nut wider may want to consult the references on ethical theory at the end of the essay.1
Consequentialist theories—utilitarianism being the most well known in health care—argue that what makes an action right or good is what brings about the most happiness for the most people. What is determinative of rightness is the outcome.
In direct opposition to consequentialism is deontology. The consequences do not matter at all to the deontologist, right and good have to do with intent, and the only truly right intent is acting for the sake of duty alone.
Virtue ethics finds the core of right and good in the character of the virtuous person. Right actions and good intent each spring from the root of an individual of moral excellence.2
Establishing these ethical theories as the criteria for judgment, I now turn to my choice for the right and the good, the “best” of federal practice in 2017. (Next month my editorial will focus on the bad or the “worst” of 2017 federal health care.) Upfront, I acknowledge these choices are subjective, but I justify them by using the theories set forth. We welcome readers to send us their selections.
The Best
While journalists and politicians have widely criticized the White House response (or lack thereof) to the destructive storms that occurred during this hurricane season, little attention has been paid to the response of the 3 federal health care agencies, which was quick, dedicated, and caring. And it is this response that makes it my best of 2017. The vulnerability of areas from Houston to Puerto Rico, some of which still lack the basic services of civilization, are struggling with loss of life and hope, powerless to protect what is left in the wake of the storms, only amplifies the desperate need for the human and material resources that the DoD, VA, and PHS have committed.
Testifying before the Senate Homeland Security and Governmental Affairs Committee, Robert G. Salesses, deputy assistant secretary of defense, chronicled the outpouring of DoD aid. “Military units cleared critical roadways, transported life-sustaining commodities, provided fuel distribution, conducted assessments of civilian hospitals, and provided medical support to include evacuating patients back to the continental United States.”3
The VA Disaster Emergency Medical Personnel system also went into high gear. In my facility and in many others, there were so many volunteers that facility leaders had to balance their clinical needs with the selfless desire to help the veterans and fellow federal practitioners who were in harm’s way.
According to Susan Wentzell, VISN 8 deputy communication manager and content manager:
“Despite the destruction caused by these monster storms, Veterans continued to receive vital health care and other support, thanks to the selfless efforts of thousands of dedicated VA employees who rallied together to provide around-the-clock care for patients sheltered-in-place in the eight large, hurricane-constructed VA hospitals and to get services back up and running in dozens of outpatient clinics impacted in the Southeast corridor of the U.S. and the Caribbean.”4
When Hurricane Maria ravaged Puerto Rico, medical personnel from the VA and the PHS Commissioned Corps staffed Federal Medical Stations in Manati and Bayamon, Puerto Rico, which provided cared for up to 250 people at a time. The officers of the Commissioned Corps also helped support the civilian health care infrastructure.
From a utilitarian perspective, the benefit of these relief efforts is obvious. They were literally life-saving and health preserving for the thousands who were injured in the wreckage of wind and rain, ill from the collapse of public services, as well as those psychologically traumatized. And had these men and women of the VA, PHS, and DoD not come to the aid of the victims of these unprecedented national disasters, the toll of human suffering and bereavement would have been far worse.
Deontologically, each of these government employees did their duty; many volunteered, and even those who were ordered to assist did so with a compassion and dedication that went far beyond doing a job. None of the historic drives of humankind to place themselves in harm’s way—power, money, or fame—motivated those who answered the call; only a duty to serve and an intention to help.
Each person who left the security of home and the comfort of friends and family displayed the highest qualities of virtue ethics: altruism, professionalism, empathy, and integrity among other virtues.
In preparing for this column, I read stories of health care practitioners and nonclinical staff who not only reached out, but also reached beyond any expectation, clearly demonstrating outstanding professionalism and humanism.
I end with just one of these inspirational accounts. As Hurricane Irma approached the Florida coast, veteran employee Tim Myers braved the coming storm to get to work. That is far harder and braver than it seems, because Myers, who is a pharmacy technician and delivers medications to inpatients at the James A. Haley VA, is a quadriplegic in a wheelchair. The humility of his laconic description of his supererogatory conduct is equally impressive. “I appreciate that, but it really wasn’t that big of a deal to me,” Myers said. “I mean, I had to get here.”5
1. Vaughn L. Bioethics Principles, Issues, and Cases. 3rd ed. New York, NY: Oxford University Press, 2017.
2. Kuhse H, Singer P, eds. A Companion to Bioethics. 2nd ed. Malden, MA: Wiley-Blackwell, 2012.
3. Garamone J. Officials detail DOD support during unprecedented hurricane season. https://www.defense.gov/News/Article/Article/1360033/officials-detail-dod-support-during-unprecedented-hurricane-season. Published November 1, 2017. Accessed November 18, 2017.
4. Wentzell S. Through hurricanes, VA continues efforts to care for Veterans. https://www.blogs.va.gov/VAntage/41864/through-hurricanes-va-continues-efforts-to-care-for-veterans/. Published October 3, 2017. Accessed November 19, 2017.
5. Drohan E. Dedication in the face of the storm. September 18, 2017. https://www.tampa.va.gov/TAMPA/features/Wheelchair_Through_Irma.asp. Published September 18, 2017. November 19, 2017.

Long-term Pubic Dermatitis Diagnosed as White Piedra
Case Report
A 58-year-old man presented for evaluation of a pruritic rash involving the pubic area of 30 years’ duration. Multiple primary care physicians and dermatologists had evaluated the patient during this period, but he noted a specific diagnosis had not been rendered and multiple treatments had been unsuccessful. The patient described a rash, which was absent at the time of evaluation, as a self-remitting and exacerbating irritation typically induced by sweating and physical activity. The patient also stated that the irritation was associated with a strong, distinct, musty odor that severely interrupted his sex life and decreased his quality of life. Prior treatments included various topical corticosteroids, topical and oral antibiotics, and various homeopathic treatments that were minimally efficacious or nonefficacious. He was unsure if antifungals had previously been prescribed.
The patient’s medical history was notable for pulmonary interstitial fibrosis, anxiety, posttraumatic stress disorder, and mild glucose intolerance. The patient had no pertinent surgical history and no known drug allergies. Current medications included a bronchodilating inhaler, escitalopram, trazodone, buspirone, clonazepam, prazosin, gabapentin, and azithromycin for current upper respiratory tract infection. The patient was a former smoker and a social drinker.
On physical evaluation the pubic area displayed slight patchy erythema without a papular component and was otherwise unremarkable to the unaided eye. Upon palpation of the skin, there were no remarkable findings. Under dermoscopic evaluation, small white-yellow concretions along the hair shaft were noticed. Evaluation with a Wood lamp is shown in Figure 1.
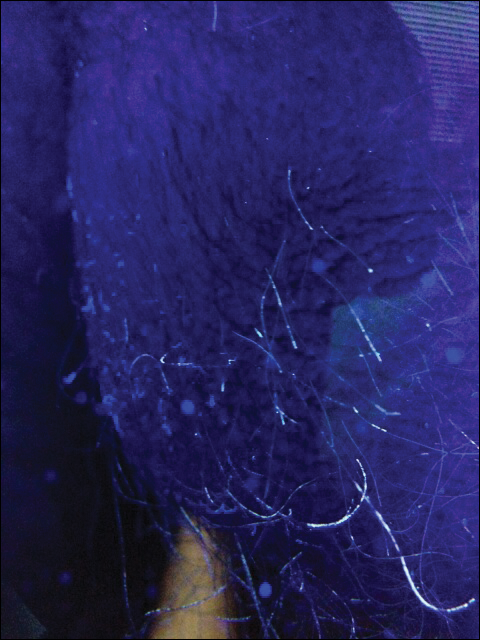
The patient was treated empirically with ketoconazole cream 2% applied to the affected area once daily until follow-up 3 weeks later. The patient also was advised to shave the pubic area to remove potentially infected hairs, as white piedra (WP) was suspected. A diagnosis of WP was confirmed on histologic evaluation of pubic hair samples approximately 1 to 2 weeks later (Figure 2).
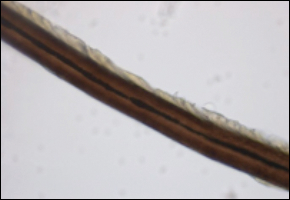
At 3-week follow-up, Wood lamp evaluation did not identify concretions along the pubic hair shafts. The patient was symptom free and extremely pleased. Of note, the patient did not shave the pubic area and was counseled on recurrence.
Comment
Piedra (meaning stone in Spanish) describes a group of fungal infections that present with gritty concretions on the hair shaft.1,2 In 1911, Horta3 classified piedra into 2 subtypes: black piedra, caused by Piedraia hortae, and WP, caused by Trichosporon species. Black piedra occurs more frequently in tropical countries and commonly affects hair shafts on the scalp.4 White piedra most commonly affects the pubic area, with rare cases in scalp and facial hair.1,5-7
Epidemiology
White piedra is seen worldwide, including Europe, South America, India, Southeast Asia, Africa, South America, and southern parts of the United States. The majority of cases occur in tropical and temperate regions.1 White piedra likely is underdiagnosed; for example, in a study of 166 young men with genital concerns in Houston, Texas, Trichosporon was isolated in 40% of cultured scrotal hairs.8
Species Identification
There are several species of WP; special techniques must be used to differentiate them, which is beyond the scope of this case. The known species include Trichosporon asahii, Trichosporon asteroides, Trichosporon cutaneum, Trichosporon inkin, Trichosporon mucoides, and Trichosporon ovoides.1Trichosporon asahii and T mucoides have been known to cause systemic infections in immunocompromised hosts known as trichosporonosis.1,9 As an example of a special technique used for species recognition, Sugita et al10 used sequence analysis of the ribosomal DNA intergenic spacer 1 regions to distinguish T asahii isolates. Identification of species may be warranted in the proper clinical scenario; however, histologic evaluation by an experienced dermatopathologist frequently is sufficient to identify the Trichosporon genus.
Transmission
The 2 most common causative organisms of WP are T inkin and T ovoides. Furthermore, T inkin causes the vast majority of WP in the pubic region.8
Diagnosis and Differential
White piedra is characterized by the presence of adherent tan to white nodules along the hair shafts. The concretions tend to be softer than black piedra and, unlike trichomycosis, normally do not fluoresce.1 They do not encircle the hair shaft as hair casts do and can be readily distinguished from Trichomycosis axillaris, black piedra, pediculosis, and trichorrhexis nodosa on microscopic examination.14 The hair shaft concretions of WP are difficult to visualize with the unaided eye. As a result, it is easily misdiagnosed.15 Upon palpation of the infected hair shafts, a grainy sensation is evident. Dermoscopy improves visualization, and fluorescence was useful in our case. Microscopic evaluation will identify the adherent organism and is readily cultured on Sabouraud agar.16 Although Trichosporon species typically do not fluoresce,1 Wood lamp examination occasionally may reveal the organism, such as in our case. A possible explanation for this finding is the synergistic relationship with Corynebacterium,17 some producing fluorescent chemicals. Growth of Trichosporon species may be enhanced by or even dependent on Corynebacterium; therefore, WP is likely a coinfection of fungus and bacteria.17,18 Studies also name a novel species of Brevibacterium in relationship with genital WP.19 This species was described as producing a foul odor, as in our patient.
Treatment
The American Academy of Dermatology’s Guidelines Committee recommends complete removal of the infected hairs.1 The recommendation traditionally is hair removal in conjunction with topical or oral medications,1 such as topical imidazoles, ciclopirox olamine, selenium sulfide 2%, chlorhexidine solution, zinc pyrithione, amphotericin B lotion, and oral itraconazole. Recurrence rates are high and spontaneous remission sometimes occurs.9,20 Triazole antifungals currently are preferred for treatment of Trichosporon infections.5 Patients should be counseled to dispose of undergarments, as the organism has been recovered from cotton fibers and are a source of reinfection.1,21
Conclusion
White piedra, though relatively uncommon, is likely underdiagnosed in the United States and should be suspected in any patient presenting with irritation and a foul odor in the genital area or multiple failed therapies for a nonspecific genital dermatitis. This clinical scenario warrants dermoscopic and Wood lamp examination of the affected skin and hair shafts in addition to microscopic examination of pubic hair shafts by a dermatopathologist. Fluorescence under Wood lamp may aid in diagnosis, and conflicting findings may be attributed to its synergistic relationship with Corynebacterium and Brevibacterium coinfection. Proper treatment includes shaving of the affected hair, oral or topical antifungal treatment, and disposal of affected clothing.
- Kiken DA, Sekaran A, Antaya RJ, et al. White piedra in children [published online September 18, 2006]. J Am Acad Dermatol. 2006;55:956-961.
- Walzam M, Leeming JG. White piedra and Trichosporon beigelii: the incidence in patients attending a clinic in genitourinary medicine. Genitourin Med. 1989;16:331-334.
- Horta P. Sobre una nova forma de piedra. Mem Inst Oswaldo Cruz. 1911;3:86-107.
- Fischman O. Black piedra in Brazil: a contribution to its study in Manaus (State of Amazonas). Mycopathol Mycol Appl. 1965;25:201-204.
- Benson PM, Lapins NA, Odom RB. White piedra. Arch Dermatol. 1983;119:602-604.
- Fischman O, Pires de Camargo Z, Meireles MCA. Genital white piedra: an emerging fungal disease? Fifth International Conference on Mycoses. PAHO Sci Publ. 1989;396:70-76.
- Tambe SA, Dhurat SR, Kumar CA, et al. Two cases of scalp piedra caused by Trichosporon ovoides. Indian J Dermatol Venereol Leprol. 2009;75:293-295.
- Kalter DC, Tschen JA, Cernoch PL, et al. Genital white piedra: epidemiology, microbiology, and therapy. J Am Acad Dermatol. 1986;14:982-993.
- James WD, Berger TG, Elston DM. Andrews’ Diseases of the Skin: Clinical Dermatology. 11th ed. United Kingdom: Saunders Elsevier; 2011.
- Sugita T, Nakajima M, Ikeda R, et al. Sequence analysis of the ribosomal DNA intergenic spacer 1 regions of Trichosporon species. J Clin Microbiol. 2002;40:1826-1830.
- Kaplan W. Piedra in lower animals: a case report of white piedra in a monkey and a review of the literature. J Am Vet Med Assoc. 1959;134:113-117.
- Carneiro JA, Assis FA, Filho JT. Piedra branca genital. An Bras Dermatol. 1971;46:265-269.
- Avram A, Buot G, Binet A, et al. Étude clinique et mycologique concernant 11 cas de trichosporie noueuse (piedra blanche) génito-pubienne. Ann Dermatol Venereol. 1987;114:819-827.
- So
bera JO, Elewski BE. Fungal diseases. In: Bolognia JL, Jorizzo JL, Rapini RP. Dermatology. 2nd ed. New York, NY: Mosby; 2003:1135-1138. - Gold I, Sommer B, Urson S, et al. White piedra: a frequently misdiagnosed infection of hair. Int J Dermatol. 1984;23:621-623.
- Smith JD, Murtishaw WA, McBride ME. White piedra (Trichosporosis). Arch Dermatol. 1973;107:439-442.
- Youker SR, Andreozzi RJ, Appelbaum PC, et al. White piedra: further evidence of a synergistic infection. J Am Acad Dermatol. 2003;49:746-749.
- Ellner KM, McBride ME, Kalter DC, et al. White piedra: evidence for a synergistic infection. Br J Dermatol. 1990;123:355-363.
- McBride ME, Ellner KM, Black HS, et al. A new Brevibacterium sp. isolated from infected genital hair of patients with white piedra. J Med Microbiol. 1993;39:255-261.
- Drake LA, Dinehart SM, Farmer ER, et al. Guidelines of care for superficial mycotic infections of the skin: piedra. J Am Acad Dermatol. 1996;34:122-124.
- de Almeida HL Jr, Rivitti EA, Jaeger RG. White piedra: ultrastructure and a new microecological aspect. Mycoses. 1990;33:491-497.
Case Report
A 58-year-old man presented for evaluation of a pruritic rash involving the pubic area of 30 years’ duration. Multiple primary care physicians and dermatologists had evaluated the patient during this period, but he noted a specific diagnosis had not been rendered and multiple treatments had been unsuccessful. The patient described a rash, which was absent at the time of evaluation, as a self-remitting and exacerbating irritation typically induced by sweating and physical activity. The patient also stated that the irritation was associated with a strong, distinct, musty odor that severely interrupted his sex life and decreased his quality of life. Prior treatments included various topical corticosteroids, topical and oral antibiotics, and various homeopathic treatments that were minimally efficacious or nonefficacious. He was unsure if antifungals had previously been prescribed.
The patient’s medical history was notable for pulmonary interstitial fibrosis, anxiety, posttraumatic stress disorder, and mild glucose intolerance. The patient had no pertinent surgical history and no known drug allergies. Current medications included a bronchodilating inhaler, escitalopram, trazodone, buspirone, clonazepam, prazosin, gabapentin, and azithromycin for current upper respiratory tract infection. The patient was a former smoker and a social drinker.
On physical evaluation the pubic area displayed slight patchy erythema without a papular component and was otherwise unremarkable to the unaided eye. Upon palpation of the skin, there were no remarkable findings. Under dermoscopic evaluation, small white-yellow concretions along the hair shaft were noticed. Evaluation with a Wood lamp is shown in Figure 1.
The patient was treated empirically with ketoconazole cream 2% applied to the affected area once daily until follow-up 3 weeks later. The patient also was advised to shave the pubic area to remove potentially infected hairs, as white piedra (WP) was suspected. A diagnosis of WP was confirmed on histologic evaluation of pubic hair samples approximately 1 to 2 weeks later (Figure 2).
At 3-week follow-up, Wood lamp evaluation did not identify concretions along the pubic hair shafts. The patient was symptom free and extremely pleased. Of note, the patient did not shave the pubic area and was counseled on recurrence.
Comment
Piedra (meaning stone in Spanish) describes a group of fungal infections that present with gritty concretions on the hair shaft.1,2 In 1911, Horta3 classified piedra into 2 subtypes: black piedra, caused by Piedraia hortae, and WP, caused by Trichosporon species. Black piedra occurs more frequently in tropical countries and commonly affects hair shafts on the scalp.4 White piedra most commonly affects the pubic area, with rare cases in scalp and facial hair.1,5-7
Epidemiology
White piedra is seen worldwide, including Europe, South America, India, Southeast Asia, Africa, South America, and southern parts of the United States. The majority of cases occur in tropical and temperate regions.1 White piedra likely is underdiagnosed; for example, in a study of 166 young men with genital concerns in Houston, Texas, Trichosporon was isolated in 40% of cultured scrotal hairs.8
Species Identification
There are several species of WP; special techniques must be used to differentiate them, which is beyond the scope of this case. The known species include Trichosporon asahii, Trichosporon asteroides, Trichosporon cutaneum, Trichosporon inkin, Trichosporon mucoides, and Trichosporon ovoides.1Trichosporon asahii and T mucoides have been known to cause systemic infections in immunocompromised hosts known as trichosporonosis.1,9 As an example of a special technique used for species recognition, Sugita et al10 used sequence analysis of the ribosomal DNA intergenic spacer 1 regions to distinguish T asahii isolates. Identification of species may be warranted in the proper clinical scenario; however, histologic evaluation by an experienced dermatopathologist frequently is sufficient to identify the Trichosporon genus.
Transmission
The 2 most common causative organisms of WP are T inkin and T ovoides. Furthermore, T inkin causes the vast majority of WP in the pubic region.8
Diagnosis and Differential
White piedra is characterized by the presence of adherent tan to white nodules along the hair shafts. The concretions tend to be softer than black piedra and, unlike trichomycosis, normally do not fluoresce.1 They do not encircle the hair shaft as hair casts do and can be readily distinguished from Trichomycosis axillaris, black piedra, pediculosis, and trichorrhexis nodosa on microscopic examination.14 The hair shaft concretions of WP are difficult to visualize with the unaided eye. As a result, it is easily misdiagnosed.15 Upon palpation of the infected hair shafts, a grainy sensation is evident. Dermoscopy improves visualization, and fluorescence was useful in our case. Microscopic evaluation will identify the adherent organism and is readily cultured on Sabouraud agar.16 Although Trichosporon species typically do not fluoresce,1 Wood lamp examination occasionally may reveal the organism, such as in our case. A possible explanation for this finding is the synergistic relationship with Corynebacterium,17 some producing fluorescent chemicals. Growth of Trichosporon species may be enhanced by or even dependent on Corynebacterium; therefore, WP is likely a coinfection of fungus and bacteria.17,18 Studies also name a novel species of Brevibacterium in relationship with genital WP.19 This species was described as producing a foul odor, as in our patient.
Treatment
The American Academy of Dermatology’s Guidelines Committee recommends complete removal of the infected hairs.1 The recommendation traditionally is hair removal in conjunction with topical or oral medications,1 such as topical imidazoles, ciclopirox olamine, selenium sulfide 2%, chlorhexidine solution, zinc pyrithione, amphotericin B lotion, and oral itraconazole. Recurrence rates are high and spontaneous remission sometimes occurs.9,20 Triazole antifungals currently are preferred for treatment of Trichosporon infections.5 Patients should be counseled to dispose of undergarments, as the organism has been recovered from cotton fibers and are a source of reinfection.1,21
Conclusion
White piedra, though relatively uncommon, is likely underdiagnosed in the United States and should be suspected in any patient presenting with irritation and a foul odor in the genital area or multiple failed therapies for a nonspecific genital dermatitis. This clinical scenario warrants dermoscopic and Wood lamp examination of the affected skin and hair shafts in addition to microscopic examination of pubic hair shafts by a dermatopathologist. Fluorescence under Wood lamp may aid in diagnosis, and conflicting findings may be attributed to its synergistic relationship with Corynebacterium and Brevibacterium coinfection. Proper treatment includes shaving of the affected hair, oral or topical antifungal treatment, and disposal of affected clothing.
- Kiken DA, Sekaran A, Antaya RJ, et al. White piedra in children [published online September 18, 2006]. J Am Acad Dermatol. 2006;55:956-961.
- Walzam M, Leeming JG. White piedra and Trichosporon beigelii: the incidence in patients attending a clinic in genitourinary medicine. Genitourin Med. 1989;16:331-334.
- Horta P. Sobre una nova forma de piedra. Mem Inst Oswaldo Cruz. 1911;3:86-107.
- Fischman O. Black piedra in Brazil: a contribution to its study in Manaus (State of Amazonas). Mycopathol Mycol Appl. 1965;25:201-204.
- Benson PM, Lapins NA, Odom RB. White piedra. Arch Dermatol. 1983;119:602-604.
- Fischman O, Pires de Camargo Z, Meireles MCA. Genital white piedra: an emerging fungal disease? Fifth International Conference on Mycoses. PAHO Sci Publ. 1989;396:70-76.
- Tambe SA, Dhurat SR, Kumar CA, et al. Two cases of scalp piedra caused by Trichosporon ovoides. Indian J Dermatol Venereol Leprol. 2009;75:293-295.
- Kalter DC, Tschen JA, Cernoch PL, et al. Genital white piedra: epidemiology, microbiology, and therapy. J Am Acad Dermatol. 1986;14:982-993.
- James WD, Berger TG, Elston DM. Andrews’ Diseases of the Skin: Clinical Dermatology. 11th ed. United Kingdom: Saunders Elsevier; 2011.
- Sugita T, Nakajima M, Ikeda R, et al. Sequence analysis of the ribosomal DNA intergenic spacer 1 regions of Trichosporon species. J Clin Microbiol. 2002;40:1826-1830.
- Kaplan W. Piedra in lower animals: a case report of white piedra in a monkey and a review of the literature. J Am Vet Med Assoc. 1959;134:113-117.
- Carneiro JA, Assis FA, Filho JT. Piedra branca genital. An Bras Dermatol. 1971;46:265-269.
- Avram A, Buot G, Binet A, et al. Étude clinique et mycologique concernant 11 cas de trichosporie noueuse (piedra blanche) génito-pubienne. Ann Dermatol Venereol. 1987;114:819-827.
- So
bera JO, Elewski BE. Fungal diseases. In: Bolognia JL, Jorizzo JL, Rapini RP. Dermatology. 2nd ed. New York, NY: Mosby; 2003:1135-1138. - Gold I, Sommer B, Urson S, et al. White piedra: a frequently misdiagnosed infection of hair. Int J Dermatol. 1984;23:621-623.
- Smith JD, Murtishaw WA, McBride ME. White piedra (Trichosporosis). Arch Dermatol. 1973;107:439-442.
- Youker SR, Andreozzi RJ, Appelbaum PC, et al. White piedra: further evidence of a synergistic infection. J Am Acad Dermatol. 2003;49:746-749.
- Ellner KM, McBride ME, Kalter DC, et al. White piedra: evidence for a synergistic infection. Br J Dermatol. 1990;123:355-363.
- McBride ME, Ellner KM, Black HS, et al. A new Brevibacterium sp. isolated from infected genital hair of patients with white piedra. J Med Microbiol. 1993;39:255-261.
- Drake LA, Dinehart SM, Farmer ER, et al. Guidelines of care for superficial mycotic infections of the skin: piedra. J Am Acad Dermatol. 1996;34:122-124.
- de Almeida HL Jr, Rivitti EA, Jaeger RG. White piedra: ultrastructure and a new microecological aspect. Mycoses. 1990;33:491-497.
- Although relatively uncommon, white piedra should be suspected in any patient presenting with irritation and foul odor in the genital area or multiple failed therapies for a nonspecific genital dermatitis.
- Wood lamp and dermoscopy should be used to evaluate for parasitic infections of the pubic hair shafts when nonspecific dermatitis presents in this area.
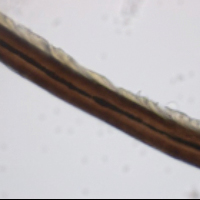
Pediatric Nevoid Basal Cell Carcinoma Syndrome
In 1960, Gorlin and Goltz1 first described nevoid basal cell carcinoma syndrome (NBCCS) as a distinct clinical entity with multiple basal cell carcinomas (BCCs), jaw cysts, and bifid ribs. This rare autosomal-dominant genodermatosis has a minimal prevalence of 1 case per 57,000 individuals2 and no sexual predilection.3 Nevoid basal cell carcinoma syndrome is caused by a mutation in the human homolog of a Drosophila gene, patched 1 (PTCH1), which is located on chromosome 9q22.3.4,5 The major clinical diagnostic criteria includes multiple BCCs, odontogenic keratocysts, palmar or plantar pits, ectopic calcification of the falx cerebri, and a family history of NBCCS.6 Basal cell carcinoma formation is affected by both skin pigmentation and sun exposure; 80% of white patients with NBCCS will develop at least 1 BCC compared to only 40% of black patients with NBCCS.7 Goldstein et al8 postulated that this disparity is associated with increased skin pigmentation providing UV radiation protection, thus decreasing the tumor burden. We report a case of an 11-year-old black boy with NBCCS to highlight the treatment considerations in pediatric cases of NBCCS.
Case Report
An 11-year-old boy with Fitzpatrick skin type V presented with a history of multiple facial lesions after undergoing excision of large keratocysts from the right maxilla, left maxilla, and right mandible. Physical examination revealed multiple light to dark brown facial papules (Figure 1), palmar and plantar pitting (Figure 2), and frontal bossing.
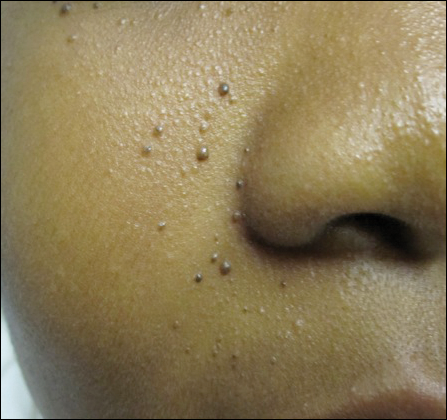
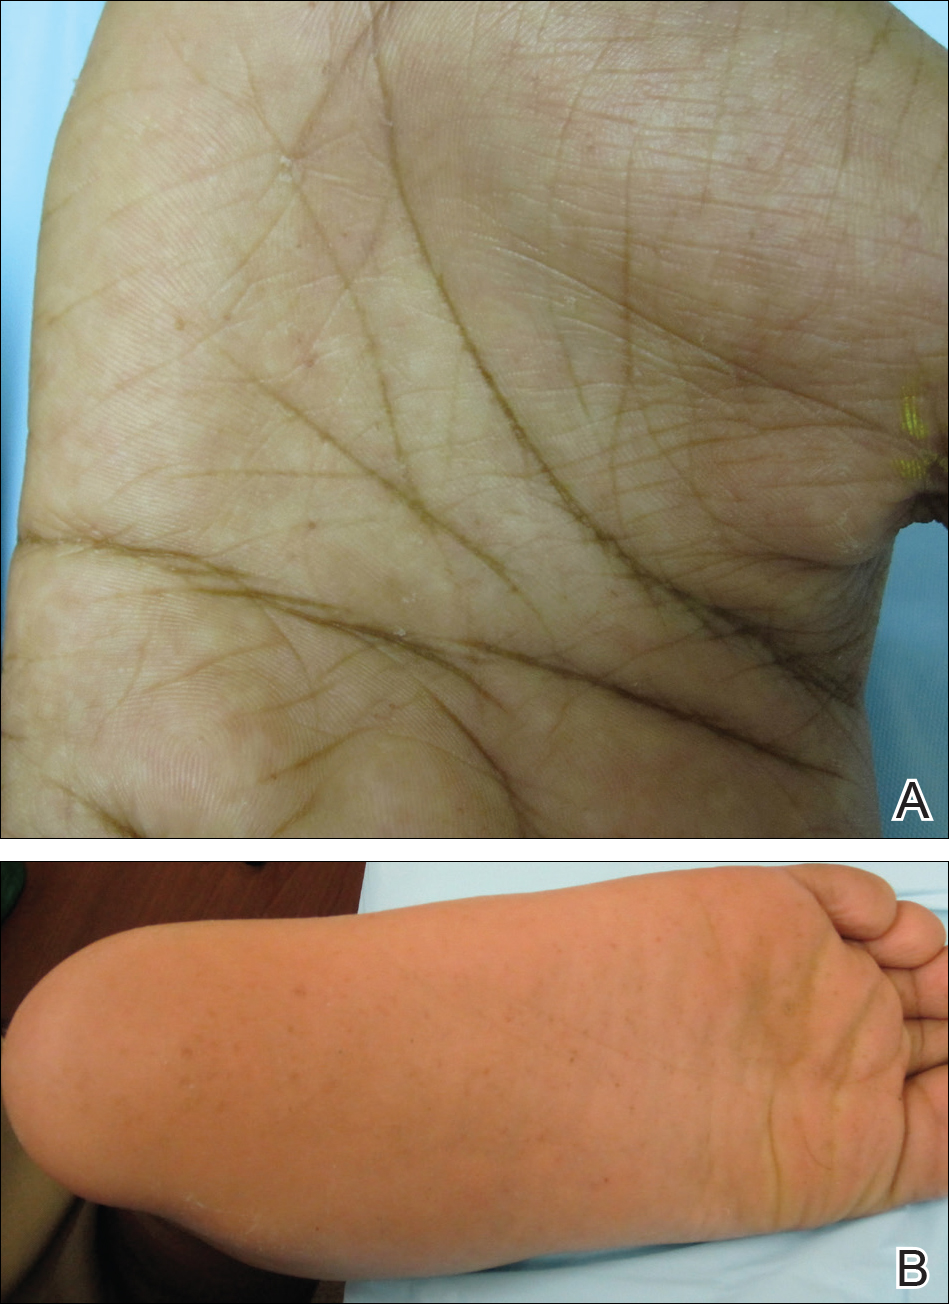
He was previously diagnosed with autism and his surgical history was notable only for excision of the keratocysts. The patient was not taking any medications and did not have any drug allergies. There was no maternal family history of skin cancer or related syndromes; his paternal family history was unknown. A shave biopsy was performed on a facial papule from the right nasolabial fold. Histopathologic evaluation revealed findings consistent with a pigmented nodular BCC (Figure 3). The patient was subsequently sent for magnetic resonance imaging of the brain, which demonstrated calcifications along the tentorium. Genetic consultation confirmed a heterozygous mutation of the PTCH1 gene.
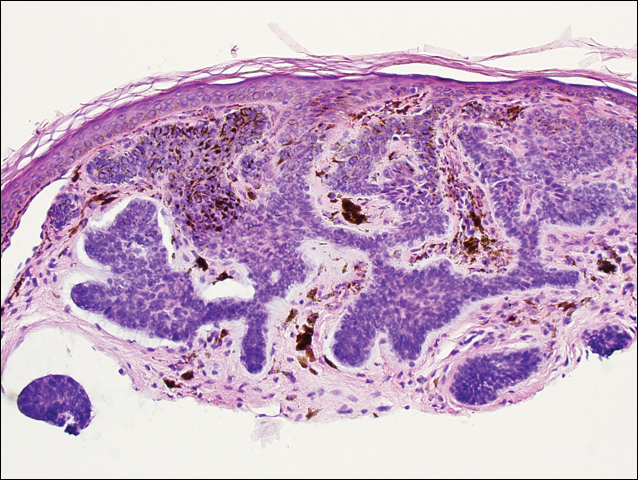
Over the next 12 months, the patient had multiple biopsy-proven pigmented BCCs. Initial management of these carcinomas located on cosmetically sensitive areas, including the upper eyelid and penis, were excised by a pediatric plastic surgeon. A truncal carcinoma was treated with electrodesiccation and curettage, which resulted in keloid formation. Early suspicious lesions were treated with imiquimod cream 5% 5 times weekly in combination with the prophylactic use of tretinoin cream 0.1%. Despite this treatment regimen, the patient continued to demonstrate multiple small clinical pigmented BCCs along the malar surfaces of the cheeks and dorsum of the nose. The patient’s mother deferred chemoprevention with an oral retinoid due to the extensive side-effect profile and long-term necessity of administration.
Management also encompassed BCC surveillance every 4 months; annual digital panorex of the jaw; routine dental screening; routine developmental screening; annual follow-up with a geneticist to ensure multidisciplinary care; and annual vision, hearing, and speech-screening examinations. Strict sun-protective measures were encouraged, including wearing a hat during physical education class.
Comment
Classification and Clinical Presentation
Nevoid basal cell carcinoma syndrome is a multisystem disorder that requires close monitoring under multidisciplinary care. Evans et al6 defined the diagnostic criteria of NBCCS to require the presence of 2 major criteria or 1 major and 2 minor criteria. The major criteria include multiple BCCs, an odontogenic keratocyst or polyostotic bone cyst, palmar or plantar pits, ectopic calcification of the falx cerebri, and family history of NBCCS. The minor criteria are defined as congenital skeletal anomalies; macrocephaly with frontal bossing; cardiac or ovarian fibromas; medulloblastoma; lymphomesenteric cysts; and congenital malformations such as cleft lip or palate, polydactyly, or eye anomalies.6 The mean age of initial BCC diagnosis is 21 years, with proliferation of cancers between puberty and 35 years of age.7,9 Our case is unique due to the patient’s young age at the time of diagnosis as well as his presentation with multiple BCCs with a darker skin type. Kimonis et al7 reported that approximately 20% of black patients develop their first BCC by the age of 21 years and 40% by 35 years. The presence of multiple BCCs is complicated by the limited treatment options in a pediatric patient. The patient’s inability to withstand multiple procedures contributed to our clinical decision to have multiple lesions removed under general anesthesia by a pediatric plastic surgeon.
Due to the patient’s young age of onset, we placed a great emphasis on close surveillance and management. A management protocol for pediatric patients with NBCCS was described by Bree and Shah; BCNS Colloquium Group10 (eTable). We closely followed this protocol for surveillance; however, we scheduled dermatologic examinations every 4 months due to his extensive history of BCCs.
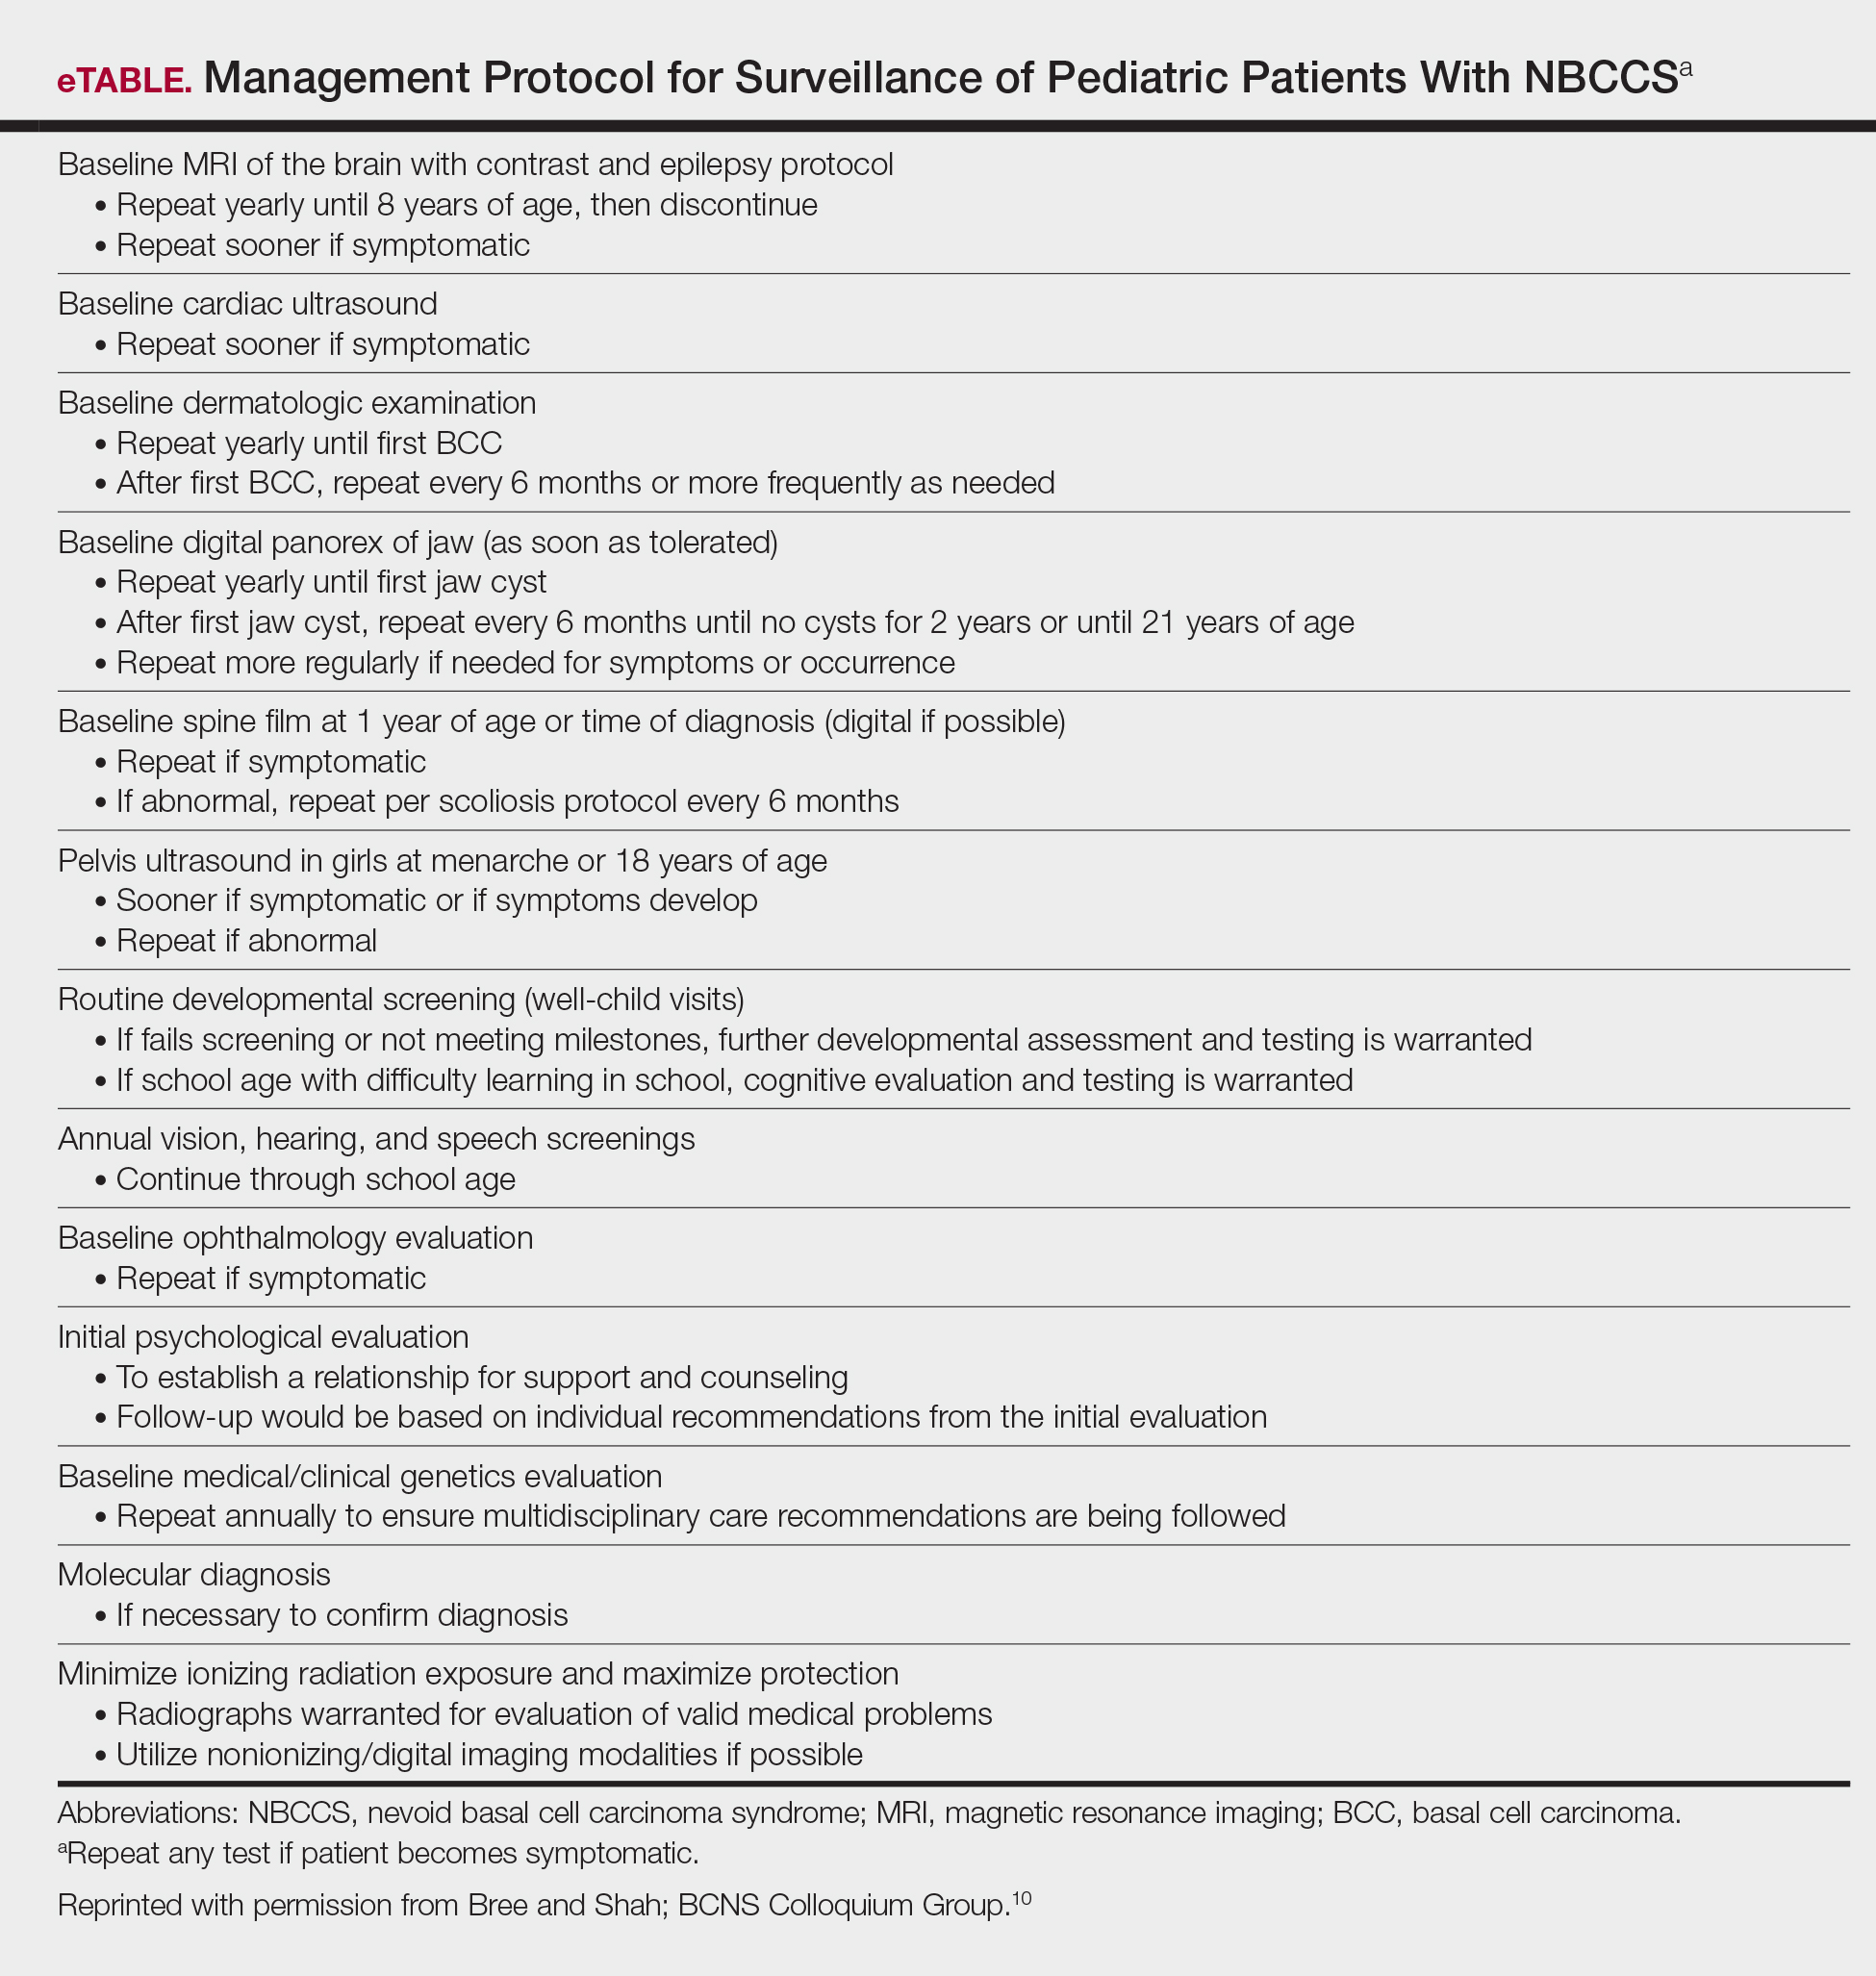
Management
Our case presents a challenging therapeutic and management dilemma. The management of NBCCS utilizes a multitude of treatment modalities, but many of them posed cosmetic challenges in our patient such as postinflammatory hypopigmentation and the propensity for keloid formation. Although surgical excision or Mohs micrographic surgery is the standard of treatment of nodular BCCs, we were limited due to the patient’s inability to tolerate multiple surgical procedures without the use of general anesthesia.
Case reports have discussed the use of CO2 laser resurfacing for management of multiple facial BCCs in patients with NBCCS. Doctoroff et al11 treated a patient with 45 facial BCCs with full-face CO2 laser resurfacing, and in a 10-month follow-up period the patient developed 6 new BCCs on the face. Nouri et al12 described 3 cases of multiple BCCs on the face, trunk, and extremities treated with ultrapulse CO2 laser with postoperative Mohs sections verifying complete histologic clearance of tumors. All 3 patients had Fitzpatrick skin type IV; their ages were 2, 16, and 35 years. Local anesthesia was used in the 2-year-old patient and intravenous sedation in the 16-year-old patient.12 Although CO2 laser therapy may be a practical treatment option, it posed too many cosmetic concerns in our patient.
Photodynamic therapy (PDT) is an emerging treatment option for NBCCS patients. Itkin and Gilchrest13 treated 2 NBCCS patients with δ-aminolevulinic acid for 1 to 5 hours prior to treatment with blue light therapy. Complete clearance was documented in 89% (8/9) of superficial BCCs and 31% (5/16) of nodular BCCs on the face, indicating that blue light treatment may reduce the cutaneous tumor burden.13 Oseroff et al14 reported similar success in treating 3 children with NBCCS with 20% δ-aminolevulinic acid for 24 hours under occlusion followed by red light treatment. After 1 to 3 treatments, the children had 85% to 98% total clearance, demonstrating it as a viable treatment option in young patients that yields excellent cosmetic results and is well tolerated.14 Photodynamic therapy is reported to have a low risk of carcinogenicity15; however, there has been 1 reported case of melanoma developing at the site of multiple PDT treatments.16 Thus, the risk of carcinogenicity is increasingly bothersome in NBCCS patients due to their sensitivity to exposure. The limited number of studies using topical PDT on pediatric patients, the lack of treatment protocols for pediatric patients, and the need to use general anesthesia for pediatric patients all posed limitations to the use of PDT in our case.
Imiquimod cream 5% was shown in randomized, vehicle-controlled studies to be a safe and effective treatment of superficial BCCs when used 5 days weekly for 6 weeks.17 These studies excluded patients with NBCCS; however, other studies have been completed in patients with NBCCS. Kagy and Amonette18 successfully treated 3 nonfacial BCCs in a patient with NBCCS with imiquimod cream 5% daily for 18 weeks, with complete histologic resolution of the tumors. Micali et al19 also treated 4 patients with NBCCS using imiquimod cream 5% 3 to 5 times weekly for 8 to 14 weeks. Thirteen of 17 BCCs resolved, as confirmed with histologic evaluation.19 One case report revealed a child with NBCCS who was successfully managed with topical fluorouracil and topical tretinoin for more than 10 years.20 Our patient used imiquimod cream 5% 5 times weekly, which inhibited the growth of existing lesions but did not clear them entirely, as they were nodular in nature.
Chemoprevention with oral retinoids breaches a controversial treatment topic. In 1989, a case study of an NBCCS patient treated with surgical excision and oral etretinate for 12 months documented reduction of large tumors.21 A multicenter clinical trial reported that low-dose isotretinoin (10 mg daily) is ineffective in preventing the occurrence of new BCC formation in patients with a history of 2 or more sporadic BCCs.22 Chemoprevention with oral retinoids is well known for being effective for squamous cell carcinomas and actinic keratosis; however, the treatment is less effective for BCCs.22 Most importantly, the extensive side-effect profile and toxicity associated with long-term administration of oral retinoids prohibits many practitioners from routinely using them in pediatric NBCCS patients.
Nevoid basal cell carcinoma syndrome patients are exquisitely sensitive to ionizing radiation and the effects of UV exposure. Therefore, it is essential to emphasize the importance of sun-protective measures such as sun avoidance, broad-spectrum sunscreen use, and sun-protective clothing.
Conclusion
Nevoid basal cell carcinoma syndrome is a multisystem disorder with a notable predisposition for skin cancer. Our case demonstrates the treatment considerations in a pediatric patient with Fitzpatrick skin type V. Pediatric NBCCS patients develop BCCs at a young age and will continue to develop additional lesions throughout life; therefore, skin preservation is an important consideration when choosing the appropriate treatment regimen. Particularly in our patient, utilizing multiple strategic treatment modalities in combination with chemoprevention moving forward will be a continued management challenge. Strict adherence to a surveillance protocol is encouraged to closely monitor the systemic manifestations of the disorder.
- Gorlin RJ, Goltz R. Multiple nevoid basal cell epitheliomata, jaw cysts, bifid rib-a syndrome. N Engl J Med. 1960;262:908-911.
- Evans DGR, Farndon PA, Burnell LD, et al. The incidence of Gorlin syndrome in 173 consecutive cases of medulloblastoma. Br J Cancer. 1991;64:959-961.
- Gorlin RJ. Nevoid basal cell carcinoma (Gorlin) syndrome. Genet Med. 2004;6:530-539.
- Farndon PA, Del Mastro RG, Evans DG, et al. Location of gene for Gorlin Syndrome. Lancet. 1992;339:581-582.
- Bale AE, Yu KP. The hedgehog pathway and basal cell carcinomas. Hum Mol Genet. 2001;10:757-761.
- Evans DGR, Ladusans EJ, Rimmer S, et al. Complications of the naevoid basal cell carcinoma syndrome: results of a population based study. J Med Genet. 1993;30:460-464.
- Kimonis VE, Goldstein AM, Pastakia B, et al. Clinical manifestations in 105 persons with nevoid basal cell carcinoma syndrome. Am J Med Genet. 1997;69:299-308.
- Goldstein AM, Pastakia B, DiGiovanna JJ, et al. Clinical findings in two African-American families with nevoid basal cell carcinoma syndrome. Am J Med Genet. 1994;50:272-281.
- Shanley S, Ratcliffe J, Hockey A, et al. Nevoid basal cell carcinoma syndrome: review of 118 affected individuals. Am J Med Genet. 1994;50:282-290.
- Bree AF, Shah MR; BCNS Colloquium Group. Consensus statement from the first international colloquium on basal cell nevus syndrome (BCNS). Am J Med Genet A. 2011;155:2091-2097.
- Doctoroff A, Oberlender SA, Purcell SM. Full-face carbon dioxide laser resurfacing in the management of a patient with the nevoid basal cell carcinoma syndrome. Dermatol Surg. 2003;29:1236-1240.
- Nouri K, Chang A, Trent JT, et al. Ultrapulse CO2 used for the successful treatment of basal cell carcinomas found in patients with basal cell nevus syndrome. Dermatol Surg. 2002;28:287-290.
- Itkin A, Gilchrest BA. δ-Aminolevulinic acid and blue light photodynamic therapy for treatment of multiple basal cell carcinomas in two patients with nevoid basal cell carcinoma syndrome. Dermatol Surg. 2004;30:1054-1061.
- Oseroff AR, Shieh S, Frawley NP, et al. Treatment of diffuse basal cell carcinomas and basaloid follicular hamartomas in nevoid basal cell carcinoma syndrome by wide-area 5-aminolevulinic acid photodynamic therapy. Arch Dermatol. 2005;141:60-67.
- Morton CA, Brown SB, Collins S, et al. Guidelines for topical photodynamic therapy: report of a workshop of the British Photodermatology Group. Br J Dermatol. 2002;146:552-567.
- Wolf P, Fink-Puches R, Reimann-Weber A, et al. Development of malignant melanoma after repeated topical photodynamic therapy with 5-aminolevulinic acid at the exposed site. Dermatology. 1997;194:53-54.
- Geisse J, Caro I, Lindholm J, et al. Imiquimod 5% cream for the treatment of superficial basal cell carcinoma: results from two phase III, randomized, vehicle-controlled studies. J Am Acad Dermatol. 2004;50:722-733.
- Kagy MK, Amonette R. The use of imiquimod 5% cream for the treatment of superficial basal cell carcinomas in a basal cell nevus syndrome patient. Dermatol Surg. 2000;26:577-579.
- Micali G, Lacarrubba F, Nasca MR, et al. The use of imiquimod 5% cream for the treatment of basal cell carcinoma as observed in Gorlin’s syndrome. Clin Exp Dermatol. 2003;28:19-23.
- Strange PR, Lang PG. Long-term management of basal cell nevus syndrome with topical tretinoin and 5-fluorouracil. J Am Acad Dermatol. 1992;27:842-845.
- Sanchez-Conejo-Mir J, Camacho F. Nevoid basal cell carcinoma syndrome: combined etretinate and surgical treatment. J Dermatol Surg Oncol. 1989;15:868-871.
- Tangrea JA, Edwards BK, Taylor PR, et al. Long-term therapy with low-dose isotretinoin for prevention of basal cell carcinoma: a multicenter clinical trial. Isotretinoin-Basal Cell Carcinoma Study Group. J Natl Cancer Inst. 1992;84:328-332.
In 1960, Gorlin and Goltz1 first described nevoid basal cell carcinoma syndrome (NBCCS) as a distinct clinical entity with multiple basal cell carcinomas (BCCs), jaw cysts, and bifid ribs. This rare autosomal-dominant genodermatosis has a minimal prevalence of 1 case per 57,000 individuals2 and no sexual predilection.3 Nevoid basal cell carcinoma syndrome is caused by a mutation in the human homolog of a Drosophila gene, patched 1 (PTCH1), which is located on chromosome 9q22.3.4,5 The major clinical diagnostic criteria includes multiple BCCs, odontogenic keratocysts, palmar or plantar pits, ectopic calcification of the falx cerebri, and a family history of NBCCS.6 Basal cell carcinoma formation is affected by both skin pigmentation and sun exposure; 80% of white patients with NBCCS will develop at least 1 BCC compared to only 40% of black patients with NBCCS.7 Goldstein et al8 postulated that this disparity is associated with increased skin pigmentation providing UV radiation protection, thus decreasing the tumor burden. We report a case of an 11-year-old black boy with NBCCS to highlight the treatment considerations in pediatric cases of NBCCS.
Case Report
An 11-year-old boy with Fitzpatrick skin type V presented with a history of multiple facial lesions after undergoing excision of large keratocysts from the right maxilla, left maxilla, and right mandible. Physical examination revealed multiple light to dark brown facial papules (Figure 1), palmar and plantar pitting (Figure 2), and frontal bossing.
He was previously diagnosed with autism and his surgical history was notable only for excision of the keratocysts. The patient was not taking any medications and did not have any drug allergies. There was no maternal family history of skin cancer or related syndromes; his paternal family history was unknown. A shave biopsy was performed on a facial papule from the right nasolabial fold. Histopathologic evaluation revealed findings consistent with a pigmented nodular BCC (Figure 3). The patient was subsequently sent for magnetic resonance imaging of the brain, which demonstrated calcifications along the tentorium. Genetic consultation confirmed a heterozygous mutation of the PTCH1 gene.
Over the next 12 months, the patient had multiple biopsy-proven pigmented BCCs. Initial management of these carcinomas located on cosmetically sensitive areas, including the upper eyelid and penis, were excised by a pediatric plastic surgeon. A truncal carcinoma was treated with electrodesiccation and curettage, which resulted in keloid formation. Early suspicious lesions were treated with imiquimod cream 5% 5 times weekly in combination with the prophylactic use of tretinoin cream 0.1%. Despite this treatment regimen, the patient continued to demonstrate multiple small clinical pigmented BCCs along the malar surfaces of the cheeks and dorsum of the nose. The patient’s mother deferred chemoprevention with an oral retinoid due to the extensive side-effect profile and long-term necessity of administration.
Management also encompassed BCC surveillance every 4 months; annual digital panorex of the jaw; routine dental screening; routine developmental screening; annual follow-up with a geneticist to ensure multidisciplinary care; and annual vision, hearing, and speech-screening examinations. Strict sun-protective measures were encouraged, including wearing a hat during physical education class.
Comment
Classification and Clinical Presentation
Nevoid basal cell carcinoma syndrome is a multisystem disorder that requires close monitoring under multidisciplinary care. Evans et al6 defined the diagnostic criteria of NBCCS to require the presence of 2 major criteria or 1 major and 2 minor criteria. The major criteria include multiple BCCs, an odontogenic keratocyst or polyostotic bone cyst, palmar or plantar pits, ectopic calcification of the falx cerebri, and family history of NBCCS. The minor criteria are defined as congenital skeletal anomalies; macrocephaly with frontal bossing; cardiac or ovarian fibromas; medulloblastoma; lymphomesenteric cysts; and congenital malformations such as cleft lip or palate, polydactyly, or eye anomalies.6 The mean age of initial BCC diagnosis is 21 years, with proliferation of cancers between puberty and 35 years of age.7,9 Our case is unique due to the patient’s young age at the time of diagnosis as well as his presentation with multiple BCCs with a darker skin type. Kimonis et al7 reported that approximately 20% of black patients develop their first BCC by the age of 21 years and 40% by 35 years. The presence of multiple BCCs is complicated by the limited treatment options in a pediatric patient. The patient’s inability to withstand multiple procedures contributed to our clinical decision to have multiple lesions removed under general anesthesia by a pediatric plastic surgeon.
Due to the patient’s young age of onset, we placed a great emphasis on close surveillance and management. A management protocol for pediatric patients with NBCCS was described by Bree and Shah; BCNS Colloquium Group10 (eTable). We closely followed this protocol for surveillance; however, we scheduled dermatologic examinations every 4 months due to his extensive history of BCCs.
Management
Our case presents a challenging therapeutic and management dilemma. The management of NBCCS utilizes a multitude of treatment modalities, but many of them posed cosmetic challenges in our patient such as postinflammatory hypopigmentation and the propensity for keloid formation. Although surgical excision or Mohs micrographic surgery is the standard of treatment of nodular BCCs, we were limited due to the patient’s inability to tolerate multiple surgical procedures without the use of general anesthesia.
Case reports have discussed the use of CO2 laser resurfacing for management of multiple facial BCCs in patients with NBCCS. Doctoroff et al11 treated a patient with 45 facial BCCs with full-face CO2 laser resurfacing, and in a 10-month follow-up period the patient developed 6 new BCCs on the face. Nouri et al12 described 3 cases of multiple BCCs on the face, trunk, and extremities treated with ultrapulse CO2 laser with postoperative Mohs sections verifying complete histologic clearance of tumors. All 3 patients had Fitzpatrick skin type IV; their ages were 2, 16, and 35 years. Local anesthesia was used in the 2-year-old patient and intravenous sedation in the 16-year-old patient.12 Although CO2 laser therapy may be a practical treatment option, it posed too many cosmetic concerns in our patient.
Photodynamic therapy (PDT) is an emerging treatment option for NBCCS patients. Itkin and Gilchrest13 treated 2 NBCCS patients with δ-aminolevulinic acid for 1 to 5 hours prior to treatment with blue light therapy. Complete clearance was documented in 89% (8/9) of superficial BCCs and 31% (5/16) of nodular BCCs on the face, indicating that blue light treatment may reduce the cutaneous tumor burden.13 Oseroff et al14 reported similar success in treating 3 children with NBCCS with 20% δ-aminolevulinic acid for 24 hours under occlusion followed by red light treatment. After 1 to 3 treatments, the children had 85% to 98% total clearance, demonstrating it as a viable treatment option in young patients that yields excellent cosmetic results and is well tolerated.14 Photodynamic therapy is reported to have a low risk of carcinogenicity15; however, there has been 1 reported case of melanoma developing at the site of multiple PDT treatments.16 Thus, the risk of carcinogenicity is increasingly bothersome in NBCCS patients due to their sensitivity to exposure. The limited number of studies using topical PDT on pediatric patients, the lack of treatment protocols for pediatric patients, and the need to use general anesthesia for pediatric patients all posed limitations to the use of PDT in our case.
Imiquimod cream 5% was shown in randomized, vehicle-controlled studies to be a safe and effective treatment of superficial BCCs when used 5 days weekly for 6 weeks.17 These studies excluded patients with NBCCS; however, other studies have been completed in patients with NBCCS. Kagy and Amonette18 successfully treated 3 nonfacial BCCs in a patient with NBCCS with imiquimod cream 5% daily for 18 weeks, with complete histologic resolution of the tumors. Micali et al19 also treated 4 patients with NBCCS using imiquimod cream 5% 3 to 5 times weekly for 8 to 14 weeks. Thirteen of 17 BCCs resolved, as confirmed with histologic evaluation.19 One case report revealed a child with NBCCS who was successfully managed with topical fluorouracil and topical tretinoin for more than 10 years.20 Our patient used imiquimod cream 5% 5 times weekly, which inhibited the growth of existing lesions but did not clear them entirely, as they were nodular in nature.
Chemoprevention with oral retinoids breaches a controversial treatment topic. In 1989, a case study of an NBCCS patient treated with surgical excision and oral etretinate for 12 months documented reduction of large tumors.21 A multicenter clinical trial reported that low-dose isotretinoin (10 mg daily) is ineffective in preventing the occurrence of new BCC formation in patients with a history of 2 or more sporadic BCCs.22 Chemoprevention with oral retinoids is well known for being effective for squamous cell carcinomas and actinic keratosis; however, the treatment is less effective for BCCs.22 Most importantly, the extensive side-effect profile and toxicity associated with long-term administration of oral retinoids prohibits many practitioners from routinely using them in pediatric NBCCS patients.
Nevoid basal cell carcinoma syndrome patients are exquisitely sensitive to ionizing radiation and the effects of UV exposure. Therefore, it is essential to emphasize the importance of sun-protective measures such as sun avoidance, broad-spectrum sunscreen use, and sun-protective clothing.
Conclusion
Nevoid basal cell carcinoma syndrome is a multisystem disorder with a notable predisposition for skin cancer. Our case demonstrates the treatment considerations in a pediatric patient with Fitzpatrick skin type V. Pediatric NBCCS patients develop BCCs at a young age and will continue to develop additional lesions throughout life; therefore, skin preservation is an important consideration when choosing the appropriate treatment regimen. Particularly in our patient, utilizing multiple strategic treatment modalities in combination with chemoprevention moving forward will be a continued management challenge. Strict adherence to a surveillance protocol is encouraged to closely monitor the systemic manifestations of the disorder.
- Gorlin RJ, Goltz R. Multiple nevoid basal cell epitheliomata, jaw cysts, bifid rib-a syndrome. N Engl J Med. 1960;262:908-911.
- Evans DGR, Farndon PA, Burnell LD, et al. The incidence of Gorlin syndrome in 173 consecutive cases of medulloblastoma. Br J Cancer. 1991;64:959-961.
- Gorlin RJ. Nevoid basal cell carcinoma (Gorlin) syndrome. Genet Med. 2004;6:530-539.
- Farndon PA, Del Mastro RG, Evans DG, et al. Location of gene for Gorlin Syndrome. Lancet. 1992;339:581-582.
- Bale AE, Yu KP. The hedgehog pathway and basal cell carcinomas. Hum Mol Genet. 2001;10:757-761.
- Evans DGR, Ladusans EJ, Rimmer S, et al. Complications of the naevoid basal cell carcinoma syndrome: results of a population based study. J Med Genet. 1993;30:460-464.
- Kimonis VE, Goldstein AM, Pastakia B, et al. Clinical manifestations in 105 persons with nevoid basal cell carcinoma syndrome. Am J Med Genet. 1997;69:299-308.
- Goldstein AM, Pastakia B, DiGiovanna JJ, et al. Clinical findings in two African-American families with nevoid basal cell carcinoma syndrome. Am J Med Genet. 1994;50:272-281.
- Shanley S, Ratcliffe J, Hockey A, et al. Nevoid basal cell carcinoma syndrome: review of 118 affected individuals. Am J Med Genet. 1994;50:282-290.
- Bree AF, Shah MR; BCNS Colloquium Group. Consensus statement from the first international colloquium on basal cell nevus syndrome (BCNS). Am J Med Genet A. 2011;155:2091-2097.
- Doctoroff A, Oberlender SA, Purcell SM. Full-face carbon dioxide laser resurfacing in the management of a patient with the nevoid basal cell carcinoma syndrome. Dermatol Surg. 2003;29:1236-1240.
- Nouri K, Chang A, Trent JT, et al. Ultrapulse CO2 used for the successful treatment of basal cell carcinomas found in patients with basal cell nevus syndrome. Dermatol Surg. 2002;28:287-290.
- Itkin A, Gilchrest BA. δ-Aminolevulinic acid and blue light photodynamic therapy for treatment of multiple basal cell carcinomas in two patients with nevoid basal cell carcinoma syndrome. Dermatol Surg. 2004;30:1054-1061.
- Oseroff AR, Shieh S, Frawley NP, et al. Treatment of diffuse basal cell carcinomas and basaloid follicular hamartomas in nevoid basal cell carcinoma syndrome by wide-area 5-aminolevulinic acid photodynamic therapy. Arch Dermatol. 2005;141:60-67.
- Morton CA, Brown SB, Collins S, et al. Guidelines for topical photodynamic therapy: report of a workshop of the British Photodermatology Group. Br J Dermatol. 2002;146:552-567.
- Wolf P, Fink-Puches R, Reimann-Weber A, et al. Development of malignant melanoma after repeated topical photodynamic therapy with 5-aminolevulinic acid at the exposed site. Dermatology. 1997;194:53-54.
- Geisse J, Caro I, Lindholm J, et al. Imiquimod 5% cream for the treatment of superficial basal cell carcinoma: results from two phase III, randomized, vehicle-controlled studies. J Am Acad Dermatol. 2004;50:722-733.
- Kagy MK, Amonette R. The use of imiquimod 5% cream for the treatment of superficial basal cell carcinomas in a basal cell nevus syndrome patient. Dermatol Surg. 2000;26:577-579.
- Micali G, Lacarrubba F, Nasca MR, et al. The use of imiquimod 5% cream for the treatment of basal cell carcinoma as observed in Gorlin’s syndrome. Clin Exp Dermatol. 2003;28:19-23.
- Strange PR, Lang PG. Long-term management of basal cell nevus syndrome with topical tretinoin and 5-fluorouracil. J Am Acad Dermatol. 1992;27:842-845.
- Sanchez-Conejo-Mir J, Camacho F. Nevoid basal cell carcinoma syndrome: combined etretinate and surgical treatment. J Dermatol Surg Oncol. 1989;15:868-871.
- Tangrea JA, Edwards BK, Taylor PR, et al. Long-term therapy with low-dose isotretinoin for prevention of basal cell carcinoma: a multicenter clinical trial. Isotretinoin-Basal Cell Carcinoma Study Group. J Natl Cancer Inst. 1992;84:328-332.
Practice Points
- Nevoid basal cell carcinoma syndrome (NBCCS) is a multisystem disorder that requires close monitoring under multidisciplinary care.
- The clinical manifestations of NBCCS include multiple basal cell carcinomas, odontogenic keratocysts, palmar or plantar pits, and calcification of the falx cerebri.
E-health app helps weight loss, QOL for African American breast cancer survivors
MONTREAL – African American breast cancer survivors who participated in fitness tracking and an online support program saw small but significant reductions in weight and improvement in quality of life, according to a new study.
Further, patients who reported a low baseline quality of life (QOL) achieved as much or more weight loss as did those whose QOL was initially high, said Jeanne Ferrante, MD, MPH, professor of family medicine and community health at Robert Wood Johnson Medical School, New Brunswick, N.J.
Overall, but not cancer-related, QOL improved during the 6 months of the study as well.
“Low quality of life at baseline was not a barrier to weight loss, and there’s the potential for weight loss to improve quality of life” in this group of cancer survivors, Dr. Ferrante said at the annual meeting of the North American Primary Care Research Group.
Although weight loss is known to improve functional status and QOL, few studies have examined these issues in African American breast cancer survivors, who may have more comorbidities and a greater risk for obesity compared with the general population, said Dr. Ferrante.
Dr. Ferrante and her coinvestigators hypothesized that QOL would be a predictor of weight loss, and that weight loss, in turn, would have a positive impact on QOL. They conducted a secondary data analysis of a trial of participants using a physical activity monitor alone (in this study, a Fitbit), compared with using the wrist-worn activity monitor together with an Internet program, SparkPeople, designed to provide information and support for increased activity and weight loss.
Eligible participants (n = 61) were African American women who had completed treatment for early stage (0-III) breast cancer, were aged 21-75 (mean 62) years, and had a body mass index of at least 25 kg/m2 (mean, 37; range 26-52). They had to be English speaking, and have Internet and smartphone access. Half the number of participants were retired, half were college graduates, and about a third were married.
One-third of the women reported that they had five or more chronic conditions at enrollment. The mean waist circumference at baseline was 45 inches, and the mean weight was 216 pounds. Patients who had bariatric surgery, had recently lost at least 5% of their body weight, or had limitations to exercise participation or other serious medical or psychiatric conditions were excluded.
To assess QOL, the investigators used the Quality of Life in Adult Cancer Survivors (Q-LACS) scale, which measures both generic and cancer-specific quality of life.
The women in the study also reported how many days out of the past 30 days their mental and their physical health was “not good.”
At baseline, the mean QOL was 108, generic quality of life was 70, and cancer-specific quality of life was 39; lower numbers are better on the scale. Patients reported that their mental health had not been good for 9 of the past 30 days, on average, and that their physical health had not been good for a mean of 6 of the past 30 days.
After 6 months (but not at 3 months), the mean improvement for overall QOL on the Q-LACS scale was –7 (P = .054). Generic QOL improved significantly at both 3 and 6 months (P = .051 and P = .017, respectively), but cancer-specific QOL did not change significantly.
The women saw no significant change over the 6 months in the number of “not good” mental and physical health days.
Waist circumference reduction was about a half inch at 3 months (–0.45 inches, not significant), with a drop at 6 months of 0.91 inches from baseline that met criteria for statistical significance. (P = .013).
The study’s limitations included its small sample size and relatively short duration, said Dr. Ferrante; however, the study continued for 12 months and those data are being analyzed now. Some bias may have been introduced by the need for Internet connection and a smartphone as well, she said.
The investigators are now piloting use of a premium version of the SparkPeople app that offers more customization and interaction with participants.
Dr. Ferrante reported no conflicts of interest.
[email protected]
On Twitter @karioakes
AT NAPCRG 2017
Key clinical point:
Major finding: Participants lost a mean 4.79 pounds from baseline (mean 2.14%, P less than .001).
Data source: Subanalysis from study of 61 African American survivors of early stage breast cancer, with BMI of 25 or higher.
Disclosures: Dr. Ferrante reported no conflicts of interest.