User login
Growths and darkened skin

Based on the dark velvety skin on the patient’s neck, the FP diagnosed acanthosis nigricans accompanied by multiple skin tags (acrochordons). The patient told the physician that he wanted to have the skin tags removed and the darkened skin treated. Because both conditions are associated with obesity and diabetes, the FP recommended that the patient increase his weight loss efforts through improved diet and increased exercise.
The FP also explained that treatment options for the skin tags included cryotherapy, snip excisions, and electrosurgery. The patient did not want to wait for the skin tags to fall off after cryotherapy or electrosurgery, so he chose snip excisions for immediate results. The skin tags were pedunculated with narrow stalks, so the snip excisions were performed without anesthesia. Aluminum chloride was applied to stop the bleeding on some of the skin tags. The patient noted some stinging, but tolerated the treatment well.
For the acanthosis nigricans, the FP explained that there are no highly effective treatments. In addition to recommending weight loss, the FP prescribed topical tretinoin cream 0.025% to be applied to the darkened skin before bed (only after the cuts from the skin tag removals had healed). The FP told the patient that the treatment might be only partially beneficial (or might not work at all). Other treatment options for acanthosis nigricans (with limited effectiveness) include keratolytic agents (eg, salicylic acid, ammonium lactate) and topical vitamin D analogs. At follow-up one month later, the patient had not yet noticed any changes to the acanthosis nigricans, but he was satisfied with the results of the skin tag removal.
Photos and text for Photo Rounds Friday courtesy of Richard P. Usatine, MD. This case was adapted from: Smith AM. Skin tags. In: Usatine R, Smith M, Mayeaux EJ, et al, eds. Color Atlas of Family Medicine. 2nd ed. New York, NY: McGraw-Hill; 2013: 922-925.
To learn more about the Color Atlas of Family Medicine, see: www.amazon.com/Color-Family-Medicine-Richard-Usatine/dp/0071769641/
You can now get the second edition of the Color Atlas of Family Medicine as an app by clicking on this link: usatinemedia.com

¿No hablás español? Help Is Here
According to the 2015 US Census Bureau, more than 60 million individuals—about 19% of Americans—reported speaking a language other than English at home, and more than 25 million reported their English-speaking ability as less than “very well.” The top five non-English languages spoken at home were Spanish, French, Chinese, Tagalog, and Vietnamese, encompassing 72% of non-English speakers. 1,2
In the health care sector, translator services are essential for providing accurate and culturally competent care. Current options for translator services include face-to-face interpreters, phone-based translator services, and translator apps on mobile devices. In settings where face-to-face interpreters or phone-based translator services are not available, translator apps may be a reasonable alternative.
THREE TYPES OF TRANSLATOR APPS
Preset medical phrase translator apps require the user to search for or find a question or statement in order to facilitate a conversation. With these types of apps, a health care provider can choose fully conjugated sentences, which then can be played or read back to the patient in the chosen translated language. Within this group of apps, Canopy Speak and Universal Doctor Speaker are highly accessible, since both apps are available from the Apple iTunes and Google Play stores and both are free.
Medical dictionary apps require the user to search for a medical term in one language to receive a translation in another language. These apps are less practical, but they can help providers find and define specific terms in a given language.
General language translator apps require the user to enter a term, statement, or question in one language and then provide a translation in another language. Google Translate and Vocre Translate are examples.
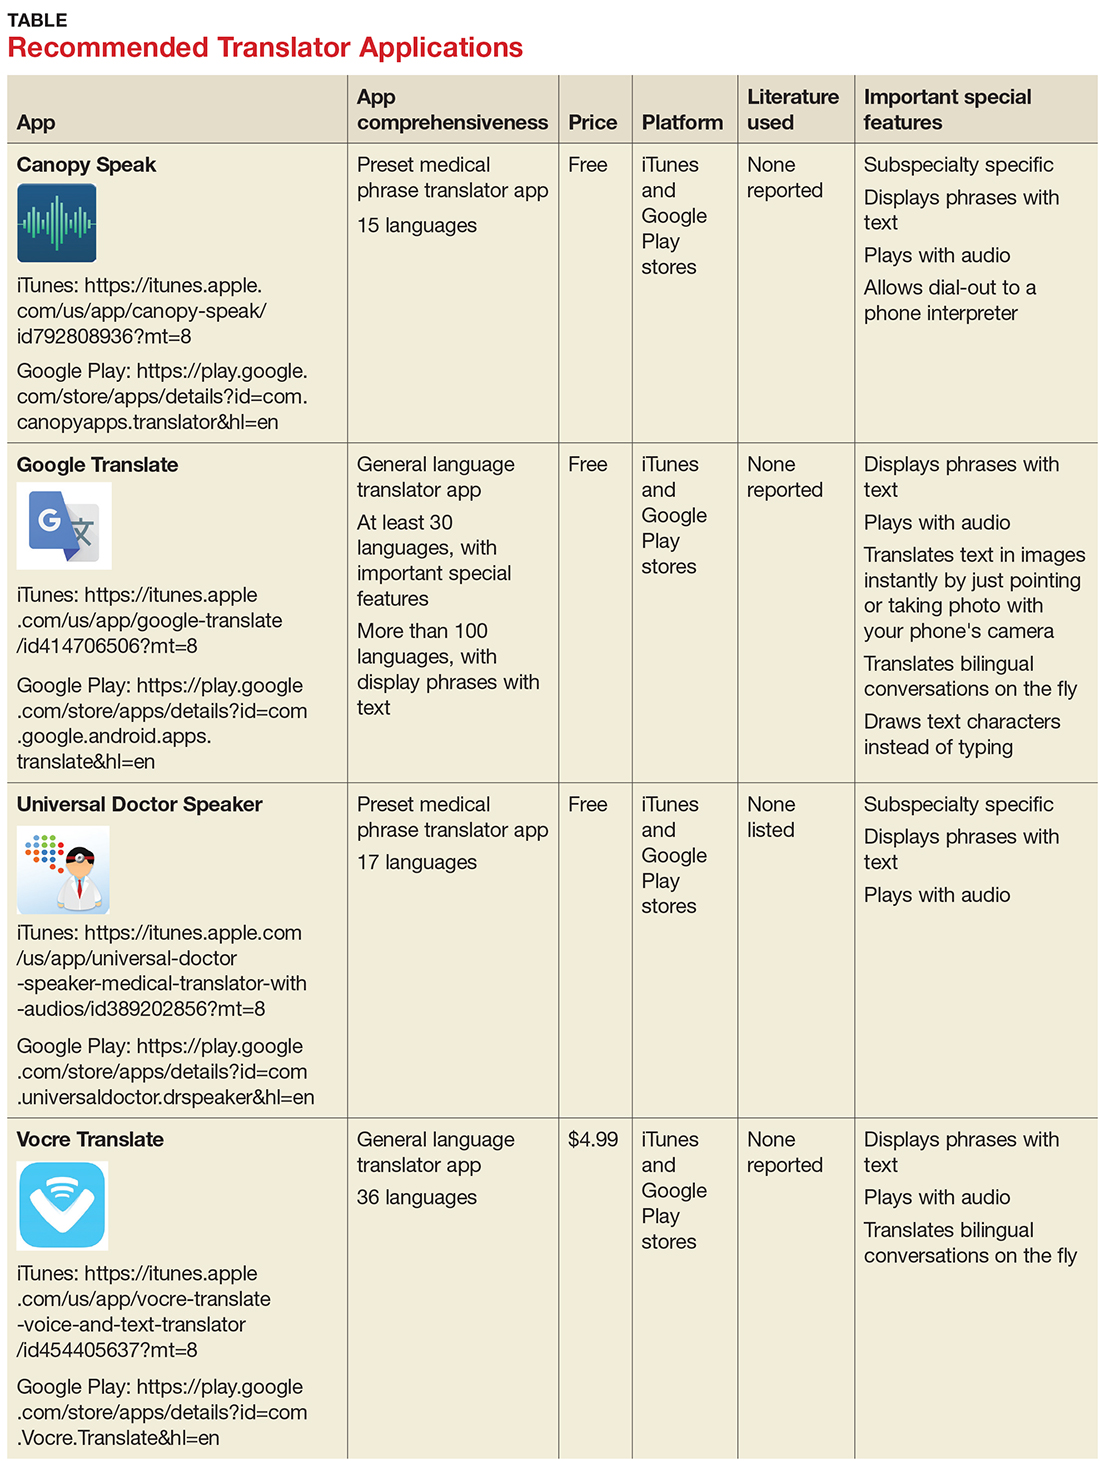
Recommended apps
My colleagues, Dr. Amrin Khander and Dr. Sara Farag, and I identified and evaluated medical translator apps that are available from the Apple iTunes and Google Play stores, to aid clinicians in using such apps during clinical encounters with non-English speakers.3
The top recommended translator apps are listed in the table, evaluated with criteria from a shortened version of the APPLICATIONS scoring system: app comprehensiveness, price, platform, literature use, and important special features.4 We hope these tools will help you enhance communication with your patients who have limited English proficiency.
1. United States Census Bureau. Detailed language spoken at home and ability to speak English for the population 5 years and over: 2009–2013. www.census.gov/data/tables/2013/demo/2009-2013-lang-tables.html. Accessed November 1, 2017.
2. United States Census Bureau. U.S. and world population clock. www.census.gov/popclock/?intcmp=home_pop. Accessed November 1, 2017.
3. Khander A, Farag S, Chen KT. Identification and rating of medical translator mobile applications using the APPLICATIONS scoring system [abstract 321]. Obstet Gynecol. 2017;129(5 suppl):101S.
4. Chyjek K, Farag S, Chen KT. Rating pregnancy wheel applications using the APPLICATIONS scoring system. Obstet Gynecol. 2015;125(6):1478-1483.
According to the 2015 US Census Bureau, more than 60 million individuals—about 19% of Americans—reported speaking a language other than English at home, and more than 25 million reported their English-speaking ability as less than “very well.” The top five non-English languages spoken at home were Spanish, French, Chinese, Tagalog, and Vietnamese, encompassing 72% of non-English speakers. 1,2
In the health care sector, translator services are essential for providing accurate and culturally competent care. Current options for translator services include face-to-face interpreters, phone-based translator services, and translator apps on mobile devices. In settings where face-to-face interpreters or phone-based translator services are not available, translator apps may be a reasonable alternative.
THREE TYPES OF TRANSLATOR APPS
Preset medical phrase translator apps require the user to search for or find a question or statement in order to facilitate a conversation. With these types of apps, a health care provider can choose fully conjugated sentences, which then can be played or read back to the patient in the chosen translated language. Within this group of apps, Canopy Speak and Universal Doctor Speaker are highly accessible, since both apps are available from the Apple iTunes and Google Play stores and both are free.
Medical dictionary apps require the user to search for a medical term in one language to receive a translation in another language. These apps are less practical, but they can help providers find and define specific terms in a given language.
General language translator apps require the user to enter a term, statement, or question in one language and then provide a translation in another language. Google Translate and Vocre Translate are examples.
Recommended apps
My colleagues, Dr. Amrin Khander and Dr. Sara Farag, and I identified and evaluated medical translator apps that are available from the Apple iTunes and Google Play stores, to aid clinicians in using such apps during clinical encounters with non-English speakers.3
The top recommended translator apps are listed in the table, evaluated with criteria from a shortened version of the APPLICATIONS scoring system: app comprehensiveness, price, platform, literature use, and important special features.4 We hope these tools will help you enhance communication with your patients who have limited English proficiency.
1. United States Census Bureau. Detailed language spoken at home and ability to speak English for the population 5 years and over: 2009–2013. www.census.gov/data/tables/2013/demo/2009-2013-lang-tables.html. Accessed November 1, 2017.
2. United States Census Bureau. U.S. and world population clock. www.census.gov/popclock/?intcmp=home_pop. Accessed November 1, 2017.
3. Khander A, Farag S, Chen KT. Identification and rating of medical translator mobile applications using the APPLICATIONS scoring system [abstract 321]. Obstet Gynecol. 2017;129(5 suppl):101S.
4. Chyjek K, Farag S, Chen KT. Rating pregnancy wheel applications using the APPLICATIONS scoring system. Obstet Gynecol. 2015;125(6):1478-1483.
FDA recommends voluntary recall of Limbrel
The Food and Drug Administration announced on Dec. 4 that it recommends the voluntary recall of Limbrel, a medical food product in capsule form that is currently marketed to “manage the metabolic processes associated with osteoarthritis.”
![]()
The FDA’s ongoing investigation at this point considers the product to be an unapproved new drug rather than a medical food product. However, the agency does not have mandatory recall authority. It has recommended the recall to the product’s manufacturer, Primus Pharmaceuticals, on the basis of the risk of liver injury and hypersensitivity pneumonitis associated with continued use of the product.
The agency had received 194 adverse event reports as of Nov. 21, of which it found a likely association of the events with Limbrel in at least 30 cases, and continues to evaluate reports, which consumers can submit through MedWatch. The FDA is currently testing samples of the product and has advised consumers to cease taking it, though the manufacturer has declined thus far to recall it.
The safety alert advises that “health care providers who are aware that their patients are taking Limbrel should advise them to immediately stop taking the product.”
Newer hormonal contraception formulations linked to breast cancer risk*
The risk of developing breast cancer is about 20% higher among women who are current or recent users of hormonal contraceptives, compared with women who never used them, according to a prospective cohort study that included current contraception formulations.

Lina S. Mørch, PhD, of the University of Copenhagen, and colleagues conducted a nationwide, prospective cohort study of 1,797,932 women in Denmark who were aged 15-49 years between 1995 and 2012. The risk of developing breast cancer among all women currently using or who had recently used hormonal contraception correlated to a relative risk (RR) of 1.20 (95% confidence interval [CI], 1.14-1.26). The report was published in the New England Journal of Medicine.
The risk of breast cancer was heavily associated with the length of time during which the women had taken hormonal contraceptives. Women with less than a year of exposure had the lowest risk elevation (RR 1.09, 95% CI, 0.96-1.23), while women with more than 10 years of exposure faced the greatest increase in risk (RR 1.38, 95% CI, 1.26-1.51, P = .002).
The increased risk persisted even after women had stopped taking contraceptives. Researchers found that contraception use of less than a year (RR 1.01, 95% CI, 0.88-1.15), between 1 year and 5 years (RR 1.07, 95% CI, 0.94-1.20), and between 5 years and 10 years (RR 1.30, 95% CI, 1.06-1.58) correlated to increased risks of breast cancer 5-10 years after cessation of use. The number of events in women who had used hormonal contraceptive for more than 10 years was too small to accurately determine risks and was not reported in the study.
The combinations and formulations of oral contraceptives had little effect on breast cancer risk elevation, the researchers found. Triphasic and monophasic formulations containing levonorgestrel had similar relative risk levels of 1.21 (95% CI, 1.04-1.41) and 1.45 (95% CI, 1.26-1.67), respectively (P = .07). The relative risk was similar for intrauterine devices containing levonorgestrel (RR 1.21, 95% CI, 1.11-1.33).
The difference in risk between current and recent users of hormonal contraception and women who never took it was 13 (CI, 10-16) per 100,000 person-years, which translates into an one extra breast cancer diagnosis for every 7,690 women using hormonal contraception for 1 year.
“The estimated number of additional breast cancers that were associated with hormonal contraception did not include extra cases diagnosed after the discontinuation of long-term use. Even so, the estimated number of additional breast cancers among premenopausal women that were attributable to hormonal contraception is likely to be low,” the researchers wrote. “This risk should be weighed against important benefits of hormonal contraceptives such as good contraceptive efficacy and reduced risks of ovarian, endometrial, and perhaps colorectal cancer (at least for combined oral contraceptives that were commonly used in the 1970s and 1980s).
”Dr. Mørch and a coauthor received grant support from the Novo Nordisk Foundation and became employed by Novo Nordisk Foundation after the study was accepted for publication. No other relevant disclosures were reported.
Source: Mørch L. et al. N Engl J Med 2017;377(23):2228-39.
*12/7/2017: The headline for this story has been corrected to reflect an association between contraception and breast cancer risk.
The association between increased breast cancer risk and hormonal contraceptives is well documented but the research by Mørch et al. offers several factors for physicians to consider when prescribing hormonal contraceptives.
Mørch et al. found a 20% total increase in breast cancer in women but that finding is not consistent across age groups. As seen in the study, breast cancer risk was more than five times higher in women in their 40s than in women in their 30s, with an overall increase in breast cancer risk of 13 women per 100,000 women. The increased risk of breast cancer was much less pronounced in women under 35, at only 2 women per 100,000 women. For women in their 40s, hormonal contraceptives not only increase their cancer risk, but they can suffer uncommon adverse side effects such as myocardial infarction and stroke as well. Older women should consider using alternative methods of contraception, such as nonhormonal long-acting, reversible contraceptives.
But the breast cancer risk needs to be balanced against the benefits, including the association between oral contraceptives and substantial reductions in the risk of ovarian, endometrial, and colorectal cancers later in life.
Ultimately, the need for contraceptives that do not increase breast cancer risk is evident.
David J. Hunter , MBBS, ScD, is from the University of Oxford, England. He reported having no relevant financial disclosures. These comments are adapted from an editorial (N Engl J Med. 2017;377[23]:2276-7).
The risk of developing breast cancer is about 20% higher among women who are current or recent users of hormonal contraceptives, compared with women who never used them, according to a prospective cohort study that included current contraception formulations.
Lina S. Mørch, PhD, of the University of Copenhagen, and colleagues conducted a nationwide, prospective cohort study of 1,797,932 women in Denmark who were aged 15-49 years between 1995 and 2012. The risk of developing breast cancer among all women currently using or who had recently used hormonal contraception correlated to a relative risk (RR) of 1.20 (95% confidence interval [CI], 1.14-1.26). The report was published in the New England Journal of Medicine.
The risk of breast cancer was heavily associated with the length of time during which the women had taken hormonal contraceptives. Women with less than a year of exposure had the lowest risk elevation (RR 1.09, 95% CI, 0.96-1.23), while women with more than 10 years of exposure faced the greatest increase in risk (RR 1.38, 95% CI, 1.26-1.51, P = .002).
The increased risk persisted even after women had stopped taking contraceptives. Researchers found that contraception use of less than a year (RR 1.01, 95% CI, 0.88-1.15), between 1 year and 5 years (RR 1.07, 95% CI, 0.94-1.20), and between 5 years and 10 years (RR 1.30, 95% CI, 1.06-1.58) correlated to increased risks of breast cancer 5-10 years after cessation of use. The number of events in women who had used hormonal contraceptive for more than 10 years was too small to accurately determine risks and was not reported in the study.
The combinations and formulations of oral contraceptives had little effect on breast cancer risk elevation, the researchers found. Triphasic and monophasic formulations containing levonorgestrel had similar relative risk levels of 1.21 (95% CI, 1.04-1.41) and 1.45 (95% CI, 1.26-1.67), respectively (P = .07). The relative risk was similar for intrauterine devices containing levonorgestrel (RR 1.21, 95% CI, 1.11-1.33).
The difference in risk between current and recent users of hormonal contraception and women who never took it was 13 (CI, 10-16) per 100,000 person-years, which translates into an one extra breast cancer diagnosis for every 7,690 women using hormonal contraception for 1 year.
“The estimated number of additional breast cancers that were associated with hormonal contraception did not include extra cases diagnosed after the discontinuation of long-term use. Even so, the estimated number of additional breast cancers among premenopausal women that were attributable to hormonal contraception is likely to be low,” the researchers wrote. “This risk should be weighed against important benefits of hormonal contraceptives such as good contraceptive efficacy and reduced risks of ovarian, endometrial, and perhaps colorectal cancer (at least for combined oral contraceptives that were commonly used in the 1970s and 1980s).
”Dr. Mørch and a coauthor received grant support from the Novo Nordisk Foundation and became employed by Novo Nordisk Foundation after the study was accepted for publication. No other relevant disclosures were reported.
Source: Mørch L. et al. N Engl J Med 2017;377(23):2228-39.
*12/7/2017: The headline for this story has been corrected to reflect an association between contraception and breast cancer risk.
FROM THE NEW ENGLAND JOURNAL OF MEDICINE
Key clinical point:
Major finding: The relative risk of breast cancer was 1.20 for current and recent users of hormonal contraception, compared with women who never used hormonal contraception (95% CI 1.14-1.26).
Data source: Nationwide, prospective cohort study of 1,797,932 women in Denmark aged 15-49 years between 1995 and 2012.
Disclosures: Dr. Mørch and a coauthor received grant support from the Novo Nordisk Foundation and became employed by Novo Nordisk Foundation after the study was accepted for publication. No other relevant disclosures were reported.
Source: Mørch L et al. N Engl J Med 2017;377(23):2228-39.
Gene therapy found promising in patients with hemophilia B
, according to results of a recent phase 1-2a study including 10 men with hemophilia B.
The treatment, known as SPK-9001, prevented bleeding and virtually eliminated the need for exogenous factors, said authors of the study, published online Dec. 6 in the New England Journal of Medicine.
The 10 men enrolled in the study had factor IX coagulation activity 2% or less of normal value. Within a week of treatment with SPK-9001, patients exhibited vector-derived factor IX coagulant activity, according to Dr. George and her colleagues.
For all participants, the mean vector-derived factor IX coagulant activity was 33.7% of normal value, they noted in the report.
Moreover, the bleeding rate was significantly reduced over follow-up, which ranged from 28 to 78 weeks. Annualized bleeding rate was 11.1 events per year before treatment and 0.4 events per year afterward (P = .02), with 9 of 10 patients experiencing no bleeds over the follow-up period, they reported.
Factor use also dropped substantially, from a mean dose of 2,908 IU/kg before vector administration to 49.3 IU/kg afterward, the researchers said, noting that 8 of 10 patients used no factor at all.
No serious adverse events were observed during vector infusion or afterward, but the long-term safety of adeno-associated viral gene transfer will require further study, the researchers said. “However, to date, no genotoxic or gene-silencing events have been noted in human participants, including those who have been followed since the first [adeno-associated virus] trials were reported in 1998,” Dr. George and her colleagues wrote.
Spark Therapeutics and Pfizer funded the study. Dr. George reported support from Spark Therapeutics for the study, and personal fees from Pfizer outside the submitted work. Some of the authors are employees of Spark or had other financial relationships with Spark and/or Pfizer.
The positive results seen in this trial of the adeno-associated viral vector SPK-9001 represent “an important milestone for the community of patients with hemophilia B and their caregivers and advocates, who now are within touching distance of having an ideal cure for this terrible disease,” Matthew Porteus, MD, PhD, wrote in an editorial.
To reduce spontaneous bleed risk in patients with hemophilia, the current standard of care is transitioning from prophylactic intravenous infusions of clotting factor multiple times per week to longer-acting agents that can be given every 7-10 days.
However, an “ideal therapy” according to Dr. Porteus, would be one that can be delivered once with minimal toxicity and last a lifetime, and be affordable for patients anywhere in the world.
“Gene therapy in which a sufficient number of cells are modified by the delivery of a gene with prolonged or even permanent expression to produce the missing clotting factor has the potential to be such an ideal therapy for hemophilia,” he wrote.
The findings regarding SPK-9001 are “striking” but are limited due to short follow-up, he said, although investigators have started a longer-term study to better investigate safety and efficacy.
Future research on hemophilia gene therapy should focus on broadening the number of patients who could benefit from it, including children, patients with preexisting antibodies, and the 80% of hemophilia patients with hemophilia A, he added.
Dr. Porteus is with the department of pediatrics at Stanford (Calif.) University. These comments are derived from his editorial (N Engl J Med. 2017;377[23]2274-5). Dr. Porteus reported receiving personal fees from CRISPR Therapeutics outside of his submitted editorial.
, according to results of a recent phase 1-2a study including 10 men with hemophilia B.
The treatment, known as SPK-9001, prevented bleeding and virtually eliminated the need for exogenous factors, said authors of the study, published online Dec. 6 in the New England Journal of Medicine.
The 10 men enrolled in the study had factor IX coagulation activity 2% or less of normal value. Within a week of treatment with SPK-9001, patients exhibited vector-derived factor IX coagulant activity, according to Dr. George and her colleagues.
For all participants, the mean vector-derived factor IX coagulant activity was 33.7% of normal value, they noted in the report.
Moreover, the bleeding rate was significantly reduced over follow-up, which ranged from 28 to 78 weeks. Annualized bleeding rate was 11.1 events per year before treatment and 0.4 events per year afterward (P = .02), with 9 of 10 patients experiencing no bleeds over the follow-up period, they reported.
Factor use also dropped substantially, from a mean dose of 2,908 IU/kg before vector administration to 49.3 IU/kg afterward, the researchers said, noting that 8 of 10 patients used no factor at all.
No serious adverse events were observed during vector infusion or afterward, but the long-term safety of adeno-associated viral gene transfer will require further study, the researchers said. “However, to date, no genotoxic or gene-silencing events have been noted in human participants, including those who have been followed since the first [adeno-associated virus] trials were reported in 1998,” Dr. George and her colleagues wrote.
Spark Therapeutics and Pfizer funded the study. Dr. George reported support from Spark Therapeutics for the study, and personal fees from Pfizer outside the submitted work. Some of the authors are employees of Spark or had other financial relationships with Spark and/or Pfizer.
FROM NEW ENGLAND JOURNAL OF MEDICINE
Key clinical point: A single intravenous dose of the adeno-associated viral vector SPK-9001 produced sustained expression of factor IX coagulant activity, virtually eliminating bleeding and use of clotting factors in patients with hemophilia B.
Major finding: A mean functional clotting-factor activity of 33.7% of the normal value (median, 29.8% of the normal value) was achieved among study participants.
Data source: An open-label, nonrandomized, multicenter phase 1-2a study including 10 men with hemophilia B and factor IX coagulant activity 2% or less of normal value.
Disclosures: Spark Therapeutics and Pfizer funded the study. Lead author Lindsey A. George, MD, reported support from Spark Therapeutics for the study, and personal fees from Pfizer outside the submitted work. Full author disclosures were published on the New England Journal of Medicine website.
Pharmacomechanical thrombolysis does not reduce post-thrombotic syndrome risk
In patients with acute proximal deep vein thrombosis who were undergoing anticoagulation, adding pharmacomechanical catheter-directed thrombolysis did not reduce risk of the post-thrombotic syndrome, according to results of a phase 3, randomized, controlled trial.
Moreover, addition of pharmacomechanical thrombolysis increased risk of major bleeding risk, investigators wrote in a report published online Dec. 6 in the New England Journal of Medicine.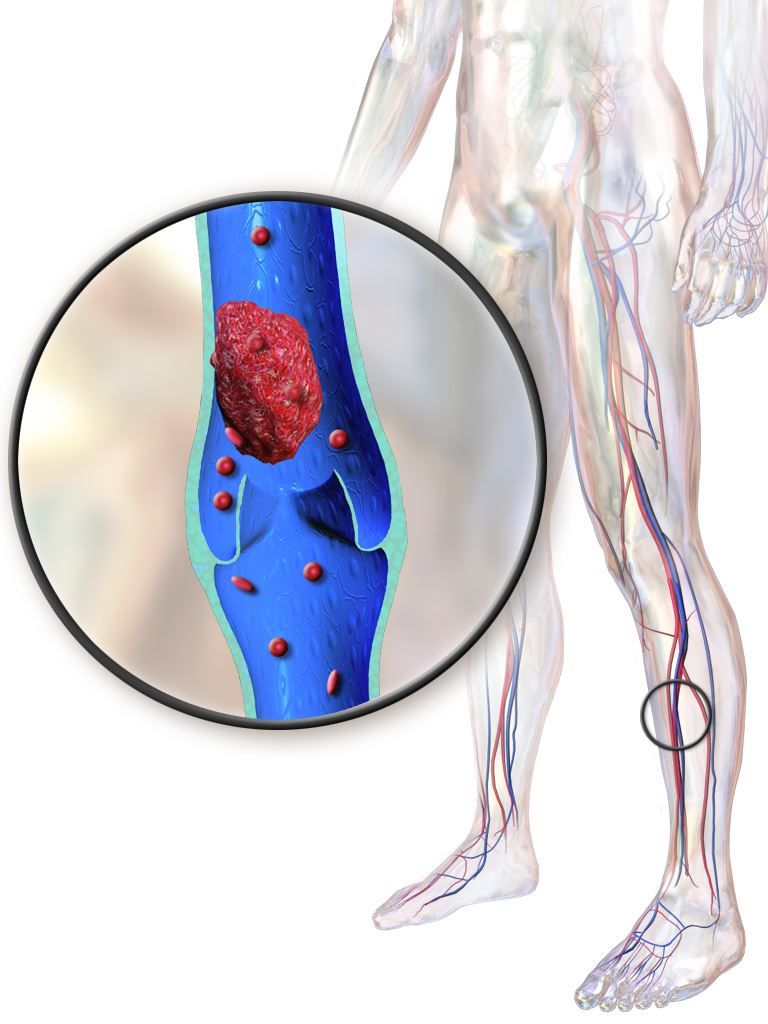
“Our trial, for uncertain reasons, did not confirm these findings,” wrote Suresh Vedantham, MD of Washington University, St. Louis, and his coauthors.
Post-thrombotic syndrome is associated with chronic limb swelling and pain, and can lead to leg ulcers, impaired quality of life, and major disability. About half of patients with proximal deep vein thrombosis (DVT) will develop the post-thrombotic syndrome within 2 years, despite use of anticoagulation therapy, Dr. Vedantham and his colleagues noted.
Pharmacomechanical thrombosis is the catheter-directed delivery of a fibrinolytic agent into the thrombus, along with aspiration or maceration of the thrombus. The goal of the treatment is to reduce the burden of thrombus, which in turn might reduce risk of the post-thrombotic syndrome.
However, in their randomized trial known as ATTRACT, which included 692 patients with an acute proximal DVT, rates of post-thrombotic syndrome between 6 to 24 months after intervention were 47% in the pharmacomechanical thrombolysis group and 48% in the control group (risk ratio, 0.96; 95% CI, 0.82-1.11; P = .56), according to the report (N Engl J Med. 2017;377:2240-52). Control group patients received no procedural intervention.
Major bleeds within 10 days of the intervention were 1.7% and 0.3% for the pharmacomechanical thrombolysis and control groups, respectively (P = .049).
By contrast, in the CAVENT trial, catheter-directed thrombolysis reduced the risk of the post-thrombotic syndrome over 5 years of follow-up (Lancet Haematol. 2016;3[2]:e64-71). Dr. Vedantham and his coauthors suggested that factors potentially explaining the difference in outcomes include the number of patients enrolled (692 in ATTRACT, versus 209 in CAVENT), or the greater use of mechanical therapies in ATTRACT versus longer recombinant tissue plasminogen activator infusions in CAVENT.
The study was supported by multiple sources, including the National Heart, Lung and Blood Institute (NHLBI), Boston Scientific, Covidien (now Medtronic), Genentech, and others. Dr. Vedantham reported receiving grant support from Cook Medical and Volcano. Some of the other authors reported financial ties to Abbott Vascular, Boston Scientific, Medtronic, and other pharmaceutical and device companies.
FROM NEW ENGLAND JOURNAL OF MEDICINE
Key clinical point:
Major finding: Rates of post-thrombotic syndrome were 47% in the pharmacomechanical thrombolysis group, and 48% in the control group (risk ratio, 0.96; 95% CI, 0.82-1.11; P = .56).
Data source: A phase 3, multicenter, randomized, open-label, assessor-blinded, controlled clinical trial, including 692 patients with acute proximal deep vein thrombosis.
Disclosures: The study was supported by multiple sources, including the National Heart, Lung and Blood Institute (NHLBI), Boston Scientific, Covidien (now Medtronic), Genentech, and others. First author Suresh Vedantham, MD, reported receiving grant support from Cook Medical and Volcano. Some of the other authors reported financial ties to Abbott Vascular, Boston Scientific, Medtronic, and other pharmaceutical and device companies.
2017 MS Highlights: The Year in Review
Fenfluramine trials in Dravet syndrome yield highly positive results
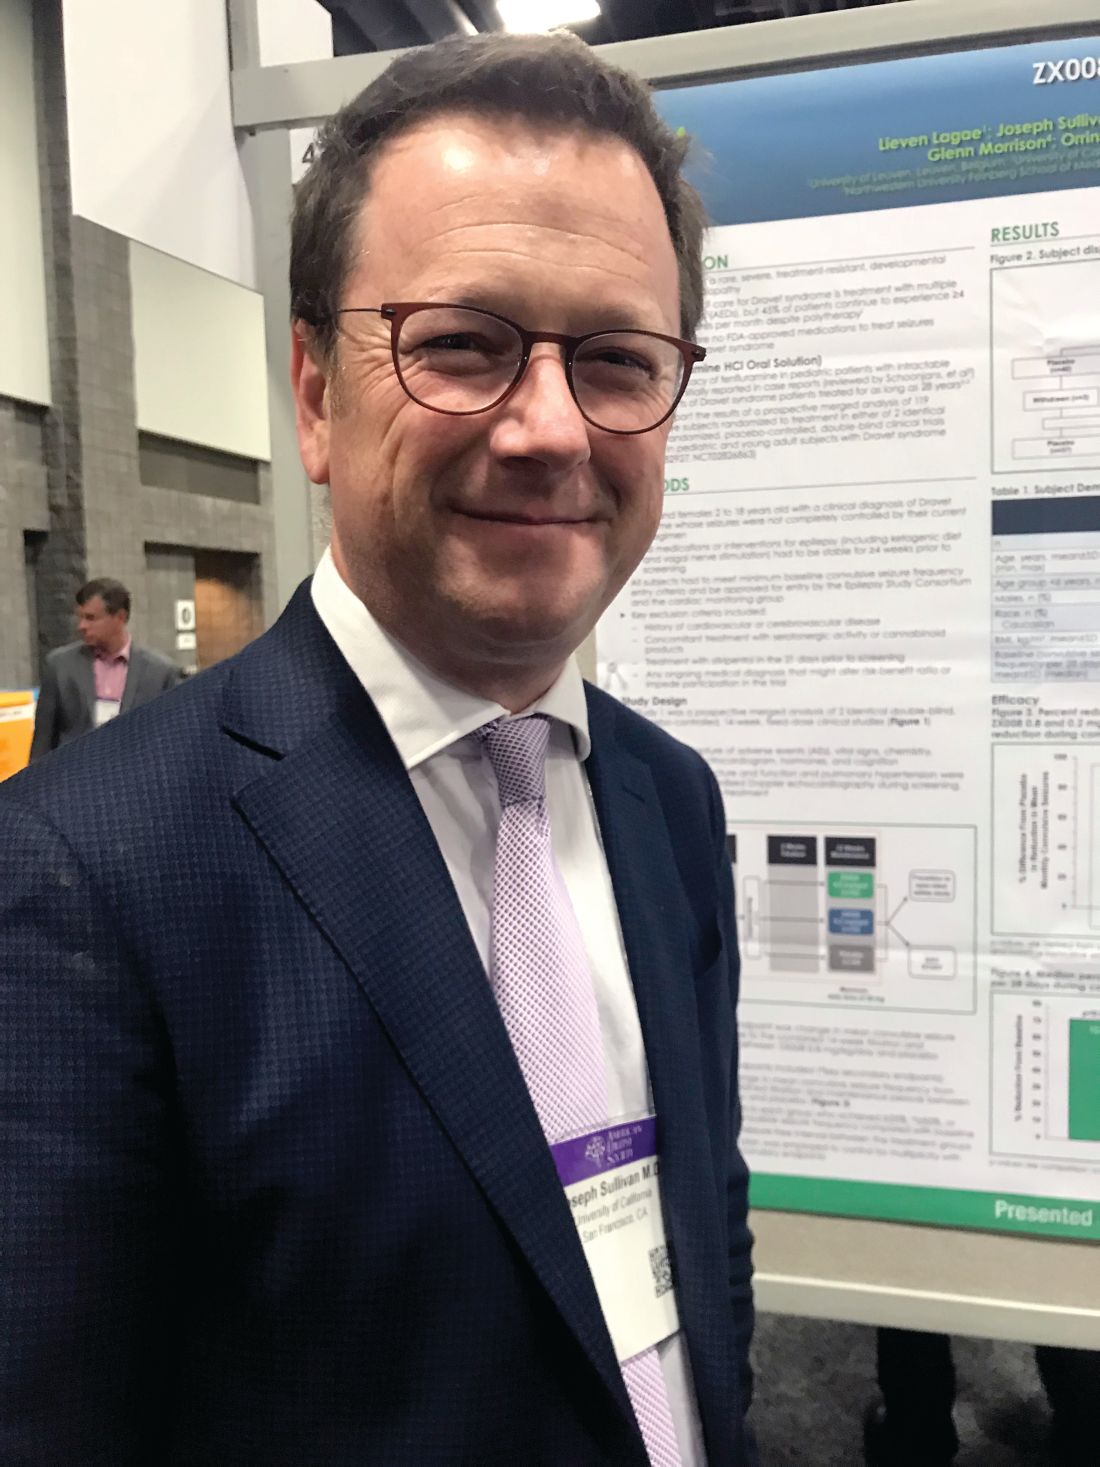
WASHINGTON – The oral experimental agent fenfluramine, also known as ZX008, has been associated with a high degree of efficacy and good tolerability for the adjunctive treatment of Dravet syndrome, according to combined results of the first patients enrolled in two phase III trials.
“For me, a highlight of this study is the finding that 45% of patients on the higher dose achieved at least a 75% reduction from baseline in monthly convulsive seizures. This is a life-changing improvement,” reported Joseph Sullivan, MD, director of the pediatric epilepsy center at the University of California, San Francisco. He presented the results at the annual meeting of the American Epilepsy Society.
“If fenfluramine is approved as an adjunctive agent, it is likely to be introduced as the second or third medication in an effort to gain adequate symptom control,” Dr. Sullivan speculated.
Three phase 3 trials with fenfluramine are underway. The data presented at the American Epilepsy Society meeting were based on the first 119 patients who had participated in either of the two identical trials conducted in Europe and North America. The data from these two trials has now been combined, and the outcomes in the remaining patients in these two trials will be presented at a later time along with results from a third phase 3 study.
Patients between the ages of 2 and 18 years with a clinical diagnosis of Dravet syndrome were eligible for the European and North American trials if they were not controlled on current therapy, which could include multiple agents. However, patients had to be on stable therapies prior to enrollment for at least 4 weeks. Once enrolled, they were observed for 6 weeks prior to randomization.
After randomization to placebo, 0.2 mg/kg fenfluramine, or 0.8 mg/kg fenfluramine, patients completed a 2-week titration before they reached their maintenance dose. They were then evaluated over an additional 12-week treatment period. There were three withdrawals over the course of treatment in the placebo group, none in the lower-dose fenfluramine group, and six in the higher-dose fenfluramine group.
The primary endpoint was change in mean monthly convulsive seizure frequency from the observation period. When compared with placebo, these reductions were 63.9% (P less than .001) in the 0.8-mg/kg group and 33.7% (P = .019) in the 0.2-mg/kg group. When expressed as the median percent reduction in convulsive seizures from the observation period per 28 days, the reductions were 72.4% for the 0.8-mg/kg dose (P less than .001 vs. placebo), 37.6% for the 0.2-mg/kg group (P = .185 vs. placebo), and 17.4% for placebo.
Other efficacy measures supported the relative advantage of fenfluramine. For example, 70% and 41% of the patients in the 0.8-mg/kg and 0.2-mg/kg groups, respectively, versus 8% of placebo patients, had at least a 50% reduction in seizure frequency. Median seizure-free intervals for the three groups were 20.5, 14, and 9 days, respectively. Seizure activity was reduced to one or no seizures over the treatment period in 25% of the 0.8-mg/kg group, 12.8% of the 0.2-mg/kg group, and 0% of the placebo group.
The most common adverse events on the 0.8-mg/kg dose of fenfluramine, compared with placebo, were decreased appetite (37.5% vs. 5%) and lethargy (17.5% vs. 5%). The proportion of patients with weight loss was also greater on 0.8 mg/kg (5%) and 0.2 mg/kg (12.8%) versus placebo (0%). Diarrhea was more common in the 0.2-mg/kg group (30.8%) than in the 0.8-mg/kg group (17.5%) or in the placebo group (7.5%).
Although monitored closely, cardiotoxicity was not observed in this study. Concern about potential cardiotoxic effects was generated by the increased risk of valvular disease observed in patients taking fenfluramine with phentermine (fen-phen) for weight loss in the 1990s. This combination was withdrawn from the market in 1997.
“The potential for cardiotoxicity will continue to be monitored closely, but these initial results were reassuring,” reported Dr. Sullivan, who noted that a history of cardiovascular or cerebrovascular disease were exclusion criteria from this study.
Application for regulatory approval is not anticipated until all the phase 3 trial data are available, but Dr. Sullivan said that the results so far suggest that fenfluramine as an adjunctive agent “may represent a significant advance over existing treatment options for Dravet syndrome.”
The studies are funded by Zogenix. Dr. Sullivan reported financial relationships with Epygenix and Zogenix.
REPORTING FROM AES 2017
Key clinical point:
Major finding: For the highest dose, the mean reduction in convulsive seizure frequency was 63.9% (P less than .001) versus placebo over a 14-week treatment period.
Data source: An analysis of the first 119 patients with Dravet syndrome enrolled in two ongoing randomized, double-blind, multicenter, phase 3 trials.
Disclosures: The studies are funded by Zogenix. The presenter reported financial relationships with Epygenix and Zogenix.
Source: L Lagae et al. AES 2017 Abstract 2.434
Clostridium difficile in the ICU: A “fluid” issue
In critically ill patients admitted to the ICU, diarrhea (defined as three or more watery loose stools within 24 hours) is a common problem. The etiologies of diarrhea are many, with infectious and noninfectious causes encountered.
Clostridium difficile infection (CDI) is the most common infectious cause of diarrhea in the hospital, including the ICU. The Centers for Disease Control and Prevention estimates the number of overall CDI cases to number about a half-million per year, of which 1 in 5 patients will have a recurrence, and 1 in 11 people aged ≥65 years will die within a month of CDI diagnosis. Age is a poor prognostic risk; greater than 80% of C difficile deaths occur in people 65 and older.

The increased use of electronic sepsis screening tools and aggressive antibiotic treatment, often done through protocols, has recently been identified as paradoxically increasing CDI occurrence (Hiensch R et al. Am J Infect Control. 2017;45[10]:1091). However, similar rapid identification and management of CDI can result in improved patient outcomes.
Issues with diagnosing CDI
Episodes of CDI can be rapid and severe, especially if due to hyper-toxin producing–strains of C difficile, such as BI/NAP1/027, which produces significantly higher levels of Toxin A, Toxin B, and binary toxin CDT (Denève C, et al. Int J Antimicrob Agents. 2009;33:S24). Testing for CDI has been controversial; several methods have been employed to aid in the diagnosis of CDI. Currently, many institutions use either nucleic acid amplification tests (NAATs) for toxigenic C difficile or direct detection of the toxin produced by the bacteria. NAATs and past culture-based methods are more sensitive but less specific than toxin assays, whereas toxin assays are less sensitive but more specific than NAATs. However, detection of C difficile colonization due to high-sensitivity NAATs has caused a rise in the apparent rate of hospital-acquired CDI (Polage CR, et al. JAMA Intern Med. 2015;175[11]:4114).
To counter this, multi-step algorithmic approaches to CDI diagnosis have been recommended, including the use of glutamate dehydrogenase (GDH) antigen, toxin detection, and NAATs for toxin-producing C difficile. These multistep pathways attempt to minimize false-positive test results while affirming the presence or absence of true CDI (Fang F, et al. J Clin Microbiol. 2017; 55[3]:670).

However, controversy continues regarding which testing modalities are optimal, as some patients with positive toxin assays have asymptomatic colonization while some patients with negative toxin assays have CDI. The hope is that emerging, higher sensitivity toxin assays will decrease the number of CDI cases missed by negative toxin tests. Because C difficile toxins are labile at body temperature and susceptible to inactivation by digestive enzymes, stool samples must be expeditiously transported to the lab (time is of the essence), so as not to lose toxin or NAAT target detection. Repeat CDI testing for a “test for cure” is not recommended.
Management of CDI
The initial management of CDI has been discussed in many publications, including the current SHEA/IDSA Guidelines (Cohen SH, et al. Infect Control Hosp Epidemiol. 2010;31[5]:431).
Briefly, this involves stratifying CDI patients by clinical severity (mild, moderate, severe) and objective data (leukocytosis >15,000, septic shock, serum creatinine level > 1.5 times premorbid level) to guide initial antibiotic therapy. For mild/moderate first episode of CDI, oral or IV metronidazole is generally recommended; more severe disease is generally treated with oral vancomycin.
Complicated CDI in patients (hypotension/shock, ileus, toxic megacolon) requires aggressive management with both IV metronidazole and oral vancomycin (if ileus is present, consider vancomycin enemas). Additionally, fidaxomicin is available for oral CDI treatment and has been associated with decreased first-episode CDI recurrence.
The management of CDI recurrence commonly involves using oral vancomycin as a taper (or taper/pulse regimen) or using fidaxomicin. A recent publication (Sirbu et al. Clin Infect Dis. 2017;65[8]:1396) retrospectively compared vancomycin taper and pulse treatment strategies for 100 consecutive patients with CDI.
After taper, patents who received every other day (QOD) dosing had a cure rate of 61%, while those who received QOD dosing followed by every third day dosing achieved an 81% cure rate. A clinical trial comparing vancomycin standard therapy vs vancomycin taper with pulse vs fidaxomicin for first- and second-recurrence of CDI is underway.
Last year, the FDA approved bezlotoxumab, a monoclonal antibody that binds to C difficile toxin B. Bezlotoxumab treatment is indicated to reduce CDI recurrence in patients >18 years of age and is administered while CDI antibiotic therapy is ongoing.
When comparing 12-week efficacy using standard of care (SoC) CDI treatment vs SoC plus bezlotoxumab (SoC+Bmab), recurrence rates in SoC and SoC+Bmab were 27.6% vs1 7.4%, respectively, in one trial, and 25.7% vs 15.7% in another. While generally well-tolerated, bezlotoxumab is associated with increased risk for exacerbating heart failure. Data relating to the cost-effectiveness of bezlotoxumab are currently pending.
Fecal microbiota transplant (FMT)— duodenal or colonic instillation of donor fecal microbiota to “restore” normal flora— is an evolving CDI therapy with promising results but difficult administration. Although FMT has high published success rates, the FDA’s policy of “enforcement discretion” permits practitioners to proceed with FMT only as an Investigational New Drug. This requires signed, informed consent to FMT as an investigational therapy with unknown long-term risks.

The FDA deemed these protections necessary as ongoing studies of the human microbiome have yet to define what constitutes “normal flora,” and some investigators highlight the possibility of transmitting flora or gut factors associated with obesity, metabolic syndrome, or malignancy.
Experimental CDI preventive modalities include new antibiotics, monoclonal antibodies, probiotics, select other novel agents, and C. difficile vaccinations. These vaccines include recombinant fusion proteins and adjuvant toxoids, both of which have generally favorable tolerance profiles, as well as robust immune responses in clinical trial subjects. However, the efficacy of these vaccines at preventing clinical disease is still to be demonstrated.
Lastly, the ubiquitous use of proton pump inhibitors (PPI) in ICUs plays a role in promoting CDI incidence, severity, and recurrence. Accordingly, the pros and cons of PPI use must be weighed in each patient.
CDI prevention in the hospital environment
Hospital-acquired CDIs (HA-CDI) and nosocomial transmission clearly occur. A recent study of electronic health record data demonstrated that patients who passed through the hospital’s emergency department CT scanner within 24 hours after a patient with C difficile were twice as likely to become infected (Murray SG, et al. JAMA Internal Medicine. published online October 23, 2017. doi:10.1001). Receipt of antibiotics by prior bed occupants was associated with increased risk for CDI in subsequent patients, implying that antibiotics can directly affect the risk for CDI in patients who do not themselves receive antibiotics. As such, aggressive environmental cleaning in conjunction with hospital antimicrobial stewardship efforts, such as appropriate use of antibiotics known to increase CDI occurrence, are required to minimize HA-CDI.
Contact precautions should be strictly enforced; wearing gloves and gowns is necessary for every encounter when treating patients with C difficile, even during short visits. Hand sanitizer does not kill C difficile, and although soap-and-water hand washing works better, it may be insufficient alone, reinforcing the importance of using gloves with all patient encounters.
The strain placed on ICUs by CDI has been increasing over the past several years. Physicians and hospitals are at risk for lower performance scores and reduced reimbursement due to CDI relapses. As such, burgeoning areas of debate and research include efforts to quickly and accurately diagnose CDI along with reducing recurrence rates. Yet, with all the capital investment, the most significant and cost-effective method to reduce CDI rates remains proper and frequent hand washing with soap and water. Prevention of disease remains the cornerstone to treatment.
In critically ill patients admitted to the ICU, diarrhea (defined as three or more watery loose stools within 24 hours) is a common problem. The etiologies of diarrhea are many, with infectious and noninfectious causes encountered.
Clostridium difficile infection (CDI) is the most common infectious cause of diarrhea in the hospital, including the ICU. The Centers for Disease Control and Prevention estimates the number of overall CDI cases to number about a half-million per year, of which 1 in 5 patients will have a recurrence, and 1 in 11 people aged ≥65 years will die within a month of CDI diagnosis. Age is a poor prognostic risk; greater than 80% of C difficile deaths occur in people 65 and older.
The increased use of electronic sepsis screening tools and aggressive antibiotic treatment, often done through protocols, has recently been identified as paradoxically increasing CDI occurrence (Hiensch R et al. Am J Infect Control. 2017;45[10]:1091). However, similar rapid identification and management of CDI can result in improved patient outcomes.
Issues with diagnosing CDI
Episodes of CDI can be rapid and severe, especially if due to hyper-toxin producing–strains of C difficile, such as BI/NAP1/027, which produces significantly higher levels of Toxin A, Toxin B, and binary toxin CDT (Denève C, et al. Int J Antimicrob Agents. 2009;33:S24). Testing for CDI has been controversial; several methods have been employed to aid in the diagnosis of CDI. Currently, many institutions use either nucleic acid amplification tests (NAATs) for toxigenic C difficile or direct detection of the toxin produced by the bacteria. NAATs and past culture-based methods are more sensitive but less specific than toxin assays, whereas toxin assays are less sensitive but more specific than NAATs. However, detection of C difficile colonization due to high-sensitivity NAATs has caused a rise in the apparent rate of hospital-acquired CDI (Polage CR, et al. JAMA Intern Med. 2015;175[11]:4114).
To counter this, multi-step algorithmic approaches to CDI diagnosis have been recommended, including the use of glutamate dehydrogenase (GDH) antigen, toxin detection, and NAATs for toxin-producing C difficile. These multistep pathways attempt to minimize false-positive test results while affirming the presence or absence of true CDI (Fang F, et al. J Clin Microbiol. 2017; 55[3]:670).
However, controversy continues regarding which testing modalities are optimal, as some patients with positive toxin assays have asymptomatic colonization while some patients with negative toxin assays have CDI. The hope is that emerging, higher sensitivity toxin assays will decrease the number of CDI cases missed by negative toxin tests. Because C difficile toxins are labile at body temperature and susceptible to inactivation by digestive enzymes, stool samples must be expeditiously transported to the lab (time is of the essence), so as not to lose toxin or NAAT target detection. Repeat CDI testing for a “test for cure” is not recommended.
Management of CDI
The initial management of CDI has been discussed in many publications, including the current SHEA/IDSA Guidelines (Cohen SH, et al. Infect Control Hosp Epidemiol. 2010;31[5]:431).
Briefly, this involves stratifying CDI patients by clinical severity (mild, moderate, severe) and objective data (leukocytosis >15,000, septic shock, serum creatinine level > 1.5 times premorbid level) to guide initial antibiotic therapy. For mild/moderate first episode of CDI, oral or IV metronidazole is generally recommended; more severe disease is generally treated with oral vancomycin.
Complicated CDI in patients (hypotension/shock, ileus, toxic megacolon) requires aggressive management with both IV metronidazole and oral vancomycin (if ileus is present, consider vancomycin enemas). Additionally, fidaxomicin is available for oral CDI treatment and has been associated with decreased first-episode CDI recurrence.
The management of CDI recurrence commonly involves using oral vancomycin as a taper (or taper/pulse regimen) or using fidaxomicin. A recent publication (Sirbu et al. Clin Infect Dis. 2017;65[8]:1396) retrospectively compared vancomycin taper and pulse treatment strategies for 100 consecutive patients with CDI.
After taper, patents who received every other day (QOD) dosing had a cure rate of 61%, while those who received QOD dosing followed by every third day dosing achieved an 81% cure rate. A clinical trial comparing vancomycin standard therapy vs vancomycin taper with pulse vs fidaxomicin for first- and second-recurrence of CDI is underway.
Last year, the FDA approved bezlotoxumab, a monoclonal antibody that binds to C difficile toxin B. Bezlotoxumab treatment is indicated to reduce CDI recurrence in patients >18 years of age and is administered while CDI antibiotic therapy is ongoing.
When comparing 12-week efficacy using standard of care (SoC) CDI treatment vs SoC plus bezlotoxumab (SoC+Bmab), recurrence rates in SoC and SoC+Bmab were 27.6% vs1 7.4%, respectively, in one trial, and 25.7% vs 15.7% in another. While generally well-tolerated, bezlotoxumab is associated with increased risk for exacerbating heart failure. Data relating to the cost-effectiveness of bezlotoxumab are currently pending.
Fecal microbiota transplant (FMT)— duodenal or colonic instillation of donor fecal microbiota to “restore” normal flora— is an evolving CDI therapy with promising results but difficult administration. Although FMT has high published success rates, the FDA’s policy of “enforcement discretion” permits practitioners to proceed with FMT only as an Investigational New Drug. This requires signed, informed consent to FMT as an investigational therapy with unknown long-term risks.
The FDA deemed these protections necessary as ongoing studies of the human microbiome have yet to define what constitutes “normal flora,” and some investigators highlight the possibility of transmitting flora or gut factors associated with obesity, metabolic syndrome, or malignancy.
Experimental CDI preventive modalities include new antibiotics, monoclonal antibodies, probiotics, select other novel agents, and C. difficile vaccinations. These vaccines include recombinant fusion proteins and adjuvant toxoids, both of which have generally favorable tolerance profiles, as well as robust immune responses in clinical trial subjects. However, the efficacy of these vaccines at preventing clinical disease is still to be demonstrated.
Lastly, the ubiquitous use of proton pump inhibitors (PPI) in ICUs plays a role in promoting CDI incidence, severity, and recurrence. Accordingly, the pros and cons of PPI use must be weighed in each patient.
CDI prevention in the hospital environment
Hospital-acquired CDIs (HA-CDI) and nosocomial transmission clearly occur. A recent study of electronic health record data demonstrated that patients who passed through the hospital’s emergency department CT scanner within 24 hours after a patient with C difficile were twice as likely to become infected (Murray SG, et al. JAMA Internal Medicine. published online October 23, 2017. doi:10.1001). Receipt of antibiotics by prior bed occupants was associated with increased risk for CDI in subsequent patients, implying that antibiotics can directly affect the risk for CDI in patients who do not themselves receive antibiotics. As such, aggressive environmental cleaning in conjunction with hospital antimicrobial stewardship efforts, such as appropriate use of antibiotics known to increase CDI occurrence, are required to minimize HA-CDI.
Contact precautions should be strictly enforced; wearing gloves and gowns is necessary for every encounter when treating patients with C difficile, even during short visits. Hand sanitizer does not kill C difficile, and although soap-and-water hand washing works better, it may be insufficient alone, reinforcing the importance of using gloves with all patient encounters.
The strain placed on ICUs by CDI has been increasing over the past several years. Physicians and hospitals are at risk for lower performance scores and reduced reimbursement due to CDI relapses. As such, burgeoning areas of debate and research include efforts to quickly and accurately diagnose CDI along with reducing recurrence rates. Yet, with all the capital investment, the most significant and cost-effective method to reduce CDI rates remains proper and frequent hand washing with soap and water. Prevention of disease remains the cornerstone to treatment.
This month in CHEST Editor’s picks
Original Research
Pharmacotherapy for Non-Cystic Fibrosis Bronchiectasis: Results From an NTM Info and Research Patient Survey and the Bronchiectasis and NTM Research Registry.
By Dr. E. Henkle, et al.

By Dr. A. Lautenbach, et al.
Commentary
Crotalaria (Monocrotaline) Pulmonary Hypertension: The Fiftieth Anniversary.
By Dr. J. Kay.
Original Research
Pharmacotherapy for Non-Cystic Fibrosis Bronchiectasis: Results From an NTM Info and Research Patient Survey and the Bronchiectasis and NTM Research Registry.
By Dr. E. Henkle, et al.
By Dr. A. Lautenbach, et al.
Commentary
Crotalaria (Monocrotaline) Pulmonary Hypertension: The Fiftieth Anniversary.
By Dr. J. Kay.