User login
SBRT controls oligometastatic RCC in majority of patients
Stereotactic body radiation therapy (SBRT) is a safe and effective treatment option for patients with oligometastatic renal cell carcinoma (RCC), according to investigators.
Patients with clear cell RCC who had previously received systemic therapy were more likely to achieve local control, reported Ciro Franzese, MD of Humanitas Clinical and Research Center in Milan, and his coauthors.
These findings contribute to a shifting landscape in RCC; modern techniques are opening doors once closed by disappointing historical results. Several recent SBRT studies have demonstrated local control rates of approximately 90%, compared with conventional RT rates of 20%.
“While the outcomes from conventional RT were quite poor, with SBRT, different biological mechanisms occur due to the use of higher doses per fraction,” the authors wrote in The Journal of Urology.
The present retrospective study involved 58 patients with oligometastatic RCC who were treated with SBRT between 2004 and 2006. Patients previously underwent primary tumor excision, had no greater than three distant extracranial metastases, and were not surgical candidates. Study endpoints included median overall survival (OS), progression-free survival (PFS), and in-field local control (LC). Stratified analysis was also performed in patients with clear cell RCC.
Just over 90% of patients achieved LC at 18 months. Slightly less than half (46.2%) were progression-free at 1 year, and this number dropped to one-third (35%) by 18 months. Median OS was just over 2 years (28 months). Although all patients (100%) were alive at 2 years, this rate dropped to 83% by the 5-year mark.
In patients with clear cell RCC, those treated with systemic therapy prior to SBRT were more likely to achieve LC compared with patients who did not receive systemic therapy (HR 0.15; P = .032).
Overall, SBRT was well tolerated. No grade 3 or higher adverse events occurred. The most common adverse events were pain, fatigue, nausea, and vomiting.
The authors concluded that SBRT is a safe and effective option for patients with oligometastatic RCC. They called for future research to address “the radiobiology of RCC” in order to “understand the role of SBRT and, particularly, its possible interaction with medical therapies.”
The authors reported no conflicts of interest.
SOURCE: Franzese et al. J Urol. 2018 Sep 1. doi: 10.1016/j.juro.2018.08.049.
FROM THE JOURNAL OF UROLOGY
Key clinical point: For patients with oligometastatic renal cell carcinoma (RCC), stereotactic body radiation therapy (SBRT) is a safe and effective treatment option.
Major finding: The local control rate 18 months after SBRT was 90.2%.
Study details: A retrospective study involving 58 patients with oligometastatic RCC who were treated with SBRT between 2004 and 2006.
Disclosures: None.
Source: Franzese et al. J Urol. 2018 Sep 1. doi: 10.1016/j.juro.2018.08.049.
Female Gender, High Stress Levels, and Migraine
A recent study found a 10.7% prevalence of migraines and synergism between female gender and stress on risk of migraine, suggesting health interventions targeting women under stress may be beneficial. Researchers used data from 42,282 persons aged ≥12 years who participated in a 2013–2014 community health survey. A multivariate log-binomial model was used to calculate adjusted prevalence ratios for migraines associated with individual and joint exposures of female gender and stress. They used relative excess risk due to interaction (RERI), attributable proportion (AP), and synergy index (S index) to measure additive interaction. They found:
- The prevalence of migraines was 10.7%.
- The adjusted prevalence ratios were 2.37 for female vs male, 1.63 for persons with high vs low levels of stress, and 3.38 for women with high stress vs men with low stress.
- The RERI estimate was 0.38, the AP estimate was 0.11, and the S index was 1.19.
Slatculescu AM, Chen Y. Synergism between female gender and high levels of daily stress associated with migraine headaches in Ontario, Canada. [Published online ahead of print August 28, 2018]. Neuroepidemiol. doi:10.1159/000492503.
Decrease Found in ED Return Rates for Migraine
For patients with migraine in the emergency department (ED), the use of IV fluids, dopamine receptor antagonists (DRA), nonsteroidal anti-Inflammatory drugs, and corticosteroids increased whereas the use of narcotics and discharge prescriptions for narcotics decreased, according to a recent study. Researchers also found that the return rates for migraines decreased and they speculate that the increased use of non-narcotic medications contributed to this decrease. In this study, they examined a multi-hospital retrospective cohort consisting of consecutive ED patients from January 1, 1999, to September 31, 2014. They examined charts at the beginning and end of the time period and found:
- Of the 2,824,710 total visits, 8046 (0.28%) were for migraine.
- 290 charts (147 in 1999–2000 and 143 in 2014) were reviewed to determine migraine treatments.
- Of the 8046 migraine patients, 624 (8%) returned within 72 hours.
- The return rate decreased from 1999–2000 to 2014 from 12% to 4% (difference = 8%).
Ruzek M, Richman P, Eskin B, Allegra JR. ED treatment of migraine patients has changed. [Published online ahead of print August 20, 2018]. Am J Emerg Med. doi:10.1016/j.ajem.2018.08.051.
Sunscreens: Survey of the Cutis Editorial Board
To improve patient care and outcomes, leading dermatologists from the Cutis Editorial Board answered 5 questions on sunscreens. Here’s what we found.
What sun protection factor (SPF) do you recommend for the majority of your patients?
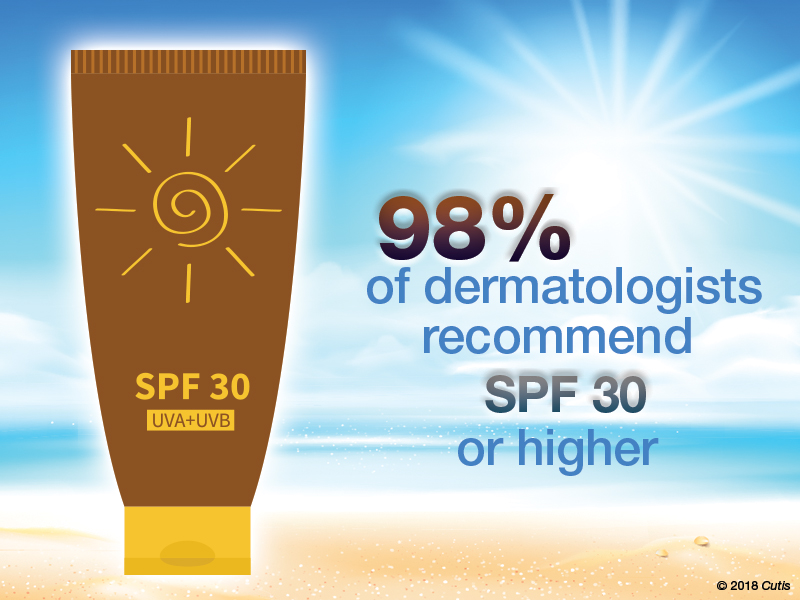
Fifty percent of dermatologists we surveyed recommend SPF 30. SPF 50 was recommended by 26%, SPF 50+ by 21%, and SPF 15 by only 2%.
Expert Commentary
Provided by Shari R. Lipner, MD, PhD (New York, New York)
Half of our Editorial Board recommends sunscreen with SPF 30, with many recommending SPF 50 or higher. This trend toward sunscreens with higher SPF is consistent with a survey-based study with 97% of dermatologists stating they were comfortable recommending sunscreens with an SPF of 50 or higher and 83.3% stating that they believe that high SPF sunscreens provide an additional margin of safety (Farberg et al). These trends are supported by a randomized, double-blind, split-face clinical trial in which participants applied either SPF 50+ or SPF 100+ sunscreen after exposure to natural sunlight. The results showed that SPF 100+ sunscreen was remarkably more effective in protecting against sunburn than SPF 50+ sunscreen in actual use conditions (Williams et al).
Next page: Spray sunscreens
Which patient populations do you feel may benefit from spray sunscreens?
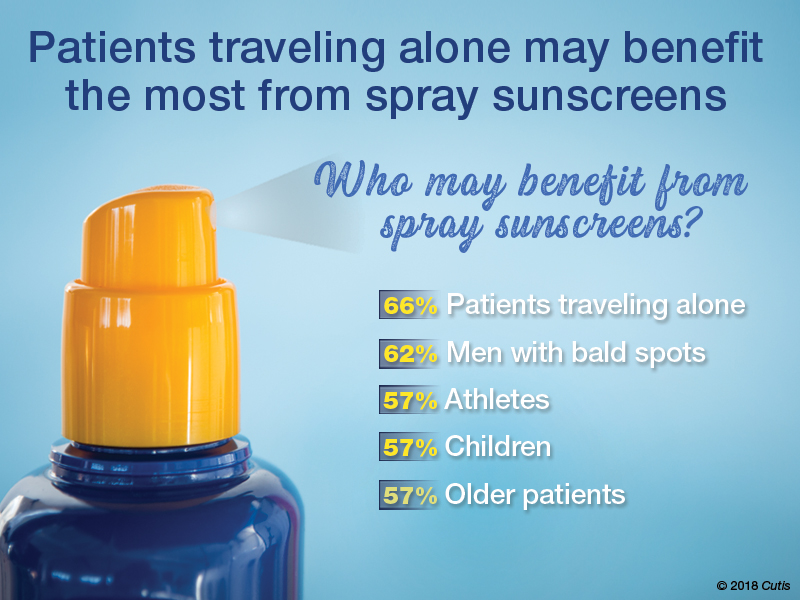
Two-thirds of dermatologists indicated that spray sunscreens may benefit patients traveling alone. Men with bald spots also may benefit (62%), as well as athletes, children, and older patients (57% each).
Expert Commentary
Provided by Shari R. Lipner, MD, PhD (New York, New York)
As dermatologists, we tell our patients that the best sunscreens are ones that are used consistently. Spray sunscreens are likely as effective as lotions (Ou-Yang et al). There has been a clear trend in consumer purchasing of spray sunscreens from 2011 to 2016 (Teplitz et al). Spray sunscreens may benefit those traveling alone, particularly for hard-to-reach areas.
Next page: Supplemental vitamin D
In patients who apply sunscreen regularly, do you recommend supplemental vitamin D3?

More than half (53%) of dermatologists recommend supplemental vitamin D3.
Expert Commentary
Provided by Shari R. Lipner, MD, PhD (New York, New York)
Because use of photoprotection results in decreased vitamin D levels in most individuals, it is good practice to recommend vitamin D supplementation in patients who are applying sunscreen regularly (Bogaczewicz et al).
Next page: Sunscreen compliance
What is the most often heard reason(s) for not using sunscreen in your patients?
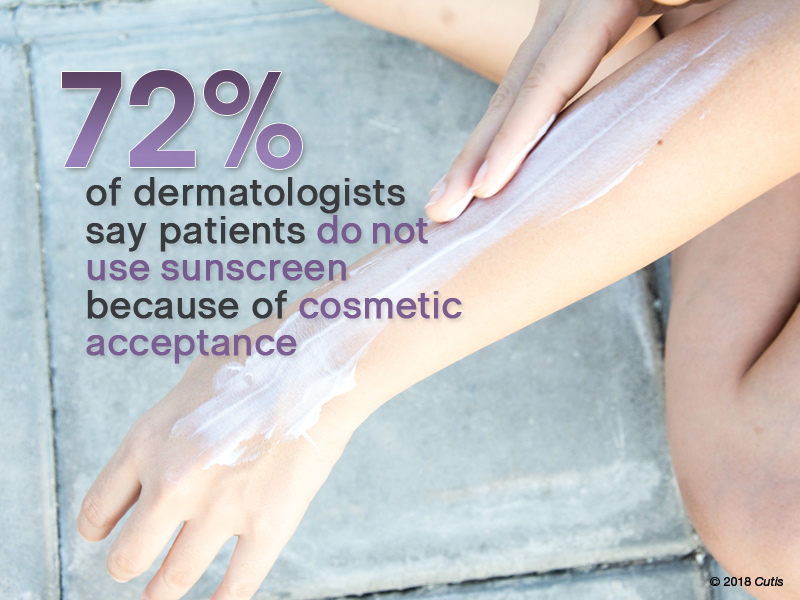
Nearly three-quarters (72%) of dermatologists reported that patients do not use sunscreen because of cosmetic acceptance. Almost one-third (31%) said their patients prefer “natural” products. Price was a factor for 26%. Fewer dermatologists indicated risk of environmental damage (14%), allergy (12%), cancer induction (5%), and hormonal alteration (5%) were reasons patients are not compliant.
Expert Commentary
Provided by Shari R. Lipner, MD, PhD (New York, New York)
Cosmetic acceptance is paramount for patient compliance for sunscreen application. These results from our Editorial Board echo a study on sunscreen product performance and other determinants of consumer preferences, which cited “cosmetic elegance” as an important factor in choosing sunscreens (Xu et al). Dermatologists must stress to patients to find a sunscreen that they find acceptable in terms of vehicle and price to increase compliance.
Next page: Sunscreens in pregnant women
What sunscreens do you recommend to pregnant women and children?
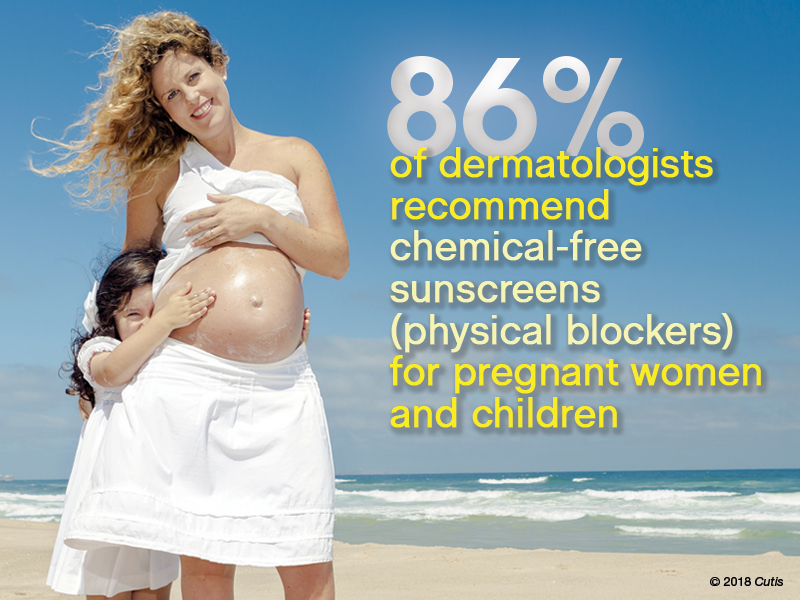
Most dermatologists (86%) recommend physical blockers “chemical-free” only sunscreens to pregnant women and children.
Expert Commentary
Provided by Shari R. Lipner, MD, PhD (New York, New York)
While absorption of sunscreen by human embryos is likely negligible, because there is limited data on sunscreen effects in embryos and children, it is reasonable to recommend physical blockers for pregnant women and children.
Next page: More tips from derms
More Tips From Dermatologists
The dermatologists we polled had the following advice for their peers:
As a dermatologist married to a pediatrician, I try to get my kids to embrace sun-protection strategies. For the little ones it’s hard, but as they have gotten older and been exposed to more derm journals sitting around with pretty graphic pictures, they seem to get on board, even when away at summer camp on their own. If only our patients knew what our kids do.—Joel L. Cohen, MD (Denver, Colorado)
The most important factor in getting patient compliance with sunscreen usage is “cosmetic acceptance.” If they or their children or their spouse don’t like the feel, they won’t use it.—Vincent A. DeLeo, MD (Los Angeles, California)
Not using photoprotection with sunscreen is like crossing a busy road without looking both ways first.—James Q. Del Rosso, DO (Las Vegas, Nevada)
I do not recommend spray sunscreens. At least half of the spray seems to go in the air rather than on the skin. And people often do not rub the spray into their skin well enough. Lotions are better!—Lawrence J. Green, MD (Washington, DC)
The most important factor in sunscreen is not SPF; educate patients on the important role vehicle and sweating play in the length of sun protection.—Orit Markowitz, MD (New York, New York)
Reapplying sunscreen in the appropriate amount is key to blocking the danger rays of the sun.—Vineet Mishra, MD (San Antonio, Texas)
A good sunscreen is the one you put on properly. Regardless of the formulation, make sure you apply the sunscreen evenly to all exposed skin and reapply according to directions on the container. Remember, a regular white T-shirt has minimal SPF 4-5. Either wear sun-protective clothing or wear sunscreen underneath!—Larisa Ravitskiy, MD (Gahanna, Ohio)
Sun protection and sunscreen application go hand-in-hand. We can still enjoy the outdoors without getting excessive UV exposure.—Anthony M. Rossi, MD (New York, New York)
Sunscreens are only part of sun protection. Make sure to reapply them regularly, try to avoid direct sun between about 10 AM and 2 PM if possible, and wear a hat with a wide brim (not a baseball cap, which, after all, is designed for catching baseballs, not sun protection).—Robert I. Rudolph, MD (Wyomissing, Pennsylvania)
Sunscreens keep you younger looking longer!—Richard K. Scher, MD (New York, New York)
The dentist says only floss the teeth you want to keep. I tell patients to only sun block the skin they want to keep.—Daniel M. Siegel, MD, MS (Brooklyn, New York)
The best sunscreen is the one that is used! If it's too greasy or drying, smells bad or stings, it won't be used. Stick to the one YOU like, but at least SPF 30 or better.—Stephen P. Stone, MD, (Springfield, Illinois)
Sunscreen can be a meaningful part of your sun-protection regimen used in conjunction with sun-protective clothing, sun safe behaviors, and a diet rich in natural antioxidants.—Michelle Tarbox, MD (Lubbock, Texas)
About This Survey
The survey was fielded electronically to Cutis Editorial Board Members within the United States from August 2, 2018, to September 2, 2018. A total of 42 usable responses were received.
Bogaczewicz J, Karczmarewicz E, Pludowski P, et al. Requirement for vitamin D supplementation in patients using photoprotection: variations in vitamin D levels and bone formation markers. Int J Dermatol. 2016;55:e176-e183.
Farberg AS, Glazer AM, Rigel AC, et al. Dermatologists’ perceptions, recommendations, and use of sunscreen. JAMA Dermatol. 2017;153:99-101.
Ou-Yang H, Stanfield J, Cole C, et al. High-SPF sunscreens (SPF ≥ 70) may provide ultraviolet protection above minimal recommended levels by adequately compensating for lower sunscreen user application amounts. J Am Acad Dermatol. 2012;67:1220-1227.
Teplitz RW, Glazer AM, Svoboda RM, et al. Trends in US sunscreen formulations: impact of increasing spray usage. J Am Acad Dermatol. 2018;78:187-189.
Williams JD, Maitra P, Atillasoy E, et al. SPF 100+ sunscreen is more protective against sunburn than SPF 50+ in actual use: Results of a randomized, double-blind, split-face, natural sunlight exposure clinical trial. J Am Acad Dermatol. 2018;78:902.e2-910.e2.
Xu S, Kwa M, Agarwal A, et al. Sunscreen product performance and other determinants of consumer preferences. JAMA Dermatol. 2016;152:920-927.
To improve patient care and outcomes, leading dermatologists from the Cutis Editorial Board answered 5 questions on sunscreens. Here’s what we found.
What sun protection factor (SPF) do you recommend for the majority of your patients?
Fifty percent of dermatologists we surveyed recommend SPF 30. SPF 50 was recommended by 26%, SPF 50+ by 21%, and SPF 15 by only 2%.
Expert Commentary
Provided by Shari R. Lipner, MD, PhD (New York, New York)
Half of our Editorial Board recommends sunscreen with SPF 30, with many recommending SPF 50 or higher. This trend toward sunscreens with higher SPF is consistent with a survey-based study with 97% of dermatologists stating they were comfortable recommending sunscreens with an SPF of 50 or higher and 83.3% stating that they believe that high SPF sunscreens provide an additional margin of safety (Farberg et al). These trends are supported by a randomized, double-blind, split-face clinical trial in which participants applied either SPF 50+ or SPF 100+ sunscreen after exposure to natural sunlight. The results showed that SPF 100+ sunscreen was remarkably more effective in protecting against sunburn than SPF 50+ sunscreen in actual use conditions (Williams et al).
Next page: Spray sunscreens
Which patient populations do you feel may benefit from spray sunscreens?
Two-thirds of dermatologists indicated that spray sunscreens may benefit patients traveling alone. Men with bald spots also may benefit (62%), as well as athletes, children, and older patients (57% each).
Expert Commentary
Provided by Shari R. Lipner, MD, PhD (New York, New York)
As dermatologists, we tell our patients that the best sunscreens are ones that are used consistently. Spray sunscreens are likely as effective as lotions (Ou-Yang et al). There has been a clear trend in consumer purchasing of spray sunscreens from 2011 to 2016 (Teplitz et al). Spray sunscreens may benefit those traveling alone, particularly for hard-to-reach areas.
Next page: Supplemental vitamin D
In patients who apply sunscreen regularly, do you recommend supplemental vitamin D3?
More than half (53%) of dermatologists recommend supplemental vitamin D3.
Expert Commentary
Provided by Shari R. Lipner, MD, PhD (New York, New York)
Because use of photoprotection results in decreased vitamin D levels in most individuals, it is good practice to recommend vitamin D supplementation in patients who are applying sunscreen regularly (Bogaczewicz et al).
Next page: Sunscreen compliance
What is the most often heard reason(s) for not using sunscreen in your patients?
Nearly three-quarters (72%) of dermatologists reported that patients do not use sunscreen because of cosmetic acceptance. Almost one-third (31%) said their patients prefer “natural” products. Price was a factor for 26%. Fewer dermatologists indicated risk of environmental damage (14%), allergy (12%), cancer induction (5%), and hormonal alteration (5%) were reasons patients are not compliant.
Expert Commentary
Provided by Shari R. Lipner, MD, PhD (New York, New York)
Cosmetic acceptance is paramount for patient compliance for sunscreen application. These results from our Editorial Board echo a study on sunscreen product performance and other determinants of consumer preferences, which cited “cosmetic elegance” as an important factor in choosing sunscreens (Xu et al). Dermatologists must stress to patients to find a sunscreen that they find acceptable in terms of vehicle and price to increase compliance.
Next page: Sunscreens in pregnant women
What sunscreens do you recommend to pregnant women and children?
Most dermatologists (86%) recommend physical blockers “chemical-free” only sunscreens to pregnant women and children.
Expert Commentary
Provided by Shari R. Lipner, MD, PhD (New York, New York)
While absorption of sunscreen by human embryos is likely negligible, because there is limited data on sunscreen effects in embryos and children, it is reasonable to recommend physical blockers for pregnant women and children.
Next page: More tips from derms
More Tips From Dermatologists
The dermatologists we polled had the following advice for their peers:
As a dermatologist married to a pediatrician, I try to get my kids to embrace sun-protection strategies. For the little ones it’s hard, but as they have gotten older and been exposed to more derm journals sitting around with pretty graphic pictures, they seem to get on board, even when away at summer camp on their own. If only our patients knew what our kids do.—Joel L. Cohen, MD (Denver, Colorado)
The most important factor in getting patient compliance with sunscreen usage is “cosmetic acceptance.” If they or their children or their spouse don’t like the feel, they won’t use it.—Vincent A. DeLeo, MD (Los Angeles, California)
Not using photoprotection with sunscreen is like crossing a busy road without looking both ways first.—James Q. Del Rosso, DO (Las Vegas, Nevada)
I do not recommend spray sunscreens. At least half of the spray seems to go in the air rather than on the skin. And people often do not rub the spray into their skin well enough. Lotions are better!—Lawrence J. Green, MD (Washington, DC)
The most important factor in sunscreen is not SPF; educate patients on the important role vehicle and sweating play in the length of sun protection.—Orit Markowitz, MD (New York, New York)
Reapplying sunscreen in the appropriate amount is key to blocking the danger rays of the sun.—Vineet Mishra, MD (San Antonio, Texas)
A good sunscreen is the one you put on properly. Regardless of the formulation, make sure you apply the sunscreen evenly to all exposed skin and reapply according to directions on the container. Remember, a regular white T-shirt has minimal SPF 4-5. Either wear sun-protective clothing or wear sunscreen underneath!—Larisa Ravitskiy, MD (Gahanna, Ohio)
Sun protection and sunscreen application go hand-in-hand. We can still enjoy the outdoors without getting excessive UV exposure.—Anthony M. Rossi, MD (New York, New York)
Sunscreens are only part of sun protection. Make sure to reapply them regularly, try to avoid direct sun between about 10 AM and 2 PM if possible, and wear a hat with a wide brim (not a baseball cap, which, after all, is designed for catching baseballs, not sun protection).—Robert I. Rudolph, MD (Wyomissing, Pennsylvania)
Sunscreens keep you younger looking longer!—Richard K. Scher, MD (New York, New York)
The dentist says only floss the teeth you want to keep. I tell patients to only sun block the skin they want to keep.—Daniel M. Siegel, MD, MS (Brooklyn, New York)
The best sunscreen is the one that is used! If it's too greasy or drying, smells bad or stings, it won't be used. Stick to the one YOU like, but at least SPF 30 or better.—Stephen P. Stone, MD, (Springfield, Illinois)
Sunscreen can be a meaningful part of your sun-protection regimen used in conjunction with sun-protective clothing, sun safe behaviors, and a diet rich in natural antioxidants.—Michelle Tarbox, MD (Lubbock, Texas)
About This Survey
The survey was fielded electronically to Cutis Editorial Board Members within the United States from August 2, 2018, to September 2, 2018. A total of 42 usable responses were received.
Bogaczewicz J, Karczmarewicz E, Pludowski P, et al. Requirement for vitamin D supplementation in patients using photoprotection: variations in vitamin D levels and bone formation markers. Int J Dermatol. 2016;55:e176-e183.
Farberg AS, Glazer AM, Rigel AC, et al. Dermatologists’ perceptions, recommendations, and use of sunscreen. JAMA Dermatol. 2017;153:99-101.
Ou-Yang H, Stanfield J, Cole C, et al. High-SPF sunscreens (SPF ≥ 70) may provide ultraviolet protection above minimal recommended levels by adequately compensating for lower sunscreen user application amounts. J Am Acad Dermatol. 2012;67:1220-1227.
Teplitz RW, Glazer AM, Svoboda RM, et al. Trends in US sunscreen formulations: impact of increasing spray usage. J Am Acad Dermatol. 2018;78:187-189.
Williams JD, Maitra P, Atillasoy E, et al. SPF 100+ sunscreen is more protective against sunburn than SPF 50+ in actual use: Results of a randomized, double-blind, split-face, natural sunlight exposure clinical trial. J Am Acad Dermatol. 2018;78:902.e2-910.e2.
Xu S, Kwa M, Agarwal A, et al. Sunscreen product performance and other determinants of consumer preferences. JAMA Dermatol. 2016;152:920-927.
Autonomic Dysfunction Greater in PPTH than Migraine
Symptoms of autonomic dysfunction were greatest among those with persistent posttraumatic headaches (PPTH) compared to migraine and healthy controls (HCs), a recent study found. In addition, among individuals with PPTH, number of lifetime traumatic brain injuries (TBIs) was associated with greater symptoms of autonomic dysfunction, while greater headache burden was associated with higher vasomotor domain autonomic dysfunction subscores, potentially indicating that PPTH patients with higher disease burden have an increased risk for having autonomic dysfunction. Individuals with PPTH (n=56) (87.5% of whom had a migraine/probable migraine phenotype), migraine (n=30), and HCs (n=36) were prospectively assessed in this cross‐sectional cohort study using the COMPASS‐31 questionnaire. Total COMPASS‐31 scores and individual domain scores were compared between subject groups. Researchers found:
- COMPASS‐31 mean total weighted score was 37.22 ± 15.44 in the PPTH group, 27.15 ± 14.37 in the migraine group, and 11.67 ± 8.98 for HCs.
- COMPASS‐31 mean weighted total scores were significantly higher in those with PPTH vs migraine, for PPTH vs HCs, and for migraine vs HCs.
Howard L, Dumkrieger G, Chong CD, Ross K, Berisha V, Schwedt TJ. Symptoms of autonomic dysfunction among those with persistent posttraumatic headache attributed to mild traumatic brain injury: A comparison to migraine and healthy controls. [Published online ahead of print August 29, 2018]. Headache. doi:10.1111/head.13396.
What’s in that e-cigarette? It may be cannabis
Nearly 1 in 11 U.S. middle and high school students have used a cannabis product in an e-cigarette, according to a school-based survey of 20,675 students.

The survey found that 8.9% of students in grades 6-12 said they had used an e-cigarette with marijuana, tetrahydrocannabinol or hash oil, or tetrahydrocannabinol wax. Among the students who reported ever using e-cigarettes, 30.6% had used a cannabis product in the device. The findings were published in JAMA Pediatrics.
This translated to around 1.7 million high school students and 425,000 middle school students who had ever used cannabis in e-cigarettes; figures the authors said were consistent with or higher than previous reports among U.S. and Canadian students.
Katrina F. Trivers, PhD, and her colleagues from the Centers for Disease Control and Prevention, noted that the U.S. Surgeon General has found e-cigarette aerosol can contain potentially harmful ingredients. Additionally, the National Academies of Sciences has said youth cannabis use can harm learning and memory.
“Strategies to reduce cannabis use in e-cigarettes are critical for protecting young people from these potential health risks,” the researchers wrote.
Male students and high school students were significantly more likely to report using cannabis products in an e-cigarette (10.6% and 12.4%, respectively), compared with female or middle school students.
Among current users of e-cigarettes, 39.5% reported using cannabis in the e-cigarette, while among those who used other tobacco products, 38.5% used cannabis in e-cigarettes. Higher e-cigarette use was also associated with use of cannabis products in e-cigarettes.
Living with someone who used tobacco products was associated with a higher incidence of cannabis in e-cigarette use (13%). Researchers also saw a higher use of cannabis in e-cigarettes among students of Hispanic ethnicity, compared with other ethnicities.
In 2015, around one-third of U.S. middle and high school students said they had used nonnicotine substances in e-cigarettes, but the use of cannabis in e-cigarettes could increase as several states consider legalizing cannabis sales for adults. “Given the high concurrent use of tobacco and other substances, it is important to monitor the substances youth use in e-cigarettes,” they wrote.
The researchers reported having no financial disclosures.
SOURCE: Trivers KF et al. JAMA Pediatr. 2018 Sep 17. doi: 10.1001/jamapediatrics.2018.1920.
Nearly 1 in 11 U.S. middle and high school students have used a cannabis product in an e-cigarette, according to a school-based survey of 20,675 students.
The survey found that 8.9% of students in grades 6-12 said they had used an e-cigarette with marijuana, tetrahydrocannabinol or hash oil, or tetrahydrocannabinol wax. Among the students who reported ever using e-cigarettes, 30.6% had used a cannabis product in the device. The findings were published in JAMA Pediatrics.
This translated to around 1.7 million high school students and 425,000 middle school students who had ever used cannabis in e-cigarettes; figures the authors said were consistent with or higher than previous reports among U.S. and Canadian students.
Katrina F. Trivers, PhD, and her colleagues from the Centers for Disease Control and Prevention, noted that the U.S. Surgeon General has found e-cigarette aerosol can contain potentially harmful ingredients. Additionally, the National Academies of Sciences has said youth cannabis use can harm learning and memory.
“Strategies to reduce cannabis use in e-cigarettes are critical for protecting young people from these potential health risks,” the researchers wrote.
Male students and high school students were significantly more likely to report using cannabis products in an e-cigarette (10.6% and 12.4%, respectively), compared with female or middle school students.
Among current users of e-cigarettes, 39.5% reported using cannabis in the e-cigarette, while among those who used other tobacco products, 38.5% used cannabis in e-cigarettes. Higher e-cigarette use was also associated with use of cannabis products in e-cigarettes.
Living with someone who used tobacco products was associated with a higher incidence of cannabis in e-cigarette use (13%). Researchers also saw a higher use of cannabis in e-cigarettes among students of Hispanic ethnicity, compared with other ethnicities.
In 2015, around one-third of U.S. middle and high school students said they had used nonnicotine substances in e-cigarettes, but the use of cannabis in e-cigarettes could increase as several states consider legalizing cannabis sales for adults. “Given the high concurrent use of tobacco and other substances, it is important to monitor the substances youth use in e-cigarettes,” they wrote.
The researchers reported having no financial disclosures.
SOURCE: Trivers KF et al. JAMA Pediatr. 2018 Sep 17. doi: 10.1001/jamapediatrics.2018.1920.
FROM JAMA PEDIATRICS
Key clinical point:
Major finding: A survey of U.S. students showed that 8.9% have used cannabis in an e-cigarette. Among e-cigarette users, cannabis use in e-cigarettes was reported by 30.6% of students.
Study details: A school-based survey of 20,675 students.
Disclosures: The researchers reported having no financial disclosures.
Source: Trivers KF et al. JAMA Pediatr. 2018 Sep 17. doi: 10.1001/jamapediatrics.2018.1920.
Metastatic breast cancer lesions immunologically depleted compared with primary
The immune microenvironment of metastatic breast cancer lesions is relatively inert and depleted versus primary tumors, results of a recent study suggest.
“These results predict that immune therapy may be more successful in early stage breast cancers rather than in metastatic disease,” Lajos Pusztai, MD, and study coinvestigators reported in Annals of Oncology.
However, metastatic breast cancers showed high expression levels of some targetable molecules that may provide a “foundation for rational immunotherapy combination strategies,” wrote Dr. Pusztai, director of breast cancer translational research at Yale Cancer Center, New Haven, Conn., and his coinvestigators.
The investigators looked at tumor PD-L1 protein expression, tumor infiltrating lymphocyte (TIL) count, and mRNA expression for 730 immune-related genes in both primary and metastatic cancer samples obtained from pathologists at Yale.
The study included one cohort with full sections of paired metastatic and primary tumors from 45 patients, and a second cohort of tissue microarrays from 55 other patients.
Compared with primary lesions, metastatic lesions had substantially lower levels of PD-L1 expression and TIL counts, the investigators found.
Staining of PD-L1 was primarily seen in stromal immune cells, rather than tumor cells, according to investigators. The median stromal PD-L1 positivity was 14% for metastases and 52% for primary tumors in the first cohort (P = .0004), and 7% for metastases and 22% for primary tumors in the second cohort (P = .03).
They also reported significant decreased TIL counts in metastatic lesions for both the first (P = .026) and second (P = .089) cohorts, the report shows.
Immune gene expression profiling results, similarly, showed that most immune cell types and functions were “depleted” in the metastatic lesions, including a decreased mRNA expression of CTLA4, Dr. Pusztai and his colleagues reported.
The “lesser immunogenicity” of metastatic breast cancer cells was shown by decreased expression of immune proteasome and MHC class I genes, along with increased expression of HLA-E, which has been shown to suppress immunity, and reduced presence of dendritic cells, they said.
However, they also found high expression of targetable molecules in metastatic lesions. Those included macrophage markers such as CD68 and CD163, cytokine ligand/receptor pairs that mediate pro-tumorigenic effects, such as CCL2/CCR2 and CXCR4/CXCL12, and signaling molecules such as STAT-3 and JAK2, among others.
“We suggest that targeting these molecules may lead to synergy with PD1/PD-L1 blockade in metastatic breast cancer,” they wrote.
The work by Dr. Pusztai and his colleagues was supported by the Breast Cancer Research Foundation, Susan G Komen for the Cure, Department of Defense Breast Cancer Research Program Awards, and the Rosztoczy Foundation. The authors declared no conflicts of interest.
SOURCE: Szekely B, et al. Ann Oncol. 2018 Sep 10. doi: 10.1093/annonc/mdy399.
FROM ANNALS OF ONCOLOGY
Key clinical point: The immune microenvironment of metastatic breast cancer lesions is relatively inert and depleted versus primary tumors.
Major finding: Median stromal PD-L1 positivity was 14% for metastases and 52% for primary tumors in one cohort (P = .0004), and 7% versus 22% in a second (P = .03).
Study details: Analysis of breast cancer tissue samples (primary tumor and metastatic lesions) from 90 patients
Disclosures: The work was supported by the Breast Cancer Research Foundation, the Susan Komen for the Cure, Department of Defense Breast Cancer Research Program Awards, and the Rosztoczy Foundation. The study authors declared no conflicts of interest.
Source: Szekely B et al. Ann Oncol. 2018 Sep 10. doi: 10.1093/annonc/mdy399.
Early CAR T data on P-BCMA-101 in refractory myeloma
Early results from a phase 1 trial suggest the chimeric antigen receptor (CAR) T-cell therapy P-BCMA-101 can produce responses in patients with relapsed/refractory multiple myeloma.
All 11 patients treated have experienced some clinical response, with 8 patients achieving a partial response (PR) or better.
The most common adverse events were neutropenia and thrombocytopenia. One patient was suspected to have cytokine release syndrome (CRS), but the condition resolved without use of tocilizumab or steroids.
These results were presented at the 2018 CAR-TCR Summit by Eric Ostertag, MD, PhD, chief executive officer of Poseida Therapeutics Inc., the company developing P-BCMA-101.
Dr. Ostertag presented data on 11 patients with heavily pretreated multiple myeloma. They had a median of six prior therapies. The median age was 60 years, and most of the patients were considered high risk.
Prior to receiving P-BCMA-101, patients received conditioning with fludarabine (30 mg/m2) and cyclophosphamide (300 mg/m2) for 3 days.
Patients were then treated across three dose groups with average CAR T-cell doses of 51 x 106 (n = 3), 152 x 106 (n = 7), and 430 x 106 (n = 1).
As of Aug. 10, 2018, all 11 patients were still on study.
There were no dose-limiting toxicities. Eight patients developed neutropenia, and five had thrombocytopenia.
Researchers suspected CRS in one patient, but the condition resolved without tocilizumab or steroid treatment. There was no neurotoxicity reported, and none of the patients required admission to an intensive care unit.
All patients showed improvement in biomarkers following treatment.
Ten patients were evaluable for response by International Myeloma Working Group criteria. Seven of these patients achieved at least a PR, including very good partial responses (VGPRs) and stringent complete response (CR).
The eleventh patient also responded to treatment, but this patient has oligosecretory disease and was evaluable only by PET. The patient had a near-CR by PET.
Poseida Therapeutics would not disclose additional details regarding how many patients achieved a PR, VGPR, or CR, but the company plans to release more information on response at an upcoming meeting.
“The latest data results show that P-BCMA-101 induces deep responses in a heavily pretreated population with relapsed/refractory multiple myeloma, with some patients reaching VGPR and even stringent CR at early efficacy assessments,” Dr. Ostertag said.
This study (NCT03288493) is funded by the California Institute for Regenerative Medicine and Poseida Therapeutics.
FROM THE 2018 CAR-TCR SUMMIT
Key clinical point: The chimeric antigen receptor .
Major finding: All 11 patients have shown signs of response, and 8 patients achieved a partial response or better.
Study details: Eleven patients have been treated thus far in this phase 1 trial.
Disclosures: This trial is funded by the California Institute for Regenerative Medicine and Poseida Therapeutics.
Nevus of Ota Associated With a Primary Uveal Melanoma and Intracranial Melanoma Metastasis
Nevus of Ota, originally referred to as nevus fusco-caeruleus ophthalmomaxillaris, initially was described in 1939 by Ota and Tanino.1 It is a dermal melanocytic hamartoma arising from incomplete migration of neural crest melanocytes to the epidermis during embryogenesis, resulting in nesting of subtle bands of dendritic melanocytes in the upper dermis. More common in Asians, Native Americans, and females, this hyperpigmented dermatosis most often is unilaterally distributed along the ophthalmic (V1) and maxillary (V2) branches of the trigeminal nerve.2 In some patients, nevus of Ota also is associated with ocular, orbital, and leptomeningeal melanocytosis. Approximately 15% of nevi of Ota have an activating guanine nucleotide-binding protein G(q) subunit alpha (GNAQ) or G protein subunit alpha 11 (GNAQ) mutation; 85% of uveal melanomas harbor one of these mutations.3 Although uncommon, neoplastic transformation with extension or metastasis to the brain has been reported in patients with nevus of Ota.4
We report the case of a 29-year-old woman with a long-standing history of nevus of Ota who presented acutely with an intracranial melanoma as an extension of a primary uveal melanoma.
Case Report
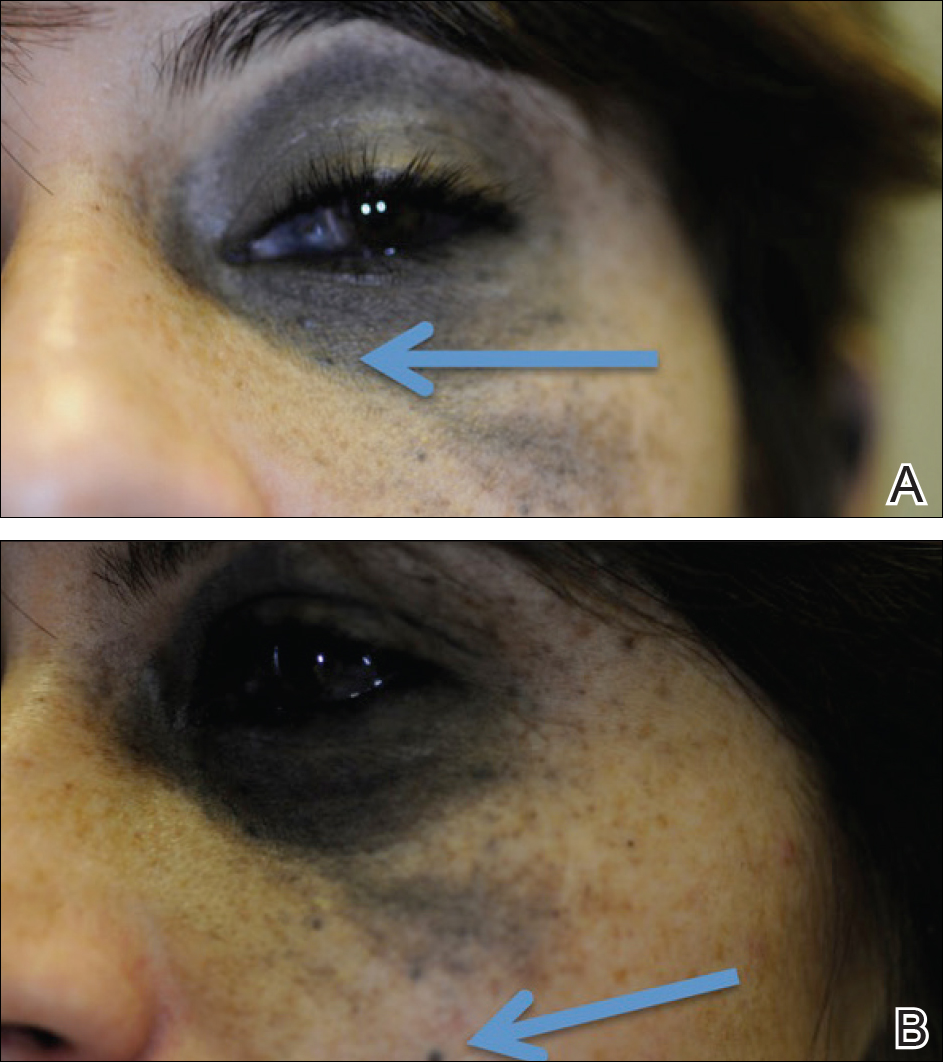
A 29-year-old woman with a history of a nevus of Ota involving the left inner canthus, eyelids, sclera, and superior malar cheek that had been present since birth presented to the emergency department with an acute onset of severe headache, blurred vision, and vomiting. Computed tomography (CT) and magnetic resonance imaging of the brain revealed a hemorrhagic mass in the left frontal lobe. Subsequent frontal craniotomy and resection revealed an intracranial melanoma.
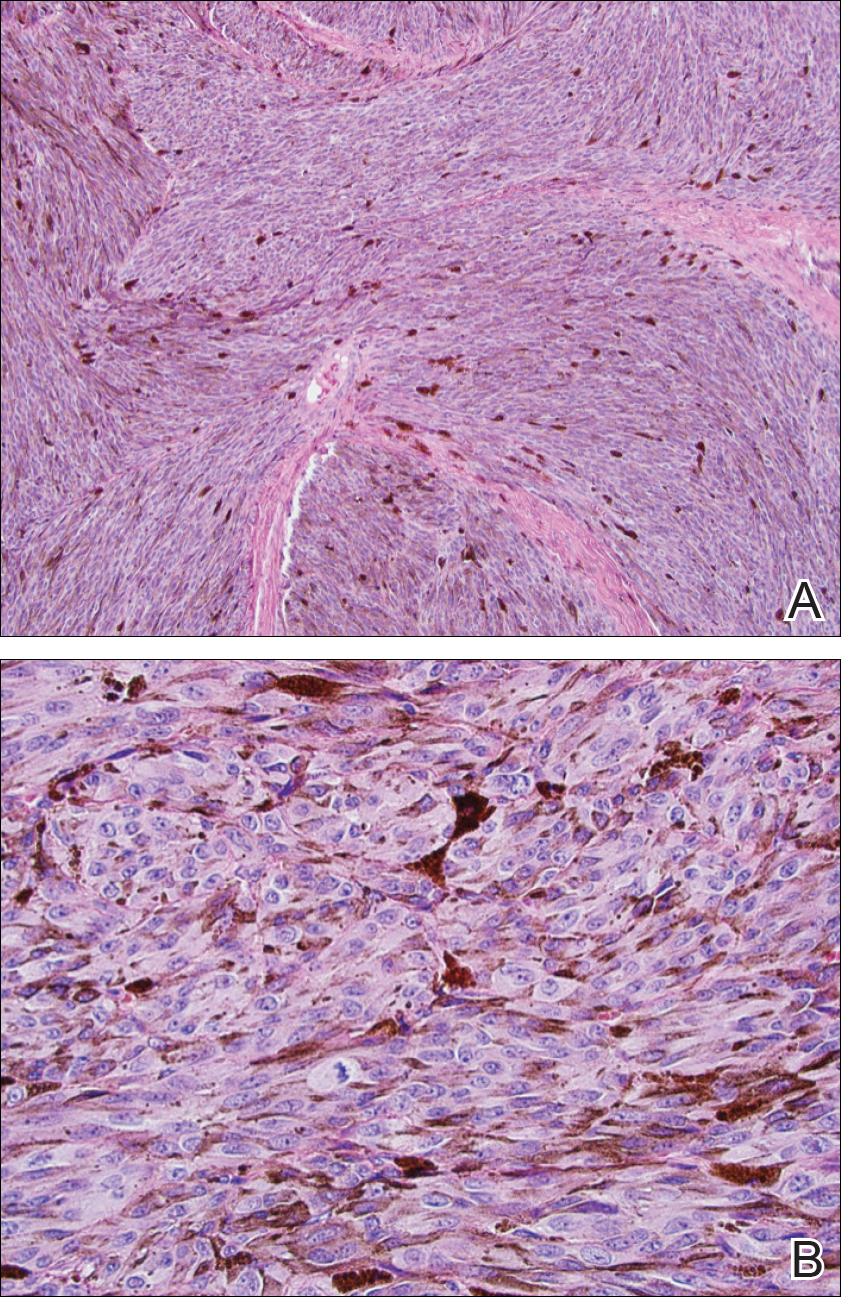
Two weeks following surgery, the patient underwent magnetic resonance imaging and combined positron emission tomography and CT scans that demonstrated a fluorodeoxyglucose-avid left retro-orbital mass. Histopathology of a biopsy from the left retro-orbital mass that had been obtained intraoperatively demonstrated a pigmented, spindled to epithelioid neoplasm with areas of marked atypia and a high mitotic rate that was compatible with malignant melanoma (Figure 1). Intracranial biopsies were sent for genetic study and were found to harbor GNAQ (Q209P) and BRCA1-associated protein 1 (BAP1)(p.P324fs*11) mutations.
The patient was referred to dermatology by neurosurgery for evaluation of a suspected primary cutaneous melanoma.

The patient entered a clinical trial at an outside institution several weeks after initial presentation to our institution for treatment with a mitogen-activated protein kinase MEK1 inhibitor as well as radiation therapy. The patient was lost to follow-up.
Comment
It has been demonstrated that homozygous loss of BAP1, located on the chromosome 3p21.1 locus, allows for progression to metastatic disease in uveal melanoma. The BAP1 gene codes for ubiquitin carboxyl-terminal hydrolase 7, which is involved in the removal of ubiquitin from proteins. This enzyme binds to BRCA1 (BRCA1, DNA repair associated) via the RING (Really Interesting New Gene) finger domain and acts as a tumor suppressor.5 Biallelic BAP1 mutations allow the transition to malignancy in concert with other mutations, such as GNAQ. Identification of a BAP1 mutation may serve as a valuable diagnostic and future therapeutic target in uveal melanoma.
Currently, there are no drugs that directly target mutated GNA11 and GNAQ proteins. Because aberrant GNA11 and GNAQ proteins activate MEK1, several MEK1 inhibitors are being tested with the hope of achieving indirect suppression of GNA11/GNAQ.6
We present a rare case of BAP1 and GNAQ mutations in intracranial melanoma associated with nevus of Ota. Although the uveal melanoma was not confirmed on histopathology, the clear mention of foci within the eye by ophthalmology, positron emission tomography–CT scan showing a fluorodeoxyglucose-avid left retro-orbital mass, and genetic studies of the intracranial biopsies were highly suggestive of a primary uveal melanoma.
Our case highlights the importance of ongoing ocular screening in patients with nevus of Ota, noting the possibility of malignant transformation. Furthermore, patients with nevus of Ota with ocular involvement may benefit from testing of BAP1 protein expression by immunohistochemistry.7 Identification of BAP1 and GNAQ mutations in patients with nevus of Ota place them at markedly higher risk for malignant melanoma. Therefore, dermatologic evaluation of patients with nevus of Ota should include a thorough review of the patient’s history and skin examination as well as referral for ophthalmologic evaluation.
- Ota M, Tanino H. A variety of nevus, frequently encountered in Japan, nevus fusco-caeruleus ophthalmomaxillaris and its relationship to pigmentary changes in the eye. Tokyo Med J. 1939;63:1243-1244.
- Swann PG, Kwong E. The naevus of Ota. Clin Exp Optom. 2010;93:264-267.
- Van Raamsdonk CD, Griewank KG, Crosby MB, et al. Mutations in GNA11 in uveal melanoma [published online November 17, 2010]. N Engl J Med. 2010;363:2191-2199.
- Nitta K, Kashima T, Mayuzumi H, et al. Animal-type malignancy melanoma associated with nevus of Ota in the orbit of a Japanese woman: a case report. Melanoma Res. 2014;24:286-289.
- Harbour JW, Onken MD, Roberson ED, et al. Frequent mutation of BAP1 in metastasizing uveal melanomas [published online November 4, 2010]. Science. 2010;330:1410-1413.
- Chen X, Wu Q, Tan L, et al. Combined PKC and MEK inhibition in uveal melanoma with GNAQ and GNA11 mutations. Oncogene. 2014;33:4724-4734.
- Kalirai H, Dodson A, Faqir S, et al. Lack of BAP1 protein expression in uveal melanoma is associated with increased metastatic risk and has utility in routine prognostic testing [published online July 24, 2010]. Br J Cancer. 2014;111:1373-1380.
Nevus of Ota, originally referred to as nevus fusco-caeruleus ophthalmomaxillaris, initially was described in 1939 by Ota and Tanino.1 It is a dermal melanocytic hamartoma arising from incomplete migration of neural crest melanocytes to the epidermis during embryogenesis, resulting in nesting of subtle bands of dendritic melanocytes in the upper dermis. More common in Asians, Native Americans, and females, this hyperpigmented dermatosis most often is unilaterally distributed along the ophthalmic (V1) and maxillary (V2) branches of the trigeminal nerve.2 In some patients, nevus of Ota also is associated with ocular, orbital, and leptomeningeal melanocytosis. Approximately 15% of nevi of Ota have an activating guanine nucleotide-binding protein G(q) subunit alpha (GNAQ) or G protein subunit alpha 11 (GNAQ) mutation; 85% of uveal melanomas harbor one of these mutations.3 Although uncommon, neoplastic transformation with extension or metastasis to the brain has been reported in patients with nevus of Ota.4
We report the case of a 29-year-old woman with a long-standing history of nevus of Ota who presented acutely with an intracranial melanoma as an extension of a primary uveal melanoma.
Case Report
A 29-year-old woman with a history of a nevus of Ota involving the left inner canthus, eyelids, sclera, and superior malar cheek that had been present since birth presented to the emergency department with an acute onset of severe headache, blurred vision, and vomiting. Computed tomography (CT) and magnetic resonance imaging of the brain revealed a hemorrhagic mass in the left frontal lobe. Subsequent frontal craniotomy and resection revealed an intracranial melanoma.
Two weeks following surgery, the patient underwent magnetic resonance imaging and combined positron emission tomography and CT scans that demonstrated a fluorodeoxyglucose-avid left retro-orbital mass. Histopathology of a biopsy from the left retro-orbital mass that had been obtained intraoperatively demonstrated a pigmented, spindled to epithelioid neoplasm with areas of marked atypia and a high mitotic rate that was compatible with malignant melanoma (Figure 1). Intracranial biopsies were sent for genetic study and were found to harbor GNAQ (Q209P) and BRCA1-associated protein 1 (BAP1)(p.P324fs*11) mutations.
The patient was referred to dermatology by neurosurgery for evaluation of a suspected primary cutaneous melanoma.
The patient entered a clinical trial at an outside institution several weeks after initial presentation to our institution for treatment with a mitogen-activated protein kinase MEK1 inhibitor as well as radiation therapy. The patient was lost to follow-up.
Comment
It has been demonstrated that homozygous loss of BAP1, located on the chromosome 3p21.1 locus, allows for progression to metastatic disease in uveal melanoma. The BAP1 gene codes for ubiquitin carboxyl-terminal hydrolase 7, which is involved in the removal of ubiquitin from proteins. This enzyme binds to BRCA1 (BRCA1, DNA repair associated) via the RING (Really Interesting New Gene) finger domain and acts as a tumor suppressor.5 Biallelic BAP1 mutations allow the transition to malignancy in concert with other mutations, such as GNAQ. Identification of a BAP1 mutation may serve as a valuable diagnostic and future therapeutic target in uveal melanoma.
Currently, there are no drugs that directly target mutated GNA11 and GNAQ proteins. Because aberrant GNA11 and GNAQ proteins activate MEK1, several MEK1 inhibitors are being tested with the hope of achieving indirect suppression of GNA11/GNAQ.6
We present a rare case of BAP1 and GNAQ mutations in intracranial melanoma associated with nevus of Ota. Although the uveal melanoma was not confirmed on histopathology, the clear mention of foci within the eye by ophthalmology, positron emission tomography–CT scan showing a fluorodeoxyglucose-avid left retro-orbital mass, and genetic studies of the intracranial biopsies were highly suggestive of a primary uveal melanoma.
Our case highlights the importance of ongoing ocular screening in patients with nevus of Ota, noting the possibility of malignant transformation. Furthermore, patients with nevus of Ota with ocular involvement may benefit from testing of BAP1 protein expression by immunohistochemistry.7 Identification of BAP1 and GNAQ mutations in patients with nevus of Ota place them at markedly higher risk for malignant melanoma. Therefore, dermatologic evaluation of patients with nevus of Ota should include a thorough review of the patient’s history and skin examination as well as referral for ophthalmologic evaluation.
- Ota M, Tanino H. A variety of nevus, frequently encountered in Japan, nevus fusco-caeruleus ophthalmomaxillaris and its relationship to pigmentary changes in the eye. Tokyo Med J. 1939;63:1243-1244.
- Swann PG, Kwong E. The naevus of Ota. Clin Exp Optom. 2010;93:264-267.
- Van Raamsdonk CD, Griewank KG, Crosby MB, et al. Mutations in GNA11 in uveal melanoma [published online November 17, 2010]. N Engl J Med. 2010;363:2191-2199.
- Nitta K, Kashima T, Mayuzumi H, et al. Animal-type malignancy melanoma associated with nevus of Ota in the orbit of a Japanese woman: a case report. Melanoma Res. 2014;24:286-289.
- Harbour JW, Onken MD, Roberson ED, et al. Frequent mutation of BAP1 in metastasizing uveal melanomas [published online November 4, 2010]. Science. 2010;330:1410-1413.
- Chen X, Wu Q, Tan L, et al. Combined PKC and MEK inhibition in uveal melanoma with GNAQ and GNA11 mutations. Oncogene. 2014;33:4724-4734.
- Kalirai H, Dodson A, Faqir S, et al. Lack of BAP1 protein expression in uveal melanoma is associated with increased metastatic risk and has utility in routine prognostic testing [published online July 24, 2010]. Br J Cancer. 2014;111:1373-1380.
Practice Points
- Nevus of Ota is a hyperpigmented dermatosis that typically is distributed along the ophthalmic (V1) and maxillary (V2) branches of the trigeminal nerve.
- GNAQ and BAP1 mutations in patients with nevus of Ota confer a greater risk for malignant melanoma and metastatic progression.
- Ongoing ophthalmologic screening is paramount in patients with nevus of Ota and may prevent devastating sequelae.
Value-based sleep: understanding and maximizing value in sleep medicine care
In addition to well-documented health consequences, obstructive sleep apnea (OSA) is associated with substantial economic costs borne by patients, payers, employers, and society at large. For example, in a recent white paper commissioned by the American Academy of Sleep Medicine, the total societal-level costs of OSA were estimated to exceed $150 billion per year in the United States alone. In addition to direct costs associated with OSA diagnosis and treatment, indirect costs were estimated at $86.9 billion for lost workplace productivity; $30 billion for increased health-care utilization (HCU); $26.2 billion for motor vehicle crashes (MVC); and $6.5 billion for workplace accidents and injuries.1
More important, evidence suggests that OSA treatments provide positive economic impact, for example reducing health-care utilization and reducing days missed from work. Our group at the University of Maryland is currently heavily involved in related research examining the health economic impact of sleep disorders and their treatments.
Value-based sleep is a concept that I created several years ago to guide a greater emphasis on health economic outcomes in order to advance our field. In addition to working with payers, industry partners, employers, and forward-thinking startups, we are investing much effort into provider education regarding the health economic aspects of sleep. This article examines what value-based sleep is, how to increase the value of sleep in your practice setting, and steps to prepare for payment models of the future.
Value is in the eye of the beholder
Unlike sleep medicine providers (and some patients), the majority of society views sleep as means to an end and not as an end-in-itself. That is, people only value sleep insofar as sleep will help them achieve their primary objectives, whatever they might be. In health economic terms, these distinct viewpoints are referred to as perspectives. For example, from the patient perspective, sleep is valued to the extent that it helps to increase quality of life. From the payer perspective, sleep is valued to the extent that reduces health-care utilization. From the employer perspective, sleep is valued to the extent that it increases workplace productivity and reduces health-care expenses. Table 1 summarizes common stakeholders and perspectives in sleep medicine.
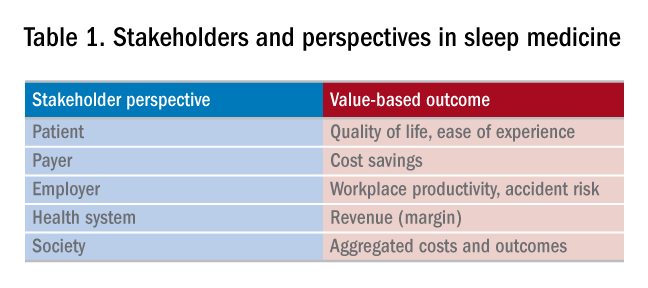
Speaking the language of value
In order to define, demonstrate, and maximize the perceived value of sleep medicine services, sleep physicians must understand and clearly articulate the values of these multiple constituents. Most important, this means that sleep physicians must move beyond discussing the apnea-hypopnea index (AHI). To be clear, no one other than sleep medicine insiders care about the AHI! Of course, the AHI is an important (albeit imperfect) measure of OSA disease severity and treatment outcomes. However, when was the last time that a patient told you they woke up one morning dreaming about a lower AHI? It simply does not happen. Instead, stakeholders care about outcomes that matters to them, from their own unique perspectives. To speak directly to these interests and frame the value of sleep, sleep medicine providers must methodically develop value propositions with each unique target constituency in mind. Speak the language of your audience, and use terms that matter to them.
Adopting value-based payments
Much has been spoken about a transition from fee-for-service to value-based care in medicine. New health-care business models will soon impact patients, providers, payers, and health systems. To guide and ensure sustainable change, multi-stakeholder organizations, such as the Health Care Payment & Learning Action Network, are heavily engaged in the development and implementation of alternate payment models (APMs) to facilitate the transition from fee-for-service to population health. As depicted in Figure 1, sequential steps toward value-based care include increased fees corresponding to improved outcomes. A reimbursement model that is fully value-based centers on shared financial risks. Although private practitioners may be ill-equipped to provide population-level services or negotiate fully value-based models, sleep medicine providers should do well to increase familiarity with APMs and their impact on primary and specialty care services. 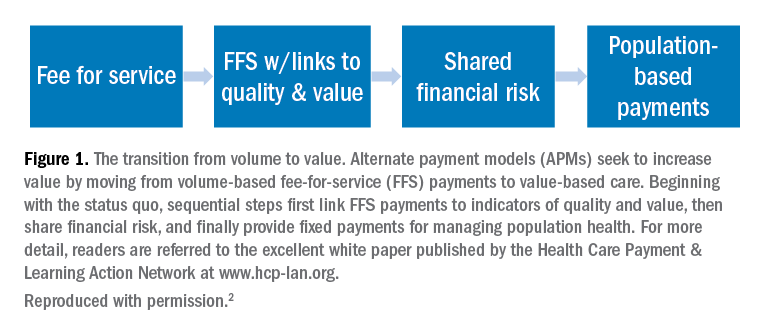
Five steps to a value-based approach
In the modern health-care climate of increasing costs on the one hand and limited resources on the other, sleep medicine providers must embrace a value-based perspective to survive, thrive, and grow in a new world of value-based care. This will require sleep medicine providers to learn, adapt, and adjust. The good news is that regardless of your practice or organizational setting, these strategies and tactics will help guide you:
1. Know thyself. What are your personal and organization objectives? Where are you, career-wise? Where do you want to be in 2, 3, and 5 years?
2. Know your customer. Whom do you serve? More broadly, whom does sleep serve? Listen carefully and identify the outcomes that matter to your constituents. Make these your endpoints.
3. Develop customer-centric language. Develop scripts. Rehearse them.
4. Understand trends in payments and technology. Is your region adopting bundled payments or paying more for improved outcomes? How might telemedicine or preauthorization for PAP impact your practice?
5. Know your numbers. To negotiate with confidence, you need to know your numbers. What are your costs per patient, per test, per outcome, and lifetime value of the patient?
Summary and next steps
To survive and thrive in a value-based future, you need to define, demonstrate, and maximize your perceived value. This will require greater attention to the language that you use, the results that you emphasize, and the data that you use to make decisions, all while attending to the perspectives of diverse stakeholders. The need for sleep medicine services has never been greater. Adopt a value-based sleep approach to ensure your bright future.
References
1. American Academy of Sleep M. Hidden health crisis costing America billions. Underdiagnosing and undertreating obstructive sleep apnea draining healthcare system. Mountain View, CA: Frost & Sullivan; 2016.
2. Wickwire EM, Verma T. Value and payment in sleep medicine. J Clin Sleep Med. 2018;14(5):881-884.
Dr. Wickwire is Associate Professor of Psychiatry and Medicine at the University of Maryland School of Medicine, where he directs the insomnia program. His current research interests include health and economic consequences of sleep disorders and their treatments and targeting sleep treatments for specific populations.
In addition to well-documented health consequences, obstructive sleep apnea (OSA) is associated with substantial economic costs borne by patients, payers, employers, and society at large. For example, in a recent white paper commissioned by the American Academy of Sleep Medicine, the total societal-level costs of OSA were estimated to exceed $150 billion per year in the United States alone. In addition to direct costs associated with OSA diagnosis and treatment, indirect costs were estimated at $86.9 billion for lost workplace productivity; $30 billion for increased health-care utilization (HCU); $26.2 billion for motor vehicle crashes (MVC); and $6.5 billion for workplace accidents and injuries.1
More important, evidence suggests that OSA treatments provide positive economic impact, for example reducing health-care utilization and reducing days missed from work. Our group at the University of Maryland is currently heavily involved in related research examining the health economic impact of sleep disorders and their treatments.
Value-based sleep is a concept that I created several years ago to guide a greater emphasis on health economic outcomes in order to advance our field. In addition to working with payers, industry partners, employers, and forward-thinking startups, we are investing much effort into provider education regarding the health economic aspects of sleep. This article examines what value-based sleep is, how to increase the value of sleep in your practice setting, and steps to prepare for payment models of the future.
Value is in the eye of the beholder
Unlike sleep medicine providers (and some patients), the majority of society views sleep as means to an end and not as an end-in-itself. That is, people only value sleep insofar as sleep will help them achieve their primary objectives, whatever they might be. In health economic terms, these distinct viewpoints are referred to as perspectives. For example, from the patient perspective, sleep is valued to the extent that it helps to increase quality of life. From the payer perspective, sleep is valued to the extent that reduces health-care utilization. From the employer perspective, sleep is valued to the extent that it increases workplace productivity and reduces health-care expenses. Table 1 summarizes common stakeholders and perspectives in sleep medicine.
Speaking the language of value
In order to define, demonstrate, and maximize the perceived value of sleep medicine services, sleep physicians must understand and clearly articulate the values of these multiple constituents. Most important, this means that sleep physicians must move beyond discussing the apnea-hypopnea index (AHI). To be clear, no one other than sleep medicine insiders care about the AHI! Of course, the AHI is an important (albeit imperfect) measure of OSA disease severity and treatment outcomes. However, when was the last time that a patient told you they woke up one morning dreaming about a lower AHI? It simply does not happen. Instead, stakeholders care about outcomes that matters to them, from their own unique perspectives. To speak directly to these interests and frame the value of sleep, sleep medicine providers must methodically develop value propositions with each unique target constituency in mind. Speak the language of your audience, and use terms that matter to them.
Adopting value-based payments
Much has been spoken about a transition from fee-for-service to value-based care in medicine. New health-care business models will soon impact patients, providers, payers, and health systems. To guide and ensure sustainable change, multi-stakeholder organizations, such as the Health Care Payment & Learning Action Network, are heavily engaged in the development and implementation of alternate payment models (APMs) to facilitate the transition from fee-for-service to population health. As depicted in Figure 1, sequential steps toward value-based care include increased fees corresponding to improved outcomes. A reimbursement model that is fully value-based centers on shared financial risks. Although private practitioners may be ill-equipped to provide population-level services or negotiate fully value-based models, sleep medicine providers should do well to increase familiarity with APMs and their impact on primary and specialty care services.
Five steps to a value-based approach
In the modern health-care climate of increasing costs on the one hand and limited resources on the other, sleep medicine providers must embrace a value-based perspective to survive, thrive, and grow in a new world of value-based care. This will require sleep medicine providers to learn, adapt, and adjust. The good news is that regardless of your practice or organizational setting, these strategies and tactics will help guide you:
1. Know thyself. What are your personal and organization objectives? Where are you, career-wise? Where do you want to be in 2, 3, and 5 years?
2. Know your customer. Whom do you serve? More broadly, whom does sleep serve? Listen carefully and identify the outcomes that matter to your constituents. Make these your endpoints.
3. Develop customer-centric language. Develop scripts. Rehearse them.
4. Understand trends in payments and technology. Is your region adopting bundled payments or paying more for improved outcomes? How might telemedicine or preauthorization for PAP impact your practice?
5. Know your numbers. To negotiate with confidence, you need to know your numbers. What are your costs per patient, per test, per outcome, and lifetime value of the patient?
Summary and next steps
To survive and thrive in a value-based future, you need to define, demonstrate, and maximize your perceived value. This will require greater attention to the language that you use, the results that you emphasize, and the data that you use to make decisions, all while attending to the perspectives of diverse stakeholders. The need for sleep medicine services has never been greater. Adopt a value-based sleep approach to ensure your bright future.
References
1. American Academy of Sleep M. Hidden health crisis costing America billions. Underdiagnosing and undertreating obstructive sleep apnea draining healthcare system. Mountain View, CA: Frost & Sullivan; 2016.
2. Wickwire EM, Verma T. Value and payment in sleep medicine. J Clin Sleep Med. 2018;14(5):881-884.
Dr. Wickwire is Associate Professor of Psychiatry and Medicine at the University of Maryland School of Medicine, where he directs the insomnia program. His current research interests include health and economic consequences of sleep disorders and their treatments and targeting sleep treatments for specific populations.