User login
Evaluation of the Mantram Repetition Program for Health Care Providers
According to the National Institute for Occupational Safety and Health (NIOSH), stress is a major problem for more than 18 million US health care workers (HCWs).1 Increases in technology, high patient acuity, and new demands for meeting institutional benchmarks create stressful clinical work environments. HCWs at the US Department of Veterans Affairs (VA) are perhaps at particular risk of experiencing burnout due to the unique needs of VA patients and bureaucratic demands.2 Stress may lead to depression, decreased job satisfaction, and other psychological distress among HCWs.3 This, in turn, affects the delivery of care. High levels of burnout have been associated with increased medication errors, lower quality of care, and lower patient satisfaction scores.4-10
A Cochrane Review found that mental and physical relaxation reduce stress in HCWs.11 Among these, meditative interventions (eg, mindfulness, meditation, yoga) have demonstrated promise.12-14 Results from a systematic meta-analysis of meditative interventions for HCWs indicated small-to-moderate improvements in emotional exhaustion, sense of personal accomplishment, and life satisfaction. Additional research is needed to determine effects of meditative interventions on burnout and caregiver burden.15
Unfortunately, many meditative intervention programs are lengthy and require a significant investment of time. They also require some form of sitting meditation every day, placing additional demands on busy HCWs. There remains a need for practical strategies to reduce HCW stress that are easier to master and practice.
Background
We developed, implemented, evaluated, and modified an evidence-based meditative intervention called the Mantram Repetition Program (MRP) to address workplace stress and burnout. The MRP is a mind-body, spiritually enhanced intervention that offers benefits similar to other types of meditative interventions.16 MRP is composed of 3 primary components: (1) silently repeating a self-selected, meaningful word or phrase (here called a mantram); (2) intentionally slowing down thoughts and behaviors; and (3) developing the ability to focus on a single task at a time (ie, one-pointed attention). The MRP does not require participants to set aside a specific place to practice, and mantram repetition can be initiated intermittently and privately throughout the day (eg, between tasks, while walking or waiting). Examples of 4 sessions (eg, Mantram 1, 2, 3, and 4) can be found on the PsychArmor Institute website (www.psycharmor.org; San Diego, CA).
Initially, the MRP was offered in a group format, in 6 or 8 weekly, 90-minute face-to-face sessions to both patient and nonpatient populations. Studies in veterans with chronic diseases demonstrated improvements in perceived stress, anxiety, and anger, and increased levels of spiritual well-being and quality of life (QOL).17-19 Veterans with posttraumatic stress disorder (PTSD) reported improvements in PTSD symptoms, QOL, and spiritual well-being.20-23 Family caregivers of veterans with dementia reported significant reductions in caregiver burden, depression, and anxiety after participating in the MRP.24
Similar results have substantiated the effects of the MRP among HCWs, including reductions in perceived stress, stress of conscience (ie, the conflict that results from competing values and behaviors in the workplace), and burnout.25-27 HCWs also reported improvements in mindfulness and spiritual well-being.28 In a randomized controlled trial, South Korean nurse managers who completed the MRP demonstrated significant improvements in psychosocial and spiritual well-being and leadership practice and experienced reductions in burnout compared with that of the control group.27 In a qualitative study, the most frequently reported benefits of the MRP were improvements in managing symptoms of stress, anxiety, and feeling out of control.18
HCWs reported they found it difficult to attend the 8-week MRP face-to-face group classes. Therefore, we developed a shorter online version of the MRP consisting of six 1-hour educational sessions: 4 online self-learning modules, and 2 live meeting webinars with the course facilitator.28 VA employees were invited to enroll in the program from June 2013 through 2016 through group e-mails and announcements in the VA Employee Education Service newsletters. Those eligible to participate could earn up to 6 hours of continuing education.
Although the program was generally well accepted, feedback from HCWs indicated that providers still lacked enough time to participate fully. We therefore condensed the MRP into one 90-minute, videotaped webinar entitled “Mind-Body-Spiritual Strategies for a Healthy Workforce: The Mantram Repetition Program.” The webinar was delivered in real time in June 2013 and archived for viewing later. This condensed course provided an overview of the development, theory, and practice of MRP core components. Specific instructions included how to choose and use a mantram; the importance of acting slowly with intention to avoid mistakes; and ways of developing single-pointed attention. Participants were invited to complete a standard course evaluation using an online survey.
This article presents results from qualitative analyses of participant feedback for the condensed MRP in a nationwide sample of more than 1,700 HCWs within the VA. We used template summary analysis to identify themes in participants’ responses to 2 open-ended questions: “What about this learning activity was most useful to you?” and “What about this learning activity was least useful to you?” These results have implications for reducing HCW stress and developing training programs for HCWs.
Analysis
Responses to the what was most useful question were downloaded to a spreadsheet file for analyses. Investigators chose summary template analysis, a rapid qualitative analytic technique, as the best strategy for analyzing these textual data. This technique is often used in health services research when it is unrealistic to use more time-consuming qualitative methods, such as coding.29
To begin, the analyst, a PhD-level anthropologist, read through the feedback to identify similar words, phrases, and/or concepts (ie, themes). Once the analyst gained a sense of general themes, she developed category labels using verbatim words and/or phrases in the feedback (similar to developing in vivo codes.30 She listed these categories at the top of a summary template document, providing a definition for each to ensure analytic rigor.
Next, each category was listed down the left side of the template. Participant feedback was copied and pasted from the spreadsheet form into the appropriate category for each of 200 responses. The investigator identified subthemes within each category. After analysis was completed for the first 200 course participants, the analyst grouped similar categories together into broader domains to further organize the data. She then read through the feedback from the remaining 917 course participants to identify negative cases (ie, dissimilarities in feedback). An additional researcher familiar with the condensed MRP training then examined the categories and domains. Together, they discussed and resolved any inconsistencies in interpretation of the data.
To get a better sense of the full range of perspectives about the training, the analyst then read through the written feedback for the what was least useful question. She scanned the feedback for negative cases that contradicted template findings and noted these in a document. A more balanced evaluation of the course emerged through this secondary analysis.
Results
Online surveys were completed by 1,117 participants, of which three-quarters (841) were female. Two hundred eleven (19%) viewed the condensed MRP in real time. The remaining participants viewed an online video of the course. Anonymous course evaluations captured only gender and professional classification of participants. Participants represented a wide range of professional roles. The majority (63%) held clinical positions with direct patient care. The next largest category included administrative or health information personnel (21%). There were also students and trainees among these categories.
Qualitative Findings
Feedback about the course was organized into categories during analysis: (1) instructional format; (2) mode of delivery; (3) course content; (4) professional and personal empowerment; (5) religion and spirituality; and (6) ease of mantram practice. These categories represented 2 broad domains: feedback about the course and feedback about the intervention.
Instructional Format
HCWs often reported that the most useful aspect of the course was the instructional format. Most cited the ease with which they could understand the materials and helpfulness of the examples of mantram practice. The option to download course materials for later reference was also useful. Some HCWs indicated that the course could have been improved by incorporating an experiential component in which participants paused to practice a mantram.
Mode of Delivery
Delivery mode including the convenience of the training and the flexibility of having the course available at both work and home was mentioned in the feedback. Some HCWs reported that the most useful aspect of the training was the on-demand feature, which allowed them to stop and restart the program as needed. A few, however, referenced technical difficulties with the webinar.
Content
HCWs also indicated that general information about mantram repetition and information regarding the benefits of the intervention (eg, stress reduction) were useful. The scientific basis of mantram was described as useful by some, though others reported it as least useful. Practical guidance regarding the appropriate time and place to practice a mantram as well as concrete information regarding how to select a mantram was mentioned as the most useful by other participants.
Professional and Personal Empowerment
Professional and personal empowerment was referenced in evaluations. Professional development, such as learning a strategy for enhancing work performance, was reported as positive. HCWs also reported that learning a new strategy for self-care and coping with stress was useful. Some described having experienced a sense of validation by participating in the course that was empowering. Finally, some HCWs indicated the personal growth experienced as the most useful.
Religion and Spirituality
General statements regarding the utility of having learned a spiritually-based practice that crossed religious boundaries as well as general references to the power of prayer were listed in the feedback. Other HCWs indicated the usefulness of having learned that a mantram could be secular.
Ease of Mantram
HCWs referenced the ease with which a mantram can be learned and/or practiced. Course participants described the simplicity of mantram repetition and referenced its portability (ie, it can be practiced in many different settings). Finally, the overall flexibility of mantram practice of where and when it can be performed was also described as useful.
Discussion
Qualitative feedback from participant evaluations of a 90-minute, virtual online MRP course suggests that HCWs representing all areas of care are interested in learning practical strategies for managing workplace stress. Participants overwhelmingly perceived mantram practice as feasible to implement, with the portability of mantram repetition described as particularly useful. This aspect of mantram repetition represents a distinct advantage over meditative interventions that require a dedicated space and time in which to practice (eg, yoga postures, sitting meditation).
These preliminary findings also suggest that mantram practice is acceptable to HCWs representing a variety of roles. Participants indicated that they valued learning a meditative practice that can be interpreted as spiritual or secular, depending on the word or phrase chosen. Only 1 participant reported that the practice of mantram conflicted with his/her personal beliefs. A small minority of participants who found the discussion of spirituality disconcerting nevertheless indicated that the intervention was acceptable to them.
The finding that even a 90-minute course was challenging for some HCWs to accommodate speaks to the importance of developing short-duration stress-reduction programs. The standardized Mindfulness Based Stress Reduction (MBSR) program consists of 8 weekly 2.5-hour sessions and a full-day retreat for an overall commitment of 29 to 33 hours.31 Additionally, a systematic review of meditative interventions for informal and professional caregivers found that programs ranged from 4 to 8 weeks.15 These lengthier programs are likely more challenging than the condensed MRP.
These results also suggest the importance of general guidelines for meditative intervention courses for reducing HCW stress. The mode of delivery should be as flexible as possible, allowing course participants to start, stop, and restart the program as needed and to participate from a location most convenient to them. Although presenting evidence for clinical effectiveness is critical for establishing credibility, statistical data should be briefly summarized. An experiential component in which participants are encouraged to practice the intervention will enhance learning and ensure the translation of knowledge into practice. Finally, framing meditative practices as compatible with many different faiths and/or secular will enhance their acceptability.
Three recommended components of an overall strategy for reducing occupational burnout in health care settings include modifying the organizational structure and work processes, improving the fit between the organization and HCWs, and promoting and allowing time for individuals to learn strategies for coping with work-related stress.32 This 90-minute online MRP course represents an aspect of an overall strategy to reduce HCW stress and burnout. Providing opportunities for HCWs to learn strategies for managing stress could enhance the quality of care and improve patient outcomes. Future pragmatic trials could determine whether mantram practice impacts clinical care at the VA and elsewhere.
Limitations
All participants were self-selected; therefore, the findings may be biased favorably toward the intervention. These qualitative analyses are not generalizable. HCWs in other, non-VA settings might have different needs and/or stressors that should be considered in future program development. If this intervention is offered to a wider audience, then other formats ought to be offered, such as print, at-home recordings, live meeting, and face-to-face.
Conclusion
Course participants reported that the condensed 90-minute virtual MRP was convenient to complete. They described the intervention as flexible and easy to learn. Participants indicated that they intended to implement what they learned in the course to reduce work-related stress. This feedback can be used to recommend guidelines for developing meditative interventions aimed at reducing stress in HCWs.
Acknowledgments
This material is based on work supported by the US Department of Veterans Affairs (VA), VA Employee Education Service and with resources from the VA San Diego Healthcare System and the VA Center for Mental Healthcare & Outcomes Research, South Central Mental Illness Research, Education, and Clinical Center at the Central Arkansas Veterans Healthcare System.
1. Centers for Disease Control and Prevention, National Institute for Occupational Safety and Health (NIOSH). Workplace safety and health topic: health care workers. http://www.cdc.gov/niosh/topics/healthcare. Updated May 9, 2018. Accessed April 8, 2019.
2. Voss Horrell SC, Holohan DR, Didion LM, Vance GT. Treating traumatized OEF/OIF veterans: how does trauma treatment affect the clinician? Prof Psychol Res Pract. 2011;42(1):79-86.
3. Centers for Disease Control and Prevention, National Institute for Occupational Safety and Health. Exposure to stress: occupational hazards in hospitals. http://www.cdc.gov/niosh/docs/2008-136/default.html. Published July 2008. Accessed April 9, 2019.
4. Fahrenkopf AM, Sectish TC, Barger LK. Rates of medication errors among depressed and burnt out residents: prospective cohort study. BMJ. 2008;336(7642):488-491.
5. Melnyk BM, Orsolini L, Tan A, et al. A national study links nurses’ physical and mental health to medical errors and perceived worksite wellness. J Occup Environ Med. 2018;60(2):126-131.
6. Shanafelt TD, Balch CM, Bechamps G, et al. Burnout and medical errors among American surgeons. Ann Surg. 2010;251(6):995-1000.
7. Aiken LH, Clarke SP, Sloane DM, Sochalski J, Silber JH. Hospital nurse staffing and patient mortality, nurse burnout, and job dissatisfaction. JAMA. 2002;288(16):1987-1993.
8. Poghosyan L, Clarke SP, Finlayson M, Aiken LH. Nurse burnout and quality of care: cross-national investigation in six countries. Res Nurs Health. 2010;33(4):288-298.
9. Rios-Risquez MI, García-Izquierdo M. Patient satisfaction, stress and burnout in nursing personnel in emergency departments: a cross-sectional study. Int J Nurs Stud. 2016;59:60-67.
10. Vahey DC, Aiken LH, Sloane DM, Clarke SP, Delfino V. Nurse burnout and patient satisfaction. Med Care. 2004;42(2 suppl):II57-II66.
11. Ruotsalainen JH, Verbeek JH, Mariné A, Serra C. Preventing occupational stress in health care workers. Cochrane Database Syst Rev. 2015;7(4):CD002892.
12. Elder C, Nidich S, Moriarty F, Nidich R. Effect of transcendental meditation on employee stress, depression, and burnout: a randomized controlled study. Perm J. 2014;18(1):19-23.
13. Prasad K, Wahner-Roedler DL, Cha SS, Sood A. Effect of a single-session meditation training to reduce stress and improve quality of life among health care professionals: a “dose-ranging” feasibility study. Altern Ther Health Med. 2011;17(3):46-49.
14. Jamieson SD, Tuckey MR. Mindfulness interventions in the workplace: a critique of the current state of the literature. J Occup Health Psychol. 2017;22(2):180-193.
15. Dharmawardene M, Givens J, Wachholtz A, Makowski S, Tjia J. A systematic review and meta-analysis of meditative interventions for informal caregivers and health professionals. BMJ Support Palliat Care. 2016;6(2):160-169.
16. Goyal M, Singh S, Sibinga EM, et al. Meditation programs for psychological stress and well-being: a systematic review and meta-analysis. JAMA Intern Med. 2014;174(3):357-368.
17. Bormann JE, Smith TL, Becker S, et al. Efficacy of frequent mantram repetition on stress, quality of life, and spiritual well-being in veterans: a pilot study. J Holist Nurs. 2005;23(4):395-414.
18. Bormann JE, Oman D, Kemppainen JK, Becker S, Gershwin M, Kelly A. Mantram repetition for stress management in veterans and employees: a critical incident study. J Adv Nurs. 2006;53(5):502-512.
19. Buttner MM, Bormann JE, Weingart K, Andrews T, Ferguson M, Afari N. Multi-site evaluation of a complementary, spiritually-based intervention for veterans: the mantram repetition program. Complement Ther Clin Pract. 2016;22:74-79.
20. Bormann JE, Hurst S, Kelly A. Responses to mantram repetition program from veterans with posttraumatic stress disorder: a qualitative analysis. J Rehabil Res Dev. 2013;50(6):769-784.
21. Bormann JE, Thorp S, Wetherell JL, Golshan S. A spiritually based group intervention for combat veterans with posttraumatic stress disorder: feasibility study. J Holist Nurs. 2008;26(2):109-116.
22. Bormann JE, Thorp SR, Wetherell JL, Golshan S, Lang AJ. Meditation-based mantram intervention for veterans with posttraumatic stress disorder: a randomized trial. Psychol Trauma: Theory Res Pract Policy. 2013;5(3):259-267.
23. Bormann JE, Thorp SR, Smith E, et al. Individual treatment of posttraumatic stress disorder using mantram repetition: a randomized clinical trial. Am J Psych. 2018;175(10):979-988.
24. Bormann JE, Warren KA, Regalbuto L, et al. A spiritually-based caregiver intervention with telephone delivery for family caregivers of veterans with dementia. Fam Community Health. 2009;32(4):345-353.
25. Bormann JE, Becker S, Gershwin M, et al. Relationship of frequent mantram repetition to emotional and spiritual well-being in healthcare workers. J Contin Educ Nurs. 2006;37(5):218-224.
26. Leary F, Weingart K, Topp R, Bormann JE. The effect of mantram repetition on burnout and stress among VA staff. Workplace Health Saf. 2018;66(3):120-128.
27. Yong J, Kim J, Park J, Seo I, Swinton BD. Effects of a spirituality training program on the spiritual and psychosocial well-being of hospital middle manager nurses in Korea. J Contin Educ Nurs. 2011;42(6):280-288.
28. Bormann JE, Walter KH, Leary S, Glaser D. An internet-delivered mantram repetition program for spiritual well-being and mindfulness for health care workers. Spirit Clin Pract. 2017;4(1):64-73.
29. Hamilton S, Pinfold V, Cotney J. Qualitative analysis of mental health service users’ reported experiences of discrimination. Acta Psychiatr Scand. 2016;134(suppl 446):14-22.
30. Ryan GW, Bernard HR. Techniques to identify themes. Field Meth. 2003;15(1):85-109.
31. Hoge EA, Bui E, Marques L, et al. Randomized controlled trial of mindfulness meditation for generalized anxiety disorder: effects on anxiety and stress reactivity. J Clin Psychiatry. 2013;74(8):786-792.
32. Lee RT, Seo B, Hladkyj S, Lovell BL, Schwartzmann L. Correlates of physician burnout across regions and specialties: a meta-analysis. Hum Resour Health. 2013;11(1):48.
According to the National Institute for Occupational Safety and Health (NIOSH), stress is a major problem for more than 18 million US health care workers (HCWs).1 Increases in technology, high patient acuity, and new demands for meeting institutional benchmarks create stressful clinical work environments. HCWs at the US Department of Veterans Affairs (VA) are perhaps at particular risk of experiencing burnout due to the unique needs of VA patients and bureaucratic demands.2 Stress may lead to depression, decreased job satisfaction, and other psychological distress among HCWs.3 This, in turn, affects the delivery of care. High levels of burnout have been associated with increased medication errors, lower quality of care, and lower patient satisfaction scores.4-10
A Cochrane Review found that mental and physical relaxation reduce stress in HCWs.11 Among these, meditative interventions (eg, mindfulness, meditation, yoga) have demonstrated promise.12-14 Results from a systematic meta-analysis of meditative interventions for HCWs indicated small-to-moderate improvements in emotional exhaustion, sense of personal accomplishment, and life satisfaction. Additional research is needed to determine effects of meditative interventions on burnout and caregiver burden.15
Unfortunately, many meditative intervention programs are lengthy and require a significant investment of time. They also require some form of sitting meditation every day, placing additional demands on busy HCWs. There remains a need for practical strategies to reduce HCW stress that are easier to master and practice.
Background
We developed, implemented, evaluated, and modified an evidence-based meditative intervention called the Mantram Repetition Program (MRP) to address workplace stress and burnout. The MRP is a mind-body, spiritually enhanced intervention that offers benefits similar to other types of meditative interventions.16 MRP is composed of 3 primary components: (1) silently repeating a self-selected, meaningful word or phrase (here called a mantram); (2) intentionally slowing down thoughts and behaviors; and (3) developing the ability to focus on a single task at a time (ie, one-pointed attention). The MRP does not require participants to set aside a specific place to practice, and mantram repetition can be initiated intermittently and privately throughout the day (eg, between tasks, while walking or waiting). Examples of 4 sessions (eg, Mantram 1, 2, 3, and 4) can be found on the PsychArmor Institute website (www.psycharmor.org; San Diego, CA).
Initially, the MRP was offered in a group format, in 6 or 8 weekly, 90-minute face-to-face sessions to both patient and nonpatient populations. Studies in veterans with chronic diseases demonstrated improvements in perceived stress, anxiety, and anger, and increased levels of spiritual well-being and quality of life (QOL).17-19 Veterans with posttraumatic stress disorder (PTSD) reported improvements in PTSD symptoms, QOL, and spiritual well-being.20-23 Family caregivers of veterans with dementia reported significant reductions in caregiver burden, depression, and anxiety after participating in the MRP.24
Similar results have substantiated the effects of the MRP among HCWs, including reductions in perceived stress, stress of conscience (ie, the conflict that results from competing values and behaviors in the workplace), and burnout.25-27 HCWs also reported improvements in mindfulness and spiritual well-being.28 In a randomized controlled trial, South Korean nurse managers who completed the MRP demonstrated significant improvements in psychosocial and spiritual well-being and leadership practice and experienced reductions in burnout compared with that of the control group.27 In a qualitative study, the most frequently reported benefits of the MRP were improvements in managing symptoms of stress, anxiety, and feeling out of control.18
HCWs reported they found it difficult to attend the 8-week MRP face-to-face group classes. Therefore, we developed a shorter online version of the MRP consisting of six 1-hour educational sessions: 4 online self-learning modules, and 2 live meeting webinars with the course facilitator.28 VA employees were invited to enroll in the program from June 2013 through 2016 through group e-mails and announcements in the VA Employee Education Service newsletters. Those eligible to participate could earn up to 6 hours of continuing education.
Although the program was generally well accepted, feedback from HCWs indicated that providers still lacked enough time to participate fully. We therefore condensed the MRP into one 90-minute, videotaped webinar entitled “Mind-Body-Spiritual Strategies for a Healthy Workforce: The Mantram Repetition Program.” The webinar was delivered in real time in June 2013 and archived for viewing later. This condensed course provided an overview of the development, theory, and practice of MRP core components. Specific instructions included how to choose and use a mantram; the importance of acting slowly with intention to avoid mistakes; and ways of developing single-pointed attention. Participants were invited to complete a standard course evaluation using an online survey.
This article presents results from qualitative analyses of participant feedback for the condensed MRP in a nationwide sample of more than 1,700 HCWs within the VA. We used template summary analysis to identify themes in participants’ responses to 2 open-ended questions: “What about this learning activity was most useful to you?” and “What about this learning activity was least useful to you?” These results have implications for reducing HCW stress and developing training programs for HCWs.
Analysis
Responses to the what was most useful question were downloaded to a spreadsheet file for analyses. Investigators chose summary template analysis, a rapid qualitative analytic technique, as the best strategy for analyzing these textual data. This technique is often used in health services research when it is unrealistic to use more time-consuming qualitative methods, such as coding.29
To begin, the analyst, a PhD-level anthropologist, read through the feedback to identify similar words, phrases, and/or concepts (ie, themes). Once the analyst gained a sense of general themes, she developed category labels using verbatim words and/or phrases in the feedback (similar to developing in vivo codes.30 She listed these categories at the top of a summary template document, providing a definition for each to ensure analytic rigor.
Next, each category was listed down the left side of the template. Participant feedback was copied and pasted from the spreadsheet form into the appropriate category for each of 200 responses. The investigator identified subthemes within each category. After analysis was completed for the first 200 course participants, the analyst grouped similar categories together into broader domains to further organize the data. She then read through the feedback from the remaining 917 course participants to identify negative cases (ie, dissimilarities in feedback). An additional researcher familiar with the condensed MRP training then examined the categories and domains. Together, they discussed and resolved any inconsistencies in interpretation of the data.
To get a better sense of the full range of perspectives about the training, the analyst then read through the written feedback for the what was least useful question. She scanned the feedback for negative cases that contradicted template findings and noted these in a document. A more balanced evaluation of the course emerged through this secondary analysis.
Results
Online surveys were completed by 1,117 participants, of which three-quarters (841) were female. Two hundred eleven (19%) viewed the condensed MRP in real time. The remaining participants viewed an online video of the course. Anonymous course evaluations captured only gender and professional classification of participants. Participants represented a wide range of professional roles. The majority (63%) held clinical positions with direct patient care. The next largest category included administrative or health information personnel (21%). There were also students and trainees among these categories.
Qualitative Findings
Feedback about the course was organized into categories during analysis: (1) instructional format; (2) mode of delivery; (3) course content; (4) professional and personal empowerment; (5) religion and spirituality; and (6) ease of mantram practice. These categories represented 2 broad domains: feedback about the course and feedback about the intervention.
Instructional Format
HCWs often reported that the most useful aspect of the course was the instructional format. Most cited the ease with which they could understand the materials and helpfulness of the examples of mantram practice. The option to download course materials for later reference was also useful. Some HCWs indicated that the course could have been improved by incorporating an experiential component in which participants paused to practice a mantram.
Mode of Delivery
Delivery mode including the convenience of the training and the flexibility of having the course available at both work and home was mentioned in the feedback. Some HCWs reported that the most useful aspect of the training was the on-demand feature, which allowed them to stop and restart the program as needed. A few, however, referenced technical difficulties with the webinar.
Content
HCWs also indicated that general information about mantram repetition and information regarding the benefits of the intervention (eg, stress reduction) were useful. The scientific basis of mantram was described as useful by some, though others reported it as least useful. Practical guidance regarding the appropriate time and place to practice a mantram as well as concrete information regarding how to select a mantram was mentioned as the most useful by other participants.
Professional and Personal Empowerment
Professional and personal empowerment was referenced in evaluations. Professional development, such as learning a strategy for enhancing work performance, was reported as positive. HCWs also reported that learning a new strategy for self-care and coping with stress was useful. Some described having experienced a sense of validation by participating in the course that was empowering. Finally, some HCWs indicated the personal growth experienced as the most useful.
Religion and Spirituality
General statements regarding the utility of having learned a spiritually-based practice that crossed religious boundaries as well as general references to the power of prayer were listed in the feedback. Other HCWs indicated the usefulness of having learned that a mantram could be secular.
Ease of Mantram
HCWs referenced the ease with which a mantram can be learned and/or practiced. Course participants described the simplicity of mantram repetition and referenced its portability (ie, it can be practiced in many different settings). Finally, the overall flexibility of mantram practice of where and when it can be performed was also described as useful.
Discussion
Qualitative feedback from participant evaluations of a 90-minute, virtual online MRP course suggests that HCWs representing all areas of care are interested in learning practical strategies for managing workplace stress. Participants overwhelmingly perceived mantram practice as feasible to implement, with the portability of mantram repetition described as particularly useful. This aspect of mantram repetition represents a distinct advantage over meditative interventions that require a dedicated space and time in which to practice (eg, yoga postures, sitting meditation).
These preliminary findings also suggest that mantram practice is acceptable to HCWs representing a variety of roles. Participants indicated that they valued learning a meditative practice that can be interpreted as spiritual or secular, depending on the word or phrase chosen. Only 1 participant reported that the practice of mantram conflicted with his/her personal beliefs. A small minority of participants who found the discussion of spirituality disconcerting nevertheless indicated that the intervention was acceptable to them.
The finding that even a 90-minute course was challenging for some HCWs to accommodate speaks to the importance of developing short-duration stress-reduction programs. The standardized Mindfulness Based Stress Reduction (MBSR) program consists of 8 weekly 2.5-hour sessions and a full-day retreat for an overall commitment of 29 to 33 hours.31 Additionally, a systematic review of meditative interventions for informal and professional caregivers found that programs ranged from 4 to 8 weeks.15 These lengthier programs are likely more challenging than the condensed MRP.
These results also suggest the importance of general guidelines for meditative intervention courses for reducing HCW stress. The mode of delivery should be as flexible as possible, allowing course participants to start, stop, and restart the program as needed and to participate from a location most convenient to them. Although presenting evidence for clinical effectiveness is critical for establishing credibility, statistical data should be briefly summarized. An experiential component in which participants are encouraged to practice the intervention will enhance learning and ensure the translation of knowledge into practice. Finally, framing meditative practices as compatible with many different faiths and/or secular will enhance their acceptability.
Three recommended components of an overall strategy for reducing occupational burnout in health care settings include modifying the organizational structure and work processes, improving the fit between the organization and HCWs, and promoting and allowing time for individuals to learn strategies for coping with work-related stress.32 This 90-minute online MRP course represents an aspect of an overall strategy to reduce HCW stress and burnout. Providing opportunities for HCWs to learn strategies for managing stress could enhance the quality of care and improve patient outcomes. Future pragmatic trials could determine whether mantram practice impacts clinical care at the VA and elsewhere.
Limitations
All participants were self-selected; therefore, the findings may be biased favorably toward the intervention. These qualitative analyses are not generalizable. HCWs in other, non-VA settings might have different needs and/or stressors that should be considered in future program development. If this intervention is offered to a wider audience, then other formats ought to be offered, such as print, at-home recordings, live meeting, and face-to-face.
Conclusion
Course participants reported that the condensed 90-minute virtual MRP was convenient to complete. They described the intervention as flexible and easy to learn. Participants indicated that they intended to implement what they learned in the course to reduce work-related stress. This feedback can be used to recommend guidelines for developing meditative interventions aimed at reducing stress in HCWs.
Acknowledgments
This material is based on work supported by the US Department of Veterans Affairs (VA), VA Employee Education Service and with resources from the VA San Diego Healthcare System and the VA Center for Mental Healthcare & Outcomes Research, South Central Mental Illness Research, Education, and Clinical Center at the Central Arkansas Veterans Healthcare System.
1. Centers for Disease Control and Prevention, National Institute for Occupational Safety and Health (NIOSH). Workplace safety and health topic: health care workers. http://www.cdc.gov/niosh/topics/healthcare. Updated May 9, 2018. Accessed April 8, 2019.
2. Voss Horrell SC, Holohan DR, Didion LM, Vance GT. Treating traumatized OEF/OIF veterans: how does trauma treatment affect the clinician? Prof Psychol Res Pract. 2011;42(1):79-86.
3. Centers for Disease Control and Prevention, National Institute for Occupational Safety and Health. Exposure to stress: occupational hazards in hospitals. http://www.cdc.gov/niosh/docs/2008-136/default.html. Published July 2008. Accessed April 9, 2019.
4. Fahrenkopf AM, Sectish TC, Barger LK. Rates of medication errors among depressed and burnt out residents: prospective cohort study. BMJ. 2008;336(7642):488-491.
5. Melnyk BM, Orsolini L, Tan A, et al. A national study links nurses’ physical and mental health to medical errors and perceived worksite wellness. J Occup Environ Med. 2018;60(2):126-131.
6. Shanafelt TD, Balch CM, Bechamps G, et al. Burnout and medical errors among American surgeons. Ann Surg. 2010;251(6):995-1000.
7. Aiken LH, Clarke SP, Sloane DM, Sochalski J, Silber JH. Hospital nurse staffing and patient mortality, nurse burnout, and job dissatisfaction. JAMA. 2002;288(16):1987-1993.
8. Poghosyan L, Clarke SP, Finlayson M, Aiken LH. Nurse burnout and quality of care: cross-national investigation in six countries. Res Nurs Health. 2010;33(4):288-298.
9. Rios-Risquez MI, García-Izquierdo M. Patient satisfaction, stress and burnout in nursing personnel in emergency departments: a cross-sectional study. Int J Nurs Stud. 2016;59:60-67.
10. Vahey DC, Aiken LH, Sloane DM, Clarke SP, Delfino V. Nurse burnout and patient satisfaction. Med Care. 2004;42(2 suppl):II57-II66.
11. Ruotsalainen JH, Verbeek JH, Mariné A, Serra C. Preventing occupational stress in health care workers. Cochrane Database Syst Rev. 2015;7(4):CD002892.
12. Elder C, Nidich S, Moriarty F, Nidich R. Effect of transcendental meditation on employee stress, depression, and burnout: a randomized controlled study. Perm J. 2014;18(1):19-23.
13. Prasad K, Wahner-Roedler DL, Cha SS, Sood A. Effect of a single-session meditation training to reduce stress and improve quality of life among health care professionals: a “dose-ranging” feasibility study. Altern Ther Health Med. 2011;17(3):46-49.
14. Jamieson SD, Tuckey MR. Mindfulness interventions in the workplace: a critique of the current state of the literature. J Occup Health Psychol. 2017;22(2):180-193.
15. Dharmawardene M, Givens J, Wachholtz A, Makowski S, Tjia J. A systematic review and meta-analysis of meditative interventions for informal caregivers and health professionals. BMJ Support Palliat Care. 2016;6(2):160-169.
16. Goyal M, Singh S, Sibinga EM, et al. Meditation programs for psychological stress and well-being: a systematic review and meta-analysis. JAMA Intern Med. 2014;174(3):357-368.
17. Bormann JE, Smith TL, Becker S, et al. Efficacy of frequent mantram repetition on stress, quality of life, and spiritual well-being in veterans: a pilot study. J Holist Nurs. 2005;23(4):395-414.
18. Bormann JE, Oman D, Kemppainen JK, Becker S, Gershwin M, Kelly A. Mantram repetition for stress management in veterans and employees: a critical incident study. J Adv Nurs. 2006;53(5):502-512.
19. Buttner MM, Bormann JE, Weingart K, Andrews T, Ferguson M, Afari N. Multi-site evaluation of a complementary, spiritually-based intervention for veterans: the mantram repetition program. Complement Ther Clin Pract. 2016;22:74-79.
20. Bormann JE, Hurst S, Kelly A. Responses to mantram repetition program from veterans with posttraumatic stress disorder: a qualitative analysis. J Rehabil Res Dev. 2013;50(6):769-784.
21. Bormann JE, Thorp S, Wetherell JL, Golshan S. A spiritually based group intervention for combat veterans with posttraumatic stress disorder: feasibility study. J Holist Nurs. 2008;26(2):109-116.
22. Bormann JE, Thorp SR, Wetherell JL, Golshan S, Lang AJ. Meditation-based mantram intervention for veterans with posttraumatic stress disorder: a randomized trial. Psychol Trauma: Theory Res Pract Policy. 2013;5(3):259-267.
23. Bormann JE, Thorp SR, Smith E, et al. Individual treatment of posttraumatic stress disorder using mantram repetition: a randomized clinical trial. Am J Psych. 2018;175(10):979-988.
24. Bormann JE, Warren KA, Regalbuto L, et al. A spiritually-based caregiver intervention with telephone delivery for family caregivers of veterans with dementia. Fam Community Health. 2009;32(4):345-353.
25. Bormann JE, Becker S, Gershwin M, et al. Relationship of frequent mantram repetition to emotional and spiritual well-being in healthcare workers. J Contin Educ Nurs. 2006;37(5):218-224.
26. Leary F, Weingart K, Topp R, Bormann JE. The effect of mantram repetition on burnout and stress among VA staff. Workplace Health Saf. 2018;66(3):120-128.
27. Yong J, Kim J, Park J, Seo I, Swinton BD. Effects of a spirituality training program on the spiritual and psychosocial well-being of hospital middle manager nurses in Korea. J Contin Educ Nurs. 2011;42(6):280-288.
28. Bormann JE, Walter KH, Leary S, Glaser D. An internet-delivered mantram repetition program for spiritual well-being and mindfulness for health care workers. Spirit Clin Pract. 2017;4(1):64-73.
29. Hamilton S, Pinfold V, Cotney J. Qualitative analysis of mental health service users’ reported experiences of discrimination. Acta Psychiatr Scand. 2016;134(suppl 446):14-22.
30. Ryan GW, Bernard HR. Techniques to identify themes. Field Meth. 2003;15(1):85-109.
31. Hoge EA, Bui E, Marques L, et al. Randomized controlled trial of mindfulness meditation for generalized anxiety disorder: effects on anxiety and stress reactivity. J Clin Psychiatry. 2013;74(8):786-792.
32. Lee RT, Seo B, Hladkyj S, Lovell BL, Schwartzmann L. Correlates of physician burnout across regions and specialties: a meta-analysis. Hum Resour Health. 2013;11(1):48.
Development of a Program to Support VA Community Living Centers’ Quality Improvement
US Department of Veterans Affairs (VA) Community Living Centers (CLCs) provide a dynamic array of long- and short-term health and rehabilitative services in a person-centered environment designed to meet the individual needs of veteran residents. The VA Office of Geriatrics and Extended Care (GEC) manages CLCs as part of its commitment to “optimizing the health and well-being of veterans with multiple chronic conditions, life-limiting illness, frailty or disability associated with chronic disease, aging or injury.”1
CLCs are home to veterans who require short stays before going home, as well as those who require longer or permanent domicile. CLCs also are home to several special populations of veterans, including those with spinal cord injury and those who choose palliative or hospice care. CLCs have embraced cultural transformation, creating therapeutic environments that function as real homes, with the kitchen at the center, and daily activities scheduled around the veterans’ preferences. Data about CLC quality are now available to the public, highlighting the important role of support for and continual refinement to quality improvement (QI) processes in the CLC system. 2,3
CONCERT Program
High-functioning teams are critical to achieving improvement in such processes.4 In fiscal year (FY) 2017, GEC launched a national center to engage and support CLC staff in creating high-functioning, relationship-based teams through specific QI practices, thereby aiming to improve veteran experience and quality of care. The center, known as the CLCs’ Ongoing National Center for Enhancing Resources and Training (CONCERT), is based on extensive VA-funded research in CLCs5-7 and builds on existing, evidence-based literature emphasizing the importance of strengths-based learning, collaborative problem solving, and structured observation.8-13 The CONCERT mission is to support CLCs in ongoing QI efforts, providing guidance, training, and resources. This article summarizes the previous research on which CONCERT is based and describes its current activities, which focus on implementing a national team-based quality improvement initiative.
Earlier VA-funded CLC research included a VA Office of Patient Centered Care and Cultural Transformation local innovation project and 2 VA Office of Research and Development-funded research studies. The local innovation project focused on strengthening staff leadership and relational skills in 1 CLC by engaging leaders and staff in collaborative work to reduce stress. The goal was to build high-functioning team skills through shared projects that created positive work experiences and reduced job-related stress while also improving veteran experience and quality of care.14,15 Over the course of a year, 2 national consultants in nursing home quality improvement worked with CLC leadership and staff, including conducting nine 4-day site visits. Using an approach designed to foster development of high-functioning teams, individual CLC neighborhoods (ie, units) developed and implemented neighborhood-initiated, neighborhood-based pilot projects, such as an individualized finger foods dining option for residents with dementia who became distressed when sitting at a table during a meal. Outcomes of these projects included improved staff communication and staff satisfaction, particularly psychological safety.
In the concurrently conducted pilot research study, a research team comprehensively assessed the person-centered care efforts of 3 CLCs prior to their construction of Green House-type (small house) homes. This mixed-methods study included more than 50 qualitative interviews conducted with VA medical center leadership and CLC staff and residents. Researchers also administered online employee surveys and conducted site visits, including more than 60 hours of direct observation of CLC life and team functioning. The local institutional review boards approved all study procedures, and researchers notified local unions.
Analyses highlighted 2 important aspects of person-centered care not captured by then-existing measurement instruments: the type, quality, and number of staff/resident interactions and the type, quality, and level of resident engagement. The team therefore developed a structured, systematic, observation-based instrument to measure these concepts.5 But while researchers found this instrument useful, it was too complex to be used by CLC staff for QI.
LOCK Quality Improvement
A later and larger research study addressed this issue. In the study, researchers worked with CLC staff to convert the complex observation-based research instrument into several structured tools that were easier for CLC staff to use.6 The researchers then incorporated their experience with the prior local innovation project and designed and implemented a QI program, which operationalized an evidence-based bundle of practices to implement the new tools in 6 CLCs. Researchers called the bundle of practices “LOCK”: (1) Learn from the bright spots; (2) Observe; (3) Collaborate in huddles; and (4) Keep it bite-sized.
Learn from the bright spots. Studies on strengths-based learning indicate that recognizing and sharing positive instances of ideal practice helps provide clear direction regarding what needs to be done differently to achieve success. Identifying and learning from outlying instances of successful practice encourages staff to continue those behaviors and gives staff tangible examples of how they may improve.16-19 That is, concentrating on instances where a negative outcome was at risk of occurring but did not occur (ie, a positive outlier or “bright spot”) enables staff to analyze what facilitated the success and design and pilot strategies to replicate it.
Observe. Human factors engineering is built on the principle that integrated approaches for studying work systems can identify areas for improvement.8 Observation is a key tool in this approach. A recent review of 69 studies that used observation to assess clinical performance found it useful in identifying factors affecting quality and safety.9
Collaborate in huddles. A necessary component to overcoming barriers to successful QI is having high-functioning teams effectively coordinate work. In the theory of relational coordination, this is operationalized as high-quality interactions (frequent, timely, and accurate communication) and high-quality relationships (share knowledge, shared goals, and mutual respect).10,11 Improved relational coordination can lead to higher quality of care outcomes and job satisfaction by enabling individuals to manage their tasks with less delay, more rapid and effective responses, fewer errors, and less wasted effort.12
Keep it bite-sized. Regular practice of a new behavior is one of the keys to making that new behavior part of an automatic routine (ie, a habit). To be successfully integrated into staff work routines, QI initiatives must be perceived as congruent with and easily integrated into care goals and workplace practices. Quick, focused, team-building and solution-oriented QI initiatives, therefore, have the greatest chance of success, particularly if staff feel they have little time for participating in new initiatives.13
Researchers designed the 4 LOCK practices to be interrelated and build on one another, creating a bundle to be used together to help facilitate positive change in resident/staff interactions and resident engagement.7 For 6 months, researchers studied the 6 CLCs’ use of the new structured observation tools as part of the LOCK-based QI program. The participating CLCs had such success in improving staff interactions with residents and residents’ engagement in CLC life that GEC, under the CONCERT umbrella, rolled out the LOCK bundle of practices to CLCs nationwide.20
CONCERT’s current activities focus on helping CLCs implement the LOCK bundle nationwide as a relational coordination-based national QI initiative designed to improve quality of care and staff satisfaction. The CONCERT team began this implementation in FY 2017 using a train-the-trainer approach through a staggered veterans integrated service network (VISN) rollout. Each CLC sent 2 leaders to a VISN-wide training program at a host CLC site (the host site was able to have more participants attend). Afterward, the CONCERT team provided individualized phone support to help CLCs implement the program. A VA Pulse (intranet-based social media portal) site hosts all training materials, program videos, an active blog, community discussions, etc.
In FY 2018, the program shifted to a VISN-based support system, with a CONCERT team member assigned to each VISN and VISN-based webinars to facilitate information exchange, collaboration, and group learning. In FY 2018, the CONCERT team also conducted site visits to selected CLCs with strong implementation success records to learn about program facilitators and to disseminate the lessons learned. Spanning FYs 2018 and 2019, the CONCERT team also supports historically low-performing CLCs through a series of rapid-cycle learning intensives based on the Institute for Healthcare Improvement breakthrough collaborative series model for accelerated and sustained QI.21 These incorporate in-person or virtual learning sessions, in which participants learn about and share effective practices, and between-session learning assignments, to facilitate the piloting, implementation, and sustainment of system changes. As part of the CONCERT continuous QI process, the CONCERT team closely monitors the impact of the program and continues to pilot, adapt, and change practices as it learns more about how best to help CLCs improve.
Conclusion
A key CONCERT principle is that health care systems create health care outcomes. The CONCERT team uses the theory of relational coordination to support implementation of the LOCK bundle of practices to help CLCs change their systems to achieve high performance. Through implementation of the LOCK bundle of practices, CLC staff develop, pilot, and spread new systems for communication, teamwork, and collaborative problem solving, as well as developing skills to participate effectively in these systems. CONCERT represents just 1 way VA supports CLCs in their continual journeys toward ever-improved quality of veteran care.
Acknowledgments
The authors thank Barbara Frank and Cathie Brady for their contributions to the development of the CONCERT program.
1. US Department of Veterans Affairs, Geriatrics and Extended Care Services (GEC). https://www.va.gov/GERIATRICS/index.asp. Updated February 25, 2019. Accessed April 9, 2019.
2. US Department of Veterans Affairs. https://www.accesstocare.va.gov/CNH/Statemap. Accessed April 10, 2019.
3. US Department of Veterans Affairs. https://www.va.gov/QUALITYOFCARE/apps/aspire/clcsurvey.aspx/. U
4. Gittell JH, Weinberg D, Pfefferle S, Bishop C. Impact of relational coordination on job satisfaction and quality outcomes: a study of nursing homes. Hum Resour Manag. 2008;18(2):154-170
5. Snow AL, Dodson, ML, Palmer JA, et al. Development of a new systematic observation tool of nursing home resident and staff engagement and relationship. Gerontologist. 2018;58(2):e15-e24.
6. Hartmann CW, Palmer JA, Mills WL, et al. Adaptation of a nursing home culture change research instrument for frontline staff quality improvement use. Psychol Serv. 2017;14(3):337-346.
7. Mills WL, Pimentel CB, Palmer JA, et al. Applying a theory-driven framework to guide quality improvement efforts in nursing homes: the LOCK model. Gerontologist. 2018;58(3):598-605.
8. Caravon P, Hundt AS, Karsh B, et al. Work system design for patient safety: the SEIPS model. Quality & Safety in Health Care. 2006;15(suppl 1), i50-i58.
9. Yanes AF, McElroy LM, Abecassis ZA, Holl J, Woods D, Ladner DP. Observation for assessment of clinician performance: a narrative review. BMJ Qual Saf. 2016;25(1):46-55.
10. Gittell JH. Supervisory span, relational coordination and flight departure performance: a reassessment of postbureaucracy theory. Organ Sci. 2011;12(4):468-483.
11. Gittell JH. New Directions for Relational Coordination Theory. In Spreitzer GM, Cameron KS, eds. The Oxford Handbook of Positive Organizational Scholarship. Oxford University Press: New York; 2012:400-411.
12. Weinberg DB, Lusenhop RW, Gittell JH, Kautz CM. Coordination between formal providers and informal caregivers. Health Care Manage Rev. 2007;32(2):140-149.
13. Phillips J, Hebish LJ, Mann S, Ching JM, Blackmore CC. Engaging frontline leaders and staff in real-time improvement. Jt Comm J Qual Patient Saf. 2016;42(4):170-183.
14. Farrell D, Brady C, Frank B. Meeting the Leadership Challenge in Long-Term Care: What You Do Matters. Health Professions Press: Baltimore, MD; 2011.
15. Brady C, Farrell D, Frank B. A Long-Term Leaders’ Guide to High Performance: Doing Better Together. Health Professions Press: Baltimore, MD; 2018.
16. Bradley EH, Curry LA, Ramanadhan S, Rowe L, Nembhard IM, Krumholz HM. Research in action: using positive deviance to improve quality of health care. Implement Sci. 2009;4:25.
17. Marsh DR, Schroeder DG, Dearden KA, Sternin J, Sternin M. The power of positive deviance. BMJ. 2004; 329(7475):1177-1179.
18. Vogt K, Johnson F, Fraser V, et al. An innovative, strengths-based, peer mentoring approach to professional development for registered dietitians. Can J Diet Pract Res. 2015;76(4):185-189.
19. Beckett P, Field J, Molloy L, Yu N, Holmes D, Pile E. Practice what you preach: developing person-centered culture in inpatient mental health settings through strengths-based, transformational leadership. Issues Ment Health Nurs. 2013;34(8):595-601.
20. Hartmann CW, Mills WL, Pimentel CB, et al. Impact of intervention to improve nursing home resident-staff interactions and engagement. Gerontologist. 2018;58(4):e291-e301.
21. Institute for Healthcare Improvement. The breakthrough series: IHI’s collaborative model for achieving breakthrough improvement. http://www.ihi.org/resources/Pages/IHIWhitePapers/TheBreakthroughSeriesIHIsCollaborativeModelforAchievingBreakthroughImprovement.aspx. Published 2003. Accessed April 9, 2019.
US Department of Veterans Affairs (VA) Community Living Centers (CLCs) provide a dynamic array of long- and short-term health and rehabilitative services in a person-centered environment designed to meet the individual needs of veteran residents. The VA Office of Geriatrics and Extended Care (GEC) manages CLCs as part of its commitment to “optimizing the health and well-being of veterans with multiple chronic conditions, life-limiting illness, frailty or disability associated with chronic disease, aging or injury.”1
CLCs are home to veterans who require short stays before going home, as well as those who require longer or permanent domicile. CLCs also are home to several special populations of veterans, including those with spinal cord injury and those who choose palliative or hospice care. CLCs have embraced cultural transformation, creating therapeutic environments that function as real homes, with the kitchen at the center, and daily activities scheduled around the veterans’ preferences. Data about CLC quality are now available to the public, highlighting the important role of support for and continual refinement to quality improvement (QI) processes in the CLC system. 2,3
CONCERT Program
High-functioning teams are critical to achieving improvement in such processes.4 In fiscal year (FY) 2017, GEC launched a national center to engage and support CLC staff in creating high-functioning, relationship-based teams through specific QI practices, thereby aiming to improve veteran experience and quality of care. The center, known as the CLCs’ Ongoing National Center for Enhancing Resources and Training (CONCERT), is based on extensive VA-funded research in CLCs5-7 and builds on existing, evidence-based literature emphasizing the importance of strengths-based learning, collaborative problem solving, and structured observation.8-13 The CONCERT mission is to support CLCs in ongoing QI efforts, providing guidance, training, and resources. This article summarizes the previous research on which CONCERT is based and describes its current activities, which focus on implementing a national team-based quality improvement initiative.
Earlier VA-funded CLC research included a VA Office of Patient Centered Care and Cultural Transformation local innovation project and 2 VA Office of Research and Development-funded research studies. The local innovation project focused on strengthening staff leadership and relational skills in 1 CLC by engaging leaders and staff in collaborative work to reduce stress. The goal was to build high-functioning team skills through shared projects that created positive work experiences and reduced job-related stress while also improving veteran experience and quality of care.14,15 Over the course of a year, 2 national consultants in nursing home quality improvement worked with CLC leadership and staff, including conducting nine 4-day site visits. Using an approach designed to foster development of high-functioning teams, individual CLC neighborhoods (ie, units) developed and implemented neighborhood-initiated, neighborhood-based pilot projects, such as an individualized finger foods dining option for residents with dementia who became distressed when sitting at a table during a meal. Outcomes of these projects included improved staff communication and staff satisfaction, particularly psychological safety.
In the concurrently conducted pilot research study, a research team comprehensively assessed the person-centered care efforts of 3 CLCs prior to their construction of Green House-type (small house) homes. This mixed-methods study included more than 50 qualitative interviews conducted with VA medical center leadership and CLC staff and residents. Researchers also administered online employee surveys and conducted site visits, including more than 60 hours of direct observation of CLC life and team functioning. The local institutional review boards approved all study procedures, and researchers notified local unions.
Analyses highlighted 2 important aspects of person-centered care not captured by then-existing measurement instruments: the type, quality, and number of staff/resident interactions and the type, quality, and level of resident engagement. The team therefore developed a structured, systematic, observation-based instrument to measure these concepts.5 But while researchers found this instrument useful, it was too complex to be used by CLC staff for QI.
LOCK Quality Improvement
A later and larger research study addressed this issue. In the study, researchers worked with CLC staff to convert the complex observation-based research instrument into several structured tools that were easier for CLC staff to use.6 The researchers then incorporated their experience with the prior local innovation project and designed and implemented a QI program, which operationalized an evidence-based bundle of practices to implement the new tools in 6 CLCs. Researchers called the bundle of practices “LOCK”: (1) Learn from the bright spots; (2) Observe; (3) Collaborate in huddles; and (4) Keep it bite-sized.
Learn from the bright spots. Studies on strengths-based learning indicate that recognizing and sharing positive instances of ideal practice helps provide clear direction regarding what needs to be done differently to achieve success. Identifying and learning from outlying instances of successful practice encourages staff to continue those behaviors and gives staff tangible examples of how they may improve.16-19 That is, concentrating on instances where a negative outcome was at risk of occurring but did not occur (ie, a positive outlier or “bright spot”) enables staff to analyze what facilitated the success and design and pilot strategies to replicate it.
Observe. Human factors engineering is built on the principle that integrated approaches for studying work systems can identify areas for improvement.8 Observation is a key tool in this approach. A recent review of 69 studies that used observation to assess clinical performance found it useful in identifying factors affecting quality and safety.9
Collaborate in huddles. A necessary component to overcoming barriers to successful QI is having high-functioning teams effectively coordinate work. In the theory of relational coordination, this is operationalized as high-quality interactions (frequent, timely, and accurate communication) and high-quality relationships (share knowledge, shared goals, and mutual respect).10,11 Improved relational coordination can lead to higher quality of care outcomes and job satisfaction by enabling individuals to manage their tasks with less delay, more rapid and effective responses, fewer errors, and less wasted effort.12
Keep it bite-sized. Regular practice of a new behavior is one of the keys to making that new behavior part of an automatic routine (ie, a habit). To be successfully integrated into staff work routines, QI initiatives must be perceived as congruent with and easily integrated into care goals and workplace practices. Quick, focused, team-building and solution-oriented QI initiatives, therefore, have the greatest chance of success, particularly if staff feel they have little time for participating in new initiatives.13
Researchers designed the 4 LOCK practices to be interrelated and build on one another, creating a bundle to be used together to help facilitate positive change in resident/staff interactions and resident engagement.7 For 6 months, researchers studied the 6 CLCs’ use of the new structured observation tools as part of the LOCK-based QI program. The participating CLCs had such success in improving staff interactions with residents and residents’ engagement in CLC life that GEC, under the CONCERT umbrella, rolled out the LOCK bundle of practices to CLCs nationwide.20
CONCERT’s current activities focus on helping CLCs implement the LOCK bundle nationwide as a relational coordination-based national QI initiative designed to improve quality of care and staff satisfaction. The CONCERT team began this implementation in FY 2017 using a train-the-trainer approach through a staggered veterans integrated service network (VISN) rollout. Each CLC sent 2 leaders to a VISN-wide training program at a host CLC site (the host site was able to have more participants attend). Afterward, the CONCERT team provided individualized phone support to help CLCs implement the program. A VA Pulse (intranet-based social media portal) site hosts all training materials, program videos, an active blog, community discussions, etc.
In FY 2018, the program shifted to a VISN-based support system, with a CONCERT team member assigned to each VISN and VISN-based webinars to facilitate information exchange, collaboration, and group learning. In FY 2018, the CONCERT team also conducted site visits to selected CLCs with strong implementation success records to learn about program facilitators and to disseminate the lessons learned. Spanning FYs 2018 and 2019, the CONCERT team also supports historically low-performing CLCs through a series of rapid-cycle learning intensives based on the Institute for Healthcare Improvement breakthrough collaborative series model for accelerated and sustained QI.21 These incorporate in-person or virtual learning sessions, in which participants learn about and share effective practices, and between-session learning assignments, to facilitate the piloting, implementation, and sustainment of system changes. As part of the CONCERT continuous QI process, the CONCERT team closely monitors the impact of the program and continues to pilot, adapt, and change practices as it learns more about how best to help CLCs improve.
Conclusion
A key CONCERT principle is that health care systems create health care outcomes. The CONCERT team uses the theory of relational coordination to support implementation of the LOCK bundle of practices to help CLCs change their systems to achieve high performance. Through implementation of the LOCK bundle of practices, CLC staff develop, pilot, and spread new systems for communication, teamwork, and collaborative problem solving, as well as developing skills to participate effectively in these systems. CONCERT represents just 1 way VA supports CLCs in their continual journeys toward ever-improved quality of veteran care.
Acknowledgments
The authors thank Barbara Frank and Cathie Brady for their contributions to the development of the CONCERT program.
1. US Department of Veterans Affairs, Geriatrics and Extended Care Services (GEC). https://www.va.gov/GERIATRICS/index.asp. Updated February 25, 2019. Accessed April 9, 2019.
2. US Department of Veterans Affairs. https://www.accesstocare.va.gov/CNH/Statemap. Accessed April 10, 2019.
3. US Department of Veterans Affairs. https://www.va.gov/QUALITYOFCARE/apps/aspire/clcsurvey.aspx/. U
4. Gittell JH, Weinberg D, Pfefferle S, Bishop C. Impact of relational coordination on job satisfaction and quality outcomes: a study of nursing homes. Hum Resour Manag. 2008;18(2):154-170
5. Snow AL, Dodson, ML, Palmer JA, et al. Development of a new systematic observation tool of nursing home resident and staff engagement and relationship. Gerontologist. 2018;58(2):e15-e24.
6. Hartmann CW, Palmer JA, Mills WL, et al. Adaptation of a nursing home culture change research instrument for frontline staff quality improvement use. Psychol Serv. 2017;14(3):337-346.
7. Mills WL, Pimentel CB, Palmer JA, et al. Applying a theory-driven framework to guide quality improvement efforts in nursing homes: the LOCK model. Gerontologist. 2018;58(3):598-605.
8. Caravon P, Hundt AS, Karsh B, et al. Work system design for patient safety: the SEIPS model. Quality & Safety in Health Care. 2006;15(suppl 1), i50-i58.
9. Yanes AF, McElroy LM, Abecassis ZA, Holl J, Woods D, Ladner DP. Observation for assessment of clinician performance: a narrative review. BMJ Qual Saf. 2016;25(1):46-55.
10. Gittell JH. Supervisory span, relational coordination and flight departure performance: a reassessment of postbureaucracy theory. Organ Sci. 2011;12(4):468-483.
11. Gittell JH. New Directions for Relational Coordination Theory. In Spreitzer GM, Cameron KS, eds. The Oxford Handbook of Positive Organizational Scholarship. Oxford University Press: New York; 2012:400-411.
12. Weinberg DB, Lusenhop RW, Gittell JH, Kautz CM. Coordination between formal providers and informal caregivers. Health Care Manage Rev. 2007;32(2):140-149.
13. Phillips J, Hebish LJ, Mann S, Ching JM, Blackmore CC. Engaging frontline leaders and staff in real-time improvement. Jt Comm J Qual Patient Saf. 2016;42(4):170-183.
14. Farrell D, Brady C, Frank B. Meeting the Leadership Challenge in Long-Term Care: What You Do Matters. Health Professions Press: Baltimore, MD; 2011.
15. Brady C, Farrell D, Frank B. A Long-Term Leaders’ Guide to High Performance: Doing Better Together. Health Professions Press: Baltimore, MD; 2018.
16. Bradley EH, Curry LA, Ramanadhan S, Rowe L, Nembhard IM, Krumholz HM. Research in action: using positive deviance to improve quality of health care. Implement Sci. 2009;4:25.
17. Marsh DR, Schroeder DG, Dearden KA, Sternin J, Sternin M. The power of positive deviance. BMJ. 2004; 329(7475):1177-1179.
18. Vogt K, Johnson F, Fraser V, et al. An innovative, strengths-based, peer mentoring approach to professional development for registered dietitians. Can J Diet Pract Res. 2015;76(4):185-189.
19. Beckett P, Field J, Molloy L, Yu N, Holmes D, Pile E. Practice what you preach: developing person-centered culture in inpatient mental health settings through strengths-based, transformational leadership. Issues Ment Health Nurs. 2013;34(8):595-601.
20. Hartmann CW, Mills WL, Pimentel CB, et al. Impact of intervention to improve nursing home resident-staff interactions and engagement. Gerontologist. 2018;58(4):e291-e301.
21. Institute for Healthcare Improvement. The breakthrough series: IHI’s collaborative model for achieving breakthrough improvement. http://www.ihi.org/resources/Pages/IHIWhitePapers/TheBreakthroughSeriesIHIsCollaborativeModelforAchievingBreakthroughImprovement.aspx. Published 2003. Accessed April 9, 2019.
Researchers examine vitamin D, skin pigmentation, and outcomes of pediatric MS
PHILADELPHIA – according to research described at the annual meeting of the American Academy of Neurology. Future research will be required to understand the interactions between dietary vitamin D ingestion, sun exposure, pigmentation of sun-exposed skin, seasonal vitamin D concentrations, and the genetic influences of vitamin D pathways with MS risk.
Race, vitamin D status, HLA-DRB1*15 genotype, and place of residence during childhood all affect the risk of MS. The place of residence also can affect exposure to ultraviolet radiation and, thus, dermal pigmentation.
Candice Dunn, a clinical research coordinator at the Children’s Hospital of Philadelphia, and colleagues conducted a prospective study to determine whether HLA-DRB1*15 status, 25-hydroxyvitamin D (25[OH]D) levels measured at baseline, and skin tone are associated with MS outcome in children with ADS. They enrolled 259 children with incident ADS in a multisite study in Toronto and Philadelphia (latitudes 43° to 51°). The investigators measured non–sun-exposed upper inner arm melanin content using the DSM II ColorMeter device. They measured 25(OH)D concentrations in serum obtained within 60 days of symptom onset and compared them with laboratory-reported normative values. Vitamin D insufficiency was defined as 25(OH)D less than 75 nmol/L. Ms. Dunn and colleagues quantified HLA-DRB1*15 alleles using allele-specific polymerase chain reaction amplification. Statistical analysis was performed using Spearman correlation models and Wilcoxon or Kruskal-Wallis tests as appropriate.
In all, 68 children were diagnosed with MS, 191 remained monophasic (monoADS). Approximately 46% of children with MS were HLA-DRB1*15-positive, compared with 29.9% of monoADS children. In addition, children with MS had significantly lower 25(OH)D levels (mean, 45.4 nmol/L) than monoADS children (mean, 61.9 nmol/L) at baseline. Non–sun-exposed skin tone measured in the upper inner arm did not differ between children diagnosed with MS (mean melanin index, 46.4) and monoADS (mean melanin index, 43.5). Furthermore, 25(OH)D levels correlated with upper inner arm melanin index in the MS group, but not in children with monoADS.
Ms. Dunn had nothing to disclose, but various coauthors have received compensation from companies such as Novartis, Merck, Teva, Celgene, and Genentech.
SOURCE: Dunn C et al. AAN 2019, Abstract S19.007.
REPORTING FROM AAN 2019
Key clinical point: The relationship between vitamin D status and MS outcome in children relates to skin pigmentation.
Major finding: About 46% of children with MS were HLA-DRB1*15 positive.
Study details: A multisite, prospective study of 259 children with MS.
Disclosures: Ms. Dunn had no disclosures, but various coauthors have received compensation from companies such as Novartis, Merck, Teva, Celgene, and Genentech.
Source: Dunn C et al. AAN 2019, Abstract S19.007.
FDA approves Vyndaqel, Vyndamax for amyloidosis-based heart disease

The disease is caused by the buildup of abnormal deposits of amyloid in the body’s organs and tissues, interfering with normal function, and most often occurs in the heart and nervous system. Symptoms associated with amyloid buildup in the heart include shortness of breath, fatigue, heart failure, loss of consciousness, abnormal heart rhythms, and death.
FDA approval of both drugs was based on results of a clinical trial in which 441 patients with transthyretin-mediated amyloidosis received either tafamidis meglumine or placebo. After a mean of 30 months, patients who received tafamidis meglumine had a higher survival rate and a lower number of cardiovascular-related hospitalizations than did patients in the placebo group.
No drug-associated side effects have yet been identified; however, tafamidis can cause fetal harm when administered to a pregnant woman.
“Transthyretin-mediated amyloidosis is a rare, debilitating, and often fatal disease. The treatments we’re approving today are an important advancement in the treatment of the cardiomyopathy caused by transthyretin-mediated amyloidosis,” said Norman Stockbridge, MD, PhD, director of the Division of Cardiovascular and Renal Drugs in the FDA’s Center for Drug Evaluation and Research.
Find the full press release on the FDA website.
Improving Health Care for Veterans With Gulf War Illness
Many veterans of the Gulf War are experiencing deployment-related chronic illness, known as Gulf War illness (GWI). Symptoms of GWI include cognitive impairments (mood and memory), chronic fatigue, musculoskeletal pain, gastrointestinal (GI) disorders, respiratory problems, and skin rashes.1-4 Three survey studies of the physical and mental health of a large cohort of Gulf War and Gulf era veterans, conducted by the US Department of Veterans Affairs (VA) Office of Public Health, established the increased prevalence of GWI in the decades that followed the end of the conflict.5-7 Thus, GWI has become the signature adverse health-related outcome of the Gulf War. Quality improvement (QI) within the Veterans Health Administration (VHA) is needed in the diagnosis and treatment of GWI.
Background
GWI was first termed chronic multisymptom illness (CMI) by the Centers for Disease Control and Prevention (CDC). According to the CDC-10 case definition, CMI in veterans of the 1990-1991 Gulf War is defined as having ≥ 1 symptoms lasting ≥ 6 months in at least 2 of 3 categories: fatigue, depressed mood and altered cognition, and musculoskeletal pain.3 The Kansas case definition of GWI is more specific and is defined as having moderate-to-severe symptoms that are unexplained by any other diagnosis, in at least 3 of 6 categories: fatigue/sleep, somatic pain, neurologic/cognition/mood, GI, respiratory, and skin.4 Although chronic unexplained symptoms have occurred after other modern conflicts, the prevalence of GWI among Gulf War veterans has proven higher than those of prior conflicts.8
The Persian Gulf War Veterans Act of 1998 and the Veterans Programs Enhancement Act of 1998 mandated studies by the Institute of Medicine (IOM) on the biologic and chemical exposures that may have contributed to illness in the Kuwaiti theater of operations.9 However, elucidating the etiology and underlying pathophysiology of GWI has been a major research challenge. In the absence of objective diagnostic measures, an understanding of the fundamental pathophysiology, evidence-based treatments, a single case definition, and definitive guidelines for health care providers (HCPs) for the diagnosis and management of GWI has not been produced. As a result, veterans with GWI have struggled for nearly 3 decades to find a consistent diagnosis of and an effective treatment for their condition.
According to a report by the Government Accountability Office (GAO), the VA approved only 17% of claims for compensation for veterans with GWI from 2011 to 2015, about one-third the level of approval for all other claimed disabilities.10 Although the VA applied GAO recommendations to improve the compensation process, many veterans consider that their illness is treated as psychosomatic in clinical practice, despite emerging evidence of GWI-associated biomarkers.11 Others think they have been forgotten due to their short 1-year period of service in the Gulf War.12 To realign research, guidelines, clinical care, and the health care experience of veterans with GWI, focused QI within VHA is urgently needed.
Veterans of Operations Enduring Freedom, Iraqi Freedom, and New Dawn (OEF/OIF/OND) are experiencing similar CMI symptoms. A study of US Army Reserve OEF/OIF veterans found that > 60% met the CDC-10 case definition for GWI 1-year postdeployment.13 Thus, CMI is emerging as a serious health problem for post-9/11 veterans. The evidence of postdeployment CMI among veterans of recent conflicts underscores the need to increase efforts at a national level, beginning with the VHA. This report includes a summary of Gulf War veterans’ experiences at the Minneapolis VA Health Care System (MVAHCS) and a proposal for QI of MVAHCS processes focused on HCP education and clinical care.
Methods
To determine areas of GWI health care that needed QI at the MVAHCS, veterans with GWI were contacted for a telephone survey. These veterans had participated in the Gulf War Illness Inflammation Reduction Trial (ClinicalTrials.gov. Identifier: NCT02506192). Therefore, all met the Kansas case definition for GWI.4 The aim of the survey was to characterize veterans’ experiences seeking health care for chronic postdeployment symptoms.
Sixty Gulf War veterans were contacted by telephone and invited to participate in a 15-minute survey about their experience seeking diagnosis and treatment for GWI. They were informed that the survey was voluntary and confidential, that it was not part of the research trial in which they had been enrolled, and that their participation would not affect compensation received from VA. Verbal consent was requested, and 30 veterans agreed to participate in the survey.
The survey included questions about the course of illness, disability and service connection status, HCPs seen, and suggestions for improvement in their care (Table 1). 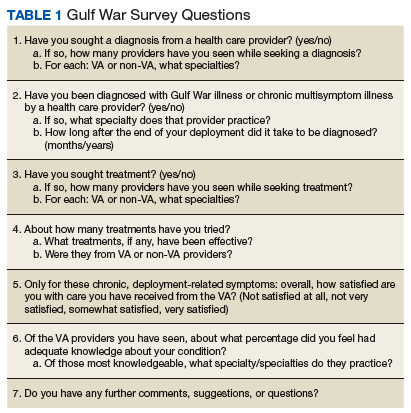
Results
Of the 30 veterans who participated in the survey, most were male with only 2 female veterans. This proportion of female veterans (7%) is similar to the overall percentage of female veterans (6.7%) of the first Gulf War.2 Ages ranged from 46 to 66 years with a mean age of 53. Mean duration of illness, defined as time elapsed since perceived onset of chronic systemic symptoms during or after deployment, was 22.8 years, with a range of 4 to 27 years. Most respondents reported symptom onset within a few years after the end of the conflict, while a few reported the onset within weeks of arriving in the Kuwaiti theater of operations. A little more than half the respondents considered themselves disabled due to their symptoms, while one-third reported losing the ability to work due to symptoms. Respondents described needing to reduce hours, retire early, or stop working altogether because of their symptoms.
Respondents attributed several common chronic symptoms to deployment in the Gulf Wars (Table 2). 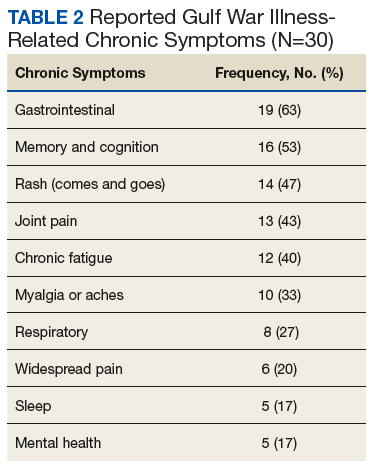
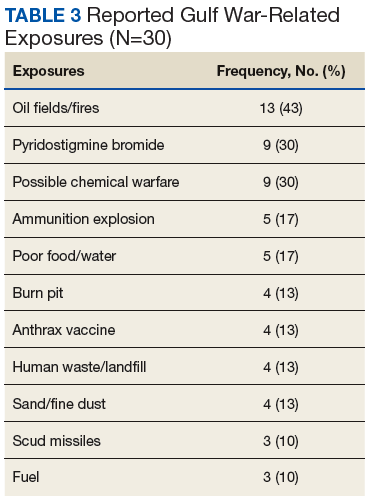
Most veterans surveyed were service connected for individual chronic symptoms. Some were service connected for systemic conditions such as fibromyalgia (FM), chronic fatigue syndrome (CFS), and irritable bowel syndrome (IBS) (5 veterans were connected for each condition). Three of the 30 veterans had been diagnosed with GWI—2 by past VA physicians and 1 by a physician at a GWI research center in another state. Of those 3, only 1 was service connected for the condition. Three respondents were not service connected at all.
The most common VA HCPs seen were in primary care and neurology followed by psychiatry and psychology. Of non-VA HCPs, most respondents saw primary care providers (PCPs) followed by chiropractors (Table 4). 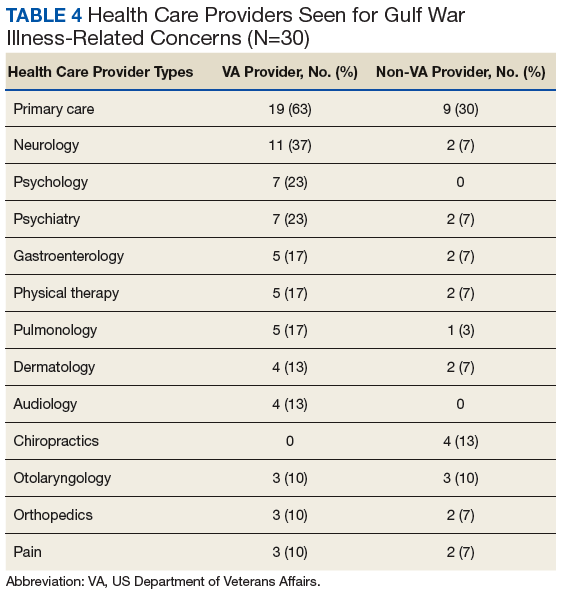
Before taking the Gulf War survey, a broad subjective question was posed. Respondents were asked whether VA HCPs were “supportive as you sought care for chronic postdeployment symptoms.” A majority of veterans reported that their VA HCPs were supportive. Reasons veterans gave for VA HCPs lack of support included feeling that HCPs did not believe them or trust their reported symptoms; did not care about their symptoms; refused to attribute their symptoms to Gulf War deployment; attributed symptoms to mental health issues; focused on doing things a certain way; or did not have the tools or information necessary to help.
Most non-VA HCPs were supportive. Reasons community HCPs were not supportive included “not looking at the whole picture,” not knowing veteran issues, not feeling comfortable with GWI, or not having much they could do.
Veterans were then asked whether they felt their HCPs were knowledgeable about GWI, and 13 respondents reported that their HCP was knowledgeable. Reasons respondents felt VA HCPs were not knowledgeable included denying that GWI exists, attributing symptoms to other conditions, not being aware of or familiar with GWI, needing education from the veteran, avoiding discussion about GWI or not caring to learn, or not knowing the latest research evidence to talk about GWI with authority. Compared with VA HCPs, veterans found community HCPs about half as likely to be knowledgeable about GWI. Many reported that community HCPs had not heard of GWI or had no knowledge about it.
Respondents also were asked what types of treatments they tried in order to typify the care received. The most common responses were pain medications, symptom-specific treatments, or “just putting up with it” (no treatment). Many patients were also self-medicating, trying lifestyle changes, or seeking alternative therapies.
Finally, respondents were asked on a scale of 0 (very unsatisfied) to 5 (very satisfied), how satisfied they were with their overall care at the VA. The majority were satisfied with their overall care, with two-thirds very satisfied (5 of 5) or pretty satisfied (4 of 5). Only 3 (10%) were unsatisfied or very unsatisfied. Respondents had the following comments about their care: “They treat me like I am important;” “I am very thankful even though they cannot figure it out;” “They are doing the best they can with no answers and not enough help;” “[I know] it is still a work in progress.” A number of respondents were satisfied with some HCPs or care for some but not all of their symptoms. Reasons respondents were less satisfied included desiring answers, feeling they were not respected, or feeling that their concerns were not addressed.
When asked for suggestions for improvement of GWI care, the most common response was providing up-to-date HCP education (Table 5). 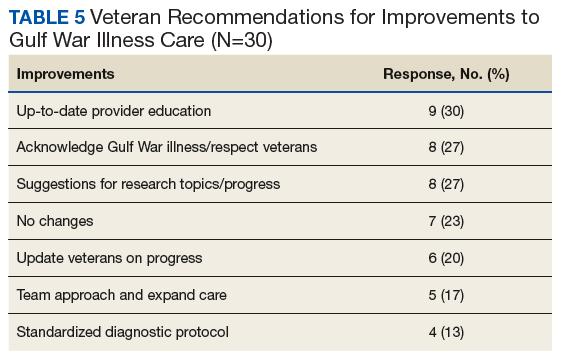
Discussion
The veterans participating in this QI survey had similar demographics, symptomology, and exposures as did those in other studies.1-7 Therefore, improvements based on their responses are likely applicable to the health care of veterans experiencing GWI-associated symptoms at other VA health care systems as well.
Veterans with GWI can lose significant functional capacity and productivity due to their symptoms. The symptoms are chronic and have afflicted many Gulf War veterans for nearly 3 decades. Furthermore, the prevalence of GWI in Gulf War veterans continues to increase.5-7 These facts testify to the enormous health-related quality-of-life impact of GWI.
Veterans who meet the Kansas case definition for GWI were not diagnosed or service connected in a uniform manner. Only 3 of the 30 veterans in this study were given a unifying diagnosis that connected their chronic illness to Gulf War deployment. Under current guidelines, Gulf War veterans are able to receive compensation for chronic symptoms in 3 ways: (1) compensation for chronic unexplained symptoms existing for ≥ 6 months that appeared during active duty in the Southwest Asia theater or by December 31, 2021, and are ≥ 10% disabling; (2) the 1995 Persian Gulf War Veterans’ Act recognizes 3 multisymptom illnesses for which veterans can be service connected: FM, CFS, and functional GI disorders, including IBS; and (3) expansion to include any CMI of unknown etiology is underway. A uniform diagnostic protocol based on biomarkers and updated understanding of disease pathology would be helpful.
Respondents shared experiences that demonstrated perceived gaps in HCP support or knowledge. Overall, more respondents found their HCPs supportive. Many of the reasons respondents found HCPs unsupportive related to acknowledgment of symptoms. Also, more respondents found that both VA and non-VA HCPs lacked knowledge about GWI symptoms. These findings further highlight the need for HCP education within the VA and in community-based care.
The treatments tried by respondents also highlight potential areas for improvement. Most of the treatments were for pain; therefore, more involvement with pain clinics and specialists could be helpful. Symptom-specific medications also are appropriate, although only one-third of patients reported use. While medications are not necessarily markers of quality care, the fact that many patients self-medicate or go without treatment suggests that access to care could be improved. In 2014, the VA and the US Department of Defense (DoD) released the “VA/DoD Clinical Practice Guideline for the Management of Chronic Multisymptom Illness,” which recommended treatments for the global disease and specific symptoms.15
Since then, GWI research points to inflammatory and metabolic disease mechanisms.11-14,16 As the underlying pathophysiology is further elucidated, practice guidelines will need to be updated to include anti-inflammatory and antioxidant treatments used in practice for GWI and similar chronic systemic illnesses (eg, CFS, FM, and IBS).17-19
Randomized control trials are needed to determine the efficacy of such medications for the treatment of GWI. As new results emerge, disseminating and updating evidence-based guidelines in a coordinated manner will be required for veterans to receive appropriate treatment. Veterans also seek alternative or nonpharmaceutical interventions, such as physical therapy and diet changes. Improving access to integrative medicine, physical therapy, nutritionists, and other practitioners also could optimize veterans’ health and function.
HCP Education
The Gulf War veteran respondents who participated in the survey noted HCP education, research progress, and veteran inclusion as areas for improvement. Respondents requested dissemination of information on diagnosis and treatment of GWI for HCPs and updates on research and other actions. They suggested ways research could be more effective (such as subgrouping by exposure, which researchers have been doing) and could extend to veterans experiencing CMI from other conflicts as well.20 Respondents also recommended team approaches or centers of excellence in order to receive more comprehensive care.
An asset of VHA is the culture of QI and education. The VA Employee Education System previously produced “Caring for Gulf War I Veterans,” a systemwide training module.21 In 2014, updated clinical practice guidelines for GWI were provided by the VA and the DoD, including evidence for each recommendation. In 2016, the VA in collaboration with the IOM produced a report summarizing conclusions and recommendations regarding associations between health concerns and Gulf War deployment.22 A concise guide for HCPs caring for veterans with GWI, updated in 2018, is available.23 Updated treatment guidelines, based on evolving understanding of GWI pathophysiology, and continuing efforts to disseminate information will be essential.
Respondents most often presented to primary care, both within and outside of MVAHCS. Therefore, VA and community PCPs who see veterans should be equipped to recognize and diagnose GWI as well as be familiar with basic disease management and specialists whom they could refer their patients. Neurology was the second most common specialty seen by respondents. The most prominent symptoms of GWI are related to nervous system function in addition to evidence of underlying neuroinflammation.20 Veterans may present to a neurologist with a variety of concerns, such as cognitive issues, sleep problems, migraines and headaches, and pain. Neurologists could best manage treatments targeting common neurologic GWI symptoms and neuroinflammation, especially as new treatments are discovered.
The next 2 most common specialty services seen were psychiatry and psychology (7 responses for each). Five respondents reported mental health issues as part of their chronic postdeployment symptoms. Population-based studies have indicated that rates of PTSD in Gulf War veterans is 3% to 6%, much lower than the prevalence of GWI.8,20 The 2010 IOM study concluded that GWI symptoms cannot be ascribed to any known psychiatric disorder. Unfortunately, several surveyed veterans made it clear that they had been denied care due to HCPs attributing their symptoms solely to mental health issues. Therefore, psychiatrists and psychologists must be educated about GWI, mental health issues occurring in Gulf War veterans, and physiologic symptoms of GWI that may mimic or coincide with mental health issues. These HCPs also would be important to include in an interdisciplinary clinic for veterans with GWI.
Finally, respondents sought care from numerous other specialties, including gastroenterology, physical therapy, pulmonology, dermatology, and surgical subspecialties, such as orthopedics and otolaryngology. This wide range of specialists seen emphasizes the need for medical education, beginning in medical school. If provided education on GWI, these specialists would be able to treat veterans with GWI, know to look for updates on GWI management, or know to look for other common symptoms, such as chronic sinusitis in otolaryngology or recurring rashes in dermatology. We also recommend identifying HCPs in these specialties who could be part of an interdisciplinary clinic or be referrals for symptom management.
Protocol Implementation
HCP education and clinical care protocol implementation should be the initial focus of improving GWI management. A team of stakeholders within the different areas of MVAHCS, including education, HCPs, and administrative staff, will need to be developed. Reaching out to VA HCPs who have seen veterans with GWI will be an essential first step to equip them with updated education about the diagnosis and management of CMI. Providing integrated widespread education to current HCPs who are likely to encounter veterans with deployment-related CMI from the Gulf War, OND/OEF/OIF, or other deployments also will be necessary. Finally, educating medical trainees, including residents and medical students, will ensure continuous care for future veterans, post-9/11 veterans.
GWI presentations at medical grand rounds or at other medical community educational events could provide educational outlets. These events create face-to-face opportunities to discuss GWI/CMI education with HCPs, giving them the opportunity to offer feedback about their experiences and create relationships with other HCPs who have seen patients with GWI/CMI. At an educational event, a short postevent feedback form that indicates whether HCPs would like more information or get involved in a clinic for veterans with CMI could be included. This information would help identify key HCPs and areas within the local VA needing further improvements, such as creating a clinic for veterans with GWI.
Since 1946, the VA has worked with academic institutions to provide state-of-the-art health care to US veterans and train new HCPs to meet the health care needs of the nation. Every year, > 40,000 residents and 20,000 medical students receive medical training at VA facilities, making VA the largest single provider of medical education in the country. Therefore, providing detailed GWI/CMI education to medical students and residents as a standard part of the VA Talent Management System would be of value for all VA professionals.
GWI Clinics
Access to comprehensive care can be accomplished by organizing a clinic for veterans with GWI. The most likely effective location would be in primary care. PCPs who have seen veterans with GWI and/or expressed interest in learning more about GWI will be the initial point of contact. As the primary care service has connections to ancillary services, such as pharmacists, dieticians, psychologists, and social workers, organizing 1 day each week to see patients with GWI would improve care.
As the need for specialty care arises, the team also would need to identify specialists willing to receive referrals from HCPs of veterans with GWI. These specialists could be identified via feedback forms from educational events, surveys after an online educational training, or through relationships among VA physicians. As the clinic becomes established, it may be effective to have certain commonly seen specialists available in person, most likely neurology, psychiatry, gastroenterology, pulmonology, and dermatology. Also, relationships with a pain clinic, sleep medicine, and integrative medicine services should be established.
Measures of improvement in the veteran health care experience could include veterans’ perceptions of the supportiveness and knowledge of physicians about GWI as well as overall satisfaction. A follow-up survey on these measures of veterans involved in a GWI clinic and those not involved would be a way to determine whether these clinics better meet veterans’ needs and what additional QI is needed.
Conclusion
A significant number of Gulf War veterans experience chronic postdeployment symptoms that need to be better addressed. Physicians need to be equipped to recognize and manage GWI and similar postdeployment CMI among veterans of OEF/OIF/OND. We recommend creating an educational initiative about GWI among VA physicians and trainees, connecting physicians who see veterans with GWI, and establishing an interdisciplinary clinic with a referral system as the next steps to improve care for veterans. An additional goal would be to reach out to veteran networks to update them on GWI research, education, and available health care, as veterans are the essential stakeholders in the QI process.
1. US Department of Veterans Affairs. Research Advisory Committee on Gulf War Veterans’ Illnesses. Gulf War Illness and the Health of Gulf War Veterans: Scientific Findings and Recommendations. https://www.va.gov/RAC-GWVI/docs/Committee_Documents/GWIandHealthofGWVeterans_RAC-GWVIReport_2008.pdf. Published November 2008. Accessed April 16, 2019.
2. Institute of Medicine. Gulf War and Health. Update of Health Effects of Serving in the Gulf War. Vol 8. Washington, DC: National Academies Press; 2009.
3. Fukuda K, Nisenbaum R, Stewart G, et al. Chronic multisymptom illness affecting Air Force veterans of the Gulf War. JAMA. 1998;280(11):981-988.
4. Steele L. Prevalence and patterns of Gulf War illness in Kansas veterans: association of symptoms with characteristics of person, place, and time of military service. Am J Epidemiol. 2000;152(10):992-1002.
5. Kang HK, Mahan CM, Lee KY, Magee CA, Murphy FM. Illnesses among United States veterans of the Gulf War: a population-based survey of 30,000 veterans. J Occup Environ Med. 2000;42(5):491-501.
6. Kang HK, Li B, Mahan CM, Eisen SA, Engel CC. Health of US veterans of 1991 Gulf War: a follow-up survey in 10 years. J Occup Environ Med. 2009;51(4):401-410.
7. Dursa EK, Barth SK, Schneiderman AI, Bossarte RM. Physical and mental health status of Gulf War and Gulf era veterans: results from a large population-based epidemiological study. J Occup Environ Med. 2016;58(1):41-46.
8. Institute of Medicine. Gulf War and Health: Treatment for Chronic Multisymptom Illness. Washington, DC: National Academies Press; 2013.
9. Institute of Medicine. Chronic Multisymptom Illness in Gulf War Veterans: Case Definitions Reexamined. Washington, DC: National Academies Press; 2014.
10. United States Government Accountability Office. Gulf War illness: improvements needed for VA to better understand, process, and communicate decisions on claims. https://www.gao.gov/assets/690/685562.pdf. Published June 2017. Accessed April 16, 2019.
11. Johnson GJ, Slater BC, Leis LA, Rector TS, Bach RR. Blood biomarkers of chronic inflammation in Gulf War illness. PLoS One. 2016;11(6):e0157855.
12. Reno J. Gulf War veterans still fighting serious health problems. https://www.healthline.com/health-news/gulf-war-veterans-still-fighting-serious-health-problems#1. Published June 17, 2016. Accessed April 16, 2019.
13. McAndrew LM, Helmer DA, Phillips LA, Chandler HK, Ray K, Quigley KS. Iraq and Afghanistan veterans report symptoms consistent with chronic multisymptom illness one year after deployment. J Rehabil Res Dev. 2016;53(1):59-70.
14. Steele L, Sastre A, Gerkovich MM, Cook MR. Complex factors in the etiology of Gulf War illness: wartime exposures and risk factors in veteran subgroups. Environ Health Perspect. 2012;120(1):112-118.
15. US Department of Veterans Affairs. VA/DoD Clinical Practice Guideline for the Management of Chronic Multisymptom Illness. Version 2.0. https://www.healthquality.va.gov/guidelines/MR/cmi/VADoDCMICPG2014.pdf. Published October 2014. Accessed April 22, 2019.
16. Koslik HJ, Hamilton G, Golomb BA. Mitochondrial dysfunction in Gulf War illness revealed by 31phosphorus magnetic resonance spectroscopy: a case-control study. PLoS One. 2014;9(3):e92887.
17. Brewer KL, Mainhart A, Meggs WJ. Double-blinded placebo-controlled cross-over pilot trial of naltrexone to treat Gulf War illness. Fatigue: Biomed Health Behav. 2018;6(3):132-140.
18. Golomb BA, Allison M, Koperski S, Koslik HJ, Devaraj S, Ritchie JB. Coenzyme Q10 benefits symptoms in Gulf War veterans: results of a randomized double-blind study. Neural Comput. 2014;26(11):2594-2651.
19. Weiduschat N, Mao X, Vu D, et al. N-acetylcysteine alleviates cortical glutathione deficit and improves symptoms in CFS: an in vivo validation study using proton magnetic resonance spectroscopy. In: Proceedings from the IACFS/ME 12th Biennial Conference; October 27-30, 2016; Fort Lauderdale, FL. Abstract. http://iacfsme.org/ME-CFS-Primer-Education/News/IACFSME-2016-Program.aspx. Accessed April 22, 2019.
20. White RF, Steele L, O’Callaghan JP, et al. Recent research on Gulf War illness and other health problems in veterans of the 1991 Gulf War: effects of toxicant exposures during deployment. Cortex. 2016;74:449-475.
21. US Department of Veterans Affairs. Caring for Gulf War I Veterans. http://www.ngwrc.net/PDF%20Files/caring-for-gulf-war.pdf. Published July 2011. Accessed April 15, 2019.
22. National Academies of Sciences, Engineering, and Medicine. Gulf War and Health. Update of Serving in the Gulf War. Vol 10. Washington, DC: National Academies Press; 2016.
23. US Department of Veterans Affairs. War-Related Illness and Injury Study Center. Gulf War illness: a guide for veteran health care providers. https://www.warrelatedillness.va.gov/education/factsheets/gulf-war-illness-for-providers.pdf. Updated October 2018. Accessed April 16, 2019.
Many veterans of the Gulf War are experiencing deployment-related chronic illness, known as Gulf War illness (GWI). Symptoms of GWI include cognitive impairments (mood and memory), chronic fatigue, musculoskeletal pain, gastrointestinal (GI) disorders, respiratory problems, and skin rashes.1-4 Three survey studies of the physical and mental health of a large cohort of Gulf War and Gulf era veterans, conducted by the US Department of Veterans Affairs (VA) Office of Public Health, established the increased prevalence of GWI in the decades that followed the end of the conflict.5-7 Thus, GWI has become the signature adverse health-related outcome of the Gulf War. Quality improvement (QI) within the Veterans Health Administration (VHA) is needed in the diagnosis and treatment of GWI.
Background
GWI was first termed chronic multisymptom illness (CMI) by the Centers for Disease Control and Prevention (CDC). According to the CDC-10 case definition, CMI in veterans of the 1990-1991 Gulf War is defined as having ≥ 1 symptoms lasting ≥ 6 months in at least 2 of 3 categories: fatigue, depressed mood and altered cognition, and musculoskeletal pain.3 The Kansas case definition of GWI is more specific and is defined as having moderate-to-severe symptoms that are unexplained by any other diagnosis, in at least 3 of 6 categories: fatigue/sleep, somatic pain, neurologic/cognition/mood, GI, respiratory, and skin.4 Although chronic unexplained symptoms have occurred after other modern conflicts, the prevalence of GWI among Gulf War veterans has proven higher than those of prior conflicts.8
The Persian Gulf War Veterans Act of 1998 and the Veterans Programs Enhancement Act of 1998 mandated studies by the Institute of Medicine (IOM) on the biologic and chemical exposures that may have contributed to illness in the Kuwaiti theater of operations.9 However, elucidating the etiology and underlying pathophysiology of GWI has been a major research challenge. In the absence of objective diagnostic measures, an understanding of the fundamental pathophysiology, evidence-based treatments, a single case definition, and definitive guidelines for health care providers (HCPs) for the diagnosis and management of GWI has not been produced. As a result, veterans with GWI have struggled for nearly 3 decades to find a consistent diagnosis of and an effective treatment for their condition.
According to a report by the Government Accountability Office (GAO), the VA approved only 17% of claims for compensation for veterans with GWI from 2011 to 2015, about one-third the level of approval for all other claimed disabilities.10 Although the VA applied GAO recommendations to improve the compensation process, many veterans consider that their illness is treated as psychosomatic in clinical practice, despite emerging evidence of GWI-associated biomarkers.11 Others think they have been forgotten due to their short 1-year period of service in the Gulf War.12 To realign research, guidelines, clinical care, and the health care experience of veterans with GWI, focused QI within VHA is urgently needed.
Veterans of Operations Enduring Freedom, Iraqi Freedom, and New Dawn (OEF/OIF/OND) are experiencing similar CMI symptoms. A study of US Army Reserve OEF/OIF veterans found that > 60% met the CDC-10 case definition for GWI 1-year postdeployment.13 Thus, CMI is emerging as a serious health problem for post-9/11 veterans. The evidence of postdeployment CMI among veterans of recent conflicts underscores the need to increase efforts at a national level, beginning with the VHA. This report includes a summary of Gulf War veterans’ experiences at the Minneapolis VA Health Care System (MVAHCS) and a proposal for QI of MVAHCS processes focused on HCP education and clinical care.
Methods
To determine areas of GWI health care that needed QI at the MVAHCS, veterans with GWI were contacted for a telephone survey. These veterans had participated in the Gulf War Illness Inflammation Reduction Trial (ClinicalTrials.gov. Identifier: NCT02506192). Therefore, all met the Kansas case definition for GWI.4 The aim of the survey was to characterize veterans’ experiences seeking health care for chronic postdeployment symptoms.
Sixty Gulf War veterans were contacted by telephone and invited to participate in a 15-minute survey about their experience seeking diagnosis and treatment for GWI. They were informed that the survey was voluntary and confidential, that it was not part of the research trial in which they had been enrolled, and that their participation would not affect compensation received from VA. Verbal consent was requested, and 30 veterans agreed to participate in the survey.
The survey included questions about the course of illness, disability and service connection status, HCPs seen, and suggestions for improvement in their care (Table 1).
Results
Of the 30 veterans who participated in the survey, most were male with only 2 female veterans. This proportion of female veterans (7%) is similar to the overall percentage of female veterans (6.7%) of the first Gulf War.2 Ages ranged from 46 to 66 years with a mean age of 53. Mean duration of illness, defined as time elapsed since perceived onset of chronic systemic symptoms during or after deployment, was 22.8 years, with a range of 4 to 27 years. Most respondents reported symptom onset within a few years after the end of the conflict, while a few reported the onset within weeks of arriving in the Kuwaiti theater of operations. A little more than half the respondents considered themselves disabled due to their symptoms, while one-third reported losing the ability to work due to symptoms. Respondents described needing to reduce hours, retire early, or stop working altogether because of their symptoms.
Respondents attributed several common chronic symptoms to deployment in the Gulf Wars (Table 2).
Most veterans surveyed were service connected for individual chronic symptoms. Some were service connected for systemic conditions such as fibromyalgia (FM), chronic fatigue syndrome (CFS), and irritable bowel syndrome (IBS) (5 veterans were connected for each condition). Three of the 30 veterans had been diagnosed with GWI—2 by past VA physicians and 1 by a physician at a GWI research center in another state. Of those 3, only 1 was service connected for the condition. Three respondents were not service connected at all.
The most common VA HCPs seen were in primary care and neurology followed by psychiatry and psychology. Of non-VA HCPs, most respondents saw primary care providers (PCPs) followed by chiropractors (Table 4).
Before taking the Gulf War survey, a broad subjective question was posed. Respondents were asked whether VA HCPs were “supportive as you sought care for chronic postdeployment symptoms.” A majority of veterans reported that their VA HCPs were supportive. Reasons veterans gave for VA HCPs lack of support included feeling that HCPs did not believe them or trust their reported symptoms; did not care about their symptoms; refused to attribute their symptoms to Gulf War deployment; attributed symptoms to mental health issues; focused on doing things a certain way; or did not have the tools or information necessary to help.
Most non-VA HCPs were supportive. Reasons community HCPs were not supportive included “not looking at the whole picture,” not knowing veteran issues, not feeling comfortable with GWI, or not having much they could do.
Veterans were then asked whether they felt their HCPs were knowledgeable about GWI, and 13 respondents reported that their HCP was knowledgeable. Reasons respondents felt VA HCPs were not knowledgeable included denying that GWI exists, attributing symptoms to other conditions, not being aware of or familiar with GWI, needing education from the veteran, avoiding discussion about GWI or not caring to learn, or not knowing the latest research evidence to talk about GWI with authority. Compared with VA HCPs, veterans found community HCPs about half as likely to be knowledgeable about GWI. Many reported that community HCPs had not heard of GWI or had no knowledge about it.
Respondents also were asked what types of treatments they tried in order to typify the care received. The most common responses were pain medications, symptom-specific treatments, or “just putting up with it” (no treatment). Many patients were also self-medicating, trying lifestyle changes, or seeking alternative therapies.
Finally, respondents were asked on a scale of 0 (very unsatisfied) to 5 (very satisfied), how satisfied they were with their overall care at the VA. The majority were satisfied with their overall care, with two-thirds very satisfied (5 of 5) or pretty satisfied (4 of 5). Only 3 (10%) were unsatisfied or very unsatisfied. Respondents had the following comments about their care: “They treat me like I am important;” “I am very thankful even though they cannot figure it out;” “They are doing the best they can with no answers and not enough help;” “[I know] it is still a work in progress.” A number of respondents were satisfied with some HCPs or care for some but not all of their symptoms. Reasons respondents were less satisfied included desiring answers, feeling they were not respected, or feeling that their concerns were not addressed.
When asked for suggestions for improvement of GWI care, the most common response was providing up-to-date HCP education (Table 5).
Discussion
The veterans participating in this QI survey had similar demographics, symptomology, and exposures as did those in other studies.1-7 Therefore, improvements based on their responses are likely applicable to the health care of veterans experiencing GWI-associated symptoms at other VA health care systems as well.
Veterans with GWI can lose significant functional capacity and productivity due to their symptoms. The symptoms are chronic and have afflicted many Gulf War veterans for nearly 3 decades. Furthermore, the prevalence of GWI in Gulf War veterans continues to increase.5-7 These facts testify to the enormous health-related quality-of-life impact of GWI.
Veterans who meet the Kansas case definition for GWI were not diagnosed or service connected in a uniform manner. Only 3 of the 30 veterans in this study were given a unifying diagnosis that connected their chronic illness to Gulf War deployment. Under current guidelines, Gulf War veterans are able to receive compensation for chronic symptoms in 3 ways: (1) compensation for chronic unexplained symptoms existing for ≥ 6 months that appeared during active duty in the Southwest Asia theater or by December 31, 2021, and are ≥ 10% disabling; (2) the 1995 Persian Gulf War Veterans’ Act recognizes 3 multisymptom illnesses for which veterans can be service connected: FM, CFS, and functional GI disorders, including IBS; and (3) expansion to include any CMI of unknown etiology is underway. A uniform diagnostic protocol based on biomarkers and updated understanding of disease pathology would be helpful.
Respondents shared experiences that demonstrated perceived gaps in HCP support or knowledge. Overall, more respondents found their HCPs supportive. Many of the reasons respondents found HCPs unsupportive related to acknowledgment of symptoms. Also, more respondents found that both VA and non-VA HCPs lacked knowledge about GWI symptoms. These findings further highlight the need for HCP education within the VA and in community-based care.
The treatments tried by respondents also highlight potential areas for improvement. Most of the treatments were for pain; therefore, more involvement with pain clinics and specialists could be helpful. Symptom-specific medications also are appropriate, although only one-third of patients reported use. While medications are not necessarily markers of quality care, the fact that many patients self-medicate or go without treatment suggests that access to care could be improved. In 2014, the VA and the US Department of Defense (DoD) released the “VA/DoD Clinical Practice Guideline for the Management of Chronic Multisymptom Illness,” which recommended treatments for the global disease and specific symptoms.15
Since then, GWI research points to inflammatory and metabolic disease mechanisms.11-14,16 As the underlying pathophysiology is further elucidated, practice guidelines will need to be updated to include anti-inflammatory and antioxidant treatments used in practice for GWI and similar chronic systemic illnesses (eg, CFS, FM, and IBS).17-19
Randomized control trials are needed to determine the efficacy of such medications for the treatment of GWI. As new results emerge, disseminating and updating evidence-based guidelines in a coordinated manner will be required for veterans to receive appropriate treatment. Veterans also seek alternative or nonpharmaceutical interventions, such as physical therapy and diet changes. Improving access to integrative medicine, physical therapy, nutritionists, and other practitioners also could optimize veterans’ health and function.
HCP Education
The Gulf War veteran respondents who participated in the survey noted HCP education, research progress, and veteran inclusion as areas for improvement. Respondents requested dissemination of information on diagnosis and treatment of GWI for HCPs and updates on research and other actions. They suggested ways research could be more effective (such as subgrouping by exposure, which researchers have been doing) and could extend to veterans experiencing CMI from other conflicts as well.20 Respondents also recommended team approaches or centers of excellence in order to receive more comprehensive care.
An asset of VHA is the culture of QI and education. The VA Employee Education System previously produced “Caring for Gulf War I Veterans,” a systemwide training module.21 In 2014, updated clinical practice guidelines for GWI were provided by the VA and the DoD, including evidence for each recommendation. In 2016, the VA in collaboration with the IOM produced a report summarizing conclusions and recommendations regarding associations between health concerns and Gulf War deployment.22 A concise guide for HCPs caring for veterans with GWI, updated in 2018, is available.23 Updated treatment guidelines, based on evolving understanding of GWI pathophysiology, and continuing efforts to disseminate information will be essential.
Respondents most often presented to primary care, both within and outside of MVAHCS. Therefore, VA and community PCPs who see veterans should be equipped to recognize and diagnose GWI as well as be familiar with basic disease management and specialists whom they could refer their patients. Neurology was the second most common specialty seen by respondents. The most prominent symptoms of GWI are related to nervous system function in addition to evidence of underlying neuroinflammation.20 Veterans may present to a neurologist with a variety of concerns, such as cognitive issues, sleep problems, migraines and headaches, and pain. Neurologists could best manage treatments targeting common neurologic GWI symptoms and neuroinflammation, especially as new treatments are discovered.
The next 2 most common specialty services seen were psychiatry and psychology (7 responses for each). Five respondents reported mental health issues as part of their chronic postdeployment symptoms. Population-based studies have indicated that rates of PTSD in Gulf War veterans is 3% to 6%, much lower than the prevalence of GWI.8,20 The 2010 IOM study concluded that GWI symptoms cannot be ascribed to any known psychiatric disorder. Unfortunately, several surveyed veterans made it clear that they had been denied care due to HCPs attributing their symptoms solely to mental health issues. Therefore, psychiatrists and psychologists must be educated about GWI, mental health issues occurring in Gulf War veterans, and physiologic symptoms of GWI that may mimic or coincide with mental health issues. These HCPs also would be important to include in an interdisciplinary clinic for veterans with GWI.
Finally, respondents sought care from numerous other specialties, including gastroenterology, physical therapy, pulmonology, dermatology, and surgical subspecialties, such as orthopedics and otolaryngology. This wide range of specialists seen emphasizes the need for medical education, beginning in medical school. If provided education on GWI, these specialists would be able to treat veterans with GWI, know to look for updates on GWI management, or know to look for other common symptoms, such as chronic sinusitis in otolaryngology or recurring rashes in dermatology. We also recommend identifying HCPs in these specialties who could be part of an interdisciplinary clinic or be referrals for symptom management.
Protocol Implementation
HCP education and clinical care protocol implementation should be the initial focus of improving GWI management. A team of stakeholders within the different areas of MVAHCS, including education, HCPs, and administrative staff, will need to be developed. Reaching out to VA HCPs who have seen veterans with GWI will be an essential first step to equip them with updated education about the diagnosis and management of CMI. Providing integrated widespread education to current HCPs who are likely to encounter veterans with deployment-related CMI from the Gulf War, OND/OEF/OIF, or other deployments also will be necessary. Finally, educating medical trainees, including residents and medical students, will ensure continuous care for future veterans, post-9/11 veterans.
GWI presentations at medical grand rounds or at other medical community educational events could provide educational outlets. These events create face-to-face opportunities to discuss GWI/CMI education with HCPs, giving them the opportunity to offer feedback about their experiences and create relationships with other HCPs who have seen patients with GWI/CMI. At an educational event, a short postevent feedback form that indicates whether HCPs would like more information or get involved in a clinic for veterans with CMI could be included. This information would help identify key HCPs and areas within the local VA needing further improvements, such as creating a clinic for veterans with GWI.
Since 1946, the VA has worked with academic institutions to provide state-of-the-art health care to US veterans and train new HCPs to meet the health care needs of the nation. Every year, > 40,000 residents and 20,000 medical students receive medical training at VA facilities, making VA the largest single provider of medical education in the country. Therefore, providing detailed GWI/CMI education to medical students and residents as a standard part of the VA Talent Management System would be of value for all VA professionals.
GWI Clinics
Access to comprehensive care can be accomplished by organizing a clinic for veterans with GWI. The most likely effective location would be in primary care. PCPs who have seen veterans with GWI and/or expressed interest in learning more about GWI will be the initial point of contact. As the primary care service has connections to ancillary services, such as pharmacists, dieticians, psychologists, and social workers, organizing 1 day each week to see patients with GWI would improve care.
As the need for specialty care arises, the team also would need to identify specialists willing to receive referrals from HCPs of veterans with GWI. These specialists could be identified via feedback forms from educational events, surveys after an online educational training, or through relationships among VA physicians. As the clinic becomes established, it may be effective to have certain commonly seen specialists available in person, most likely neurology, psychiatry, gastroenterology, pulmonology, and dermatology. Also, relationships with a pain clinic, sleep medicine, and integrative medicine services should be established.
Measures of improvement in the veteran health care experience could include veterans’ perceptions of the supportiveness and knowledge of physicians about GWI as well as overall satisfaction. A follow-up survey on these measures of veterans involved in a GWI clinic and those not involved would be a way to determine whether these clinics better meet veterans’ needs and what additional QI is needed.
Conclusion
A significant number of Gulf War veterans experience chronic postdeployment symptoms that need to be better addressed. Physicians need to be equipped to recognize and manage GWI and similar postdeployment CMI among veterans of OEF/OIF/OND. We recommend creating an educational initiative about GWI among VA physicians and trainees, connecting physicians who see veterans with GWI, and establishing an interdisciplinary clinic with a referral system as the next steps to improve care for veterans. An additional goal would be to reach out to veteran networks to update them on GWI research, education, and available health care, as veterans are the essential stakeholders in the QI process.
1. US Department of Veterans Affairs. Research Advisory Committee on Gulf War Veterans’ Illnesses. Gulf War Illness and the Health of Gulf War Veterans: Scientific Findings and Recommendations. https://www.va.gov/RAC-GWVI/docs/Committee_Documents/GWIandHealthofGWVeterans_RAC-GWVIReport_2008.pdf. Published November 2008. Accessed April 16, 2019.
2. Institute of Medicine. Gulf War and Health. Update of Health Effects of Serving in the Gulf War. Vol 8. Washington, DC: National Academies Press; 2009.
3. Fukuda K, Nisenbaum R, Stewart G, et al. Chronic multisymptom illness affecting Air Force veterans of the Gulf War. JAMA. 1998;280(11):981-988.
4. Steele L. Prevalence and patterns of Gulf War illness in Kansas veterans: association of symptoms with characteristics of person, place, and time of military service. Am J Epidemiol. 2000;152(10):992-1002.
5. Kang HK, Mahan CM, Lee KY, Magee CA, Murphy FM. Illnesses among United States veterans of the Gulf War: a population-based survey of 30,000 veterans. J Occup Environ Med. 2000;42(5):491-501.
6. Kang HK, Li B, Mahan CM, Eisen SA, Engel CC. Health of US veterans of 1991 Gulf War: a follow-up survey in 10 years. J Occup Environ Med. 2009;51(4):401-410.
7. Dursa EK, Barth SK, Schneiderman AI, Bossarte RM. Physical and mental health status of Gulf War and Gulf era veterans: results from a large population-based epidemiological study. J Occup Environ Med. 2016;58(1):41-46.
8. Institute of Medicine. Gulf War and Health: Treatment for Chronic Multisymptom Illness. Washington, DC: National Academies Press; 2013.
9. Institute of Medicine. Chronic Multisymptom Illness in Gulf War Veterans: Case Definitions Reexamined. Washington, DC: National Academies Press; 2014.
10. United States Government Accountability Office. Gulf War illness: improvements needed for VA to better understand, process, and communicate decisions on claims. https://www.gao.gov/assets/690/685562.pdf. Published June 2017. Accessed April 16, 2019.
11. Johnson GJ, Slater BC, Leis LA, Rector TS, Bach RR. Blood biomarkers of chronic inflammation in Gulf War illness. PLoS One. 2016;11(6):e0157855.
12. Reno J. Gulf War veterans still fighting serious health problems. https://www.healthline.com/health-news/gulf-war-veterans-still-fighting-serious-health-problems#1. Published June 17, 2016. Accessed April 16, 2019.
13. McAndrew LM, Helmer DA, Phillips LA, Chandler HK, Ray K, Quigley KS. Iraq and Afghanistan veterans report symptoms consistent with chronic multisymptom illness one year after deployment. J Rehabil Res Dev. 2016;53(1):59-70.
14. Steele L, Sastre A, Gerkovich MM, Cook MR. Complex factors in the etiology of Gulf War illness: wartime exposures and risk factors in veteran subgroups. Environ Health Perspect. 2012;120(1):112-118.
15. US Department of Veterans Affairs. VA/DoD Clinical Practice Guideline for the Management of Chronic Multisymptom Illness. Version 2.0. https://www.healthquality.va.gov/guidelines/MR/cmi/VADoDCMICPG2014.pdf. Published October 2014. Accessed April 22, 2019.
16. Koslik HJ, Hamilton G, Golomb BA. Mitochondrial dysfunction in Gulf War illness revealed by 31phosphorus magnetic resonance spectroscopy: a case-control study. PLoS One. 2014;9(3):e92887.
17. Brewer KL, Mainhart A, Meggs WJ. Double-blinded placebo-controlled cross-over pilot trial of naltrexone to treat Gulf War illness. Fatigue: Biomed Health Behav. 2018;6(3):132-140.
18. Golomb BA, Allison M, Koperski S, Koslik HJ, Devaraj S, Ritchie JB. Coenzyme Q10 benefits symptoms in Gulf War veterans: results of a randomized double-blind study. Neural Comput. 2014;26(11):2594-2651.
19. Weiduschat N, Mao X, Vu D, et al. N-acetylcysteine alleviates cortical glutathione deficit and improves symptoms in CFS: an in vivo validation study using proton magnetic resonance spectroscopy. In: Proceedings from the IACFS/ME 12th Biennial Conference; October 27-30, 2016; Fort Lauderdale, FL. Abstract. http://iacfsme.org/ME-CFS-Primer-Education/News/IACFSME-2016-Program.aspx. Accessed April 22, 2019.
20. White RF, Steele L, O’Callaghan JP, et al. Recent research on Gulf War illness and other health problems in veterans of the 1991 Gulf War: effects of toxicant exposures during deployment. Cortex. 2016;74:449-475.
21. US Department of Veterans Affairs. Caring for Gulf War I Veterans. http://www.ngwrc.net/PDF%20Files/caring-for-gulf-war.pdf. Published July 2011. Accessed April 15, 2019.
22. National Academies of Sciences, Engineering, and Medicine. Gulf War and Health. Update of Serving in the Gulf War. Vol 10. Washington, DC: National Academies Press; 2016.
23. US Department of Veterans Affairs. War-Related Illness and Injury Study Center. Gulf War illness: a guide for veteran health care providers. https://www.warrelatedillness.va.gov/education/factsheets/gulf-war-illness-for-providers.pdf. Updated October 2018. Accessed April 16, 2019.
Sleep, chronic pain, and OUD have a complex relationship
MILWAUKEE – Individuals with chronic pain frequently have disrupted sleep and also may be at risk for opioid use disorder. However, even with advanced monitoring, it’s not clear how sleep modulates pain and opioid cravings.
Sleep has an impact on positive and negative affect, but new research shows that the link between sleep and mood states that may contribute to opioid use disorder is not straightforward. At the scientific meeting of the American Pain Society, Patrick Finan, PhD, of Johns Hopkins University, Baltimore, discussed how sleep and mood affect cravings for opioids among those in treatment for opioid use disorder (OUD).
said Dr. Finan, who told attendees that one key question he and his colleagues were seeking to answer was whether those with OUD and chronic pain had more disturbed sleep than those with OUD alone. Also, the researchers wanted to know whether the ups and downs of sleep on a day-to-day basis were reflected in pain scores among those with OUD, as would be predicted by prevailing models.
Finally, two “proximal indicators” of relapse risk, affect and heroin craving, might be affected by both sleep and pain, and Dr. Finan and collaborators sought to explore that association.
The work was part of a larger study looking at the natural history of OUD and OUD with comorbid chronic pain. To participate in this parent study, adults with OUD had to be seeking treatment or currently enrolled in methadone or buprenorphine maintenance treatment, and without current major depressive disorder. Also, patients could not have a history of significant mental illness, cognitive impairment, or a medical condition that would interfere with study participation. A total of 56 patients participated, and 20 of these individuals also had chronic pain.
Those with OUD and chronic pain qualified if they had pain (not related to opioid withdrawal) averaging above 3 on a 0-10 pain rating scale over the past week; additional criteria included pain for at least the past 3 months, with 10 or more days per month of pain.
Pain ratings were captured via a smartphone app that prompted participants to enter a pain rating at three random times during each day. Each evening, patients also completed a sleep diary giving information about bedtime, sleep onset latency, waking after sleep onset, and wake time for the preceding day.
A self-applied ambulatory electroencephalogram applied to the forehead was used for up to 7 consecutive nights to capture sleep continuity estimates; the device has been validated against polysomnography data in other work. Participants were given incentives to use the device, and this “yielded strong adherence,” with an average of 5 nights of use per participant, Dr. Finan said.
Patients were an average age of about 49 years, and were 75% male. African American participants made up just over half of the cohort, and 43% were white. Participants were roughly evenly divided in the type of maintenance therapy they were taking. Overall, 39% of participants had a positive urine toxicology screen.
For patients with chronic pain, 45% of all momentary pain reports had a pain score over zero, with a mean of 32 days of pain. Looking at the data another way, 58% of all patient-days had at least one momentary report of pain greater than zero, said Dr. Finan. On average, participants recorded a pain score of 2.27.
Brief Pain Inventory scores at baseline showed a mean severity of 5, and a pain interference score of 5.07.
Participants with OUD and chronic pain did not differ across any EEG-recorded sleep measures, compared with those with OUD alone. However, subjective reports of sleep were actually better overall for those with chronic pain than the objective EEG reports. The EEG recordings captured an average of 9.11 minutes more of waking after sleep onset (P less than .001). Also, total sleep time was 10.37 minutes shorter as recorded by the EEG than by self-report (P less than .001). Overall sleep efficiency was also worse by 5.96 minutes according to the EEG, compared with self-report (P less than .001).
“Sleep is objectively poor but subjectively ‘normal’ and variable in opioid use disorder patients,” Dr. Finan said. In aggregate, however, neither diary-based subjective nor EEG-based objective sleep measures differed between those with and without chronic pain in the research cohort. This phenomenon of sleep efficiency being self-reported as higher than objective measures capture sleep has also been seen in those newly abstinent from cocaine, Dr. Finan said, adding that it’s possible individuals with substance use disorder who are new to treatment simply feel better than they have in some time along many dimensions, with sleep being one such domain.
Pain on a given day didn’t predict poor sleep on that night, except that sleep onset took slightly longer (P = .01), said Dr. Finan. He noted that “there was no substantive effect on other sleep continuity parameters.”
Looking at how negative affect mediated craving for heroin, Dr. Finan and colleagues found that negative affect–related craving was significantly greater for those with chronic pain (P less than .001). Unlike findings in patients without OUD, having disrupted sleep continuity was more associated with increased daily negative affect, rather than decreased positive affect. And this increased negative affect was associated with heroin cravings, said Dr. Finan. “In the past few years, we’ve seen quite a few studies that have found some abnormalities in the reward system in patients with chronic pain.” Whether poor sleep is a mediator of these abnormalities deserves further study.
The study was supported by the National Institutes of Health. Dr. Finan reported no outside sources of funding.
REPORTING FROM APS 2019
Guideline issued for treating Tourette syndrome and chronic tics
PHILADELPHIA – Approaches to managing tics in patients with Tourette syndrome or chronic tic disorders “should be individualized, and the choice should be the result of a collaborative decision among patient, caregiver, and clinician, during which the benefits and harms of individual treatments as well as the presence of comorbid disorders are considered,” according to Tamara Pringsheim, MD, lead author of a practice guideline published May 6, 2019, by the American Academy of Neurology, and her collaborators.

The panel of nine physicians, two psychologists, and two patient representatives developed the recommendations based on a comprehensive systematic literature review. They concluded that treatments may decrease the frequency and severity of tics but rarely eliminate them.
The guideline was endorsed by the Child Neurology Society and the European Academy of Neurology and is the first such guideline for American neurologists, said Dr. Pringsheim of the University of Calgary (Alta.). Like recent Canadian and European guidelines, it strongly supports the Comprehensive Behavioral Intervention for Tics (CBIT) as a treatment option for tics.
After examining which medical, behavioral, and neurostimulation interventions, compared with placebo or other active interventions, improve tic severity and tic-related impairment in children and adults with Tourette syndrome or a chronic tic disorder, the guideline writers recommended that the evidence was strongest for CBIT as a first-line treatment, relative to other behavioral treatments and medications.
If symptoms affect a patient’s daily life, doctors should consider CBIT, said guideline author John Piacentini, PhD, of the University of California, Los Angeles, at the annual meeting of the American Academy of Neurology. “This treatment combines habit-reversal training, which teaches patients how to control their urges to tic, with other behavioral strategies to reduce stress and other factors that often make tics worse.”
Patients typically see results from CBIT in 8-12 weeks. More CBIT providers are needed, however, to make the treatment readily available to all patients, he said.
The guideline panel members said that there was moderate confidence in the evidence for reduced tic severity for the following therapeutic approaches, compared with placebo: haloperidol, risperidone, aripiprazole (children only), tiapride (children only), clonidine, onabotulinumtoxinA injections, ningdong granule (as formulated by Zhao), (children only), and ling granule (children only). There was low or very low confidence in the evidence for all other therapies for reducing tic severity.
Comorbid conditions
Many people with tic disorders have neurodevelopmental or psychiatric conditions such as ADHD, obsessive-compulsive disorder, and mood and anxiety disorders. The guideline recommends that people with tics be evaluated for these conditions.
Alpha2-adrenergic agonists may improve symptoms of tic disorders and ADHD, the authors said. There was moderate confidence in the evidence for reduced tic severity for people with a comorbid diagnosis of ADHD with clonidine plus methylphenidate (children only) and methylphenidate alone (children only), compared with placebo.
Adults with severe Tourette syndrome who are resistant to medical and behavioral therapy may benefit from deep brain stimulation (DBS), the guideline states. There was moderate confidence in the evidence for reduced tic severity for DBS of the globus pallidus, compared with sham DBS, as an option for adults with severe tics who have failed CBIT and drugs. These patients first must be screened by a mental health professional and continue to be monitored throughout DBS treatment.
Adults with Tourette syndrome who self-treat their tics with cannabis in states where cannabis is legal should see a doctor who can monitor the use of cannabis for efficacy and adverse effects, the guideline says.
Adverse effects of therapy
The panel also examined the risks of harm, including weight gain, elevated prolactin levels, sedation, drug-induced movement disorders, hypotension, bradycardia, and ECG changes with medical treatments, compared with placebo or other active interventions. In regard to weight gain, the panel concluded with moderate confidence that people with tics receiving risperidone or aripiprazole (children only) are probably more likely to gain weight than people receiving placebo. There was low confidence for associations between specific therapies and elevated prolactin levels.
Compared with people receiving placebo, there was moderate confidence that tiapride is probably associated with higher rates of physical tiredness and sleep disturbances (children only), that clonidine is probably associated with sedation, and that guanfacine is probably associated with drowsiness (children only). There was moderate evidence that pimozide is probably associated with extrapyramidal symptoms. There was low confidence that any specific treatment led to hypotension, bradycardia, or ECG changes.
Additional guideline specifics
The guideline’s practice recommendations include explaining the natural history of tic disorders to patients and caregivers and evaluating patients for functional impairment. Watchful waiting is an acceptable approach in people who do not experience functional impairment, and patients receiving medications for tics must have periodic reevaluations for the need for ongoing medical treatment. People with Tourette syndrome should be referred to resources for psychoeducation for teachers and peers, such as the Tourette Association of America.
Comorbid ADHD occurs in 30%-50% of patients with tics. If screening for ADHD is positive, the burden of ADHD symptoms should be assessed and those with functionally impairing ADHD should be treated for the disorder. Similarly, obsessive-compulsive behaviors occur in 10%-50% of those with Tourette syndrome. If an assessment finds comorbid obsessive-compulsive disorder, it should be treated.
Other psychiatric comorbidities with Tourette syndrome include anxiety disorders, oppositional defiant disorder, and mood disorders. When screening for these conditions, one must inquire about suicidal thoughts and suicide attempts and refer to appropriate resources if present, according to the guidelines.
Individuals with tics and comorbid ADHD should be advised that alpha2-adrenergic agonists may provide benefit for both conditions. Alpha2-adrenergic agonists should be prescribed for the treatment of tics when the benefits of treatment outweigh the risks and patients must be counseled regarding common side effects of alpha2-adrenergic agonists, including sedation. Heart rate and blood pressure must be monitored in patients with tics treated with alpha2-adrenergic agonists. If prescribing extended-release guanfacine, one must monitor the QTc interval in patients with a history of cardiac conditions, patients taking other QT-prolonging agents, or patients with a family history of long QT syndrome. If discontinuing alpha2-adrenergic agonists, they must gradually be tapered to avoid rebound hypertension.
If considering antipsychotic therapies, patients must be counseled on the relative risk for extrapyramidal, hormonal, and metabolic adverse effects to inform decision making on which antipsychotic should be prescribed. Before prescribing antipsychotics for tics, ECGs must be performed. The QTc interval must be measured before and after starting pimozide or ziprasidone, or if antipsychotics are coadministered with other drugs that can prolong the QT interval. The lowest effective dose should be prescribed to decrease the risk of adverse effects, and patients should be monitored for drug-induced movement disorders and for metabolic and hormonal adverse effects of antipsychotics. When attempting to discontinue antipsychotics for tics, the medications should be gradually tapered over weeks to months to avoid withdrawal dyskinesias.
If topiramate is prescribed, patients must be counseled regarding common adverse effects, including cognitive and language problems, somnolence, weight loss, and an increased risk of renal stones.
Some patients with Tourette syndrome use cannabis as a self-medication for tics and comorbidities. Because of the risks associated with cannabis use and widespread self-medication with cannabis for tics, where regional legislation and resources allow, physicians must offer to direct patients to appropriate medical supervision when cannabis is used as self-medication for tics. Appropriate medical supervision would entail education and monitoring for efficacy and adverse effects, according to the guidelines.
Where regional legislation allows, physicians prescribing cannabis-based medication must prescribe the lowest effective dose to decrease the risk of adverse effects. Physicians prescribing cannabis-based medication must inform patients that medication may impair driving ability. Physicians prescribing cannabis-based medication to patients with Tourette syndrome must periodically reevaluate the need for ongoing treatment.
A multidisciplinary evaluation is needed to establish when the benefits of treatment outweigh the risks for prescribing DBS for medication-resistant motor and phonic tics. The DSM-5 diagnosis of Tourette syndrome must be confirmed and exclude secondary and functional tic-like movements when considering DBS for medication-resistant tics. A mental health professional must screen patients preoperatively and follow patients postoperatively for psychiatric disorders that may impede the long-term success of the therapy. Physicians must confirm that multiple classes of medication (antipsychotics, dopamine depleters, alpha1 agonists) and behavioral therapy have been administered (or are contraindicated) before prescribing DBS for tics.
The practice guideline was developed with financial support from AAN. Dr. Pringsheim reported no disclosures. Dr. Piacentini reported receiving funding for travel and speaking from foundations and universities and has received royalties from publishers. In addition, he has performed behavior therapy for tics for approximately 50% of his clinical time and has received financial or material support from Pfizer, the National Institute of Mental Health, and foundations.
SOURCE: Pringsheim T et al. Neurology. 2019 May 6. doi: 10.1212/WNL.0000000000007466.
PHILADELPHIA – Approaches to managing tics in patients with Tourette syndrome or chronic tic disorders “should be individualized, and the choice should be the result of a collaborative decision among patient, caregiver, and clinician, during which the benefits and harms of individual treatments as well as the presence of comorbid disorders are considered,” according to Tamara Pringsheim, MD, lead author of a practice guideline published May 6, 2019, by the American Academy of Neurology, and her collaborators.
The panel of nine physicians, two psychologists, and two patient representatives developed the recommendations based on a comprehensive systematic literature review. They concluded that treatments may decrease the frequency and severity of tics but rarely eliminate them.
The guideline was endorsed by the Child Neurology Society and the European Academy of Neurology and is the first such guideline for American neurologists, said Dr. Pringsheim of the University of Calgary (Alta.). Like recent Canadian and European guidelines, it strongly supports the Comprehensive Behavioral Intervention for Tics (CBIT) as a treatment option for tics.
After examining which medical, behavioral, and neurostimulation interventions, compared with placebo or other active interventions, improve tic severity and tic-related impairment in children and adults with Tourette syndrome or a chronic tic disorder, the guideline writers recommended that the evidence was strongest for CBIT as a first-line treatment, relative to other behavioral treatments and medications.
If symptoms affect a patient’s daily life, doctors should consider CBIT, said guideline author John Piacentini, PhD, of the University of California, Los Angeles, at the annual meeting of the American Academy of Neurology. “This treatment combines habit-reversal training, which teaches patients how to control their urges to tic, with other behavioral strategies to reduce stress and other factors that often make tics worse.”
Patients typically see results from CBIT in 8-12 weeks. More CBIT providers are needed, however, to make the treatment readily available to all patients, he said.
The guideline panel members said that there was moderate confidence in the evidence for reduced tic severity for the following therapeutic approaches, compared with placebo: haloperidol, risperidone, aripiprazole (children only), tiapride (children only), clonidine, onabotulinumtoxinA injections, ningdong granule (as formulated by Zhao), (children only), and ling granule (children only). There was low or very low confidence in the evidence for all other therapies for reducing tic severity.
Comorbid conditions
Many people with tic disorders have neurodevelopmental or psychiatric conditions such as ADHD, obsessive-compulsive disorder, and mood and anxiety disorders. The guideline recommends that people with tics be evaluated for these conditions.
Alpha2-adrenergic agonists may improve symptoms of tic disorders and ADHD, the authors said. There was moderate confidence in the evidence for reduced tic severity for people with a comorbid diagnosis of ADHD with clonidine plus methylphenidate (children only) and methylphenidate alone (children only), compared with placebo.
Adults with severe Tourette syndrome who are resistant to medical and behavioral therapy may benefit from deep brain stimulation (DBS), the guideline states. There was moderate confidence in the evidence for reduced tic severity for DBS of the globus pallidus, compared with sham DBS, as an option for adults with severe tics who have failed CBIT and drugs. These patients first must be screened by a mental health professional and continue to be monitored throughout DBS treatment.
Adults with Tourette syndrome who self-treat their tics with cannabis in states where cannabis is legal should see a doctor who can monitor the use of cannabis for efficacy and adverse effects, the guideline says.
Adverse effects of therapy
The panel also examined the risks of harm, including weight gain, elevated prolactin levels, sedation, drug-induced movement disorders, hypotension, bradycardia, and ECG changes with medical treatments, compared with placebo or other active interventions. In regard to weight gain, the panel concluded with moderate confidence that people with tics receiving risperidone or aripiprazole (children only) are probably more likely to gain weight than people receiving placebo. There was low confidence for associations between specific therapies and elevated prolactin levels.
Compared with people receiving placebo, there was moderate confidence that tiapride is probably associated with higher rates of physical tiredness and sleep disturbances (children only), that clonidine is probably associated with sedation, and that guanfacine is probably associated with drowsiness (children only). There was moderate evidence that pimozide is probably associated with extrapyramidal symptoms. There was low confidence that any specific treatment led to hypotension, bradycardia, or ECG changes.
Additional guideline specifics
The guideline’s practice recommendations include explaining the natural history of tic disorders to patients and caregivers and evaluating patients for functional impairment. Watchful waiting is an acceptable approach in people who do not experience functional impairment, and patients receiving medications for tics must have periodic reevaluations for the need for ongoing medical treatment. People with Tourette syndrome should be referred to resources for psychoeducation for teachers and peers, such as the Tourette Association of America.
Comorbid ADHD occurs in 30%-50% of patients with tics. If screening for ADHD is positive, the burden of ADHD symptoms should be assessed and those with functionally impairing ADHD should be treated for the disorder. Similarly, obsessive-compulsive behaviors occur in 10%-50% of those with Tourette syndrome. If an assessment finds comorbid obsessive-compulsive disorder, it should be treated.
Other psychiatric comorbidities with Tourette syndrome include anxiety disorders, oppositional defiant disorder, and mood disorders. When screening for these conditions, one must inquire about suicidal thoughts and suicide attempts and refer to appropriate resources if present, according to the guidelines.
Individuals with tics and comorbid ADHD should be advised that alpha2-adrenergic agonists may provide benefit for both conditions. Alpha2-adrenergic agonists should be prescribed for the treatment of tics when the benefits of treatment outweigh the risks and patients must be counseled regarding common side effects of alpha2-adrenergic agonists, including sedation. Heart rate and blood pressure must be monitored in patients with tics treated with alpha2-adrenergic agonists. If prescribing extended-release guanfacine, one must monitor the QTc interval in patients with a history of cardiac conditions, patients taking other QT-prolonging agents, or patients with a family history of long QT syndrome. If discontinuing alpha2-adrenergic agonists, they must gradually be tapered to avoid rebound hypertension.
If considering antipsychotic therapies, patients must be counseled on the relative risk for extrapyramidal, hormonal, and metabolic adverse effects to inform decision making on which antipsychotic should be prescribed. Before prescribing antipsychotics for tics, ECGs must be performed. The QTc interval must be measured before and after starting pimozide or ziprasidone, or if antipsychotics are coadministered with other drugs that can prolong the QT interval. The lowest effective dose should be prescribed to decrease the risk of adverse effects, and patients should be monitored for drug-induced movement disorders and for metabolic and hormonal adverse effects of antipsychotics. When attempting to discontinue antipsychotics for tics, the medications should be gradually tapered over weeks to months to avoid withdrawal dyskinesias.
If topiramate is prescribed, patients must be counseled regarding common adverse effects, including cognitive and language problems, somnolence, weight loss, and an increased risk of renal stones.
Some patients with Tourette syndrome use cannabis as a self-medication for tics and comorbidities. Because of the risks associated with cannabis use and widespread self-medication with cannabis for tics, where regional legislation and resources allow, physicians must offer to direct patients to appropriate medical supervision when cannabis is used as self-medication for tics. Appropriate medical supervision would entail education and monitoring for efficacy and adverse effects, according to the guidelines.
Where regional legislation allows, physicians prescribing cannabis-based medication must prescribe the lowest effective dose to decrease the risk of adverse effects. Physicians prescribing cannabis-based medication must inform patients that medication may impair driving ability. Physicians prescribing cannabis-based medication to patients with Tourette syndrome must periodically reevaluate the need for ongoing treatment.
A multidisciplinary evaluation is needed to establish when the benefits of treatment outweigh the risks for prescribing DBS for medication-resistant motor and phonic tics. The DSM-5 diagnosis of Tourette syndrome must be confirmed and exclude secondary and functional tic-like movements when considering DBS for medication-resistant tics. A mental health professional must screen patients preoperatively and follow patients postoperatively for psychiatric disorders that may impede the long-term success of the therapy. Physicians must confirm that multiple classes of medication (antipsychotics, dopamine depleters, alpha1 agonists) and behavioral therapy have been administered (or are contraindicated) before prescribing DBS for tics.
The practice guideline was developed with financial support from AAN. Dr. Pringsheim reported no disclosures. Dr. Piacentini reported receiving funding for travel and speaking from foundations and universities and has received royalties from publishers. In addition, he has performed behavior therapy for tics for approximately 50% of his clinical time and has received financial or material support from Pfizer, the National Institute of Mental Health, and foundations.
SOURCE: Pringsheim T et al. Neurology. 2019 May 6. doi: 10.1212/WNL.0000000000007466.
REPORTING FROM AAN 2019
Aspirin did not improve sensitivity of fecal immunochemical test
The study was inspired by an observational study in which the sensitivity of the fecal immunochemical test (FIT) was enhanced in adults taking aspirin for cardiovascular disease prevention.
It was surmised that “aspirin predisposes to subclinical bleeding and, hence, increased detection of advanced adenomas by FIT. This suggests that administration of aspirin prior to fecal sampling might be a practical intervention to increase FIT sensitivity,” wrote Hermann Brenner, MD, of the German Cancer Research Center, Heidelberg, and colleagues.
In a study published in JAMA, the researchers analyzed 2,134 adults aged 40-80 years who were scheduled for colonoscopy. The study participants, who had no recent use of aspirin or other drugs with antithrombotic effects, were randomized to a 300-mg aspirin tablet or a placebo tablet 2 days before stool samples were obtained. The average age of the participants was 60 years, and 78% of the colonoscopies were for primary screening.
Overall, 224 of the study participants had advanced neoplasms, including 216 individuals with advanced adenoma and 8 with colorectal cancer.
Sensitivity was not significantly different between the aspirin and placebo groups at either of two predefined cutoffs of 10.2-mcg Hb/g stool (40.2% and 30.4%, respectively) and 17-mcg Hb/g stool (28.6% and 22.5%, respectively).
Two serious adverse events occurred in the aspirin group but were not considered related to aspirin. No serious adverse events were reported in the placebo group.
Although the results do not support the findings from previous observational studies, they suggest the need for more research of the potential impact of aspirin on FIT sensitivity, the researchers said.
“This trial was designed to detect a 24% absolute increase in sensitivity and was not adequately powered to detect small differences that may nevertheless be clinically meaningful given the low morbidity observed, the low cost of a single dose of aspirin, and the ease of implementation of this intervention across health systems,” they explained.
Additional limitations of the study included lack of adjustment for multiple testing in secondary analyses, inability to analyze subtypes of advanced neoplasms, and the inclusion of only one round of screening. FIT programs usually include multiple rounds, the researchers said. Therefore, “potential effects on detection of advanced neoplasms and reduction of CRC incidence and mortality in the long run are yet to be determined.”
SOURCE: Brenner H et al. JAMA. 2019;321(17):1686-1692.
FROM JAMA
Key clinical point: A dose of aspirin did not improve fecal immunochemical test (FIT) sensitivity to detect colorectal neoplasms in adults with no recent use of aspirin or other drugs with antithrombotic effects.
Major finding: Sensitivity of the FIT test was 40% in the aspirin group and 30% in the placebo group, a nonsignificant difference.
Study details: The data come from a randomized trial of 2,134 adults who received aspirin or placebo 2 days before stool sampling for FIT. The study participants were scheduled for colonoscopy at 14 gastroenterology practices and 4 hospitals in Germany.
Disclosures: Lead author Dr. Brenner disclosed grants from the German Federal Ministry of Education and Research, which funded the study, as well as the German Cancer Aid, the European Commission, the U.S. National Institutes of Health, Applied Proteomics, Roche Diagnostics, Volition, and Goodgut during the study period.
Source: Brenner H et al. JAMA. 2019;321(17):1686-92.
Product News May 2019
Altreno Lotion Now Available for Acne
Ortho Dermatologics launches Altreno (tretinoin) Lotion 0.05% for the treatment of acne in patients 9 years and older. Altreno was designed for women with adult acne, providing efficacy and tolerability in an elegant lotion formulation with once-daily dosing. Altreno Lotion is formulated with soluble collagen, glycerin, and sodium hyaluronate, which hydrate the skin. For more information visit www.altreno.com.
Avène XeraCalm A.D Soothes Dry Skin
Pierre Fabre Dermo-Cosmetique USA introduces new XeraCalm A.D products formulated for dry skin prone to itching and/or atopic dermatitis. The XeraCalm A.D line includes the Lipid-Replenishing Balm and the Lipid-Replenishing Cream, both with the new D.E.F.I. (Device for Exclusive Formula Integrity) pump to dispense the sterile formula and block allergens, bacteria, or air that could compromise safety and efficacy. The line also includes the Lipid-Replenishing Cleansing Oil and the new Ultra-Rich Cleansing Bar. For more information visit www.AveneUSA.com.
Duobrii Receives FDA Approval for Psoriasis
Ortho Dermatologics announces US Food and Drug Administration approval of the New Drug Application for Duobrii (halobetasol propionate and tazarotene) Lotion 0.01%/0.045% for treatment of plaque psoriasis in adults. Duobrii provides the benefits of combination therapy with a potent topical corticosteroid and a topical retinoid. Duobrii is expected to be available in June 2019. For more information visit www.duobriilotion.com.
Dupixent Approved for Atopic Dermatitis in Adolescents
sanofi-aventis and Regeneron Pharmaceuticals, Inc, announce US Food and Drug Administration approval of Dupixent (dupilumab) for adolescent patients aged 12 to 17 years with moderate to severe atopic dermatitis (AD) whose disease is not adequately controlled with topical prescription therapies or when those therapies are not advisable. Dupixent is a targeted biologic therapy that inhibits signaling of IL-4 and IL-13, which play a role in the inflammation underlying AD. It reduces the extent and severity of AD and itching. Dupixent also is indicated for adult patients with AD. For more information visit www.dupixentHCP.com.
Jeuveau Approved for Glabellar Lines
Evolus, Inc, announces US Food and Drug Administration approval of Jeuveau (prabotulinumtoxinA-xvfs), an acetylcholine release inhibitor and neuromuscular blocking agent, for temporary improvement in the appearance of moderate to severe glabellar lines associated with corrugator and/or procerus muscle activity in adults. Jeuveau will be available in spring 2019. For more information visit www.evolus.com.
Ortho Dermatologics Cash-Pay Prescription Program Offers Predictable Prices
Ortho Dermatologics launches a cash-pay prescription program that will provide physicians and patients with direct access to many branded products at predictable prices ($50 to $115). The cash-pay prescription program gives patients access to treatments for acne, actinic keratosis and superficial basal cell carcinoma, barrier repair (eg, eczema treatments), wounds, and corticosteroid-responsive diseases and atopic dermatitis at a fixed price without the need for insurance, co-pay cards, or prior authorizations. After the physician issues an e-prescription, the product is shipped to the patient's home within 48 hours. Ortho Dermatologics plans to include approximately 20 products in the program over the next 18 months. There currently are 11 products available. For more information visit www.dermatology.com.
The Skin Cancer Foundation Awards 3 Research Grants
The Skin Cancer Foundation announces the winners of its annual research grant awards. The foundation awarded $125,000 total to 3 separate projects to support dermatology department research and clinical studies related to skin cancer. The 2019 recipients were Stephanie Savory, MD; Shruti Naik, PhD; and Rie Takahashi, MD, PhD. For more information visit www.SkinCancer.org/research.
The Skin Cancer Foundation Introduces NMSC Digital Publication
The Skin Cancer Foundation launches Carcinomas & Keratoses, a digital publication that sheds light on the most recent and important developments in keratinocyte cancers and precancers (nonmelanoma skin cancer), including basal cell carcinoma, cutaneous squamous cell carcinoma, and actinic keratosis. The publication features content written by dermatologists and the foundation's editorial team. Désirée Ratner, MD, will serve as Editor-in-Chief. For more information visit www.CarcinomasandKeratoses.org.
Tremfya One-Press Injector Approved for Plaque Psoriasis
Janssen Biotech, Inc, announces US Food and Drug Administration approval of Tremfya (guselkumab), a single-dose, patient-controlled, One-Press injector for adults with moderate to severe plaque psoriasis. The One-Press injector allows patients to control the rate and pressure of their injection, and it hides the needle throughout the process. Tremfya is an IL-23 blocker administered as a 100-mg subcutaneous injection once every 8 weeks, after starter doses at weeks 0 and 4. For more information visit www.tremfyahcp.com.
If you would like your product included in Product News, please email a press release to the Editorial Office at [email protected].
Criterion based on the central vein sign distinguishes between MS and mimics
PHILADELPHIA – according to research presented at the annual meeting of the American Academy of Neurology. Using this criterion in clinical practice is feasible, the researchers added.
Several years ago, researchers proposed the central vein sign as a specific and sensitive imaging biomarker for distinguishing between multiple sclerosis (MS) and its imaging mimics. Recent studies have proposed criteria for this distinction that are based on the proportion of lesions with the central vein sign. Criteria that are based on the absolute numbers of lesions with the central vein sign, however, may be more applicable in clinical practice, said Tim Sinnecker, MD, research associate at the University of Basel (Switzerland).
Dr. Sinnecker and colleagues conducted a multicenter study to evaluate the sensitivity and specificity of criteria that are based on the absolute numbers of lesions with the central vein sign (CVS) in distinguishing MS from non-MS conditions on clinical 3T brain MRI. They analyzed 606 participants with clinically isolated syndrome (CIS; n = 117), relapsing remitting MS (RRMS; n = 236, of whom 108 had a disease duration shorter than 5 years), aquaporin 4 antibody–positive neuromyelitis optica spectrum disorder (n = 32), systemic lupus erythematosus (n = 25), migraine (n = 29), cluster headache (n = 5), diabetes mellitus (n = 20), or other types of small-vessel disease (n = 142). Raters blinded to clinical data and lesion distribution determined the occurrence of CVS on 3T T2*-weighted or susceptibility-weighted imaging. The researchers assessed the sensitivity and specificity of different CVS lesion criteria that were defined according to the absolute numbers of lesions with CVS.
In total, Dr. Sinnecker and colleagues analyzed 4,447 lesions. The “two-CVS-lesions criterion” (two or more lesions with CVS) had a sensitivity and specificity of 76.2% and 79.3%, respectively, in distinguishing between RRMS/CIS and non-MS. The “three-CVS-lesions criterion” (three or more lesions with CVS) had a sensitivity and specificity of 61.9% and 89.0%, respectively. The observed sensitivity and specificity values were consistent across all disease subgroups examined in the study, including CIS and early RRMS. These results indicate that positive criteria based on CVS could be used to support the diagnosis of MS, Dr. Sinnecker said.
Dr. Sinnecker reported receiving personal compensation for consulting, serving on a scientific advisory board, speaking, or other activities with Actelion.
SOURCE: Sinnecker T et al. AAN 2019, Abstract S6.002.
REPORTING FROM AAN 2019