User login
Anticoagulants and pregnancy: When are they safe?
Anticoagulation is essential in a wide variety of conditions in women of child-bearing age. Some, such as venous thromboembolism, occur more often during pregnancy. Others, such as recurrent fetal loss in the setting of antiphospholipid antibodies, are specific to pregnancy.
While anticoagulants are useful in many circumstances, their use during pregnancy increases the risk of hemorrhage and other adverse effects on the mother and the fetus. Treatment with anticoagulants during pregnancy must therefore be carefully considered, with judicious selection of the agent, and with reflection on the physiologic changes of pregnancy to ensure appropriate dosing. In this article, we review these issues.
WHY IS THROMBOTIC RISK HIGHER DURING PREGNANCY?
Venous thromboembolism is among the leading causes of maternal death in developed countries.1–3 Modern care has dramatically reduced the risk of maternal death from hemorrhage, infection, and hypertension, but rates of morbidity and death from thrombosis have remained stable or increased in recent years.4
- Much higher levels of fibrinogen and factors VII, VIII, IX, and X
- Lower levels of protein S and increased resistance to activated protein C
- Impaired fibrinolysis, due to inhibitors derived from the placenta.
Acquired antithrombin deficiency may also occur in high-proteinuric states such as nephrotic syndrome or preeclampsia, further increasing thrombotic risk. Pooling of venous blood, caused by progesterone-mediated venous dilation and compounded by compression of the inferior vena cava by the uterus in later pregnancy, also increases thrombotic risk. And endothelial disruption of the pelvic vessels may occur during delivery, particularly during cesarean section.
Additional factors that increase thrombotic risk include immobilization, such as bed rest for pregnancy complications; surgery, including cesarean section; ovarian hyperstimulation during gonadotropin use for in vitro fertilization; trauma; malignancy; and hereditary or acquired hypercoagulable states.6 These hypercoagulable states include deficiencies of antithrombin or the intrinsic anticoagulant proteins C or S; resistance to activated protein C, usually due to the factor V Leiden mutation; the PT20210A mutation of the prothrombin gene; hyperhomocystinemia due to mutation of the methyltetrahydrofolate reductase (MTHFR) gene; and the sustained presence of antiphospholipid antibodies, including lupus anticoagulant antibodies, sometimes also with moderately high titers of anticardiolipin or beta-2-glycoprotein I antibodies.
Other conditions that increase thrombotic risk include hyperemesis gravidarum, obesity, inflammatory bowel disease, infection, smoking, and indwelling intravenous catheters.6 Given the multitude of risk factors, pregnant women have a risk of thrombotic complications three to five times higher than nonpregnant women.7
HEPARIN USE DURING PREGNANCY
Low-molecular-weight heparins (LMWHs)8 and unfractionated heparin bind to anti-thrombin and thus change the shape of the antithrombin molecule, dramatically increasing its interaction with the clotting factors Xa and prothrombin (factor II). The enhanced clearance of these procoagulant proteins leads to the anticoagulant effect. Unfractionated heparin has roughly equivalent interaction with factors Xa and II and prolongs the activated partial thromboplastin time (aPTT), which is therefore used to monitor the intensity of anticoagulation.
LMWHs, on the other hand, interact relatively little with factor II and do not predictably prolong the aPTT. Monitoring their effect is therefore more difficult and requires direct measurement of anti-factor-Xa activity. This test is widely available, but it is time-consuming (it takes several hours and results may not be available within 24 hours if the test is requested “after hours”), and therefore it is of limited use in the acute clinical setting. While weight-based dosing of LMWHs is reliable and safe in nonpregnant patients, it has not yet been validated for pregnant women.
Unfractionated heparin has been used for decades for many indications during pregnancy. It is a large molecule, so it does not cross the placenta and thus, in contrast to the coumarin derivatives, does not cause teratogenesis or toxic fetal effects. Its main limitations in pregnancy are its inconvenient dosing (at least twice daily when given subcutaneously) and its potential maternal adverse effects (mainly osteoporosis and heparin-induced thrombocytopenia).
Over the last 10 years LMWHs have become the preferred anticoagulants for treating and preventing thromboembolism in all patients. They are equivalent or superior to unfractionated heparin in efficacy and safety in the initial treatment of acute deep venous thrombosis9,10 and pulmonary embolism11,12 outside of pregnancy. While comparative data are much less robust in pregnant patients, several series have confirmed the safety and efficacy of LMWHs in pregnancy.13–15 LMWHs do not cross the placenta15–17 and thus have a fetal safety profile equivalent to that of unfractionated heparin.
Pregnancy alters metabolism of LMWHs
The physiologic changes of pregnancy alter the metabolism of LMWH, resulting in lower peak levels and a higher rate of clearance,18,19 and so a pregnant woman may need higher doses or more frequent dosing.
Recent evidence suggests that thromboprophylaxis can be done with lower, fixed, once-daily doses of LMWH throughout pregnancy,20 although some clinicians still prefer twice-daily dosing (particularly during the latter half of pregnancy).
Pending more research on weight-based dosing of LMWH in pregnancy, anti-factor- Xa activity levels should be measured after treatment is started and every 1 to 3 months thereafter during pregnancy.21 Doses should be adjusted to keep the peak anti-Xa level (ie, 4 hours after the dose) at 0.5 to 1.2 U/mL.22
Heparin-induced thrombocytopenia
Type-2 heparin-induced thrombocytopenia is an uncommon but serious adverse effect of unfractionated heparin therapy (and, less commonly of LMWH), caused by heparin-dependent immunoglobulin G (IgG) antibodies that activate platelets via their Fc receptors, potentially precipitating life-threatening arterial or venous thrombosis.
In a trial in nonpregnant orthopedic patients,23 clinical heparin-induced thrombocytopenia occurred in 2.7% of patients receiving unfractionated heparin vs 0% of those receiving LMWH; heparin-dependent IgG was present in 7.8% vs 2.2%, respectively.
Fortunately, heparin-induced thrombocytopenia seems to be very rare in pregnancy: two recent prospective series evaluating prolonged LMWH use in pregnancy13,15 revealed no episodes of this disease. Nonetheless, it is reasonable to measure the platelet count once or twice weekly during the first few weeks of LMWH use and less often thereafter, unless symptoms of heparin-induced thrombocytopenia develop. In pregnant women with heparin-induced thrombocytopenia or heparin-related skin reactions, other anticoagulants must be considered24 (see discussion later).
Heparin-induced osteoporosis
Heparin-induced osteoporosis, a potential effect of prolonged heparin therapy, is of concern, given the prolonged duration and high doses of unfractionated heparin often needed to treat venous thromboembolism during pregnancy. Several studies found significant loss of bone mineral density in the proximal femur25 and lumbar spine26 during extended use of unfractionated heparin in pregnancy.
Fortunately, LMWH appears to be much safer with respect to bone loss. Three recent studies27–30 evaluated the use of LMWH for extended periods during pregnancy, and none found any greater loss of bone mineral density than that seen in normal pregnant controls. Giving supplemental calcium (1,000–1,500 mg/day) and vitamin D (400–1,000 IU/day) concomitantly with unfractionated heparin or LMWH in pregnancy is advisable to further reduce the risk.
Interrupt heparin to permit regional anesthesia
Heparin therapy should be temporarily stopped during the immediate peripartum interval to minimize the risk of hemorrhage and to permit regional anesthesia. Because of the theoretical risk of paraspinal hemorrhage in women receiving heparin who undergo epidural or spinal anesthesia, many anesthetists will not perform neuraxial regional anesthesia in women who have recently received heparin.
Since unfractionated heparin has a relatively short duration of action, the American Society of Regional Anesthesia states that subcutaneous unfractionated heparin prophylaxis is not a contraindication to neuraxial regional anesthesia.31 However, LMWHs should be stopped for at least 12 to 24 hours before regional anesthesia can be considered safe. This issue is discussed in more detail in the section on peripartum and postpartum management of anticoagulation, below.
In summary, LMWH during pregnancy offers a number of advantages over unfractionated heparin: equivalent efficacy, once- or twice-daily dosing, lower risk of heparin-induced thrombocytopenia and osteoporosis, and less-intensive monitoring. Unfractionated heparin can be offered to women who cannot afford LMWH (which costs four to five times more), and it may be used peripartum to reduce hemorrhagic risk and to permit regional anesthesia.
COUMARINS
Coumarins are the mainstay of anticoagulant therapy in most nonpregnant women beyond the immediate thrombotic period.
Warfarin (Coumadin) is the most widely used coumarin because it has a predictable onset and duration of action and excellent bioavailability.32 Others, such as acenocoumarol (Sintrom) and phenprocoumon (Marcoumar), are used more outside the United States but can be ordered or brought into the United States.
Coumarins interfere with vitamin K metabolism, inhibiting the generation of vitamin-K-dependent procoagulant proteins (factors II, VII, IX, and X) and thereby preventing clotting. They also inhibit the formation of the vitamin-K-dependent intrinsic anticoagulant proteins C and S.
Major bleeding is the most significant side effect of coumarin therapy, occurring at a rate of 4% to 6% over 3 months when the prothrombin time is maintained at an international normalized ratio (INR) of 2 to 3,33 and more often if the INR is higher.
Other issues with warfarin are the effect of variations in dietary vitamin K intake on anticoagulation and potential drug interactions that may alter the anticoagulant effect. Thus, the INR needs to be monitored closely.
Risks to the fetus and the mother
Unlike the heparins, coumarins freely cross the placenta and thus pose a risk of teratogenicity. A cluster of fetal malformations including “warfarin embryopathy” (nasal bone hypoplasia and chondrodysplasia punctata) can occur when the drug is used between 6 and 12 weeks of gestation. Warfarin embryopathy may be avoided by stopping warfarin prior to 6 weeks from the onset of the last menstrual period (ie, 6-week “menstrual age” or 4-week gestational age34).
Later in pregnancy, warfarin is associated with potential fetal bleeding complications leading to central nervous system abnormalities, increased rates of intrauterine fetal death, and pregnancy loss. In pregnant women with mechanical cardiac valve prostheses who received oral anticoagulants throughout pregnancy, the incidence of congenital anomalies was 6.4% to 10.2%.35 Fetal demise (spontaneous abortion, stillbirth, neonatal death) was also very common (29.7% to 33.6% of pregnancies) in coumarin-treated women.
Severe maternal hemorrhage may also occur in pregnant women on oral anticoagulants, particularly those who remain fully anticoagulated around the time of labor and delivery.
General caveats to warfarin in pregnancy
Because of the many maternal and fetal concerns, oral anticoagulant use in pregnancy is largely restricted to women with older-generation prosthetic heart valves in whom the very high maternal thrombotic risk may outweigh the risk of maternal and fetal side effects.
While there are limited data on warfarin use in pregnant women with antiphospholipid syndrome,36 warfarin use in such patients should be considered only for those at highest risk and with careful informed consent. These issues are discussed further below in the section on mechanical heart valve prostheses.
ANTIPLATELET DRUGS
Aspirin is an antiplatelet agent rather than an anticoagulant. Although considered inadequate for preventing venous thrombosis in high-risk groups when used alone, aspirin can moderately reduce the risk of deep venous thrombosis and pulmonary embolism in nonpregnant patients.37 It also has a well-accepted role in preventing arterial thrombotic events, ie, coronary artery disease and stroke.38
Low-dose aspirin (≤ 100 mg/day) has been extensively evaluated during pregnancy39–41 and has been shown to be safe and effective in reducing the risk of preeclampsia in high-risk women39 and in treating women with antiphospholipid antibodies and recurrent pregnancy loss42 (in conjunction with prophylactic doses of heparin). Although higher doses of aspirin and other nonsteroidal anti-inflammatory drugs can be toxic to the fetus, low doses have been shown to be safe throughout pregnancy.43
Dipyridamole (Persantine) has been studied extensively in pregnancy, and while it appears to be safe, it has not found a well-defined therapeutic role.
Other antiplatelet drugs have been only rarely used, and data on their safety and efficacy during pregnancy are limited to case reports, for example, on ticlopidine44 (Ticlid) and clopidogrel45,46 (Plavix) given during pregnancy in women with cardiac disease. These drugs do not appear to be major teratogens or to cause specific fetal harm. Their use may be reasonable in some high-risk situations, such as recurrent thrombotic stroke despite aspirin therapy. They may be used alone or with other anticoagulants in women with a coronary or other vascular stent if fetal safety is uncertain or if there is an increased risk of maternal bleeding.
NEWER ANTICOAGULANTS
Danaparoid
The heparinoid danaparoid (Orgaran) is an LMWH, a combination of heparan, dermatan, and chondroitin sulfate. Since it is derived from heparin, in theory it can cross-react with antiheparin antibodies, but this is generally not a problem. Danaparoid inhibits factor Xa, and monitoring is via measurement of anti-factor-Xa activity levels. It has been shown to be safe and effective in nonpregnant patients with heparin-induced thrombocytopenia.51
Although no controlled study has been published on danaparoid in pregnancy, at least 51 pregnancies in 49 patients treated with danaparoid have been reported.52 Thirty-two of the patients received danaparoid because of heparin-induced thrombocytopenia and 19 because of heparin-induced skin intolerance. These reports suggest that danaparoid does not cross the placenta53 and that it may be effective and safe during pregnancy.54 For this reason, it is probably the preferred anticoagulant in pregnant patients with heparin-induced thrombocytopenia or other serious reactions to heparin.
Unfortunately, danaparoid has two major disadvantages. First, it has a prolonged half-life and no effective reversing agent, which makes its use problematic close to the time of delivery. Second, and perhaps more relevant to this discussion, it is not readily available in the United States; it was removed from the market by its manufacturer in April 2002 for business reasons rather than because of concerns over toxicity. It is still available in Canada and Europe, and it can be obtained in special circumstances in the United States via the US Food and Drug Administration (FDA); this may be worthwhile in pregnant patients who require a nonurgent alternative to heparin.
Direct thrombin inhibitors
Lepirudin (Refludan), bivalirudin (Angiomax), and argatroban are direct thrombin inhibitors and exert their anticoagulant effect independently of antithrombin. They are given by continuous intravenous infusion, and they have a very short half-life.
Lepirudin and argatroban are typically monitored via the aPTT. Bivalirudin can be monitored with the activated clotting time, partial thromboplastin time, or INR, depending on the circumstances. None of these agents generates or cross-reacts with antibodies generated in heparin-induced thrombocytopenia. None has an antidote, but the short half-life usually obviates the need for one.
Unfortunately, pregnancy data are very sparse for all three of these new agents. Argatroban has a low molecular weight and likely crosses the placenta. Also, because these agents are given intravenously, they are not practical for long-term use in pregnancy.
Fondaparinux
Fondaparinux (Arixtra), a direct factor Xa inhibitor, binds to antithrombin, causing an irreversible conformational change that increases antithrombin’s ability to inactivate factor Xa (as do the heparins). It has no effect on factor IIa (thrombin) and does not predictably affect the aPTT. Its half-life is 17 hours, and no agent is known to reverse its anticoagulant effect, although some experts would recommend a trial of high-dose recombinant factor VIIa (Novo-Seven) in uncontrolled hemorrhage.
While not FDA-approved for treating heparin-induced thrombocytopenia, it has been used for this in some patients.55–58 Animal studies and in vitro human placental perfusion studies suggest that fondaparinux does not cross the placenta in significant amounts.49 Since danaparoid is not available in the United States, fondaparinux would likely be the first choice among the newer anticoagulants when treating heparin-induced thrombocytopenia in pregnancy.
INDICATIONS FOR ANTICOAGULANTS DURING PREGNANCY
Acute deep venous thrombosis and pulmonary embolism
Anticoagulant therapy should begin as full doses of either LMWH or intravenous unfractionated heparin. We prefer starting with LMWH, as it can be started rapidly with less need for nursing care (eg, no need to start and maintain an intravenous line and monitor the aPTT) and has excellent safety. If LMWH is selected, initial dosing should be based on the current weight (Table 2). Subsequent monitoring of the peak anti-factor-Xa activity levels (ie, 4 hours after the dose) is recommended, with the first level drawn in the first few days of treatment, and repeat levels every 1 to 3 months for the rest of treatment. As mentioned earlier, weight-based dosing has not been systematically evaluated in pregnancy.
If unfractionated heparin is the initial agent, it should be given as a bolus followed by a continuous infusion, ideally utilizing a weight-based nomogram to estimate required doses, with adjustment of the infusion rate to maintain the aPTT at 1.5 to 2.5 times the baseline value (obtained during pregnancy). After several days, the heparin may be switched to LMWH in therapeutic doses (Table 2).
Alternatively, in women approaching term or who cannot afford LMWH, anticoagulation may be continued as adjusted-dose subcutaneous unfractionated heparin, ie, two or three large daily doses of subcutaneous heparin to provide therapeutic levels of anticoagulation. The starting dose can be calculated as the total units of heparin required to maintain full anticoagulation intravenously over 24 hours, given as two or three divided doses (Table 2). The aPTT at the mid-dosing interval (eg, 6 hours after the subcutaneous dose during every-12-hour dosing) should be monitored and the dose adjusted to maintain the aPTT at 1.5 to 2.5 times the baseline value.
A therapeutic level of anticoagulation should be maintained for at least 3 months after an acute thrombotic event during pregnancy, though many physicians prefer to continue full anticoagulation for a total of 6 months. Beyond this interval, if the woman is still pregnant, the anticoagulation may be reduced in intensity, perhaps even to a prophylactic level for the duration of the pregnancy (see discussion below on prior venous thromboembolic events) (Table 2). Peripartum and postpartum anticoagulation are discussed further below.
PRIOR VENOUS THROMBOEMBOLIC EVENT
While all pregnant women are at higher risk of venous thrombosis, the overall incidence of thromboembolism is only about one event per 1,000 pregnancies. Routine thromboprophylaxis in all pregnant women is therefore not justified. However, women who have previously had a venous thromboembolic event are at a substantially higher risk of recurrent thrombosis and should be considered for thromboprophylaxis in all subsequent high-risk situations, including pregnancy.
For women on indefinite therapeutic anticoagulation (ie, because of recurrent thrombosis), full therapeutic anticoagulation with LMWH or adjusted-dose unfractionated heparin should be maintained throughout pregnancy, as described above.
Which other women should receive prophylactic anticoagulation is a topic of ongoing debate and controversy.
How great is the risk of recurrent thromboembolism?
A small observational study59 examined the risk of recurrent venous thromboembolism during subsequent pregnancies in women with a prior thrombotic event. Anticoagulation was withheld during the antepartum period and restarted briefly after delivery. Among the 125 women enrolled, recurrent venous thromboembolism occurred in 4.8%, with half of the events occurring during the antepartum period. Among those with underlying thrombophilia, the rate of recurrent venous thromboembolism was 13% (95% confidence interval [CI] 1.7%–40.5%) to 20% (95% CI 2.5%–56.5%), and those with a prior idiopathic clot without thrombophilia had an event rate of 7.7% (95% CI 0.01%–25.1%). The subgroup with a prior reversible risk factor (at the time of their initial venous thromboembolic event) and without detectable thrombophilia had no recurrent events.
This study suggests that women with prior venous thromboembolism and thrombophilia or a prior idiopathic thrombotic event are at a substantial risk of recurrent thrombotic events during pregnancy. And other data confirm the high risk of recurrent venous thromboembolism in thrombophilic pregnant women.60 These women should all be offered active antepartum and postpartum thromboprophylaxis with LMWH or unfractionated heparin (Tables 2 and 4). Women without thrombophilia but with a history of venous thromboembolism related to pregnancy or oral contraceptive use also have a substantial risk of recurrent venous thrombosis and should be offered antepartum and postpartum thromboprophylaxis.61 In contrast, women with a prior “secondary” clot, no thrombophilia, and no additional current risk factors (Table 1) appear to be at low risk of recurrent venous thromboembolism.
The risks should be discussed with these women, with an option for close clinical surveillance during pregnancy (Table 4), but with a low threshold to investigate any worrisome symptoms. Such women may also elect to take LMWH or unfractionated heparin during pregnancy.
Which heparin to use?
Prophylactic anticoagulation during pregnancy can be with either LMWH or unfractionated heparin. For most women this involves “prophylactic” dosing with the goal of maintaining a mid-interval anti-factor-Xa activity level of approximately 0.05 to 0.2 U/mL. Thromboprophylaxis with LMWH can be with lower, fixed, once-daily doses throughout pregnancy20 (Table 2), although some clinicians still prefer twice-daily dosing. The heparin should be started as soon as pregnancy is confirmed, as the pregnancy-associated increase in thrombotic risk begins by the middle of the first trimester.
To maintain effective prophylactic levels, the dose of unfractionated heparin should be increased sequentially over the trimesters62,63: approximately 5,000 units subcutaneously twice daily in the first trimester, then 7,500 units twice daily in the second trimester, and 10,000 units twice daily in the third trimester for a woman of average size.
When to add low-dose aspirin
Women with antiphospholipid antibodies, particularly those with prior recurrent pregnancy loss or fetal demise, should receive aspirin 81 mg/day in addition to heparin.39 The aspirin may be started prior to conception or when pregnancy is confirmed.
Other measures
Women on anticoagulant therapy who are at risk of recurrent venous thromboembolism should be encouraged to wear elastic compression stockings. Intermittent pneumatic compression of the legs via automated devices may be considered for women hospitalized for any reason or on bedrest.
Whichever measures are used, a high index of suspicion and a low threshold for investigating for recurrent thrombosis should be maintained throughout pregnancy and the puerperium.
PERIPARTUM AND POSTPARTUM MANAGEMENT OF ANTICOAGULATION
Heparin therapy must be interrupted temporarily during the immediate peripartum interval to minimize the risk of hemorrhage and to allow for the option of regional anesthesia. As mentioned earlier, because of the theoretical risk of paraspinal hemorrhage in women receiving heparin who undergo epidural or spinal anesthesia, the American Society of Regional Anesthesia guidelines advise waiting to insert the needle at least 10 to 12 hours after the last prophylactic dose of LMWH, and at least 24 hours after the last therapeutic dose.31
The guidelines state that neuraxial anesthesia is not contraindicated in patients on prophylactic unfractionated heparin.31
To facilitate use of regional anesthesia in these women, therefore, options include:
- Electively stopping LMWH 24 hours before planned induction of labor
- Electively stopping prophylactic-dose LMWH or unfractionated heparin at about 38 weeks of gestation, to await spontaneous labor, or
- Switching therapeutic or prophylactic LMWH to unfractionated heparin at about 36 weeks of gestation, with instructions to discontinue the injections in the earliest stages of spontaneous labor. This aims to shorten the heparin-free period required before neuraxial anesthesia while minimizing maternal thrombotic risk.
Additional advantages to using unfractionated heparin peripartum include the option of obtaining a rapid aPTT measurement to confirm the absence of a significant ongoing heparin effect prior to regional anesthesia or delivery, and the ability to completely reverse the heparin effect with protamine sulfate if major bleeding occurs. LMWHs are only partially reversible.64
Interrupting anticoagulation after an initial thrombotic event
If therapeutic anticoagulation must be interrupted for labor within 1 month of the initial thrombotic event, the risk of recurrent thrombotic complications is high65; these women must be observed very carefully and may benefit from intravenous heparin before and after delivery. They may even merit placement of a temporary vena cava filter (particularly if less than 2 weeks have elapsed since the venous thromboembolic event and in women with a large deep venous clot burden), a procedure that has been used safely but little studied in pregnant women.66
Fluoroscopic guidance may be needed for filter placement. This exposes the fetus to radiation, but the low-level exposure at this late gestational age is unlikely to pose a significant risk. The filter may be removed within 1 to 2 weeks postpartum, assuming there are no ongoing contraindications to anticoagulation.
In the rare woman with antithrombin deficiency and a recent or prior thrombotic event, giving antithrombin concentrate during the peripartum (heparin-free) interval has been described and may be considered under the guidance of a hematologist.67
Ongoing anticoagulation is essential postpartum, as the puerperium is the period of highest day-to-day risk of thromboembolic events: about one-third of pregnancy-associated events occur during these 6 to 12 weeks.2 Heparin should be resumed 6 to 12 hours after delivery, once hemostasis is confirmed.
Options for women requiring ongoing therapeutic anticoagulation include intravenous heparin started without a bolus, to minimize bleeding risk, with aPTT measured 12 hours later, or an initial prophylactic dose of LMWH 6 to 12 hours postpartum, with therapeutic dosing resumed on postpartum day 1. If prophylactic dosing is desired, unfractionated heparin or LMWH may be given subcutaneously starting at about 6 hours postpartum.
Warfarin in the puerperium
Women may subsequently be maintained on either LMWH or unfractionated heparin, or switched to an oral anticoagulant such as warfarin. Although warfarin may appear in minute amounts in breast milk, it has not been associated with adverse events in newborns and is considered compatible with breastfeeding.68 Heparin should be continued during the initial days of warfarin therapy, until the INR is at a therapeutic level for 24 hours. Some physicians prefer to delay warfarin for several days, giving LMWH alone in the immediate postpartum period, to allow wound-healing and to reduce bleeding risk.
Postpartum, anticoagulation should be continued for at least 6 to 12 weeks, at which point the physiologic changes in the coagulation system related to pregnancy will have returned to normal.
THROMBOPHILIA WITHOUT A PREVIOUS THROMBOEMBOLIC EVENT
Over the last 5 to 10 years, practitioners have been seeing many more young women with genetic or acquired thrombophilias who have never had a venous thromboembolic event. Physicians must advise these women about their risk of thromboembolic events during pregnancy and about the appropriateness of anticoagulant use.
Thrombophilias are often detected in women who develop venous thrombosis during pregnancy,69–71 but they are also very common in the general population (around 15%). While women with thrombophilia are at above-average risk of venous thromboembolism during pregnancy, the magnitude of risk in an individual patient is often difficult to estimate.
Data suggest that some types of thrombophilia confer greater thrombotic risk than others. McColl et al72 derived risk estimates for a primary event in women with several of the disorders: 0.23% in women heterozygous for the factor V Leiden mutation, 0.88% in women with protein C deficiency, and 2.4% to 35.7% in women with antithrombin deficiency. A case-control study70 found that all thrombophilic states were more common in women with pregnancy-associated venous thromboembolism than in healthy pregnant controls, except those with the MTHFR mutation and protein S deficiency. The estimated risk during pregnancy was 0.03% in women with no defect, 0.1% in women with protein C deficiency, 0.25% in women with the factor V Leiden mutation, 0.4% in those with antithrombin deficiency, 0.5% in those with the prothrombin gene mutation, and 4.6% in those with both factor V Leiden and prothrombin gene mutations.
Routine anticoagulation not advised in pregnant thrombophilic women
Because the risk of a primary venous thromboembolic event is less than 1% for most thrombophilic women, routine anticoagulant therapy does not seem prudent for this indication. Given the low absolute risk of venous thromboembolism, the cost and potential side effects of anticoagulant use are difficult to justify.
The women who seem at higher risk and in whom anticoagulation should be considered include those with antithrombin deficiency; those with high-titer anticardiolipin antibodies or a lupus anticoagulant antibody (treat with heparin and low-dose aspirin); those with combined thrombophilic defects or who are homozygotes for the factor V Leiden or prothrombin gene mutations; and those with multiple other current risk factors for venous thromboembolism (Table 1).
Since anticoagulants for primary prevention of adverse pregnancy outcomes in thrombophilic women have not yet been shown to have a definitive benefit, they are not recommended for this purpose.
ADVERSE PREGNANCY OUTCOMES IN WOMEN WITH THROMBOPHILIAS
Women with antiphospholipid antibodies and a previous poor obstetric outcome are clearly at increased risk of recurrent adverse pregnancy outcomes such as recurrent spontaneous abortion, unexplained fetal death, placental insufficiency, and early or severe preeclampsia. In such women who have both antiphospholipid antibodies and a history of venous thromboembolism or adverse pregnancy outcome, treatment during subsequent pregnancy with low-dose aspirin and prophylactic-dose LMWH or unfractionated heparin improves pregnancy outcomes.36–42 Women with antiphospholipid antibodies without previous thrombosis or pregnancy complications may also be at increased risk, but it is unclear whether thromboprophylaxis improves their outcomes.
Recent epidemiologic data reveal that women with other thrombophilic conditions also are at increased risk of early, severe preeclampsia73 as well as other pregnancy complications, including recurrent pregnancy loss, placental abruption, fetal growth restriction, and stillbirth.74 A recent meta-analysis75 looked at individual thrombophilias and found that factor V Leiden and prothrombin gene mutations were associated with recurrent fetal loss, stillbirth, and preeclampsia; that protein S deficiency was associated with recurrent fetal loss and stillbirth; that antiphospholipid antibodies were associated with recurrent pregnancy loss, preeclampsia, and intrauterine growth restriction; that the MTHFR mutation (homozygous) was associated with preeclampsia; and that protein C and antithrombin deficiencies were not significantly associated with adverse pregnancy outcomes. Data were scant for some of the rarer thrombophilias.75
Several recent small studies76–78 suggest that anticoagulants may improve pregnancy outcomes in women with genetic thrombophilias and recurrent pregnancy loss. These findings have not yet been confirmed in high-quality clinical trials, but such trials are under way. It is still unclear whether anticoagulants also reduce the risk of other adverse pregnancy outcomes associated with thrombophilias.
The current American College of Chest Physicians guidelines recommend testing of women with adverse pregnancy outcomes (recurrent pregnancy loss, prior severe or recurrent preeclampsia, abruptions, or otherwise unexplained intrauterine death) for congenital thrombophilias and antiphospholipid antibodies, and offering treatment to such women, if thrombophilic, with low-dose aspirin plus prophylactic heparin (unfractionated or LMWH).22 The authors of the guidelines admit that the evidence for this recommendation is weak, but they argue that the heparin will also serve as thromboprophylaxis in this high-risk group. Hopefully, the randomized clinical trials currently under way will provide clearer guidance regarding the most appropriate therapy in this difficult clinical situation.
MECHANICAL HEART VALVES
Internists may occasionally encounter a woman with a mechanical heart valve prosthesis who is either pregnant or is planning a pregnancy and therefore needs advice regarding optimal anticoagulant management. This should generally be undertaken in a multi-disciplinary fashion, with input from cardiology, hematology, and maternal-fetal medicine. The substantial maternal and fetal risks and the lack of definitive data on which to base treatment decisions make it a treacherous and stressful undertaking. Nonetheless, all internists should have a basic understanding of the complex issues regarding this management.
Outside of pregnancy, oral anticoagulants are the mainstay of therapy for patients with mechanical heart valves. Unfortunately, as discussed above, the use of these agents during pregnancy carries a risk of teratogenicity and toxic fetal effects and increases the risk of pregnancy loss and maternal hemorrhage. Heparins have been used in this setting for many years, but data on their efficacy and safety are very limited, and there are numerous reports of catastrophic maternal thrombotic complications.79,80
A systematic review of anticoagulation in pregnant women with prosthetic heart valves34 found very limited data on heparin use throughout pregnancy. Women maintained on warfarin vs heparin between pregnancy weeks 6 and 12 had higher rates of congenital anomalies (6.4% with warfarin vs 3.4% with heparin) and total fetal wastage (33.6% vs 26.5%). The warfarin group had fewer maternal thromboembolic complications (3.9% vs 9.2%), however, and a slightly lower rate of maternal death (1.8% vs 4.2%). Most of the women had higher-risk older-generation valves in the mitral position.
Recent data on LMWH consist mainly of case reports and case series,81 with a likely bias to publication of worse outcomes. Controlled trials in this area will be difficult to conduct. Still, aggressive anticoagulation with LMWH or unfractionated heparin, with close monitoring of the intensity of anticoagulation, may be safe and effective for pregnant women with newer-generation mechanical heart valves.82 A recent consensus statement22 suggested several regimens for pregnant women with mechanical heart valves:
- Twice-daily LMWH throughout pregnancy, with the dose adjusted either by weight, or to keep the 4-hour postinjection anti-factor-Xa activity level around 1.0 to 1.2 U/mL
- Aggressive adjusted-dose unfractionated heparin throughout pregnancy, given subcutaneously every 12 hours and adjusted to keep the mid-interval aPTT at least twice the control value or to attain a mid-interval anti-factor-Xa activity level of 0.35 to 0.70 U/mL
- Unfractionated heparin or LMWH (as above) until gestation week 13, then warfarin until the middle of the third trimester, and then heparin again.22
The authors also recommended adding low-dose aspirin (75–162 mg/day) in high-risk women.22
These options all seem reasonable, given our current knowledge, though warfarin use during pregnancy should be restricted to very-high-risk situations, such as women with older-generation mitral prostheses. LM-WHs may become the preferred therapy for this indication once further controlled data regarding their efficacy and safety become available.
- Chang J, Elam-Evans LD, Berg CJ, et al. Pregnancy-related mortality surveillance-United States, 1991–1999. MMWR Surveill Summ 2003; 52:1–8.
- Lewis G, Drife JO, Clutton-Brock T, et al. Why Mothers Die, 2000–2002. The Sixth Report of the Confidential Enquiries into Maternal Deaths in the United Kingdom. London: RCOG Press, 2004.
- Health Canada. Special Report on Maternal Mortality and Severe Morbidity in Canada—Enhanced Surveillance: The Path to Prevention. Ottawa: Minister of Public Works and Government Services Canada, 2004. www.phac-aspc.gc.ca/rhs-ssg/srmm-rsmm/page1-eng.php. Accessed 11/26/2008.
- Stein PD, Hull RD, Kayali F, et al. Venous thromboembolism in pregnancy: 21-year trends. Am J Med 2004; 117:121–125.
- Greer IA. Thrombosis in pregnancy: maternal and fetal issues. Lancet 1999; 353:1258–1265.
- Rosendaal FR. Venous thrombosis: a multicausal disease. Lancet 1999; 353:1167–1173.
- Gherman RB, Goodwin TM, Leung B, et al. Incidence, clinical characteristics, and timing of objectively diagnosed venous thromboembolism during pregnancy. Obstet Gynecol 1999; 94:730–734.
- Weitz JI. Low-molecular-weight heparins. N Engl J Med 1997; 337:688–698.
- Levine M, Gent M, Hirsh J, et al. A comparison of low-molecular-weight heparin administered primarily at home with unfractionated heparin administered in the hospital for proximal deep-vein thrombosis. N Engl J Med 1996; 334:677–681.
- Koopman MM, Prandoni P, Piovella F, et al. Treatment of venous thrombosis with intravenous unfractionated heparin administered in the hospital as compared with subcutaneous low-molecular-weight heparin administered at home. The Tasman Study Group. N Engl J Med 1996; 334:682–687.
- Simonneau G, Sors H, Charbonnier B, et al. A comparison of low-molecular-weight heparin with unfractionated heparin for acute pulmonary embolism. The THESEE Study Group. Tinzaparine ou Heparine Standard: Evaluations dans l’Embolie Pulmonaire. N Engl J Med 1997; 337:663–669.
- Hull RD, Raskob GE, Brant RF, et al. Low-molecular-weight heparin vs heparin in the treatment of patients with pulmonary embolism. American-Canadian Thrombosis Study Group. Arch Intern Med 2000; 160:229–236.
- Sanson BJ, Lensing AW, Prins MH, et al. Safety of low-molecular-weight heparin in pregnancy: a systematic review. Thromb Haemost 1999; 81:668–672.
- Greer IA, Nelson-Piercy C. Low-molecular-weight heparins for thromboprophylaxis and treatment of venous thromboembolism in pregnancy: a systematic review of safety and efficacy. Blood 2005; 106:401–407.
- Melissari E, Parker CJ, Wilson NV, et al. Use of low molecular weight heparin in pregnancy. Thromb Haemost 1992; 68:652–656.
- Forestier F, Daffos F, Capella-Pavlovsky M. Low molecular weight heparin (PK 10169) does not cross the placenta during the second trimester of pregnancy study by direct fetal blood sampling under ultrasound. Thromb Res 1984; 34:557–560.
- Forestier F, Daffos F, Rainaut M, Toulemonde F. Low molecular weight heparin (CY 216) does not cross the placenta during the third trimester of pregnancy. Thromb Haemost 1987; 57:234.
- Barbour LA, Oja JL, Schultz LK. A prospective trial that demonstrates that dalteparin requirements increase in pregnancy to maintain therapeutic levels of anticoagulation. Am J Obstet Gynecol 2004; 191:1024–1029.
- Smith MP, Norris LA, Steer PJ, Savidge GF, Bonnar J. Tinzaparin sodium for thrombosis treatment and prevention during pregnancy. Am J Obstet Gynecol 2004; 190:495–501.
- Ellison J, Walker ID, Greer IA. Antenatal use of enoxaparin for prevention and treatment of thromboembolism in pregnancy. BJOG 2000; 107:1116–1121.
- Sarig G, Brenner B. Monitoring of low molecular weight heparin (LMWH) in pregnancy. Thromb Res 2005; 115 suppl 1:84–86.
- Bates SM, Greer IA, Hirsh J, Ginsberg JS. Use of antithrombotic agents during pregnancy: the seventh ACCP conference on antithrombotic and thrombolytic therapy. Chest 2004; 126 suppl 3:627S–644S.
- Warkentin TE, Levine MN, Hirsh J, et al. Heparin-induced thrombocytopenia in patients treated with low-molecular-weight heparin or unfractionated heparin. N Engl J Med 1995; 332:1330–1335.
- Hassell K. The management of patients with heparin-induced thrombocytopenia who require anticoagulant therapy. Chest 2005; 127 suppl 2:1S–8S.
- Barbour LA, Kick SD, Steiner JF, et al. A prospective study of heparin-induced osteoporosis in pregnancy using bone densitometry. Am J Obst Gynecol 1994; 170:862–869.
- Douketis JD, Ginsberg JS, Burrows RF, Duku EK, Webber CE, Brill-Edwards P. The effects of long-term heparin therapy during pregnancy on bone density. A prospective matched cohort study. Thromb Haemost 1996; 75:254–257.
- Pettila V, Leinonen P, Markkola A, Hiilesmaa V, Kaaja R. Postpartum bone mineral density in women treated for thromboprophylaxis with unfractionated heparin or LMW heparin. Thromb Haemost 2002; 87:182–186.
- Carlin AJ, Farquharson RG, Quenby SM, Topping J, Fraser WD. Prospective observational study of bone mineral density during pregnancy: low molecular weight heparin versus control. Hum Reprod 2004; 19:1211–1214.
- Casele HL, Laifer SA. Prospective evaluation of bone density in pregnant women receiving the low molecular weight heparin enoxaparin sodium. J Matern Fetal Med 2000; 9:122–125.
- Casele H, Haney EI, James A, Rosene-Montella K, Carson M. Bone density changes in women who receive thromboprophylaxis in pregnancy. Am J Obstet Gynecol 2006; 195:1109–1113.
- Horlocker TT, Wedel DJ, Benzon H, et al. Regional anesthesia in the anticoagulated patient: defining the risks (the second ASRA Consensus Conference on Neuraxial Anesthesia and Anticoagulation). Reg Anesth Pain Med 2003; 28:172–197.
- Hirsh J, Dalen JE, Anderson DR, et al. Oral anticoagulants: mechanism of action, clinical effectiveness, and optimal therapeutic range. Chest 2001; 119 suppl 1:8S–21S.
- Levine MN, Raskob G, Beyth RJ, Kearon C, Schulman S. Hemorrhagic complications of anticoagulant treatment: the seventh ACCP conference on antithrombotic and thrombolytic therapy. Chest 2004; 126 suppl 3:287S–310S.
- Holmes LB. Teratogen-induced limb defects. Am J Med Genet 2002; 112:297–303.
- Chan WS, Anand S, Ginsberg JS. Anticoagulation of pregnant women with mechanical heart valves: a systematic review of the literature. Arch Intern Med 2000; 160:191–196.
- Pauzner R, Dulitzki M, Langevitz P, Livneh A, Kenett R, Many A. Low molecular weight heparin and warfarin in the treatment of patients with antiphospholipid syndrome during pregnancy. Thromb Haemost 2001; 86:1379–1384.
- Pulmonary Embolism Prevention (PEP) Trial Collaborative Group. Prevention of pulmonary embolism and deep vein thrombosis with low dose aspirin: Pulmonary Embolism Prevention (PEP) trial. Lancet 2000; 355:1295–1302.
- Patrono C, Coller B, FitzGerald GA, Hirsh J, Roth G. Platelet-active drugs: the relationships among dose, effectiveness, and side effects: the Seventh ACCP Conference on Antithrombotic and Thrombolytic Therapy. Chest 2004; 126 suppl 3:234S–264S.
- Duley L, Henderson-Smart DJ, Knight M, King JF. Antiplatelet agents for preventing preeclampsia and its complications. Cochrane Database Syst Rev. 2004; ( 1):CD004659.
- Coomarasamy A, Honest H, Papaioannou S, Gee H, Khan KS. Aspirin for prevention of preeclampsia in women with historical risk factors: a systematic review. Obstet Gynecol 2003; 101:1319–1332.
- Caritis SN, Sibai BM, Hauth J, et al, and the National Institute of Child Health and Human Development Network of Maternal Fetal Medicine Units. Low-dose aspirin to prevent preeclampsia in women at high risk. N Engl J Med 1998; 338:701–705.
- Rai R, Cohen H, Dave M, Regan L. Randomised controlled trial of aspirin and aspirin plus heparin in pregnant women with recurrent miscarriage associated with phospholipid antibodies (or antiphospholipid antibodies). BMJ 1997; 314:253–257.
- Kozer E, Nikfar S, Costei A, Boskovic R, Nulman I, Koren G. Aspirin consumption during the first trimester of pregnancy and congenital anomalies: a meta-analysis. Am J Obstet Gynecol 2002; 187:1623–1630.
- Sebastian C, Scherlag M, Kugelmass A, Schechter E. Primary stent implantation for acute myocardial infarction during pregnancy: use of abciximab, ticlopidine, and aspirin. Cathet Cardiovasc Diagn 1998; 45:275–249.
- Wilson AM, Boyle AJ, Fox P. Management of ischaemic heart disease in women of child-bearing age. Intern Med J 2004; 34:694–697.
- Klinzing P, Markert UR, Liesaus K, Peiker G. Case report: successful pregnancy and delivery after myocardial infarction and essential thrombocythemia treated with clopidogrel. Clin Exp Obstet Gynecol 2001; 28:215–216.
- Danhof M, de Boer A, Magnani HN, Stiekema JC. Pharmacokinetic considerations on Orgaran (Org 10172) therapy. Haemostasis 1992; 22:73–84.
- Tardy-Poncet B, Tardy B, Reynaud J, et al. Efficacy and safety of danaparoid sodium (ORG 10172) in critically ill patients with heparin-associated thrombocytopenia. Chest 1999; 115:1616–1620.
- Lagrange F, Vergnes C, Brun JL, et al. Absence of placental transfer of pentasaccharide (fondaparinux, Arixtra) in the dually perfused human cotyledon in vitro. Thromb Haemost 2002; 87:831–835.
- Dempfle CE. Minor transplacental passge of fondapinux in vivo. N Engl J Med 2004; 350:1914.
- Magnani HN. Heparin-induced thrombocytopenia (HIT): an overview of 230 patients treated with orgaran (Org 10172). Thromb Haemost 1993; 70:554–561.
- Lindhoff-Last E, Kreutzenbeck HJ, Magnani HN. Treatment of 51 pregnancies with danaparoid because of heparin intolerance. Thromb Haemost 2005; 93:63–69.
- Greinacher A, Eckhardt T, Mussmann J, Mueller-Eckhardt C. Pregnancy complicated by heparin associated thrombocytopenia: management by a prospectively in vitro selected heparinoid (Org 10172). Thromb Res 1993; 71:123–126.
- Schindewolf M, Mosch G, Bauersachs RM, Lindhoff-Last E. Safe anticoagulation with danaparoid in pregnancy and lactation. Thromb Haemost 2004; 92:211.
- Harenberg J. Treatment of a woman with lupus and thromboembolism and cutaneous intolerance to heparins using fondaparinux during pregnancy. Thromb Res 2007; 119:385–388.
- Wijesiriwardana A, Lees DA, Lush C. Fondaparinux as anticoagulant in a pregnant woman with heparin allergy. Blood Coagul Fibrinolysis 2006; 17:147–149.
- Mazzolai L, Hohlfeld P, Spertini F, Hayoz D, Schapira M, Duchosal MA. Fondaparinux is a safe alternative in case of heparin intolerance during pregnancy. Blood 2006; 108:1569–1570.
- Hawkins D, Evans J. Minimizing the risk of heparin-induced osteoporosis during pregnancy. Expert Opin Drug Saf 2005; 4:583–590.
- Brill-Edwards P, Ginsberg JS, Gent M, et al. Safety of withholding heparin in pregnant women with a history of venous thromboembolism. Recurrence of clot in this pregnancy study group. N Engl J Med 2000; 343:1439–1444.
- Martinelli I, Legnani C, Bucciarelli P, Grandone E, De Stefano V, Mannucci PM. Risk of pregnancy-related venous thrombosis in carriers of severe inherited thrombophilia. Thromb Haemost 2001; 86:800–803.
- De Stefano V, Martinelli I, Rossi E, Battaglioli T, Za T, Mannucci PM, Leone G. The risk of recurrent venous thromboembolism in pregnancy and puerperium without antithrombotic prophylaxis. Br J Haematol 2006; 135:386–391.
- Barbour LA, Smith JM, Marlar RA. Heparin levels to guide thromboembolism prophylaxis during pregnancy. Am J Obstet Gynecol 1995; 173:1869–1873.
- Ensom MH, Stephenson MD. Pharmacokinetics of low molecular weight heparin and unfractionated heparin in pregnancy. J Soc Gynecol Investig 2004; 11:377–383.
- Crowther MA, Berry LR, Monagle PT, Chan AK. Mechanisms responsible for the failure of protamine to inactivate low-molecular-weight heparin. Br J Haematol 2002; 116:178–186.
- Kearon C, Hirsh J. Management of anticoagulation before and after elective surgery. N Engl J Med 1997; 336:1506–1511.
- Thomas LA, Summers RR, Cardwell MS. Use of Greenfield filters in pregnant women at risk for pulmonary embolism. South Med J 1997; 90:215–217.
- Maclean PS, Tait RC. Hereditary and acquired antithrombin deficiency: epidemiology, pathogenesis and treatment options. Drugs 2007; 67:1429–1440.
- Information from LactMed: http://toxnet.nlm.nih.gov/cgi-bin/sis/htmlgen?LACT, LactMed Record Number: 279. Accessed 11/26/2008.
- Gerhardt A, Scharf RE, Beckmann MW, et al. Prothrombin and factor V mutations in women with a history of thrombosis during pregnancy and the puerperium. N Engl J Med 2000; 342:374–380.
- Hirsch DR, Mikkola KM, Marks PW, et al. Pulmonary embolism and deep venous thrombosis during pregnancy or oral contraceptive use: prevalence of factor V Leiden. Am Heart J 1996; 131:1145–1148.
- Dizon-Townson DS, Nelson LM, Jang H, Varner MW, Ward K. The incidence of the factor V Leiden mutation in an obstetric population and its relationship to deep vein thrombosis. Am J Obstet Gynecol 1997; 176:883–886.
- McColl MD, Ramsay JE, Tait RC, et al. Risk factors for pregnancy associated venous thromboembolism. Thromb Haemost 1997; 78:1183–1188.
- Kupferminc MJ, Fait G, Many A, Gordon D, Eldor A, Lessing JB. Severe preeclampsia and high frequency of genetic thrombophilic mutations. Obstet Gynecol 2000; 96:45–49.
- Kupferminc MJ, Eldor A, Steinman N, et al. Increased frequency of genetic thrombophilia in women with complications of pregnancy. N Engl J Med 1999; 340:9–13.
- Robertson L, Wu O, Langhorne P, et al. Thrombophilia in pregnancy: a systematic review. Br J Haematol 2006; 132:171–196.
- Brenner B, Hoffman R, Blumenfeld Z, Weiner Z, Younis JS. Gestational outcome in thrombophilic women with recurrent pregnancy loss treated by enoxaparin. Thromb Haemost 2000; 83:693–697.
- Carp H, Dolitzky M, Inbal A. Thromboprophylaxis improves the live birth rate in women with consecutive recurrent miscarriages and hereditary thrombophilia. J Thromb Haemost 2003; 1:433–438.
- Gris JC, Mercier E, Quere I, et al. Low-molecular-weight heparin versus low-dose aspirin in women with one fetal loss and a constitutional thrombophilic disorder. Blood 2004; 103:3695–3699.
- Salazar E, Izaguirre R, Verdejo J, Mutchinick O. Failure of adjusted doses of subcutaneous heparin to prevent thromboembolic phenomena in pregnant patients with mechanical cardiac valve prostheses. J Am Coll Cardiol 1996; 27:1698–1703.
- Iturbe-Alessio I, Fonseca MC, Mutchinik O, Santos MA, Zajarias A, Salazar E. Risks of anticoagulant therapy in pregnant women with artificial heart valves. N Engl J Med 1986; 315:1390–1393.
- Rowan JA, McCowan LM, Raudkivi PJ, North RA. Enoxaparin treatment in women with mechanical heart valves during pregnancy. Am J Obstet Gynecol 2001; 185:633–637.
- Oran B, Lee-Parritz A, Ansell J. Low molecular weight heparin for the prophylaxis of thromboembolism in women with prosthetic mechanical heart valves during pregnancy. Thromb Haemost 2004; 92:747–751.
Anticoagulation is essential in a wide variety of conditions in women of child-bearing age. Some, such as venous thromboembolism, occur more often during pregnancy. Others, such as recurrent fetal loss in the setting of antiphospholipid antibodies, are specific to pregnancy.
While anticoagulants are useful in many circumstances, their use during pregnancy increases the risk of hemorrhage and other adverse effects on the mother and the fetus. Treatment with anticoagulants during pregnancy must therefore be carefully considered, with judicious selection of the agent, and with reflection on the physiologic changes of pregnancy to ensure appropriate dosing. In this article, we review these issues.
WHY IS THROMBOTIC RISK HIGHER DURING PREGNANCY?
Venous thromboembolism is among the leading causes of maternal death in developed countries.1–3 Modern care has dramatically reduced the risk of maternal death from hemorrhage, infection, and hypertension, but rates of morbidity and death from thrombosis have remained stable or increased in recent years.4
- Much higher levels of fibrinogen and factors VII, VIII, IX, and X
- Lower levels of protein S and increased resistance to activated protein C
- Impaired fibrinolysis, due to inhibitors derived from the placenta.
Acquired antithrombin deficiency may also occur in high-proteinuric states such as nephrotic syndrome or preeclampsia, further increasing thrombotic risk. Pooling of venous blood, caused by progesterone-mediated venous dilation and compounded by compression of the inferior vena cava by the uterus in later pregnancy, also increases thrombotic risk. And endothelial disruption of the pelvic vessels may occur during delivery, particularly during cesarean section.
Additional factors that increase thrombotic risk include immobilization, such as bed rest for pregnancy complications; surgery, including cesarean section; ovarian hyperstimulation during gonadotropin use for in vitro fertilization; trauma; malignancy; and hereditary or acquired hypercoagulable states.6 These hypercoagulable states include deficiencies of antithrombin or the intrinsic anticoagulant proteins C or S; resistance to activated protein C, usually due to the factor V Leiden mutation; the PT20210A mutation of the prothrombin gene; hyperhomocystinemia due to mutation of the methyltetrahydrofolate reductase (MTHFR) gene; and the sustained presence of antiphospholipid antibodies, including lupus anticoagulant antibodies, sometimes also with moderately high titers of anticardiolipin or beta-2-glycoprotein I antibodies.
Other conditions that increase thrombotic risk include hyperemesis gravidarum, obesity, inflammatory bowel disease, infection, smoking, and indwelling intravenous catheters.6 Given the multitude of risk factors, pregnant women have a risk of thrombotic complications three to five times higher than nonpregnant women.7
HEPARIN USE DURING PREGNANCY
Low-molecular-weight heparins (LMWHs)8 and unfractionated heparin bind to anti-thrombin and thus change the shape of the antithrombin molecule, dramatically increasing its interaction with the clotting factors Xa and prothrombin (factor II). The enhanced clearance of these procoagulant proteins leads to the anticoagulant effect. Unfractionated heparin has roughly equivalent interaction with factors Xa and II and prolongs the activated partial thromboplastin time (aPTT), which is therefore used to monitor the intensity of anticoagulation.
LMWHs, on the other hand, interact relatively little with factor II and do not predictably prolong the aPTT. Monitoring their effect is therefore more difficult and requires direct measurement of anti-factor-Xa activity. This test is widely available, but it is time-consuming (it takes several hours and results may not be available within 24 hours if the test is requested “after hours”), and therefore it is of limited use in the acute clinical setting. While weight-based dosing of LMWHs is reliable and safe in nonpregnant patients, it has not yet been validated for pregnant women.
Unfractionated heparin has been used for decades for many indications during pregnancy. It is a large molecule, so it does not cross the placenta and thus, in contrast to the coumarin derivatives, does not cause teratogenesis or toxic fetal effects. Its main limitations in pregnancy are its inconvenient dosing (at least twice daily when given subcutaneously) and its potential maternal adverse effects (mainly osteoporosis and heparin-induced thrombocytopenia).
Over the last 10 years LMWHs have become the preferred anticoagulants for treating and preventing thromboembolism in all patients. They are equivalent or superior to unfractionated heparin in efficacy and safety in the initial treatment of acute deep venous thrombosis9,10 and pulmonary embolism11,12 outside of pregnancy. While comparative data are much less robust in pregnant patients, several series have confirmed the safety and efficacy of LMWHs in pregnancy.13–15 LMWHs do not cross the placenta15–17 and thus have a fetal safety profile equivalent to that of unfractionated heparin.
Pregnancy alters metabolism of LMWHs
The physiologic changes of pregnancy alter the metabolism of LMWH, resulting in lower peak levels and a higher rate of clearance,18,19 and so a pregnant woman may need higher doses or more frequent dosing.
Recent evidence suggests that thromboprophylaxis can be done with lower, fixed, once-daily doses of LMWH throughout pregnancy,20 although some clinicians still prefer twice-daily dosing (particularly during the latter half of pregnancy).
Pending more research on weight-based dosing of LMWH in pregnancy, anti-factor- Xa activity levels should be measured after treatment is started and every 1 to 3 months thereafter during pregnancy.21 Doses should be adjusted to keep the peak anti-Xa level (ie, 4 hours after the dose) at 0.5 to 1.2 U/mL.22
Heparin-induced thrombocytopenia
Type-2 heparin-induced thrombocytopenia is an uncommon but serious adverse effect of unfractionated heparin therapy (and, less commonly of LMWH), caused by heparin-dependent immunoglobulin G (IgG) antibodies that activate platelets via their Fc receptors, potentially precipitating life-threatening arterial or venous thrombosis.
In a trial in nonpregnant orthopedic patients,23 clinical heparin-induced thrombocytopenia occurred in 2.7% of patients receiving unfractionated heparin vs 0% of those receiving LMWH; heparin-dependent IgG was present in 7.8% vs 2.2%, respectively.
Fortunately, heparin-induced thrombocytopenia seems to be very rare in pregnancy: two recent prospective series evaluating prolonged LMWH use in pregnancy13,15 revealed no episodes of this disease. Nonetheless, it is reasonable to measure the platelet count once or twice weekly during the first few weeks of LMWH use and less often thereafter, unless symptoms of heparin-induced thrombocytopenia develop. In pregnant women with heparin-induced thrombocytopenia or heparin-related skin reactions, other anticoagulants must be considered24 (see discussion later).
Heparin-induced osteoporosis
Heparin-induced osteoporosis, a potential effect of prolonged heparin therapy, is of concern, given the prolonged duration and high doses of unfractionated heparin often needed to treat venous thromboembolism during pregnancy. Several studies found significant loss of bone mineral density in the proximal femur25 and lumbar spine26 during extended use of unfractionated heparin in pregnancy.
Fortunately, LMWH appears to be much safer with respect to bone loss. Three recent studies27–30 evaluated the use of LMWH for extended periods during pregnancy, and none found any greater loss of bone mineral density than that seen in normal pregnant controls. Giving supplemental calcium (1,000–1,500 mg/day) and vitamin D (400–1,000 IU/day) concomitantly with unfractionated heparin or LMWH in pregnancy is advisable to further reduce the risk.
Interrupt heparin to permit regional anesthesia
Heparin therapy should be temporarily stopped during the immediate peripartum interval to minimize the risk of hemorrhage and to permit regional anesthesia. Because of the theoretical risk of paraspinal hemorrhage in women receiving heparin who undergo epidural or spinal anesthesia, many anesthetists will not perform neuraxial regional anesthesia in women who have recently received heparin.
Since unfractionated heparin has a relatively short duration of action, the American Society of Regional Anesthesia states that subcutaneous unfractionated heparin prophylaxis is not a contraindication to neuraxial regional anesthesia.31 However, LMWHs should be stopped for at least 12 to 24 hours before regional anesthesia can be considered safe. This issue is discussed in more detail in the section on peripartum and postpartum management of anticoagulation, below.
In summary, LMWH during pregnancy offers a number of advantages over unfractionated heparin: equivalent efficacy, once- or twice-daily dosing, lower risk of heparin-induced thrombocytopenia and osteoporosis, and less-intensive monitoring. Unfractionated heparin can be offered to women who cannot afford LMWH (which costs four to five times more), and it may be used peripartum to reduce hemorrhagic risk and to permit regional anesthesia.
COUMARINS
Coumarins are the mainstay of anticoagulant therapy in most nonpregnant women beyond the immediate thrombotic period.
Warfarin (Coumadin) is the most widely used coumarin because it has a predictable onset and duration of action and excellent bioavailability.32 Others, such as acenocoumarol (Sintrom) and phenprocoumon (Marcoumar), are used more outside the United States but can be ordered or brought into the United States.
Coumarins interfere with vitamin K metabolism, inhibiting the generation of vitamin-K-dependent procoagulant proteins (factors II, VII, IX, and X) and thereby preventing clotting. They also inhibit the formation of the vitamin-K-dependent intrinsic anticoagulant proteins C and S.
Major bleeding is the most significant side effect of coumarin therapy, occurring at a rate of 4% to 6% over 3 months when the prothrombin time is maintained at an international normalized ratio (INR) of 2 to 3,33 and more often if the INR is higher.
Other issues with warfarin are the effect of variations in dietary vitamin K intake on anticoagulation and potential drug interactions that may alter the anticoagulant effect. Thus, the INR needs to be monitored closely.
Risks to the fetus and the mother
Unlike the heparins, coumarins freely cross the placenta and thus pose a risk of teratogenicity. A cluster of fetal malformations including “warfarin embryopathy” (nasal bone hypoplasia and chondrodysplasia punctata) can occur when the drug is used between 6 and 12 weeks of gestation. Warfarin embryopathy may be avoided by stopping warfarin prior to 6 weeks from the onset of the last menstrual period (ie, 6-week “menstrual age” or 4-week gestational age34).
Later in pregnancy, warfarin is associated with potential fetal bleeding complications leading to central nervous system abnormalities, increased rates of intrauterine fetal death, and pregnancy loss. In pregnant women with mechanical cardiac valve prostheses who received oral anticoagulants throughout pregnancy, the incidence of congenital anomalies was 6.4% to 10.2%.35 Fetal demise (spontaneous abortion, stillbirth, neonatal death) was also very common (29.7% to 33.6% of pregnancies) in coumarin-treated women.
Severe maternal hemorrhage may also occur in pregnant women on oral anticoagulants, particularly those who remain fully anticoagulated around the time of labor and delivery.
General caveats to warfarin in pregnancy
Because of the many maternal and fetal concerns, oral anticoagulant use in pregnancy is largely restricted to women with older-generation prosthetic heart valves in whom the very high maternal thrombotic risk may outweigh the risk of maternal and fetal side effects.
While there are limited data on warfarin use in pregnant women with antiphospholipid syndrome,36 warfarin use in such patients should be considered only for those at highest risk and with careful informed consent. These issues are discussed further below in the section on mechanical heart valve prostheses.
ANTIPLATELET DRUGS
Aspirin is an antiplatelet agent rather than an anticoagulant. Although considered inadequate for preventing venous thrombosis in high-risk groups when used alone, aspirin can moderately reduce the risk of deep venous thrombosis and pulmonary embolism in nonpregnant patients.37 It also has a well-accepted role in preventing arterial thrombotic events, ie, coronary artery disease and stroke.38
Low-dose aspirin (≤ 100 mg/day) has been extensively evaluated during pregnancy39–41 and has been shown to be safe and effective in reducing the risk of preeclampsia in high-risk women39 and in treating women with antiphospholipid antibodies and recurrent pregnancy loss42 (in conjunction with prophylactic doses of heparin). Although higher doses of aspirin and other nonsteroidal anti-inflammatory drugs can be toxic to the fetus, low doses have been shown to be safe throughout pregnancy.43
Dipyridamole (Persantine) has been studied extensively in pregnancy, and while it appears to be safe, it has not found a well-defined therapeutic role.
Other antiplatelet drugs have been only rarely used, and data on their safety and efficacy during pregnancy are limited to case reports, for example, on ticlopidine44 (Ticlid) and clopidogrel45,46 (Plavix) given during pregnancy in women with cardiac disease. These drugs do not appear to be major teratogens or to cause specific fetal harm. Their use may be reasonable in some high-risk situations, such as recurrent thrombotic stroke despite aspirin therapy. They may be used alone or with other anticoagulants in women with a coronary or other vascular stent if fetal safety is uncertain or if there is an increased risk of maternal bleeding.
NEWER ANTICOAGULANTS
Danaparoid
The heparinoid danaparoid (Orgaran) is an LMWH, a combination of heparan, dermatan, and chondroitin sulfate. Since it is derived from heparin, in theory it can cross-react with antiheparin antibodies, but this is generally not a problem. Danaparoid inhibits factor Xa, and monitoring is via measurement of anti-factor-Xa activity levels. It has been shown to be safe and effective in nonpregnant patients with heparin-induced thrombocytopenia.51
Although no controlled study has been published on danaparoid in pregnancy, at least 51 pregnancies in 49 patients treated with danaparoid have been reported.52 Thirty-two of the patients received danaparoid because of heparin-induced thrombocytopenia and 19 because of heparin-induced skin intolerance. These reports suggest that danaparoid does not cross the placenta53 and that it may be effective and safe during pregnancy.54 For this reason, it is probably the preferred anticoagulant in pregnant patients with heparin-induced thrombocytopenia or other serious reactions to heparin.
Unfortunately, danaparoid has two major disadvantages. First, it has a prolonged half-life and no effective reversing agent, which makes its use problematic close to the time of delivery. Second, and perhaps more relevant to this discussion, it is not readily available in the United States; it was removed from the market by its manufacturer in April 2002 for business reasons rather than because of concerns over toxicity. It is still available in Canada and Europe, and it can be obtained in special circumstances in the United States via the US Food and Drug Administration (FDA); this may be worthwhile in pregnant patients who require a nonurgent alternative to heparin.
Direct thrombin inhibitors
Lepirudin (Refludan), bivalirudin (Angiomax), and argatroban are direct thrombin inhibitors and exert their anticoagulant effect independently of antithrombin. They are given by continuous intravenous infusion, and they have a very short half-life.
Lepirudin and argatroban are typically monitored via the aPTT. Bivalirudin can be monitored with the activated clotting time, partial thromboplastin time, or INR, depending on the circumstances. None of these agents generates or cross-reacts with antibodies generated in heparin-induced thrombocytopenia. None has an antidote, but the short half-life usually obviates the need for one.
Unfortunately, pregnancy data are very sparse for all three of these new agents. Argatroban has a low molecular weight and likely crosses the placenta. Also, because these agents are given intravenously, they are not practical for long-term use in pregnancy.
Fondaparinux
Fondaparinux (Arixtra), a direct factor Xa inhibitor, binds to antithrombin, causing an irreversible conformational change that increases antithrombin’s ability to inactivate factor Xa (as do the heparins). It has no effect on factor IIa (thrombin) and does not predictably affect the aPTT. Its half-life is 17 hours, and no agent is known to reverse its anticoagulant effect, although some experts would recommend a trial of high-dose recombinant factor VIIa (Novo-Seven) in uncontrolled hemorrhage.
While not FDA-approved for treating heparin-induced thrombocytopenia, it has been used for this in some patients.55–58 Animal studies and in vitro human placental perfusion studies suggest that fondaparinux does not cross the placenta in significant amounts.49 Since danaparoid is not available in the United States, fondaparinux would likely be the first choice among the newer anticoagulants when treating heparin-induced thrombocytopenia in pregnancy.
INDICATIONS FOR ANTICOAGULANTS DURING PREGNANCY
Acute deep venous thrombosis and pulmonary embolism
Anticoagulant therapy should begin as full doses of either LMWH or intravenous unfractionated heparin. We prefer starting with LMWH, as it can be started rapidly with less need for nursing care (eg, no need to start and maintain an intravenous line and monitor the aPTT) and has excellent safety. If LMWH is selected, initial dosing should be based on the current weight (Table 2). Subsequent monitoring of the peak anti-factor-Xa activity levels (ie, 4 hours after the dose) is recommended, with the first level drawn in the first few days of treatment, and repeat levels every 1 to 3 months for the rest of treatment. As mentioned earlier, weight-based dosing has not been systematically evaluated in pregnancy.
If unfractionated heparin is the initial agent, it should be given as a bolus followed by a continuous infusion, ideally utilizing a weight-based nomogram to estimate required doses, with adjustment of the infusion rate to maintain the aPTT at 1.5 to 2.5 times the baseline value (obtained during pregnancy). After several days, the heparin may be switched to LMWH in therapeutic doses (Table 2).
Alternatively, in women approaching term or who cannot afford LMWH, anticoagulation may be continued as adjusted-dose subcutaneous unfractionated heparin, ie, two or three large daily doses of subcutaneous heparin to provide therapeutic levels of anticoagulation. The starting dose can be calculated as the total units of heparin required to maintain full anticoagulation intravenously over 24 hours, given as two or three divided doses (Table 2). The aPTT at the mid-dosing interval (eg, 6 hours after the subcutaneous dose during every-12-hour dosing) should be monitored and the dose adjusted to maintain the aPTT at 1.5 to 2.5 times the baseline value.
A therapeutic level of anticoagulation should be maintained for at least 3 months after an acute thrombotic event during pregnancy, though many physicians prefer to continue full anticoagulation for a total of 6 months. Beyond this interval, if the woman is still pregnant, the anticoagulation may be reduced in intensity, perhaps even to a prophylactic level for the duration of the pregnancy (see discussion below on prior venous thromboembolic events) (Table 2). Peripartum and postpartum anticoagulation are discussed further below.
PRIOR VENOUS THROMBOEMBOLIC EVENT
While all pregnant women are at higher risk of venous thrombosis, the overall incidence of thromboembolism is only about one event per 1,000 pregnancies. Routine thromboprophylaxis in all pregnant women is therefore not justified. However, women who have previously had a venous thromboembolic event are at a substantially higher risk of recurrent thrombosis and should be considered for thromboprophylaxis in all subsequent high-risk situations, including pregnancy.
For women on indefinite therapeutic anticoagulation (ie, because of recurrent thrombosis), full therapeutic anticoagulation with LMWH or adjusted-dose unfractionated heparin should be maintained throughout pregnancy, as described above.
Which other women should receive prophylactic anticoagulation is a topic of ongoing debate and controversy.
How great is the risk of recurrent thromboembolism?
A small observational study59 examined the risk of recurrent venous thromboembolism during subsequent pregnancies in women with a prior thrombotic event. Anticoagulation was withheld during the antepartum period and restarted briefly after delivery. Among the 125 women enrolled, recurrent venous thromboembolism occurred in 4.8%, with half of the events occurring during the antepartum period. Among those with underlying thrombophilia, the rate of recurrent venous thromboembolism was 13% (95% confidence interval [CI] 1.7%–40.5%) to 20% (95% CI 2.5%–56.5%), and those with a prior idiopathic clot without thrombophilia had an event rate of 7.7% (95% CI 0.01%–25.1%). The subgroup with a prior reversible risk factor (at the time of their initial venous thromboembolic event) and without detectable thrombophilia had no recurrent events.
This study suggests that women with prior venous thromboembolism and thrombophilia or a prior idiopathic thrombotic event are at a substantial risk of recurrent thrombotic events during pregnancy. And other data confirm the high risk of recurrent venous thromboembolism in thrombophilic pregnant women.60 These women should all be offered active antepartum and postpartum thromboprophylaxis with LMWH or unfractionated heparin (Tables 2 and 4). Women without thrombophilia but with a history of venous thromboembolism related to pregnancy or oral contraceptive use also have a substantial risk of recurrent venous thrombosis and should be offered antepartum and postpartum thromboprophylaxis.61 In contrast, women with a prior “secondary” clot, no thrombophilia, and no additional current risk factors (Table 1) appear to be at low risk of recurrent venous thromboembolism.
The risks should be discussed with these women, with an option for close clinical surveillance during pregnancy (Table 4), but with a low threshold to investigate any worrisome symptoms. Such women may also elect to take LMWH or unfractionated heparin during pregnancy.
Which heparin to use?
Prophylactic anticoagulation during pregnancy can be with either LMWH or unfractionated heparin. For most women this involves “prophylactic” dosing with the goal of maintaining a mid-interval anti-factor-Xa activity level of approximately 0.05 to 0.2 U/mL. Thromboprophylaxis with LMWH can be with lower, fixed, once-daily doses throughout pregnancy20 (Table 2), although some clinicians still prefer twice-daily dosing. The heparin should be started as soon as pregnancy is confirmed, as the pregnancy-associated increase in thrombotic risk begins by the middle of the first trimester.
To maintain effective prophylactic levels, the dose of unfractionated heparin should be increased sequentially over the trimesters62,63: approximately 5,000 units subcutaneously twice daily in the first trimester, then 7,500 units twice daily in the second trimester, and 10,000 units twice daily in the third trimester for a woman of average size.
When to add low-dose aspirin
Women with antiphospholipid antibodies, particularly those with prior recurrent pregnancy loss or fetal demise, should receive aspirin 81 mg/day in addition to heparin.39 The aspirin may be started prior to conception or when pregnancy is confirmed.
Other measures
Women on anticoagulant therapy who are at risk of recurrent venous thromboembolism should be encouraged to wear elastic compression stockings. Intermittent pneumatic compression of the legs via automated devices may be considered for women hospitalized for any reason or on bedrest.
Whichever measures are used, a high index of suspicion and a low threshold for investigating for recurrent thrombosis should be maintained throughout pregnancy and the puerperium.
PERIPARTUM AND POSTPARTUM MANAGEMENT OF ANTICOAGULATION
Heparin therapy must be interrupted temporarily during the immediate peripartum interval to minimize the risk of hemorrhage and to allow for the option of regional anesthesia. As mentioned earlier, because of the theoretical risk of paraspinal hemorrhage in women receiving heparin who undergo epidural or spinal anesthesia, the American Society of Regional Anesthesia guidelines advise waiting to insert the needle at least 10 to 12 hours after the last prophylactic dose of LMWH, and at least 24 hours after the last therapeutic dose.31
The guidelines state that neuraxial anesthesia is not contraindicated in patients on prophylactic unfractionated heparin.31
To facilitate use of regional anesthesia in these women, therefore, options include:
- Electively stopping LMWH 24 hours before planned induction of labor
- Electively stopping prophylactic-dose LMWH or unfractionated heparin at about 38 weeks of gestation, to await spontaneous labor, or
- Switching therapeutic or prophylactic LMWH to unfractionated heparin at about 36 weeks of gestation, with instructions to discontinue the injections in the earliest stages of spontaneous labor. This aims to shorten the heparin-free period required before neuraxial anesthesia while minimizing maternal thrombotic risk.
Additional advantages to using unfractionated heparin peripartum include the option of obtaining a rapid aPTT measurement to confirm the absence of a significant ongoing heparin effect prior to regional anesthesia or delivery, and the ability to completely reverse the heparin effect with protamine sulfate if major bleeding occurs. LMWHs are only partially reversible.64
Interrupting anticoagulation after an initial thrombotic event
If therapeutic anticoagulation must be interrupted for labor within 1 month of the initial thrombotic event, the risk of recurrent thrombotic complications is high65; these women must be observed very carefully and may benefit from intravenous heparin before and after delivery. They may even merit placement of a temporary vena cava filter (particularly if less than 2 weeks have elapsed since the venous thromboembolic event and in women with a large deep venous clot burden), a procedure that has been used safely but little studied in pregnant women.66
Fluoroscopic guidance may be needed for filter placement. This exposes the fetus to radiation, but the low-level exposure at this late gestational age is unlikely to pose a significant risk. The filter may be removed within 1 to 2 weeks postpartum, assuming there are no ongoing contraindications to anticoagulation.
In the rare woman with antithrombin deficiency and a recent or prior thrombotic event, giving antithrombin concentrate during the peripartum (heparin-free) interval has been described and may be considered under the guidance of a hematologist.67
Ongoing anticoagulation is essential postpartum, as the puerperium is the period of highest day-to-day risk of thromboembolic events: about one-third of pregnancy-associated events occur during these 6 to 12 weeks.2 Heparin should be resumed 6 to 12 hours after delivery, once hemostasis is confirmed.
Options for women requiring ongoing therapeutic anticoagulation include intravenous heparin started without a bolus, to minimize bleeding risk, with aPTT measured 12 hours later, or an initial prophylactic dose of LMWH 6 to 12 hours postpartum, with therapeutic dosing resumed on postpartum day 1. If prophylactic dosing is desired, unfractionated heparin or LMWH may be given subcutaneously starting at about 6 hours postpartum.
Warfarin in the puerperium
Women may subsequently be maintained on either LMWH or unfractionated heparin, or switched to an oral anticoagulant such as warfarin. Although warfarin may appear in minute amounts in breast milk, it has not been associated with adverse events in newborns and is considered compatible with breastfeeding.68 Heparin should be continued during the initial days of warfarin therapy, until the INR is at a therapeutic level for 24 hours. Some physicians prefer to delay warfarin for several days, giving LMWH alone in the immediate postpartum period, to allow wound-healing and to reduce bleeding risk.
Postpartum, anticoagulation should be continued for at least 6 to 12 weeks, at which point the physiologic changes in the coagulation system related to pregnancy will have returned to normal.
THROMBOPHILIA WITHOUT A PREVIOUS THROMBOEMBOLIC EVENT
Over the last 5 to 10 years, practitioners have been seeing many more young women with genetic or acquired thrombophilias who have never had a venous thromboembolic event. Physicians must advise these women about their risk of thromboembolic events during pregnancy and about the appropriateness of anticoagulant use.
Thrombophilias are often detected in women who develop venous thrombosis during pregnancy,69–71 but they are also very common in the general population (around 15%). While women with thrombophilia are at above-average risk of venous thromboembolism during pregnancy, the magnitude of risk in an individual patient is often difficult to estimate.
Data suggest that some types of thrombophilia confer greater thrombotic risk than others. McColl et al72 derived risk estimates for a primary event in women with several of the disorders: 0.23% in women heterozygous for the factor V Leiden mutation, 0.88% in women with protein C deficiency, and 2.4% to 35.7% in women with antithrombin deficiency. A case-control study70 found that all thrombophilic states were more common in women with pregnancy-associated venous thromboembolism than in healthy pregnant controls, except those with the MTHFR mutation and protein S deficiency. The estimated risk during pregnancy was 0.03% in women with no defect, 0.1% in women with protein C deficiency, 0.25% in women with the factor V Leiden mutation, 0.4% in those with antithrombin deficiency, 0.5% in those with the prothrombin gene mutation, and 4.6% in those with both factor V Leiden and prothrombin gene mutations.
Routine anticoagulation not advised in pregnant thrombophilic women
Because the risk of a primary venous thromboembolic event is less than 1% for most thrombophilic women, routine anticoagulant therapy does not seem prudent for this indication. Given the low absolute risk of venous thromboembolism, the cost and potential side effects of anticoagulant use are difficult to justify.
The women who seem at higher risk and in whom anticoagulation should be considered include those with antithrombin deficiency; those with high-titer anticardiolipin antibodies or a lupus anticoagulant antibody (treat with heparin and low-dose aspirin); those with combined thrombophilic defects or who are homozygotes for the factor V Leiden or prothrombin gene mutations; and those with multiple other current risk factors for venous thromboembolism (Table 1).
Since anticoagulants for primary prevention of adverse pregnancy outcomes in thrombophilic women have not yet been shown to have a definitive benefit, they are not recommended for this purpose.
ADVERSE PREGNANCY OUTCOMES IN WOMEN WITH THROMBOPHILIAS
Women with antiphospholipid antibodies and a previous poor obstetric outcome are clearly at increased risk of recurrent adverse pregnancy outcomes such as recurrent spontaneous abortion, unexplained fetal death, placental insufficiency, and early or severe preeclampsia. In such women who have both antiphospholipid antibodies and a history of venous thromboembolism or adverse pregnancy outcome, treatment during subsequent pregnancy with low-dose aspirin and prophylactic-dose LMWH or unfractionated heparin improves pregnancy outcomes.36–42 Women with antiphospholipid antibodies without previous thrombosis or pregnancy complications may also be at increased risk, but it is unclear whether thromboprophylaxis improves their outcomes.
Recent epidemiologic data reveal that women with other thrombophilic conditions also are at increased risk of early, severe preeclampsia73 as well as other pregnancy complications, including recurrent pregnancy loss, placental abruption, fetal growth restriction, and stillbirth.74 A recent meta-analysis75 looked at individual thrombophilias and found that factor V Leiden and prothrombin gene mutations were associated with recurrent fetal loss, stillbirth, and preeclampsia; that protein S deficiency was associated with recurrent fetal loss and stillbirth; that antiphospholipid antibodies were associated with recurrent pregnancy loss, preeclampsia, and intrauterine growth restriction; that the MTHFR mutation (homozygous) was associated with preeclampsia; and that protein C and antithrombin deficiencies were not significantly associated with adverse pregnancy outcomes. Data were scant for some of the rarer thrombophilias.75
Several recent small studies76–78 suggest that anticoagulants may improve pregnancy outcomes in women with genetic thrombophilias and recurrent pregnancy loss. These findings have not yet been confirmed in high-quality clinical trials, but such trials are under way. It is still unclear whether anticoagulants also reduce the risk of other adverse pregnancy outcomes associated with thrombophilias.
The current American College of Chest Physicians guidelines recommend testing of women with adverse pregnancy outcomes (recurrent pregnancy loss, prior severe or recurrent preeclampsia, abruptions, or otherwise unexplained intrauterine death) for congenital thrombophilias and antiphospholipid antibodies, and offering treatment to such women, if thrombophilic, with low-dose aspirin plus prophylactic heparin (unfractionated or LMWH).22 The authors of the guidelines admit that the evidence for this recommendation is weak, but they argue that the heparin will also serve as thromboprophylaxis in this high-risk group. Hopefully, the randomized clinical trials currently under way will provide clearer guidance regarding the most appropriate therapy in this difficult clinical situation.
MECHANICAL HEART VALVES
Internists may occasionally encounter a woman with a mechanical heart valve prosthesis who is either pregnant or is planning a pregnancy and therefore needs advice regarding optimal anticoagulant management. This should generally be undertaken in a multi-disciplinary fashion, with input from cardiology, hematology, and maternal-fetal medicine. The substantial maternal and fetal risks and the lack of definitive data on which to base treatment decisions make it a treacherous and stressful undertaking. Nonetheless, all internists should have a basic understanding of the complex issues regarding this management.
Outside of pregnancy, oral anticoagulants are the mainstay of therapy for patients with mechanical heart valves. Unfortunately, as discussed above, the use of these agents during pregnancy carries a risk of teratogenicity and toxic fetal effects and increases the risk of pregnancy loss and maternal hemorrhage. Heparins have been used in this setting for many years, but data on their efficacy and safety are very limited, and there are numerous reports of catastrophic maternal thrombotic complications.79,80
A systematic review of anticoagulation in pregnant women with prosthetic heart valves34 found very limited data on heparin use throughout pregnancy. Women maintained on warfarin vs heparin between pregnancy weeks 6 and 12 had higher rates of congenital anomalies (6.4% with warfarin vs 3.4% with heparin) and total fetal wastage (33.6% vs 26.5%). The warfarin group had fewer maternal thromboembolic complications (3.9% vs 9.2%), however, and a slightly lower rate of maternal death (1.8% vs 4.2%). Most of the women had higher-risk older-generation valves in the mitral position.
Recent data on LMWH consist mainly of case reports and case series,81 with a likely bias to publication of worse outcomes. Controlled trials in this area will be difficult to conduct. Still, aggressive anticoagulation with LMWH or unfractionated heparin, with close monitoring of the intensity of anticoagulation, may be safe and effective for pregnant women with newer-generation mechanical heart valves.82 A recent consensus statement22 suggested several regimens for pregnant women with mechanical heart valves:
- Twice-daily LMWH throughout pregnancy, with the dose adjusted either by weight, or to keep the 4-hour postinjection anti-factor-Xa activity level around 1.0 to 1.2 U/mL
- Aggressive adjusted-dose unfractionated heparin throughout pregnancy, given subcutaneously every 12 hours and adjusted to keep the mid-interval aPTT at least twice the control value or to attain a mid-interval anti-factor-Xa activity level of 0.35 to 0.70 U/mL
- Unfractionated heparin or LMWH (as above) until gestation week 13, then warfarin until the middle of the third trimester, and then heparin again.22
The authors also recommended adding low-dose aspirin (75–162 mg/day) in high-risk women.22
These options all seem reasonable, given our current knowledge, though warfarin use during pregnancy should be restricted to very-high-risk situations, such as women with older-generation mitral prostheses. LM-WHs may become the preferred therapy for this indication once further controlled data regarding their efficacy and safety become available.
- Chang J, Elam-Evans LD, Berg CJ, et al. Pregnancy-related mortality surveillance-United States, 1991–1999. MMWR Surveill Summ 2003; 52:1–8.
- Lewis G, Drife JO, Clutton-Brock T, et al. Why Mothers Die, 2000–2002. The Sixth Report of the Confidential Enquiries into Maternal Deaths in the United Kingdom. London: RCOG Press, 2004.
- Health Canada. Special Report on Maternal Mortality and Severe Morbidity in Canada—Enhanced Surveillance: The Path to Prevention. Ottawa: Minister of Public Works and Government Services Canada, 2004. www.phac-aspc.gc.ca/rhs-ssg/srmm-rsmm/page1-eng.php. Accessed 11/26/2008.
- Stein PD, Hull RD, Kayali F, et al. Venous thromboembolism in pregnancy: 21-year trends. Am J Med 2004; 117:121–125.
- Greer IA. Thrombosis in pregnancy: maternal and fetal issues. Lancet 1999; 353:1258–1265.
- Rosendaal FR. Venous thrombosis: a multicausal disease. Lancet 1999; 353:1167–1173.
- Gherman RB, Goodwin TM, Leung B, et al. Incidence, clinical characteristics, and timing of objectively diagnosed venous thromboembolism during pregnancy. Obstet Gynecol 1999; 94:730–734.
- Weitz JI. Low-molecular-weight heparins. N Engl J Med 1997; 337:688–698.
- Levine M, Gent M, Hirsh J, et al. A comparison of low-molecular-weight heparin administered primarily at home with unfractionated heparin administered in the hospital for proximal deep-vein thrombosis. N Engl J Med 1996; 334:677–681.
- Koopman MM, Prandoni P, Piovella F, et al. Treatment of venous thrombosis with intravenous unfractionated heparin administered in the hospital as compared with subcutaneous low-molecular-weight heparin administered at home. The Tasman Study Group. N Engl J Med 1996; 334:682–687.
- Simonneau G, Sors H, Charbonnier B, et al. A comparison of low-molecular-weight heparin with unfractionated heparin for acute pulmonary embolism. The THESEE Study Group. Tinzaparine ou Heparine Standard: Evaluations dans l’Embolie Pulmonaire. N Engl J Med 1997; 337:663–669.
- Hull RD, Raskob GE, Brant RF, et al. Low-molecular-weight heparin vs heparin in the treatment of patients with pulmonary embolism. American-Canadian Thrombosis Study Group. Arch Intern Med 2000; 160:229–236.
- Sanson BJ, Lensing AW, Prins MH, et al. Safety of low-molecular-weight heparin in pregnancy: a systematic review. Thromb Haemost 1999; 81:668–672.
- Greer IA, Nelson-Piercy C. Low-molecular-weight heparins for thromboprophylaxis and treatment of venous thromboembolism in pregnancy: a systematic review of safety and efficacy. Blood 2005; 106:401–407.
- Melissari E, Parker CJ, Wilson NV, et al. Use of low molecular weight heparin in pregnancy. Thromb Haemost 1992; 68:652–656.
- Forestier F, Daffos F, Capella-Pavlovsky M. Low molecular weight heparin (PK 10169) does not cross the placenta during the second trimester of pregnancy study by direct fetal blood sampling under ultrasound. Thromb Res 1984; 34:557–560.
- Forestier F, Daffos F, Rainaut M, Toulemonde F. Low molecular weight heparin (CY 216) does not cross the placenta during the third trimester of pregnancy. Thromb Haemost 1987; 57:234.
- Barbour LA, Oja JL, Schultz LK. A prospective trial that demonstrates that dalteparin requirements increase in pregnancy to maintain therapeutic levels of anticoagulation. Am J Obstet Gynecol 2004; 191:1024–1029.
- Smith MP, Norris LA, Steer PJ, Savidge GF, Bonnar J. Tinzaparin sodium for thrombosis treatment and prevention during pregnancy. Am J Obstet Gynecol 2004; 190:495–501.
- Ellison J, Walker ID, Greer IA. Antenatal use of enoxaparin for prevention and treatment of thromboembolism in pregnancy. BJOG 2000; 107:1116–1121.
- Sarig G, Brenner B. Monitoring of low molecular weight heparin (LMWH) in pregnancy. Thromb Res 2005; 115 suppl 1:84–86.
- Bates SM, Greer IA, Hirsh J, Ginsberg JS. Use of antithrombotic agents during pregnancy: the seventh ACCP conference on antithrombotic and thrombolytic therapy. Chest 2004; 126 suppl 3:627S–644S.
- Warkentin TE, Levine MN, Hirsh J, et al. Heparin-induced thrombocytopenia in patients treated with low-molecular-weight heparin or unfractionated heparin. N Engl J Med 1995; 332:1330–1335.
- Hassell K. The management of patients with heparin-induced thrombocytopenia who require anticoagulant therapy. Chest 2005; 127 suppl 2:1S–8S.
- Barbour LA, Kick SD, Steiner JF, et al. A prospective study of heparin-induced osteoporosis in pregnancy using bone densitometry. Am J Obst Gynecol 1994; 170:862–869.
- Douketis JD, Ginsberg JS, Burrows RF, Duku EK, Webber CE, Brill-Edwards P. The effects of long-term heparin therapy during pregnancy on bone density. A prospective matched cohort study. Thromb Haemost 1996; 75:254–257.
- Pettila V, Leinonen P, Markkola A, Hiilesmaa V, Kaaja R. Postpartum bone mineral density in women treated for thromboprophylaxis with unfractionated heparin or LMW heparin. Thromb Haemost 2002; 87:182–186.
- Carlin AJ, Farquharson RG, Quenby SM, Topping J, Fraser WD. Prospective observational study of bone mineral density during pregnancy: low molecular weight heparin versus control. Hum Reprod 2004; 19:1211–1214.
- Casele HL, Laifer SA. Prospective evaluation of bone density in pregnant women receiving the low molecular weight heparin enoxaparin sodium. J Matern Fetal Med 2000; 9:122–125.
- Casele H, Haney EI, James A, Rosene-Montella K, Carson M. Bone density changes in women who receive thromboprophylaxis in pregnancy. Am J Obstet Gynecol 2006; 195:1109–1113.
- Horlocker TT, Wedel DJ, Benzon H, et al. Regional anesthesia in the anticoagulated patient: defining the risks (the second ASRA Consensus Conference on Neuraxial Anesthesia and Anticoagulation). Reg Anesth Pain Med 2003; 28:172–197.
- Hirsh J, Dalen JE, Anderson DR, et al. Oral anticoagulants: mechanism of action, clinical effectiveness, and optimal therapeutic range. Chest 2001; 119 suppl 1:8S–21S.
- Levine MN, Raskob G, Beyth RJ, Kearon C, Schulman S. Hemorrhagic complications of anticoagulant treatment: the seventh ACCP conference on antithrombotic and thrombolytic therapy. Chest 2004; 126 suppl 3:287S–310S.
- Holmes LB. Teratogen-induced limb defects. Am J Med Genet 2002; 112:297–303.
- Chan WS, Anand S, Ginsberg JS. Anticoagulation of pregnant women with mechanical heart valves: a systematic review of the literature. Arch Intern Med 2000; 160:191–196.
- Pauzner R, Dulitzki M, Langevitz P, Livneh A, Kenett R, Many A. Low molecular weight heparin and warfarin in the treatment of patients with antiphospholipid syndrome during pregnancy. Thromb Haemost 2001; 86:1379–1384.
- Pulmonary Embolism Prevention (PEP) Trial Collaborative Group. Prevention of pulmonary embolism and deep vein thrombosis with low dose aspirin: Pulmonary Embolism Prevention (PEP) trial. Lancet 2000; 355:1295–1302.
- Patrono C, Coller B, FitzGerald GA, Hirsh J, Roth G. Platelet-active drugs: the relationships among dose, effectiveness, and side effects: the Seventh ACCP Conference on Antithrombotic and Thrombolytic Therapy. Chest 2004; 126 suppl 3:234S–264S.
- Duley L, Henderson-Smart DJ, Knight M, King JF. Antiplatelet agents for preventing preeclampsia and its complications. Cochrane Database Syst Rev. 2004; ( 1):CD004659.
- Coomarasamy A, Honest H, Papaioannou S, Gee H, Khan KS. Aspirin for prevention of preeclampsia in women with historical risk factors: a systematic review. Obstet Gynecol 2003; 101:1319–1332.
- Caritis SN, Sibai BM, Hauth J, et al, and the National Institute of Child Health and Human Development Network of Maternal Fetal Medicine Units. Low-dose aspirin to prevent preeclampsia in women at high risk. N Engl J Med 1998; 338:701–705.
- Rai R, Cohen H, Dave M, Regan L. Randomised controlled trial of aspirin and aspirin plus heparin in pregnant women with recurrent miscarriage associated with phospholipid antibodies (or antiphospholipid antibodies). BMJ 1997; 314:253–257.
- Kozer E, Nikfar S, Costei A, Boskovic R, Nulman I, Koren G. Aspirin consumption during the first trimester of pregnancy and congenital anomalies: a meta-analysis. Am J Obstet Gynecol 2002; 187:1623–1630.
- Sebastian C, Scherlag M, Kugelmass A, Schechter E. Primary stent implantation for acute myocardial infarction during pregnancy: use of abciximab, ticlopidine, and aspirin. Cathet Cardiovasc Diagn 1998; 45:275–249.
- Wilson AM, Boyle AJ, Fox P. Management of ischaemic heart disease in women of child-bearing age. Intern Med J 2004; 34:694–697.
- Klinzing P, Markert UR, Liesaus K, Peiker G. Case report: successful pregnancy and delivery after myocardial infarction and essential thrombocythemia treated with clopidogrel. Clin Exp Obstet Gynecol 2001; 28:215–216.
- Danhof M, de Boer A, Magnani HN, Stiekema JC. Pharmacokinetic considerations on Orgaran (Org 10172) therapy. Haemostasis 1992; 22:73–84.
- Tardy-Poncet B, Tardy B, Reynaud J, et al. Efficacy and safety of danaparoid sodium (ORG 10172) in critically ill patients with heparin-associated thrombocytopenia. Chest 1999; 115:1616–1620.
- Lagrange F, Vergnes C, Brun JL, et al. Absence of placental transfer of pentasaccharide (fondaparinux, Arixtra) in the dually perfused human cotyledon in vitro. Thromb Haemost 2002; 87:831–835.
- Dempfle CE. Minor transplacental passge of fondapinux in vivo. N Engl J Med 2004; 350:1914.
- Magnani HN. Heparin-induced thrombocytopenia (HIT): an overview of 230 patients treated with orgaran (Org 10172). Thromb Haemost 1993; 70:554–561.
- Lindhoff-Last E, Kreutzenbeck HJ, Magnani HN. Treatment of 51 pregnancies with danaparoid because of heparin intolerance. Thromb Haemost 2005; 93:63–69.
- Greinacher A, Eckhardt T, Mussmann J, Mueller-Eckhardt C. Pregnancy complicated by heparin associated thrombocytopenia: management by a prospectively in vitro selected heparinoid (Org 10172). Thromb Res 1993; 71:123–126.
- Schindewolf M, Mosch G, Bauersachs RM, Lindhoff-Last E. Safe anticoagulation with danaparoid in pregnancy and lactation. Thromb Haemost 2004; 92:211.
- Harenberg J. Treatment of a woman with lupus and thromboembolism and cutaneous intolerance to heparins using fondaparinux during pregnancy. Thromb Res 2007; 119:385–388.
- Wijesiriwardana A, Lees DA, Lush C. Fondaparinux as anticoagulant in a pregnant woman with heparin allergy. Blood Coagul Fibrinolysis 2006; 17:147–149.
- Mazzolai L, Hohlfeld P, Spertini F, Hayoz D, Schapira M, Duchosal MA. Fondaparinux is a safe alternative in case of heparin intolerance during pregnancy. Blood 2006; 108:1569–1570.
- Hawkins D, Evans J. Minimizing the risk of heparin-induced osteoporosis during pregnancy. Expert Opin Drug Saf 2005; 4:583–590.
- Brill-Edwards P, Ginsberg JS, Gent M, et al. Safety of withholding heparin in pregnant women with a history of venous thromboembolism. Recurrence of clot in this pregnancy study group. N Engl J Med 2000; 343:1439–1444.
- Martinelli I, Legnani C, Bucciarelli P, Grandone E, De Stefano V, Mannucci PM. Risk of pregnancy-related venous thrombosis in carriers of severe inherited thrombophilia. Thromb Haemost 2001; 86:800–803.
- De Stefano V, Martinelli I, Rossi E, Battaglioli T, Za T, Mannucci PM, Leone G. The risk of recurrent venous thromboembolism in pregnancy and puerperium without antithrombotic prophylaxis. Br J Haematol 2006; 135:386–391.
- Barbour LA, Smith JM, Marlar RA. Heparin levels to guide thromboembolism prophylaxis during pregnancy. Am J Obstet Gynecol 1995; 173:1869–1873.
- Ensom MH, Stephenson MD. Pharmacokinetics of low molecular weight heparin and unfractionated heparin in pregnancy. J Soc Gynecol Investig 2004; 11:377–383.
- Crowther MA, Berry LR, Monagle PT, Chan AK. Mechanisms responsible for the failure of protamine to inactivate low-molecular-weight heparin. Br J Haematol 2002; 116:178–186.
- Kearon C, Hirsh J. Management of anticoagulation before and after elective surgery. N Engl J Med 1997; 336:1506–1511.
- Thomas LA, Summers RR, Cardwell MS. Use of Greenfield filters in pregnant women at risk for pulmonary embolism. South Med J 1997; 90:215–217.
- Maclean PS, Tait RC. Hereditary and acquired antithrombin deficiency: epidemiology, pathogenesis and treatment options. Drugs 2007; 67:1429–1440.
- Information from LactMed: http://toxnet.nlm.nih.gov/cgi-bin/sis/htmlgen?LACT, LactMed Record Number: 279. Accessed 11/26/2008.
- Gerhardt A, Scharf RE, Beckmann MW, et al. Prothrombin and factor V mutations in women with a history of thrombosis during pregnancy and the puerperium. N Engl J Med 2000; 342:374–380.
- Hirsch DR, Mikkola KM, Marks PW, et al. Pulmonary embolism and deep venous thrombosis during pregnancy or oral contraceptive use: prevalence of factor V Leiden. Am Heart J 1996; 131:1145–1148.
- Dizon-Townson DS, Nelson LM, Jang H, Varner MW, Ward K. The incidence of the factor V Leiden mutation in an obstetric population and its relationship to deep vein thrombosis. Am J Obstet Gynecol 1997; 176:883–886.
- McColl MD, Ramsay JE, Tait RC, et al. Risk factors for pregnancy associated venous thromboembolism. Thromb Haemost 1997; 78:1183–1188.
- Kupferminc MJ, Fait G, Many A, Gordon D, Eldor A, Lessing JB. Severe preeclampsia and high frequency of genetic thrombophilic mutations. Obstet Gynecol 2000; 96:45–49.
- Kupferminc MJ, Eldor A, Steinman N, et al. Increased frequency of genetic thrombophilia in women with complications of pregnancy. N Engl J Med 1999; 340:9–13.
- Robertson L, Wu O, Langhorne P, et al. Thrombophilia in pregnancy: a systematic review. Br J Haematol 2006; 132:171–196.
- Brenner B, Hoffman R, Blumenfeld Z, Weiner Z, Younis JS. Gestational outcome in thrombophilic women with recurrent pregnancy loss treated by enoxaparin. Thromb Haemost 2000; 83:693–697.
- Carp H, Dolitzky M, Inbal A. Thromboprophylaxis improves the live birth rate in women with consecutive recurrent miscarriages and hereditary thrombophilia. J Thromb Haemost 2003; 1:433–438.
- Gris JC, Mercier E, Quere I, et al. Low-molecular-weight heparin versus low-dose aspirin in women with one fetal loss and a constitutional thrombophilic disorder. Blood 2004; 103:3695–3699.
- Salazar E, Izaguirre R, Verdejo J, Mutchinick O. Failure of adjusted doses of subcutaneous heparin to prevent thromboembolic phenomena in pregnant patients with mechanical cardiac valve prostheses. J Am Coll Cardiol 1996; 27:1698–1703.
- Iturbe-Alessio I, Fonseca MC, Mutchinik O, Santos MA, Zajarias A, Salazar E. Risks of anticoagulant therapy in pregnant women with artificial heart valves. N Engl J Med 1986; 315:1390–1393.
- Rowan JA, McCowan LM, Raudkivi PJ, North RA. Enoxaparin treatment in women with mechanical heart valves during pregnancy. Am J Obstet Gynecol 2001; 185:633–637.
- Oran B, Lee-Parritz A, Ansell J. Low molecular weight heparin for the prophylaxis of thromboembolism in women with prosthetic mechanical heart valves during pregnancy. Thromb Haemost 2004; 92:747–751.
KEY POINTS
- Pregnancy is a hypercoagulable state. Thrombotic risk in an individual pregnancy depends on many maternal and situational factors.
- When indicated, careful anticoagulation can proceed with minimal risk to the mother and fetus.
- Heparins, especially LMWHs, are the main anticoagulants used in pregnancy. Dosing depends on the clinical indications and on the agent selected.
- If anticoagulation is absolutely necessary and LMWH is contraindicated, a newer, alternative anticoagulant should be considered.
- Warfarin should not be used in pregnancy in any but the highest-risk situations.
Fungal Foes: Lacazia loboi
November 2008 Instant Poll Results
Which of these wardrobe items would you ban from the hospital?*
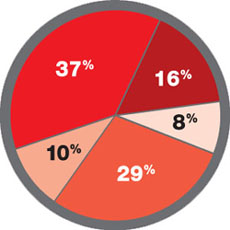
37% Jewelry on the hand and wrist
16% White coat
8% Long-sleeve shirt
29% Long necktie
10% Wrist watch
* FOR MEDICAL STAFF
Which of these wardrobe items would you ban from the hospital?*
37% Jewelry on the hand and wrist
16% White coat
8% Long-sleeve shirt
29% Long necktie
10% Wrist watch
* FOR MEDICAL STAFF
Which of these wardrobe items would you ban from the hospital?*
37% Jewelry on the hand and wrist
16% White coat
8% Long-sleeve shirt
29% Long necktie
10% Wrist watch
* FOR MEDICAL STAFF
ROUNDTABLE PART 2 OF 2: Using mesh to repair prolapse: Averting, managing complications
Hear Dr Phillips discuss the key points of this series
Vaginal placement of mesh for the correction of pelvic organ prolapse is not an entirely benign procedure. As Mickey M. Karram, MD, and an expert panel discuss in this article—the second of a two-part series—complications secondary to mesh placement can be a challenge to correct and often make life miserable for patients who experience them. Here, these experts address mesh erosion, extrusion, and other serious complications; discuss ways to prevent them; and offer strategies for managing them when they arise.
In Part 1, which appeared in the January 2009 issue of OBG Management, the panel discussed the increasing use of mesh in prolapse repair—in particular, the proliferation of mesh kits.
How common is erosion?
DR. KARRAM: The literature seems to indicate that, even in the best of hands, there is an extrusion, or erosion, rate of between 5% and 17% when mesh is used. Would you agree with this statistic?
DR. LUCENTE: Not completely. The vaginal exposure rate can be as low as 2%, as reported by our center and others, when the mesh is properly placed below all histologic layers of the vaginal wall, as it is when it is “delivered” to the pelvis via the transabdominal route.1,2
At the other end of the scale, an exposure rate above 17% has been reported when mesh is improperly placed within the vaginal wall—that is, just below the mucosa, as some surgeons have described in the methodology section of their abstract or article.3,4

MICKEY M. KARRAM, MD, moderator, is Director of Urogynecology at Good Samaritan Hospital and Voluntary Professor of ObGyn at the University of Cincinnati School of Medicine in Cincinnati, Ohio.

SHLOMO RAZ, MD, is Professor of Urology and Chief of Pelvic Medicine and Reconstructive Urology at UCLA School of Medicine in Los Angeles.

VINCENT LUCENTE, MD, MBA, is Founder and Director of the Institute for Female Pelvic Medicine and Reconstructive Surgery in Allentown, Pa, and Clinical Professor of ObGyn at Temple University School of Medicine in Philadelphia.

MARK D. WALTERS, MD, is Professor and Vice Chair of Gynecology, Section of Urogynecology and Reconstructive Pelvic Surgery, Department of Obstetrics and Gynecology, at the Cleveland Clinic in Cleveland, Ohio.
We have found that complete, full-thickness dissection of the vaginal wall into the true pelvic space (vesicovaginal and rectovaginal), utilizing small vaginal incisions and limiting hysterectomy and the trimming of vaginal mucosa, can promote a very low vaginal-exposure rate.
DR. WALTERS: Some surgeons tell me that their own extrusion or erosion rate is lower than the published rate of 5% to 17%, but it is impossible to be certain of the long-term outcome in any patient unless she is followed carefully. The patient may consult another physician about her complications. The primary surgeon—even an expert—often does not know the actual mesh complication rate.
That said, I am sure that some surgeons are particularly adept at using mesh kits for prolapse repair, thereby keeping their mesh complication rate low. The 5% to 17% number is what most gynecologic surgeons should expect for their patients.
DR. RAZ: The complication rates are clearly underreported since very few centers of excellence report on complications and the majority of users don’t report them. Also, the reported complication rate concerns short-term erosion. I imagine that, as time passes and vaginal tissue becomes more atrophic, the incidence of erosion will increase.
Are simple measures enough to resolve erosion?
DR. KARRAM: There seems to be a general perception that most extrusions or erosions can be easily managed in the office by placing estrogen or trimming. In our experience, that approach has been successful in a minority of cases only.
What have you seen?
DR. WALTERS: At the Cleveland Clinic, as at most tertiary care referral centers, we often see the worst cases of extrusion or erosion related to mesh. Estrogen helps in some cases of simple mesh exposure, especially after sacrocolpopexy. If estrogen is going to be effective, however, the problem should clear up relatively quickly; if it isn’t effective after a month or two of therapy, estrogen is unlikely to ever be successful.
When it comes to related problems, such as ridges or strictures in the vagina, dyspareunia, penile pain with insertion, and vaginal burning pain, I have not found simple trimming and estrogen to be effective.
DR. KARRAM: It’s also unlikely that simple excision or placement of estrogen will be successful over the long term. When an extrusion or erosion occurs, we are generally seeing only the tip of the iceberg. That’s because mesh is placed in a certain plane. Although only part of the mesh may be exposed, the entire mesh is likely to be affected because it lies in the same plane.
Also, because of the special nature of vaginal flora, it is unlikely that a foreign body is going to be successfully managed by simple excision or placement of estrogen.
DR. LUCENTE: Management of vaginal exposure really depends on the size of the exposure, its location, and whether there is underlying infection or ischemia of host tissue. When the exposure is small (<1 cm in diameter) and in the midline, with the mesh lying flat below the plane of the vaginal wall, we have been very successful using a conservative approach.
However, even the tiniest of exposures needs to be surgically excised if it traverses the vaginal sulcus. Obviously, any mesh erosion into viscera such as the bladder and bowel also requires surgical intervention. Host-tissue factors always play a contributing role.
I also want to point out that the manner in which exposure is managed depends to some extent on whether the mesh was properly placed. Exposures that arise when mesh is implanted improperly are difficult to correct and usually require complete removal.
Although we, too, started off with an exposure rate around 8%, it is now very low, thanks to technical advancements.
DR. RAZ: A very small vaginal erosion of a mesh sling can sometimes be managed in the office by excision. The cases referred to our service generally involve more extensive areas of exposure that will not be resolved by local treatment.
Is risk of injury operator-dependent?
DR. KARRAM: We’re all seeing very severe complications secondary to mesh placement. Would each of you give your opinion as to whether the severe complications such as significant pain, dyspareunia, and injury of important structures are mostly technical or inherent to mesh placement. Would they happen in the best of hands?
DR. LUCENTE: The more severe complications, for the most part, are very much related to technique. Not that they cannot happen in the very best of hands, but they are extremely rare when technique is meticulous.
Over a 4-year period, after well over 1,000 transvaginal mesh surgeries at our center, we had no death, ICU admission, or transfusion, and our intraoperative complication rate was only 3%, most commonly involving simple cystotomy without long-term consequence. This compares very favorably to the nearly 12% complication rate reported recently in the CARE trial for abdominal sacral colpopexy.5
Our primary challenge today is preventing postoperative dyspareunia. Our rate of new-onset dyspareunia is approximately 3.5%. This complication is, I think, more likely to be related to the inherent material properties of mesh, such as elasticity and flexural rigidity, and to host-tissue response to the material itself.
DR. RAZ: I think that the majority of complications are operator-dependent. Thin dissection of the vaginal wall and unrecognized bladder, urethral, and vaginal perforation are the most common reasons for the complications. Mesh does not move after surgery; if there is a problem, it means that the mesh was misplaced.
Another problem is that industry, in an effort to sell more kits, is pushing physicians who are unfamiliar with the principles of pelvic reconstruction to perform this complex procedure. Repair of major vaginal prolapse is not a simple sling procedure.
In addition, there is a greater likelihood of complications in patients who have severe atrophic tissues. These patients should not be candidates for mesh reconstruction.
DR. WALTERS: Many of the complications that we see with mesh are certainly operator-dependent. For example, mesh that is placed under too much tension leaves the vagina tight and stiff, and mesh that is placed with ripples and ridges causes irregularities in the vagina that are often painful, especially during intercourse.
I do not believe that mesh “erodes” into the bladder, urethra, or rectum, but that it is placed there inadvertently and overlooked intraoperatively (FIGURES 1 and 2), Visceral erosion can occur if the primary surgeon made a cystotomy or proctotomy before proceeding with the mesh kit, and the mesh eventually wore through the repaired area.
There are also some problems that are inherent to mesh, and that occur even in the best hands and after surgeries that are performed very competently. Some mesh exposures are inevitable, as are some cases of dyspareunia and rare cases of vaginal burning and pain. In addition, I am seeing more de novo SUI [stress urinary incontinence] with anterior mesh kits. Although this is not really a complication, it does lead to dissatisfaction in patients and merits efforts to prevent it.
DR. KARRAM: Yes. With the current state of mesh, I believe pain and dyspareunia are almost inevitable in some cases.
DR. LUCENTE: Another problem that is currently underaddressed is scar plating along the surface of the mesh. Such plating forms more readily in the absence of mechanical movement or distention during the early stages of wound healing. To make a comparison, even the best reconstructive orthopedic surgeons cannot achieve optimal functional outcomes with an implant surgery without intense postoperative physical therapy, which may simply involve range of motion or movement.
Most everyone is familiar with the capsular fibrosis and contraction that develop around a breast implant if there isn’t immediate postoperative massaging of the breast tissue and implant during wound repair. I am confident that the rate of dyspareunia will decline over time if specialists in reconstructive pelvic surgery pay closer attention to optimizing vaginal length, preserving the cervix (in women with relatively shorter vaginal length), and ensuring optimal apical attachment (that is, above the ischial spine) in younger, sexually active patients.
DR. RAZ: I think it is the surgeon rather than the surgery who causes most complications. In its effort to sell kits, industry sometimes puts them in the hands of surgeons who are not well prepared for the task. This operation can be quite complex, and you cannot create a pelvic surgeon from a physician who is unfamiliar with the anatomy. If you cannot manage the potential complications, you should not perform this type of surgery.
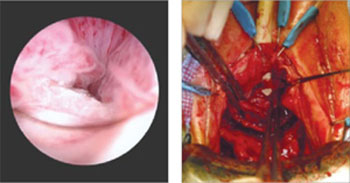
FIGURE 1 When mesh “erodes” into the urethra
Two images of mesh in the urethra. There is some uncertainty here whether mesh that has penetrated the urethra eroded through vaginal tissue or was placed there inadvertently and overlooked intraoperatively.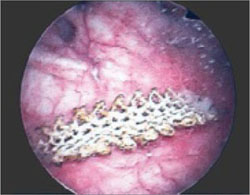
FIGURE 2 Mesh in the bladder
A segment of tension-free vaginal tape has penetrated into the bladder.
Should mesh be removed at the time of injury?
DR. KARRAM: As we discuss specific complications, let’s start with the most severe, which I would say relate to the inadvertent placement of mesh through important structures such as bowel, bladder, or ureters. If this were to happen and be diagnosed intraoperatively, what would you recommend that the surgeon do—abort the procedure or simply remove the mesh or trocar and attempt to pass it again safely?
DR. LUCENTE: That is a difficult question to answer because so much depends on various intraoperative factors.
I am much more comfortable proceeding with surgery after intraoperative bladder injury than after bowel or rectal injury. We have successfully corrected cystotomies that were small, did not encroach on the ureter, and were easily repaired without tension—and we have seen no fistula formation as a result.
The key is to maintain a high index of suspicion throughout the procedure. We have always diagnosed injuries before mesh is delivered—either during dissection or during passage of the needle or trocar. We have not experienced any ureteral injuries aside from “kinking” of one ureter, which was easily corrected with simple readjustment of the mesh.
If, at any time, we were concerned about potential infection, fistula, or a more severe complication that would be aggravated by proceeding with the operation, we would abort the procedure. However, we would be likely to proceed with an alternative operation to address the pelvic-support defect so that the patient would not awaken with intraoperative injury and no surgical treatment for her primary complaint.
We conduct informed consent in such a way as to preserve our flexibility to adapt the surgical plan to execute the reparative work that is necessary despite the development of a non–life-threatening complication during surgery. In the event of any injury to the bowel that would involve gross spillage of fecal material, of course, I would abort placement of synthetic mesh.
DR. WALTERS: If I placed one of the trocars through the bladder or bowel, I would probably remove it, reposition it, and continue with the surgery. With bladder perforation, this approach is generally no problem, but I would usually leave a Foley catheter in place for 1 week of continuous bladder drainage.
If I placed the trocar through the rectum, I would probably oversew the proctotomy, irrigate the space, and continue with the mesh repair. If I had an outright laceration in the bladder or rectum as part of the dissection, I would repair it and consider converting the surgery to prolapse repair without mesh.
The most dreaded complication: the foreshortened vagina
DR. KARRAM: It would seem that the most difficult complication to deal with is the foreshortened, firm, painful vagina. A patient who has these problems may be perceived, at times, as a pelvic “cripple.” Is this an accepted, albeit rare, complication? Or can it be avoided?
DR. LUCENTE: This is the most feared complication arising from the use of synthetic mesh. I do believe it can almost always be avoided—but I never say never. The key is to pay full attention to considerations of vaginal length before surgery, including, first, preservation of the cervix, and, second, placing the mesh loosely, properly sized, and attached with optimization of apical support to preserve vaginal length.
I also believe that use of second-generation meshes that are lighter, more elastic, and more flexible helps reduce this complication when the mesh is properly placed by a surgeon well trained in the technique.
When the vagina is foreshortened, the sooner it is revised, the better the chance that pain will resolve, whether the mesh is removed or released.
DR. RAZ: Mesh infection, capsular formation, dissection of a thin vaginal wall, and excess vaginal-wall excision lead to the short, firm, and painful vagina. The use and abuse of mesh has created a new subspecialty to manage mesh complications. The PFS syndrome (painful, firm, and short vagina) is one of the most difficult complications to treat because, in many cases, it cannot be reversed without major surgery.
DR. WALTERS: Women who have a foreshortened, firm, or painful vagina after mesh augmentation almost always need to have the mesh removed with reconstruction of the vaginal canal. I have never seen a successful outcome in this type of patient without complete or near-complete removal of the mesh.
1. van Raalte H, Lucente V, Haff R, Murphy M. Prolift: an innovative delivery system for transvaginal placement of synthetic grafts for the repair of pelvic organ prolapse. J Pelvic Med Surg .2007;13:351-360.
2. Murphy M, Raders JL, Haff R, Yeager M, Lucente V. Early U.S. experience with vaginal extraperitoneal colpopexy using propylene graft (Prolift) for the treatment of pelvic organ prolapse. J Pelvic Med Surg .2006;12:104-105.
3. Nguyen JM, Burchette RJ. Outcome after anterior vaginal prolapse repair: a randomized controlled trial. Obstet Gynecol. 2008;111:891-898.
4. Nieminen K, Hiltunen R, Heiskanen E, et al. Symptom resolution and sexual function after anterior vaginal wall repair with or without polypropylene mesh. Int Urogynecol J Pelvic Floor Dysfunct. 2008;19:1611-1616.
5. Brubaker L, Nygaard I, Richter HE, et al. Two-year outcomes after sacrocolpopexy with and without Burch to prevent stress urinary incontinence. Obstet Gynecol. 2008;112:49-55.
Hear Dr Phillips discuss the key points of this series
Vaginal placement of mesh for the correction of pelvic organ prolapse is not an entirely benign procedure. As Mickey M. Karram, MD, and an expert panel discuss in this article—the second of a two-part series—complications secondary to mesh placement can be a challenge to correct and often make life miserable for patients who experience them. Here, these experts address mesh erosion, extrusion, and other serious complications; discuss ways to prevent them; and offer strategies for managing them when they arise.
In Part 1, which appeared in the January 2009 issue of OBG Management, the panel discussed the increasing use of mesh in prolapse repair—in particular, the proliferation of mesh kits.
How common is erosion?
DR. KARRAM: The literature seems to indicate that, even in the best of hands, there is an extrusion, or erosion, rate of between 5% and 17% when mesh is used. Would you agree with this statistic?
DR. LUCENTE: Not completely. The vaginal exposure rate can be as low as 2%, as reported by our center and others, when the mesh is properly placed below all histologic layers of the vaginal wall, as it is when it is “delivered” to the pelvis via the transabdominal route.1,2
At the other end of the scale, an exposure rate above 17% has been reported when mesh is improperly placed within the vaginal wall—that is, just below the mucosa, as some surgeons have described in the methodology section of their abstract or article.3,4
MICKEY M. KARRAM, MD, moderator, is Director of Urogynecology at Good Samaritan Hospital and Voluntary Professor of ObGyn at the University of Cincinnati School of Medicine in Cincinnati, Ohio.
SHLOMO RAZ, MD, is Professor of Urology and Chief of Pelvic Medicine and Reconstructive Urology at UCLA School of Medicine in Los Angeles.
VINCENT LUCENTE, MD, MBA, is Founder and Director of the Institute for Female Pelvic Medicine and Reconstructive Surgery in Allentown, Pa, and Clinical Professor of ObGyn at Temple University School of Medicine in Philadelphia.
MARK D. WALTERS, MD, is Professor and Vice Chair of Gynecology, Section of Urogynecology and Reconstructive Pelvic Surgery, Department of Obstetrics and Gynecology, at the Cleveland Clinic in Cleveland, Ohio.
We have found that complete, full-thickness dissection of the vaginal wall into the true pelvic space (vesicovaginal and rectovaginal), utilizing small vaginal incisions and limiting hysterectomy and the trimming of vaginal mucosa, can promote a very low vaginal-exposure rate.
DR. WALTERS: Some surgeons tell me that their own extrusion or erosion rate is lower than the published rate of 5% to 17%, but it is impossible to be certain of the long-term outcome in any patient unless she is followed carefully. The patient may consult another physician about her complications. The primary surgeon—even an expert—often does not know the actual mesh complication rate.
That said, I am sure that some surgeons are particularly adept at using mesh kits for prolapse repair, thereby keeping their mesh complication rate low. The 5% to 17% number is what most gynecologic surgeons should expect for their patients.
DR. RAZ: The complication rates are clearly underreported since very few centers of excellence report on complications and the majority of users don’t report them. Also, the reported complication rate concerns short-term erosion. I imagine that, as time passes and vaginal tissue becomes more atrophic, the incidence of erosion will increase.
Are simple measures enough to resolve erosion?
DR. KARRAM: There seems to be a general perception that most extrusions or erosions can be easily managed in the office by placing estrogen or trimming. In our experience, that approach has been successful in a minority of cases only.
What have you seen?
DR. WALTERS: At the Cleveland Clinic, as at most tertiary care referral centers, we often see the worst cases of extrusion or erosion related to mesh. Estrogen helps in some cases of simple mesh exposure, especially after sacrocolpopexy. If estrogen is going to be effective, however, the problem should clear up relatively quickly; if it isn’t effective after a month or two of therapy, estrogen is unlikely to ever be successful.
When it comes to related problems, such as ridges or strictures in the vagina, dyspareunia, penile pain with insertion, and vaginal burning pain, I have not found simple trimming and estrogen to be effective.
DR. KARRAM: It’s also unlikely that simple excision or placement of estrogen will be successful over the long term. When an extrusion or erosion occurs, we are generally seeing only the tip of the iceberg. That’s because mesh is placed in a certain plane. Although only part of the mesh may be exposed, the entire mesh is likely to be affected because it lies in the same plane.
Also, because of the special nature of vaginal flora, it is unlikely that a foreign body is going to be successfully managed by simple excision or placement of estrogen.
DR. LUCENTE: Management of vaginal exposure really depends on the size of the exposure, its location, and whether there is underlying infection or ischemia of host tissue. When the exposure is small (<1 cm in diameter) and in the midline, with the mesh lying flat below the plane of the vaginal wall, we have been very successful using a conservative approach.
However, even the tiniest of exposures needs to be surgically excised if it traverses the vaginal sulcus. Obviously, any mesh erosion into viscera such as the bladder and bowel also requires surgical intervention. Host-tissue factors always play a contributing role.
I also want to point out that the manner in which exposure is managed depends to some extent on whether the mesh was properly placed. Exposures that arise when mesh is implanted improperly are difficult to correct and usually require complete removal.
Although we, too, started off with an exposure rate around 8%, it is now very low, thanks to technical advancements.
DR. RAZ: A very small vaginal erosion of a mesh sling can sometimes be managed in the office by excision. The cases referred to our service generally involve more extensive areas of exposure that will not be resolved by local treatment.
Is risk of injury operator-dependent?
DR. KARRAM: We’re all seeing very severe complications secondary to mesh placement. Would each of you give your opinion as to whether the severe complications such as significant pain, dyspareunia, and injury of important structures are mostly technical or inherent to mesh placement. Would they happen in the best of hands?
DR. LUCENTE: The more severe complications, for the most part, are very much related to technique. Not that they cannot happen in the very best of hands, but they are extremely rare when technique is meticulous.
Over a 4-year period, after well over 1,000 transvaginal mesh surgeries at our center, we had no death, ICU admission, or transfusion, and our intraoperative complication rate was only 3%, most commonly involving simple cystotomy without long-term consequence. This compares very favorably to the nearly 12% complication rate reported recently in the CARE trial for abdominal sacral colpopexy.5
Our primary challenge today is preventing postoperative dyspareunia. Our rate of new-onset dyspareunia is approximately 3.5%. This complication is, I think, more likely to be related to the inherent material properties of mesh, such as elasticity and flexural rigidity, and to host-tissue response to the material itself.
DR. RAZ: I think that the majority of complications are operator-dependent. Thin dissection of the vaginal wall and unrecognized bladder, urethral, and vaginal perforation are the most common reasons for the complications. Mesh does not move after surgery; if there is a problem, it means that the mesh was misplaced.
Another problem is that industry, in an effort to sell more kits, is pushing physicians who are unfamiliar with the principles of pelvic reconstruction to perform this complex procedure. Repair of major vaginal prolapse is not a simple sling procedure.
In addition, there is a greater likelihood of complications in patients who have severe atrophic tissues. These patients should not be candidates for mesh reconstruction.
DR. WALTERS: Many of the complications that we see with mesh are certainly operator-dependent. For example, mesh that is placed under too much tension leaves the vagina tight and stiff, and mesh that is placed with ripples and ridges causes irregularities in the vagina that are often painful, especially during intercourse.
I do not believe that mesh “erodes” into the bladder, urethra, or rectum, but that it is placed there inadvertently and overlooked intraoperatively (FIGURES 1 and 2), Visceral erosion can occur if the primary surgeon made a cystotomy or proctotomy before proceeding with the mesh kit, and the mesh eventually wore through the repaired area.
There are also some problems that are inherent to mesh, and that occur even in the best hands and after surgeries that are performed very competently. Some mesh exposures are inevitable, as are some cases of dyspareunia and rare cases of vaginal burning and pain. In addition, I am seeing more de novo SUI [stress urinary incontinence] with anterior mesh kits. Although this is not really a complication, it does lead to dissatisfaction in patients and merits efforts to prevent it.
DR. KARRAM: Yes. With the current state of mesh, I believe pain and dyspareunia are almost inevitable in some cases.
DR. LUCENTE: Another problem that is currently underaddressed is scar plating along the surface of the mesh. Such plating forms more readily in the absence of mechanical movement or distention during the early stages of wound healing. To make a comparison, even the best reconstructive orthopedic surgeons cannot achieve optimal functional outcomes with an implant surgery without intense postoperative physical therapy, which may simply involve range of motion or movement.
Most everyone is familiar with the capsular fibrosis and contraction that develop around a breast implant if there isn’t immediate postoperative massaging of the breast tissue and implant during wound repair. I am confident that the rate of dyspareunia will decline over time if specialists in reconstructive pelvic surgery pay closer attention to optimizing vaginal length, preserving the cervix (in women with relatively shorter vaginal length), and ensuring optimal apical attachment (that is, above the ischial spine) in younger, sexually active patients.
DR. RAZ: I think it is the surgeon rather than the surgery who causes most complications. In its effort to sell kits, industry sometimes puts them in the hands of surgeons who are not well prepared for the task. This operation can be quite complex, and you cannot create a pelvic surgeon from a physician who is unfamiliar with the anatomy. If you cannot manage the potential complications, you should not perform this type of surgery.
FIGURE 1 When mesh “erodes” into the urethra
Two images of mesh in the urethra. There is some uncertainty here whether mesh that has penetrated the urethra eroded through vaginal tissue or was placed there inadvertently and overlooked intraoperatively.
FIGURE 2 Mesh in the bladder
A segment of tension-free vaginal tape has penetrated into the bladder.
Should mesh be removed at the time of injury?
DR. KARRAM: As we discuss specific complications, let’s start with the most severe, which I would say relate to the inadvertent placement of mesh through important structures such as bowel, bladder, or ureters. If this were to happen and be diagnosed intraoperatively, what would you recommend that the surgeon do—abort the procedure or simply remove the mesh or trocar and attempt to pass it again safely?
DR. LUCENTE: That is a difficult question to answer because so much depends on various intraoperative factors.
I am much more comfortable proceeding with surgery after intraoperative bladder injury than after bowel or rectal injury. We have successfully corrected cystotomies that were small, did not encroach on the ureter, and were easily repaired without tension—and we have seen no fistula formation as a result.
The key is to maintain a high index of suspicion throughout the procedure. We have always diagnosed injuries before mesh is delivered—either during dissection or during passage of the needle or trocar. We have not experienced any ureteral injuries aside from “kinking” of one ureter, which was easily corrected with simple readjustment of the mesh.
If, at any time, we were concerned about potential infection, fistula, or a more severe complication that would be aggravated by proceeding with the operation, we would abort the procedure. However, we would be likely to proceed with an alternative operation to address the pelvic-support defect so that the patient would not awaken with intraoperative injury and no surgical treatment for her primary complaint.
We conduct informed consent in such a way as to preserve our flexibility to adapt the surgical plan to execute the reparative work that is necessary despite the development of a non–life-threatening complication during surgery. In the event of any injury to the bowel that would involve gross spillage of fecal material, of course, I would abort placement of synthetic mesh.
DR. WALTERS: If I placed one of the trocars through the bladder or bowel, I would probably remove it, reposition it, and continue with the surgery. With bladder perforation, this approach is generally no problem, but I would usually leave a Foley catheter in place for 1 week of continuous bladder drainage.
If I placed the trocar through the rectum, I would probably oversew the proctotomy, irrigate the space, and continue with the mesh repair. If I had an outright laceration in the bladder or rectum as part of the dissection, I would repair it and consider converting the surgery to prolapse repair without mesh.
The most dreaded complication: the foreshortened vagina
DR. KARRAM: It would seem that the most difficult complication to deal with is the foreshortened, firm, painful vagina. A patient who has these problems may be perceived, at times, as a pelvic “cripple.” Is this an accepted, albeit rare, complication? Or can it be avoided?
DR. LUCENTE: This is the most feared complication arising from the use of synthetic mesh. I do believe it can almost always be avoided—but I never say never. The key is to pay full attention to considerations of vaginal length before surgery, including, first, preservation of the cervix, and, second, placing the mesh loosely, properly sized, and attached with optimization of apical support to preserve vaginal length.
I also believe that use of second-generation meshes that are lighter, more elastic, and more flexible helps reduce this complication when the mesh is properly placed by a surgeon well trained in the technique.
When the vagina is foreshortened, the sooner it is revised, the better the chance that pain will resolve, whether the mesh is removed or released.
DR. RAZ: Mesh infection, capsular formation, dissection of a thin vaginal wall, and excess vaginal-wall excision lead to the short, firm, and painful vagina. The use and abuse of mesh has created a new subspecialty to manage mesh complications. The PFS syndrome (painful, firm, and short vagina) is one of the most difficult complications to treat because, in many cases, it cannot be reversed without major surgery.
DR. WALTERS: Women who have a foreshortened, firm, or painful vagina after mesh augmentation almost always need to have the mesh removed with reconstruction of the vaginal canal. I have never seen a successful outcome in this type of patient without complete or near-complete removal of the mesh.
1. van Raalte H, Lucente V, Haff R, Murphy M. Prolift: an innovative delivery system for transvaginal placement of synthetic grafts for the repair of pelvic organ prolapse. J Pelvic Med Surg .2007;13:351-360.
2. Murphy M, Raders JL, Haff R, Yeager M, Lucente V. Early U.S. experience with vaginal extraperitoneal colpopexy using propylene graft (Prolift) for the treatment of pelvic organ prolapse. J Pelvic Med Surg .2006;12:104-105.
3. Nguyen JM, Burchette RJ. Outcome after anterior vaginal prolapse repair: a randomized controlled trial. Obstet Gynecol. 2008;111:891-898.
4. Nieminen K, Hiltunen R, Heiskanen E, et al. Symptom resolution and sexual function after anterior vaginal wall repair with or without polypropylene mesh. Int Urogynecol J Pelvic Floor Dysfunct. 2008;19:1611-1616.
5. Brubaker L, Nygaard I, Richter HE, et al. Two-year outcomes after sacrocolpopexy with and without Burch to prevent stress urinary incontinence. Obstet Gynecol. 2008;112:49-55.
Why off-label isn’t off base
Dear Dr. Mossman:
When I was a resident, attending physicians occasionally cited journal articles in their consultation notes to substantiate their treatment choices. Since then, I’ve done this at times when I’ve prescribed a drug off-label.
Recently, I mentioned this practice to a physician who is trained as a lawyer. He thought citing articles in a patient’s chart was a bad idea, because by doing so I was automatically making the referred-to article the “expert witness.” If a lawsuit occurred, I might be called upon to justify the article’s validity, statistical details, methodology, etc. My intent is to show that I have a detailed, well-thought-out justification for my treatment choice.
Am I placing myself at greater risk of incurring liability should a lawsuit occur?—Submitted by “Dr. W”
Dr. W wants to know how he can minimize malpractice risk when prescribing a medication off label and wonders if citing an article in a patient’s chart is a good or bad idea. In law school, attorneys-in-training learn to answer very general legal questions with, “It depends.” There’s little certainty about how to avoid successful malpractice litigation, because few if any strategies have been tested systematically. However, this article will explain—and hopefully help you avoid—the medicolegal pitfalls of off-label prescribing.
Off-label: ‘Accepted and necessary’
Off-label prescribing occurs when a physician prescribes a medication or uses a medical device outside the scope of FDA-approved labeling. Most commonly, off-label use involves prescribing a medication for something other than its FDA-approved indication—such as sildenafil for women with antidepressant-induced sexual dysfunction.1
Other examples are prescribing a drug:
- at an unapproved dose
- in an unapproved format, such as mixing capsule contents with applesauce
- outside the approved age group
- for longer than the approved interval
- at a different dose schedule, such as qhs instead of bid or tid.
- Submit your malpractice-related questions to Dr. Mossman at [email protected].
- Include your name, address, and practice location. If your question is chosen for publication, your name can be withheld by request.
- All readers who submit questions will be included in quarterly drawings for a $50 gift certificate for Professional Risk Management Services, Inc’s online marketplace of risk management publications and resources (www.prms.com).
Typically, it takes years for a new drug to gain FDA approval and additional time for an already-approved drug to gain approval for a new indication. In the mean-time, clinicians treat their patients with available drugs prescribed off-label.
Off-label prescribing is legal. FDA approval means drugs may be sold and marketed in specific ways, but the FDA does not tell physicians how they can use approved drugs. As each edition of the Physicians’ Desk Reference explains, “Once a product has been approved for marketing, a physician may prescribe it for uses or in treatment regimens or patient populations that are not included in approved labeling.”2 Federal statutes state that FDA approval does not “limit or interfere with the authority of a health care practitioner to prescribe” approved drugs or devices “for any condition or disease.”3
Courts endorse off-label prescribing. As 1 appellate decision states, “Because the pace of medical discovery runs ahead of the FDA’s regulatory machinery, the off-label use of some drugs is frequently considered to be ‘state-of-the-art’ treatment.”4 The U.S. Supreme Court has concluded that off-label prescribing “is an accepted and necessary corollary of the FDA’s mission to regulate.”5
Limited testing for safety and effectiveness. Experiences such as “Fen-phen” for weight loss11 and estrogens for preventing vascular disease in postmenopausal women12 remind physicians that some untested treatments may do more harm than good.
Commercial influence. Pharmaceutical companies have used advisory boards, consultant meetings, and continuing medical education events to promote unproven off-label indications for drugs.13,14 Many studies ostensibly designed and proposed by researchers show evidence of “ghost authorship” by commercial concerns.15
Study bias. Even published, peer-reviewed, double-blind studies might not sufficiently support off-label prescribing practices, because sponsors of such studies can structure them or use statistical analyses to make results look favorable. Former editors of the British Medical Journal and the Lancet have acknowledged that their publications unwittingly served as “an extension of the marketing arm” or “laundering operations” for drug manufacturers.16,17 Even for FDA-approved indications, a selective, positive-result publication bias and non-reporting of negative results may make drugs seem more effective than the full range of studies would justify.18
Legal use of labeling. Though off-label prescribing is accepted medical practice, doctors “may be found negligent if their decision to use a drug off-label is sufficiently careless, imprudent, or unprofessional.”4 During a malpractice lawsuit, plaintiff’s counsel could try to use FDA-approved labeling or prescribing information to establish a presumptive standard of care. Such evidence usually is admissible if it is supported by expert testimony. It places the burden of proof on the defendant physician to show how an off-label use met the standard of care.19
Is off-label use malpractice?
Off-label use is not only legal, it’s often wise medical practice. Many drug uses that now have FDA approval were off-label just a few years ago. Examples include using selective serotonin reuptake inhibitors (SSRIs) to treat panic disorder and obsessive-compulsive disorder and valproate for bipolar mania. Though fluoxetine is the only FDA-approved drug for treating depression in adolescents, other SSRIs may have a favorable risk-benefit profile.6
Numerous studies have shown that off-label prescribing is common in psychiatry7 and other specialties.8,9 Because the practice is so common, the mere fact that a drug is not FDA-approved for a particular use does not imply that the drug was prescribed negligently.
Are patients human guinea pigs?
Some commentators have suggested that off-label prescribing amounts to human experimentation.10 Without FDA approval, they say physicians lack “hard evidence” that a product is safe and effective, so off-label prescribing is a small-scale clinical trial based on the doctor’s educated guesses. If this reasoning is correct, off-label prescribing would require the same human subject protections used in research, including institution review board approval and special consent forms.
Although this argument sounds plausible, off-label prescribing is not experimentation or research (Box).4,11-19 Researchers investigate hypotheses to obtain generalizable knowledge, whereas medical therapy aims to benefit individual patients. This experimentation/therapy distinction is not perfect because successful off-label treatment of 1 patient might imply beneficial effects for others.10 When courts have looked at this matter, though, they have found that “off-label use…by a physician seeking an optimal treatment for his or her patient is not necessarily…research or an investigational or experimental treatment when the use is customarily followed by physicians.”4
Courts also have said that off-label use does not require special informed consent. Just because a drug is prescribed off-label doesn’t mean it’s risky. FDA approval “is not a material risk inherently involved in a proposed therapy which a physician should have disclosed to a patient prior to the therapy.”20 In other words, a physician is not required to discuss FDA regulatory status—such as off-label uses of a medication—to comply with standards of informed consent. FDA regulatory status has nothing to do with the risks or benefits of a medication and it does not provide information about treatment alternatives.21
What should you do?
Keep abreast of news and scientific evidence concerning drug uses, effects, interactions, and adverse effects, especially when prescribing for uses that are different from the manufacturer’s intended purposes (such as hormone therapy for sex offenders).22
Collect articles on off-label uses, but keep them separate from your patients’ files. Good attorneys are highly skilled at using documents to score legal points, and opposing counsel will prepare questions to focus on the articles’ faults or limitations in isolation.
Know why an article applies to your patient. If you are sued for malpractice, you can use an article to support your treatment choice by explaining how this information contributed to your decision-making.
Tell your patient that the proposed treatment is an off-label use when you obtain consent, even though case law says you don’t have to do this. Telling your patient helps him understand your reasoning and prevents surprises that may give offense. For example, if you prescribe a second-generation antipsychotic for a nonpsychotic patient, you wouldn’t want your patient to think you believe he has schizophrenia when he reads the information his pharmacy attaches to his prescription.
Engage in ongoing informed consent. Uncertainty is part of medical practice and is heightened when doctors prescribe off-label. Ongoing discussions help patients understand, accept, and share that uncertainty.
Document informed consent. This will show—if it becomes necessary—that you and your patient made collaborative, conscientious decisions about treatment.23
Related resources
- Zito JM, Derivan AT, Kratochvil CJ, et al. Off-label psychopharmacologic prescribing for children: history supports close clinical monitoring. Child Adolesc Psychiatry Ment Health. 2008;2:24. www.capmh.com/content/pdf/1753-2000-2-24.pdf.
- Spiesel S. Prozac on the playground. October 15, 2008. Slate. www.slate.com/id/2202338.
Drug brand names
- Fenfluramine and phentermine • Fen-phen
- Fluoxetine • Prozac
- Sildenafil • Viagra
- Valproate • Depakote
1. Nurnberg HG, Hensley PL, Heiman JR, et al. Sildenafil treatment of women with antidepressant-associated sexual dysfunction: a randomized controlled trial. JAMA. 2008;300:395-404.
2. Physicians’ Desk Reference. 62nd edition. Montvale, NJ: Thomson Healthcare, Inc.; 2007.
3. Food, Drug and Cosmetic Act, 21USC §396.
4. Richardson v Miller, 44 SW3d 1 (Tenn Ct App 2000).
5. Buckman Co. v Plaintiffs’ Legal Comm., 531 US 341 (2001).
6. Bridge JA, Iyengar S, Salary CB, et al. Clinical response and risk for reported suicidal ideation and suicide attempts in pediatric antidepressant treatment: a meta-analysis of randomized controlled trials. JAMA. 2007;297:1683-1696.
7. Baldwin DS, Kosky N. Off-label prescribing in psychiatric practice. Advances in Psychiatric Treatment. 2007;13:414-422.
8. Conroy S, Choonare I, Impicciatore P, et al. Survey of unlicensed and off label drug use in paediatric wards in European countries. Br Med J. 2000;320:79-82.
9. Radley DC, Finkelstein SN, Stafford RS. Off-label prescribing among office-based physicians. Arch Intern Med. 2006;166:1021-1026.
10. Mehlman MJ. Off-label prescribing. Available at: http://www.thedoctorwillseeyounow.com/articles/bioethics/offlabel_11. Accessed October 21, 2008.
11. Connolly H, Crary J, McGoon M, et al. Vascular heart disease associated with fenfluramine-phentermine. N Engl J Med. 1997;337:581-588.
12. Anderson GL, Limacher M, Assaf AR, et al. Effects of conjugated equine estrogen in postmenopausal women with hysterectomy: the Women’s Health Initiative randomized controlled trial. JAMA. 2004;291:1701-1712.
13. Sismondo S. Ghost management: how much of the medical literature is shaped behind the scenes by the pharmaceutical industry? PLoS Med. 2007;4(9):e286.
14. Steinman MA, Bero L, Chren M, et al. Narrative review: the promotion of gabapentin: an analysis of internal industry documents. Ann Intern Med. 2006;145:284-293.
15. Gøtzsche PC, Hrobjartsson A, Johansen H, et al. Ghost authorship in industry-initiated randomised trials. PLoS Med. 2007;4(1):e19.
16. Smith R. Medical journals are an extension of the marketing arm of pharmaceutical companies. PLoS Med. 2005;2(5):e138.
17. Horton R. The dawn of McScience. New York Rev Books. 2004;51(4):7-9.
18. Turner EH, Matthews A, Linardatos E, et al. Selective publication of antidepressant trials and its influence on apparent efficacy. N Engl J Med. 2008;358:252-260.
19. Henry V. Off-label prescribing. Legal implications. J Leg Med. 1999;20:365-383.
20. Klein v Biscup, 673 NE2d 225 (Ohio App 1996).
21. Beck JM, Azari ED. FDA, off-label use, and informed consent: debunking myths and misconceptions. Food Drug Law J. 1998;53:71-104.
22. Shajnfeld A, Krueger RB. Reforming (purportedly) non-punitive responses to sexual offending. Developments in Mental Health Law. 2006;25:81-99.
23. Royal College of Psychiatrists CR142. Use of unlicensed medicine for unlicensed applications in psychiatric practice. Available at: http://www.rcpsych.ac.uk/publications/collegereports/cr/cr142.aspx. Accessed October 21, 2008.

Douglas Mossman, MD
Dr. Mossman is director, Glenn M. Weaver Institute of Law and Psychiatry, University of Cincinnati College of Law, and volunteer professor of psychiatry and associate program director, Institute for Psychiatry and Law, University of Cincinnati College of Medicine.
Douglas Mossman, MD
Dr. Mossman is director, Glenn M. Weaver Institute of Law and Psychiatry, University of Cincinnati College of Law, and volunteer professor of psychiatry and associate program director, Institute for Psychiatry and Law, University of Cincinnati College of Medicine.
Douglas Mossman, MD
Dr. Mossman is director, Glenn M. Weaver Institute of Law and Psychiatry, University of Cincinnati College of Law, and volunteer professor of psychiatry and associate program director, Institute for Psychiatry and Law, University of Cincinnati College of Medicine.
Dear Dr. Mossman:
When I was a resident, attending physicians occasionally cited journal articles in their consultation notes to substantiate their treatment choices. Since then, I’ve done this at times when I’ve prescribed a drug off-label.
Recently, I mentioned this practice to a physician who is trained as a lawyer. He thought citing articles in a patient’s chart was a bad idea, because by doing so I was automatically making the referred-to article the “expert witness.” If a lawsuit occurred, I might be called upon to justify the article’s validity, statistical details, methodology, etc. My intent is to show that I have a detailed, well-thought-out justification for my treatment choice.
Am I placing myself at greater risk of incurring liability should a lawsuit occur?—Submitted by “Dr. W”
Dr. W wants to know how he can minimize malpractice risk when prescribing a medication off label and wonders if citing an article in a patient’s chart is a good or bad idea. In law school, attorneys-in-training learn to answer very general legal questions with, “It depends.” There’s little certainty about how to avoid successful malpractice litigation, because few if any strategies have been tested systematically. However, this article will explain—and hopefully help you avoid—the medicolegal pitfalls of off-label prescribing.
Off-label: ‘Accepted and necessary’
Off-label prescribing occurs when a physician prescribes a medication or uses a medical device outside the scope of FDA-approved labeling. Most commonly, off-label use involves prescribing a medication for something other than its FDA-approved indication—such as sildenafil for women with antidepressant-induced sexual dysfunction.1
Other examples are prescribing a drug:
- at an unapproved dose
- in an unapproved format, such as mixing capsule contents with applesauce
- outside the approved age group
- for longer than the approved interval
- at a different dose schedule, such as qhs instead of bid or tid.
- Submit your malpractice-related questions to Dr. Mossman at [email protected].
- Include your name, address, and practice location. If your question is chosen for publication, your name can be withheld by request.
- All readers who submit questions will be included in quarterly drawings for a $50 gift certificate for Professional Risk Management Services, Inc’s online marketplace of risk management publications and resources (www.prms.com).
Typically, it takes years for a new drug to gain FDA approval and additional time for an already-approved drug to gain approval for a new indication. In the mean-time, clinicians treat their patients with available drugs prescribed off-label.
Off-label prescribing is legal. FDA approval means drugs may be sold and marketed in specific ways, but the FDA does not tell physicians how they can use approved drugs. As each edition of the Physicians’ Desk Reference explains, “Once a product has been approved for marketing, a physician may prescribe it for uses or in treatment regimens or patient populations that are not included in approved labeling.”2 Federal statutes state that FDA approval does not “limit or interfere with the authority of a health care practitioner to prescribe” approved drugs or devices “for any condition or disease.”3
Courts endorse off-label prescribing. As 1 appellate decision states, “Because the pace of medical discovery runs ahead of the FDA’s regulatory machinery, the off-label use of some drugs is frequently considered to be ‘state-of-the-art’ treatment.”4 The U.S. Supreme Court has concluded that off-label prescribing “is an accepted and necessary corollary of the FDA’s mission to regulate.”5
Limited testing for safety and effectiveness. Experiences such as “Fen-phen” for weight loss11 and estrogens for preventing vascular disease in postmenopausal women12 remind physicians that some untested treatments may do more harm than good.
Commercial influence. Pharmaceutical companies have used advisory boards, consultant meetings, and continuing medical education events to promote unproven off-label indications for drugs.13,14 Many studies ostensibly designed and proposed by researchers show evidence of “ghost authorship” by commercial concerns.15
Study bias. Even published, peer-reviewed, double-blind studies might not sufficiently support off-label prescribing practices, because sponsors of such studies can structure them or use statistical analyses to make results look favorable. Former editors of the British Medical Journal and the Lancet have acknowledged that their publications unwittingly served as “an extension of the marketing arm” or “laundering operations” for drug manufacturers.16,17 Even for FDA-approved indications, a selective, positive-result publication bias and non-reporting of negative results may make drugs seem more effective than the full range of studies would justify.18
Legal use of labeling. Though off-label prescribing is accepted medical practice, doctors “may be found negligent if their decision to use a drug off-label is sufficiently careless, imprudent, or unprofessional.”4 During a malpractice lawsuit, plaintiff’s counsel could try to use FDA-approved labeling or prescribing information to establish a presumptive standard of care. Such evidence usually is admissible if it is supported by expert testimony. It places the burden of proof on the defendant physician to show how an off-label use met the standard of care.19
Is off-label use malpractice?
Off-label use is not only legal, it’s often wise medical practice. Many drug uses that now have FDA approval were off-label just a few years ago. Examples include using selective serotonin reuptake inhibitors (SSRIs) to treat panic disorder and obsessive-compulsive disorder and valproate for bipolar mania. Though fluoxetine is the only FDA-approved drug for treating depression in adolescents, other SSRIs may have a favorable risk-benefit profile.6
Numerous studies have shown that off-label prescribing is common in psychiatry7 and other specialties.8,9 Because the practice is so common, the mere fact that a drug is not FDA-approved for a particular use does not imply that the drug was prescribed negligently.
Are patients human guinea pigs?
Some commentators have suggested that off-label prescribing amounts to human experimentation.10 Without FDA approval, they say physicians lack “hard evidence” that a product is safe and effective, so off-label prescribing is a small-scale clinical trial based on the doctor’s educated guesses. If this reasoning is correct, off-label prescribing would require the same human subject protections used in research, including institution review board approval and special consent forms.
Although this argument sounds plausible, off-label prescribing is not experimentation or research (Box).4,11-19 Researchers investigate hypotheses to obtain generalizable knowledge, whereas medical therapy aims to benefit individual patients. This experimentation/therapy distinction is not perfect because successful off-label treatment of 1 patient might imply beneficial effects for others.10 When courts have looked at this matter, though, they have found that “off-label use…by a physician seeking an optimal treatment for his or her patient is not necessarily…research or an investigational or experimental treatment when the use is customarily followed by physicians.”4
Courts also have said that off-label use does not require special informed consent. Just because a drug is prescribed off-label doesn’t mean it’s risky. FDA approval “is not a material risk inherently involved in a proposed therapy which a physician should have disclosed to a patient prior to the therapy.”20 In other words, a physician is not required to discuss FDA regulatory status—such as off-label uses of a medication—to comply with standards of informed consent. FDA regulatory status has nothing to do with the risks or benefits of a medication and it does not provide information about treatment alternatives.21
What should you do?
Keep abreast of news and scientific evidence concerning drug uses, effects, interactions, and adverse effects, especially when prescribing for uses that are different from the manufacturer’s intended purposes (such as hormone therapy for sex offenders).22
Collect articles on off-label uses, but keep them separate from your patients’ files. Good attorneys are highly skilled at using documents to score legal points, and opposing counsel will prepare questions to focus on the articles’ faults or limitations in isolation.
Know why an article applies to your patient. If you are sued for malpractice, you can use an article to support your treatment choice by explaining how this information contributed to your decision-making.
Tell your patient that the proposed treatment is an off-label use when you obtain consent, even though case law says you don’t have to do this. Telling your patient helps him understand your reasoning and prevents surprises that may give offense. For example, if you prescribe a second-generation antipsychotic for a nonpsychotic patient, you wouldn’t want your patient to think you believe he has schizophrenia when he reads the information his pharmacy attaches to his prescription.
Engage in ongoing informed consent. Uncertainty is part of medical practice and is heightened when doctors prescribe off-label. Ongoing discussions help patients understand, accept, and share that uncertainty.
Document informed consent. This will show—if it becomes necessary—that you and your patient made collaborative, conscientious decisions about treatment.23
Related resources
- Zito JM, Derivan AT, Kratochvil CJ, et al. Off-label psychopharmacologic prescribing for children: history supports close clinical monitoring. Child Adolesc Psychiatry Ment Health. 2008;2:24. www.capmh.com/content/pdf/1753-2000-2-24.pdf.
- Spiesel S. Prozac on the playground. October 15, 2008. Slate. www.slate.com/id/2202338.
Drug brand names
- Fenfluramine and phentermine • Fen-phen
- Fluoxetine • Prozac
- Sildenafil • Viagra
- Valproate • Depakote
1. Nurnberg HG, Hensley PL, Heiman JR, et al. Sildenafil treatment of women with antidepressant-associated sexual dysfunction: a randomized controlled trial. JAMA. 2008;300:395-404.
2. Physicians’ Desk Reference. 62nd edition. Montvale, NJ: Thomson Healthcare, Inc.; 2007.
3. Food, Drug and Cosmetic Act, 21USC §396.
4. Richardson v Miller, 44 SW3d 1 (Tenn Ct App 2000).
5. Buckman Co. v Plaintiffs’ Legal Comm., 531 US 341 (2001).
6. Bridge JA, Iyengar S, Salary CB, et al. Clinical response and risk for reported suicidal ideation and suicide attempts in pediatric antidepressant treatment: a meta-analysis of randomized controlled trials. JAMA. 2007;297:1683-1696.
7. Baldwin DS, Kosky N. Off-label prescribing in psychiatric practice. Advances in Psychiatric Treatment. 2007;13:414-422.
8. Conroy S, Choonare I, Impicciatore P, et al. Survey of unlicensed and off label drug use in paediatric wards in European countries. Br Med J. 2000;320:79-82.
9. Radley DC, Finkelstein SN, Stafford RS. Off-label prescribing among office-based physicians. Arch Intern Med. 2006;166:1021-1026.
10. Mehlman MJ. Off-label prescribing. Available at: http://www.thedoctorwillseeyounow.com/articles/bioethics/offlabel_11. Accessed October 21, 2008.
11. Connolly H, Crary J, McGoon M, et al. Vascular heart disease associated with fenfluramine-phentermine. N Engl J Med. 1997;337:581-588.
12. Anderson GL, Limacher M, Assaf AR, et al. Effects of conjugated equine estrogen in postmenopausal women with hysterectomy: the Women’s Health Initiative randomized controlled trial. JAMA. 2004;291:1701-1712.
13. Sismondo S. Ghost management: how much of the medical literature is shaped behind the scenes by the pharmaceutical industry? PLoS Med. 2007;4(9):e286.
14. Steinman MA, Bero L, Chren M, et al. Narrative review: the promotion of gabapentin: an analysis of internal industry documents. Ann Intern Med. 2006;145:284-293.
15. Gøtzsche PC, Hrobjartsson A, Johansen H, et al. Ghost authorship in industry-initiated randomised trials. PLoS Med. 2007;4(1):e19.
16. Smith R. Medical journals are an extension of the marketing arm of pharmaceutical companies. PLoS Med. 2005;2(5):e138.
17. Horton R. The dawn of McScience. New York Rev Books. 2004;51(4):7-9.
18. Turner EH, Matthews A, Linardatos E, et al. Selective publication of antidepressant trials and its influence on apparent efficacy. N Engl J Med. 2008;358:252-260.
19. Henry V. Off-label prescribing. Legal implications. J Leg Med. 1999;20:365-383.
20. Klein v Biscup, 673 NE2d 225 (Ohio App 1996).
21. Beck JM, Azari ED. FDA, off-label use, and informed consent: debunking myths and misconceptions. Food Drug Law J. 1998;53:71-104.
22. Shajnfeld A, Krueger RB. Reforming (purportedly) non-punitive responses to sexual offending. Developments in Mental Health Law. 2006;25:81-99.
23. Royal College of Psychiatrists CR142. Use of unlicensed medicine for unlicensed applications in psychiatric practice. Available at: http://www.rcpsych.ac.uk/publications/collegereports/cr/cr142.aspx. Accessed October 21, 2008.
Doctor, my breathing is better when I lie down
A 73‐year‐old female presented with progressive shortness of breath that was worse in the upright position and was relieved when she was lying flat (platypnea). Arterial blood gas analysis revealed a partial pressure of oxygen of 56 mm Hg in the supine position and 42 mm Hg when the patient was seated upright. Chest radiography revealed an ill‐defined density in the left lung base, and a high‐resolution computed tomography scan of the chest revealed dilated arteries and veins in the left lower lobe (Figure 1). Pulmonary angiography showed a huge pulmonary arteriovenous malformation (PAVM) with a nidus of 7 cm 8 cm involving the left lower lobe (Figure 2; the arrow points to the catheter tip). Embolization therapy was not an option because of the large size of the PAVM, which would have necessitated several coils with an increased risk of systemic embolization. Left lower lobectomy was performed with marked relief of the patient's dyspnea and hypoxemia.
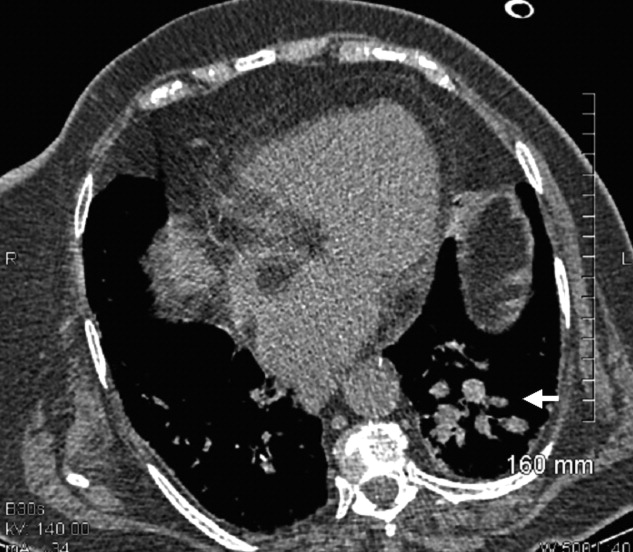
PAVMs are extracardiac shunts caused by abnormal communication between pulmonary arteries and pulmonary veins. Hereditary hemorrhagic telangiectasia accounts for nearly 84% of PAVMs. PAVMs as complications of the surgical treatment of complex cyanotic congenital heart disease, trauma, and liver disease and sporadic PAVMs, as in our case, are less common. There were no associated signs of hereditary hemorrhagic telangiectasia or liver disease in our patient, and gradual enlargement over time likely resulted in the late presentation. Common clinical manifestations of PAVMs include dyspnea, hemoptysis, and chest pain. A PAVM may also cause platypnea because of a decrease in blood flow through the PAVM in the dependent portions of the lungs when the patient changes from an upright position to a supine position. This decrease in blood flow though the PAVM causes an improvement in the shortness of breath and hypoxemia as there is decreased right‐to‐left shunting of blood. Treatment is initiated for all symptomatic patients and PAVMs more than 2 cm in diameter. Embolization therapy is preferable because it avoids the risks of major surgery. Surgery is performed for patients with an untreatable allergy to the contrast material and with large PAVMs not technically amenable to embolization therapy, as in our patient.
A 73‐year‐old female presented with progressive shortness of breath that was worse in the upright position and was relieved when she was lying flat (platypnea). Arterial blood gas analysis revealed a partial pressure of oxygen of 56 mm Hg in the supine position and 42 mm Hg when the patient was seated upright. Chest radiography revealed an ill‐defined density in the left lung base, and a high‐resolution computed tomography scan of the chest revealed dilated arteries and veins in the left lower lobe (Figure 1). Pulmonary angiography showed a huge pulmonary arteriovenous malformation (PAVM) with a nidus of 7 cm 8 cm involving the left lower lobe (Figure 2; the arrow points to the catheter tip). Embolization therapy was not an option because of the large size of the PAVM, which would have necessitated several coils with an increased risk of systemic embolization. Left lower lobectomy was performed with marked relief of the patient's dyspnea and hypoxemia.
PAVMs are extracardiac shunts caused by abnormal communication between pulmonary arteries and pulmonary veins. Hereditary hemorrhagic telangiectasia accounts for nearly 84% of PAVMs. PAVMs as complications of the surgical treatment of complex cyanotic congenital heart disease, trauma, and liver disease and sporadic PAVMs, as in our case, are less common. There were no associated signs of hereditary hemorrhagic telangiectasia or liver disease in our patient, and gradual enlargement over time likely resulted in the late presentation. Common clinical manifestations of PAVMs include dyspnea, hemoptysis, and chest pain. A PAVM may also cause platypnea because of a decrease in blood flow through the PAVM in the dependent portions of the lungs when the patient changes from an upright position to a supine position. This decrease in blood flow though the PAVM causes an improvement in the shortness of breath and hypoxemia as there is decreased right‐to‐left shunting of blood. Treatment is initiated for all symptomatic patients and PAVMs more than 2 cm in diameter. Embolization therapy is preferable because it avoids the risks of major surgery. Surgery is performed for patients with an untreatable allergy to the contrast material and with large PAVMs not technically amenable to embolization therapy, as in our patient.

Plane Crash Highlights Hospitalists' Role in MCIs
Mass casualty incidents (MCIs), such as the landing of a US Airways jetliner in New York City's frigid Hudson River, showcase the role hospitalists can play in an ED scrambling to handle a triage scenario.
When the Airbus A320 and its 155 passengers crashed Jan. 15, New York and New Jersey hospitals braced for incoming patients. However, reports showed only a few dozen passengers were treated—the most serious for a fractured leg. Still, at Jersey City (N.J.) Medical Center (JCMC), eight victims brought to the ED meant half a dozen patients had to be discharged to make room.
"The hospitalists were involved only on the periphery this time, as we initially needed their approval to move patients out in anticipation of mass casualties," Douglas Ratner, MD, chairman and program director of JCMC's Department of Medicine, wrote in an e-mail. "They will be integral in future endeavors like this."
To that end, some hospitalists used the "Miracle on the Hudson" as a rallying cry for more training.
"How many of us have gone through rigorous teamwork training to learn to better communicate with our 'cabinmates' during times of stress? Remarkably few," Robert Wachter, MD, a hospitalist as well as a professor and associate chairman of the University of California at San Francisco’s department of medicine, wrote on his blog (the-hospitalist.org/blogs). "How often do we need to demonstrate our continued competency in our specialty? For most board-certified physicians, about every 10 years (up from 'never' 20 years ago). And how well do we learn from our errors? Well, never mind."
The Blog Rounds
Too busy rounding on patients to keep up with the blogosphere? We're doing the surfing for you in this first monthly roundup of what your colleagues are buzzing about in cyberspace.
First up: The Happy Hospitalist, who was not happy about Medco CEO Dave Snow's support of treatment protocols, had the following to say last week: "This guy doesn't get it. Cookbook medicine is but a tiny fraction of care. Perhaps 5% or less. I can admit a hemorrhagic stroke, follow standardized protocols, and the next 10 patients will have 10 different permutations of care. I can follow the guidelines to a T and every single patient's comorbid conditions will add layers upon layers of complication to the management."
On SHM's Hospitalist Leader blog, former SHM CEO Rusty Holman touched upon another frustration in the workplace: New hires who complain that "this isn't what I signed up for." Dr. Holman’s advice? When hiring explain that "the job you take today is likely— no, is certain— to be different a year from now." Dr. Holman assures practice managers that "as a leader, you will never be faulted for telling the truth."
Speaking of leaders, Health Beat's Maggie Mahar offered her thoughts on President Obama's inauguration speech: "When President Obama said, 'The time has come to put away childish things,' I couldn't help but recall healthcare reformer Don Berwick, sounding discouraged last winter, as he said, 'Maybe this country just isn't mature enough for healthcare reform.' Berwick, who is the president of the Institute for Healthcare Improvement, was referring to the fact that at times, it seems that everyone wants healthcare for all— but no one wants to pay for it."
Onward and Upward
New data from the American Hospital Association (AHA) showing hospitalists number 23,000 and now practice in 4 out of 5 large hospitals drew the same response from doctors and administrators alike: We know.
"I don’t think a hospitalist program is optional," says Mark Larey, MD, vice president of medical affairs at St. Joseph's Mercy Health Center in Hot Springs, Ark. "In today’s environment, due to the regulatory issues, trying to improve patient satisfaction, trying to manage the increased unassigned population, it would be increasingly difficult to keep everything balanced … without a hospitalist service."
Dr. Larey's 309-bed hospital has a team of five internists and one nurse practitioner, and is adding a sixth full-time position this fall to absorb increased stress on the emergency department. The situation is typical of the exponential growth of the industry since it started in 1996 with as few as 500 hospitalists, says Larry Wellikson, MD, CEO of SHM.
In many hospitals, hospital medicine has become a quality-care necessity—one that increases satisfaction scores, trims length of stay, and increases emergency-room throughputs, Dr. Wellikson says. AHA figures culled from the 2007 survey of nearly 5,000 community hospitals show that at hospitals with 200 or more beds, 83% have hospital medicine programs. SHM estimates the current hospitalist workforce at 29,000.
"It took emergency medicine 25, 30 years to get to the point hospital medicine got to in 10 years," Dr. Wellikson says. "It’s the growth of a specialty on steroids."
For more information, visit http://www.aha.org/aha/research-and-trends/health-and-hospital-trends/2008.html.
Research Roundup
Question: Can a D-dimer level assess the risk of recurrent venous thromboembolism (VTE) after a course of anticoagulation therapy has been completed?
Background: The duration of anticoagulation therapy for first unprovoked VTE is uncertain. Identifying risk of recurrent VTE will help clinicians make decisions on optimal duration of anticoagulation.
Study design: Systematic review and meta-analysis.
Setting: Patients who have completed therapy for an episode of VTE without known risks.
Synopsis: Seven high-quality studies totaling 1,888 patients with first unprovoked VTE were analyzed. All patients received standardized therapy for at least three months with warfarin (Coumadin). A D-dimer had been checked in all patients between three and six weeks after stopping anticoagulation. The annual rate of VTE recurrence among patients with a positive D-dimer result was 8.9% (confidence interval (CI), 5.8% to 11.9%) compared with 3.5% (CI, 2.7 to 4.3%) for those with a negative result.
False-positive or false-negative D-dimer results could have occurred due to the heterogeneity in duration of anticoagulation and timing of D-dimer testing among the various studies. Since none of the studies were blinded to a history of VTE, there is potential for outcome ascertainment bias due to studying a sample deemed susceptible to disease recurrence.
Bottom line: D-dimer testing holds promise in identifying risk of VTE recurrence and could aid therapeutic decision-making regarding duration of anticoagulation.
Citation: Ann Intern Med. 2008;149:481-490
–Reviewed for the eWire by Rebecca Allyn, MD, Smitha Chadaga, MD, Mary Dedecker, MD, Vignesh Narayanan, MD, Eugene S. Chu, MD, Division of Hospital Medicine, Denver Health and Hospital Authority