User login
Insulin Infusion in the Non‐ICU Setting
Increasing evidence suggests that in hospitalized adult patients with and without diabetes, hyperglycemia is associated with increased risk of complications, prolonged length of hospitalization, and death.15 Past studies have shown that intensive glucose control in the intensive care unit (ICU) with continuous insulin infusion (CII) improves clinical outcomes by reducing the risk of multiorgan failure, systemic infection, and mortality. Effective management of hyperglycemia, an independent marker of poor outcome,1, 3, 6 is also associated with a decreased length of ICU and hospital stay79 and decreased total hospitalization cost.10 Based on several observational and interventional studies, improved control of blood glucose (BG) has been recommended for most adult patients with critical illness.2, 6, 11
Detrimental effects of hyperglycemia on outcome are not limited to patients in the ICU setting and CII has increasingly been used in non‐ICU settings. In such patients, the presence of hyperglycemia has been associated with prolonged hospital stay, infection, disability after hospital discharge, and death.1, 3, 6 In general medicine and surgery services, however, hyperglycemia is frequently overlooked and inadequately addressed. Numerous reports have shown that sliding scale regular insulin (SSRI) continues to be the most common insulin prescribed regimen in the non‐ICU setting.12 This regimen is challenged by limited and variable efficacy and continued concern for hypoglycemia13; thus, a more structured, target‐driven protocol such as scheduled SC insulin or a CII protocol could facilitate glycemic control in the non‐ICU setting. Recently, we reported that a scheduled regimen using basal‐bolus insulin subcutaneously was safe, effective, and superior to SSRI in controlling BG levels in hospitalized subjects with type 2 diabetes. As in many institutions in the United States, we have used CII protocols as an alternative to subcutaneous (SC) insulin for the management of persistent hyperglycemia in non‐ICU areas during the past 10 years, particularly during the postoperative period, transplant recipients, or patients transferred from the ICU. There is, however, no clinical evidence regarding the safety, efficacy, or outcomes with the use of CII in the non‐ICU setting. Accordingly, we analyzed our experience on the efficacy and safety of CII in the management of hyperglycemia in general medicine and surgical services.
Research Design and Methods
This retrospective chart analysis was conducted in adult patients >18 years of age who were consecutively admitted to the general medical and surgical wards between July 1, 2004 and June 30, 2005 at Emory University Hospital, a 579‐bed tertiary care facility staffed exclusively by Emory University School of Medicine faculty members and residents. The CII protocol, employing regular insulin (Novolin‐R Novo Nordisk Pharmaceuticals, Princeton, NJ) with a very short half‐life, in this study is a dynamic protocol14 that has been available at all nursing stations at Emory Hospital for the past decade (Table 1). The insulin rate is calculated using the formula (BG 60) (multiplier) = units of insulin per hour. The multiplier is a value used to denote the degree of insulin sensitivity based on glucose pattern and response to insulin. The multiplier typically starts at a value of 0.02 and is adjusted by the nurse as needed to achieve target BG levels based on bedside capillary glucose measurements. Blood glucose levels were checked every 1 to 2 hours by the nursing staff (nurse:patient ratio = 1:5) according to the protocol.
| ||
| Date (mm/dd/yyyy): | Time: | Allergies: NKA |
| 1. Begin this protocol and IV fluids on ____/____/____ at __________ (time). Discontinue previous insulin orders when this protocol is started. | ||
| 2. Bedside BG monitoring q 1 h until patient is within target range two consecutive readings, and then obtain BG q 2 h. If the BG falls above or below the targeted range, resume q 1 h readings. (If using A‐line specimen, please use consistently while patient on drip). | ||
| 3. If initial BG >150 mg/dL give Regular Insulin bolus: Dose _____ units. (Dose 0.1 units/kg body weight) | ||
| 4. Insulin drip: 125 units of Regular Insulin in 250 mL 0.9% saline (1 mL of solution = 0.5 units of Insulin). | ||
| 5. Target BG Range on Insulin Drip: _____ mg/dL to _____ mg/dL (Suggested target 80‐100 for ICU patients)* | ||
| For each BG value, recalculate drip rate and disregard previous rate of infusion. | ||
| Calculate Insulin Drip rate: (BG 60) ________ (multiplier) = units of Insulin per hour ( 2 to determine cc/hour) (Typical starting multiplier 0.02 but varies by insulin sensitivity) | ||
| Adjusting Multiplier: | ||
| BG > Target Range: Increase multiplier by 0.01 | ||
| BG within Target Range: No change in multiplier | ||
| BG < Target Range: Decrease multiplier by 0.01 | ||
| 6. Treating Hypoglycemia: | ||
| 6a. BG 60‐80: Give D50W using formula: (100 BG) 0.3 = mL D50W IV Push. Adjust multiplier per protocol above | ||
| 6b. BG <60: Give D50W using formula: (100 BG) 0.3 = mL D50W IV Push | ||
| Decrease insulin drip to 50% of current infusion rate | ||
| Recheck BG in 30 minutes | ||
| BG >80: Decrease multiplier by 0.01 and then return to Step 5 formula | ||
| BG 60‐80: Repeat step 6a | ||
| BG <60: Notify MD and repeat Step 6b | ||
| 7. Continuous IV fluids ______________________ at ____________ mL/hour. (Consider changing to dextrose‐based fluids when BG <250) | ||
| 8. Additional Orders: | ||
Of 1404 patients treated with CII during the hospital stay, 1191 patients received CII in the ICU and 213 patients received CII in non‐ICU areas. The final analysis included a total of 200 non‐ICU patient records after excluding 13 patients with diabetic ketoacidosis, incomplete documentation of glycemic records, or with duration of CII for less than 3 hours. Data collected included demographics, medical history, admission diagnoses, inpatient medications, inpatient laboratory values, bedside BG measurements, insulin doses used, nutrition status during CII, length of stay, disposition at discharge, and mortality rate. Nutrition status was defined in 3 ways: (1) nil per os or nothing by mouth (NPO); (2) oral nutrition (PO‐regular or PO‐liquid); and (3) tube feeds or total parenteral nutrition (TF/TPN). Data collection was limited to the first 10 days of CII use. This study was approved by the Institutional Review Board at Emory University.
The primary aim of the study was to determine the efficacy (mean daily BG levels) and safety (number of hyperglycemic [200 mg/dL] and hypoglycemic [60 mg/dL] events) during CII. We also determined the presence of potential risk factors associated with hypoglycemic and hyperglycemic events (age, body mass index [BMI], nutrition status, renal function, corticosteroid therapy, and use of enteral and parenteral nutrition) during CII.
Statistical Analysis
Two‐sample Wilcoxon tests and analysis of variance (ANOVA) were used to compare continuous variables. Levine's test for homogeneity of variances and log transformations were used when necessary. For categorical variables, chi square (2) analysis was used. Multivariate regression analyses controlling for age, gender, race, history of diabetes mellitus (DM), BMI, Cockcroft‐Gault estimated glomerular filtration rate (GFR), steroid use, nutrition status (via oral route vs. NPO), and number of BG tests were performed based on repeated measures linear models or linear models and were used to determine the influence of demographic and clinical characteristics on the risk of hypoglycemia, hyperglycemia, mortality, and length of stay. Model building followed the backward selection procedure. All data are expressed as mean standard deviation. Statistical significance was defined as P < 0.05.
Statistical Analysis Software (SAS), version 9.1 (SAS Institute, Inc., Cary, NC), was used to perform the statistical analysis.
Results
The cohort of 200 patients consisted of 54% males and 46% females, 53% Caucasian, 37% Black, with a mean age of 52 16 years (Table 2). Forty‐five percent of patients were admitted to the general medicine service and the remaining 55% were admitted to the surgical service for admission diagnoses that included cardiovascular disorders, trauma/surgery gastrointestinal disorders, renal disorders, and infection.
| |
| Age (years) | 52 16 |
| Gender (M/F) | 108/92 |
| Race (W/B/H/O) | 106/74//3/17 |
| Admitting service, Medical/Surgical (%/%) | 45/55 |
| BMI (kg/m2) | 28.4 7.1 |
| Known diabetes/new onset (%/%) | 90/11 |
| Admission blood glucose (mg/dL) | 325 235 |
| A1c (%) | 9.1 3 |
| CrCl (mL/minute) | 59.5 44 |
| On steroids (%) | 82 (41%) |
| Insulin drip duration (hours) | 41.6 37 |
| LOS (days) | 10 9 |
The primary indication for CII was poor glycemic control in 93.4% of patients. Forty‐one percent of subjects were receiving corticosteroids and 16% were continued on the insulin drip after transferring from an ICU. Nearly 90% of subjects had a history of diabetes and 11% were diagnosed with new‐onset diabetes. The mean admission BG concentration was 325 235 mg/dL (mean SD) and the mean A1c in 121 subjects in whom it was measured was 9.1 3%. The mean BG prior to the initiation of CII (323 184) was similar to the admission BG.
Of the 173 subjects that had well‐documented glycemic goals, the BG targeted during CII was 150 mg/dL in 85% of patients while the remaining subjects had a target BG goal that ranged from 70 to 250 mg/dL. The most commonly prescribed BG target goals were 80 to 110 mg/dL (41.6%), 80 to 120 mg/dL (13.9%), and 100 to 150 mg/dL (5.8%).
BG improved rapidly after the initiation of CII. BG on the first day of CII was 182 71 mg/dL; day 2: 142 42 mg/dL; day 3: 131 38 mg/dL; and day 4: 132 43 in response to receiving an average of 84 66 units/day, 71 61 units/day, 70 61 units/day, and 64 29 units/day, respectively (Table 3). Irrespective of the target BG goal, 67% of patients reached BG levels of 150 mg/dL by 48 hours of CII initiation. The duration of CII ranged between 4 and 240 hours, with an average of 41.6 hours and a median of 28 hours. The average insulin infusion rate during CII was 4.29 2.99 units/hour and the mean amount of insulin required to attain glycemic goals was 1.96 1.88 units/kg/day.
| Mean Daily Blood Glucose (mg/dL*) | Mean Daily IV Insulin Dose (units/day) | |
|---|---|---|
| ||
| Preinfusion | 323 184 | N/A |
| Day 1 | 182 71 | 84 66 |
| Day 2 | 142 42 | 71 61 |
| Day 3 | 131 38 | 70 61 |
| Day 4 | 132 43 | 64 29 |
During CII, 48% and 35% of patients had at least 1 episode of hyperglycemia (BG >200 mg/dL) on the second and third day of CII, respectively. Hypoglycemia (BG <60 mg/dL) was noted at least once in 22% of the cohort (day 1: 11%; day 2: 16%; and day 3: 14%); however, severe hypoglycemia (BG <40 mg/dL) only occurred in 5% of subjects. During the CII, 37% of patients experienced a BG <70 mg/dL. When BG targets were stratified (<120 mg/dL vs. 120‐180 mg/dL vs. >180 mg/dL), we found no significant association between the target BG goal and the frequency of hypoglycemic or hyperglycemic events during CII. None of the episodes of hypoglycemia were associated with significant or permanent complications.
The analysis of collected variables for influence on glycemic control (ie, BMI, age, corticosteroid use, renal function, and nutrition status) revealed that subjects with a creatinine level >1.5 mg/dL may have an increased risk of hyperglycemia (BG >200 mg/dL) (P = 0.047) but not hypoglycemia. The analysis also found that younger patients (51 16 years) were more likely to have episodes of hyperglycemia than older patients (57 13 years) (P = 0.027). Hospital length of stay and mortality rate (3%) were not associated with the rate of hyperglycemic or hypoglycemic events.
Eighty‐two percent of patients received nutrition support at some point while on the CII: 48% PO‐regular diet; 14% PO‐liquid diet; and 20% TF/TPN. Due to the titration of nutrition from NPO at CII initiation to PO, NPO status was analyzed in a time‐dependent fashion. Thus, among patients on CII on day 1, day 2, day 3, day 4, and days 510; 34.0%, 26.3%, 11.3%, 12.5%, and 10.5%, respectively, were NPO.
As compared to subjects maintained NPO, subjects that received oral nutrition while on CII had an increased rate of hyperglycemic events (BG >200 mg/dL: 86% vs. 76%, P = 0.19; >300 mg/dL: 57% vs. 53%, P = 0.69; >400 mg/dL: 32% vs. 21%, P = 0.22) and a decreased rate of hypoglycemic events (BG <70 mg/dL: 33% vs. 41%, P = 0.39; BG <60 mg/dL: 20% vs. 26%, P = 0.49; and BG <40 mg/dL: 4% vs. 6%, P = 0.65). The multivariate regression analyses, however, which considered age, gender, race, BMI, renal function, steroid use, history of diabetes, and number of BG tests, showed that nutrition status during CII was associated with increased frequency of hyperglycemic (P = 0.042) and hypoglycemic events (P = 0.086). As compared to NPO, oral intake (PO‐regular or PO‐liquid) was associated with a significantly increased frequency of hyperglycemic (P = 0.012) and hypoglycemic events (P = 0.035). Patients treated with TPN had lower BG values than those not on TPN. Although we observed no increased number of hypoglycemic events, TPN‐treated subjects had higher mortality than non‐TPN treated subjects (P < 0.001).
Discussion
Our study aimed to determine the safety and efficacy of CII in non‐critically‐ill patients with persistent hyperglycemia in general medicine and surgical services. We observed that the use of CII was effective in controlling hyperglycemia, with two‐thirds of patients achieving their target BG 150 mg/dL by 48 hours of insulin infusion. The rate of hypoglycemic events with the use of CII in non‐ICU patients was similar to that reported in recent ICU trials with intensive glycemic control7, 8, 15, 16 and is comparable to that reported in studies using SC insulin therapy in non‐ICU settings.17, 18 The number of hypoglycemic and hyperglycemic events was significantly higher in patients allowed to eat compared to those patients kept NPO during CII. There is substantial observational evidence linking hyperglycemia in hospitalized patients (with and without diabetes) to poor outcomes. There is ongoing debate, however, about the optimal level of BG in hospitalized patients. Early cohort studies as well as randomized controlled trials (RCTs) suggest that intensive treatment of hyperglycemia reduces length of hospital and ICU stay, multiorgan failure and systemic infections, and mortality.7, 9 These positive reports led the American Diabetes Association (ADA) and American Association of Clinical Endocrinologists (AACE) to recommend tight glycemic control (target of 80‐110 mg/dL) in critical care units. Recent multicenter controlled trials, however, have not been able to reproduce these results and in fact, have reported an increased risk of severe hypoglycemia and mortality in ICU patients in association with tight glycemic control.15, 16, 19 New glycemic targets call for more reasonable, achievable, and safer glycemic targets20, 21 in patients receiving CII in the ICU setting. The recent ADA/AACE Inpatient Task Force now recommends against aggressive BG targets of <110 mg/dL for patients in the ICU, and suggests maintaining glucose levels between 140 and 180 mg/dL during insulin therapy. However, lower targets between 110 and 140 mg/dL, while not evidence‐based, may be acceptable in a subset of patients as long as these levels can be achieved safely by a well‐trained staff.
There are no RCTs examining the effect of intensive glycemic control on outcomes or the optimal glycemic target in hospitalized patients outside the ICU setting. However, several observational studies point to a strong association between hyperglycemia and poor clinical outcomes, including prolonged hospital stay, infection, disability after hospital discharge, and death.1, 3, 5 Despite the paucity of randomized controlled trials on general medical‐surgical floors, a premeal BG target of <140 mg/dL with random BG <180 mg/dL are recommended as long as this target can be safely achieved.21
Our study indicates that the use of CII in the non‐ICU setting is effective in improving glycemic control. After the first day of CII, the mean glucose level was within the recommended BG target of <180 mg/dL for patients treated with CII in the ICU. Moreover, the mean daily BG level during CII was lower than those recently reported with the use of SC basal‐bolus and insulin neutral protamine hagedorn (NPH) and regular insulin combinations in non‐ICU settings.17, 18 In the Randomized Study of Basal Bolus Insulin Therapy in the Inpatient Management of Patients with Type 2 Diabetes (RABBIT 2) trial, a study that compared the efficacy and safety of an SC basal‐bolus to a sliding scale insulin regimen, showed that 66% and 38% of patients, respectively, reached a target BG of <140 mg/dL.17 The Comparison of Inpatient Insulin Regimens: DEtemir plus Aspart vs. NPH plus regular in Medical Patients with Type 2 Diabetes (DEAN Trial) trial reported daily mean BG levels after the first day of 160 38 mg/dL and 158 51 mg/dL in the detemir/aspart and NPH/regular group, respectively with an achieved BG target of <140 mg/dL in 45% of patients in the detemir/aspart and in 48% in the NPH/regular18; whereas in this study we observed that most patients reached the target BG goal by 48 hours of the CII regimen.
Increasing evidence indicates that inpatient hypoglycemia is associated with short‐term and long‐term adverse outcomes.22, 23 The incidence of severe hypoglycemia (<40 mg/dL) with intensified glycemic control has ranged between 9.8% and 19%7, 15 vs. <5% in conventional treatment. In the present study, 35% of patients experienced a BG <70 mg/dL, 22% had a BG <60 mg/dL, and 5% of patients had a BG <40 mg/dL. The lower rate of hypoglycemic events with the use of CII in the non‐ICU setting observed in this study is likely the result of a more relaxed glycemic target of 80 to 150 mg/dL for the majority of subjects, as well as fewer severe comorbidities compared to patients in the ICU, where the presence of sepsis or hepatic, adrenal, or renal failure increase the risk of hypoglycemia.2224
Multivariate analyses adjusted for age, gender, race, BMI, renal function, steroid use, history of diabetes, and number of BG tests showed that nutrition status during CII was an important factor associated with increased frequency of hyperglycemic and hypoglycemic events. Compared to subjects maintained NPO, subjects who received oral intake while on CII had a significantly increased rate of hyperglycemic and hypoglycemic events. The increased risk of hypoglycemia for those allowed to eat is expected as the protocol would mandate an increase in the CII rate in response to the prandial BG increase but does not make provisions for BG assessments or CII adjustments in relationship to the meal. These results indicate that in stable patients who are ready to start eating, CII should be stopped and transitioned to SC insulin regimen. In patients who may benefit from the continued use of CII (eg, patients requiring multistep procedures/surgeries), treatment with CII could be continued with supplemental mealtime insulin (intravenous [IV] or SC).
CII may be useful in cases of patients with persistent hyperglycemia despite scheduled SC insulin regimen; in patients where rapid glycemic control may be warranted in order to decrease the risk of increased inflammation and vascular dysfunction in acute coronary syndromes; and to enhance wound healing status post surgical procedures. Other clinical scenarios in which CII may be preferred and no ICU bed is required include cases of new‐onset diabetes with significant hyperglycemia (BG >300 mg/dL), type 1 diabetes poorly controlled with SC insulin, uncontrolled gestational diabetes, parenteral nutrition use, perioperative states, or the use of high‐dose steroids or chemotherapy.
Our findings are limited by the retrospective nature of our study and the evaluation of patients in a single university medical center. Selection bias should be considered in the interpretation of the results since each index case was selected by the attending physician to be treated with CII as opposed to another regimen for inpatient glycemic control. The selection bias, however, may be limited by the fact that the subjects in this study placed on CII seemed to be similar to those in the general hospital population. A previous pilot study from a different academic institution, however, reported that implementing CII protocols in non‐ICU patients is safe and improved glycemic control without increasing hypoglycemia.25 In addition, because most subjects in this study had a history of diabetes prior to admission, these results may not be generalizable to populations with stress‐induced hyperglycemia.
In summary, our study indicates that a CII regimen is an effective option for the management of patients with persistent hyperglycemia in the non‐critical care setting. Most patients achieved and remained within targeted BG levels during CII. The overall rate of hypoglycemic events was similar to that reported in recent randomized clinical trials in the ICU and with SC insulin therapy. The frequency of hypoglycemic and hyperglycemic events was significantly increased in patients allowed to eat during CII suggesting that CII should be stopped and patients should be transitioned to an SC insulin regimen once oral intake is initiated. Future prospective, randomized studies are needed to compare the efficacy and safety of CII protocols to SC insulin protocols in the management of patients with persistent hyperglycemia in the non‐ICU setting.
- ,,,,,.Hyperglycemia: an independent marker of in‐hospital mortality in patients with undiagnosed diabetes.J Clin Endocrinol Metab.2002;87(3):978–982.
- ,,, et al.Outcome benefit of intensive insulin therapy in the critically ill: insulin dose versus glycemic control.Crit Care Med.2003;31(2):359–366.
- ,,, et al.Early postoperative glucose control predicts nosocomial infection rate in diabetic patients.JPEN J Parenter Enteral Nutr.1998;22(2):77–81.
- ,,, et al.Randomized trial of insulin‐glucose infusion followed by subcutaneous insulin treatment in diabetic patients with acute myocardial infarction (DIGAMI study): effects on mortality at 1 year.J Am Coll Cardiol.1995;26(1):57–65.
- ,,,.Glucose control and mortality in critically ill patients.JAMA.2003;290(15):2041–2047.
- ,,, et al.Management of diabetes and hyperglycemia in hospitals.Diabetes Care.2004;27(2):553–597.
- ,,, et al.Intensive insulin therapy in the medical ICU.N Engl J Med.2006;354(5):449–461.
- ,,, et al.Intensive insulin therapy in the critically ill patients.N Engl J Med.2001;345(19):1359–1367.
- ,,, et al.Continuous insulin infusion reduces mortality in patients with diabetes undergoing coronary artery bypass grafting.J Thorac Cardiovasc Surg.2003;125(5):1007–1021.
- ,.Cost analysis of intensive glycemic control in critically ill adult patients.Chest.2006;129(3):644–650.
- ,,, et al.Intensive versus conventional glucose control in critically ill patients.N Engl J Med.2009;360(13):1283–1297.
- ,,, et al.Implementation of a safe and effective insulin infusion protocol in a medical intensive care unit.Diabetes Care.2004;27(2):461–467.
- ,,.Glycemic control and sliding scale insulin use in medical inpatients with diabetes mellitus.Arch Intern Med.1997;157(5):545–552.
- .Diabetes Dek Professional Edition.Eatonton, GA:American Diabetes Association;1993.
- ,,, et al.Intensive insulin therapy and pentastarch resuscitation in severe sepsis.N Engl J Med.2008;358(2):125–139.
- ,,, et al.Intensive insulin therapy and mortality among critically ill patients: a meta‐analysis including NICE‐SUGAR study data.CMAJ.2009;180(8):799–800.
- ,,, et al.Randomized study of basal‐bolus insulin therapy in the inpatient management of patients with type 2 diabetes (RABBIT 2 trial).Diabetes Care.2007;30(9):2181–2186.
- ,,, et al.Comparison of inpatient insulin regimens with detemir plus aspart versus neutral protamine hagedorn plus regular in medical patients with type 2 diabetes.J Clin Endocrinol Metab.2009;94(2):564–569.
- ,,, et al.Strict glycaemic control in patients hospitalised in a mixed medical and surgical intensive care unit: a randomised clinical trial.Crit Care.2008;12(5):R120.
- ,,, et al.Hyperglycemia and acute coronary syndrome: a scientific statement from the American Heart Association Diabetes Committee of the Council on Nutrition, Physical Activity, and Metabolism.Circulation.2008;117(12):1610–1619.
- ,,, et al.American Association of Clinical Endocrinologists/American Diabetes Association: Consensus Statement on Inpatient Glycemic Control.Endocr Pract.2009;15(4):353–369.
- .Blood glucose and its prognostic implications in patients hospitalised with acute myocardial infarction.Diab Vasc Dis Res.2008;5(4):269–275.
- ,.Severe hypoglycemia in critically ill patients: risk factors and outcomes.Crit Care Med.2007;35(10):2262–2267.
- ,,, et al.Evaluation of short‐term consequences of hypoglycemia in an intensive care unit.Crit Care Med.2006;34(11):2714–2718.
- ,,,.New insulin infusion protocol Improves blood glucose control in hospitalized patients without increasing hypoglycemia.Jt Comm J Qual Patient Saf.2005;31(3):141–147.
Increasing evidence suggests that in hospitalized adult patients with and without diabetes, hyperglycemia is associated with increased risk of complications, prolonged length of hospitalization, and death.15 Past studies have shown that intensive glucose control in the intensive care unit (ICU) with continuous insulin infusion (CII) improves clinical outcomes by reducing the risk of multiorgan failure, systemic infection, and mortality. Effective management of hyperglycemia, an independent marker of poor outcome,1, 3, 6 is also associated with a decreased length of ICU and hospital stay79 and decreased total hospitalization cost.10 Based on several observational and interventional studies, improved control of blood glucose (BG) has been recommended for most adult patients with critical illness.2, 6, 11
Detrimental effects of hyperglycemia on outcome are not limited to patients in the ICU setting and CII has increasingly been used in non‐ICU settings. In such patients, the presence of hyperglycemia has been associated with prolonged hospital stay, infection, disability after hospital discharge, and death.1, 3, 6 In general medicine and surgery services, however, hyperglycemia is frequently overlooked and inadequately addressed. Numerous reports have shown that sliding scale regular insulin (SSRI) continues to be the most common insulin prescribed regimen in the non‐ICU setting.12 This regimen is challenged by limited and variable efficacy and continued concern for hypoglycemia13; thus, a more structured, target‐driven protocol such as scheduled SC insulin or a CII protocol could facilitate glycemic control in the non‐ICU setting. Recently, we reported that a scheduled regimen using basal‐bolus insulin subcutaneously was safe, effective, and superior to SSRI in controlling BG levels in hospitalized subjects with type 2 diabetes. As in many institutions in the United States, we have used CII protocols as an alternative to subcutaneous (SC) insulin for the management of persistent hyperglycemia in non‐ICU areas during the past 10 years, particularly during the postoperative period, transplant recipients, or patients transferred from the ICU. There is, however, no clinical evidence regarding the safety, efficacy, or outcomes with the use of CII in the non‐ICU setting. Accordingly, we analyzed our experience on the efficacy and safety of CII in the management of hyperglycemia in general medicine and surgical services.
Research Design and Methods
This retrospective chart analysis was conducted in adult patients >18 years of age who were consecutively admitted to the general medical and surgical wards between July 1, 2004 and June 30, 2005 at Emory University Hospital, a 579‐bed tertiary care facility staffed exclusively by Emory University School of Medicine faculty members and residents. The CII protocol, employing regular insulin (Novolin‐R Novo Nordisk Pharmaceuticals, Princeton, NJ) with a very short half‐life, in this study is a dynamic protocol14 that has been available at all nursing stations at Emory Hospital for the past decade (Table 1). The insulin rate is calculated using the formula (BG 60) (multiplier) = units of insulin per hour. The multiplier is a value used to denote the degree of insulin sensitivity based on glucose pattern and response to insulin. The multiplier typically starts at a value of 0.02 and is adjusted by the nurse as needed to achieve target BG levels based on bedside capillary glucose measurements. Blood glucose levels were checked every 1 to 2 hours by the nursing staff (nurse:patient ratio = 1:5) according to the protocol.
| ||
| Date (mm/dd/yyyy): | Time: | Allergies: NKA |
| 1. Begin this protocol and IV fluids on ____/____/____ at __________ (time). Discontinue previous insulin orders when this protocol is started. | ||
| 2. Bedside BG monitoring q 1 h until patient is within target range two consecutive readings, and then obtain BG q 2 h. If the BG falls above or below the targeted range, resume q 1 h readings. (If using A‐line specimen, please use consistently while patient on drip). | ||
| 3. If initial BG >150 mg/dL give Regular Insulin bolus: Dose _____ units. (Dose 0.1 units/kg body weight) | ||
| 4. Insulin drip: 125 units of Regular Insulin in 250 mL 0.9% saline (1 mL of solution = 0.5 units of Insulin). | ||
| 5. Target BG Range on Insulin Drip: _____ mg/dL to _____ mg/dL (Suggested target 80‐100 for ICU patients)* | ||
| For each BG value, recalculate drip rate and disregard previous rate of infusion. | ||
| Calculate Insulin Drip rate: (BG 60) ________ (multiplier) = units of Insulin per hour ( 2 to determine cc/hour) (Typical starting multiplier 0.02 but varies by insulin sensitivity) | ||
| Adjusting Multiplier: | ||
| BG > Target Range: Increase multiplier by 0.01 | ||
| BG within Target Range: No change in multiplier | ||
| BG < Target Range: Decrease multiplier by 0.01 | ||
| 6. Treating Hypoglycemia: | ||
| 6a. BG 60‐80: Give D50W using formula: (100 BG) 0.3 = mL D50W IV Push. Adjust multiplier per protocol above | ||
| 6b. BG <60: Give D50W using formula: (100 BG) 0.3 = mL D50W IV Push | ||
| Decrease insulin drip to 50% of current infusion rate | ||
| Recheck BG in 30 minutes | ||
| BG >80: Decrease multiplier by 0.01 and then return to Step 5 formula | ||
| BG 60‐80: Repeat step 6a | ||
| BG <60: Notify MD and repeat Step 6b | ||
| 7. Continuous IV fluids ______________________ at ____________ mL/hour. (Consider changing to dextrose‐based fluids when BG <250) | ||
| 8. Additional Orders: | ||
Of 1404 patients treated with CII during the hospital stay, 1191 patients received CII in the ICU and 213 patients received CII in non‐ICU areas. The final analysis included a total of 200 non‐ICU patient records after excluding 13 patients with diabetic ketoacidosis, incomplete documentation of glycemic records, or with duration of CII for less than 3 hours. Data collected included demographics, medical history, admission diagnoses, inpatient medications, inpatient laboratory values, bedside BG measurements, insulin doses used, nutrition status during CII, length of stay, disposition at discharge, and mortality rate. Nutrition status was defined in 3 ways: (1) nil per os or nothing by mouth (NPO); (2) oral nutrition (PO‐regular or PO‐liquid); and (3) tube feeds or total parenteral nutrition (TF/TPN). Data collection was limited to the first 10 days of CII use. This study was approved by the Institutional Review Board at Emory University.
The primary aim of the study was to determine the efficacy (mean daily BG levels) and safety (number of hyperglycemic [200 mg/dL] and hypoglycemic [60 mg/dL] events) during CII. We also determined the presence of potential risk factors associated with hypoglycemic and hyperglycemic events (age, body mass index [BMI], nutrition status, renal function, corticosteroid therapy, and use of enteral and parenteral nutrition) during CII.
Statistical Analysis
Two‐sample Wilcoxon tests and analysis of variance (ANOVA) were used to compare continuous variables. Levine's test for homogeneity of variances and log transformations were used when necessary. For categorical variables, chi square (2) analysis was used. Multivariate regression analyses controlling for age, gender, race, history of diabetes mellitus (DM), BMI, Cockcroft‐Gault estimated glomerular filtration rate (GFR), steroid use, nutrition status (via oral route vs. NPO), and number of BG tests were performed based on repeated measures linear models or linear models and were used to determine the influence of demographic and clinical characteristics on the risk of hypoglycemia, hyperglycemia, mortality, and length of stay. Model building followed the backward selection procedure. All data are expressed as mean standard deviation. Statistical significance was defined as P < 0.05.
Statistical Analysis Software (SAS), version 9.1 (SAS Institute, Inc., Cary, NC), was used to perform the statistical analysis.
Results
The cohort of 200 patients consisted of 54% males and 46% females, 53% Caucasian, 37% Black, with a mean age of 52 16 years (Table 2). Forty‐five percent of patients were admitted to the general medicine service and the remaining 55% were admitted to the surgical service for admission diagnoses that included cardiovascular disorders, trauma/surgery gastrointestinal disorders, renal disorders, and infection.
| |
| Age (years) | 52 16 |
| Gender (M/F) | 108/92 |
| Race (W/B/H/O) | 106/74//3/17 |
| Admitting service, Medical/Surgical (%/%) | 45/55 |
| BMI (kg/m2) | 28.4 7.1 |
| Known diabetes/new onset (%/%) | 90/11 |
| Admission blood glucose (mg/dL) | 325 235 |
| A1c (%) | 9.1 3 |
| CrCl (mL/minute) | 59.5 44 |
| On steroids (%) | 82 (41%) |
| Insulin drip duration (hours) | 41.6 37 |
| LOS (days) | 10 9 |
The primary indication for CII was poor glycemic control in 93.4% of patients. Forty‐one percent of subjects were receiving corticosteroids and 16% were continued on the insulin drip after transferring from an ICU. Nearly 90% of subjects had a history of diabetes and 11% were diagnosed with new‐onset diabetes. The mean admission BG concentration was 325 235 mg/dL (mean SD) and the mean A1c in 121 subjects in whom it was measured was 9.1 3%. The mean BG prior to the initiation of CII (323 184) was similar to the admission BG.
Of the 173 subjects that had well‐documented glycemic goals, the BG targeted during CII was 150 mg/dL in 85% of patients while the remaining subjects had a target BG goal that ranged from 70 to 250 mg/dL. The most commonly prescribed BG target goals were 80 to 110 mg/dL (41.6%), 80 to 120 mg/dL (13.9%), and 100 to 150 mg/dL (5.8%).
BG improved rapidly after the initiation of CII. BG on the first day of CII was 182 71 mg/dL; day 2: 142 42 mg/dL; day 3: 131 38 mg/dL; and day 4: 132 43 in response to receiving an average of 84 66 units/day, 71 61 units/day, 70 61 units/day, and 64 29 units/day, respectively (Table 3). Irrespective of the target BG goal, 67% of patients reached BG levels of 150 mg/dL by 48 hours of CII initiation. The duration of CII ranged between 4 and 240 hours, with an average of 41.6 hours and a median of 28 hours. The average insulin infusion rate during CII was 4.29 2.99 units/hour and the mean amount of insulin required to attain glycemic goals was 1.96 1.88 units/kg/day.
| Mean Daily Blood Glucose (mg/dL*) | Mean Daily IV Insulin Dose (units/day) | |
|---|---|---|
| ||
| Preinfusion | 323 184 | N/A |
| Day 1 | 182 71 | 84 66 |
| Day 2 | 142 42 | 71 61 |
| Day 3 | 131 38 | 70 61 |
| Day 4 | 132 43 | 64 29 |
During CII, 48% and 35% of patients had at least 1 episode of hyperglycemia (BG >200 mg/dL) on the second and third day of CII, respectively. Hypoglycemia (BG <60 mg/dL) was noted at least once in 22% of the cohort (day 1: 11%; day 2: 16%; and day 3: 14%); however, severe hypoglycemia (BG <40 mg/dL) only occurred in 5% of subjects. During the CII, 37% of patients experienced a BG <70 mg/dL. When BG targets were stratified (<120 mg/dL vs. 120‐180 mg/dL vs. >180 mg/dL), we found no significant association between the target BG goal and the frequency of hypoglycemic or hyperglycemic events during CII. None of the episodes of hypoglycemia were associated with significant or permanent complications.
The analysis of collected variables for influence on glycemic control (ie, BMI, age, corticosteroid use, renal function, and nutrition status) revealed that subjects with a creatinine level >1.5 mg/dL may have an increased risk of hyperglycemia (BG >200 mg/dL) (P = 0.047) but not hypoglycemia. The analysis also found that younger patients (51 16 years) were more likely to have episodes of hyperglycemia than older patients (57 13 years) (P = 0.027). Hospital length of stay and mortality rate (3%) were not associated with the rate of hyperglycemic or hypoglycemic events.
Eighty‐two percent of patients received nutrition support at some point while on the CII: 48% PO‐regular diet; 14% PO‐liquid diet; and 20% TF/TPN. Due to the titration of nutrition from NPO at CII initiation to PO, NPO status was analyzed in a time‐dependent fashion. Thus, among patients on CII on day 1, day 2, day 3, day 4, and days 510; 34.0%, 26.3%, 11.3%, 12.5%, and 10.5%, respectively, were NPO.
As compared to subjects maintained NPO, subjects that received oral nutrition while on CII had an increased rate of hyperglycemic events (BG >200 mg/dL: 86% vs. 76%, P = 0.19; >300 mg/dL: 57% vs. 53%, P = 0.69; >400 mg/dL: 32% vs. 21%, P = 0.22) and a decreased rate of hypoglycemic events (BG <70 mg/dL: 33% vs. 41%, P = 0.39; BG <60 mg/dL: 20% vs. 26%, P = 0.49; and BG <40 mg/dL: 4% vs. 6%, P = 0.65). The multivariate regression analyses, however, which considered age, gender, race, BMI, renal function, steroid use, history of diabetes, and number of BG tests, showed that nutrition status during CII was associated with increased frequency of hyperglycemic (P = 0.042) and hypoglycemic events (P = 0.086). As compared to NPO, oral intake (PO‐regular or PO‐liquid) was associated with a significantly increased frequency of hyperglycemic (P = 0.012) and hypoglycemic events (P = 0.035). Patients treated with TPN had lower BG values than those not on TPN. Although we observed no increased number of hypoglycemic events, TPN‐treated subjects had higher mortality than non‐TPN treated subjects (P < 0.001).
Discussion
Our study aimed to determine the safety and efficacy of CII in non‐critically‐ill patients with persistent hyperglycemia in general medicine and surgical services. We observed that the use of CII was effective in controlling hyperglycemia, with two‐thirds of patients achieving their target BG 150 mg/dL by 48 hours of insulin infusion. The rate of hypoglycemic events with the use of CII in non‐ICU patients was similar to that reported in recent ICU trials with intensive glycemic control7, 8, 15, 16 and is comparable to that reported in studies using SC insulin therapy in non‐ICU settings.17, 18 The number of hypoglycemic and hyperglycemic events was significantly higher in patients allowed to eat compared to those patients kept NPO during CII. There is substantial observational evidence linking hyperglycemia in hospitalized patients (with and without diabetes) to poor outcomes. There is ongoing debate, however, about the optimal level of BG in hospitalized patients. Early cohort studies as well as randomized controlled trials (RCTs) suggest that intensive treatment of hyperglycemia reduces length of hospital and ICU stay, multiorgan failure and systemic infections, and mortality.7, 9 These positive reports led the American Diabetes Association (ADA) and American Association of Clinical Endocrinologists (AACE) to recommend tight glycemic control (target of 80‐110 mg/dL) in critical care units. Recent multicenter controlled trials, however, have not been able to reproduce these results and in fact, have reported an increased risk of severe hypoglycemia and mortality in ICU patients in association with tight glycemic control.15, 16, 19 New glycemic targets call for more reasonable, achievable, and safer glycemic targets20, 21 in patients receiving CII in the ICU setting. The recent ADA/AACE Inpatient Task Force now recommends against aggressive BG targets of <110 mg/dL for patients in the ICU, and suggests maintaining glucose levels between 140 and 180 mg/dL during insulin therapy. However, lower targets between 110 and 140 mg/dL, while not evidence‐based, may be acceptable in a subset of patients as long as these levels can be achieved safely by a well‐trained staff.
There are no RCTs examining the effect of intensive glycemic control on outcomes or the optimal glycemic target in hospitalized patients outside the ICU setting. However, several observational studies point to a strong association between hyperglycemia and poor clinical outcomes, including prolonged hospital stay, infection, disability after hospital discharge, and death.1, 3, 5 Despite the paucity of randomized controlled trials on general medical‐surgical floors, a premeal BG target of <140 mg/dL with random BG <180 mg/dL are recommended as long as this target can be safely achieved.21
Our study indicates that the use of CII in the non‐ICU setting is effective in improving glycemic control. After the first day of CII, the mean glucose level was within the recommended BG target of <180 mg/dL for patients treated with CII in the ICU. Moreover, the mean daily BG level during CII was lower than those recently reported with the use of SC basal‐bolus and insulin neutral protamine hagedorn (NPH) and regular insulin combinations in non‐ICU settings.17, 18 In the Randomized Study of Basal Bolus Insulin Therapy in the Inpatient Management of Patients with Type 2 Diabetes (RABBIT 2) trial, a study that compared the efficacy and safety of an SC basal‐bolus to a sliding scale insulin regimen, showed that 66% and 38% of patients, respectively, reached a target BG of <140 mg/dL.17 The Comparison of Inpatient Insulin Regimens: DEtemir plus Aspart vs. NPH plus regular in Medical Patients with Type 2 Diabetes (DEAN Trial) trial reported daily mean BG levels after the first day of 160 38 mg/dL and 158 51 mg/dL in the detemir/aspart and NPH/regular group, respectively with an achieved BG target of <140 mg/dL in 45% of patients in the detemir/aspart and in 48% in the NPH/regular18; whereas in this study we observed that most patients reached the target BG goal by 48 hours of the CII regimen.
Increasing evidence indicates that inpatient hypoglycemia is associated with short‐term and long‐term adverse outcomes.22, 23 The incidence of severe hypoglycemia (<40 mg/dL) with intensified glycemic control has ranged between 9.8% and 19%7, 15 vs. <5% in conventional treatment. In the present study, 35% of patients experienced a BG <70 mg/dL, 22% had a BG <60 mg/dL, and 5% of patients had a BG <40 mg/dL. The lower rate of hypoglycemic events with the use of CII in the non‐ICU setting observed in this study is likely the result of a more relaxed glycemic target of 80 to 150 mg/dL for the majority of subjects, as well as fewer severe comorbidities compared to patients in the ICU, where the presence of sepsis or hepatic, adrenal, or renal failure increase the risk of hypoglycemia.2224
Multivariate analyses adjusted for age, gender, race, BMI, renal function, steroid use, history of diabetes, and number of BG tests showed that nutrition status during CII was an important factor associated with increased frequency of hyperglycemic and hypoglycemic events. Compared to subjects maintained NPO, subjects who received oral intake while on CII had a significantly increased rate of hyperglycemic and hypoglycemic events. The increased risk of hypoglycemia for those allowed to eat is expected as the protocol would mandate an increase in the CII rate in response to the prandial BG increase but does not make provisions for BG assessments or CII adjustments in relationship to the meal. These results indicate that in stable patients who are ready to start eating, CII should be stopped and transitioned to SC insulin regimen. In patients who may benefit from the continued use of CII (eg, patients requiring multistep procedures/surgeries), treatment with CII could be continued with supplemental mealtime insulin (intravenous [IV] or SC).
CII may be useful in cases of patients with persistent hyperglycemia despite scheduled SC insulin regimen; in patients where rapid glycemic control may be warranted in order to decrease the risk of increased inflammation and vascular dysfunction in acute coronary syndromes; and to enhance wound healing status post surgical procedures. Other clinical scenarios in which CII may be preferred and no ICU bed is required include cases of new‐onset diabetes with significant hyperglycemia (BG >300 mg/dL), type 1 diabetes poorly controlled with SC insulin, uncontrolled gestational diabetes, parenteral nutrition use, perioperative states, or the use of high‐dose steroids or chemotherapy.
Our findings are limited by the retrospective nature of our study and the evaluation of patients in a single university medical center. Selection bias should be considered in the interpretation of the results since each index case was selected by the attending physician to be treated with CII as opposed to another regimen for inpatient glycemic control. The selection bias, however, may be limited by the fact that the subjects in this study placed on CII seemed to be similar to those in the general hospital population. A previous pilot study from a different academic institution, however, reported that implementing CII protocols in non‐ICU patients is safe and improved glycemic control without increasing hypoglycemia.25 In addition, because most subjects in this study had a history of diabetes prior to admission, these results may not be generalizable to populations with stress‐induced hyperglycemia.
In summary, our study indicates that a CII regimen is an effective option for the management of patients with persistent hyperglycemia in the non‐critical care setting. Most patients achieved and remained within targeted BG levels during CII. The overall rate of hypoglycemic events was similar to that reported in recent randomized clinical trials in the ICU and with SC insulin therapy. The frequency of hypoglycemic and hyperglycemic events was significantly increased in patients allowed to eat during CII suggesting that CII should be stopped and patients should be transitioned to an SC insulin regimen once oral intake is initiated. Future prospective, randomized studies are needed to compare the efficacy and safety of CII protocols to SC insulin protocols in the management of patients with persistent hyperglycemia in the non‐ICU setting.
Increasing evidence suggests that in hospitalized adult patients with and without diabetes, hyperglycemia is associated with increased risk of complications, prolonged length of hospitalization, and death.15 Past studies have shown that intensive glucose control in the intensive care unit (ICU) with continuous insulin infusion (CII) improves clinical outcomes by reducing the risk of multiorgan failure, systemic infection, and mortality. Effective management of hyperglycemia, an independent marker of poor outcome,1, 3, 6 is also associated with a decreased length of ICU and hospital stay79 and decreased total hospitalization cost.10 Based on several observational and interventional studies, improved control of blood glucose (BG) has been recommended for most adult patients with critical illness.2, 6, 11
Detrimental effects of hyperglycemia on outcome are not limited to patients in the ICU setting and CII has increasingly been used in non‐ICU settings. In such patients, the presence of hyperglycemia has been associated with prolonged hospital stay, infection, disability after hospital discharge, and death.1, 3, 6 In general medicine and surgery services, however, hyperglycemia is frequently overlooked and inadequately addressed. Numerous reports have shown that sliding scale regular insulin (SSRI) continues to be the most common insulin prescribed regimen in the non‐ICU setting.12 This regimen is challenged by limited and variable efficacy and continued concern for hypoglycemia13; thus, a more structured, target‐driven protocol such as scheduled SC insulin or a CII protocol could facilitate glycemic control in the non‐ICU setting. Recently, we reported that a scheduled regimen using basal‐bolus insulin subcutaneously was safe, effective, and superior to SSRI in controlling BG levels in hospitalized subjects with type 2 diabetes. As in many institutions in the United States, we have used CII protocols as an alternative to subcutaneous (SC) insulin for the management of persistent hyperglycemia in non‐ICU areas during the past 10 years, particularly during the postoperative period, transplant recipients, or patients transferred from the ICU. There is, however, no clinical evidence regarding the safety, efficacy, or outcomes with the use of CII in the non‐ICU setting. Accordingly, we analyzed our experience on the efficacy and safety of CII in the management of hyperglycemia in general medicine and surgical services.
Research Design and Methods
This retrospective chart analysis was conducted in adult patients >18 years of age who were consecutively admitted to the general medical and surgical wards between July 1, 2004 and June 30, 2005 at Emory University Hospital, a 579‐bed tertiary care facility staffed exclusively by Emory University School of Medicine faculty members and residents. The CII protocol, employing regular insulin (Novolin‐R Novo Nordisk Pharmaceuticals, Princeton, NJ) with a very short half‐life, in this study is a dynamic protocol14 that has been available at all nursing stations at Emory Hospital for the past decade (Table 1). The insulin rate is calculated using the formula (BG 60) (multiplier) = units of insulin per hour. The multiplier is a value used to denote the degree of insulin sensitivity based on glucose pattern and response to insulin. The multiplier typically starts at a value of 0.02 and is adjusted by the nurse as needed to achieve target BG levels based on bedside capillary glucose measurements. Blood glucose levels were checked every 1 to 2 hours by the nursing staff (nurse:patient ratio = 1:5) according to the protocol.
| ||
| Date (mm/dd/yyyy): | Time: | Allergies: NKA |
| 1. Begin this protocol and IV fluids on ____/____/____ at __________ (time). Discontinue previous insulin orders when this protocol is started. | ||
| 2. Bedside BG monitoring q 1 h until patient is within target range two consecutive readings, and then obtain BG q 2 h. If the BG falls above or below the targeted range, resume q 1 h readings. (If using A‐line specimen, please use consistently while patient on drip). | ||
| 3. If initial BG >150 mg/dL give Regular Insulin bolus: Dose _____ units. (Dose 0.1 units/kg body weight) | ||
| 4. Insulin drip: 125 units of Regular Insulin in 250 mL 0.9% saline (1 mL of solution = 0.5 units of Insulin). | ||
| 5. Target BG Range on Insulin Drip: _____ mg/dL to _____ mg/dL (Suggested target 80‐100 for ICU patients)* | ||
| For each BG value, recalculate drip rate and disregard previous rate of infusion. | ||
| Calculate Insulin Drip rate: (BG 60) ________ (multiplier) = units of Insulin per hour ( 2 to determine cc/hour) (Typical starting multiplier 0.02 but varies by insulin sensitivity) | ||
| Adjusting Multiplier: | ||
| BG > Target Range: Increase multiplier by 0.01 | ||
| BG within Target Range: No change in multiplier | ||
| BG < Target Range: Decrease multiplier by 0.01 | ||
| 6. Treating Hypoglycemia: | ||
| 6a. BG 60‐80: Give D50W using formula: (100 BG) 0.3 = mL D50W IV Push. Adjust multiplier per protocol above | ||
| 6b. BG <60: Give D50W using formula: (100 BG) 0.3 = mL D50W IV Push | ||
| Decrease insulin drip to 50% of current infusion rate | ||
| Recheck BG in 30 minutes | ||
| BG >80: Decrease multiplier by 0.01 and then return to Step 5 formula | ||
| BG 60‐80: Repeat step 6a | ||
| BG <60: Notify MD and repeat Step 6b | ||
| 7. Continuous IV fluids ______________________ at ____________ mL/hour. (Consider changing to dextrose‐based fluids when BG <250) | ||
| 8. Additional Orders: | ||
Of 1404 patients treated with CII during the hospital stay, 1191 patients received CII in the ICU and 213 patients received CII in non‐ICU areas. The final analysis included a total of 200 non‐ICU patient records after excluding 13 patients with diabetic ketoacidosis, incomplete documentation of glycemic records, or with duration of CII for less than 3 hours. Data collected included demographics, medical history, admission diagnoses, inpatient medications, inpatient laboratory values, bedside BG measurements, insulin doses used, nutrition status during CII, length of stay, disposition at discharge, and mortality rate. Nutrition status was defined in 3 ways: (1) nil per os or nothing by mouth (NPO); (2) oral nutrition (PO‐regular or PO‐liquid); and (3) tube feeds or total parenteral nutrition (TF/TPN). Data collection was limited to the first 10 days of CII use. This study was approved by the Institutional Review Board at Emory University.
The primary aim of the study was to determine the efficacy (mean daily BG levels) and safety (number of hyperglycemic [200 mg/dL] and hypoglycemic [60 mg/dL] events) during CII. We also determined the presence of potential risk factors associated with hypoglycemic and hyperglycemic events (age, body mass index [BMI], nutrition status, renal function, corticosteroid therapy, and use of enteral and parenteral nutrition) during CII.
Statistical Analysis
Two‐sample Wilcoxon tests and analysis of variance (ANOVA) were used to compare continuous variables. Levine's test for homogeneity of variances and log transformations were used when necessary. For categorical variables, chi square (2) analysis was used. Multivariate regression analyses controlling for age, gender, race, history of diabetes mellitus (DM), BMI, Cockcroft‐Gault estimated glomerular filtration rate (GFR), steroid use, nutrition status (via oral route vs. NPO), and number of BG tests were performed based on repeated measures linear models or linear models and were used to determine the influence of demographic and clinical characteristics on the risk of hypoglycemia, hyperglycemia, mortality, and length of stay. Model building followed the backward selection procedure. All data are expressed as mean standard deviation. Statistical significance was defined as P < 0.05.
Statistical Analysis Software (SAS), version 9.1 (SAS Institute, Inc., Cary, NC), was used to perform the statistical analysis.
Results
The cohort of 200 patients consisted of 54% males and 46% females, 53% Caucasian, 37% Black, with a mean age of 52 16 years (Table 2). Forty‐five percent of patients were admitted to the general medicine service and the remaining 55% were admitted to the surgical service for admission diagnoses that included cardiovascular disorders, trauma/surgery gastrointestinal disorders, renal disorders, and infection.
| |
| Age (years) | 52 16 |
| Gender (M/F) | 108/92 |
| Race (W/B/H/O) | 106/74//3/17 |
| Admitting service, Medical/Surgical (%/%) | 45/55 |
| BMI (kg/m2) | 28.4 7.1 |
| Known diabetes/new onset (%/%) | 90/11 |
| Admission blood glucose (mg/dL) | 325 235 |
| A1c (%) | 9.1 3 |
| CrCl (mL/minute) | 59.5 44 |
| On steroids (%) | 82 (41%) |
| Insulin drip duration (hours) | 41.6 37 |
| LOS (days) | 10 9 |
The primary indication for CII was poor glycemic control in 93.4% of patients. Forty‐one percent of subjects were receiving corticosteroids and 16% were continued on the insulin drip after transferring from an ICU. Nearly 90% of subjects had a history of diabetes and 11% were diagnosed with new‐onset diabetes. The mean admission BG concentration was 325 235 mg/dL (mean SD) and the mean A1c in 121 subjects in whom it was measured was 9.1 3%. The mean BG prior to the initiation of CII (323 184) was similar to the admission BG.
Of the 173 subjects that had well‐documented glycemic goals, the BG targeted during CII was 150 mg/dL in 85% of patients while the remaining subjects had a target BG goal that ranged from 70 to 250 mg/dL. The most commonly prescribed BG target goals were 80 to 110 mg/dL (41.6%), 80 to 120 mg/dL (13.9%), and 100 to 150 mg/dL (5.8%).
BG improved rapidly after the initiation of CII. BG on the first day of CII was 182 71 mg/dL; day 2: 142 42 mg/dL; day 3: 131 38 mg/dL; and day 4: 132 43 in response to receiving an average of 84 66 units/day, 71 61 units/day, 70 61 units/day, and 64 29 units/day, respectively (Table 3). Irrespective of the target BG goal, 67% of patients reached BG levels of 150 mg/dL by 48 hours of CII initiation. The duration of CII ranged between 4 and 240 hours, with an average of 41.6 hours and a median of 28 hours. The average insulin infusion rate during CII was 4.29 2.99 units/hour and the mean amount of insulin required to attain glycemic goals was 1.96 1.88 units/kg/day.
| Mean Daily Blood Glucose (mg/dL*) | Mean Daily IV Insulin Dose (units/day) | |
|---|---|---|
| ||
| Preinfusion | 323 184 | N/A |
| Day 1 | 182 71 | 84 66 |
| Day 2 | 142 42 | 71 61 |
| Day 3 | 131 38 | 70 61 |
| Day 4 | 132 43 | 64 29 |
During CII, 48% and 35% of patients had at least 1 episode of hyperglycemia (BG >200 mg/dL) on the second and third day of CII, respectively. Hypoglycemia (BG <60 mg/dL) was noted at least once in 22% of the cohort (day 1: 11%; day 2: 16%; and day 3: 14%); however, severe hypoglycemia (BG <40 mg/dL) only occurred in 5% of subjects. During the CII, 37% of patients experienced a BG <70 mg/dL. When BG targets were stratified (<120 mg/dL vs. 120‐180 mg/dL vs. >180 mg/dL), we found no significant association between the target BG goal and the frequency of hypoglycemic or hyperglycemic events during CII. None of the episodes of hypoglycemia were associated with significant or permanent complications.
The analysis of collected variables for influence on glycemic control (ie, BMI, age, corticosteroid use, renal function, and nutrition status) revealed that subjects with a creatinine level >1.5 mg/dL may have an increased risk of hyperglycemia (BG >200 mg/dL) (P = 0.047) but not hypoglycemia. The analysis also found that younger patients (51 16 years) were more likely to have episodes of hyperglycemia than older patients (57 13 years) (P = 0.027). Hospital length of stay and mortality rate (3%) were not associated with the rate of hyperglycemic or hypoglycemic events.
Eighty‐two percent of patients received nutrition support at some point while on the CII: 48% PO‐regular diet; 14% PO‐liquid diet; and 20% TF/TPN. Due to the titration of nutrition from NPO at CII initiation to PO, NPO status was analyzed in a time‐dependent fashion. Thus, among patients on CII on day 1, day 2, day 3, day 4, and days 510; 34.0%, 26.3%, 11.3%, 12.5%, and 10.5%, respectively, were NPO.
As compared to subjects maintained NPO, subjects that received oral nutrition while on CII had an increased rate of hyperglycemic events (BG >200 mg/dL: 86% vs. 76%, P = 0.19; >300 mg/dL: 57% vs. 53%, P = 0.69; >400 mg/dL: 32% vs. 21%, P = 0.22) and a decreased rate of hypoglycemic events (BG <70 mg/dL: 33% vs. 41%, P = 0.39; BG <60 mg/dL: 20% vs. 26%, P = 0.49; and BG <40 mg/dL: 4% vs. 6%, P = 0.65). The multivariate regression analyses, however, which considered age, gender, race, BMI, renal function, steroid use, history of diabetes, and number of BG tests, showed that nutrition status during CII was associated with increased frequency of hyperglycemic (P = 0.042) and hypoglycemic events (P = 0.086). As compared to NPO, oral intake (PO‐regular or PO‐liquid) was associated with a significantly increased frequency of hyperglycemic (P = 0.012) and hypoglycemic events (P = 0.035). Patients treated with TPN had lower BG values than those not on TPN. Although we observed no increased number of hypoglycemic events, TPN‐treated subjects had higher mortality than non‐TPN treated subjects (P < 0.001).
Discussion
Our study aimed to determine the safety and efficacy of CII in non‐critically‐ill patients with persistent hyperglycemia in general medicine and surgical services. We observed that the use of CII was effective in controlling hyperglycemia, with two‐thirds of patients achieving their target BG 150 mg/dL by 48 hours of insulin infusion. The rate of hypoglycemic events with the use of CII in non‐ICU patients was similar to that reported in recent ICU trials with intensive glycemic control7, 8, 15, 16 and is comparable to that reported in studies using SC insulin therapy in non‐ICU settings.17, 18 The number of hypoglycemic and hyperglycemic events was significantly higher in patients allowed to eat compared to those patients kept NPO during CII. There is substantial observational evidence linking hyperglycemia in hospitalized patients (with and without diabetes) to poor outcomes. There is ongoing debate, however, about the optimal level of BG in hospitalized patients. Early cohort studies as well as randomized controlled trials (RCTs) suggest that intensive treatment of hyperglycemia reduces length of hospital and ICU stay, multiorgan failure and systemic infections, and mortality.7, 9 These positive reports led the American Diabetes Association (ADA) and American Association of Clinical Endocrinologists (AACE) to recommend tight glycemic control (target of 80‐110 mg/dL) in critical care units. Recent multicenter controlled trials, however, have not been able to reproduce these results and in fact, have reported an increased risk of severe hypoglycemia and mortality in ICU patients in association with tight glycemic control.15, 16, 19 New glycemic targets call for more reasonable, achievable, and safer glycemic targets20, 21 in patients receiving CII in the ICU setting. The recent ADA/AACE Inpatient Task Force now recommends against aggressive BG targets of <110 mg/dL for patients in the ICU, and suggests maintaining glucose levels between 140 and 180 mg/dL during insulin therapy. However, lower targets between 110 and 140 mg/dL, while not evidence‐based, may be acceptable in a subset of patients as long as these levels can be achieved safely by a well‐trained staff.
There are no RCTs examining the effect of intensive glycemic control on outcomes or the optimal glycemic target in hospitalized patients outside the ICU setting. However, several observational studies point to a strong association between hyperglycemia and poor clinical outcomes, including prolonged hospital stay, infection, disability after hospital discharge, and death.1, 3, 5 Despite the paucity of randomized controlled trials on general medical‐surgical floors, a premeal BG target of <140 mg/dL with random BG <180 mg/dL are recommended as long as this target can be safely achieved.21
Our study indicates that the use of CII in the non‐ICU setting is effective in improving glycemic control. After the first day of CII, the mean glucose level was within the recommended BG target of <180 mg/dL for patients treated with CII in the ICU. Moreover, the mean daily BG level during CII was lower than those recently reported with the use of SC basal‐bolus and insulin neutral protamine hagedorn (NPH) and regular insulin combinations in non‐ICU settings.17, 18 In the Randomized Study of Basal Bolus Insulin Therapy in the Inpatient Management of Patients with Type 2 Diabetes (RABBIT 2) trial, a study that compared the efficacy and safety of an SC basal‐bolus to a sliding scale insulin regimen, showed that 66% and 38% of patients, respectively, reached a target BG of <140 mg/dL.17 The Comparison of Inpatient Insulin Regimens: DEtemir plus Aspart vs. NPH plus regular in Medical Patients with Type 2 Diabetes (DEAN Trial) trial reported daily mean BG levels after the first day of 160 38 mg/dL and 158 51 mg/dL in the detemir/aspart and NPH/regular group, respectively with an achieved BG target of <140 mg/dL in 45% of patients in the detemir/aspart and in 48% in the NPH/regular18; whereas in this study we observed that most patients reached the target BG goal by 48 hours of the CII regimen.
Increasing evidence indicates that inpatient hypoglycemia is associated with short‐term and long‐term adverse outcomes.22, 23 The incidence of severe hypoglycemia (<40 mg/dL) with intensified glycemic control has ranged between 9.8% and 19%7, 15 vs. <5% in conventional treatment. In the present study, 35% of patients experienced a BG <70 mg/dL, 22% had a BG <60 mg/dL, and 5% of patients had a BG <40 mg/dL. The lower rate of hypoglycemic events with the use of CII in the non‐ICU setting observed in this study is likely the result of a more relaxed glycemic target of 80 to 150 mg/dL for the majority of subjects, as well as fewer severe comorbidities compared to patients in the ICU, where the presence of sepsis or hepatic, adrenal, or renal failure increase the risk of hypoglycemia.2224
Multivariate analyses adjusted for age, gender, race, BMI, renal function, steroid use, history of diabetes, and number of BG tests showed that nutrition status during CII was an important factor associated with increased frequency of hyperglycemic and hypoglycemic events. Compared to subjects maintained NPO, subjects who received oral intake while on CII had a significantly increased rate of hyperglycemic and hypoglycemic events. The increased risk of hypoglycemia for those allowed to eat is expected as the protocol would mandate an increase in the CII rate in response to the prandial BG increase but does not make provisions for BG assessments or CII adjustments in relationship to the meal. These results indicate that in stable patients who are ready to start eating, CII should be stopped and transitioned to SC insulin regimen. In patients who may benefit from the continued use of CII (eg, patients requiring multistep procedures/surgeries), treatment with CII could be continued with supplemental mealtime insulin (intravenous [IV] or SC).
CII may be useful in cases of patients with persistent hyperglycemia despite scheduled SC insulin regimen; in patients where rapid glycemic control may be warranted in order to decrease the risk of increased inflammation and vascular dysfunction in acute coronary syndromes; and to enhance wound healing status post surgical procedures. Other clinical scenarios in which CII may be preferred and no ICU bed is required include cases of new‐onset diabetes with significant hyperglycemia (BG >300 mg/dL), type 1 diabetes poorly controlled with SC insulin, uncontrolled gestational diabetes, parenteral nutrition use, perioperative states, or the use of high‐dose steroids or chemotherapy.
Our findings are limited by the retrospective nature of our study and the evaluation of patients in a single university medical center. Selection bias should be considered in the interpretation of the results since each index case was selected by the attending physician to be treated with CII as opposed to another regimen for inpatient glycemic control. The selection bias, however, may be limited by the fact that the subjects in this study placed on CII seemed to be similar to those in the general hospital population. A previous pilot study from a different academic institution, however, reported that implementing CII protocols in non‐ICU patients is safe and improved glycemic control without increasing hypoglycemia.25 In addition, because most subjects in this study had a history of diabetes prior to admission, these results may not be generalizable to populations with stress‐induced hyperglycemia.
In summary, our study indicates that a CII regimen is an effective option for the management of patients with persistent hyperglycemia in the non‐critical care setting. Most patients achieved and remained within targeted BG levels during CII. The overall rate of hypoglycemic events was similar to that reported in recent randomized clinical trials in the ICU and with SC insulin therapy. The frequency of hypoglycemic and hyperglycemic events was significantly increased in patients allowed to eat during CII suggesting that CII should be stopped and patients should be transitioned to an SC insulin regimen once oral intake is initiated. Future prospective, randomized studies are needed to compare the efficacy and safety of CII protocols to SC insulin protocols in the management of patients with persistent hyperglycemia in the non‐ICU setting.
- ,,,,,.Hyperglycemia: an independent marker of in‐hospital mortality in patients with undiagnosed diabetes.J Clin Endocrinol Metab.2002;87(3):978–982.
- ,,, et al.Outcome benefit of intensive insulin therapy in the critically ill: insulin dose versus glycemic control.Crit Care Med.2003;31(2):359–366.
- ,,, et al.Early postoperative glucose control predicts nosocomial infection rate in diabetic patients.JPEN J Parenter Enteral Nutr.1998;22(2):77–81.
- ,,, et al.Randomized trial of insulin‐glucose infusion followed by subcutaneous insulin treatment in diabetic patients with acute myocardial infarction (DIGAMI study): effects on mortality at 1 year.J Am Coll Cardiol.1995;26(1):57–65.
- ,,,.Glucose control and mortality in critically ill patients.JAMA.2003;290(15):2041–2047.
- ,,, et al.Management of diabetes and hyperglycemia in hospitals.Diabetes Care.2004;27(2):553–597.
- ,,, et al.Intensive insulin therapy in the medical ICU.N Engl J Med.2006;354(5):449–461.
- ,,, et al.Intensive insulin therapy in the critically ill patients.N Engl J Med.2001;345(19):1359–1367.
- ,,, et al.Continuous insulin infusion reduces mortality in patients with diabetes undergoing coronary artery bypass grafting.J Thorac Cardiovasc Surg.2003;125(5):1007–1021.
- ,.Cost analysis of intensive glycemic control in critically ill adult patients.Chest.2006;129(3):644–650.
- ,,, et al.Intensive versus conventional glucose control in critically ill patients.N Engl J Med.2009;360(13):1283–1297.
- ,,, et al.Implementation of a safe and effective insulin infusion protocol in a medical intensive care unit.Diabetes Care.2004;27(2):461–467.
- ,,.Glycemic control and sliding scale insulin use in medical inpatients with diabetes mellitus.Arch Intern Med.1997;157(5):545–552.
- .Diabetes Dek Professional Edition.Eatonton, GA:American Diabetes Association;1993.
- ,,, et al.Intensive insulin therapy and pentastarch resuscitation in severe sepsis.N Engl J Med.2008;358(2):125–139.
- ,,, et al.Intensive insulin therapy and mortality among critically ill patients: a meta‐analysis including NICE‐SUGAR study data.CMAJ.2009;180(8):799–800.
- ,,, et al.Randomized study of basal‐bolus insulin therapy in the inpatient management of patients with type 2 diabetes (RABBIT 2 trial).Diabetes Care.2007;30(9):2181–2186.
- ,,, et al.Comparison of inpatient insulin regimens with detemir plus aspart versus neutral protamine hagedorn plus regular in medical patients with type 2 diabetes.J Clin Endocrinol Metab.2009;94(2):564–569.
- ,,, et al.Strict glycaemic control in patients hospitalised in a mixed medical and surgical intensive care unit: a randomised clinical trial.Crit Care.2008;12(5):R120.
- ,,, et al.Hyperglycemia and acute coronary syndrome: a scientific statement from the American Heart Association Diabetes Committee of the Council on Nutrition, Physical Activity, and Metabolism.Circulation.2008;117(12):1610–1619.
- ,,, et al.American Association of Clinical Endocrinologists/American Diabetes Association: Consensus Statement on Inpatient Glycemic Control.Endocr Pract.2009;15(4):353–369.
- .Blood glucose and its prognostic implications in patients hospitalised with acute myocardial infarction.Diab Vasc Dis Res.2008;5(4):269–275.
- ,.Severe hypoglycemia in critically ill patients: risk factors and outcomes.Crit Care Med.2007;35(10):2262–2267.
- ,,, et al.Evaluation of short‐term consequences of hypoglycemia in an intensive care unit.Crit Care Med.2006;34(11):2714–2718.
- ,,,.New insulin infusion protocol Improves blood glucose control in hospitalized patients without increasing hypoglycemia.Jt Comm J Qual Patient Saf.2005;31(3):141–147.
- ,,,,,.Hyperglycemia: an independent marker of in‐hospital mortality in patients with undiagnosed diabetes.J Clin Endocrinol Metab.2002;87(3):978–982.
- ,,, et al.Outcome benefit of intensive insulin therapy in the critically ill: insulin dose versus glycemic control.Crit Care Med.2003;31(2):359–366.
- ,,, et al.Early postoperative glucose control predicts nosocomial infection rate in diabetic patients.JPEN J Parenter Enteral Nutr.1998;22(2):77–81.
- ,,, et al.Randomized trial of insulin‐glucose infusion followed by subcutaneous insulin treatment in diabetic patients with acute myocardial infarction (DIGAMI study): effects on mortality at 1 year.J Am Coll Cardiol.1995;26(1):57–65.
- ,,,.Glucose control and mortality in critically ill patients.JAMA.2003;290(15):2041–2047.
- ,,, et al.Management of diabetes and hyperglycemia in hospitals.Diabetes Care.2004;27(2):553–597.
- ,,, et al.Intensive insulin therapy in the medical ICU.N Engl J Med.2006;354(5):449–461.
- ,,, et al.Intensive insulin therapy in the critically ill patients.N Engl J Med.2001;345(19):1359–1367.
- ,,, et al.Continuous insulin infusion reduces mortality in patients with diabetes undergoing coronary artery bypass grafting.J Thorac Cardiovasc Surg.2003;125(5):1007–1021.
- ,.Cost analysis of intensive glycemic control in critically ill adult patients.Chest.2006;129(3):644–650.
- ,,, et al.Intensive versus conventional glucose control in critically ill patients.N Engl J Med.2009;360(13):1283–1297.
- ,,, et al.Implementation of a safe and effective insulin infusion protocol in a medical intensive care unit.Diabetes Care.2004;27(2):461–467.
- ,,.Glycemic control and sliding scale insulin use in medical inpatients with diabetes mellitus.Arch Intern Med.1997;157(5):545–552.
- .Diabetes Dek Professional Edition.Eatonton, GA:American Diabetes Association;1993.
- ,,, et al.Intensive insulin therapy and pentastarch resuscitation in severe sepsis.N Engl J Med.2008;358(2):125–139.
- ,,, et al.Intensive insulin therapy and mortality among critically ill patients: a meta‐analysis including NICE‐SUGAR study data.CMAJ.2009;180(8):799–800.
- ,,, et al.Randomized study of basal‐bolus insulin therapy in the inpatient management of patients with type 2 diabetes (RABBIT 2 trial).Diabetes Care.2007;30(9):2181–2186.
- ,,, et al.Comparison of inpatient insulin regimens with detemir plus aspart versus neutral protamine hagedorn plus regular in medical patients with type 2 diabetes.J Clin Endocrinol Metab.2009;94(2):564–569.
- ,,, et al.Strict glycaemic control in patients hospitalised in a mixed medical and surgical intensive care unit: a randomised clinical trial.Crit Care.2008;12(5):R120.
- ,,, et al.Hyperglycemia and acute coronary syndrome: a scientific statement from the American Heart Association Diabetes Committee of the Council on Nutrition, Physical Activity, and Metabolism.Circulation.2008;117(12):1610–1619.
- ,,, et al.American Association of Clinical Endocrinologists/American Diabetes Association: Consensus Statement on Inpatient Glycemic Control.Endocr Pract.2009;15(4):353–369.
- .Blood glucose and its prognostic implications in patients hospitalised with acute myocardial infarction.Diab Vasc Dis Res.2008;5(4):269–275.
- ,.Severe hypoglycemia in critically ill patients: risk factors and outcomes.Crit Care Med.2007;35(10):2262–2267.
- ,,, et al.Evaluation of short‐term consequences of hypoglycemia in an intensive care unit.Crit Care Med.2006;34(11):2714–2718.
- ,,,.New insulin infusion protocol Improves blood glucose control in hospitalized patients without increasing hypoglycemia.Jt Comm J Qual Patient Saf.2005;31(3):141–147.
Copyright © 2010 Society of Hospital Medicine
Combination Therapy and Surgery Mortality
Vascular surgery is the most morbid of the noncardiac surgeries, with a 30‐day mortality estimated to be 3% to 10% and 6‐month mortality estimated to be 10% to 30%.14 Adverse outcomes are highly correlated with the presence of perioperative ischemia and infarction. Perioperative ischemia is associated with a 9‐fold increase in the odds of unstable angina, nonfatal myocardial infarction, and cardiac death, while a perioperative myocardial infarction increases the odds of death 20‐fold up to 2 years after surgery.57 Prior research has centered on the single or combination use of perioperative beta‐blockers and statins, which has been associated with decreased short‐term and long‐term mortality after vascular surgery,814 with the exceptions of the Metoprolol After Vascular Surgery (MAVS)15 and the Perioperative Beta‐Blockade (POBBLE) studies,16 which were negative beta‐blocker randomized controlled trials exclusively in vascular surgery patients, and the Perioperative Ischemic Evaluation (POISE) study,17 which was the largest perioperative beta‐blocker trial to date in noncardiac surgery, with 41% of the patients undergoing vascular surgery.
There have been few studies assessing clinical outcomes in patients taking multiple concurrent cardioprotective medications. Clinicians are challenged to apply research results to their patients, who generally take multiple drugs. A retrospective cohort study of acute coronary syndrome patients did assess the use of evidence‐based, combination therapies, including aspirin, ACE inhibitors, beta‐blockers, and statins, compared to the use of none of these agents and found an association with decreased 6‐month mortality.18 There are no prior noncardiac surgery studies assessing the concurrent use of multiple possibly cardioprotective drugs. There is 1 cohort study of coronary artery bypass graft surgery patients that assessed aspirin, ACE inhibitor, beta‐blocker, and statin use and found associations with decreased mortality.19 As preoperative coronary revascularization has not been found to produce improved survival after vascular surgery, clarifying which perioperative medicines alone or in combination may improve outcomes becomes even more important.20 We sought to ascertain if the use of concurrent combination aspirin, ACE inhibitors, beta‐blockers, and statins compared to nonuse was associated with a decrease in 6‐month mortality after vascular surgery.
Patients and Methods
Setting and Subjects
All patients presenting for vascular surgery at 5 regional Department of Veterans Affairs (VA) medical centers between January 1998 and March 2005 (3062 patients) were eligible for study entry. Patients with less than 6 months follow‐up were excluded (42 patients). The study included the remaining 3020 patients (comprising 99% of the original population). Our methods have been previously described.8 In brief, we conducted a retrospective cohort study using a regional VA administrative and relational database containing information on both the outpatient and inpatient environments. A record is generated for every contact a patient makes with the VA healthcare system, including prescription medications, laboratory values, demographic information, International Classification of Diseases, 9th Revision (ICD‐9) codes, and vital status. In addition, we used the national VA death index, the VA Beneficiary Identification and Records Locator Subsystem database, which includes Social Security Administration data, to assess vital status. A patient was considered to have a drug exposure (aspirin, ACE inhibitor, beta‐blocker, or statin) if the patient filled or renewed a prescription for the drug within 30 days before surgery. It was determined how many of these drugs were taken during this period, and in which combinations. The Institutional Review Board (IRB) at the Portland VA Medical Center approved the study with a waiver of informed consent.
Data Elements
For every patient we noted the type of vascular surgery (carotid, aortic, lower extremity bypass, or lower extremity amputation), age, sex, comorbid conditions (hypertension, cerebrovascular disease, cancer, diabetes, hyperlipidemia, chronic obstructive pulmonary disease [COPD], chronic kidney disease [CKD], coronary artery disease [CAD], or heart failure), nutritional status (serum albumin), and other medication use (also defined as filling a prescription within 30 days before surgery [insulin and clonidine]). Insulin use was documented to calculate the revised cardiac risk index (RCRI),21 and clonidine was documented to account for as a confounder.22 The RCRI was assigned to each patient. One point was given for each of the following risk factors: use of insulin, CAD, heart failure, cerebrovascular disease, CKD, and high‐risk surgery (intrathoracic, intraperitoneal, or suprainguinal vascular procedures). These variables were defined by ICD‐9 codes. CKD was defined as either an ICD‐9 code for CKD or a serum creatinine >2 mg/dL. Patients were identified by the index vascular surgery using ICD‐9 codes in the VA database, and data were extracted from both the inpatient and outpatient environments.
Statistical Analysis
Patients were included in the analysis if they either died within 6 months or were followed for at least 6 months. Data management and analyses were performed using SAS software, version 9.0. We conducted the univariate analysis of 6‐month mortality using chi‐square analysis and provided unadjusted relative risk estimates for demographic and clinical variables. Demographic variables included age, sex, year, and site of surgery. Clinical variables included preoperative use of insulin and clonidine, preoperative medical conditions, serum albumin, creatinine, RCRI score, and type of surgery.
Bias due to confounding is a problem for studies that cannot randomize subjects into treatment groups. This bias can often be reduced by adjusting for the potentially confounding variables as covariates in regression models. However, when the number of potential confounders is large, as it was in our study, and the number of events, ie, deaths, is small, the resulting regression model can be unstable and the estimates unreliable.23, 24 In such cases, it is necessary to control for confounding using another method. We chose to use propensity scoring and stratification analyses since these methods enable controlling for a large number of covariates using a single variable.
The study drugs were: aspirin, beta‐blockers, statins, and ACE inhibitors. There are 16 combinations with 120 pairwise statistical comparisons possible for these 4 drug exposures. Instead of these multiple comparisons, we chose 4 classifications of combination drug exposure to examine: all 4 drugs compared to none, 3 drugs compared to none, 2 drugs compared to none, and 1 drug compared to none. Four different propensity scores were generated since we studied 4 different drug exposure classes. For each drug exposure class, propensity analyses were performed by using logistic regression to predict the likelihood of use of the drug of interest using all potential demographic and clinical confounding variables. Each subject received a score corresponding to the probability of their having a drug exposure based on the covariates. Scores were divided into quintiles, and these quintiles were used for stratification in Cochran‐Mantel‐Haenszel analyses. Thus, we were able to test the association of patient survival to 6 months with the category of drug exposure comparisons within 30 days before surgery, while controlling for all aforementioned potential confounders. Results of the Breslow‐Day test for homogeneity indicated that no statistically significant differences existed between the results of the propensity quintiles, so the overall summary statistic was reported. All quintiles achieved a balance in the covariates. However, for the 4 study drug exposure class, there were no deaths for the first (n = 173) and second (n = 176) quintiles (corresponding to lower‐risk patients). We therefore excluded these patients from the final analysis.
Variables used in propensity scores included: age, sex, preoperative medical conditions, preoperative clonidine use, nutritional status (serum albumin), RCRI score, and year and location of surgery. To determine whether the propensity score adjustment removed imbalance among the comparisons of the combination drug classes to the no‐drug‐exposure patients, we evaluated associations between each classification of study drug exposure and predictor variables as compared to no‐drug‐exposure patients with both unadjusted chi‐square and propensity‐adjusted Cochran‐Mantel‐Haenszel analyses.
Results
Patient Characteristics
There were 3020 patients with a median age of 67 years, and interquartile range of 59 to 75 years. Ninety‐nine percent were male, and all patients were assessed for death at 6 months after surgery (Table 1). Ten percent (304) had combination all‐4‐drug exposure, 22% (652) had 3‐drug exposure, 24% (736) had 2‐drug exposure, 26% (783) had 1‐drug exposure, and 18% (545) had no study drug exposures. Eight percent (229) of surgeries were aortic, 28% (861) were carotid, 28% (852) were lower extremity amputation, and 36% (1078) were lower extremity bypass. Twenty‐two percent (665) of patients were low risk, with a RCRI of 0, 60% (1822) were moderate risk with a RCRI of 1 to 2, and 18% (553) were high risk with a RCRI of 3. Overall the 6‐month mortality was 9.7% (294). The 6‐month mortality for carotid endarterectomy was 5.0% (43/861), for lower extremity bypass 7.6% (82/1078), for aorta repair 9.2% (21/229), and for lower extremity amputation 17.4% (148/852).
| Variable | Level | N (%) Overall N = 3020 | Relative Risk (95% CI) | Chi Square P‐Value |
|---|---|---|---|---|
| ||||
| Age: year, median (IQR) | 67 (59, 75) | 1.04 (1.031.06) | <0.001* | |
| Sex | Female | 44 (1.5) | 1 | 0.490 |
| Male | 2976 (98.5) | 1.48 (0.464.81) | ||
| Preoperative medical conditions | HTN | 2388 (79.1) | 1.40 (0.011.93) | 0.036 |
| DM | 1455 (48.2) | 1.45 (1.131.84) | 0.003 | |
| COPD | 912 (30.2) | 1.71 (1.342.19) | <0.001 | |
| CA | 674 (22.3) | 1.42 (1.091.86) | 0.012 | |
| CKD | 344 (11.4) | 2.04 (1.492.80) | <0.001 | |
| CAD | 1479 (49.0) | 1.51 (1.181.92) | 0.001 | |
| CHF | 911 (30.2) | 2.41 (1.893.08) | <0.001 | |
| CVA/TIA | 802 (26.6) | 1.08 (0.821.41) | 0.587 | |
| Lipid | 865 (28.6) | 0.81 (0.611.06) | 0.123 | |
| Blood chemistry | Creatinine > 2 | 228 (7.5) | 3.11 (2.224.36) | <0.001 |
| Albumin 3.5 | 629 (20.8) | 3.60 (2.804.62) | <0.001 | |
| Medication use | Aspirin | 1773 (58.7) | 1.12 (0.881.44) | 0.355 |
| ACE, inhibitor | 1238 (41.0) | 0.81 (0.631.04) | 0.090 | |
| Statin | 1214 (40.2) | 0.66 (0.510.86) | 0.001 | |
| Beta blocker | 1202 (39.8) | 0.76 (0.590.98) | 0.031 | |
| Clonidine | 115 (3.8) | 1.65 (0.972.80) | 0.080 | |
| Insulin | 474 (15.7) | 1.47 (1.091.98) | 0.013 | |
| Number of study drugs used | None | 545 (18.0) | 1 | 0.018 |
| One of 4 | 783 (25.9) | 1.06 (0.751.51) | ||
| Two of 4 | 736 (24.4) | 0.94 (0.651.35) | ||
| Three of 4 | 652 (21.6) | 0.73 (0.491.08) | ||
| All four | 304 (10.1) | 0.66 (0.391.09) | ||
| Type of surgery | Carotid | 861 (28.5) | 1 | <0.001 |
| Bypass | 1078 (35.7) | 1.57 (1.072.29) | ||
| Aorta | 229 (7.6) | 1.92 (1.123.31) | ||
| Amputation | 852 (28.2) | 4.00 (2.815.70) | ||
| RCRI category | 0 | 665 (22.0) | 1 | <0.001 |
| 1 | 976 (32.3) | 1.12 (0.761.66) | ||
| 2 | 846 (28.0) | 1.66 (1.142.42) | ||
| 3 | 553 (17.6) | 2.83 (1.934.14) | ||
| Surgery year | 1998 | 539 (17.8) | 1 | 0.804 |
| 1999 | 463 (15.3) | 1.36 (0.892.07) | ||
| 2000 | 418 (13.8) | 1.07 (0.681.68) | ||
| 2001 | 407 (13.5) | 1.23 (0.791.92) | ||
| 2002 | 368 (12.2) | 1.34 (0.962.10) | ||
| 2003 | 371 (12.3) | 1.25 (0.801.97) | ||
| 2004 | 395 (13.1) | 1.17 (0.741.84) | ||
| 2005 | 59 (2.0) | 0.80 (0.282.30) | ||
The most common single‐drug exposure was aspirin, 14% (416), followed by ACE inhibitors, 5% (163) (Table 2). The more common 2‐drug exposures included ACE inhibitors and aspirin, 7% (203), aspirin and beta‐blockers, 5% (161), and aspirin and statins, 5% (141). The common 3‐drug combinations included aspirin, beta‐blockers, and statins, 8% (229); ACE inhibitors, aspirin, and statins, 6% (167); and ACE inhibitors, aspirin, and beta‐blockers, 5% (152). ACE inhibitor exposure was common in all combinations, eg, 20.8% of the 1‐drug group had exposure to an ACE inhibitor, 40.5% in the 2‐drug group, 64.9% in the 3‐drug group, and all patients in the 4‐drug group. Overall, 39.3% of patients in the study had ACE inhibitor exposure. The gross unadjusted mortality for each drug exposure group was 10.6% for the no drug group, 11.2% for the 1‐drug group, 10.1% for the 2‐drug group, 8% for the 3‐drug group, and 7.2% for the 4‐drug group.
| Drugs Used | Presurgery | 6 Months Postsurgery | ||
|---|---|---|---|---|
| Frequency | % | Frequency | % | |
| ||||
| None | 545 | 18.1 | 669 | 24.5 |
| 1 Drug | ||||
| Aspirin | 416 | 53.1 | 169 | 28.3 |
| ACE inhibitor | 163 | 20.8 | 135 | 22.6 |
| Beta‐blocker | 110 | 14.1 | 163 | 27.2 |
| Statin | 94 | 12.0 | 131 | 21.9 |
| All 1 drug | 783 | 100.0 | 598 | 100.0 |
| 2 Drugs | ||||
| Aspirin + ACE inhibitor | 203 | 27.6 | 102 | 14.4 |
| Aspirin + Beta‐blocker | 161 | 21.8 | 117 | 16.5 |
| Aspirin + Statin | 141 | 19.2 | 86 | 12.1 |
| ACE inhibitor + Beta‐blocker | 56 | 7.6 | 103 | 14.5 |
| ACE inhibitor + Statin | 89 | 12.1 | 126 | 17.7 |
| Beta‐blocker + Statin | 86 | 11.7 | 176 | 24.8 |
| All 2 drugs | 36 | 100.0 | 710 | 100.0 |
| 3 Drugs | ||||
| Aspirin + ACE inhibitor + Beta‐blocker | 152 | 23.3 | 96 | 16.5 |
| Aspirin + ACE inhibitor + Statin | 167 | 25.6 | 103 | 17.7 |
| Aspirin + Beta‐ blocker + Statin | 229 | 35.1 | 165 | 28.4 |
| ACE inhibitor + Beta‐blocker Statin | 104 | 16.0 | 218 | 37.4 |
| All 3 drugs | 652 | 100.0 | 582 | 100.0 |
| All 4 drugs | 304 | 10.1 | 167 | 6.1 |
| Total | 3020 | 100.0 | 2726* | 100.0 |
During the 6 complete years of the study (1998‐2004) the frequency of combination exposure for all 4 study drugs increased from 3.5% to 13.4%; 3‐drug exposure also increased, 14.7% to 27.8%; 2‐drug exposure remained relatively stable, 24.5% to 22%; and single‐drug exposure declined, 24.9% to 12.7% (Figure 1). Individual study drug exposures over the 6 years of the study generally also increased with respect to the other combinations: ACE inhibitor use increased, 34.5% to 42.5%; beta‐blocker, 27.8% to 53.4%; statin, 22.6% to 52.2%. The exception was aspirin, which was relatively stable, 54.5% in 1998, and 57.2% in 2004 (Figure 2).
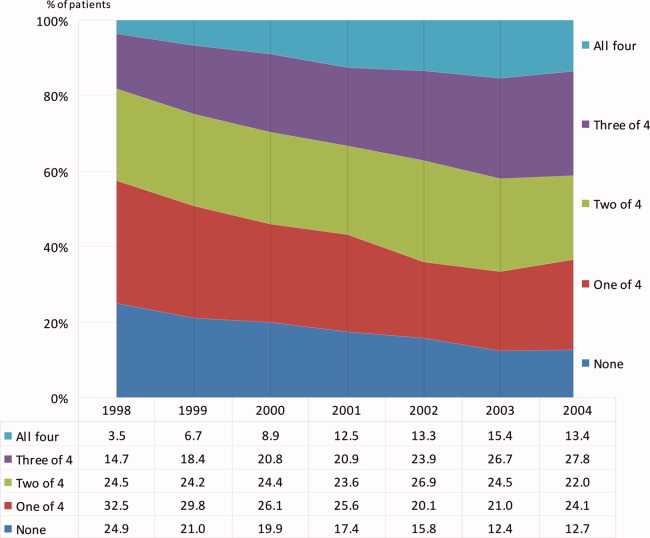
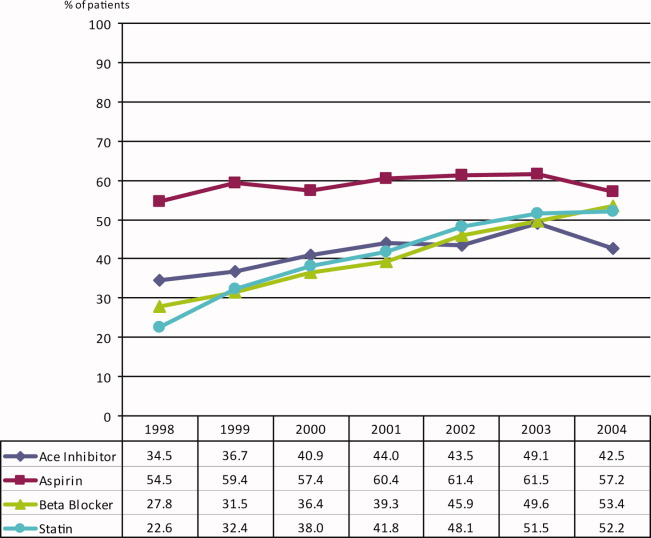
We also compared the use of the study drug exposures at 6 months after surgery to use within 30 days before surgery (Table 2). In the VA healthcare system aspirin is cheaper for some patients to purchase over‐the‐counter. Aspirin is likely underestimated in this dataset. The frequency of follow‐up drug exposure at 6 months was overall similar to the drug exposure within 30 days before surgery. When aspirin was 1 of the combination exposures, the frequencies declined, and when aspirin was not 1 of the exposures, the frequencies generally increased. The frequency of no‐drug exposures increased from 18.1% before surgery to 24.5% 6 months after surgery, and the frequency of all 4 drug exposures decreased from 10.1% to 6.1%, respectively.
Univariate Analysis
There were statistically significant differences in 6‐month mortality for the combination drug exposure classes compared to no‐drug exposure; P value for linear trend = 0.018 (Table 1).
Propensity‐adjusted Analysis
Patients categorized in each combination drug exposure group were significantly different in their demographic and clinical characteristics compared to the no‐drug exposure patients using unadjusted chi‐square P values (Appendix Table 1). However, after the propensity adjustments, only hyperlipidemia was statistically different for the combination 4‐drug exposure patients compared to no‐drug exposure patients (Appendix Table 1). All other demographic and clinical characteristics for the comparison of the drug exposure classes to no‐drug exposure patients had statistically nonsignificant propensity‐adjusted P values. The range of propensity score distribution was fairly comparable for each combination drug exposure group. The Breslow‐Day test for homogeneity was not significant among the quintiles for any of the drug exposure classes (Table 3; Appendix Table 2), indicating that there was not a statistically significant difference in stratum‐specific relative risks between the different quintiles. Therefore, the summary adjusted result was reported for each drug exposure group. Patients with all 4 drug exposures (with the first [n = 173] and second [n = 166] quintiles excluded due to zero deaths) compared to no‐drug exposure patients had a marginally significant association with decreased mortality, overall propensity‐adjusted relative risk (aRR) 0.52 (95% confidence interval [CI], 0.26‐1.01; P = 0.052), number needed to treat (NNT) 19; patients with the combination 3‐drug exposure had a significant association with decreased mortality, aRR 0.60 (95% CI, 0.38‐0.95; P = 0.030), NNT 38; as well as patients with combination 2‐drug exposure, aRR 0.68 (95% CI, 0.46‐0.99; P = 0.043), NNT 170 (Table 3). Patients with 1 drug exposure did not have an association with decreased mortality compared to no‐drug exposure patients, aRR 0.88 (95% CI, 0.63‐1.22; P = 0.445).
| Variable | N (Overall N = 3020) | 6 Mo. Mortality | P Value* | Adjusted Relative Risk (95% CI) of Death* | NNT | |||
|---|---|---|---|---|---|---|---|---|
| Nonuser | User | |||||||
| % | (n/N) | % | (n/N) | |||||
| ||||||||
| 1 Drug vs. no drugs | 1328 | 10.64 | (58/545) | 11.24 | (88/783) | 0.445 | 0.88 (0.631.22) | |
| 2 Drugs vs. no drugs | 1281 | 10.64 | (58/545) | 10.05 | (74/736) | 0.043 | 0.68 (0.460.99) | 170 |
| 3 Drugs vs. no drugs | 1197 | 10.64 | (58/545) | 7.98 | (52/652) | 0.030 | 0.60 (0.380.95) | 38 |
| 4 Drugs vs. no drugs | 510 | 12.56 | (26/207) | 7.26 | (22/303) | 0.052 | 0.52 (0.261.01) | 19 |
Discussion
This retrospective cohort study has demonstrated that the combination use of 4 drugs (aspirin, beta‐blockers, statins, and ACE inhibitors) compared to the use of none of these drugs had a trend toward decreased mortality, with a 49% decrease in propensity‐adjusted 6‐month mortality after vascular surgery and an NNT of 19. In addition, the combination use of 3 drug exposures was significantly associated with a 40% decrease in mortality, with propensity adjustment and NNT of 38; and the 2‐drug combination exposure showed a significant association, with a propensity‐adjusted 32% decreased mortality, and an NNT of 170. Both the unadjusted and adjusted analyses showed a linear trend, suggesting a dose‐response effect of more study‐drug exposure association with less 6‐month mortality and smaller NNT.
The lack of statistical significance for the 4‐drug exposure group is likely due to few patients and events in this group, and the exclusion of the first 2 quintiles (n = 339) due to having zero deaths with which to compare. It is not unusual to exclude patients from analyses in propensity methods. The patients we excluded were low‐risk who had survived to 6‐months after surgery, so they would have also been excluded in a propensity‐matched analysis. We did not perform propensity matching, as we had adequate homogeneity between our quintile strata, and were not powered to perform matching.
This is the first evidence of which we are aware of an association with decreased mortality for the combination perioperative use of aspirin, beta‐blockers, statins, and ACE inhibitors in vascular surgery patients. Aspirin has been associated with decreased mortality in patients undergoing coronary artery bypass graft surgery,25 but the effects of aspirin on noncardiac surgery outcomes is less clear.26
Beta‐blockers and statins have been associated with decreased short‐term and long‐term mortality after vascular surgery in the past,814 but more recent beta‐blocker studies have been negative, introducing controversy for the topic.1517, 27 Beta‐blockers are currently recommended as: Class I (should be used), Evidence Level B (limited population risk strata evaluated) for vascular surgery patients already taking a beta‐blocker or with positive ischemia on stress testing; Class IIa (reasonable to use), Evidence Level B for 1 or more clinical risk factors; or Class IIb (may be considered), Evidence Level B for no clinical risk factors, in the 2007 American College of Cardiology/American Heart Association (ACC/AHA) guidelines for perioperative evaluation.28 Perioperative beta‐blocker trials that have titrated the dose to a goal heart rate have consistently been associated with improved outcomes after vascular surgery,10, 12, 29, 30 and perioperative beta‐blocker trials that have used fixed dosing after surgery have been negative,1517, 27 including the POISE trial, which was associated with increased strokes and mortality.
This is also the first evidence of which we are aware that ACE inhibitors in combination with other drugs may be associated with decreased mortality after vascular surgery. While our study design does not support a causal relationship between ACE inhibitor exposure and decreased mortality, the increasing exposure in each drug exposure group for ACE inhibitors and correlated decreasing mortality is of sufficient interest to warrant further study. The use of ACE inhibitors has been associated with decreased mortality in patients with atherosclerotic vascular disease and CAD.31 There has been a concern expressed in the literature about the perioperative use of ACE inhibitors due to the potential for intraoperative hypotension.3236 Many centers advise patients to discontinue ACE inhibitor use the day before surgery. The number of patients studied remains small. More research is needed to clarify this issue. Use of angiotensin‐receptor blockers was not assessed; their use was considered to be rare, because use was restricted to patients intolerant of ACE inhibitors during the study period.
The 2005 ACC/AHA guideline for patients with peripheral arterial disease recommends the use of aspirin and statins.37 ACE inhibitors are recommended for both asymptomatic and symptomatic peripheral artery disease patients. The 2006 ACC/AHA guidelines for secondary prevention for patients with coronary or other atherosclerotic vascular disease recommends the use of chronic beta‐blockers.38 There appears to be some benefit in mortality from the combination aspirin, beta‐blocker, statin, and ACE inhibitor drug regimen in patients with established atherosclerotic vascular disease.
We expect the frequency of aspirin exposure to be underestimated in this study population (due to over‐the‐counter undocumented use), so our findings may be somewhat underestimated as well. This may also explain why the frequency of aspirin remained constant over time while the other drug exposures increased over time.
Our study has several limitations. First, our design was a retrospective cohort. Propensity analysis attempts to correct for confounding by indication in nonrandomized studies as patients that are exposed to a study drug are different from patients that are not exposed to the same study drug. For example, without adjustment for the propensity scores, the drug exposure classes were significantly associated with demographic and clinical characteristics when compare to the no‐drug‐exposure patients. However, with the propensity score adjustment, these associations were no longer statistically significant, with the exception of hyperlipidemia in patients taking all 4 drugs, which supports a rigorous propensity adjustment. We also controlled for the use of clonidine and serum albumin, both strong predictors of death after noncardiac surgery.22, 39 Second, we utilized administrative ICD‐9 code data for abstraction, and utilized only documented and coded comorbidities in the VA database. Unmeasured confounders may exist. Further, we cannot identify which combinations of specific study drugs were most associated with a reduction in 6‐month mortality, but we believe our data supports the case that all 4 of the study drugs be considered for each patient undergoing vascular surgery. It is important to also note that patient baseline risk, which can be difficult to clarify in retrospective cohort studies, will have a large impact on the results of the NNT. Lastly, this study needs to be repeated in a population that includes a greater number of female participants.
The combination exposure of 2 to 3 study drugs: aspirin, beta‐blockers, statins, and ACE inhibitors was consistently associated with decreased 6‐month mortality after vascular surgery, with a high prevalence of ACE inhibitor use, and the combination exposure of all 4 study drugs was marginally associated with decreased mortality. Consideration for the individual patient undergoing vascular surgery should include whether or not the patient may benefit from these 4 drugs. Further research with prospective and randomized studies is needed to clarify the optimum timing of these drugs and their combination efficacy in vascular surgery patients with attention to patient‐specific risk.
Acknowledgements
The authors thank Martha S. Gerrity, MD, PhD, Portland VA Medical Center, Portland, Oregon, for comments on an earlier version of the manuscript.
- ,,, et al.Postoperative and late survival outcomes after major amputation: findings from the Department of Veterans Affairs National Surgical Quality Improvement Program.Surgery.2001;130(1):21–29.
- ,,,.Perioperative‐ and long‐term mortality rates after major vascular surgery: the relationship to preoperative testing in the Medicare population.Anesth Analg.1999;89(4):849–855.
- ,,, et al.Women have increased risk of perioperative myocardial infarction and higher long‐term mortality rates after lower extremity arterial bypass grafting.J Vasc Surg.1999;29(5):807–812; discussion 12‐13.
- ,,,,,.The influence of perioperative myocardial infarction on long‐term prognosis following elective vascular surgery.Chest.1998;113(3):681–686.
- ,,,,,.Association of perioperative myocardial ischemia with cardiac morbidity and mortality in men undergoing noncardiac surgery. The Study of Perioperative Ischemia Research Group.N Engl J Med.1990;323(26):1781–1788.
- ,,, et al.Perioperative myocardial ischemia in patients undergoing noncardiac surgeryI: Incidence and severity during the 4 day perioperative period. The Study of Perioperative Ischemia (SPI) Research Group.J Am Coll Cardiol.1991;17(4):843–850.
- ,,,,.Perioperative myocardial ischemia in patients undergoing noncardiac surgeryII: Incidence and severity during the 1st week after surgery. The Study of Perioperative Ischemia (SPI) Research Group.J Am Coll Cardiol.1991;17(4):851–857.
- ,,.Association of ambulatory use of statins and beta‐blockers with long‐term mortality after vascular surgery.J Hosp Med.2007;2(4):241–252.
- ,,, et al.Reduction in cardiovascular events after vascular surgery with atorvastatin: a randomized trial.J Vasc Surg.2004;39(5):967–975; discussion 75‐76.
- ,,,.Effect of atenolol on mortality and cardiovascular morbidity after noncardiac surgery. Multicenter Study of Perioperative Ischemia Research Group.N Engl J Med.1996;335(23):1713–1720.
- ,,, et al.Statins are associated with a reduced incidence of perioperative mortality in patients undergoing major noncardiac vascular surgery.Circulation.2003;107(14):1848–1851.
- ,,, et al.The effect of bisoprolol on perioperative mortality and myocardial infarction in high‐risk patients undergoing vascular surgery. Dutch Echocardiographic Cardiac Risk Evaluation Applying Stress Echocardiography Study Group.N Engl J Med.1999;341(24):1789–1794.
- ,,, et al.Prophylactic atenolol reduces postoperative myocardial ischemia. McSPI Research Group.Anesthesiology.1998;88(1):7–17.
- ,,,,,.The effect of preoperative statin therapy on cardiovascular outcomes in patients undergoing infrainguinal vascular surgery.Int J Cardiol.2005;104(3):264–268.
- ,,,,.The effects of perioperative beta‐blockade: results of the Metoprolol after Vascular Surgery (MaVS) study, a randomized controlled trial.Am Heart J.2006;152(5):983–990.
- ,,,,.Perioperative beta‐blockade (POBBLE) for patients undergoing infrarenal vascular surgery: results of a randomized double‐blind controlled trial.J Vasc Surg.2005;41(4):602–609.
- ,,, et al.Effects of extended‐release metoprolol succinate in patients undergoing non‐cardiac surgery (POISE trial): a randomised controlled trial.Lancet.2008;371(9627):1839–1847.
- ,,,,,.Impact of combination evidence‐based medical therapy on mortality in patients with acute coronary syndromes.Circulation.2004;109(6):745–749.
- ,,, et al.Outcomes associated with the use of secondary prevention medications after coronary artery bypass graft surgery.Ann Thorac Surg.2007;83(3):993–1001.
- ,,, et al.Coronary‐artery revascularization before elective major vascular surgery.N Engl J Med.2004;351(27):2795–2804.
- ,,, et al.Derivation and prospective validation of a simple index for prediction of cardiac risk of major noncardiac surgery.Circulation.1999;100(10):1043–1049.
- ,,.Alpha‐2 adrenergic agonists to prevent perioperative cardiovascular complications: a meta‐analysis.Am J Med.2003;114(9):742–752.
- ,,,.Comparison of logistic regression versus propensity score when the number of events is low and there are multiple confounders.Am J Epidemiol.2003;158(3):280–287.
- .Propensity score methods for bias reduction in the comparison of a treatment to a non‐randomized control group.Stat Med.1998;17(19):2265–2281.
- .Aspirin and mortality from coronary bypass surgery.N Engl J Med.2002;347(17):1309–1317.
- ,,,.Systematic review of randomized controlled trials of aspirin and oral anticoagulants in the prevention of graft occlusion and ischemic events after infrainguinal bypass surgery.J Vasc Surg.1999;30(4):701–709.
- ,,, et al.Effect of perioperative beta blockade in patients with diabetes undergoing major non‐cardiac surgery: randomised placebo controlled, blinded multicentre trial.Br Med J (Clin Res Ed).2006;332(7556):1482.
- ,,, et al.ACC/AHA 2007 Guidelines on perioperative cardiovascular evaluation and care for noncardiac surgery: executive summary: a report of the American College of Cardiology/American Heart Association Task Force on Practice Guidelines (Writing Committee to Revise the 2002 Guidelines on Perioperative Cardiovascular Evaluation for Noncardiac Surgery): developed in collaboration with the American Society of Echocardiography, American Society of Nuclear Cardiology, Heart Rhythm Society, Society of Cardiovascular Anesthesiologists, Society for Cardiovascular Angiography and Interventions, Society for Vascular Medicine and Biology, and Society for Vascular Surgery.Circulation.2007;116(17):1971–1996.
- ,,, et al.High‐dose beta‐blockers and tight heart rate control reduce myocardial ischemia and troponin T release in vascular surgery patients.Circulation.2006;114(1 suppl):I344–I349.
- ,,, et al.Should major vascular surgery be delayed because of preoperative cardiac testing in intermediate‐risk patients receiving beta‐blocker therapy with tight heart rate control?J Am Coll Cardiol.2006;48(5):964–969.
- ,,,,,.Effects of an angiotensin‐converting‐enzyme inhibitor, ramipril, on cardiovascular events in high‐risk patients. The Heart Outcomes Prevention Evaluation Study Investigators.N Engl J Med.2000;342(3):145–153.
- ,,,,.The hemodynamic effects of anesthetic induction in vascular surgical patients chronically treated with angiotensin II receptor antagonists.Anesth Analg.1999;89(6):1388–1392.
- ,,,,,.Hemodynamic effects of anesthesia in patients chronically treated with angiotensin‐converting enzyme inhibitors.Anesth Analg.1992;74(6):805–808.
- ,,, et al.Angiotensin system inhibitors in a general surgical population.Anesth Analg.2005;100(3):636–644.
- ,,, et al.Influence of chronic angiotensin‐converting enzyme inhibition on anesthetic induction.Anesthesiology.1994;81(2):299–307.
- ,.Preoperative administration of angiotensin‐converting enzyme inhibitors.Anaesthesist.2007;56(6):557–561.
- ,,, et al.ACC/AHA 2005 Practice guidelines for the management of patients with peripheral arterial disease (lower extremity, renal, mesenteric, and abdominal aortic): executive summarya collaborative report from the American Association for Vascular Surgery/Society for Vascular Surgery, Society for Cardiovascular Angiography and Interventions, Society for Vascular Medicine and Biology, Society of Interventional Radiology, and the ACC/AHA Task Force on Practice Guidelines (Writing committee to develop guidelines for the management of patients with peripheral arterial disease).Circulation.2006;113(11):1474–1547.
- ,,, et al.AHA/ACC guidelines for secondary prevention for patients with coronary and other atherosclerotic vascular disease: 2006 update: endorsed by the National Heart, Lung, and Blood Institute.Circulation.2006;113(19):2363–2372.
- ,,,,,.Preoperative serum albumin level as a predictor of operative mortality and morbidity: results from the National VA Surgical Risk Study.Arch Surg.1999;134(1):36–42.
Vascular surgery is the most morbid of the noncardiac surgeries, with a 30‐day mortality estimated to be 3% to 10% and 6‐month mortality estimated to be 10% to 30%.14 Adverse outcomes are highly correlated with the presence of perioperative ischemia and infarction. Perioperative ischemia is associated with a 9‐fold increase in the odds of unstable angina, nonfatal myocardial infarction, and cardiac death, while a perioperative myocardial infarction increases the odds of death 20‐fold up to 2 years after surgery.57 Prior research has centered on the single or combination use of perioperative beta‐blockers and statins, which has been associated with decreased short‐term and long‐term mortality after vascular surgery,814 with the exceptions of the Metoprolol After Vascular Surgery (MAVS)15 and the Perioperative Beta‐Blockade (POBBLE) studies,16 which were negative beta‐blocker randomized controlled trials exclusively in vascular surgery patients, and the Perioperative Ischemic Evaluation (POISE) study,17 which was the largest perioperative beta‐blocker trial to date in noncardiac surgery, with 41% of the patients undergoing vascular surgery.
There have been few studies assessing clinical outcomes in patients taking multiple concurrent cardioprotective medications. Clinicians are challenged to apply research results to their patients, who generally take multiple drugs. A retrospective cohort study of acute coronary syndrome patients did assess the use of evidence‐based, combination therapies, including aspirin, ACE inhibitors, beta‐blockers, and statins, compared to the use of none of these agents and found an association with decreased 6‐month mortality.18 There are no prior noncardiac surgery studies assessing the concurrent use of multiple possibly cardioprotective drugs. There is 1 cohort study of coronary artery bypass graft surgery patients that assessed aspirin, ACE inhibitor, beta‐blocker, and statin use and found associations with decreased mortality.19 As preoperative coronary revascularization has not been found to produce improved survival after vascular surgery, clarifying which perioperative medicines alone or in combination may improve outcomes becomes even more important.20 We sought to ascertain if the use of concurrent combination aspirin, ACE inhibitors, beta‐blockers, and statins compared to nonuse was associated with a decrease in 6‐month mortality after vascular surgery.
Patients and Methods
Setting and Subjects
All patients presenting for vascular surgery at 5 regional Department of Veterans Affairs (VA) medical centers between January 1998 and March 2005 (3062 patients) were eligible for study entry. Patients with less than 6 months follow‐up were excluded (42 patients). The study included the remaining 3020 patients (comprising 99% of the original population). Our methods have been previously described.8 In brief, we conducted a retrospective cohort study using a regional VA administrative and relational database containing information on both the outpatient and inpatient environments. A record is generated for every contact a patient makes with the VA healthcare system, including prescription medications, laboratory values, demographic information, International Classification of Diseases, 9th Revision (ICD‐9) codes, and vital status. In addition, we used the national VA death index, the VA Beneficiary Identification and Records Locator Subsystem database, which includes Social Security Administration data, to assess vital status. A patient was considered to have a drug exposure (aspirin, ACE inhibitor, beta‐blocker, or statin) if the patient filled or renewed a prescription for the drug within 30 days before surgery. It was determined how many of these drugs were taken during this period, and in which combinations. The Institutional Review Board (IRB) at the Portland VA Medical Center approved the study with a waiver of informed consent.
Data Elements
For every patient we noted the type of vascular surgery (carotid, aortic, lower extremity bypass, or lower extremity amputation), age, sex, comorbid conditions (hypertension, cerebrovascular disease, cancer, diabetes, hyperlipidemia, chronic obstructive pulmonary disease [COPD], chronic kidney disease [CKD], coronary artery disease [CAD], or heart failure), nutritional status (serum albumin), and other medication use (also defined as filling a prescription within 30 days before surgery [insulin and clonidine]). Insulin use was documented to calculate the revised cardiac risk index (RCRI),21 and clonidine was documented to account for as a confounder.22 The RCRI was assigned to each patient. One point was given for each of the following risk factors: use of insulin, CAD, heart failure, cerebrovascular disease, CKD, and high‐risk surgery (intrathoracic, intraperitoneal, or suprainguinal vascular procedures). These variables were defined by ICD‐9 codes. CKD was defined as either an ICD‐9 code for CKD or a serum creatinine >2 mg/dL. Patients were identified by the index vascular surgery using ICD‐9 codes in the VA database, and data were extracted from both the inpatient and outpatient environments.
Statistical Analysis
Patients were included in the analysis if they either died within 6 months or were followed for at least 6 months. Data management and analyses were performed using SAS software, version 9.0. We conducted the univariate analysis of 6‐month mortality using chi‐square analysis and provided unadjusted relative risk estimates for demographic and clinical variables. Demographic variables included age, sex, year, and site of surgery. Clinical variables included preoperative use of insulin and clonidine, preoperative medical conditions, serum albumin, creatinine, RCRI score, and type of surgery.
Bias due to confounding is a problem for studies that cannot randomize subjects into treatment groups. This bias can often be reduced by adjusting for the potentially confounding variables as covariates in regression models. However, when the number of potential confounders is large, as it was in our study, and the number of events, ie, deaths, is small, the resulting regression model can be unstable and the estimates unreliable.23, 24 In such cases, it is necessary to control for confounding using another method. We chose to use propensity scoring and stratification analyses since these methods enable controlling for a large number of covariates using a single variable.
The study drugs were: aspirin, beta‐blockers, statins, and ACE inhibitors. There are 16 combinations with 120 pairwise statistical comparisons possible for these 4 drug exposures. Instead of these multiple comparisons, we chose 4 classifications of combination drug exposure to examine: all 4 drugs compared to none, 3 drugs compared to none, 2 drugs compared to none, and 1 drug compared to none. Four different propensity scores were generated since we studied 4 different drug exposure classes. For each drug exposure class, propensity analyses were performed by using logistic regression to predict the likelihood of use of the drug of interest using all potential demographic and clinical confounding variables. Each subject received a score corresponding to the probability of their having a drug exposure based on the covariates. Scores were divided into quintiles, and these quintiles were used for stratification in Cochran‐Mantel‐Haenszel analyses. Thus, we were able to test the association of patient survival to 6 months with the category of drug exposure comparisons within 30 days before surgery, while controlling for all aforementioned potential confounders. Results of the Breslow‐Day test for homogeneity indicated that no statistically significant differences existed between the results of the propensity quintiles, so the overall summary statistic was reported. All quintiles achieved a balance in the covariates. However, for the 4 study drug exposure class, there were no deaths for the first (n = 173) and second (n = 176) quintiles (corresponding to lower‐risk patients). We therefore excluded these patients from the final analysis.
Variables used in propensity scores included: age, sex, preoperative medical conditions, preoperative clonidine use, nutritional status (serum albumin), RCRI score, and year and location of surgery. To determine whether the propensity score adjustment removed imbalance among the comparisons of the combination drug classes to the no‐drug‐exposure patients, we evaluated associations between each classification of study drug exposure and predictor variables as compared to no‐drug‐exposure patients with both unadjusted chi‐square and propensity‐adjusted Cochran‐Mantel‐Haenszel analyses.
Results
Patient Characteristics
There were 3020 patients with a median age of 67 years, and interquartile range of 59 to 75 years. Ninety‐nine percent were male, and all patients were assessed for death at 6 months after surgery (Table 1). Ten percent (304) had combination all‐4‐drug exposure, 22% (652) had 3‐drug exposure, 24% (736) had 2‐drug exposure, 26% (783) had 1‐drug exposure, and 18% (545) had no study drug exposures. Eight percent (229) of surgeries were aortic, 28% (861) were carotid, 28% (852) were lower extremity amputation, and 36% (1078) were lower extremity bypass. Twenty‐two percent (665) of patients were low risk, with a RCRI of 0, 60% (1822) were moderate risk with a RCRI of 1 to 2, and 18% (553) were high risk with a RCRI of 3. Overall the 6‐month mortality was 9.7% (294). The 6‐month mortality for carotid endarterectomy was 5.0% (43/861), for lower extremity bypass 7.6% (82/1078), for aorta repair 9.2% (21/229), and for lower extremity amputation 17.4% (148/852).
| Variable | Level | N (%) Overall N = 3020 | Relative Risk (95% CI) | Chi Square P‐Value |
|---|---|---|---|---|
| ||||
| Age: year, median (IQR) | 67 (59, 75) | 1.04 (1.031.06) | <0.001* | |
| Sex | Female | 44 (1.5) | 1 | 0.490 |
| Male | 2976 (98.5) | 1.48 (0.464.81) | ||
| Preoperative medical conditions | HTN | 2388 (79.1) | 1.40 (0.011.93) | 0.036 |
| DM | 1455 (48.2) | 1.45 (1.131.84) | 0.003 | |
| COPD | 912 (30.2) | 1.71 (1.342.19) | <0.001 | |
| CA | 674 (22.3) | 1.42 (1.091.86) | 0.012 | |
| CKD | 344 (11.4) | 2.04 (1.492.80) | <0.001 | |
| CAD | 1479 (49.0) | 1.51 (1.181.92) | 0.001 | |
| CHF | 911 (30.2) | 2.41 (1.893.08) | <0.001 | |
| CVA/TIA | 802 (26.6) | 1.08 (0.821.41) | 0.587 | |
| Lipid | 865 (28.6) | 0.81 (0.611.06) | 0.123 | |
| Blood chemistry | Creatinine > 2 | 228 (7.5) | 3.11 (2.224.36) | <0.001 |
| Albumin 3.5 | 629 (20.8) | 3.60 (2.804.62) | <0.001 | |
| Medication use | Aspirin | 1773 (58.7) | 1.12 (0.881.44) | 0.355 |
| ACE, inhibitor | 1238 (41.0) | 0.81 (0.631.04) | 0.090 | |
| Statin | 1214 (40.2) | 0.66 (0.510.86) | 0.001 | |
| Beta blocker | 1202 (39.8) | 0.76 (0.590.98) | 0.031 | |
| Clonidine | 115 (3.8) | 1.65 (0.972.80) | 0.080 | |
| Insulin | 474 (15.7) | 1.47 (1.091.98) | 0.013 | |
| Number of study drugs used | None | 545 (18.0) | 1 | 0.018 |
| One of 4 | 783 (25.9) | 1.06 (0.751.51) | ||
| Two of 4 | 736 (24.4) | 0.94 (0.651.35) | ||
| Three of 4 | 652 (21.6) | 0.73 (0.491.08) | ||
| All four | 304 (10.1) | 0.66 (0.391.09) | ||
| Type of surgery | Carotid | 861 (28.5) | 1 | <0.001 |
| Bypass | 1078 (35.7) | 1.57 (1.072.29) | ||
| Aorta | 229 (7.6) | 1.92 (1.123.31) | ||
| Amputation | 852 (28.2) | 4.00 (2.815.70) | ||
| RCRI category | 0 | 665 (22.0) | 1 | <0.001 |
| 1 | 976 (32.3) | 1.12 (0.761.66) | ||
| 2 | 846 (28.0) | 1.66 (1.142.42) | ||
| 3 | 553 (17.6) | 2.83 (1.934.14) | ||
| Surgery year | 1998 | 539 (17.8) | 1 | 0.804 |
| 1999 | 463 (15.3) | 1.36 (0.892.07) | ||
| 2000 | 418 (13.8) | 1.07 (0.681.68) | ||
| 2001 | 407 (13.5) | 1.23 (0.791.92) | ||
| 2002 | 368 (12.2) | 1.34 (0.962.10) | ||
| 2003 | 371 (12.3) | 1.25 (0.801.97) | ||
| 2004 | 395 (13.1) | 1.17 (0.741.84) | ||
| 2005 | 59 (2.0) | 0.80 (0.282.30) | ||
The most common single‐drug exposure was aspirin, 14% (416), followed by ACE inhibitors, 5% (163) (Table 2). The more common 2‐drug exposures included ACE inhibitors and aspirin, 7% (203), aspirin and beta‐blockers, 5% (161), and aspirin and statins, 5% (141). The common 3‐drug combinations included aspirin, beta‐blockers, and statins, 8% (229); ACE inhibitors, aspirin, and statins, 6% (167); and ACE inhibitors, aspirin, and beta‐blockers, 5% (152). ACE inhibitor exposure was common in all combinations, eg, 20.8% of the 1‐drug group had exposure to an ACE inhibitor, 40.5% in the 2‐drug group, 64.9% in the 3‐drug group, and all patients in the 4‐drug group. Overall, 39.3% of patients in the study had ACE inhibitor exposure. The gross unadjusted mortality for each drug exposure group was 10.6% for the no drug group, 11.2% for the 1‐drug group, 10.1% for the 2‐drug group, 8% for the 3‐drug group, and 7.2% for the 4‐drug group.
| Drugs Used | Presurgery | 6 Months Postsurgery | ||
|---|---|---|---|---|
| Frequency | % | Frequency | % | |
| ||||
| None | 545 | 18.1 | 669 | 24.5 |
| 1 Drug | ||||
| Aspirin | 416 | 53.1 | 169 | 28.3 |
| ACE inhibitor | 163 | 20.8 | 135 | 22.6 |
| Beta‐blocker | 110 | 14.1 | 163 | 27.2 |
| Statin | 94 | 12.0 | 131 | 21.9 |
| All 1 drug | 783 | 100.0 | 598 | 100.0 |
| 2 Drugs | ||||
| Aspirin + ACE inhibitor | 203 | 27.6 | 102 | 14.4 |
| Aspirin + Beta‐blocker | 161 | 21.8 | 117 | 16.5 |
| Aspirin + Statin | 141 | 19.2 | 86 | 12.1 |
| ACE inhibitor + Beta‐blocker | 56 | 7.6 | 103 | 14.5 |
| ACE inhibitor + Statin | 89 | 12.1 | 126 | 17.7 |
| Beta‐blocker + Statin | 86 | 11.7 | 176 | 24.8 |
| All 2 drugs | 36 | 100.0 | 710 | 100.0 |
| 3 Drugs | ||||
| Aspirin + ACE inhibitor + Beta‐blocker | 152 | 23.3 | 96 | 16.5 |
| Aspirin + ACE inhibitor + Statin | 167 | 25.6 | 103 | 17.7 |
| Aspirin + Beta‐ blocker + Statin | 229 | 35.1 | 165 | 28.4 |
| ACE inhibitor + Beta‐blocker Statin | 104 | 16.0 | 218 | 37.4 |
| All 3 drugs | 652 | 100.0 | 582 | 100.0 |
| All 4 drugs | 304 | 10.1 | 167 | 6.1 |
| Total | 3020 | 100.0 | 2726* | 100.0 |
During the 6 complete years of the study (1998‐2004) the frequency of combination exposure for all 4 study drugs increased from 3.5% to 13.4%; 3‐drug exposure also increased, 14.7% to 27.8%; 2‐drug exposure remained relatively stable, 24.5% to 22%; and single‐drug exposure declined, 24.9% to 12.7% (Figure 1). Individual study drug exposures over the 6 years of the study generally also increased with respect to the other combinations: ACE inhibitor use increased, 34.5% to 42.5%; beta‐blocker, 27.8% to 53.4%; statin, 22.6% to 52.2%. The exception was aspirin, which was relatively stable, 54.5% in 1998, and 57.2% in 2004 (Figure 2).
We also compared the use of the study drug exposures at 6 months after surgery to use within 30 days before surgery (Table 2). In the VA healthcare system aspirin is cheaper for some patients to purchase over‐the‐counter. Aspirin is likely underestimated in this dataset. The frequency of follow‐up drug exposure at 6 months was overall similar to the drug exposure within 30 days before surgery. When aspirin was 1 of the combination exposures, the frequencies declined, and when aspirin was not 1 of the exposures, the frequencies generally increased. The frequency of no‐drug exposures increased from 18.1% before surgery to 24.5% 6 months after surgery, and the frequency of all 4 drug exposures decreased from 10.1% to 6.1%, respectively.
Univariate Analysis
There were statistically significant differences in 6‐month mortality for the combination drug exposure classes compared to no‐drug exposure; P value for linear trend = 0.018 (Table 1).
Propensity‐adjusted Analysis
Patients categorized in each combination drug exposure group were significantly different in their demographic and clinical characteristics compared to the no‐drug exposure patients using unadjusted chi‐square P values (Appendix Table 1). However, after the propensity adjustments, only hyperlipidemia was statistically different for the combination 4‐drug exposure patients compared to no‐drug exposure patients (Appendix Table 1). All other demographic and clinical characteristics for the comparison of the drug exposure classes to no‐drug exposure patients had statistically nonsignificant propensity‐adjusted P values. The range of propensity score distribution was fairly comparable for each combination drug exposure group. The Breslow‐Day test for homogeneity was not significant among the quintiles for any of the drug exposure classes (Table 3; Appendix Table 2), indicating that there was not a statistically significant difference in stratum‐specific relative risks between the different quintiles. Therefore, the summary adjusted result was reported for each drug exposure group. Patients with all 4 drug exposures (with the first [n = 173] and second [n = 166] quintiles excluded due to zero deaths) compared to no‐drug exposure patients had a marginally significant association with decreased mortality, overall propensity‐adjusted relative risk (aRR) 0.52 (95% confidence interval [CI], 0.26‐1.01; P = 0.052), number needed to treat (NNT) 19; patients with the combination 3‐drug exposure had a significant association with decreased mortality, aRR 0.60 (95% CI, 0.38‐0.95; P = 0.030), NNT 38; as well as patients with combination 2‐drug exposure, aRR 0.68 (95% CI, 0.46‐0.99; P = 0.043), NNT 170 (Table 3). Patients with 1 drug exposure did not have an association with decreased mortality compared to no‐drug exposure patients, aRR 0.88 (95% CI, 0.63‐1.22; P = 0.445).
| Variable | N (Overall N = 3020) | 6 Mo. Mortality | P Value* | Adjusted Relative Risk (95% CI) of Death* | NNT | |||
|---|---|---|---|---|---|---|---|---|
| Nonuser | User | |||||||
| % | (n/N) | % | (n/N) | |||||
| ||||||||
| 1 Drug vs. no drugs | 1328 | 10.64 | (58/545) | 11.24 | (88/783) | 0.445 | 0.88 (0.631.22) | |
| 2 Drugs vs. no drugs | 1281 | 10.64 | (58/545) | 10.05 | (74/736) | 0.043 | 0.68 (0.460.99) | 170 |
| 3 Drugs vs. no drugs | 1197 | 10.64 | (58/545) | 7.98 | (52/652) | 0.030 | 0.60 (0.380.95) | 38 |
| 4 Drugs vs. no drugs | 510 | 12.56 | (26/207) | 7.26 | (22/303) | 0.052 | 0.52 (0.261.01) | 19 |
Discussion
This retrospective cohort study has demonstrated that the combination use of 4 drugs (aspirin, beta‐blockers, statins, and ACE inhibitors) compared to the use of none of these drugs had a trend toward decreased mortality, with a 49% decrease in propensity‐adjusted 6‐month mortality after vascular surgery and an NNT of 19. In addition, the combination use of 3 drug exposures was significantly associated with a 40% decrease in mortality, with propensity adjustment and NNT of 38; and the 2‐drug combination exposure showed a significant association, with a propensity‐adjusted 32% decreased mortality, and an NNT of 170. Both the unadjusted and adjusted analyses showed a linear trend, suggesting a dose‐response effect of more study‐drug exposure association with less 6‐month mortality and smaller NNT.
The lack of statistical significance for the 4‐drug exposure group is likely due to few patients and events in this group, and the exclusion of the first 2 quintiles (n = 339) due to having zero deaths with which to compare. It is not unusual to exclude patients from analyses in propensity methods. The patients we excluded were low‐risk who had survived to 6‐months after surgery, so they would have also been excluded in a propensity‐matched analysis. We did not perform propensity matching, as we had adequate homogeneity between our quintile strata, and were not powered to perform matching.
This is the first evidence of which we are aware of an association with decreased mortality for the combination perioperative use of aspirin, beta‐blockers, statins, and ACE inhibitors in vascular surgery patients. Aspirin has been associated with decreased mortality in patients undergoing coronary artery bypass graft surgery,25 but the effects of aspirin on noncardiac surgery outcomes is less clear.26
Beta‐blockers and statins have been associated with decreased short‐term and long‐term mortality after vascular surgery in the past,814 but more recent beta‐blocker studies have been negative, introducing controversy for the topic.1517, 27 Beta‐blockers are currently recommended as: Class I (should be used), Evidence Level B (limited population risk strata evaluated) for vascular surgery patients already taking a beta‐blocker or with positive ischemia on stress testing; Class IIa (reasonable to use), Evidence Level B for 1 or more clinical risk factors; or Class IIb (may be considered), Evidence Level B for no clinical risk factors, in the 2007 American College of Cardiology/American Heart Association (ACC/AHA) guidelines for perioperative evaluation.28 Perioperative beta‐blocker trials that have titrated the dose to a goal heart rate have consistently been associated with improved outcomes after vascular surgery,10, 12, 29, 30 and perioperative beta‐blocker trials that have used fixed dosing after surgery have been negative,1517, 27 including the POISE trial, which was associated with increased strokes and mortality.
This is also the first evidence of which we are aware that ACE inhibitors in combination with other drugs may be associated with decreased mortality after vascular surgery. While our study design does not support a causal relationship between ACE inhibitor exposure and decreased mortality, the increasing exposure in each drug exposure group for ACE inhibitors and correlated decreasing mortality is of sufficient interest to warrant further study. The use of ACE inhibitors has been associated with decreased mortality in patients with atherosclerotic vascular disease and CAD.31 There has been a concern expressed in the literature about the perioperative use of ACE inhibitors due to the potential for intraoperative hypotension.3236 Many centers advise patients to discontinue ACE inhibitor use the day before surgery. The number of patients studied remains small. More research is needed to clarify this issue. Use of angiotensin‐receptor blockers was not assessed; their use was considered to be rare, because use was restricted to patients intolerant of ACE inhibitors during the study period.
The 2005 ACC/AHA guideline for patients with peripheral arterial disease recommends the use of aspirin and statins.37 ACE inhibitors are recommended for both asymptomatic and symptomatic peripheral artery disease patients. The 2006 ACC/AHA guidelines for secondary prevention for patients with coronary or other atherosclerotic vascular disease recommends the use of chronic beta‐blockers.38 There appears to be some benefit in mortality from the combination aspirin, beta‐blocker, statin, and ACE inhibitor drug regimen in patients with established atherosclerotic vascular disease.
We expect the frequency of aspirin exposure to be underestimated in this study population (due to over‐the‐counter undocumented use), so our findings may be somewhat underestimated as well. This may also explain why the frequency of aspirin remained constant over time while the other drug exposures increased over time.
Our study has several limitations. First, our design was a retrospective cohort. Propensity analysis attempts to correct for confounding by indication in nonrandomized studies as patients that are exposed to a study drug are different from patients that are not exposed to the same study drug. For example, without adjustment for the propensity scores, the drug exposure classes were significantly associated with demographic and clinical characteristics when compare to the no‐drug‐exposure patients. However, with the propensity score adjustment, these associations were no longer statistically significant, with the exception of hyperlipidemia in patients taking all 4 drugs, which supports a rigorous propensity adjustment. We also controlled for the use of clonidine and serum albumin, both strong predictors of death after noncardiac surgery.22, 39 Second, we utilized administrative ICD‐9 code data for abstraction, and utilized only documented and coded comorbidities in the VA database. Unmeasured confounders may exist. Further, we cannot identify which combinations of specific study drugs were most associated with a reduction in 6‐month mortality, but we believe our data supports the case that all 4 of the study drugs be considered for each patient undergoing vascular surgery. It is important to also note that patient baseline risk, which can be difficult to clarify in retrospective cohort studies, will have a large impact on the results of the NNT. Lastly, this study needs to be repeated in a population that includes a greater number of female participants.
The combination exposure of 2 to 3 study drugs: aspirin, beta‐blockers, statins, and ACE inhibitors was consistently associated with decreased 6‐month mortality after vascular surgery, with a high prevalence of ACE inhibitor use, and the combination exposure of all 4 study drugs was marginally associated with decreased mortality. Consideration for the individual patient undergoing vascular surgery should include whether or not the patient may benefit from these 4 drugs. Further research with prospective and randomized studies is needed to clarify the optimum timing of these drugs and their combination efficacy in vascular surgery patients with attention to patient‐specific risk.
Acknowledgements
The authors thank Martha S. Gerrity, MD, PhD, Portland VA Medical Center, Portland, Oregon, for comments on an earlier version of the manuscript.
Vascular surgery is the most morbid of the noncardiac surgeries, with a 30‐day mortality estimated to be 3% to 10% and 6‐month mortality estimated to be 10% to 30%.14 Adverse outcomes are highly correlated with the presence of perioperative ischemia and infarction. Perioperative ischemia is associated with a 9‐fold increase in the odds of unstable angina, nonfatal myocardial infarction, and cardiac death, while a perioperative myocardial infarction increases the odds of death 20‐fold up to 2 years after surgery.57 Prior research has centered on the single or combination use of perioperative beta‐blockers and statins, which has been associated with decreased short‐term and long‐term mortality after vascular surgery,814 with the exceptions of the Metoprolol After Vascular Surgery (MAVS)15 and the Perioperative Beta‐Blockade (POBBLE) studies,16 which were negative beta‐blocker randomized controlled trials exclusively in vascular surgery patients, and the Perioperative Ischemic Evaluation (POISE) study,17 which was the largest perioperative beta‐blocker trial to date in noncardiac surgery, with 41% of the patients undergoing vascular surgery.
There have been few studies assessing clinical outcomes in patients taking multiple concurrent cardioprotective medications. Clinicians are challenged to apply research results to their patients, who generally take multiple drugs. A retrospective cohort study of acute coronary syndrome patients did assess the use of evidence‐based, combination therapies, including aspirin, ACE inhibitors, beta‐blockers, and statins, compared to the use of none of these agents and found an association with decreased 6‐month mortality.18 There are no prior noncardiac surgery studies assessing the concurrent use of multiple possibly cardioprotective drugs. There is 1 cohort study of coronary artery bypass graft surgery patients that assessed aspirin, ACE inhibitor, beta‐blocker, and statin use and found associations with decreased mortality.19 As preoperative coronary revascularization has not been found to produce improved survival after vascular surgery, clarifying which perioperative medicines alone or in combination may improve outcomes becomes even more important.20 We sought to ascertain if the use of concurrent combination aspirin, ACE inhibitors, beta‐blockers, and statins compared to nonuse was associated with a decrease in 6‐month mortality after vascular surgery.
Patients and Methods
Setting and Subjects
All patients presenting for vascular surgery at 5 regional Department of Veterans Affairs (VA) medical centers between January 1998 and March 2005 (3062 patients) were eligible for study entry. Patients with less than 6 months follow‐up were excluded (42 patients). The study included the remaining 3020 patients (comprising 99% of the original population). Our methods have been previously described.8 In brief, we conducted a retrospective cohort study using a regional VA administrative and relational database containing information on both the outpatient and inpatient environments. A record is generated for every contact a patient makes with the VA healthcare system, including prescription medications, laboratory values, demographic information, International Classification of Diseases, 9th Revision (ICD‐9) codes, and vital status. In addition, we used the national VA death index, the VA Beneficiary Identification and Records Locator Subsystem database, which includes Social Security Administration data, to assess vital status. A patient was considered to have a drug exposure (aspirin, ACE inhibitor, beta‐blocker, or statin) if the patient filled or renewed a prescription for the drug within 30 days before surgery. It was determined how many of these drugs were taken during this period, and in which combinations. The Institutional Review Board (IRB) at the Portland VA Medical Center approved the study with a waiver of informed consent.
Data Elements
For every patient we noted the type of vascular surgery (carotid, aortic, lower extremity bypass, or lower extremity amputation), age, sex, comorbid conditions (hypertension, cerebrovascular disease, cancer, diabetes, hyperlipidemia, chronic obstructive pulmonary disease [COPD], chronic kidney disease [CKD], coronary artery disease [CAD], or heart failure), nutritional status (serum albumin), and other medication use (also defined as filling a prescription within 30 days before surgery [insulin and clonidine]). Insulin use was documented to calculate the revised cardiac risk index (RCRI),21 and clonidine was documented to account for as a confounder.22 The RCRI was assigned to each patient. One point was given for each of the following risk factors: use of insulin, CAD, heart failure, cerebrovascular disease, CKD, and high‐risk surgery (intrathoracic, intraperitoneal, or suprainguinal vascular procedures). These variables were defined by ICD‐9 codes. CKD was defined as either an ICD‐9 code for CKD or a serum creatinine >2 mg/dL. Patients were identified by the index vascular surgery using ICD‐9 codes in the VA database, and data were extracted from both the inpatient and outpatient environments.
Statistical Analysis
Patients were included in the analysis if they either died within 6 months or were followed for at least 6 months. Data management and analyses were performed using SAS software, version 9.0. We conducted the univariate analysis of 6‐month mortality using chi‐square analysis and provided unadjusted relative risk estimates for demographic and clinical variables. Demographic variables included age, sex, year, and site of surgery. Clinical variables included preoperative use of insulin and clonidine, preoperative medical conditions, serum albumin, creatinine, RCRI score, and type of surgery.
Bias due to confounding is a problem for studies that cannot randomize subjects into treatment groups. This bias can often be reduced by adjusting for the potentially confounding variables as covariates in regression models. However, when the number of potential confounders is large, as it was in our study, and the number of events, ie, deaths, is small, the resulting regression model can be unstable and the estimates unreliable.23, 24 In such cases, it is necessary to control for confounding using another method. We chose to use propensity scoring and stratification analyses since these methods enable controlling for a large number of covariates using a single variable.
The study drugs were: aspirin, beta‐blockers, statins, and ACE inhibitors. There are 16 combinations with 120 pairwise statistical comparisons possible for these 4 drug exposures. Instead of these multiple comparisons, we chose 4 classifications of combination drug exposure to examine: all 4 drugs compared to none, 3 drugs compared to none, 2 drugs compared to none, and 1 drug compared to none. Four different propensity scores were generated since we studied 4 different drug exposure classes. For each drug exposure class, propensity analyses were performed by using logistic regression to predict the likelihood of use of the drug of interest using all potential demographic and clinical confounding variables. Each subject received a score corresponding to the probability of their having a drug exposure based on the covariates. Scores were divided into quintiles, and these quintiles were used for stratification in Cochran‐Mantel‐Haenszel analyses. Thus, we were able to test the association of patient survival to 6 months with the category of drug exposure comparisons within 30 days before surgery, while controlling for all aforementioned potential confounders. Results of the Breslow‐Day test for homogeneity indicated that no statistically significant differences existed between the results of the propensity quintiles, so the overall summary statistic was reported. All quintiles achieved a balance in the covariates. However, for the 4 study drug exposure class, there were no deaths for the first (n = 173) and second (n = 176) quintiles (corresponding to lower‐risk patients). We therefore excluded these patients from the final analysis.
Variables used in propensity scores included: age, sex, preoperative medical conditions, preoperative clonidine use, nutritional status (serum albumin), RCRI score, and year and location of surgery. To determine whether the propensity score adjustment removed imbalance among the comparisons of the combination drug classes to the no‐drug‐exposure patients, we evaluated associations between each classification of study drug exposure and predictor variables as compared to no‐drug‐exposure patients with both unadjusted chi‐square and propensity‐adjusted Cochran‐Mantel‐Haenszel analyses.
Results
Patient Characteristics
There were 3020 patients with a median age of 67 years, and interquartile range of 59 to 75 years. Ninety‐nine percent were male, and all patients were assessed for death at 6 months after surgery (Table 1). Ten percent (304) had combination all‐4‐drug exposure, 22% (652) had 3‐drug exposure, 24% (736) had 2‐drug exposure, 26% (783) had 1‐drug exposure, and 18% (545) had no study drug exposures. Eight percent (229) of surgeries were aortic, 28% (861) were carotid, 28% (852) were lower extremity amputation, and 36% (1078) were lower extremity bypass. Twenty‐two percent (665) of patients were low risk, with a RCRI of 0, 60% (1822) were moderate risk with a RCRI of 1 to 2, and 18% (553) were high risk with a RCRI of 3. Overall the 6‐month mortality was 9.7% (294). The 6‐month mortality for carotid endarterectomy was 5.0% (43/861), for lower extremity bypass 7.6% (82/1078), for aorta repair 9.2% (21/229), and for lower extremity amputation 17.4% (148/852).
| Variable | Level | N (%) Overall N = 3020 | Relative Risk (95% CI) | Chi Square P‐Value |
|---|---|---|---|---|
| ||||
| Age: year, median (IQR) | 67 (59, 75) | 1.04 (1.031.06) | <0.001* | |
| Sex | Female | 44 (1.5) | 1 | 0.490 |
| Male | 2976 (98.5) | 1.48 (0.464.81) | ||
| Preoperative medical conditions | HTN | 2388 (79.1) | 1.40 (0.011.93) | 0.036 |
| DM | 1455 (48.2) | 1.45 (1.131.84) | 0.003 | |
| COPD | 912 (30.2) | 1.71 (1.342.19) | <0.001 | |
| CA | 674 (22.3) | 1.42 (1.091.86) | 0.012 | |
| CKD | 344 (11.4) | 2.04 (1.492.80) | <0.001 | |
| CAD | 1479 (49.0) | 1.51 (1.181.92) | 0.001 | |
| CHF | 911 (30.2) | 2.41 (1.893.08) | <0.001 | |
| CVA/TIA | 802 (26.6) | 1.08 (0.821.41) | 0.587 | |
| Lipid | 865 (28.6) | 0.81 (0.611.06) | 0.123 | |
| Blood chemistry | Creatinine > 2 | 228 (7.5) | 3.11 (2.224.36) | <0.001 |
| Albumin 3.5 | 629 (20.8) | 3.60 (2.804.62) | <0.001 | |
| Medication use | Aspirin | 1773 (58.7) | 1.12 (0.881.44) | 0.355 |
| ACE, inhibitor | 1238 (41.0) | 0.81 (0.631.04) | 0.090 | |
| Statin | 1214 (40.2) | 0.66 (0.510.86) | 0.001 | |
| Beta blocker | 1202 (39.8) | 0.76 (0.590.98) | 0.031 | |
| Clonidine | 115 (3.8) | 1.65 (0.972.80) | 0.080 | |
| Insulin | 474 (15.7) | 1.47 (1.091.98) | 0.013 | |
| Number of study drugs used | None | 545 (18.0) | 1 | 0.018 |
| One of 4 | 783 (25.9) | 1.06 (0.751.51) | ||
| Two of 4 | 736 (24.4) | 0.94 (0.651.35) | ||
| Three of 4 | 652 (21.6) | 0.73 (0.491.08) | ||
| All four | 304 (10.1) | 0.66 (0.391.09) | ||
| Type of surgery | Carotid | 861 (28.5) | 1 | <0.001 |
| Bypass | 1078 (35.7) | 1.57 (1.072.29) | ||
| Aorta | 229 (7.6) | 1.92 (1.123.31) | ||
| Amputation | 852 (28.2) | 4.00 (2.815.70) | ||
| RCRI category | 0 | 665 (22.0) | 1 | <0.001 |
| 1 | 976 (32.3) | 1.12 (0.761.66) | ||
| 2 | 846 (28.0) | 1.66 (1.142.42) | ||
| 3 | 553 (17.6) | 2.83 (1.934.14) | ||
| Surgery year | 1998 | 539 (17.8) | 1 | 0.804 |
| 1999 | 463 (15.3) | 1.36 (0.892.07) | ||
| 2000 | 418 (13.8) | 1.07 (0.681.68) | ||
| 2001 | 407 (13.5) | 1.23 (0.791.92) | ||
| 2002 | 368 (12.2) | 1.34 (0.962.10) | ||
| 2003 | 371 (12.3) | 1.25 (0.801.97) | ||
| 2004 | 395 (13.1) | 1.17 (0.741.84) | ||
| 2005 | 59 (2.0) | 0.80 (0.282.30) | ||
The most common single‐drug exposure was aspirin, 14% (416), followed by ACE inhibitors, 5% (163) (Table 2). The more common 2‐drug exposures included ACE inhibitors and aspirin, 7% (203), aspirin and beta‐blockers, 5% (161), and aspirin and statins, 5% (141). The common 3‐drug combinations included aspirin, beta‐blockers, and statins, 8% (229); ACE inhibitors, aspirin, and statins, 6% (167); and ACE inhibitors, aspirin, and beta‐blockers, 5% (152). ACE inhibitor exposure was common in all combinations, eg, 20.8% of the 1‐drug group had exposure to an ACE inhibitor, 40.5% in the 2‐drug group, 64.9% in the 3‐drug group, and all patients in the 4‐drug group. Overall, 39.3% of patients in the study had ACE inhibitor exposure. The gross unadjusted mortality for each drug exposure group was 10.6% for the no drug group, 11.2% for the 1‐drug group, 10.1% for the 2‐drug group, 8% for the 3‐drug group, and 7.2% for the 4‐drug group.
| Drugs Used | Presurgery | 6 Months Postsurgery | ||
|---|---|---|---|---|
| Frequency | % | Frequency | % | |
| ||||
| None | 545 | 18.1 | 669 | 24.5 |
| 1 Drug | ||||
| Aspirin | 416 | 53.1 | 169 | 28.3 |
| ACE inhibitor | 163 | 20.8 | 135 | 22.6 |
| Beta‐blocker | 110 | 14.1 | 163 | 27.2 |
| Statin | 94 | 12.0 | 131 | 21.9 |
| All 1 drug | 783 | 100.0 | 598 | 100.0 |
| 2 Drugs | ||||
| Aspirin + ACE inhibitor | 203 | 27.6 | 102 | 14.4 |
| Aspirin + Beta‐blocker | 161 | 21.8 | 117 | 16.5 |
| Aspirin + Statin | 141 | 19.2 | 86 | 12.1 |
| ACE inhibitor + Beta‐blocker | 56 | 7.6 | 103 | 14.5 |
| ACE inhibitor + Statin | 89 | 12.1 | 126 | 17.7 |
| Beta‐blocker + Statin | 86 | 11.7 | 176 | 24.8 |
| All 2 drugs | 36 | 100.0 | 710 | 100.0 |
| 3 Drugs | ||||
| Aspirin + ACE inhibitor + Beta‐blocker | 152 | 23.3 | 96 | 16.5 |
| Aspirin + ACE inhibitor + Statin | 167 | 25.6 | 103 | 17.7 |
| Aspirin + Beta‐ blocker + Statin | 229 | 35.1 | 165 | 28.4 |
| ACE inhibitor + Beta‐blocker Statin | 104 | 16.0 | 218 | 37.4 |
| All 3 drugs | 652 | 100.0 | 582 | 100.0 |
| All 4 drugs | 304 | 10.1 | 167 | 6.1 |
| Total | 3020 | 100.0 | 2726* | 100.0 |
During the 6 complete years of the study (1998‐2004) the frequency of combination exposure for all 4 study drugs increased from 3.5% to 13.4%; 3‐drug exposure also increased, 14.7% to 27.8%; 2‐drug exposure remained relatively stable, 24.5% to 22%; and single‐drug exposure declined, 24.9% to 12.7% (Figure 1). Individual study drug exposures over the 6 years of the study generally also increased with respect to the other combinations: ACE inhibitor use increased, 34.5% to 42.5%; beta‐blocker, 27.8% to 53.4%; statin, 22.6% to 52.2%. The exception was aspirin, which was relatively stable, 54.5% in 1998, and 57.2% in 2004 (Figure 2).
We also compared the use of the study drug exposures at 6 months after surgery to use within 30 days before surgery (Table 2). In the VA healthcare system aspirin is cheaper for some patients to purchase over‐the‐counter. Aspirin is likely underestimated in this dataset. The frequency of follow‐up drug exposure at 6 months was overall similar to the drug exposure within 30 days before surgery. When aspirin was 1 of the combination exposures, the frequencies declined, and when aspirin was not 1 of the exposures, the frequencies generally increased. The frequency of no‐drug exposures increased from 18.1% before surgery to 24.5% 6 months after surgery, and the frequency of all 4 drug exposures decreased from 10.1% to 6.1%, respectively.
Univariate Analysis
There were statistically significant differences in 6‐month mortality for the combination drug exposure classes compared to no‐drug exposure; P value for linear trend = 0.018 (Table 1).
Propensity‐adjusted Analysis
Patients categorized in each combination drug exposure group were significantly different in their demographic and clinical characteristics compared to the no‐drug exposure patients using unadjusted chi‐square P values (Appendix Table 1). However, after the propensity adjustments, only hyperlipidemia was statistically different for the combination 4‐drug exposure patients compared to no‐drug exposure patients (Appendix Table 1). All other demographic and clinical characteristics for the comparison of the drug exposure classes to no‐drug exposure patients had statistically nonsignificant propensity‐adjusted P values. The range of propensity score distribution was fairly comparable for each combination drug exposure group. The Breslow‐Day test for homogeneity was not significant among the quintiles for any of the drug exposure classes (Table 3; Appendix Table 2), indicating that there was not a statistically significant difference in stratum‐specific relative risks between the different quintiles. Therefore, the summary adjusted result was reported for each drug exposure group. Patients with all 4 drug exposures (with the first [n = 173] and second [n = 166] quintiles excluded due to zero deaths) compared to no‐drug exposure patients had a marginally significant association with decreased mortality, overall propensity‐adjusted relative risk (aRR) 0.52 (95% confidence interval [CI], 0.26‐1.01; P = 0.052), number needed to treat (NNT) 19; patients with the combination 3‐drug exposure had a significant association with decreased mortality, aRR 0.60 (95% CI, 0.38‐0.95; P = 0.030), NNT 38; as well as patients with combination 2‐drug exposure, aRR 0.68 (95% CI, 0.46‐0.99; P = 0.043), NNT 170 (Table 3). Patients with 1 drug exposure did not have an association with decreased mortality compared to no‐drug exposure patients, aRR 0.88 (95% CI, 0.63‐1.22; P = 0.445).
| Variable | N (Overall N = 3020) | 6 Mo. Mortality | P Value* | Adjusted Relative Risk (95% CI) of Death* | NNT | |||
|---|---|---|---|---|---|---|---|---|
| Nonuser | User | |||||||
| % | (n/N) | % | (n/N) | |||||
| ||||||||
| 1 Drug vs. no drugs | 1328 | 10.64 | (58/545) | 11.24 | (88/783) | 0.445 | 0.88 (0.631.22) | |
| 2 Drugs vs. no drugs | 1281 | 10.64 | (58/545) | 10.05 | (74/736) | 0.043 | 0.68 (0.460.99) | 170 |
| 3 Drugs vs. no drugs | 1197 | 10.64 | (58/545) | 7.98 | (52/652) | 0.030 | 0.60 (0.380.95) | 38 |
| 4 Drugs vs. no drugs | 510 | 12.56 | (26/207) | 7.26 | (22/303) | 0.052 | 0.52 (0.261.01) | 19 |
Discussion
This retrospective cohort study has demonstrated that the combination use of 4 drugs (aspirin, beta‐blockers, statins, and ACE inhibitors) compared to the use of none of these drugs had a trend toward decreased mortality, with a 49% decrease in propensity‐adjusted 6‐month mortality after vascular surgery and an NNT of 19. In addition, the combination use of 3 drug exposures was significantly associated with a 40% decrease in mortality, with propensity adjustment and NNT of 38; and the 2‐drug combination exposure showed a significant association, with a propensity‐adjusted 32% decreased mortality, and an NNT of 170. Both the unadjusted and adjusted analyses showed a linear trend, suggesting a dose‐response effect of more study‐drug exposure association with less 6‐month mortality and smaller NNT.
The lack of statistical significance for the 4‐drug exposure group is likely due to few patients and events in this group, and the exclusion of the first 2 quintiles (n = 339) due to having zero deaths with which to compare. It is not unusual to exclude patients from analyses in propensity methods. The patients we excluded were low‐risk who had survived to 6‐months after surgery, so they would have also been excluded in a propensity‐matched analysis. We did not perform propensity matching, as we had adequate homogeneity between our quintile strata, and were not powered to perform matching.
This is the first evidence of which we are aware of an association with decreased mortality for the combination perioperative use of aspirin, beta‐blockers, statins, and ACE inhibitors in vascular surgery patients. Aspirin has been associated with decreased mortality in patients undergoing coronary artery bypass graft surgery,25 but the effects of aspirin on noncardiac surgery outcomes is less clear.26
Beta‐blockers and statins have been associated with decreased short‐term and long‐term mortality after vascular surgery in the past,814 but more recent beta‐blocker studies have been negative, introducing controversy for the topic.1517, 27 Beta‐blockers are currently recommended as: Class I (should be used), Evidence Level B (limited population risk strata evaluated) for vascular surgery patients already taking a beta‐blocker or with positive ischemia on stress testing; Class IIa (reasonable to use), Evidence Level B for 1 or more clinical risk factors; or Class IIb (may be considered), Evidence Level B for no clinical risk factors, in the 2007 American College of Cardiology/American Heart Association (ACC/AHA) guidelines for perioperative evaluation.28 Perioperative beta‐blocker trials that have titrated the dose to a goal heart rate have consistently been associated with improved outcomes after vascular surgery,10, 12, 29, 30 and perioperative beta‐blocker trials that have used fixed dosing after surgery have been negative,1517, 27 including the POISE trial, which was associated with increased strokes and mortality.
This is also the first evidence of which we are aware that ACE inhibitors in combination with other drugs may be associated with decreased mortality after vascular surgery. While our study design does not support a causal relationship between ACE inhibitor exposure and decreased mortality, the increasing exposure in each drug exposure group for ACE inhibitors and correlated decreasing mortality is of sufficient interest to warrant further study. The use of ACE inhibitors has been associated with decreased mortality in patients with atherosclerotic vascular disease and CAD.31 There has been a concern expressed in the literature about the perioperative use of ACE inhibitors due to the potential for intraoperative hypotension.3236 Many centers advise patients to discontinue ACE inhibitor use the day before surgery. The number of patients studied remains small. More research is needed to clarify this issue. Use of angiotensin‐receptor blockers was not assessed; their use was considered to be rare, because use was restricted to patients intolerant of ACE inhibitors during the study period.
The 2005 ACC/AHA guideline for patients with peripheral arterial disease recommends the use of aspirin and statins.37 ACE inhibitors are recommended for both asymptomatic and symptomatic peripheral artery disease patients. The 2006 ACC/AHA guidelines for secondary prevention for patients with coronary or other atherosclerotic vascular disease recommends the use of chronic beta‐blockers.38 There appears to be some benefit in mortality from the combination aspirin, beta‐blocker, statin, and ACE inhibitor drug regimen in patients with established atherosclerotic vascular disease.
We expect the frequency of aspirin exposure to be underestimated in this study population (due to over‐the‐counter undocumented use), so our findings may be somewhat underestimated as well. This may also explain why the frequency of aspirin remained constant over time while the other drug exposures increased over time.
Our study has several limitations. First, our design was a retrospective cohort. Propensity analysis attempts to correct for confounding by indication in nonrandomized studies as patients that are exposed to a study drug are different from patients that are not exposed to the same study drug. For example, without adjustment for the propensity scores, the drug exposure classes were significantly associated with demographic and clinical characteristics when compare to the no‐drug‐exposure patients. However, with the propensity score adjustment, these associations were no longer statistically significant, with the exception of hyperlipidemia in patients taking all 4 drugs, which supports a rigorous propensity adjustment. We also controlled for the use of clonidine and serum albumin, both strong predictors of death after noncardiac surgery.22, 39 Second, we utilized administrative ICD‐9 code data for abstraction, and utilized only documented and coded comorbidities in the VA database. Unmeasured confounders may exist. Further, we cannot identify which combinations of specific study drugs were most associated with a reduction in 6‐month mortality, but we believe our data supports the case that all 4 of the study drugs be considered for each patient undergoing vascular surgery. It is important to also note that patient baseline risk, which can be difficult to clarify in retrospective cohort studies, will have a large impact on the results of the NNT. Lastly, this study needs to be repeated in a population that includes a greater number of female participants.
The combination exposure of 2 to 3 study drugs: aspirin, beta‐blockers, statins, and ACE inhibitors was consistently associated with decreased 6‐month mortality after vascular surgery, with a high prevalence of ACE inhibitor use, and the combination exposure of all 4 study drugs was marginally associated with decreased mortality. Consideration for the individual patient undergoing vascular surgery should include whether or not the patient may benefit from these 4 drugs. Further research with prospective and randomized studies is needed to clarify the optimum timing of these drugs and their combination efficacy in vascular surgery patients with attention to patient‐specific risk.
Acknowledgements
The authors thank Martha S. Gerrity, MD, PhD, Portland VA Medical Center, Portland, Oregon, for comments on an earlier version of the manuscript.
- ,,, et al.Postoperative and late survival outcomes after major amputation: findings from the Department of Veterans Affairs National Surgical Quality Improvement Program.Surgery.2001;130(1):21–29.
- ,,,.Perioperative‐ and long‐term mortality rates after major vascular surgery: the relationship to preoperative testing in the Medicare population.Anesth Analg.1999;89(4):849–855.
- ,,, et al.Women have increased risk of perioperative myocardial infarction and higher long‐term mortality rates after lower extremity arterial bypass grafting.J Vasc Surg.1999;29(5):807–812; discussion 12‐13.
- ,,,,,.The influence of perioperative myocardial infarction on long‐term prognosis following elective vascular surgery.Chest.1998;113(3):681–686.
- ,,,,,.Association of perioperative myocardial ischemia with cardiac morbidity and mortality in men undergoing noncardiac surgery. The Study of Perioperative Ischemia Research Group.N Engl J Med.1990;323(26):1781–1788.
- ,,, et al.Perioperative myocardial ischemia in patients undergoing noncardiac surgeryI: Incidence and severity during the 4 day perioperative period. The Study of Perioperative Ischemia (SPI) Research Group.J Am Coll Cardiol.1991;17(4):843–850.
- ,,,,.Perioperative myocardial ischemia in patients undergoing noncardiac surgeryII: Incidence and severity during the 1st week after surgery. The Study of Perioperative Ischemia (SPI) Research Group.J Am Coll Cardiol.1991;17(4):851–857.
- ,,.Association of ambulatory use of statins and beta‐blockers with long‐term mortality after vascular surgery.J Hosp Med.2007;2(4):241–252.
- ,,, et al.Reduction in cardiovascular events after vascular surgery with atorvastatin: a randomized trial.J Vasc Surg.2004;39(5):967–975; discussion 75‐76.
- ,,,.Effect of atenolol on mortality and cardiovascular morbidity after noncardiac surgery. Multicenter Study of Perioperative Ischemia Research Group.N Engl J Med.1996;335(23):1713–1720.
- ,,, et al.Statins are associated with a reduced incidence of perioperative mortality in patients undergoing major noncardiac vascular surgery.Circulation.2003;107(14):1848–1851.
- ,,, et al.The effect of bisoprolol on perioperative mortality and myocardial infarction in high‐risk patients undergoing vascular surgery. Dutch Echocardiographic Cardiac Risk Evaluation Applying Stress Echocardiography Study Group.N Engl J Med.1999;341(24):1789–1794.
- ,,, et al.Prophylactic atenolol reduces postoperative myocardial ischemia. McSPI Research Group.Anesthesiology.1998;88(1):7–17.
- ,,,,,.The effect of preoperative statin therapy on cardiovascular outcomes in patients undergoing infrainguinal vascular surgery.Int J Cardiol.2005;104(3):264–268.
- ,,,,.The effects of perioperative beta‐blockade: results of the Metoprolol after Vascular Surgery (MaVS) study, a randomized controlled trial.Am Heart J.2006;152(5):983–990.
- ,,,,.Perioperative beta‐blockade (POBBLE) for patients undergoing infrarenal vascular surgery: results of a randomized double‐blind controlled trial.J Vasc Surg.2005;41(4):602–609.
- ,,, et al.Effects of extended‐release metoprolol succinate in patients undergoing non‐cardiac surgery (POISE trial): a randomised controlled trial.Lancet.2008;371(9627):1839–1847.
- ,,,,,.Impact of combination evidence‐based medical therapy on mortality in patients with acute coronary syndromes.Circulation.2004;109(6):745–749.
- ,,, et al.Outcomes associated with the use of secondary prevention medications after coronary artery bypass graft surgery.Ann Thorac Surg.2007;83(3):993–1001.
- ,,, et al.Coronary‐artery revascularization before elective major vascular surgery.N Engl J Med.2004;351(27):2795–2804.
- ,,, et al.Derivation and prospective validation of a simple index for prediction of cardiac risk of major noncardiac surgery.Circulation.1999;100(10):1043–1049.
- ,,.Alpha‐2 adrenergic agonists to prevent perioperative cardiovascular complications: a meta‐analysis.Am J Med.2003;114(9):742–752.
- ,,,.Comparison of logistic regression versus propensity score when the number of events is low and there are multiple confounders.Am J Epidemiol.2003;158(3):280–287.
- .Propensity score methods for bias reduction in the comparison of a treatment to a non‐randomized control group.Stat Med.1998;17(19):2265–2281.
- .Aspirin and mortality from coronary bypass surgery.N Engl J Med.2002;347(17):1309–1317.
- ,,,.Systematic review of randomized controlled trials of aspirin and oral anticoagulants in the prevention of graft occlusion and ischemic events after infrainguinal bypass surgery.J Vasc Surg.1999;30(4):701–709.
- ,,, et al.Effect of perioperative beta blockade in patients with diabetes undergoing major non‐cardiac surgery: randomised placebo controlled, blinded multicentre trial.Br Med J (Clin Res Ed).2006;332(7556):1482.
- ,,, et al.ACC/AHA 2007 Guidelines on perioperative cardiovascular evaluation and care for noncardiac surgery: executive summary: a report of the American College of Cardiology/American Heart Association Task Force on Practice Guidelines (Writing Committee to Revise the 2002 Guidelines on Perioperative Cardiovascular Evaluation for Noncardiac Surgery): developed in collaboration with the American Society of Echocardiography, American Society of Nuclear Cardiology, Heart Rhythm Society, Society of Cardiovascular Anesthesiologists, Society for Cardiovascular Angiography and Interventions, Society for Vascular Medicine and Biology, and Society for Vascular Surgery.Circulation.2007;116(17):1971–1996.
- ,,, et al.High‐dose beta‐blockers and tight heart rate control reduce myocardial ischemia and troponin T release in vascular surgery patients.Circulation.2006;114(1 suppl):I344–I349.
- ,,, et al.Should major vascular surgery be delayed because of preoperative cardiac testing in intermediate‐risk patients receiving beta‐blocker therapy with tight heart rate control?J Am Coll Cardiol.2006;48(5):964–969.
- ,,,,,.Effects of an angiotensin‐converting‐enzyme inhibitor, ramipril, on cardiovascular events in high‐risk patients. The Heart Outcomes Prevention Evaluation Study Investigators.N Engl J Med.2000;342(3):145–153.
- ,,,,.The hemodynamic effects of anesthetic induction in vascular surgical patients chronically treated with angiotensin II receptor antagonists.Anesth Analg.1999;89(6):1388–1392.
- ,,,,,.Hemodynamic effects of anesthesia in patients chronically treated with angiotensin‐converting enzyme inhibitors.Anesth Analg.1992;74(6):805–808.
- ,,, et al.Angiotensin system inhibitors in a general surgical population.Anesth Analg.2005;100(3):636–644.
- ,,, et al.Influence of chronic angiotensin‐converting enzyme inhibition on anesthetic induction.Anesthesiology.1994;81(2):299–307.
- ,.Preoperative administration of angiotensin‐converting enzyme inhibitors.Anaesthesist.2007;56(6):557–561.
- ,,, et al.ACC/AHA 2005 Practice guidelines for the management of patients with peripheral arterial disease (lower extremity, renal, mesenteric, and abdominal aortic): executive summarya collaborative report from the American Association for Vascular Surgery/Society for Vascular Surgery, Society for Cardiovascular Angiography and Interventions, Society for Vascular Medicine and Biology, Society of Interventional Radiology, and the ACC/AHA Task Force on Practice Guidelines (Writing committee to develop guidelines for the management of patients with peripheral arterial disease).Circulation.2006;113(11):1474–1547.
- ,,, et al.AHA/ACC guidelines for secondary prevention for patients with coronary and other atherosclerotic vascular disease: 2006 update: endorsed by the National Heart, Lung, and Blood Institute.Circulation.2006;113(19):2363–2372.
- ,,,,,.Preoperative serum albumin level as a predictor of operative mortality and morbidity: results from the National VA Surgical Risk Study.Arch Surg.1999;134(1):36–42.
- ,,, et al.Postoperative and late survival outcomes after major amputation: findings from the Department of Veterans Affairs National Surgical Quality Improvement Program.Surgery.2001;130(1):21–29.
- ,,,.Perioperative‐ and long‐term mortality rates after major vascular surgery: the relationship to preoperative testing in the Medicare population.Anesth Analg.1999;89(4):849–855.
- ,,, et al.Women have increased risk of perioperative myocardial infarction and higher long‐term mortality rates after lower extremity arterial bypass grafting.J Vasc Surg.1999;29(5):807–812; discussion 12‐13.
- ,,,,,.The influence of perioperative myocardial infarction on long‐term prognosis following elective vascular surgery.Chest.1998;113(3):681–686.
- ,,,,,.Association of perioperative myocardial ischemia with cardiac morbidity and mortality in men undergoing noncardiac surgery. The Study of Perioperative Ischemia Research Group.N Engl J Med.1990;323(26):1781–1788.
- ,,, et al.Perioperative myocardial ischemia in patients undergoing noncardiac surgeryI: Incidence and severity during the 4 day perioperative period. The Study of Perioperative Ischemia (SPI) Research Group.J Am Coll Cardiol.1991;17(4):843–850.
- ,,,,.Perioperative myocardial ischemia in patients undergoing noncardiac surgeryII: Incidence and severity during the 1st week after surgery. The Study of Perioperative Ischemia (SPI) Research Group.J Am Coll Cardiol.1991;17(4):851–857.
- ,,.Association of ambulatory use of statins and beta‐blockers with long‐term mortality after vascular surgery.J Hosp Med.2007;2(4):241–252.
- ,,, et al.Reduction in cardiovascular events after vascular surgery with atorvastatin: a randomized trial.J Vasc Surg.2004;39(5):967–975; discussion 75‐76.
- ,,,.Effect of atenolol on mortality and cardiovascular morbidity after noncardiac surgery. Multicenter Study of Perioperative Ischemia Research Group.N Engl J Med.1996;335(23):1713–1720.
- ,,, et al.Statins are associated with a reduced incidence of perioperative mortality in patients undergoing major noncardiac vascular surgery.Circulation.2003;107(14):1848–1851.
- ,,, et al.The effect of bisoprolol on perioperative mortality and myocardial infarction in high‐risk patients undergoing vascular surgery. Dutch Echocardiographic Cardiac Risk Evaluation Applying Stress Echocardiography Study Group.N Engl J Med.1999;341(24):1789–1794.
- ,,, et al.Prophylactic atenolol reduces postoperative myocardial ischemia. McSPI Research Group.Anesthesiology.1998;88(1):7–17.
- ,,,,,.The effect of preoperative statin therapy on cardiovascular outcomes in patients undergoing infrainguinal vascular surgery.Int J Cardiol.2005;104(3):264–268.
- ,,,,.The effects of perioperative beta‐blockade: results of the Metoprolol after Vascular Surgery (MaVS) study, a randomized controlled trial.Am Heart J.2006;152(5):983–990.
- ,,,,.Perioperative beta‐blockade (POBBLE) for patients undergoing infrarenal vascular surgery: results of a randomized double‐blind controlled trial.J Vasc Surg.2005;41(4):602–609.
- ,,, et al.Effects of extended‐release metoprolol succinate in patients undergoing non‐cardiac surgery (POISE trial): a randomised controlled trial.Lancet.2008;371(9627):1839–1847.
- ,,,,,.Impact of combination evidence‐based medical therapy on mortality in patients with acute coronary syndromes.Circulation.2004;109(6):745–749.
- ,,, et al.Outcomes associated with the use of secondary prevention medications after coronary artery bypass graft surgery.Ann Thorac Surg.2007;83(3):993–1001.
- ,,, et al.Coronary‐artery revascularization before elective major vascular surgery.N Engl J Med.2004;351(27):2795–2804.
- ,,, et al.Derivation and prospective validation of a simple index for prediction of cardiac risk of major noncardiac surgery.Circulation.1999;100(10):1043–1049.
- ,,.Alpha‐2 adrenergic agonists to prevent perioperative cardiovascular complications: a meta‐analysis.Am J Med.2003;114(9):742–752.
- ,,,.Comparison of logistic regression versus propensity score when the number of events is low and there are multiple confounders.Am J Epidemiol.2003;158(3):280–287.
- .Propensity score methods for bias reduction in the comparison of a treatment to a non‐randomized control group.Stat Med.1998;17(19):2265–2281.
- .Aspirin and mortality from coronary bypass surgery.N Engl J Med.2002;347(17):1309–1317.
- ,,,.Systematic review of randomized controlled trials of aspirin and oral anticoagulants in the prevention of graft occlusion and ischemic events after infrainguinal bypass surgery.J Vasc Surg.1999;30(4):701–709.
- ,,, et al.Effect of perioperative beta blockade in patients with diabetes undergoing major non‐cardiac surgery: randomised placebo controlled, blinded multicentre trial.Br Med J (Clin Res Ed).2006;332(7556):1482.
- ,,, et al.ACC/AHA 2007 Guidelines on perioperative cardiovascular evaluation and care for noncardiac surgery: executive summary: a report of the American College of Cardiology/American Heart Association Task Force on Practice Guidelines (Writing Committee to Revise the 2002 Guidelines on Perioperative Cardiovascular Evaluation for Noncardiac Surgery): developed in collaboration with the American Society of Echocardiography, American Society of Nuclear Cardiology, Heart Rhythm Society, Society of Cardiovascular Anesthesiologists, Society for Cardiovascular Angiography and Interventions, Society for Vascular Medicine and Biology, and Society for Vascular Surgery.Circulation.2007;116(17):1971–1996.
- ,,, et al.High‐dose beta‐blockers and tight heart rate control reduce myocardial ischemia and troponin T release in vascular surgery patients.Circulation.2006;114(1 suppl):I344–I349.
- ,,, et al.Should major vascular surgery be delayed because of preoperative cardiac testing in intermediate‐risk patients receiving beta‐blocker therapy with tight heart rate control?J Am Coll Cardiol.2006;48(5):964–969.
- ,,,,,.Effects of an angiotensin‐converting‐enzyme inhibitor, ramipril, on cardiovascular events in high‐risk patients. The Heart Outcomes Prevention Evaluation Study Investigators.N Engl J Med.2000;342(3):145–153.
- ,,,,.The hemodynamic effects of anesthetic induction in vascular surgical patients chronically treated with angiotensin II receptor antagonists.Anesth Analg.1999;89(6):1388–1392.
- ,,,,,.Hemodynamic effects of anesthesia in patients chronically treated with angiotensin‐converting enzyme inhibitors.Anesth Analg.1992;74(6):805–808.
- ,,, et al.Angiotensin system inhibitors in a general surgical population.Anesth Analg.2005;100(3):636–644.
- ,,, et al.Influence of chronic angiotensin‐converting enzyme inhibition on anesthetic induction.Anesthesiology.1994;81(2):299–307.
- ,.Preoperative administration of angiotensin‐converting enzyme inhibitors.Anaesthesist.2007;56(6):557–561.
- ,,, et al.ACC/AHA 2005 Practice guidelines for the management of patients with peripheral arterial disease (lower extremity, renal, mesenteric, and abdominal aortic): executive summarya collaborative report from the American Association for Vascular Surgery/Society for Vascular Surgery, Society for Cardiovascular Angiography and Interventions, Society for Vascular Medicine and Biology, Society of Interventional Radiology, and the ACC/AHA Task Force on Practice Guidelines (Writing committee to develop guidelines for the management of patients with peripheral arterial disease).Circulation.2006;113(11):1474–1547.
- ,,, et al.AHA/ACC guidelines for secondary prevention for patients with coronary and other atherosclerotic vascular disease: 2006 update: endorsed by the National Heart, Lung, and Blood Institute.Circulation.2006;113(19):2363–2372.
- ,,,,,.Preoperative serum albumin level as a predictor of operative mortality and morbidity: results from the National VA Surgical Risk Study.Arch Surg.1999;134(1):36–42.
Copyright © 2010 Society of Hospital Medicine
Sigmoid Volvulus
A 63‐year‐old man with multiple medical problems was transferred from a nursing home to the emergency room with progressively worsening diffuse abdominal pain of 3 days' duration. His vital signs were significant for heart rate of 94 beats per minute, blood pressure of 126/84 mmHg, respiratory rate of 20 breaths per minute, and oxygen saturation of 98% on room air. Abdominal examination showed diffuse tenderness in all quadrants. Active bowel sounds were heard; guarding or rigidity was absent. Examination of respiratory and cardiovascular system was unremarkable. His laboratory tests showed leukocytosis with left shift. Topogram done for planning computed tomography (CT) scan of abdomen (Figure 1) showed the following findings:
-
The dilated sigmoid loops (outlined by linear black arrows) have closely apposed medial walls (arrowheads), giving the appearance of a coffee bean. In addition, the apex of the loop is seen under the left hemidiaphragm.
-
The dilated sigmoid loop is seen to overlap the descending colon (the left flank overlap sign). The lateral margin of descending colon is shown with bold white arrows.
-
The level of convergence of the 2 limbs of the loop is seen to lie below the lumbosacral junction and to the left of the midline (inferior convergence sign, shown by the bold black arrow).
-
The small bowel and large bowel loops are dilated due to distal obstruction and are seen overlapping with the distended sigmoid colon.
-
The rectal gas is not visualized.
These features were suggestive of sigmoid volvulus.
Patients with sigmoid volvulus are often in the sixth to eighth decades of life and frequently have concomitant chronic illnesses, such as cardiac, pulmonary, and renal disease, that significantly influence their outcome.14 Males develop sigmoid volvulus more commonly than do females. In a large series of patients with sigmoid volvulus, 30% had a history of psychiatric disease and 13% were institutionalized at the time of diagnosis.4 Abdominal tenderness is present in less than one‐third of patients with volvulus, and severe pain or signs of peritonitis suggest impending or actual colonic necrosis and perforation.
Plain radiograph of the abdomen is usually diagnostic and reveals a dilated ahaustral sigmoid colon with features of closed‐loop obstruction (bent inner‐tube appearance). The apex of the loop usually extends above the T10 vertebra. The various signs described for sigmoid volvulus on plain radiograph and the sensitivity and specificity for these are given in Table 1.5 A diagnosis of sigmoid volvulus can be made with abdominal radiographs alone in as many as 85% of instances.3 A CT scan helps detect the changes of bowel ischemia and can confirm or provide an alternate diagnosis. A single contrast barium enema examination may be done if signs of bowel ischemia or perforation are absent. This may reveal a mucosal spiral pattern or bird's beak appearance (due to abrupt termination of the barium column) at the site of twist.
| Sign | Sensitivity (%) | Specificity (%) |
|---|---|---|
| Distended ahaustral loop | 94 | 20 |
| Apex under left hemidiaphragm | 88 | 100 |
| Apex of loop above T10 vertebra | 71 | 80 |
| Inferior convergence on the left | 53 | 100 |
| Fulcrum below lumbosacral angle | 65 | 80 |
| Approximation of the medial walls of the sigmoid loop | 88 | 80 |
| Left flank overlap sign | 59 | 100 |
In patients with abdominal films most consistent with a sigmoid volvulus, initial rigid or flexible proctosigmoidoscopy may allow prompt decompression of the volvulus. Early recognition and treatment are necessary to prevent mortality. Placement of a rectal tube for 48 hours may minimize the possibility of early recurrence. Successful reduction of sigmoid volvulus also has been reported with colonoscopy; however, the procedure must be performed carefully with minimal insufflation of air (or preferably carbon dioxide) to minimize the risk of perforation of the distended, inflamed bowel. Endoscopic reduction of sigmoid volvulus alone is associated with a recurrence rate of 25% to 50%.1, 2, 6, 7 Hence, elective sigmoid resection and coloproctostomy, or in medically compromised patients, end colostomy, should follow proctoscopic decompression and mechanical preparation of the bowel. Recurrence rates with this approach are 3% to 6%.1, 2, 7 Patients requiring emergent laparotomy for strangulated sigmoid volvulus require sigmoid resection with end colostomy and a Hartmann pouch. The patient's volvulus was successfully decompressed with colonoscopy. He was offered elective sigmoid resection and coloproctostomy as a definitive therapy, which he declined.
- ,,, et al.Sigmoid volvulus in Department of Veterans Affairs Medical Centers.Dis Colon Rectum.2000;43:414–418.
- .Review of sigmoid volvulus: history and results of treatment.Dis Colon Rectum.1982;25:494–501.
- ,,, et al.Volvulus of the colon: incidence and mortality.Ann Surg.1985;202:83–92.
- .Review of sigmoid volvulus: clinical patterns and pathogenesis.Dis Colon Rectum.1982;25:823–830.
- ,,,.Significant plain film findings in sigmoid volvulus.Clin Radiol.1994;49:317–319.
- ,.Volvulus of the sigmoid colon.Ann Surg.1973;177:527–537.
- ,,.Endoscopy in colonic volvulus.Ann Surg.1987;206:1–7.
A 63‐year‐old man with multiple medical problems was transferred from a nursing home to the emergency room with progressively worsening diffuse abdominal pain of 3 days' duration. His vital signs were significant for heart rate of 94 beats per minute, blood pressure of 126/84 mmHg, respiratory rate of 20 breaths per minute, and oxygen saturation of 98% on room air. Abdominal examination showed diffuse tenderness in all quadrants. Active bowel sounds were heard; guarding or rigidity was absent. Examination of respiratory and cardiovascular system was unremarkable. His laboratory tests showed leukocytosis with left shift. Topogram done for planning computed tomography (CT) scan of abdomen (Figure 1) showed the following findings:
-
The dilated sigmoid loops (outlined by linear black arrows) have closely apposed medial walls (arrowheads), giving the appearance of a coffee bean. In addition, the apex of the loop is seen under the left hemidiaphragm.
-
The dilated sigmoid loop is seen to overlap the descending colon (the left flank overlap sign). The lateral margin of descending colon is shown with bold white arrows.
-
The level of convergence of the 2 limbs of the loop is seen to lie below the lumbosacral junction and to the left of the midline (inferior convergence sign, shown by the bold black arrow).
-
The small bowel and large bowel loops are dilated due to distal obstruction and are seen overlapping with the distended sigmoid colon.
-
The rectal gas is not visualized.
These features were suggestive of sigmoid volvulus.
Patients with sigmoid volvulus are often in the sixth to eighth decades of life and frequently have concomitant chronic illnesses, such as cardiac, pulmonary, and renal disease, that significantly influence their outcome.14 Males develop sigmoid volvulus more commonly than do females. In a large series of patients with sigmoid volvulus, 30% had a history of psychiatric disease and 13% were institutionalized at the time of diagnosis.4 Abdominal tenderness is present in less than one‐third of patients with volvulus, and severe pain or signs of peritonitis suggest impending or actual colonic necrosis and perforation.
Plain radiograph of the abdomen is usually diagnostic and reveals a dilated ahaustral sigmoid colon with features of closed‐loop obstruction (bent inner‐tube appearance). The apex of the loop usually extends above the T10 vertebra. The various signs described for sigmoid volvulus on plain radiograph and the sensitivity and specificity for these are given in Table 1.5 A diagnosis of sigmoid volvulus can be made with abdominal radiographs alone in as many as 85% of instances.3 A CT scan helps detect the changes of bowel ischemia and can confirm or provide an alternate diagnosis. A single contrast barium enema examination may be done if signs of bowel ischemia or perforation are absent. This may reveal a mucosal spiral pattern or bird's beak appearance (due to abrupt termination of the barium column) at the site of twist.
| Sign | Sensitivity (%) | Specificity (%) |
|---|---|---|
| Distended ahaustral loop | 94 | 20 |
| Apex under left hemidiaphragm | 88 | 100 |
| Apex of loop above T10 vertebra | 71 | 80 |
| Inferior convergence on the left | 53 | 100 |
| Fulcrum below lumbosacral angle | 65 | 80 |
| Approximation of the medial walls of the sigmoid loop | 88 | 80 |
| Left flank overlap sign | 59 | 100 |
In patients with abdominal films most consistent with a sigmoid volvulus, initial rigid or flexible proctosigmoidoscopy may allow prompt decompression of the volvulus. Early recognition and treatment are necessary to prevent mortality. Placement of a rectal tube for 48 hours may minimize the possibility of early recurrence. Successful reduction of sigmoid volvulus also has been reported with colonoscopy; however, the procedure must be performed carefully with minimal insufflation of air (or preferably carbon dioxide) to minimize the risk of perforation of the distended, inflamed bowel. Endoscopic reduction of sigmoid volvulus alone is associated with a recurrence rate of 25% to 50%.1, 2, 6, 7 Hence, elective sigmoid resection and coloproctostomy, or in medically compromised patients, end colostomy, should follow proctoscopic decompression and mechanical preparation of the bowel. Recurrence rates with this approach are 3% to 6%.1, 2, 7 Patients requiring emergent laparotomy for strangulated sigmoid volvulus require sigmoid resection with end colostomy and a Hartmann pouch. The patient's volvulus was successfully decompressed with colonoscopy. He was offered elective sigmoid resection and coloproctostomy as a definitive therapy, which he declined.
A 63‐year‐old man with multiple medical problems was transferred from a nursing home to the emergency room with progressively worsening diffuse abdominal pain of 3 days' duration. His vital signs were significant for heart rate of 94 beats per minute, blood pressure of 126/84 mmHg, respiratory rate of 20 breaths per minute, and oxygen saturation of 98% on room air. Abdominal examination showed diffuse tenderness in all quadrants. Active bowel sounds were heard; guarding or rigidity was absent. Examination of respiratory and cardiovascular system was unremarkable. His laboratory tests showed leukocytosis with left shift. Topogram done for planning computed tomography (CT) scan of abdomen (Figure 1) showed the following findings:
-
The dilated sigmoid loops (outlined by linear black arrows) have closely apposed medial walls (arrowheads), giving the appearance of a coffee bean. In addition, the apex of the loop is seen under the left hemidiaphragm.
-
The dilated sigmoid loop is seen to overlap the descending colon (the left flank overlap sign). The lateral margin of descending colon is shown with bold white arrows.
-
The level of convergence of the 2 limbs of the loop is seen to lie below the lumbosacral junction and to the left of the midline (inferior convergence sign, shown by the bold black arrow).
-
The small bowel and large bowel loops are dilated due to distal obstruction and are seen overlapping with the distended sigmoid colon.
-
The rectal gas is not visualized.
These features were suggestive of sigmoid volvulus.
Patients with sigmoid volvulus are often in the sixth to eighth decades of life and frequently have concomitant chronic illnesses, such as cardiac, pulmonary, and renal disease, that significantly influence their outcome.14 Males develop sigmoid volvulus more commonly than do females. In a large series of patients with sigmoid volvulus, 30% had a history of psychiatric disease and 13% were institutionalized at the time of diagnosis.4 Abdominal tenderness is present in less than one‐third of patients with volvulus, and severe pain or signs of peritonitis suggest impending or actual colonic necrosis and perforation.
Plain radiograph of the abdomen is usually diagnostic and reveals a dilated ahaustral sigmoid colon with features of closed‐loop obstruction (bent inner‐tube appearance). The apex of the loop usually extends above the T10 vertebra. The various signs described for sigmoid volvulus on plain radiograph and the sensitivity and specificity for these are given in Table 1.5 A diagnosis of sigmoid volvulus can be made with abdominal radiographs alone in as many as 85% of instances.3 A CT scan helps detect the changes of bowel ischemia and can confirm or provide an alternate diagnosis. A single contrast barium enema examination may be done if signs of bowel ischemia or perforation are absent. This may reveal a mucosal spiral pattern or bird's beak appearance (due to abrupt termination of the barium column) at the site of twist.
| Sign | Sensitivity (%) | Specificity (%) |
|---|---|---|
| Distended ahaustral loop | 94 | 20 |
| Apex under left hemidiaphragm | 88 | 100 |
| Apex of loop above T10 vertebra | 71 | 80 |
| Inferior convergence on the left | 53 | 100 |
| Fulcrum below lumbosacral angle | 65 | 80 |
| Approximation of the medial walls of the sigmoid loop | 88 | 80 |
| Left flank overlap sign | 59 | 100 |
In patients with abdominal films most consistent with a sigmoid volvulus, initial rigid or flexible proctosigmoidoscopy may allow prompt decompression of the volvulus. Early recognition and treatment are necessary to prevent mortality. Placement of a rectal tube for 48 hours may minimize the possibility of early recurrence. Successful reduction of sigmoid volvulus also has been reported with colonoscopy; however, the procedure must be performed carefully with minimal insufflation of air (or preferably carbon dioxide) to minimize the risk of perforation of the distended, inflamed bowel. Endoscopic reduction of sigmoid volvulus alone is associated with a recurrence rate of 25% to 50%.1, 2, 6, 7 Hence, elective sigmoid resection and coloproctostomy, or in medically compromised patients, end colostomy, should follow proctoscopic decompression and mechanical preparation of the bowel. Recurrence rates with this approach are 3% to 6%.1, 2, 7 Patients requiring emergent laparotomy for strangulated sigmoid volvulus require sigmoid resection with end colostomy and a Hartmann pouch. The patient's volvulus was successfully decompressed with colonoscopy. He was offered elective sigmoid resection and coloproctostomy as a definitive therapy, which he declined.
- ,,, et al.Sigmoid volvulus in Department of Veterans Affairs Medical Centers.Dis Colon Rectum.2000;43:414–418.
- .Review of sigmoid volvulus: history and results of treatment.Dis Colon Rectum.1982;25:494–501.
- ,,, et al.Volvulus of the colon: incidence and mortality.Ann Surg.1985;202:83–92.
- .Review of sigmoid volvulus: clinical patterns and pathogenesis.Dis Colon Rectum.1982;25:823–830.
- ,,,.Significant plain film findings in sigmoid volvulus.Clin Radiol.1994;49:317–319.
- ,.Volvulus of the sigmoid colon.Ann Surg.1973;177:527–537.
- ,,.Endoscopy in colonic volvulus.Ann Surg.1987;206:1–7.
- ,,, et al.Sigmoid volvulus in Department of Veterans Affairs Medical Centers.Dis Colon Rectum.2000;43:414–418.
- .Review of sigmoid volvulus: history and results of treatment.Dis Colon Rectum.1982;25:494–501.
- ,,, et al.Volvulus of the colon: incidence and mortality.Ann Surg.1985;202:83–92.
- .Review of sigmoid volvulus: clinical patterns and pathogenesis.Dis Colon Rectum.1982;25:823–830.
- ,,,.Significant plain film findings in sigmoid volvulus.Clin Radiol.1994;49:317–319.
- ,.Volvulus of the sigmoid colon.Ann Surg.1973;177:527–537.
- ,,.Endoscopy in colonic volvulus.Ann Surg.1987;206:1–7.
More Than a Plantar Wart
A 56‐year‐old man with a 1‐year history of a verrucous nodule on his left foot presented to our department due to the unexpected growth. He was previously diagnosed with a plantar wart so underwent salicylic ointment application, liquid‐nitrogen cryotherapy and electrocoagulation, with no improvement of the condition.
Clinical examination revealed a 22‐mm flesh‐colored, centrally hypopigmented and ulcerated, exophytic nodule, with an adjacent 5 4 mm pink papule with telangiectasia (Figure 1A and B).

Histological examination established the diagnosis of ulcerated amelanotic malignant melanoma (Clark's level IV, Breslow's thickness of 3 mm) with a satellite nodule. Radical inguinal lymph node dissection yielded a negative result. Total‐body computed tomographic scan was unremarkable. One‐year follow‐up revealed no metastatic disease.
Melanoma of the foot accounts for 3% to 15% of all cutaneous melanoma. In acral skin, melanomas tend to have unusual clinical appearances. Amelanotic variants may masquerade as several benign hyperkeratotic dermatoses (warts, calluses, fungal disorders, foreign bodies, moles, keratoacanthomas, hematomas) increasing misdiagnosis and inadequate treatment rates, with a poorer patient outcome.1 Pedal lesions require close observation and biopsy when diagnostic uncertainty exists or when therapeutic interventions fail.
- ,,,,,.Acral lentiginous melanoma mimicking benign disease: the Emory experience.J Am Acad Dermatol.2003;48:183–188.
A 56‐year‐old man with a 1‐year history of a verrucous nodule on his left foot presented to our department due to the unexpected growth. He was previously diagnosed with a plantar wart so underwent salicylic ointment application, liquid‐nitrogen cryotherapy and electrocoagulation, with no improvement of the condition.
Clinical examination revealed a 22‐mm flesh‐colored, centrally hypopigmented and ulcerated, exophytic nodule, with an adjacent 5 4 mm pink papule with telangiectasia (Figure 1A and B).
Histological examination established the diagnosis of ulcerated amelanotic malignant melanoma (Clark's level IV, Breslow's thickness of 3 mm) with a satellite nodule. Radical inguinal lymph node dissection yielded a negative result. Total‐body computed tomographic scan was unremarkable. One‐year follow‐up revealed no metastatic disease.
Melanoma of the foot accounts for 3% to 15% of all cutaneous melanoma. In acral skin, melanomas tend to have unusual clinical appearances. Amelanotic variants may masquerade as several benign hyperkeratotic dermatoses (warts, calluses, fungal disorders, foreign bodies, moles, keratoacanthomas, hematomas) increasing misdiagnosis and inadequate treatment rates, with a poorer patient outcome.1 Pedal lesions require close observation and biopsy when diagnostic uncertainty exists or when therapeutic interventions fail.
A 56‐year‐old man with a 1‐year history of a verrucous nodule on his left foot presented to our department due to the unexpected growth. He was previously diagnosed with a plantar wart so underwent salicylic ointment application, liquid‐nitrogen cryotherapy and electrocoagulation, with no improvement of the condition.
Clinical examination revealed a 22‐mm flesh‐colored, centrally hypopigmented and ulcerated, exophytic nodule, with an adjacent 5 4 mm pink papule with telangiectasia (Figure 1A and B).
Histological examination established the diagnosis of ulcerated amelanotic malignant melanoma (Clark's level IV, Breslow's thickness of 3 mm) with a satellite nodule. Radical inguinal lymph node dissection yielded a negative result. Total‐body computed tomographic scan was unremarkable. One‐year follow‐up revealed no metastatic disease.
Melanoma of the foot accounts for 3% to 15% of all cutaneous melanoma. In acral skin, melanomas tend to have unusual clinical appearances. Amelanotic variants may masquerade as several benign hyperkeratotic dermatoses (warts, calluses, fungal disorders, foreign bodies, moles, keratoacanthomas, hematomas) increasing misdiagnosis and inadequate treatment rates, with a poorer patient outcome.1 Pedal lesions require close observation and biopsy when diagnostic uncertainty exists or when therapeutic interventions fail.
- ,,,,,.Acral lentiginous melanoma mimicking benign disease: the Emory experience.J Am Acad Dermatol.2003;48:183–188.
- ,,,,,.Acral lentiginous melanoma mimicking benign disease: the Emory experience.J Am Acad Dermatol.2003;48:183–188.
Pneumothorax in a Patient With COPD
A 53‐year‐old man with a history of heavy tobacco use presented with shortness of breath. Eight days prior to his presentation he was diagnosed with multiple rib fractures after suffering an assault. Since then he had developed dyspnea and a nonproductive cough. A chest x‐ray revealed a large pneumothorax on the right with approximately 80% volume loss (arrow, Figure 1).
Tube thoracostomy was performed. Repeat chest x‐ray showed that the pneumothorax had resolved, revealing a consolidation likely caused by either reexpansion pulmonary edema1, 2 or, given its location in the superior segment of the right lower lobe, aspiration pneumonia (thin arrow, Figure 2). Also seen in the x‐ray is an old scar (thick arrow, Figure 2) and apical bullous changes with hyperinflated lungs suggestive of chronic obstructive pulmonary disease (COPD).
DISCUSSION
Pneumothorax is a common complication of blunt trauma and rib fractures.3 While the patient did not have a preceding diagnosis of COPD, his extensive smoking history and his radiographic changes are consistent with COPD, which is a risk factor for pneumothroax. Secondary pneumothorax is defined as pneumothorax that occurs as a complication of underlying lung disease and is most commonly associated with COPD,4 with rupturing of apical blebs as the proposed mechanism. This patient suffered a pneumothorax due to trauma, but given his COPD he is at increased risk for developing spontaneous pneumothorax in the future.
- .Reexpansion pulmonary edema.Ann Thorac Cardiovasc Surg.2008;14(4):205–209.
- ,.Images in clinical medicine. Reexpansion pulmonary edema after treatment of pneumothorax.N Engl J Med.2006;354(19):2046.
- ,,.Profile of chest trauma in a level I trauma center.J Trauma.2004;57(3):576–581.
- ,,,.Factors related to recurrence of spontaneous pneumothorax.Respirology.2005;10(3):378–384.
A 53‐year‐old man with a history of heavy tobacco use presented with shortness of breath. Eight days prior to his presentation he was diagnosed with multiple rib fractures after suffering an assault. Since then he had developed dyspnea and a nonproductive cough. A chest x‐ray revealed a large pneumothorax on the right with approximately 80% volume loss (arrow, Figure 1).
Tube thoracostomy was performed. Repeat chest x‐ray showed that the pneumothorax had resolved, revealing a consolidation likely caused by either reexpansion pulmonary edema1, 2 or, given its location in the superior segment of the right lower lobe, aspiration pneumonia (thin arrow, Figure 2). Also seen in the x‐ray is an old scar (thick arrow, Figure 2) and apical bullous changes with hyperinflated lungs suggestive of chronic obstructive pulmonary disease (COPD).
DISCUSSION
Pneumothorax is a common complication of blunt trauma and rib fractures.3 While the patient did not have a preceding diagnosis of COPD, his extensive smoking history and his radiographic changes are consistent with COPD, which is a risk factor for pneumothroax. Secondary pneumothorax is defined as pneumothorax that occurs as a complication of underlying lung disease and is most commonly associated with COPD,4 with rupturing of apical blebs as the proposed mechanism. This patient suffered a pneumothorax due to trauma, but given his COPD he is at increased risk for developing spontaneous pneumothorax in the future.
A 53‐year‐old man with a history of heavy tobacco use presented with shortness of breath. Eight days prior to his presentation he was diagnosed with multiple rib fractures after suffering an assault. Since then he had developed dyspnea and a nonproductive cough. A chest x‐ray revealed a large pneumothorax on the right with approximately 80% volume loss (arrow, Figure 1).
Tube thoracostomy was performed. Repeat chest x‐ray showed that the pneumothorax had resolved, revealing a consolidation likely caused by either reexpansion pulmonary edema1, 2 or, given its location in the superior segment of the right lower lobe, aspiration pneumonia (thin arrow, Figure 2). Also seen in the x‐ray is an old scar (thick arrow, Figure 2) and apical bullous changes with hyperinflated lungs suggestive of chronic obstructive pulmonary disease (COPD).
DISCUSSION
Pneumothorax is a common complication of blunt trauma and rib fractures.3 While the patient did not have a preceding diagnosis of COPD, his extensive smoking history and his radiographic changes are consistent with COPD, which is a risk factor for pneumothroax. Secondary pneumothorax is defined as pneumothorax that occurs as a complication of underlying lung disease and is most commonly associated with COPD,4 with rupturing of apical blebs as the proposed mechanism. This patient suffered a pneumothorax due to trauma, but given his COPD he is at increased risk for developing spontaneous pneumothorax in the future.
- .Reexpansion pulmonary edema.Ann Thorac Cardiovasc Surg.2008;14(4):205–209.
- ,.Images in clinical medicine. Reexpansion pulmonary edema after treatment of pneumothorax.N Engl J Med.2006;354(19):2046.
- ,,.Profile of chest trauma in a level I trauma center.J Trauma.2004;57(3):576–581.
- ,,,.Factors related to recurrence of spontaneous pneumothorax.Respirology.2005;10(3):378–384.
- .Reexpansion pulmonary edema.Ann Thorac Cardiovasc Surg.2008;14(4):205–209.
- ,.Images in clinical medicine. Reexpansion pulmonary edema after treatment of pneumothorax.N Engl J Med.2006;354(19):2046.
- ,,.Profile of chest trauma in a level I trauma center.J Trauma.2004;57(3):576–581.
- ,,,.Factors related to recurrence of spontaneous pneumothorax.Respirology.2005;10(3):378–384.
Positional Atrial Flutter?
A 68‐year‐old man with a history of congestive heart failure and hypertension presented to the emergency department with fatigue and dyspnea of 3 weeks duration. Physical examination was consistent with heart failure. In addition, a right upper extremity resting tremor was noticed. An electrocardiogram (ECG) revealed an atrial flutter with a conduction ratio of 4:1 (Figure 1A). He denied palpitations or a previous history of atrial flutter/fibrillation. Unlike typical atrial flutter, these flutter like waves were distinctly absent in lead III, the only limb lead not connected to the right arm.

While holding the patient's right arm to control the tremor, a second ECG tracing was obtained. As expected the flutter like waves disappeared (Figure 1B). These ECG findings were attributed to the patient's tremor. A neurological consultation established a clinical diagnosis of Parkinson's disease. His congestive heart failure (CHF) was treated with increasing diuretics and appropriate treatment for Parkinson's disease was initiated.
A 68‐year‐old man with a history of congestive heart failure and hypertension presented to the emergency department with fatigue and dyspnea of 3 weeks duration. Physical examination was consistent with heart failure. In addition, a right upper extremity resting tremor was noticed. An electrocardiogram (ECG) revealed an atrial flutter with a conduction ratio of 4:1 (Figure 1A). He denied palpitations or a previous history of atrial flutter/fibrillation. Unlike typical atrial flutter, these flutter like waves were distinctly absent in lead III, the only limb lead not connected to the right arm.
While holding the patient's right arm to control the tremor, a second ECG tracing was obtained. As expected the flutter like waves disappeared (Figure 1B). These ECG findings were attributed to the patient's tremor. A neurological consultation established a clinical diagnosis of Parkinson's disease. His congestive heart failure (CHF) was treated with increasing diuretics and appropriate treatment for Parkinson's disease was initiated.
A 68‐year‐old man with a history of congestive heart failure and hypertension presented to the emergency department with fatigue and dyspnea of 3 weeks duration. Physical examination was consistent with heart failure. In addition, a right upper extremity resting tremor was noticed. An electrocardiogram (ECG) revealed an atrial flutter with a conduction ratio of 4:1 (Figure 1A). He denied palpitations or a previous history of atrial flutter/fibrillation. Unlike typical atrial flutter, these flutter like waves were distinctly absent in lead III, the only limb lead not connected to the right arm.
While holding the patient's right arm to control the tremor, a second ECG tracing was obtained. As expected the flutter like waves disappeared (Figure 1B). These ECG findings were attributed to the patient's tremor. A neurological consultation established a clinical diagnosis of Parkinson's disease. His congestive heart failure (CHF) was treated with increasing diuretics and appropriate treatment for Parkinson's disease was initiated.
Hospitalists and Quality of Care
Quality of care in US hospitals is inconsistent and often below accepted standards.1 This observation has catalyzed a number of performance measurement initiatives intended to publicize gaps and spur quality improvement.2 As the field has evolved, organizational factors such as teaching status, ownership model, nurse staffing levels, and hospital volume have been found to be associated with performance on quality measures.1, 3‐7 Hospitalists represent a more recent change in the organization of inpatient care8 that may impact hospital‐level performance. In fact, most hospitals provide financial support to hospitalists, not only for hopes of improving efficiency, but also for improving quality and safety.9
Only a few single‐site studies have examined the impact of hospitalists on quality of care for common medical conditions (ie, pneumonia, congestive heart failure, and acute myocardial infarction), and each has focused on patient‐level effects. Rifkin et al.10, 11 did not find differences between hospitalists' and nonhospitalists' patients in terms of pneumonia process measures. Roytman et al.12 found hospitalists more frequently prescribed afterload‐reducing agents for congestive heart failure (CHF), but other studies have shown no differences in care quality for heart failure.13, 14 Importantly, no studies have examined the role of hospitalists in the care of patients with acute myocardial infarction (AMI). In addition, studies have not addressed the effect of hospitalists at the hospital level to understand whether hospitalists have broader system‐level effects reflected by overall hospital performance.
We hypothesized that the presence of hospitalists within a hospital would be associated with improvements in hospital‐level adherence to publicly reported quality process measures, and having a greater percentage of patients admitted by hospitalists would be associated with improved performance. To test these hypotheses, we linked data from a statewide census of hospitalists with data collected as part of a hospital quality‐reporting initiative.
Materials and Methods
Study Sites
We examined the performance of 209 hospitals (63% of all 334 non‐federal facilities in California) participating in the California Hospital Assessment and Reporting Taskforce (CHART) at the time of the survey. CHART is a voluntary quality reporting initiative that began publicly reporting hospital quality data in January 2006.
Hospital‐level Organizational, Case‐mix, and Quality Data
Hospital organizational characteristics (eg, bed size) were obtained from publicly available discharge and utilization data sets from the California Office of Statewide Health Planning and Development (OSHPD). We also linked hospital‐level patient‐mix data (eg, race) from these OSHPD files.
We obtained quality of care data from CHART for January 2006 through June 2007, the time period corresponding to the survey. Quality metrics included 16 measures collected by the Center for Medicare and Medicaid Services (www.cms.hhs.gov) and extensively used in quality research.1, 4, 13, 15‐17 Rather than define a single measure, we examined multiple process measures, anticipating differential impacts of hospitalists on various processes of care for AMI, CHF, and pneumonia. Measures were further divided among those that are usually measured upon initial presentation to the hospital and those that are measured throughout the entire hospitalization and discharge. This division reflects the division of care in the hospital, where emergency room physicians are likely to have a more critical role for admission processes.
Survey Process
We surveyed all nonfederal, acute care hospitals in California that participated in CHART.2 We first identified contacts at each site via professional society mailing lists. We then sent web‐based surveys to all with available email addresses and a fax/paper survey to the remainder. We surveyed individuals between October 2006 and April 2007 and repeated the process at intervals of 1 to 3 weeks. For remaining nonrespondents, we placed a direct call unless consent to survey had been specifically refused. We contacted the following persons in sequence: (1) hospital executives or administrative leaders; (2) hospital medicine department leaders; (3) admitting emergency room personnel or medical staff officers; and (4) hospital website information. In the case of multiple responses with disagreement, the hospital/hospitalist leader's response was treated as the primary source. At each step, respondents were asked to answer questions only if they had a direct working knowledge of their hospitalist services.
Survey Data
Our key survey question to all respondents included whether the respondents could confirm their hospitals had at least one hospitalist medicine group. Hospital leaders were also asked to participate in a more comprehensive survey of their organizational and clinical characteristics. Within the comprehensive survey, leaders also provided estimates of the percent of general medical patients admitted by hospitalists. This measure, used in prior surveys of hospital leaders,9 was intended to be an easily understood approximation of the intensity of hospitalist utilization in any given hospital. A more rigorous, direct measure was not feasible due to the complexity of obtaining admission data over such a large, diverse set of hospitals.
Process Performance Measures
AMI measures assessed at admission included aspirin and ‐blocker administration within 24 hours of arrival. AMI measures assessed at discharge included aspirin administration, ‐blocker administration, angiotensin converting enzyme inhibitor (ACE‐I) (or angiotensin receptor blocker [ARB]) administration for left ventricular (LV) dysfunction, and smoking cessation counseling. There were no CHF admission measures. CHF discharge measures included assessment of LV function, the use of an ACE‐I or ARB for LV dysfunction, and smoking cessation counseling. Pneumonia admission measures included the drawing of blood cultures prior to the receipt of antibiotics, timely administration of initial antibiotics (<8 hours), and antibiotics consistent with recommendations. Pneumonia discharge measures included pneumococcal vaccination, flu vaccination, and smoking cessation counseling.
For each performance measure, we quantified the percentage of missed quality opportunities, defined as the number of patients who did not receive a care process divided by the number of eligible patients, multiplied by 100. In addition, we calculated composite scores for admission and discharge measures across each condition. We summed the numerators and denominators of individual performance measures to generate a disease‐specific composite numerator and denominator. Both individual and composite scores were produced using methodology outlined by the Center for Medicare & Medicaid Services.18 In order to retain as representative a sample of hospitals as possible, we calculated composite scores for hospitals that had a minimum of 25 observations in at least 2 of the quality indicators that made up each composite score.
Statistical Analysis
We used chi‐square tests, Student t tests, and Mann‐Whitney tests, where appropriate, to compare hospital‐level characteristics of hospitals that utilized hospitalists vs. those that did not. Similar analyses were performed among the subset of hospitals that utilized hospitalists. Among this subgroup of hospitals, we compared hospital‐level characteristics between hospitals that provided information regarding the percent of patients admitted by hospitalists vs. those who did not provide this information.
We used multivariable, generalized linear regression models to assess the relationship between having at least 1 hospitalist group and the percentage of missed quality of care measures. Because percentages were not normally distributed (ie, a majority of hospitals had few missed opportunities, while a minority had many), multivariable models employed log‐link functions with a gamma distribution.19, 20 Coefficients for our key predictor (presence of hospitalists) were transformed back to the original units (percentage of missed quality opportunities) so that a positive coefficient represented a higher number of quality measures missed relative to hospitals without hospitalists. Models were adjusted for factors previously reported to be associated with care quality. Hospital organizational characteristics included the number of beds, teaching status, registered nursing (RN) hours per adjusted patient day, and hospital ownership (for‐profit vs. not‐for‐profit). Hospital patient mix factors included annual percentage of admissions by insurance status (Medicare, Medicaid, other), annual percentage of admissions by race (white vs. nonwhite), annual percentage of do‐not‐resuscitate status at admission, and mean diagnosis‐related group‐based case‐mix index.21 We additionally adjusted for the number of cardiac catheterizations, a measure that moderately correlates with the number of cardiologists and technology utilization.22‐24 In our subset analysis among those hospitals with hospitalists, our key predictor for regression analyses was the percentage of patients admitted by hospitalists. For ease of interpretation, the percentage of patients admitted by hospitalists was centered on the mean across all respondent hospitals, and we report the effect of increasing by 10% the percentage of patients admitted by hospitalists. Models were adjusted for the same hospital organizational characteristics listed above. For those models, a positive coefficient also meant a higher number of measures missed.
For both sets of predictors, we additionally tested for the presence of interactions between the predictors and hospital bed size (both continuous as well as dichotomized at 150 beds) in composite measure performance, given the possibility that any hospitalist effect may be greater among smaller, resource‐limited hospitals. Tests for interaction were performed with the likelihood ratio test. In addition, to minimize any potential bias or loss of power that might result from limiting the analysis to hospitals with complete data, we used the multivariate imputation by chained equations method, as implemented in STATA 9.2 (StataCorp, College Station, TX), to create 10 imputed datasets.25 Imputation of missing values was restricted to confounding variables. Standard methods were then used to combine results over the 10 imputed datasets. We also applied Bonferroni corrections to composite measure tests based on the number of composites generated (n = 5). Thus, for the 5 inpatient composites created, standard definitions of significance (P 0.05) were corrected by dividing composite P values by 5, requiring P 0.01 for significance. The institutional review board of the University of California, San Francisco, approved the study. All analyses were performed using STATA 9.2.
Results
Characteristics of Participating Sites
There were 209 eligible hospitals. All 209 (100%) hospitals provided data about the presence or absence of hospitalists via at least 1 of our survey strategies. The majority of identification of hospitalist utilization was via contact with either hospital or hospitalist leaders, n = 147 (70.3%). Web‐sites informed hospitalist prevalence in only 3 (1.4%) hospitals. There were 8 (3.8%) occurrences of disagreement between sources, all of which had available hospital/hospitalist leader responses. Only 1 (0.5%) hospital did not have the minimum 25 patients eligible for any disease‐specific quality measures during the data reporting period. Collectively, the remaining 208 hospitals accounted for 81% of California's acute care hospital population.
Comparisons of Sites With Hospitalists and Those Without
A total of 170 hospitals (82%) participating in CHART used hospitalists. Hospitals with and without hospitalists differed by a variety of characteristics (Table 1). Sites with hospitalists were larger, less likely to be for‐profit, had more registered nursing hours per day, and performed more cardiac catheterizations.
| Characteristic | Hospitals Without Hospitalists (n = 38) | Hospitals With Hospitalists (n = 170) | P Value* |
|---|---|---|---|
| |||
| Number of beds, n (% of hospitals) | <0.001 | ||
| 0‐99 | 16 (42.1) | 14 (8.2) | |
| 100‐199 | 8 (21.1) | 44 (25.9) | |
| 200‐299 | 7 (18.4) | 42 (24.7) | |
| 300+ | 7 (18.4) | 70 (41.2) | |
| For profit, n (% of hospitals) | 9 (23.7) | 18 (10.6) | 0.03 |
| Teaching hospital, n (% of hospitals) | 7 (18.4) | 55 (32.4) | 0.09 |
| RN hours per adjusted patient day, number of hours (IQR) | 7.4 (5.7‐8.6) | 8.5 (7.4‐9.9) | <0.001 |
| Annual cardiac catheterizations, n (IQR) | 0 (0‐356) | 210 (0‐813) | 0.007 |
| Hospital total census days, n (IQR) | 37161 (14910‐59750) | 60626 (34402‐87950) | <0.001 |
| ICU total census, n (IQR) | 2193 (1132‐4289) | 3855 (2489‐6379) | <0.001 |
| Medicare insurance, % patients (IQR) | 36.9 (28.5‐48.0) | 35.3(28.2‐44.3) | 0.95 |
| Medicaid insurance, % patients (IQR) | 21.0 (12.7‐48.3) | 16.6 (5.6‐27.6) | 0.02 |
| Race, white, % patients (IQR) | 53.7 (26.0‐82.7) | 59.1 (45.6‐74.3) | 0.73 |
| DNR at admission, % patients (IQR) | 3.6 (2.0‐6.4) | 4.4 (2.7‐7.1) | 0.12 |
| Case‐mix index, index (IQR) | 1.05 (0.90‐1.21) | 1.13 (1.01‐1.26) | 0.11 |
Relationship Between Hospitalist Group Utilization and the Percentage of Missed Quality Opportunities
Table 2 shows the frequency of missed quality opportunities in sites with hospitalists compared to those without. In general, for both individual and composite measures of quality, multivariable adjustment modestly attenuated the observed differences between the 2 groups of hospitals. We present only the more conservative adjusted estimates.
| Quality Measure | Number of Hospitals | Adjusted Mean % Missed Quality Opportunities (95% CI) | Difference With Hospitalists | Relative % Change | P Value | |
|---|---|---|---|---|---|---|
| Hospitals Without Hospitalists | Hospitals With Hospitalists | |||||
| ||||||
| Acute myocardial infarction | ||||||
| Admission measures | ||||||
| Aspirin at admission | 193 | 3.7 (2.4‐5.1) | 3.4 (2.3‐4.4) | 0.3 | 10.0 | 0.44 |
| Beta‐blocker at admission | 186 | 7.8 (4.7‐10.9) | 6.4 (4.4‐8.3) | 1.4 | 18.3 | 0.19 |
| AMI admission composite | 186 | 5.5 (3.6‐7.5) | 4.8 (3.4‐6.1) | 0.7 | 14.3 | 0.26 |
| Hospital/discharge measures | ||||||
| Aspirin at discharge | 173 | 7.5 (4.5‐10.4) | 5.2 (3.4‐6.9) | 2.3 | 31.0 | 0.02 |
| Beta‐blocker at discharge | 179 | 6.6 (3.8‐9.4) | 5.9 (3.6‐8.2) | 0.7 | 9.6 | 0.54 |
| ACE‐I/ARB at discharge | 119 | 20.7 (9.5‐31.8) | 11.8 (6.6‐17.0) | 8.9 | 43.0 | 0.006 |
| Smoking cessation counseling | 193 | 3.8 (2.4‐5.1) | 3.4 (2.4‐4.4) | 0.4 | 10.0 | 0.44 |
| AMI hospital/discharge composite | 179 | 6.4 (4.1‐8.6) | 5.3 (3.7‐6.8) | 1.1 | 17.6 | 0.16 |
| Congestive heart failure | ||||||
| Hospital/discharge measures | ||||||
| Ejection fraction assessment | 208 | 12.6 (7.7‐17.6) | 6.5 (4.6‐8.4) | 6.1 | 48.2 | <0.001 |
| ACE‐I/ARB at discharge | 201 | 14.7 (10.0‐19.4) | 12.9 (9.8‐16.1) | 1.8 | 12.1 | 0.31 |
| Smoking cessation counseling | 168 | 9.1 (2.9‐15.4) | 9.0 (4.2‐13.8) | 0.1 | 1.8 | 0.98 |
| CHF hospital/discharge composite | 201 | 12.2 (7.9‐16.5) | 8.2 (6.2‐10.2) | 4.0 | 33.1 | 0.006* |
| Pneumonia | ||||||
| Admission measures | ||||||
| Blood culture before antibiotics | 206 | 12.0 (9.1‐14.9) | 10.9 (8.8‐13.0) | 1.1 | 9.1 | 0.29 |
| Timing of antibiotics <8 hours | 208 | 5.8 (4.1‐7.5) | 6.2 (4.7‐7.7) | 0.4 | 6.9 | 0.56 |
| Initial antibiotic consistent with recommendations | 207 | 15.0 (11.6‐18.6) | 13.8 (10.9‐16.8) | 1.2 | 8.1 | 0.27 |
| Pneumonia admission composite | 207 | 10.5 (8.5‐12.5) | 9.9 (8.3‐11.5) | 0.6 | 5.9 | 0.37 |
| Hospital/discharge measures | ||||||
| Pneumonia vaccine | 208 | 29.4 (19.5‐39.2) | 27.1 (19.9‐34.3) | 2.3 | 7.7 | 0.54 |
| Influenza vaccine | 207 | 36.9 (25.4‐48.4) | 35.0 (27.0‐43.1) | 1.9 | 5.2 | 0.67 |
| Smoking cessation counseling | 196 | 15.4 (7.8‐23.1) | 13.9 (8.9‐18.9) | 1.5 | 10.2 | 0.59 |
| Pneumonia hospital/discharge composite | 207 | 29.6 (20.5‐38.7) | 27.3 (20.9‐33.6) | 2.3 | 7.8 | 0.51 |
Compared to hospitals without hospitalists, those with hospitalists did not have any statistically significant differences in the individual and composite admission measures for each of the disease processes. In contrast, there were statistically significant differences between hospitalist and nonhospitalist sites for many individual cardiac processes of care that typically occur after admission from the emergency room (ie, LV function assessment for CHF) or those that occurred at discharge (ie, aspirin and ACE‐I/ARB at discharge for AMI). Similarly, the composite discharge scores for AMI and CHF revealed better overall process measure performance at sites with hospitalists, although the AMI composite did not meet statistical significance. There were no statistically significant differences between groups for the pneumonia process measures assessed at discharge. In addition, for composite measures there were no statistically significant interactions between hospitalist prevalence and bed size, although there was a trend (P = 0.06) for the CHF discharge composite, with a larger effect of hospitalists among smaller hospitals.
Percent of Patients Admitted by Hospitalists
Of the 171 hospitals with hospitalists, 71 (42%) estimated the percent of patients admitted by their hospitalist physicians. Among the respondents, the mean and median percentages of medical patients admitted by hospitalists were 51% (SD = 25%) and 49% (IQR = 30‐70%), respectively. Thirty hospitals were above the sample mean. Compared to nonrespondent sites, respondent hospitals took care of more white patients; otherwise, respondent and nonrespondent hospitals were similar in terms of bed size, location, performance across each measure, and other observable characteristics (Supporting Information, Appendix 1).
Relationship Between the Estimated Percentages of Medical Patients Admitted by Hospitalists and Missed Quality Opportunities
Table 3 displays the change in missed quality measures associated with each additional 10% of patients estimated to be admitted by hospitalists. A higher estimated percentage of patients admitted by hospitalists was associated with statistically significant improvements in quality of care across a majority of individual measures and for all composite discharge measures regardless of condition. For example, every 10% increase in the mean estimated number of patients admitted by hospitalists was associated with a mean of 0.6% (P < 0.001), 0.5% (P = 0.004), and 1.5% (P = 0.006) fewer missed quality opportunities for AMI, CHF, and pneumonia discharge process measures composites, respectively. In addition, for these composite measures, there were no statistically significant interactions between the estimated percentage of patients admitted by hospitalists and bed size (dichotomized at 150 beds), although there was a trend (P = 0.09) for the AMI discharge composite, with a larger effect of hospitalists among smaller hospitals.
| Quality Measure | Number of Hospitals | Adjusted % Missed Quality Opportunities (95% CI) | Difference With Hospitalists | Relative Percent Change | P Value | |
|---|---|---|---|---|---|---|
| Among Hospitals With Mean % of Patients Admitted by Hospitalists | Among Hospitals With Mean + 10% of Patients Admitted by Hospitalists | |||||
| ||||||
| Acute myocardial infarction | ||||||
| Admission measures | ||||||
| Aspirin at admission | 70 | 3.4 (2.3‐4.6) | 3.1 (2.0‐3.1) | 0.3 | 10.2 | 0.001 |
| Beta‐blocker at admission | 65 | 5.8 (3.4‐8.2) | 5.1 (3.0‐7.3) | 0.7 | 11.9 | <0.001 |
| AMI admission composite | 65 | 4.5 (2.9‐6.1) | 4.0 (2.6‐5.5) | 0.5 | 11.1 | <0.001* |
| Hospital/discharge measures | ||||||
| Aspirin at discharge | 62 | 5.1 (3.3‐6.9) | 4.6 (3.1‐6.2) | 0.5 | 9.0 | 0.03 |
| Beta‐blocker at discharge | 63 | 5.1 (2.9‐7.2) | 4.3 (2.5‐6.0) | 0.8 | 15.4 | <0.001 |
| ACE‐I/ARB at discharge | 44 | 11.4 (6.2‐16.6) | 10.3 (5.4‐15.1) | 1.1 | 10.0 | 0.02 |
| Smoking cessation counseling | 70 | 3.4 (2.3‐4.6) | 3.1 (2.0‐4.1) | 0.3 | 10.2 | 0.001 |
| AMI hospital/discharge composite | 63 | 5.0 (3.3‐6.7) | 4.4 (3.0‐5.8) | 0.6 | 11.3 | 0.001* |
| Congestive heart failure | ||||||
| Hospital/discharge measures | ||||||
| Ejection fraction assessment | 71 | 5.9 (4.1‐7.6) | 5.6 (3.9‐7.2) | 0.3 | 2.9 | 0.07 |
| ACE‐I/ARB at discharge | 70 | 12.3 (8.6‐16.0) | 11.4 (7.9‐15.0) | 0.9 | 7.1 | 0.008* |
| Smoking cessation counseling | 56 | 8.4 (4.1‐12.6) | 8.2 (4.2‐12.3) | 0.2 | 1.7 | 0.67 |
| CHF hospital/discharge composite | 70 | 7.7 (5.8‐9.6) | 7.2 (5.4‐9.0) | 0.5 | 6.0 | 0.004* |
| Pneumonia | ||||||
| Admission measures | ||||||
| Timing of antibiotics <8 hours | 71 | 5.9 (4.2‐7.6) | 5.9 (4.1‐7.7) | 0.0 | 0.0 | 0.98 |
| Blood culture before antibiotics | 71 | 10.0 (8.0‐12.0) | 9.8 (7.7‐11.8) | 0.2 | 2.6 | 0.18 |
| Initial antibiotic consistent with recommendations | 71 | 13.3 (10.4‐16.2) | 12.9 (9.9‐15.9) | 0.4 | 2.8 | 0.20 |
| Pneumonia admission composite | 71 | 9.4 (7.7‐11.1) | 9.2 (7.6‐10.9) | 0.2 | 1.8 | 0.23 |
| Hospital/discharge measures | ||||||
| Pneumonia vaccine | 71 | 27.0 (19.2‐34.8) | 24.7 (17.2‐32.2) | 2.3 | 8.4 | 0.006 |
| Influenza vaccine | 71 | 34.1 (25.9‐42.2) | 32.6 (24.7‐40.5) | 1.5 | 4.3 | 0.03 |
| Smoking cessation counseling | 67 | 15.2 (9.8‐20.7) | 15.0 (9.6‐20.4) | 0.2 | 2.0 | 0.56 |
| Pneumonia hospital/discharge composite | 71 | 26.7 (20.3‐33.1) | 25.2 (19.0‐31.3) | 1.5 | 5.8 | 0.006* |
In order to test the robustness of our results, we carried out 2 secondary analyses. First, we used multivariable models to generate a propensity score representing the predicted probability of being assigned to a hospital with hospitalists. We then used the propensity score as an additional covariate in subsequent multivariable models. In addition, we performed a complete‐case analysis (including only hospitals with complete data, n = 204) as a check on the sensitivity of our results to missing data. Neither analysis produced results substantially different from those presented.
Discussion
In this cross‐sectional analysis of hospitals participating in a voluntary quality reporting initiative, hospitals with at least 1 hospitalist group had fewer missed discharge care process measures for CHF, even after adjusting for hospital‐level characteristics. In addition, as the estimated percentage of patients admitted by hospitalists increased, the percentage of missed quality opportunities decreased across all measures. The observed relationships were most apparent for measures that could be completed at any time during the hospitalization and at discharge. While it is likely that hospitalists are a marker of a hospital's ability to invest in systems (and as a result, care improvement initiatives), the presence of a potential dose‐response relationship suggests that hospitalists themselves may have a role in improving processes of care.
Our study suggests a generally positive, but mixed, picture of hospitalists' effects on quality process measure performance. Lack of uniformity across measures may depend on the timing of the process measure (eg, whether or not the process is measured at admission or discharge). For example, in contrast to admission process measures, we more commonly observed a positive association between hospitalists and care quality on process measures targeting processes that generally took place later in hospitalization or at discharge. Many admission process measures (eg, door to antibiotic time, blood cultures, and appropriate initial antibiotics) likely occurred prior to hospitalist involvement in most cases and were instead under the direction of emergency medicine physicians. Performance on these measures would not be expected to relate to use of hospitalists, and that is what we observed.
In addition to the timing of when a process was measured or took place, associations between hospitalists and care quality vary by disease. The apparent variation in impact of hospitalists by disease (more impact for cardiac conditions, less for pneumonia) may relate primarily to the characteristics of the processes of care that were measured for each condition. For example, one‐half of the pneumonia process measures related to care occurring within a few hours of admission, while the other one‐half (smoking cessation advice and streptococcal and influenza vaccines) were often administered per protocol or by nonphysician providers.26‐29 However, more of the cardiac measures required physician action (eg, prescription of an ACE‐I at discharge). Alternatively, unmeasured confounders important in the delivery of cardiac care might play an important role in the relationship between hospitalists and cardiac process measure performance.
Our approach to defining hospitalists bears mention as well. While a dichotomous measure of having hospitalists available was only statistically significant for the single CHF discharge composite measure, our measure of hospitalist availabilitythe percentage of patients admitted by hospitalistswas more strongly associated with a larger number of quality measures. Contrast between the dichotomous and continuous measures may have statistical explanations (the power to see differences between 2 groups is more limited with use of a binary predictor, which itself can be subject to bias),30 but may also indicate a dose‐response relationship. A larger number of admissions to hospitalists may help standardize practices, as care is concentrated in a smaller number of physicians' hands. Moreover, larger hospitalist programs may be more likely to have implemented care standardization or quality improvement processes or to have been incorporated into (or lead) hospitals' quality infrastructures. Finally, presence of larger hospitalist groups may be a marker for a hospital's capacity to make hospital‐wide investments in improvement. However, the association between the percentage of patients admitted by hospitalists and care quality persisted even after adjustment for many measures plausibly associated with ability to invest in care quality.
Our study has several limitations. First, although we used a widely accepted definition of hospitalists endorsed by the Society of Hospital Medicine, there are no gold standard definitions for a hospitalist's job description or skill set. As a result, it is possible that a model utilizing rotating internists (from a multispecialty group) might have been misidentified as a hospitalist model. Second, our findings represent a convenience sample of hospitals in a voluntary reporting initiative (CHART) and may not be applicable to hospitals that are less able to participate in such an endeavor. CHART hospitals are recognized to be better performers than the overall California population of hospitals, potentially decreasing variability in our quality of care measures.2 Third, there were significant differences between our comparison groups within the CHART hospitals, including sample size. Although we attempted to adjust our analyses for many important potential confounders and applied conservative measures to assess statistical significance, given the baseline differences, we cannot rule out the possibility of residual confounding by unmeasured factors. Fourth, as described above, this observational study cannot provide robust evidence to support conclusions regarding causality. Fifth, the estimation of the percent of patients admitted by hospitalists is unvalidated and based upon self‐reported and incomplete (41% of respondents) data. We are somewhat reassured by the fact that respondents and nonresponders were similar across all hospital characteristics, as well as outcomes. Sixth, misclassification of the estimated percentage of patients admitted by hospitalists may have influenced our results. Although possible, misclassification often biases results toward the null, potentially weakening any observed association. Given that our respondents were not aware of our hypotheses, there is no reason to expect recall issues to bias the results one way or the other. Finally, for many performance measures, overall performance was excellent among all hospitals (eg, aspirin at admission) with limited variability, thus limiting the ability to assess for differences.
In summary, in a large, cross‐sectional study of California hospitals participating in a voluntary quality reporting initiative, the presence of hospitalists was associated with modest improvements in hospital‐level performance of quality process measures. In addition, we found a relationship between the percentage of patients admitted by hospitalists and improved process measure adherence. Although we cannot determine causality, our data support the hypothesis that dedicated hospital physicians can positively affect the quality of care. Future research should examine this relationship in other settings and should address causality using broader measures of quality including both processes and outcomes.
Acknowledgements
The authors acknowledge Teresa Chipps, BS, Center for Health Services Research, Division of General Internal Medicine and Public Health, Department of Medicine, Vanderbilt University, Nashville, TN, for her administrative and editorial assistance in the preparation of this manuscript.
- ,,,.Care in U.S. hospitals—the Hospital Quality Alliance Program.N Engl J Med.2005;353:265–274.
- CalHospitalCompare.org: online report card simplifies the search for quality hospital care. Available at: http://www.chcf.org/topics/hospitals/index.cfm?itemID=131387. Accessed September 2009.
- ,,, et al.Hospital characteristics and quality of care.JAMA.1992;268:1709–1714.
- ,,,,.Patient and hospital characteristics associated with recommended processes of care for elderly patients hospitalized with pneumonia: results from the Medicare quality indicator system pneumonia module.Arch Intern Med.2002;162:827–833.
- ,,, et al.A systematic review and meta‐analysis of studies comparing mortality rates of private for‐profit and private not‐for‐profit hospitals.CMAJ.2002;166:1399–1406.
- ,.Teaching hospitals and quality of care: a review of the literature.Milbank Q.2002;80:569–593.
- ,,,,.Nurse‐staffing levels and the quality of care in hospitals.N Engl J Med.2002;346:1715–1722.
- ,,,.Growth in the care of older patients by hospitalists in the United States.N Engl J Med.2009;360:1102–1112.
- ,,,.Health care market trends and the evolution of hospitalist use and roles.J Gen Intern Med.2005;20:101–107.
- ,,,.Comparison of processes and outcomes of pneumonia care between hospitalists and community‐based primary care physicians.Mayo Clin Proc.2002;77:1053–1058.
- ,,,.Comparison of hospitalists and nonhospitalists regarding core measures of pneumonia care.Am J Manag Care.2007;13:129–132.
- ,,.Comparison of practice patterns of hospitalists and community physicians in the care of patients with congestive heart failure.J Hosp Med.2008;3:35–41.
- ,,, et al.Quality of care for decompensated heart failure: comparable performance between academic hospitalists and non‐hospitalists.J Gen Intern Med.2008;23:1399–1406.
- ,,,,.Quality of care for patients hospitalized with heart failure: assessing the impact of hospitalists.Arch Intern Med.2002;162:1251–1256.
- ,,,.The inverse relationship between mortality rates and performance in the Hospital Quality Alliance measures.Health Aff.2007;26:1104–1110.
- ,,,,.Does the Leapfrog program help identify high‐quality hospitals?Jt Comm J Qual Patient Saf.2008;34:318–325.
- ,,,,,.Outcomes of care by hospitalists, general internists, and family physicians.N Engl J Med.2007;357:2589–2600.
- CMS HQI demonstration project—composite quality score methodology overview. Available at: http://www.cms.hhs.gov/HospitalQualityInits/downloads/HospitalCompositeQualityScoreMethodologyOverview.pdf. Accessed September 2009.
- ,,.Modeling risk using generalized linear models.J Health Econ.1999;18:153–171.
- ,,.Generalized modeling approaches to risk adjustment of skewed outcomes data.J Health Econ.2005;24:465–488.
- ,,, et al.Quality of care for the treatment of acute medical conditions in US hospitals.Arch Intern Med.2006;166:2511–2517.
- ,,, et al.The Dartmouth Atlas of Cardiovascular Health Care.Chicago:AHA Press;1999. Current data from the Dartmouth Institute for Health Policy and Clinical Practice, Lebanon, NH. Available at: http://www.dartmouthatlas.org/atlases/atlas_ series.shtm. Accessed September 2009.
- ,,.Differences in per capita rates of revascularization and in choice of revascularization procedure for eleven states.BMC Health Serv Res.2006;6:35.
- ,,.The relationship between physician supply, cardiovascular health service use and cardiac disease burden in Ontario: supply‐need mismatch.Can J Card.2008;24:187.
- .Multiple imputation: a primer.Stat Methods Med Res.1999;8:3–15.
- .Nursing intervention and smoking cessation: Meta‐analysis update.Heart Lung.2006;35:147–163.
- .Ten‐year durability and success of an organized program to increase influenza and pneumococcal vaccination rates among high‐risk adults.Am J Med.1998;105:385–392.
- ,,, et al.Role of student pharmacist interns in hospital‐based standing orders pneumococcal vaccination program.J Am Pharm Assoc.2007;47:404–409.
- ,,,.Effect of a pharmacist‐managed program of pneumococcal and influenza immunization on vaccination rates among adult inpatients.Am J Health Syst Pharm.2003;60:1767–1771.
- ,,.Dichotomizing continuous predictors in multiple regression: a bad idea.Stat Med.2006;25:127–141.
Quality of care in US hospitals is inconsistent and often below accepted standards.1 This observation has catalyzed a number of performance measurement initiatives intended to publicize gaps and spur quality improvement.2 As the field has evolved, organizational factors such as teaching status, ownership model, nurse staffing levels, and hospital volume have been found to be associated with performance on quality measures.1, 3‐7 Hospitalists represent a more recent change in the organization of inpatient care8 that may impact hospital‐level performance. In fact, most hospitals provide financial support to hospitalists, not only for hopes of improving efficiency, but also for improving quality and safety.9
Only a few single‐site studies have examined the impact of hospitalists on quality of care for common medical conditions (ie, pneumonia, congestive heart failure, and acute myocardial infarction), and each has focused on patient‐level effects. Rifkin et al.10, 11 did not find differences between hospitalists' and nonhospitalists' patients in terms of pneumonia process measures. Roytman et al.12 found hospitalists more frequently prescribed afterload‐reducing agents for congestive heart failure (CHF), but other studies have shown no differences in care quality for heart failure.13, 14 Importantly, no studies have examined the role of hospitalists in the care of patients with acute myocardial infarction (AMI). In addition, studies have not addressed the effect of hospitalists at the hospital level to understand whether hospitalists have broader system‐level effects reflected by overall hospital performance.
We hypothesized that the presence of hospitalists within a hospital would be associated with improvements in hospital‐level adherence to publicly reported quality process measures, and having a greater percentage of patients admitted by hospitalists would be associated with improved performance. To test these hypotheses, we linked data from a statewide census of hospitalists with data collected as part of a hospital quality‐reporting initiative.
Materials and Methods
Study Sites
We examined the performance of 209 hospitals (63% of all 334 non‐federal facilities in California) participating in the California Hospital Assessment and Reporting Taskforce (CHART) at the time of the survey. CHART is a voluntary quality reporting initiative that began publicly reporting hospital quality data in January 2006.
Hospital‐level Organizational, Case‐mix, and Quality Data
Hospital organizational characteristics (eg, bed size) were obtained from publicly available discharge and utilization data sets from the California Office of Statewide Health Planning and Development (OSHPD). We also linked hospital‐level patient‐mix data (eg, race) from these OSHPD files.
We obtained quality of care data from CHART for January 2006 through June 2007, the time period corresponding to the survey. Quality metrics included 16 measures collected by the Center for Medicare and Medicaid Services (www.cms.hhs.gov) and extensively used in quality research.1, 4, 13, 15‐17 Rather than define a single measure, we examined multiple process measures, anticipating differential impacts of hospitalists on various processes of care for AMI, CHF, and pneumonia. Measures were further divided among those that are usually measured upon initial presentation to the hospital and those that are measured throughout the entire hospitalization and discharge. This division reflects the division of care in the hospital, where emergency room physicians are likely to have a more critical role for admission processes.
Survey Process
We surveyed all nonfederal, acute care hospitals in California that participated in CHART.2 We first identified contacts at each site via professional society mailing lists. We then sent web‐based surveys to all with available email addresses and a fax/paper survey to the remainder. We surveyed individuals between October 2006 and April 2007 and repeated the process at intervals of 1 to 3 weeks. For remaining nonrespondents, we placed a direct call unless consent to survey had been specifically refused. We contacted the following persons in sequence: (1) hospital executives or administrative leaders; (2) hospital medicine department leaders; (3) admitting emergency room personnel or medical staff officers; and (4) hospital website information. In the case of multiple responses with disagreement, the hospital/hospitalist leader's response was treated as the primary source. At each step, respondents were asked to answer questions only if they had a direct working knowledge of their hospitalist services.
Survey Data
Our key survey question to all respondents included whether the respondents could confirm their hospitals had at least one hospitalist medicine group. Hospital leaders were also asked to participate in a more comprehensive survey of their organizational and clinical characteristics. Within the comprehensive survey, leaders also provided estimates of the percent of general medical patients admitted by hospitalists. This measure, used in prior surveys of hospital leaders,9 was intended to be an easily understood approximation of the intensity of hospitalist utilization in any given hospital. A more rigorous, direct measure was not feasible due to the complexity of obtaining admission data over such a large, diverse set of hospitals.
Process Performance Measures
AMI measures assessed at admission included aspirin and ‐blocker administration within 24 hours of arrival. AMI measures assessed at discharge included aspirin administration, ‐blocker administration, angiotensin converting enzyme inhibitor (ACE‐I) (or angiotensin receptor blocker [ARB]) administration for left ventricular (LV) dysfunction, and smoking cessation counseling. There were no CHF admission measures. CHF discharge measures included assessment of LV function, the use of an ACE‐I or ARB for LV dysfunction, and smoking cessation counseling. Pneumonia admission measures included the drawing of blood cultures prior to the receipt of antibiotics, timely administration of initial antibiotics (<8 hours), and antibiotics consistent with recommendations. Pneumonia discharge measures included pneumococcal vaccination, flu vaccination, and smoking cessation counseling.
For each performance measure, we quantified the percentage of missed quality opportunities, defined as the number of patients who did not receive a care process divided by the number of eligible patients, multiplied by 100. In addition, we calculated composite scores for admission and discharge measures across each condition. We summed the numerators and denominators of individual performance measures to generate a disease‐specific composite numerator and denominator. Both individual and composite scores were produced using methodology outlined by the Center for Medicare & Medicaid Services.18 In order to retain as representative a sample of hospitals as possible, we calculated composite scores for hospitals that had a minimum of 25 observations in at least 2 of the quality indicators that made up each composite score.
Statistical Analysis
We used chi‐square tests, Student t tests, and Mann‐Whitney tests, where appropriate, to compare hospital‐level characteristics of hospitals that utilized hospitalists vs. those that did not. Similar analyses were performed among the subset of hospitals that utilized hospitalists. Among this subgroup of hospitals, we compared hospital‐level characteristics between hospitals that provided information regarding the percent of patients admitted by hospitalists vs. those who did not provide this information.
We used multivariable, generalized linear regression models to assess the relationship between having at least 1 hospitalist group and the percentage of missed quality of care measures. Because percentages were not normally distributed (ie, a majority of hospitals had few missed opportunities, while a minority had many), multivariable models employed log‐link functions with a gamma distribution.19, 20 Coefficients for our key predictor (presence of hospitalists) were transformed back to the original units (percentage of missed quality opportunities) so that a positive coefficient represented a higher number of quality measures missed relative to hospitals without hospitalists. Models were adjusted for factors previously reported to be associated with care quality. Hospital organizational characteristics included the number of beds, teaching status, registered nursing (RN) hours per adjusted patient day, and hospital ownership (for‐profit vs. not‐for‐profit). Hospital patient mix factors included annual percentage of admissions by insurance status (Medicare, Medicaid, other), annual percentage of admissions by race (white vs. nonwhite), annual percentage of do‐not‐resuscitate status at admission, and mean diagnosis‐related group‐based case‐mix index.21 We additionally adjusted for the number of cardiac catheterizations, a measure that moderately correlates with the number of cardiologists and technology utilization.22‐24 In our subset analysis among those hospitals with hospitalists, our key predictor for regression analyses was the percentage of patients admitted by hospitalists. For ease of interpretation, the percentage of patients admitted by hospitalists was centered on the mean across all respondent hospitals, and we report the effect of increasing by 10% the percentage of patients admitted by hospitalists. Models were adjusted for the same hospital organizational characteristics listed above. For those models, a positive coefficient also meant a higher number of measures missed.
For both sets of predictors, we additionally tested for the presence of interactions between the predictors and hospital bed size (both continuous as well as dichotomized at 150 beds) in composite measure performance, given the possibility that any hospitalist effect may be greater among smaller, resource‐limited hospitals. Tests for interaction were performed with the likelihood ratio test. In addition, to minimize any potential bias or loss of power that might result from limiting the analysis to hospitals with complete data, we used the multivariate imputation by chained equations method, as implemented in STATA 9.2 (StataCorp, College Station, TX), to create 10 imputed datasets.25 Imputation of missing values was restricted to confounding variables. Standard methods were then used to combine results over the 10 imputed datasets. We also applied Bonferroni corrections to composite measure tests based on the number of composites generated (n = 5). Thus, for the 5 inpatient composites created, standard definitions of significance (P 0.05) were corrected by dividing composite P values by 5, requiring P 0.01 for significance. The institutional review board of the University of California, San Francisco, approved the study. All analyses were performed using STATA 9.2.
Results
Characteristics of Participating Sites
There were 209 eligible hospitals. All 209 (100%) hospitals provided data about the presence or absence of hospitalists via at least 1 of our survey strategies. The majority of identification of hospitalist utilization was via contact with either hospital or hospitalist leaders, n = 147 (70.3%). Web‐sites informed hospitalist prevalence in only 3 (1.4%) hospitals. There were 8 (3.8%) occurrences of disagreement between sources, all of which had available hospital/hospitalist leader responses. Only 1 (0.5%) hospital did not have the minimum 25 patients eligible for any disease‐specific quality measures during the data reporting period. Collectively, the remaining 208 hospitals accounted for 81% of California's acute care hospital population.
Comparisons of Sites With Hospitalists and Those Without
A total of 170 hospitals (82%) participating in CHART used hospitalists. Hospitals with and without hospitalists differed by a variety of characteristics (Table 1). Sites with hospitalists were larger, less likely to be for‐profit, had more registered nursing hours per day, and performed more cardiac catheterizations.
| Characteristic | Hospitals Without Hospitalists (n = 38) | Hospitals With Hospitalists (n = 170) | P Value* |
|---|---|---|---|
| |||
| Number of beds, n (% of hospitals) | <0.001 | ||
| 0‐99 | 16 (42.1) | 14 (8.2) | |
| 100‐199 | 8 (21.1) | 44 (25.9) | |
| 200‐299 | 7 (18.4) | 42 (24.7) | |
| 300+ | 7 (18.4) | 70 (41.2) | |
| For profit, n (% of hospitals) | 9 (23.7) | 18 (10.6) | 0.03 |
| Teaching hospital, n (% of hospitals) | 7 (18.4) | 55 (32.4) | 0.09 |
| RN hours per adjusted patient day, number of hours (IQR) | 7.4 (5.7‐8.6) | 8.5 (7.4‐9.9) | <0.001 |
| Annual cardiac catheterizations, n (IQR) | 0 (0‐356) | 210 (0‐813) | 0.007 |
| Hospital total census days, n (IQR) | 37161 (14910‐59750) | 60626 (34402‐87950) | <0.001 |
| ICU total census, n (IQR) | 2193 (1132‐4289) | 3855 (2489‐6379) | <0.001 |
| Medicare insurance, % patients (IQR) | 36.9 (28.5‐48.0) | 35.3(28.2‐44.3) | 0.95 |
| Medicaid insurance, % patients (IQR) | 21.0 (12.7‐48.3) | 16.6 (5.6‐27.6) | 0.02 |
| Race, white, % patients (IQR) | 53.7 (26.0‐82.7) | 59.1 (45.6‐74.3) | 0.73 |
| DNR at admission, % patients (IQR) | 3.6 (2.0‐6.4) | 4.4 (2.7‐7.1) | 0.12 |
| Case‐mix index, index (IQR) | 1.05 (0.90‐1.21) | 1.13 (1.01‐1.26) | 0.11 |
Relationship Between Hospitalist Group Utilization and the Percentage of Missed Quality Opportunities
Table 2 shows the frequency of missed quality opportunities in sites with hospitalists compared to those without. In general, for both individual and composite measures of quality, multivariable adjustment modestly attenuated the observed differences between the 2 groups of hospitals. We present only the more conservative adjusted estimates.
| Quality Measure | Number of Hospitals | Adjusted Mean % Missed Quality Opportunities (95% CI) | Difference With Hospitalists | Relative % Change | P Value | |
|---|---|---|---|---|---|---|
| Hospitals Without Hospitalists | Hospitals With Hospitalists | |||||
| ||||||
| Acute myocardial infarction | ||||||
| Admission measures | ||||||
| Aspirin at admission | 193 | 3.7 (2.4‐5.1) | 3.4 (2.3‐4.4) | 0.3 | 10.0 | 0.44 |
| Beta‐blocker at admission | 186 | 7.8 (4.7‐10.9) | 6.4 (4.4‐8.3) | 1.4 | 18.3 | 0.19 |
| AMI admission composite | 186 | 5.5 (3.6‐7.5) | 4.8 (3.4‐6.1) | 0.7 | 14.3 | 0.26 |
| Hospital/discharge measures | ||||||
| Aspirin at discharge | 173 | 7.5 (4.5‐10.4) | 5.2 (3.4‐6.9) | 2.3 | 31.0 | 0.02 |
| Beta‐blocker at discharge | 179 | 6.6 (3.8‐9.4) | 5.9 (3.6‐8.2) | 0.7 | 9.6 | 0.54 |
| ACE‐I/ARB at discharge | 119 | 20.7 (9.5‐31.8) | 11.8 (6.6‐17.0) | 8.9 | 43.0 | 0.006 |
| Smoking cessation counseling | 193 | 3.8 (2.4‐5.1) | 3.4 (2.4‐4.4) | 0.4 | 10.0 | 0.44 |
| AMI hospital/discharge composite | 179 | 6.4 (4.1‐8.6) | 5.3 (3.7‐6.8) | 1.1 | 17.6 | 0.16 |
| Congestive heart failure | ||||||
| Hospital/discharge measures | ||||||
| Ejection fraction assessment | 208 | 12.6 (7.7‐17.6) | 6.5 (4.6‐8.4) | 6.1 | 48.2 | <0.001 |
| ACE‐I/ARB at discharge | 201 | 14.7 (10.0‐19.4) | 12.9 (9.8‐16.1) | 1.8 | 12.1 | 0.31 |
| Smoking cessation counseling | 168 | 9.1 (2.9‐15.4) | 9.0 (4.2‐13.8) | 0.1 | 1.8 | 0.98 |
| CHF hospital/discharge composite | 201 | 12.2 (7.9‐16.5) | 8.2 (6.2‐10.2) | 4.0 | 33.1 | 0.006* |
| Pneumonia | ||||||
| Admission measures | ||||||
| Blood culture before antibiotics | 206 | 12.0 (9.1‐14.9) | 10.9 (8.8‐13.0) | 1.1 | 9.1 | 0.29 |
| Timing of antibiotics <8 hours | 208 | 5.8 (4.1‐7.5) | 6.2 (4.7‐7.7) | 0.4 | 6.9 | 0.56 |
| Initial antibiotic consistent with recommendations | 207 | 15.0 (11.6‐18.6) | 13.8 (10.9‐16.8) | 1.2 | 8.1 | 0.27 |
| Pneumonia admission composite | 207 | 10.5 (8.5‐12.5) | 9.9 (8.3‐11.5) | 0.6 | 5.9 | 0.37 |
| Hospital/discharge measures | ||||||
| Pneumonia vaccine | 208 | 29.4 (19.5‐39.2) | 27.1 (19.9‐34.3) | 2.3 | 7.7 | 0.54 |
| Influenza vaccine | 207 | 36.9 (25.4‐48.4) | 35.0 (27.0‐43.1) | 1.9 | 5.2 | 0.67 |
| Smoking cessation counseling | 196 | 15.4 (7.8‐23.1) | 13.9 (8.9‐18.9) | 1.5 | 10.2 | 0.59 |
| Pneumonia hospital/discharge composite | 207 | 29.6 (20.5‐38.7) | 27.3 (20.9‐33.6) | 2.3 | 7.8 | 0.51 |
Compared to hospitals without hospitalists, those with hospitalists did not have any statistically significant differences in the individual and composite admission measures for each of the disease processes. In contrast, there were statistically significant differences between hospitalist and nonhospitalist sites for many individual cardiac processes of care that typically occur after admission from the emergency room (ie, LV function assessment for CHF) or those that occurred at discharge (ie, aspirin and ACE‐I/ARB at discharge for AMI). Similarly, the composite discharge scores for AMI and CHF revealed better overall process measure performance at sites with hospitalists, although the AMI composite did not meet statistical significance. There were no statistically significant differences between groups for the pneumonia process measures assessed at discharge. In addition, for composite measures there were no statistically significant interactions between hospitalist prevalence and bed size, although there was a trend (P = 0.06) for the CHF discharge composite, with a larger effect of hospitalists among smaller hospitals.
Percent of Patients Admitted by Hospitalists
Of the 171 hospitals with hospitalists, 71 (42%) estimated the percent of patients admitted by their hospitalist physicians. Among the respondents, the mean and median percentages of medical patients admitted by hospitalists were 51% (SD = 25%) and 49% (IQR = 30‐70%), respectively. Thirty hospitals were above the sample mean. Compared to nonrespondent sites, respondent hospitals took care of more white patients; otherwise, respondent and nonrespondent hospitals were similar in terms of bed size, location, performance across each measure, and other observable characteristics (Supporting Information, Appendix 1).
Relationship Between the Estimated Percentages of Medical Patients Admitted by Hospitalists and Missed Quality Opportunities
Table 3 displays the change in missed quality measures associated with each additional 10% of patients estimated to be admitted by hospitalists. A higher estimated percentage of patients admitted by hospitalists was associated with statistically significant improvements in quality of care across a majority of individual measures and for all composite discharge measures regardless of condition. For example, every 10% increase in the mean estimated number of patients admitted by hospitalists was associated with a mean of 0.6% (P < 0.001), 0.5% (P = 0.004), and 1.5% (P = 0.006) fewer missed quality opportunities for AMI, CHF, and pneumonia discharge process measures composites, respectively. In addition, for these composite measures, there were no statistically significant interactions between the estimated percentage of patients admitted by hospitalists and bed size (dichotomized at 150 beds), although there was a trend (P = 0.09) for the AMI discharge composite, with a larger effect of hospitalists among smaller hospitals.
| Quality Measure | Number of Hospitals | Adjusted % Missed Quality Opportunities (95% CI) | Difference With Hospitalists | Relative Percent Change | P Value | |
|---|---|---|---|---|---|---|
| Among Hospitals With Mean % of Patients Admitted by Hospitalists | Among Hospitals With Mean + 10% of Patients Admitted by Hospitalists | |||||
| ||||||
| Acute myocardial infarction | ||||||
| Admission measures | ||||||
| Aspirin at admission | 70 | 3.4 (2.3‐4.6) | 3.1 (2.0‐3.1) | 0.3 | 10.2 | 0.001 |
| Beta‐blocker at admission | 65 | 5.8 (3.4‐8.2) | 5.1 (3.0‐7.3) | 0.7 | 11.9 | <0.001 |
| AMI admission composite | 65 | 4.5 (2.9‐6.1) | 4.0 (2.6‐5.5) | 0.5 | 11.1 | <0.001* |
| Hospital/discharge measures | ||||||
| Aspirin at discharge | 62 | 5.1 (3.3‐6.9) | 4.6 (3.1‐6.2) | 0.5 | 9.0 | 0.03 |
| Beta‐blocker at discharge | 63 | 5.1 (2.9‐7.2) | 4.3 (2.5‐6.0) | 0.8 | 15.4 | <0.001 |
| ACE‐I/ARB at discharge | 44 | 11.4 (6.2‐16.6) | 10.3 (5.4‐15.1) | 1.1 | 10.0 | 0.02 |
| Smoking cessation counseling | 70 | 3.4 (2.3‐4.6) | 3.1 (2.0‐4.1) | 0.3 | 10.2 | 0.001 |
| AMI hospital/discharge composite | 63 | 5.0 (3.3‐6.7) | 4.4 (3.0‐5.8) | 0.6 | 11.3 | 0.001* |
| Congestive heart failure | ||||||
| Hospital/discharge measures | ||||||
| Ejection fraction assessment | 71 | 5.9 (4.1‐7.6) | 5.6 (3.9‐7.2) | 0.3 | 2.9 | 0.07 |
| ACE‐I/ARB at discharge | 70 | 12.3 (8.6‐16.0) | 11.4 (7.9‐15.0) | 0.9 | 7.1 | 0.008* |
| Smoking cessation counseling | 56 | 8.4 (4.1‐12.6) | 8.2 (4.2‐12.3) | 0.2 | 1.7 | 0.67 |
| CHF hospital/discharge composite | 70 | 7.7 (5.8‐9.6) | 7.2 (5.4‐9.0) | 0.5 | 6.0 | 0.004* |
| Pneumonia | ||||||
| Admission measures | ||||||
| Timing of antibiotics <8 hours | 71 | 5.9 (4.2‐7.6) | 5.9 (4.1‐7.7) | 0.0 | 0.0 | 0.98 |
| Blood culture before antibiotics | 71 | 10.0 (8.0‐12.0) | 9.8 (7.7‐11.8) | 0.2 | 2.6 | 0.18 |
| Initial antibiotic consistent with recommendations | 71 | 13.3 (10.4‐16.2) | 12.9 (9.9‐15.9) | 0.4 | 2.8 | 0.20 |
| Pneumonia admission composite | 71 | 9.4 (7.7‐11.1) | 9.2 (7.6‐10.9) | 0.2 | 1.8 | 0.23 |
| Hospital/discharge measures | ||||||
| Pneumonia vaccine | 71 | 27.0 (19.2‐34.8) | 24.7 (17.2‐32.2) | 2.3 | 8.4 | 0.006 |
| Influenza vaccine | 71 | 34.1 (25.9‐42.2) | 32.6 (24.7‐40.5) | 1.5 | 4.3 | 0.03 |
| Smoking cessation counseling | 67 | 15.2 (9.8‐20.7) | 15.0 (9.6‐20.4) | 0.2 | 2.0 | 0.56 |
| Pneumonia hospital/discharge composite | 71 | 26.7 (20.3‐33.1) | 25.2 (19.0‐31.3) | 1.5 | 5.8 | 0.006* |
In order to test the robustness of our results, we carried out 2 secondary analyses. First, we used multivariable models to generate a propensity score representing the predicted probability of being assigned to a hospital with hospitalists. We then used the propensity score as an additional covariate in subsequent multivariable models. In addition, we performed a complete‐case analysis (including only hospitals with complete data, n = 204) as a check on the sensitivity of our results to missing data. Neither analysis produced results substantially different from those presented.
Discussion
In this cross‐sectional analysis of hospitals participating in a voluntary quality reporting initiative, hospitals with at least 1 hospitalist group had fewer missed discharge care process measures for CHF, even after adjusting for hospital‐level characteristics. In addition, as the estimated percentage of patients admitted by hospitalists increased, the percentage of missed quality opportunities decreased across all measures. The observed relationships were most apparent for measures that could be completed at any time during the hospitalization and at discharge. While it is likely that hospitalists are a marker of a hospital's ability to invest in systems (and as a result, care improvement initiatives), the presence of a potential dose‐response relationship suggests that hospitalists themselves may have a role in improving processes of care.
Our study suggests a generally positive, but mixed, picture of hospitalists' effects on quality process measure performance. Lack of uniformity across measures may depend on the timing of the process measure (eg, whether or not the process is measured at admission or discharge). For example, in contrast to admission process measures, we more commonly observed a positive association between hospitalists and care quality on process measures targeting processes that generally took place later in hospitalization or at discharge. Many admission process measures (eg, door to antibiotic time, blood cultures, and appropriate initial antibiotics) likely occurred prior to hospitalist involvement in most cases and were instead under the direction of emergency medicine physicians. Performance on these measures would not be expected to relate to use of hospitalists, and that is what we observed.
In addition to the timing of when a process was measured or took place, associations between hospitalists and care quality vary by disease. The apparent variation in impact of hospitalists by disease (more impact for cardiac conditions, less for pneumonia) may relate primarily to the characteristics of the processes of care that were measured for each condition. For example, one‐half of the pneumonia process measures related to care occurring within a few hours of admission, while the other one‐half (smoking cessation advice and streptococcal and influenza vaccines) were often administered per protocol or by nonphysician providers.26‐29 However, more of the cardiac measures required physician action (eg, prescription of an ACE‐I at discharge). Alternatively, unmeasured confounders important in the delivery of cardiac care might play an important role in the relationship between hospitalists and cardiac process measure performance.
Our approach to defining hospitalists bears mention as well. While a dichotomous measure of having hospitalists available was only statistically significant for the single CHF discharge composite measure, our measure of hospitalist availabilitythe percentage of patients admitted by hospitalistswas more strongly associated with a larger number of quality measures. Contrast between the dichotomous and continuous measures may have statistical explanations (the power to see differences between 2 groups is more limited with use of a binary predictor, which itself can be subject to bias),30 but may also indicate a dose‐response relationship. A larger number of admissions to hospitalists may help standardize practices, as care is concentrated in a smaller number of physicians' hands. Moreover, larger hospitalist programs may be more likely to have implemented care standardization or quality improvement processes or to have been incorporated into (or lead) hospitals' quality infrastructures. Finally, presence of larger hospitalist groups may be a marker for a hospital's capacity to make hospital‐wide investments in improvement. However, the association between the percentage of patients admitted by hospitalists and care quality persisted even after adjustment for many measures plausibly associated with ability to invest in care quality.
Our study has several limitations. First, although we used a widely accepted definition of hospitalists endorsed by the Society of Hospital Medicine, there are no gold standard definitions for a hospitalist's job description or skill set. As a result, it is possible that a model utilizing rotating internists (from a multispecialty group) might have been misidentified as a hospitalist model. Second, our findings represent a convenience sample of hospitals in a voluntary reporting initiative (CHART) and may not be applicable to hospitals that are less able to participate in such an endeavor. CHART hospitals are recognized to be better performers than the overall California population of hospitals, potentially decreasing variability in our quality of care measures.2 Third, there were significant differences between our comparison groups within the CHART hospitals, including sample size. Although we attempted to adjust our analyses for many important potential confounders and applied conservative measures to assess statistical significance, given the baseline differences, we cannot rule out the possibility of residual confounding by unmeasured factors. Fourth, as described above, this observational study cannot provide robust evidence to support conclusions regarding causality. Fifth, the estimation of the percent of patients admitted by hospitalists is unvalidated and based upon self‐reported and incomplete (41% of respondents) data. We are somewhat reassured by the fact that respondents and nonresponders were similar across all hospital characteristics, as well as outcomes. Sixth, misclassification of the estimated percentage of patients admitted by hospitalists may have influenced our results. Although possible, misclassification often biases results toward the null, potentially weakening any observed association. Given that our respondents were not aware of our hypotheses, there is no reason to expect recall issues to bias the results one way or the other. Finally, for many performance measures, overall performance was excellent among all hospitals (eg, aspirin at admission) with limited variability, thus limiting the ability to assess for differences.
In summary, in a large, cross‐sectional study of California hospitals participating in a voluntary quality reporting initiative, the presence of hospitalists was associated with modest improvements in hospital‐level performance of quality process measures. In addition, we found a relationship between the percentage of patients admitted by hospitalists and improved process measure adherence. Although we cannot determine causality, our data support the hypothesis that dedicated hospital physicians can positively affect the quality of care. Future research should examine this relationship in other settings and should address causality using broader measures of quality including both processes and outcomes.
Acknowledgements
The authors acknowledge Teresa Chipps, BS, Center for Health Services Research, Division of General Internal Medicine and Public Health, Department of Medicine, Vanderbilt University, Nashville, TN, for her administrative and editorial assistance in the preparation of this manuscript.
Quality of care in US hospitals is inconsistent and often below accepted standards.1 This observation has catalyzed a number of performance measurement initiatives intended to publicize gaps and spur quality improvement.2 As the field has evolved, organizational factors such as teaching status, ownership model, nurse staffing levels, and hospital volume have been found to be associated with performance on quality measures.1, 3‐7 Hospitalists represent a more recent change in the organization of inpatient care8 that may impact hospital‐level performance. In fact, most hospitals provide financial support to hospitalists, not only for hopes of improving efficiency, but also for improving quality and safety.9
Only a few single‐site studies have examined the impact of hospitalists on quality of care for common medical conditions (ie, pneumonia, congestive heart failure, and acute myocardial infarction), and each has focused on patient‐level effects. Rifkin et al.10, 11 did not find differences between hospitalists' and nonhospitalists' patients in terms of pneumonia process measures. Roytman et al.12 found hospitalists more frequently prescribed afterload‐reducing agents for congestive heart failure (CHF), but other studies have shown no differences in care quality for heart failure.13, 14 Importantly, no studies have examined the role of hospitalists in the care of patients with acute myocardial infarction (AMI). In addition, studies have not addressed the effect of hospitalists at the hospital level to understand whether hospitalists have broader system‐level effects reflected by overall hospital performance.
We hypothesized that the presence of hospitalists within a hospital would be associated with improvements in hospital‐level adherence to publicly reported quality process measures, and having a greater percentage of patients admitted by hospitalists would be associated with improved performance. To test these hypotheses, we linked data from a statewide census of hospitalists with data collected as part of a hospital quality‐reporting initiative.
Materials and Methods
Study Sites
We examined the performance of 209 hospitals (63% of all 334 non‐federal facilities in California) participating in the California Hospital Assessment and Reporting Taskforce (CHART) at the time of the survey. CHART is a voluntary quality reporting initiative that began publicly reporting hospital quality data in January 2006.
Hospital‐level Organizational, Case‐mix, and Quality Data
Hospital organizational characteristics (eg, bed size) were obtained from publicly available discharge and utilization data sets from the California Office of Statewide Health Planning and Development (OSHPD). We also linked hospital‐level patient‐mix data (eg, race) from these OSHPD files.
We obtained quality of care data from CHART for January 2006 through June 2007, the time period corresponding to the survey. Quality metrics included 16 measures collected by the Center for Medicare and Medicaid Services (www.cms.hhs.gov) and extensively used in quality research.1, 4, 13, 15‐17 Rather than define a single measure, we examined multiple process measures, anticipating differential impacts of hospitalists on various processes of care for AMI, CHF, and pneumonia. Measures were further divided among those that are usually measured upon initial presentation to the hospital and those that are measured throughout the entire hospitalization and discharge. This division reflects the division of care in the hospital, where emergency room physicians are likely to have a more critical role for admission processes.
Survey Process
We surveyed all nonfederal, acute care hospitals in California that participated in CHART.2 We first identified contacts at each site via professional society mailing lists. We then sent web‐based surveys to all with available email addresses and a fax/paper survey to the remainder. We surveyed individuals between October 2006 and April 2007 and repeated the process at intervals of 1 to 3 weeks. For remaining nonrespondents, we placed a direct call unless consent to survey had been specifically refused. We contacted the following persons in sequence: (1) hospital executives or administrative leaders; (2) hospital medicine department leaders; (3) admitting emergency room personnel or medical staff officers; and (4) hospital website information. In the case of multiple responses with disagreement, the hospital/hospitalist leader's response was treated as the primary source. At each step, respondents were asked to answer questions only if they had a direct working knowledge of their hospitalist services.
Survey Data
Our key survey question to all respondents included whether the respondents could confirm their hospitals had at least one hospitalist medicine group. Hospital leaders were also asked to participate in a more comprehensive survey of their organizational and clinical characteristics. Within the comprehensive survey, leaders also provided estimates of the percent of general medical patients admitted by hospitalists. This measure, used in prior surveys of hospital leaders,9 was intended to be an easily understood approximation of the intensity of hospitalist utilization in any given hospital. A more rigorous, direct measure was not feasible due to the complexity of obtaining admission data over such a large, diverse set of hospitals.
Process Performance Measures
AMI measures assessed at admission included aspirin and ‐blocker administration within 24 hours of arrival. AMI measures assessed at discharge included aspirin administration, ‐blocker administration, angiotensin converting enzyme inhibitor (ACE‐I) (or angiotensin receptor blocker [ARB]) administration for left ventricular (LV) dysfunction, and smoking cessation counseling. There were no CHF admission measures. CHF discharge measures included assessment of LV function, the use of an ACE‐I or ARB for LV dysfunction, and smoking cessation counseling. Pneumonia admission measures included the drawing of blood cultures prior to the receipt of antibiotics, timely administration of initial antibiotics (<8 hours), and antibiotics consistent with recommendations. Pneumonia discharge measures included pneumococcal vaccination, flu vaccination, and smoking cessation counseling.
For each performance measure, we quantified the percentage of missed quality opportunities, defined as the number of patients who did not receive a care process divided by the number of eligible patients, multiplied by 100. In addition, we calculated composite scores for admission and discharge measures across each condition. We summed the numerators and denominators of individual performance measures to generate a disease‐specific composite numerator and denominator. Both individual and composite scores were produced using methodology outlined by the Center for Medicare & Medicaid Services.18 In order to retain as representative a sample of hospitals as possible, we calculated composite scores for hospitals that had a minimum of 25 observations in at least 2 of the quality indicators that made up each composite score.
Statistical Analysis
We used chi‐square tests, Student t tests, and Mann‐Whitney tests, where appropriate, to compare hospital‐level characteristics of hospitals that utilized hospitalists vs. those that did not. Similar analyses were performed among the subset of hospitals that utilized hospitalists. Among this subgroup of hospitals, we compared hospital‐level characteristics between hospitals that provided information regarding the percent of patients admitted by hospitalists vs. those who did not provide this information.
We used multivariable, generalized linear regression models to assess the relationship between having at least 1 hospitalist group and the percentage of missed quality of care measures. Because percentages were not normally distributed (ie, a majority of hospitals had few missed opportunities, while a minority had many), multivariable models employed log‐link functions with a gamma distribution.19, 20 Coefficients for our key predictor (presence of hospitalists) were transformed back to the original units (percentage of missed quality opportunities) so that a positive coefficient represented a higher number of quality measures missed relative to hospitals without hospitalists. Models were adjusted for factors previously reported to be associated with care quality. Hospital organizational characteristics included the number of beds, teaching status, registered nursing (RN) hours per adjusted patient day, and hospital ownership (for‐profit vs. not‐for‐profit). Hospital patient mix factors included annual percentage of admissions by insurance status (Medicare, Medicaid, other), annual percentage of admissions by race (white vs. nonwhite), annual percentage of do‐not‐resuscitate status at admission, and mean diagnosis‐related group‐based case‐mix index.21 We additionally adjusted for the number of cardiac catheterizations, a measure that moderately correlates with the number of cardiologists and technology utilization.22‐24 In our subset analysis among those hospitals with hospitalists, our key predictor for regression analyses was the percentage of patients admitted by hospitalists. For ease of interpretation, the percentage of patients admitted by hospitalists was centered on the mean across all respondent hospitals, and we report the effect of increasing by 10% the percentage of patients admitted by hospitalists. Models were adjusted for the same hospital organizational characteristics listed above. For those models, a positive coefficient also meant a higher number of measures missed.
For both sets of predictors, we additionally tested for the presence of interactions between the predictors and hospital bed size (both continuous as well as dichotomized at 150 beds) in composite measure performance, given the possibility that any hospitalist effect may be greater among smaller, resource‐limited hospitals. Tests for interaction were performed with the likelihood ratio test. In addition, to minimize any potential bias or loss of power that might result from limiting the analysis to hospitals with complete data, we used the multivariate imputation by chained equations method, as implemented in STATA 9.2 (StataCorp, College Station, TX), to create 10 imputed datasets.25 Imputation of missing values was restricted to confounding variables. Standard methods were then used to combine results over the 10 imputed datasets. We also applied Bonferroni corrections to composite measure tests based on the number of composites generated (n = 5). Thus, for the 5 inpatient composites created, standard definitions of significance (P 0.05) were corrected by dividing composite P values by 5, requiring P 0.01 for significance. The institutional review board of the University of California, San Francisco, approved the study. All analyses were performed using STATA 9.2.
Results
Characteristics of Participating Sites
There were 209 eligible hospitals. All 209 (100%) hospitals provided data about the presence or absence of hospitalists via at least 1 of our survey strategies. The majority of identification of hospitalist utilization was via contact with either hospital or hospitalist leaders, n = 147 (70.3%). Web‐sites informed hospitalist prevalence in only 3 (1.4%) hospitals. There were 8 (3.8%) occurrences of disagreement between sources, all of which had available hospital/hospitalist leader responses. Only 1 (0.5%) hospital did not have the minimum 25 patients eligible for any disease‐specific quality measures during the data reporting period. Collectively, the remaining 208 hospitals accounted for 81% of California's acute care hospital population.
Comparisons of Sites With Hospitalists and Those Without
A total of 170 hospitals (82%) participating in CHART used hospitalists. Hospitals with and without hospitalists differed by a variety of characteristics (Table 1). Sites with hospitalists were larger, less likely to be for‐profit, had more registered nursing hours per day, and performed more cardiac catheterizations.
| Characteristic | Hospitals Without Hospitalists (n = 38) | Hospitals With Hospitalists (n = 170) | P Value* |
|---|---|---|---|
| |||
| Number of beds, n (% of hospitals) | <0.001 | ||
| 0‐99 | 16 (42.1) | 14 (8.2) | |
| 100‐199 | 8 (21.1) | 44 (25.9) | |
| 200‐299 | 7 (18.4) | 42 (24.7) | |
| 300+ | 7 (18.4) | 70 (41.2) | |
| For profit, n (% of hospitals) | 9 (23.7) | 18 (10.6) | 0.03 |
| Teaching hospital, n (% of hospitals) | 7 (18.4) | 55 (32.4) | 0.09 |
| RN hours per adjusted patient day, number of hours (IQR) | 7.4 (5.7‐8.6) | 8.5 (7.4‐9.9) | <0.001 |
| Annual cardiac catheterizations, n (IQR) | 0 (0‐356) | 210 (0‐813) | 0.007 |
| Hospital total census days, n (IQR) | 37161 (14910‐59750) | 60626 (34402‐87950) | <0.001 |
| ICU total census, n (IQR) | 2193 (1132‐4289) | 3855 (2489‐6379) | <0.001 |
| Medicare insurance, % patients (IQR) | 36.9 (28.5‐48.0) | 35.3(28.2‐44.3) | 0.95 |
| Medicaid insurance, % patients (IQR) | 21.0 (12.7‐48.3) | 16.6 (5.6‐27.6) | 0.02 |
| Race, white, % patients (IQR) | 53.7 (26.0‐82.7) | 59.1 (45.6‐74.3) | 0.73 |
| DNR at admission, % patients (IQR) | 3.6 (2.0‐6.4) | 4.4 (2.7‐7.1) | 0.12 |
| Case‐mix index, index (IQR) | 1.05 (0.90‐1.21) | 1.13 (1.01‐1.26) | 0.11 |
Relationship Between Hospitalist Group Utilization and the Percentage of Missed Quality Opportunities
Table 2 shows the frequency of missed quality opportunities in sites with hospitalists compared to those without. In general, for both individual and composite measures of quality, multivariable adjustment modestly attenuated the observed differences between the 2 groups of hospitals. We present only the more conservative adjusted estimates.
| Quality Measure | Number of Hospitals | Adjusted Mean % Missed Quality Opportunities (95% CI) | Difference With Hospitalists | Relative % Change | P Value | |
|---|---|---|---|---|---|---|
| Hospitals Without Hospitalists | Hospitals With Hospitalists | |||||
| ||||||
| Acute myocardial infarction | ||||||
| Admission measures | ||||||
| Aspirin at admission | 193 | 3.7 (2.4‐5.1) | 3.4 (2.3‐4.4) | 0.3 | 10.0 | 0.44 |
| Beta‐blocker at admission | 186 | 7.8 (4.7‐10.9) | 6.4 (4.4‐8.3) | 1.4 | 18.3 | 0.19 |
| AMI admission composite | 186 | 5.5 (3.6‐7.5) | 4.8 (3.4‐6.1) | 0.7 | 14.3 | 0.26 |
| Hospital/discharge measures | ||||||
| Aspirin at discharge | 173 | 7.5 (4.5‐10.4) | 5.2 (3.4‐6.9) | 2.3 | 31.0 | 0.02 |
| Beta‐blocker at discharge | 179 | 6.6 (3.8‐9.4) | 5.9 (3.6‐8.2) | 0.7 | 9.6 | 0.54 |
| ACE‐I/ARB at discharge | 119 | 20.7 (9.5‐31.8) | 11.8 (6.6‐17.0) | 8.9 | 43.0 | 0.006 |
| Smoking cessation counseling | 193 | 3.8 (2.4‐5.1) | 3.4 (2.4‐4.4) | 0.4 | 10.0 | 0.44 |
| AMI hospital/discharge composite | 179 | 6.4 (4.1‐8.6) | 5.3 (3.7‐6.8) | 1.1 | 17.6 | 0.16 |
| Congestive heart failure | ||||||
| Hospital/discharge measures | ||||||
| Ejection fraction assessment | 208 | 12.6 (7.7‐17.6) | 6.5 (4.6‐8.4) | 6.1 | 48.2 | <0.001 |
| ACE‐I/ARB at discharge | 201 | 14.7 (10.0‐19.4) | 12.9 (9.8‐16.1) | 1.8 | 12.1 | 0.31 |
| Smoking cessation counseling | 168 | 9.1 (2.9‐15.4) | 9.0 (4.2‐13.8) | 0.1 | 1.8 | 0.98 |
| CHF hospital/discharge composite | 201 | 12.2 (7.9‐16.5) | 8.2 (6.2‐10.2) | 4.0 | 33.1 | 0.006* |
| Pneumonia | ||||||
| Admission measures | ||||||
| Blood culture before antibiotics | 206 | 12.0 (9.1‐14.9) | 10.9 (8.8‐13.0) | 1.1 | 9.1 | 0.29 |
| Timing of antibiotics <8 hours | 208 | 5.8 (4.1‐7.5) | 6.2 (4.7‐7.7) | 0.4 | 6.9 | 0.56 |
| Initial antibiotic consistent with recommendations | 207 | 15.0 (11.6‐18.6) | 13.8 (10.9‐16.8) | 1.2 | 8.1 | 0.27 |
| Pneumonia admission composite | 207 | 10.5 (8.5‐12.5) | 9.9 (8.3‐11.5) | 0.6 | 5.9 | 0.37 |
| Hospital/discharge measures | ||||||
| Pneumonia vaccine | 208 | 29.4 (19.5‐39.2) | 27.1 (19.9‐34.3) | 2.3 | 7.7 | 0.54 |
| Influenza vaccine | 207 | 36.9 (25.4‐48.4) | 35.0 (27.0‐43.1) | 1.9 | 5.2 | 0.67 |
| Smoking cessation counseling | 196 | 15.4 (7.8‐23.1) | 13.9 (8.9‐18.9) | 1.5 | 10.2 | 0.59 |
| Pneumonia hospital/discharge composite | 207 | 29.6 (20.5‐38.7) | 27.3 (20.9‐33.6) | 2.3 | 7.8 | 0.51 |
Compared to hospitals without hospitalists, those with hospitalists did not have any statistically significant differences in the individual and composite admission measures for each of the disease processes. In contrast, there were statistically significant differences between hospitalist and nonhospitalist sites for many individual cardiac processes of care that typically occur after admission from the emergency room (ie, LV function assessment for CHF) or those that occurred at discharge (ie, aspirin and ACE‐I/ARB at discharge for AMI). Similarly, the composite discharge scores for AMI and CHF revealed better overall process measure performance at sites with hospitalists, although the AMI composite did not meet statistical significance. There were no statistically significant differences between groups for the pneumonia process measures assessed at discharge. In addition, for composite measures there were no statistically significant interactions between hospitalist prevalence and bed size, although there was a trend (P = 0.06) for the CHF discharge composite, with a larger effect of hospitalists among smaller hospitals.
Percent of Patients Admitted by Hospitalists
Of the 171 hospitals with hospitalists, 71 (42%) estimated the percent of patients admitted by their hospitalist physicians. Among the respondents, the mean and median percentages of medical patients admitted by hospitalists were 51% (SD = 25%) and 49% (IQR = 30‐70%), respectively. Thirty hospitals were above the sample mean. Compared to nonrespondent sites, respondent hospitals took care of more white patients; otherwise, respondent and nonrespondent hospitals were similar in terms of bed size, location, performance across each measure, and other observable characteristics (Supporting Information, Appendix 1).
Relationship Between the Estimated Percentages of Medical Patients Admitted by Hospitalists and Missed Quality Opportunities
Table 3 displays the change in missed quality measures associated with each additional 10% of patients estimated to be admitted by hospitalists. A higher estimated percentage of patients admitted by hospitalists was associated with statistically significant improvements in quality of care across a majority of individual measures and for all composite discharge measures regardless of condition. For example, every 10% increase in the mean estimated number of patients admitted by hospitalists was associated with a mean of 0.6% (P < 0.001), 0.5% (P = 0.004), and 1.5% (P = 0.006) fewer missed quality opportunities for AMI, CHF, and pneumonia discharge process measures composites, respectively. In addition, for these composite measures, there were no statistically significant interactions between the estimated percentage of patients admitted by hospitalists and bed size (dichotomized at 150 beds), although there was a trend (P = 0.09) for the AMI discharge composite, with a larger effect of hospitalists among smaller hospitals.
| Quality Measure | Number of Hospitals | Adjusted % Missed Quality Opportunities (95% CI) | Difference With Hospitalists | Relative Percent Change | P Value | |
|---|---|---|---|---|---|---|
| Among Hospitals With Mean % of Patients Admitted by Hospitalists | Among Hospitals With Mean + 10% of Patients Admitted by Hospitalists | |||||
| ||||||
| Acute myocardial infarction | ||||||
| Admission measures | ||||||
| Aspirin at admission | 70 | 3.4 (2.3‐4.6) | 3.1 (2.0‐3.1) | 0.3 | 10.2 | 0.001 |
| Beta‐blocker at admission | 65 | 5.8 (3.4‐8.2) | 5.1 (3.0‐7.3) | 0.7 | 11.9 | <0.001 |
| AMI admission composite | 65 | 4.5 (2.9‐6.1) | 4.0 (2.6‐5.5) | 0.5 | 11.1 | <0.001* |
| Hospital/discharge measures | ||||||
| Aspirin at discharge | 62 | 5.1 (3.3‐6.9) | 4.6 (3.1‐6.2) | 0.5 | 9.0 | 0.03 |
| Beta‐blocker at discharge | 63 | 5.1 (2.9‐7.2) | 4.3 (2.5‐6.0) | 0.8 | 15.4 | <0.001 |
| ACE‐I/ARB at discharge | 44 | 11.4 (6.2‐16.6) | 10.3 (5.4‐15.1) | 1.1 | 10.0 | 0.02 |
| Smoking cessation counseling | 70 | 3.4 (2.3‐4.6) | 3.1 (2.0‐4.1) | 0.3 | 10.2 | 0.001 |
| AMI hospital/discharge composite | 63 | 5.0 (3.3‐6.7) | 4.4 (3.0‐5.8) | 0.6 | 11.3 | 0.001* |
| Congestive heart failure | ||||||
| Hospital/discharge measures | ||||||
| Ejection fraction assessment | 71 | 5.9 (4.1‐7.6) | 5.6 (3.9‐7.2) | 0.3 | 2.9 | 0.07 |
| ACE‐I/ARB at discharge | 70 | 12.3 (8.6‐16.0) | 11.4 (7.9‐15.0) | 0.9 | 7.1 | 0.008* |
| Smoking cessation counseling | 56 | 8.4 (4.1‐12.6) | 8.2 (4.2‐12.3) | 0.2 | 1.7 | 0.67 |
| CHF hospital/discharge composite | 70 | 7.7 (5.8‐9.6) | 7.2 (5.4‐9.0) | 0.5 | 6.0 | 0.004* |
| Pneumonia | ||||||
| Admission measures | ||||||
| Timing of antibiotics <8 hours | 71 | 5.9 (4.2‐7.6) | 5.9 (4.1‐7.7) | 0.0 | 0.0 | 0.98 |
| Blood culture before antibiotics | 71 | 10.0 (8.0‐12.0) | 9.8 (7.7‐11.8) | 0.2 | 2.6 | 0.18 |
| Initial antibiotic consistent with recommendations | 71 | 13.3 (10.4‐16.2) | 12.9 (9.9‐15.9) | 0.4 | 2.8 | 0.20 |
| Pneumonia admission composite | 71 | 9.4 (7.7‐11.1) | 9.2 (7.6‐10.9) | 0.2 | 1.8 | 0.23 |
| Hospital/discharge measures | ||||||
| Pneumonia vaccine | 71 | 27.0 (19.2‐34.8) | 24.7 (17.2‐32.2) | 2.3 | 8.4 | 0.006 |
| Influenza vaccine | 71 | 34.1 (25.9‐42.2) | 32.6 (24.7‐40.5) | 1.5 | 4.3 | 0.03 |
| Smoking cessation counseling | 67 | 15.2 (9.8‐20.7) | 15.0 (9.6‐20.4) | 0.2 | 2.0 | 0.56 |
| Pneumonia hospital/discharge composite | 71 | 26.7 (20.3‐33.1) | 25.2 (19.0‐31.3) | 1.5 | 5.8 | 0.006* |
In order to test the robustness of our results, we carried out 2 secondary analyses. First, we used multivariable models to generate a propensity score representing the predicted probability of being assigned to a hospital with hospitalists. We then used the propensity score as an additional covariate in subsequent multivariable models. In addition, we performed a complete‐case analysis (including only hospitals with complete data, n = 204) as a check on the sensitivity of our results to missing data. Neither analysis produced results substantially different from those presented.
Discussion
In this cross‐sectional analysis of hospitals participating in a voluntary quality reporting initiative, hospitals with at least 1 hospitalist group had fewer missed discharge care process measures for CHF, even after adjusting for hospital‐level characteristics. In addition, as the estimated percentage of patients admitted by hospitalists increased, the percentage of missed quality opportunities decreased across all measures. The observed relationships were most apparent for measures that could be completed at any time during the hospitalization and at discharge. While it is likely that hospitalists are a marker of a hospital's ability to invest in systems (and as a result, care improvement initiatives), the presence of a potential dose‐response relationship suggests that hospitalists themselves may have a role in improving processes of care.
Our study suggests a generally positive, but mixed, picture of hospitalists' effects on quality process measure performance. Lack of uniformity across measures may depend on the timing of the process measure (eg, whether or not the process is measured at admission or discharge). For example, in contrast to admission process measures, we more commonly observed a positive association between hospitalists and care quality on process measures targeting processes that generally took place later in hospitalization or at discharge. Many admission process measures (eg, door to antibiotic time, blood cultures, and appropriate initial antibiotics) likely occurred prior to hospitalist involvement in most cases and were instead under the direction of emergency medicine physicians. Performance on these measures would not be expected to relate to use of hospitalists, and that is what we observed.
In addition to the timing of when a process was measured or took place, associations between hospitalists and care quality vary by disease. The apparent variation in impact of hospitalists by disease (more impact for cardiac conditions, less for pneumonia) may relate primarily to the characteristics of the processes of care that were measured for each condition. For example, one‐half of the pneumonia process measures related to care occurring within a few hours of admission, while the other one‐half (smoking cessation advice and streptococcal and influenza vaccines) were often administered per protocol or by nonphysician providers.26‐29 However, more of the cardiac measures required physician action (eg, prescription of an ACE‐I at discharge). Alternatively, unmeasured confounders important in the delivery of cardiac care might play an important role in the relationship between hospitalists and cardiac process measure performance.
Our approach to defining hospitalists bears mention as well. While a dichotomous measure of having hospitalists available was only statistically significant for the single CHF discharge composite measure, our measure of hospitalist availabilitythe percentage of patients admitted by hospitalistswas more strongly associated with a larger number of quality measures. Contrast between the dichotomous and continuous measures may have statistical explanations (the power to see differences between 2 groups is more limited with use of a binary predictor, which itself can be subject to bias),30 but may also indicate a dose‐response relationship. A larger number of admissions to hospitalists may help standardize practices, as care is concentrated in a smaller number of physicians' hands. Moreover, larger hospitalist programs may be more likely to have implemented care standardization or quality improvement processes or to have been incorporated into (or lead) hospitals' quality infrastructures. Finally, presence of larger hospitalist groups may be a marker for a hospital's capacity to make hospital‐wide investments in improvement. However, the association between the percentage of patients admitted by hospitalists and care quality persisted even after adjustment for many measures plausibly associated with ability to invest in care quality.
Our study has several limitations. First, although we used a widely accepted definition of hospitalists endorsed by the Society of Hospital Medicine, there are no gold standard definitions for a hospitalist's job description or skill set. As a result, it is possible that a model utilizing rotating internists (from a multispecialty group) might have been misidentified as a hospitalist model. Second, our findings represent a convenience sample of hospitals in a voluntary reporting initiative (CHART) and may not be applicable to hospitals that are less able to participate in such an endeavor. CHART hospitals are recognized to be better performers than the overall California population of hospitals, potentially decreasing variability in our quality of care measures.2 Third, there were significant differences between our comparison groups within the CHART hospitals, including sample size. Although we attempted to adjust our analyses for many important potential confounders and applied conservative measures to assess statistical significance, given the baseline differences, we cannot rule out the possibility of residual confounding by unmeasured factors. Fourth, as described above, this observational study cannot provide robust evidence to support conclusions regarding causality. Fifth, the estimation of the percent of patients admitted by hospitalists is unvalidated and based upon self‐reported and incomplete (41% of respondents) data. We are somewhat reassured by the fact that respondents and nonresponders were similar across all hospital characteristics, as well as outcomes. Sixth, misclassification of the estimated percentage of patients admitted by hospitalists may have influenced our results. Although possible, misclassification often biases results toward the null, potentially weakening any observed association. Given that our respondents were not aware of our hypotheses, there is no reason to expect recall issues to bias the results one way or the other. Finally, for many performance measures, overall performance was excellent among all hospitals (eg, aspirin at admission) with limited variability, thus limiting the ability to assess for differences.
In summary, in a large, cross‐sectional study of California hospitals participating in a voluntary quality reporting initiative, the presence of hospitalists was associated with modest improvements in hospital‐level performance of quality process measures. In addition, we found a relationship between the percentage of patients admitted by hospitalists and improved process measure adherence. Although we cannot determine causality, our data support the hypothesis that dedicated hospital physicians can positively affect the quality of care. Future research should examine this relationship in other settings and should address causality using broader measures of quality including both processes and outcomes.
Acknowledgements
The authors acknowledge Teresa Chipps, BS, Center for Health Services Research, Division of General Internal Medicine and Public Health, Department of Medicine, Vanderbilt University, Nashville, TN, for her administrative and editorial assistance in the preparation of this manuscript.
- ,,,.Care in U.S. hospitals—the Hospital Quality Alliance Program.N Engl J Med.2005;353:265–274.
- CalHospitalCompare.org: online report card simplifies the search for quality hospital care. Available at: http://www.chcf.org/topics/hospitals/index.cfm?itemID=131387. Accessed September 2009.
- ,,, et al.Hospital characteristics and quality of care.JAMA.1992;268:1709–1714.
- ,,,,.Patient and hospital characteristics associated with recommended processes of care for elderly patients hospitalized with pneumonia: results from the Medicare quality indicator system pneumonia module.Arch Intern Med.2002;162:827–833.
- ,,, et al.A systematic review and meta‐analysis of studies comparing mortality rates of private for‐profit and private not‐for‐profit hospitals.CMAJ.2002;166:1399–1406.
- ,.Teaching hospitals and quality of care: a review of the literature.Milbank Q.2002;80:569–593.
- ,,,,.Nurse‐staffing levels and the quality of care in hospitals.N Engl J Med.2002;346:1715–1722.
- ,,,.Growth in the care of older patients by hospitalists in the United States.N Engl J Med.2009;360:1102–1112.
- ,,,.Health care market trends and the evolution of hospitalist use and roles.J Gen Intern Med.2005;20:101–107.
- ,,,.Comparison of processes and outcomes of pneumonia care between hospitalists and community‐based primary care physicians.Mayo Clin Proc.2002;77:1053–1058.
- ,,,.Comparison of hospitalists and nonhospitalists regarding core measures of pneumonia care.Am J Manag Care.2007;13:129–132.
- ,,.Comparison of practice patterns of hospitalists and community physicians in the care of patients with congestive heart failure.J Hosp Med.2008;3:35–41.
- ,,, et al.Quality of care for decompensated heart failure: comparable performance between academic hospitalists and non‐hospitalists.J Gen Intern Med.2008;23:1399–1406.
- ,,,,.Quality of care for patients hospitalized with heart failure: assessing the impact of hospitalists.Arch Intern Med.2002;162:1251–1256.
- ,,,.The inverse relationship between mortality rates and performance in the Hospital Quality Alliance measures.Health Aff.2007;26:1104–1110.
- ,,,,.Does the Leapfrog program help identify high‐quality hospitals?Jt Comm J Qual Patient Saf.2008;34:318–325.
- ,,,,,.Outcomes of care by hospitalists, general internists, and family physicians.N Engl J Med.2007;357:2589–2600.
- CMS HQI demonstration project—composite quality score methodology overview. Available at: http://www.cms.hhs.gov/HospitalQualityInits/downloads/HospitalCompositeQualityScoreMethodologyOverview.pdf. Accessed September 2009.
- ,,.Modeling risk using generalized linear models.J Health Econ.1999;18:153–171.
- ,,.Generalized modeling approaches to risk adjustment of skewed outcomes data.J Health Econ.2005;24:465–488.
- ,,, et al.Quality of care for the treatment of acute medical conditions in US hospitals.Arch Intern Med.2006;166:2511–2517.
- ,,, et al.The Dartmouth Atlas of Cardiovascular Health Care.Chicago:AHA Press;1999. Current data from the Dartmouth Institute for Health Policy and Clinical Practice, Lebanon, NH. Available at: http://www.dartmouthatlas.org/atlases/atlas_ series.shtm. Accessed September 2009.
- ,,.Differences in per capita rates of revascularization and in choice of revascularization procedure for eleven states.BMC Health Serv Res.2006;6:35.
- ,,.The relationship between physician supply, cardiovascular health service use and cardiac disease burden in Ontario: supply‐need mismatch.Can J Card.2008;24:187.
- .Multiple imputation: a primer.Stat Methods Med Res.1999;8:3–15.
- .Nursing intervention and smoking cessation: Meta‐analysis update.Heart Lung.2006;35:147–163.
- .Ten‐year durability and success of an organized program to increase influenza and pneumococcal vaccination rates among high‐risk adults.Am J Med.1998;105:385–392.
- ,,, et al.Role of student pharmacist interns in hospital‐based standing orders pneumococcal vaccination program.J Am Pharm Assoc.2007;47:404–409.
- ,,,.Effect of a pharmacist‐managed program of pneumococcal and influenza immunization on vaccination rates among adult inpatients.Am J Health Syst Pharm.2003;60:1767–1771.
- ,,.Dichotomizing continuous predictors in multiple regression: a bad idea.Stat Med.2006;25:127–141.
- ,,,.Care in U.S. hospitals—the Hospital Quality Alliance Program.N Engl J Med.2005;353:265–274.
- CalHospitalCompare.org: online report card simplifies the search for quality hospital care. Available at: http://www.chcf.org/topics/hospitals/index.cfm?itemID=131387. Accessed September 2009.
- ,,, et al.Hospital characteristics and quality of care.JAMA.1992;268:1709–1714.
- ,,,,.Patient and hospital characteristics associated with recommended processes of care for elderly patients hospitalized with pneumonia: results from the Medicare quality indicator system pneumonia module.Arch Intern Med.2002;162:827–833.
- ,,, et al.A systematic review and meta‐analysis of studies comparing mortality rates of private for‐profit and private not‐for‐profit hospitals.CMAJ.2002;166:1399–1406.
- ,.Teaching hospitals and quality of care: a review of the literature.Milbank Q.2002;80:569–593.
- ,,,,.Nurse‐staffing levels and the quality of care in hospitals.N Engl J Med.2002;346:1715–1722.
- ,,,.Growth in the care of older patients by hospitalists in the United States.N Engl J Med.2009;360:1102–1112.
- ,,,.Health care market trends and the evolution of hospitalist use and roles.J Gen Intern Med.2005;20:101–107.
- ,,,.Comparison of processes and outcomes of pneumonia care between hospitalists and community‐based primary care physicians.Mayo Clin Proc.2002;77:1053–1058.
- ,,,.Comparison of hospitalists and nonhospitalists regarding core measures of pneumonia care.Am J Manag Care.2007;13:129–132.
- ,,.Comparison of practice patterns of hospitalists and community physicians in the care of patients with congestive heart failure.J Hosp Med.2008;3:35–41.
- ,,, et al.Quality of care for decompensated heart failure: comparable performance between academic hospitalists and non‐hospitalists.J Gen Intern Med.2008;23:1399–1406.
- ,,,,.Quality of care for patients hospitalized with heart failure: assessing the impact of hospitalists.Arch Intern Med.2002;162:1251–1256.
- ,,,.The inverse relationship between mortality rates and performance in the Hospital Quality Alliance measures.Health Aff.2007;26:1104–1110.
- ,,,,.Does the Leapfrog program help identify high‐quality hospitals?Jt Comm J Qual Patient Saf.2008;34:318–325.
- ,,,,,.Outcomes of care by hospitalists, general internists, and family physicians.N Engl J Med.2007;357:2589–2600.
- CMS HQI demonstration project—composite quality score methodology overview. Available at: http://www.cms.hhs.gov/HospitalQualityInits/downloads/HospitalCompositeQualityScoreMethodologyOverview.pdf. Accessed September 2009.
- ,,.Modeling risk using generalized linear models.J Health Econ.1999;18:153–171.
- ,,.Generalized modeling approaches to risk adjustment of skewed outcomes data.J Health Econ.2005;24:465–488.
- ,,, et al.Quality of care for the treatment of acute medical conditions in US hospitals.Arch Intern Med.2006;166:2511–2517.
- ,,, et al.The Dartmouth Atlas of Cardiovascular Health Care.Chicago:AHA Press;1999. Current data from the Dartmouth Institute for Health Policy and Clinical Practice, Lebanon, NH. Available at: http://www.dartmouthatlas.org/atlases/atlas_ series.shtm. Accessed September 2009.
- ,,.Differences in per capita rates of revascularization and in choice of revascularization procedure for eleven states.BMC Health Serv Res.2006;6:35.
- ,,.The relationship between physician supply, cardiovascular health service use and cardiac disease burden in Ontario: supply‐need mismatch.Can J Card.2008;24:187.
- .Multiple imputation: a primer.Stat Methods Med Res.1999;8:3–15.
- .Nursing intervention and smoking cessation: Meta‐analysis update.Heart Lung.2006;35:147–163.
- .Ten‐year durability and success of an organized program to increase influenza and pneumococcal vaccination rates among high‐risk adults.Am J Med.1998;105:385–392.
- ,,, et al.Role of student pharmacist interns in hospital‐based standing orders pneumococcal vaccination program.J Am Pharm Assoc.2007;47:404–409.
- ,,,.Effect of a pharmacist‐managed program of pneumococcal and influenza immunization on vaccination rates among adult inpatients.Am J Health Syst Pharm.2003;60:1767–1771.
- ,,.Dichotomizing continuous predictors in multiple regression: a bad idea.Stat Med.2006;25:127–141.
Copyright © 2010 Society of Hospital Medicine
Hope
Hello Mrs. K, I'm Dr. Baru, I said. I squeezed the hand limply resting on her cover with my own gloved one.
The room was quiet except for the sighing of her ventilator in the background. She had a broad round face with high cheek bones. Her skin was wrinkle‐free except around the eyes and the corners of her mouth. She breathed peacefully through her tracheostomy. She slowly nodded her head when I squeezed her hand and her blue eyes shone as she smiled broadly. Her son stood at my side, his mouth set in a straight line his eyes gazing intently at his mom. His handshake was firm and brisk, a single downstroke.
I was called in as the Palliative Care consultant. She's in denial, I was told. There's nothing more that we can do for her here. She had already been in the hospital for 2 months but this was the first time I was meeting her and her son. With the help of the Polish interpreter and her son, who had become adept at reading her lips and translating her breathy rasps, I began to sift through all of the information that they had been told, all of the information they had gathered on their own, and what they understood.
Mrs. K was 59 years old. She'd given up her job as a kindergarten teacher and come from Poland 3 years ago to help care for her first grandchild. Two years later, her daughter‐in‐law delivered 2 more grandchildren: twins. Just weeks after the delivery, Mrs. K was diagnosed with multiple myeloma. She was told that her prognosis was good and that, with chemotherapy, she had years to live. She thought about returning home but she felt fine. Though she didn't yet qualify for any kind of insurance, she was getting good care in our County health system. Besides, her grandchildren meant everything to her and her son and daughter‐in‐law needed her now more than ever.
Five months into her treatment she developed pain in her neck and started noticing numbness in her hands. She immediately went to the hospital where she was found to have a tumor in her cervical spine. Despite early radiation and surgery, she was completely paralyzed and dependent on mechanical ventilation within a week. In a matter of days she had been torn from life as she knew it.
It became clear during our conversation that, though Mrs. K was not physically uncomfortable, being confined to the hospital was difficult for her. Her grandchildren couldn't visit because she was on contact precautions. She missed them deeply. She missed sitting on her porch drinking her morning coffee. Unable to move her head, she spent most of her day staring at the ceiling or at the TV watching shows in a language she couldn't understand. She had met countless doctors, nurses, and medical personnel, endured multiple complications, including a pulseless arrest, and had been placed in 3 different ICUs. Yet she was unwavering in her desire to remain on the ventilator and continue doing everything.
Both she and her son expected that the treatments she had been getting would help get her off the ventilator so that she could go home. I struggled to balance their hopes with the information at hand, exploring realistic goals.
Could she go to a nursing home and wait and see if she will recover? I know they have these for people that are on ventilators, her son asked.
This was not going to be possible given her disease. Her paralysis was complete and permanent. She would not recover the ability to breathe on her own. Besides, without insurance they would have to pay for these services. It was not realistic to hope for this.
Could we fly her back to Poland so that she can die and be buried there?
She was not stable enough to fly without medical assistance. Furthermore, she would need to be in contact isolation given the virulence of her uniquely resistant bacteria. The cost to arrange an air ambulance was exorbitant and unaffordable on her son's electrician salary. It was not realistic to hope for this.
Well, if she can't go back to Poland and can't get off of the ventilator, could we set up a ventilator at home so that we can care for her there until she dies?
I explained that this would require help from medical personnel trained in ventilator management. They would also need assistance from individuals trained in palliative care to insure that Mrs. K had adequate nursing and symptom relief, particularly in the event of a medical emergency or a complication with the ventilator. The family would be required to pay for these services out of pocket. After spending hours contacting hospice agencies, medical suppliers, nursing agencies, friends of the family, and community organizations it became clear that even though the family was willing to bankrupt themselves for their mother's care there was not a safe, affordable solution. It was not realistic to hope for this.
What can you do for me? Mrs. K asked.
My tongue sat numbly in my mouth. I felt a tide of shame and sorrow rising. Nothing! I thought, knowing not to say it. At times like this, we often fall back on training; I tried to force her into the round hole.
We can care for you here. We can insure that you are as comfortable as possible for whatever time you have left. We can shift our focus from life‐prolonging treatments to those that are purely focused on your comfort. We can stop those treatments that will interrupt the time that you spend with your family, and try to give you and your family as much space as possible to be together here in the ICU. As your death approaches we would work to keep you as comfortable and peaceful as possible and to allow your family to be with you here at your bedside, but we wouldn't try to prolong the dying process.
I don't WANT to die. I WANT to go home, I WANT to smell fresh air. I'm willing to take risks with my life for that, but not otherwise.
My impotence, my inability to give this woman any of the things that she was hoping for was overwhelming. Her suffering was overwhelming. I was unable to find a thread of hope in her world. I was failing my patient.
Feeling a sense of despair, I told her, I cannot help you breathe on your own or smell the fresh air or be with your grandchildren. None of those goals are realistic. I don't know what I can do for you, but I would like to continue to see you. I want to come back tomorrow.
I hope you do, she said, her blue eyes shining as she smiled softly.
I was struck by the words. Though my loftier goals had been frustrated, I realized that my efforts and my presence at her bedside alone were easing her sufferingthis is something that we all hope for.
Hello Mrs. K, I'm Dr. Baru, I said. I squeezed the hand limply resting on her cover with my own gloved one.
The room was quiet except for the sighing of her ventilator in the background. She had a broad round face with high cheek bones. Her skin was wrinkle‐free except around the eyes and the corners of her mouth. She breathed peacefully through her tracheostomy. She slowly nodded her head when I squeezed her hand and her blue eyes shone as she smiled broadly. Her son stood at my side, his mouth set in a straight line his eyes gazing intently at his mom. His handshake was firm and brisk, a single downstroke.
I was called in as the Palliative Care consultant. She's in denial, I was told. There's nothing more that we can do for her here. She had already been in the hospital for 2 months but this was the first time I was meeting her and her son. With the help of the Polish interpreter and her son, who had become adept at reading her lips and translating her breathy rasps, I began to sift through all of the information that they had been told, all of the information they had gathered on their own, and what they understood.
Mrs. K was 59 years old. She'd given up her job as a kindergarten teacher and come from Poland 3 years ago to help care for her first grandchild. Two years later, her daughter‐in‐law delivered 2 more grandchildren: twins. Just weeks after the delivery, Mrs. K was diagnosed with multiple myeloma. She was told that her prognosis was good and that, with chemotherapy, she had years to live. She thought about returning home but she felt fine. Though she didn't yet qualify for any kind of insurance, she was getting good care in our County health system. Besides, her grandchildren meant everything to her and her son and daughter‐in‐law needed her now more than ever.
Five months into her treatment she developed pain in her neck and started noticing numbness in her hands. She immediately went to the hospital where she was found to have a tumor in her cervical spine. Despite early radiation and surgery, she was completely paralyzed and dependent on mechanical ventilation within a week. In a matter of days she had been torn from life as she knew it.
It became clear during our conversation that, though Mrs. K was not physically uncomfortable, being confined to the hospital was difficult for her. Her grandchildren couldn't visit because she was on contact precautions. She missed them deeply. She missed sitting on her porch drinking her morning coffee. Unable to move her head, she spent most of her day staring at the ceiling or at the TV watching shows in a language she couldn't understand. She had met countless doctors, nurses, and medical personnel, endured multiple complications, including a pulseless arrest, and had been placed in 3 different ICUs. Yet she was unwavering in her desire to remain on the ventilator and continue doing everything.
Both she and her son expected that the treatments she had been getting would help get her off the ventilator so that she could go home. I struggled to balance their hopes with the information at hand, exploring realistic goals.
Could she go to a nursing home and wait and see if she will recover? I know they have these for people that are on ventilators, her son asked.
This was not going to be possible given her disease. Her paralysis was complete and permanent. She would not recover the ability to breathe on her own. Besides, without insurance they would have to pay for these services. It was not realistic to hope for this.
Could we fly her back to Poland so that she can die and be buried there?
She was not stable enough to fly without medical assistance. Furthermore, she would need to be in contact isolation given the virulence of her uniquely resistant bacteria. The cost to arrange an air ambulance was exorbitant and unaffordable on her son's electrician salary. It was not realistic to hope for this.
Well, if she can't go back to Poland and can't get off of the ventilator, could we set up a ventilator at home so that we can care for her there until she dies?
I explained that this would require help from medical personnel trained in ventilator management. They would also need assistance from individuals trained in palliative care to insure that Mrs. K had adequate nursing and symptom relief, particularly in the event of a medical emergency or a complication with the ventilator. The family would be required to pay for these services out of pocket. After spending hours contacting hospice agencies, medical suppliers, nursing agencies, friends of the family, and community organizations it became clear that even though the family was willing to bankrupt themselves for their mother's care there was not a safe, affordable solution. It was not realistic to hope for this.
What can you do for me? Mrs. K asked.
My tongue sat numbly in my mouth. I felt a tide of shame and sorrow rising. Nothing! I thought, knowing not to say it. At times like this, we often fall back on training; I tried to force her into the round hole.
We can care for you here. We can insure that you are as comfortable as possible for whatever time you have left. We can shift our focus from life‐prolonging treatments to those that are purely focused on your comfort. We can stop those treatments that will interrupt the time that you spend with your family, and try to give you and your family as much space as possible to be together here in the ICU. As your death approaches we would work to keep you as comfortable and peaceful as possible and to allow your family to be with you here at your bedside, but we wouldn't try to prolong the dying process.
I don't WANT to die. I WANT to go home, I WANT to smell fresh air. I'm willing to take risks with my life for that, but not otherwise.
My impotence, my inability to give this woman any of the things that she was hoping for was overwhelming. Her suffering was overwhelming. I was unable to find a thread of hope in her world. I was failing my patient.
Feeling a sense of despair, I told her, I cannot help you breathe on your own or smell the fresh air or be with your grandchildren. None of those goals are realistic. I don't know what I can do for you, but I would like to continue to see you. I want to come back tomorrow.
I hope you do, she said, her blue eyes shining as she smiled softly.
I was struck by the words. Though my loftier goals had been frustrated, I realized that my efforts and my presence at her bedside alone were easing her sufferingthis is something that we all hope for.
Hello Mrs. K, I'm Dr. Baru, I said. I squeezed the hand limply resting on her cover with my own gloved one.
The room was quiet except for the sighing of her ventilator in the background. She had a broad round face with high cheek bones. Her skin was wrinkle‐free except around the eyes and the corners of her mouth. She breathed peacefully through her tracheostomy. She slowly nodded her head when I squeezed her hand and her blue eyes shone as she smiled broadly. Her son stood at my side, his mouth set in a straight line his eyes gazing intently at his mom. His handshake was firm and brisk, a single downstroke.
I was called in as the Palliative Care consultant. She's in denial, I was told. There's nothing more that we can do for her here. She had already been in the hospital for 2 months but this was the first time I was meeting her and her son. With the help of the Polish interpreter and her son, who had become adept at reading her lips and translating her breathy rasps, I began to sift through all of the information that they had been told, all of the information they had gathered on their own, and what they understood.
Mrs. K was 59 years old. She'd given up her job as a kindergarten teacher and come from Poland 3 years ago to help care for her first grandchild. Two years later, her daughter‐in‐law delivered 2 more grandchildren: twins. Just weeks after the delivery, Mrs. K was diagnosed with multiple myeloma. She was told that her prognosis was good and that, with chemotherapy, she had years to live. She thought about returning home but she felt fine. Though she didn't yet qualify for any kind of insurance, she was getting good care in our County health system. Besides, her grandchildren meant everything to her and her son and daughter‐in‐law needed her now more than ever.
Five months into her treatment she developed pain in her neck and started noticing numbness in her hands. She immediately went to the hospital where she was found to have a tumor in her cervical spine. Despite early radiation and surgery, she was completely paralyzed and dependent on mechanical ventilation within a week. In a matter of days she had been torn from life as she knew it.
It became clear during our conversation that, though Mrs. K was not physically uncomfortable, being confined to the hospital was difficult for her. Her grandchildren couldn't visit because she was on contact precautions. She missed them deeply. She missed sitting on her porch drinking her morning coffee. Unable to move her head, she spent most of her day staring at the ceiling or at the TV watching shows in a language she couldn't understand. She had met countless doctors, nurses, and medical personnel, endured multiple complications, including a pulseless arrest, and had been placed in 3 different ICUs. Yet she was unwavering in her desire to remain on the ventilator and continue doing everything.
Both she and her son expected that the treatments she had been getting would help get her off the ventilator so that she could go home. I struggled to balance their hopes with the information at hand, exploring realistic goals.
Could she go to a nursing home and wait and see if she will recover? I know they have these for people that are on ventilators, her son asked.
This was not going to be possible given her disease. Her paralysis was complete and permanent. She would not recover the ability to breathe on her own. Besides, without insurance they would have to pay for these services. It was not realistic to hope for this.
Could we fly her back to Poland so that she can die and be buried there?
She was not stable enough to fly without medical assistance. Furthermore, she would need to be in contact isolation given the virulence of her uniquely resistant bacteria. The cost to arrange an air ambulance was exorbitant and unaffordable on her son's electrician salary. It was not realistic to hope for this.
Well, if she can't go back to Poland and can't get off of the ventilator, could we set up a ventilator at home so that we can care for her there until she dies?
I explained that this would require help from medical personnel trained in ventilator management. They would also need assistance from individuals trained in palliative care to insure that Mrs. K had adequate nursing and symptom relief, particularly in the event of a medical emergency or a complication with the ventilator. The family would be required to pay for these services out of pocket. After spending hours contacting hospice agencies, medical suppliers, nursing agencies, friends of the family, and community organizations it became clear that even though the family was willing to bankrupt themselves for their mother's care there was not a safe, affordable solution. It was not realistic to hope for this.
What can you do for me? Mrs. K asked.
My tongue sat numbly in my mouth. I felt a tide of shame and sorrow rising. Nothing! I thought, knowing not to say it. At times like this, we often fall back on training; I tried to force her into the round hole.
We can care for you here. We can insure that you are as comfortable as possible for whatever time you have left. We can shift our focus from life‐prolonging treatments to those that are purely focused on your comfort. We can stop those treatments that will interrupt the time that you spend with your family, and try to give you and your family as much space as possible to be together here in the ICU. As your death approaches we would work to keep you as comfortable and peaceful as possible and to allow your family to be with you here at your bedside, but we wouldn't try to prolong the dying process.
I don't WANT to die. I WANT to go home, I WANT to smell fresh air. I'm willing to take risks with my life for that, but not otherwise.
My impotence, my inability to give this woman any of the things that she was hoping for was overwhelming. Her suffering was overwhelming. I was unable to find a thread of hope in her world. I was failing my patient.
Feeling a sense of despair, I told her, I cannot help you breathe on your own or smell the fresh air or be with your grandchildren. None of those goals are realistic. I don't know what I can do for you, but I would like to continue to see you. I want to come back tomorrow.
I hope you do, she said, her blue eyes shining as she smiled softly.
I was struck by the words. Though my loftier goals had been frustrated, I realized that my efforts and my presence at her bedside alone were easing her sufferingthis is something that we all hope for.
Self‐Medication and Intractable Cough
A 60 year old man presented with a 1‐month history of severe, dry cough. His medical history is significant for lymphoma (4 years), bone marrow transplant (8 months), stable graft‐vs.‐host disease, with a negative bleeding history. He self‐medicated his cough with 6 to 8 tablets daily of an analgesic containing 250 mg acetaminophen, 65 mg caffeine, and 250 mg aspirin. He developed severe stabbing pain in his right lower quadrant exacerbated by coughing. Several days later he developed severe pain of his left upper abdomen. The abdominal wall was tender. Laboratory tests revealed a hematocrit of 31%, platelet count of 246,000, international normalized prothrombin ratio of 1.0, and activated partial thromboplastin ratio of 0.8. Abdominal computed tomography (CT) without contrast revealed 2 rectus sheath hematomas. A 4‐cm 2‐cm 2‐cm collection consistent with hematoma was contained within the left rectus abdominis muscle sheath above the level of the umbilicus (white arrow, Figure 1A, top). An additional collection measuring 6 cm 6 cm 4 cm was present below the umbilicus and between the posterior aspect of the right rectus abdominus muscle (black arrows, Figure 1A bottom; B and C) and the anterior surface of the bladder (arrowhead, Figure 1A and C). Aspirin was stopped and he was started on moxifloxacin for pneumonia. He was discharged 3 days later with improved cough resulting in improved pain control.
Rectus sheath hematoma may be contained with the fascia when above the arcuate line, located about 5 cm below the umbilicus. Below the arcuate line a rectus sheath hematoma may dissect posteriorly into the prevesicular space of Retzius. Both are seen in this case. Rectus sheath hematoma are usually associated with cough in the setting of coagulopathy, and may require transfusion or surgical evacuation. High dose aspirin, in this case up to 2000 mg per day, may lead to hemorrhage associated with intractable coughing.
A 60 year old man presented with a 1‐month history of severe, dry cough. His medical history is significant for lymphoma (4 years), bone marrow transplant (8 months), stable graft‐vs.‐host disease, with a negative bleeding history. He self‐medicated his cough with 6 to 8 tablets daily of an analgesic containing 250 mg acetaminophen, 65 mg caffeine, and 250 mg aspirin. He developed severe stabbing pain in his right lower quadrant exacerbated by coughing. Several days later he developed severe pain of his left upper abdomen. The abdominal wall was tender. Laboratory tests revealed a hematocrit of 31%, platelet count of 246,000, international normalized prothrombin ratio of 1.0, and activated partial thromboplastin ratio of 0.8. Abdominal computed tomography (CT) without contrast revealed 2 rectus sheath hematomas. A 4‐cm 2‐cm 2‐cm collection consistent with hematoma was contained within the left rectus abdominis muscle sheath above the level of the umbilicus (white arrow, Figure 1A, top). An additional collection measuring 6 cm 6 cm 4 cm was present below the umbilicus and between the posterior aspect of the right rectus abdominus muscle (black arrows, Figure 1A bottom; B and C) and the anterior surface of the bladder (arrowhead, Figure 1A and C). Aspirin was stopped and he was started on moxifloxacin for pneumonia. He was discharged 3 days later with improved cough resulting in improved pain control.
Rectus sheath hematoma may be contained with the fascia when above the arcuate line, located about 5 cm below the umbilicus. Below the arcuate line a rectus sheath hematoma may dissect posteriorly into the prevesicular space of Retzius. Both are seen in this case. Rectus sheath hematoma are usually associated with cough in the setting of coagulopathy, and may require transfusion or surgical evacuation. High dose aspirin, in this case up to 2000 mg per day, may lead to hemorrhage associated with intractable coughing.
A 60 year old man presented with a 1‐month history of severe, dry cough. His medical history is significant for lymphoma (4 years), bone marrow transplant (8 months), stable graft‐vs.‐host disease, with a negative bleeding history. He self‐medicated his cough with 6 to 8 tablets daily of an analgesic containing 250 mg acetaminophen, 65 mg caffeine, and 250 mg aspirin. He developed severe stabbing pain in his right lower quadrant exacerbated by coughing. Several days later he developed severe pain of his left upper abdomen. The abdominal wall was tender. Laboratory tests revealed a hematocrit of 31%, platelet count of 246,000, international normalized prothrombin ratio of 1.0, and activated partial thromboplastin ratio of 0.8. Abdominal computed tomography (CT) without contrast revealed 2 rectus sheath hematomas. A 4‐cm 2‐cm 2‐cm collection consistent with hematoma was contained within the left rectus abdominis muscle sheath above the level of the umbilicus (white arrow, Figure 1A, top). An additional collection measuring 6 cm 6 cm 4 cm was present below the umbilicus and between the posterior aspect of the right rectus abdominus muscle (black arrows, Figure 1A bottom; B and C) and the anterior surface of the bladder (arrowhead, Figure 1A and C). Aspirin was stopped and he was started on moxifloxacin for pneumonia. He was discharged 3 days later with improved cough resulting in improved pain control.
Rectus sheath hematoma may be contained with the fascia when above the arcuate line, located about 5 cm below the umbilicus. Below the arcuate line a rectus sheath hematoma may dissect posteriorly into the prevesicular space of Retzius. Both are seen in this case. Rectus sheath hematoma are usually associated with cough in the setting of coagulopathy, and may require transfusion or surgical evacuation. High dose aspirin, in this case up to 2000 mg per day, may lead to hemorrhage associated with intractable coughing.
Finger Points to the Diagnosis
A 24‐year‐old man presented to the emergency room with a 3‐month history of bright red blood per rectum and increasing fatigue. Review of systems was significant for intermittent hematuria, swelling, and pain in his lower extremities. He denied abdominal pain, nausea, or vomiting, and was otherwise asymptomatic. He was not taking any medicines. He said that he has had this bleeding problem on and off since he was a child. The chronic intermittent rectal bleeding usually resolved spontaneously. Previous treatments have consisted of blood transfusions, small bowel resections, and a partial colectomy.
Physical exam demonstrates a thin and well‐nourished African American male in no distress. Temperature 36.7C, blood pressure while sitting was 111/65 mmHg, with a pulse of 117 beats per minute; on standing his blood pressure was 103/54 mmHg, with a pulse of 137 beats per minute, and respirations were 18 breaths per minute. Abdominal examination revealed splenomegaly. Rectal exam revealed the presence of bright red blood. Other significant findings include unilateral limb skeletal asymmetry with the right upper and lower extremity being longer than the left side. There was significant hypertrophy of several digits of the hands and feet bilaterally (Figure 1). Notable was the presence of raised, hyperpigmented irregular linear plaques, extending from his right medial forearm to his chest and also from his abdomen to right medial thigh. Additional skin examination was remarkable for well‐demarcated, raised vascular areas on the lateral thighs and knees bilaterally (Figure 2), as well as the dorsum of both the feet. Laboratory workup was notable for hemoglobin of 2.7gm/dl, a hematocrit of 9%, and mean corpuscular volume (MCV) of 58 fl. Normal coagulation parameters, and profound iron deficiency (iron level 16 mcg/dl and ferritin 20 ng/ml).

Other routine laboratory results including coagulation parameters were unremarkable.
Discussion
Based on the classic examination findings and history of gastrointestinal bleeding, this patient has Klippel‐Trenaunay‐Weber syndrome (KTWS), which is characterized by cutaneous malformations of the capillary and venous systems, bony and soft tissue hypertrophy, and arteriovenous malformations (AVMs).1 Many patients with KTWS suffer recurrent bleeding from gastrointestinal AVMs.
Although involvement is usually unilateral, this patient had bilateral limb hypertrophy and hemangiomas. His nevus flammeus was unilateral and incidentally was present over the lower abdomen and posterior thigh and buttock, with significant underlying varices in the pelvis and rectum. His hematuria was secondary to AVMs in the bladder and resolved by itself. The size and extent of his pelvic and rectal varices presented a therapeutic challenge. With blood transfusions and a conservative approach, his bleeding diminished spontaneously. A rectal artery was thought to be contributing to the problem, so a prophylactic embolization was performed by interventional radiology. Follow‐up at 2 months revealed no further bleeding.
Hospitalists treat common causes of gastrointestinal (GI) bleeding such as ulcers, polyps, malignancies, varices, inflammatory bowel disease, AVMs, and, rarely, mucosal Kaposi sarcoma. However, they may occasionally encounter an adult with skin manifestations of a congenital cause of GI bleeding. The 4 most common congenital disorders with primary cutaneous manifestations that also involve the GI tract are reviewed below (also see Table 1).
| Vascular Malformation Syndromes | Characteristics |
|---|---|
| Klippel‐Trenaunay‐Weber | Soft tissue; bony, vascular lesions; and varices |
| Mafucci | Enchondromas, subcutaneous visceral lesions |
| Blue rubber bleb nevus | Bluish black sessile venous malformations |
| Osler‐Maffuci‐Weber‐Rendu | Mucocutaneous telangiectasias |
Blue rubber bleb nevus syndrome, also known as Bean syndrome, is the rarest of these disorders, characterized by cutaneous and intestinal cavernous hemangiomas that may occasionally be painful and tender.2 Hemangiomas may measure from a few millimeters to approximately 5 cm and are raised, blue‐purple, and rubbery in consistency, with a wrinkled surface. They are usually located on the trunk, extremities, face, and any part of the GI tract, with the small intestine and distal colon being the most common sites involved. Given that the lesions may involve the full thickness of the bowel wall, surgery is often required, as less invasive measures such as endoscopic laser coagulation may be inadequate. Orthopedic problems such as scoliosis arise from pressure exerted by large vascular malformations.
Maffucci syndrome is characterized by skeletal and vascular malformations manifested as enchondromas in the metaphyseal and diaphyseal portion of long bones. The vascular lesions, which may involve mucous membranes or viscera, are compressible blue‐purple hemangiomas that follow the rate of the growth of the child. Limb deformities, pathological fractures, and malignant transformation into chondrosarcomas are common complications.3
Osler‐Weber‐Rendu syndrome is also known as hereditary hemorrhagic telangiectasia. In this disorder, mucocutaneous telangiectatic lesions usually develop by puberty and may involve the conjunctiva, respiratory tract, brain, liver, GI tract, and genitourinary (GU) tract. Most patients exhibit only epistaxis, yet massive hemorrhage may occur in the lung, GI tract, and GU tract. These hemorrhages can usually be managed by cautery or electrocoagulation but pulmonary and GI lesions may need excision.4
KTWS consists of the triad of cutaneous vascular malformations of the capillary, venous and lymphatic systems, bony and soft tissue hypertrophy, and venous varicosities in association with AVMs. The name Weber is added when patients have AVMs that are clinically significant; otherwise, it is simply known as Klippel‐Trenaunay syndrome. The most common cutaneous vascular lesion is a capillary hemangioma known as a nevus flammeus. The distribution of the nevus flammeus usually indicates underlying vascular malformations that may extend as deep as the bone, causing limb or digit hypertrophy, as seen in this patient.5 Delineation of the extent of vascular abnormalities is accomplished by noninvasive methods such as color ultrasonography, magnetic resonance imaging, and computer‐aided angiography. Symptomatic GI or GU involvement is rare (1%), but can cause significant hemorrhage.6 Surgical correction is often difficult and the lesions tend to recur.
In the largest published series of Klippel‐Trenaunay patients, followed over 30 years at the Mayo Clinic, most patients were treated conservatively, with surgery limited to epiphysiodesis to prevent excessive leg length in the affected limbs and selected superficial vein stripping in patients with large venous varicosities with preserved deep venous systems.7, 8 For the treatment of AVMs, nonsurgical measures such as foam embolization and radiotherapy are increasingly being used due to their safety and precise application.9, 10
- ,,, et al.Klippel‐Trenaunay syndrome.Am J Med Genet.1998;79(4):319–326.
- .Blue rubber bleb nevus syndrome.Curr Treat Options Gastroenterol.2001;4(5):433–440.
- ,.Maffucci's syndrome, functional and neoplastic significance. Case report and review of the literature.J Bone Joint Surg Am.1973;55:1465–1479.
- ,,.Hereditary hemorrhagic telangiectasia (Osler‐Weber‐Rendu syndrome): a view from the 21st century.Postgrad Med J.2003;79:18–24.
- ,.Klippel Trenaunay syndrome: the importance of “geographic stains” in identifying lymphatic disease and risk of complications.J Am Acad Dermatol.2004;51(3):391–398.
- ,,,.Klippel‐Trenaunay syndrome with involvement of cecum and rectum: a rare cause of lower gastrointestinal bleeding.Eur J Med Res.2004;9(11):515–517.
- ,,.Klippel‐Trenaunay syndrome: spectrum and management.Mayo Clinic Proc.1998;73:28–36.
- ,,,,,.Surgical treatment of venous malformations in Klippel‐Trenaunay syndrome.J Vasc Surg.2000;32:840–847.
- .Radiotherapy in the management of Klippel‐Trenaunay‐Weber syndrome: report of two cases.Ann Vasc Surg.2005;19(4):566–571.
- ,,.Venous angiomata: treatment with sclerosant foam.Ann Vasc Surg.2005;19:457–464.
A 24‐year‐old man presented to the emergency room with a 3‐month history of bright red blood per rectum and increasing fatigue. Review of systems was significant for intermittent hematuria, swelling, and pain in his lower extremities. He denied abdominal pain, nausea, or vomiting, and was otherwise asymptomatic. He was not taking any medicines. He said that he has had this bleeding problem on and off since he was a child. The chronic intermittent rectal bleeding usually resolved spontaneously. Previous treatments have consisted of blood transfusions, small bowel resections, and a partial colectomy.
Physical exam demonstrates a thin and well‐nourished African American male in no distress. Temperature 36.7C, blood pressure while sitting was 111/65 mmHg, with a pulse of 117 beats per minute; on standing his blood pressure was 103/54 mmHg, with a pulse of 137 beats per minute, and respirations were 18 breaths per minute. Abdominal examination revealed splenomegaly. Rectal exam revealed the presence of bright red blood. Other significant findings include unilateral limb skeletal asymmetry with the right upper and lower extremity being longer than the left side. There was significant hypertrophy of several digits of the hands and feet bilaterally (Figure 1). Notable was the presence of raised, hyperpigmented irregular linear plaques, extending from his right medial forearm to his chest and also from his abdomen to right medial thigh. Additional skin examination was remarkable for well‐demarcated, raised vascular areas on the lateral thighs and knees bilaterally (Figure 2), as well as the dorsum of both the feet. Laboratory workup was notable for hemoglobin of 2.7gm/dl, a hematocrit of 9%, and mean corpuscular volume (MCV) of 58 fl. Normal coagulation parameters, and profound iron deficiency (iron level 16 mcg/dl and ferritin 20 ng/ml).
Other routine laboratory results including coagulation parameters were unremarkable.
Discussion
Based on the classic examination findings and history of gastrointestinal bleeding, this patient has Klippel‐Trenaunay‐Weber syndrome (KTWS), which is characterized by cutaneous malformations of the capillary and venous systems, bony and soft tissue hypertrophy, and arteriovenous malformations (AVMs).1 Many patients with KTWS suffer recurrent bleeding from gastrointestinal AVMs.
Although involvement is usually unilateral, this patient had bilateral limb hypertrophy and hemangiomas. His nevus flammeus was unilateral and incidentally was present over the lower abdomen and posterior thigh and buttock, with significant underlying varices in the pelvis and rectum. His hematuria was secondary to AVMs in the bladder and resolved by itself. The size and extent of his pelvic and rectal varices presented a therapeutic challenge. With blood transfusions and a conservative approach, his bleeding diminished spontaneously. A rectal artery was thought to be contributing to the problem, so a prophylactic embolization was performed by interventional radiology. Follow‐up at 2 months revealed no further bleeding.
Hospitalists treat common causes of gastrointestinal (GI) bleeding such as ulcers, polyps, malignancies, varices, inflammatory bowel disease, AVMs, and, rarely, mucosal Kaposi sarcoma. However, they may occasionally encounter an adult with skin manifestations of a congenital cause of GI bleeding. The 4 most common congenital disorders with primary cutaneous manifestations that also involve the GI tract are reviewed below (also see Table 1).
| Vascular Malformation Syndromes | Characteristics |
|---|---|
| Klippel‐Trenaunay‐Weber | Soft tissue; bony, vascular lesions; and varices |
| Mafucci | Enchondromas, subcutaneous visceral lesions |
| Blue rubber bleb nevus | Bluish black sessile venous malformations |
| Osler‐Maffuci‐Weber‐Rendu | Mucocutaneous telangiectasias |
Blue rubber bleb nevus syndrome, also known as Bean syndrome, is the rarest of these disorders, characterized by cutaneous and intestinal cavernous hemangiomas that may occasionally be painful and tender.2 Hemangiomas may measure from a few millimeters to approximately 5 cm and are raised, blue‐purple, and rubbery in consistency, with a wrinkled surface. They are usually located on the trunk, extremities, face, and any part of the GI tract, with the small intestine and distal colon being the most common sites involved. Given that the lesions may involve the full thickness of the bowel wall, surgery is often required, as less invasive measures such as endoscopic laser coagulation may be inadequate. Orthopedic problems such as scoliosis arise from pressure exerted by large vascular malformations.
Maffucci syndrome is characterized by skeletal and vascular malformations manifested as enchondromas in the metaphyseal and diaphyseal portion of long bones. The vascular lesions, which may involve mucous membranes or viscera, are compressible blue‐purple hemangiomas that follow the rate of the growth of the child. Limb deformities, pathological fractures, and malignant transformation into chondrosarcomas are common complications.3
Osler‐Weber‐Rendu syndrome is also known as hereditary hemorrhagic telangiectasia. In this disorder, mucocutaneous telangiectatic lesions usually develop by puberty and may involve the conjunctiva, respiratory tract, brain, liver, GI tract, and genitourinary (GU) tract. Most patients exhibit only epistaxis, yet massive hemorrhage may occur in the lung, GI tract, and GU tract. These hemorrhages can usually be managed by cautery or electrocoagulation but pulmonary and GI lesions may need excision.4
KTWS consists of the triad of cutaneous vascular malformations of the capillary, venous and lymphatic systems, bony and soft tissue hypertrophy, and venous varicosities in association with AVMs. The name Weber is added when patients have AVMs that are clinically significant; otherwise, it is simply known as Klippel‐Trenaunay syndrome. The most common cutaneous vascular lesion is a capillary hemangioma known as a nevus flammeus. The distribution of the nevus flammeus usually indicates underlying vascular malformations that may extend as deep as the bone, causing limb or digit hypertrophy, as seen in this patient.5 Delineation of the extent of vascular abnormalities is accomplished by noninvasive methods such as color ultrasonography, magnetic resonance imaging, and computer‐aided angiography. Symptomatic GI or GU involvement is rare (1%), but can cause significant hemorrhage.6 Surgical correction is often difficult and the lesions tend to recur.
In the largest published series of Klippel‐Trenaunay patients, followed over 30 years at the Mayo Clinic, most patients were treated conservatively, with surgery limited to epiphysiodesis to prevent excessive leg length in the affected limbs and selected superficial vein stripping in patients with large venous varicosities with preserved deep venous systems.7, 8 For the treatment of AVMs, nonsurgical measures such as foam embolization and radiotherapy are increasingly being used due to their safety and precise application.9, 10
A 24‐year‐old man presented to the emergency room with a 3‐month history of bright red blood per rectum and increasing fatigue. Review of systems was significant for intermittent hematuria, swelling, and pain in his lower extremities. He denied abdominal pain, nausea, or vomiting, and was otherwise asymptomatic. He was not taking any medicines. He said that he has had this bleeding problem on and off since he was a child. The chronic intermittent rectal bleeding usually resolved spontaneously. Previous treatments have consisted of blood transfusions, small bowel resections, and a partial colectomy.
Physical exam demonstrates a thin and well‐nourished African American male in no distress. Temperature 36.7C, blood pressure while sitting was 111/65 mmHg, with a pulse of 117 beats per minute; on standing his blood pressure was 103/54 mmHg, with a pulse of 137 beats per minute, and respirations were 18 breaths per minute. Abdominal examination revealed splenomegaly. Rectal exam revealed the presence of bright red blood. Other significant findings include unilateral limb skeletal asymmetry with the right upper and lower extremity being longer than the left side. There was significant hypertrophy of several digits of the hands and feet bilaterally (Figure 1). Notable was the presence of raised, hyperpigmented irregular linear plaques, extending from his right medial forearm to his chest and also from his abdomen to right medial thigh. Additional skin examination was remarkable for well‐demarcated, raised vascular areas on the lateral thighs and knees bilaterally (Figure 2), as well as the dorsum of both the feet. Laboratory workup was notable for hemoglobin of 2.7gm/dl, a hematocrit of 9%, and mean corpuscular volume (MCV) of 58 fl. Normal coagulation parameters, and profound iron deficiency (iron level 16 mcg/dl and ferritin 20 ng/ml).
Other routine laboratory results including coagulation parameters were unremarkable.
Discussion
Based on the classic examination findings and history of gastrointestinal bleeding, this patient has Klippel‐Trenaunay‐Weber syndrome (KTWS), which is characterized by cutaneous malformations of the capillary and venous systems, bony and soft tissue hypertrophy, and arteriovenous malformations (AVMs).1 Many patients with KTWS suffer recurrent bleeding from gastrointestinal AVMs.
Although involvement is usually unilateral, this patient had bilateral limb hypertrophy and hemangiomas. His nevus flammeus was unilateral and incidentally was present over the lower abdomen and posterior thigh and buttock, with significant underlying varices in the pelvis and rectum. His hematuria was secondary to AVMs in the bladder and resolved by itself. The size and extent of his pelvic and rectal varices presented a therapeutic challenge. With blood transfusions and a conservative approach, his bleeding diminished spontaneously. A rectal artery was thought to be contributing to the problem, so a prophylactic embolization was performed by interventional radiology. Follow‐up at 2 months revealed no further bleeding.
Hospitalists treat common causes of gastrointestinal (GI) bleeding such as ulcers, polyps, malignancies, varices, inflammatory bowel disease, AVMs, and, rarely, mucosal Kaposi sarcoma. However, they may occasionally encounter an adult with skin manifestations of a congenital cause of GI bleeding. The 4 most common congenital disorders with primary cutaneous manifestations that also involve the GI tract are reviewed below (also see Table 1).
| Vascular Malformation Syndromes | Characteristics |
|---|---|
| Klippel‐Trenaunay‐Weber | Soft tissue; bony, vascular lesions; and varices |
| Mafucci | Enchondromas, subcutaneous visceral lesions |
| Blue rubber bleb nevus | Bluish black sessile venous malformations |
| Osler‐Maffuci‐Weber‐Rendu | Mucocutaneous telangiectasias |
Blue rubber bleb nevus syndrome, also known as Bean syndrome, is the rarest of these disorders, characterized by cutaneous and intestinal cavernous hemangiomas that may occasionally be painful and tender.2 Hemangiomas may measure from a few millimeters to approximately 5 cm and are raised, blue‐purple, and rubbery in consistency, with a wrinkled surface. They are usually located on the trunk, extremities, face, and any part of the GI tract, with the small intestine and distal colon being the most common sites involved. Given that the lesions may involve the full thickness of the bowel wall, surgery is often required, as less invasive measures such as endoscopic laser coagulation may be inadequate. Orthopedic problems such as scoliosis arise from pressure exerted by large vascular malformations.
Maffucci syndrome is characterized by skeletal and vascular malformations manifested as enchondromas in the metaphyseal and diaphyseal portion of long bones. The vascular lesions, which may involve mucous membranes or viscera, are compressible blue‐purple hemangiomas that follow the rate of the growth of the child. Limb deformities, pathological fractures, and malignant transformation into chondrosarcomas are common complications.3
Osler‐Weber‐Rendu syndrome is also known as hereditary hemorrhagic telangiectasia. In this disorder, mucocutaneous telangiectatic lesions usually develop by puberty and may involve the conjunctiva, respiratory tract, brain, liver, GI tract, and genitourinary (GU) tract. Most patients exhibit only epistaxis, yet massive hemorrhage may occur in the lung, GI tract, and GU tract. These hemorrhages can usually be managed by cautery or electrocoagulation but pulmonary and GI lesions may need excision.4
KTWS consists of the triad of cutaneous vascular malformations of the capillary, venous and lymphatic systems, bony and soft tissue hypertrophy, and venous varicosities in association with AVMs. The name Weber is added when patients have AVMs that are clinically significant; otherwise, it is simply known as Klippel‐Trenaunay syndrome. The most common cutaneous vascular lesion is a capillary hemangioma known as a nevus flammeus. The distribution of the nevus flammeus usually indicates underlying vascular malformations that may extend as deep as the bone, causing limb or digit hypertrophy, as seen in this patient.5 Delineation of the extent of vascular abnormalities is accomplished by noninvasive methods such as color ultrasonography, magnetic resonance imaging, and computer‐aided angiography. Symptomatic GI or GU involvement is rare (1%), but can cause significant hemorrhage.6 Surgical correction is often difficult and the lesions tend to recur.
In the largest published series of Klippel‐Trenaunay patients, followed over 30 years at the Mayo Clinic, most patients were treated conservatively, with surgery limited to epiphysiodesis to prevent excessive leg length in the affected limbs and selected superficial vein stripping in patients with large venous varicosities with preserved deep venous systems.7, 8 For the treatment of AVMs, nonsurgical measures such as foam embolization and radiotherapy are increasingly being used due to their safety and precise application.9, 10
- ,,, et al.Klippel‐Trenaunay syndrome.Am J Med Genet.1998;79(4):319–326.
- .Blue rubber bleb nevus syndrome.Curr Treat Options Gastroenterol.2001;4(5):433–440.
- ,.Maffucci's syndrome, functional and neoplastic significance. Case report and review of the literature.J Bone Joint Surg Am.1973;55:1465–1479.
- ,,.Hereditary hemorrhagic telangiectasia (Osler‐Weber‐Rendu syndrome): a view from the 21st century.Postgrad Med J.2003;79:18–24.
- ,.Klippel Trenaunay syndrome: the importance of “geographic stains” in identifying lymphatic disease and risk of complications.J Am Acad Dermatol.2004;51(3):391–398.
- ,,,.Klippel‐Trenaunay syndrome with involvement of cecum and rectum: a rare cause of lower gastrointestinal bleeding.Eur J Med Res.2004;9(11):515–517.
- ,,.Klippel‐Trenaunay syndrome: spectrum and management.Mayo Clinic Proc.1998;73:28–36.
- ,,,,,.Surgical treatment of venous malformations in Klippel‐Trenaunay syndrome.J Vasc Surg.2000;32:840–847.
- .Radiotherapy in the management of Klippel‐Trenaunay‐Weber syndrome: report of two cases.Ann Vasc Surg.2005;19(4):566–571.
- ,,.Venous angiomata: treatment with sclerosant foam.Ann Vasc Surg.2005;19:457–464.
- ,,, et al.Klippel‐Trenaunay syndrome.Am J Med Genet.1998;79(4):319–326.
- .Blue rubber bleb nevus syndrome.Curr Treat Options Gastroenterol.2001;4(5):433–440.
- ,.Maffucci's syndrome, functional and neoplastic significance. Case report and review of the literature.J Bone Joint Surg Am.1973;55:1465–1479.
- ,,.Hereditary hemorrhagic telangiectasia (Osler‐Weber‐Rendu syndrome): a view from the 21st century.Postgrad Med J.2003;79:18–24.
- ,.Klippel Trenaunay syndrome: the importance of “geographic stains” in identifying lymphatic disease and risk of complications.J Am Acad Dermatol.2004;51(3):391–398.
- ,,,.Klippel‐Trenaunay syndrome with involvement of cecum and rectum: a rare cause of lower gastrointestinal bleeding.Eur J Med Res.2004;9(11):515–517.
- ,,.Klippel‐Trenaunay syndrome: spectrum and management.Mayo Clinic Proc.1998;73:28–36.
- ,,,,,.Surgical treatment of venous malformations in Klippel‐Trenaunay syndrome.J Vasc Surg.2000;32:840–847.
- .Radiotherapy in the management of Klippel‐Trenaunay‐Weber syndrome: report of two cases.Ann Vasc Surg.2005;19(4):566–571.
- ,,.Venous angiomata: treatment with sclerosant foam.Ann Vasc Surg.2005;19:457–464.