User login
Leading a healthcare team
Introduction
Leading a pediatric inpatient healthcare team requires maintaining advanced current knowledge of diseases and healthcare systems. A leader must recognize, support and encourage active participation by all team members to attain the highest level of group performance while creating a positive work environment. A leader should set a strategic direction and motivate others to work towards defined goals. More patients are cared for in ambulatory settings. As a result, pediatric patients who are admitted to the hospital often have more complex diseases or are more acutely ill. Children with special healthcare needs comprise more of the inpatient pediatric population. Care must be coordinated in an efficient, effective, and safe manner both during the hospital phase of care and at transitions of care. Pediatric hospitalists need to develop leadership skills to assure care is rendered in a collaborative and interdisciplinary manner.
Knowledge
Pediatric hospitalists should be able to:
Distinguish between the goals, methods, and styles of a leader and those of a manager.
Describe methods used to strengthen leadership skills, such as role playing or attendance at leadership conferences.
State the importance of clear communication between all members of the healthcare team when collaborating to care for children.
Give examples of skills needed to be an effective team leader, including critical thinking, evidence‐based decision‐making, and use of continuous quality improvement principles.
Compare and contrast potential healthcare team members in various settings such as community, tertiary care, academic, and non‐academic.
Discuss pediatric hospitalists' role as team leader in coordination of care, particularly where other physician subspecialists are involved in co‐management.
List issues that impact team dynamics, such as personalities, perceptions, and varied individual clinical skills of team members.
Recognize how conflict or enmeshment can be created within a team or between team members and patients and the family/caregiver.
Articulate the skills needed to lead a healthcare team that includes trainees.
Describe methods that enhance team efficiency.
Explain the roles of key personnel, facilities, and equipment in various clinical settings.
Define the team relationship between pediatric hospitalists, the primary care provider, patients and the family/caregiver in the context of the medical home and family centered care.
Define terms related to documentation, billing and coding such as compliance, Relative Value Units (RVUs) and authorizations and articulate why it is important for healthcare team members to understand them.
Skills
Pediatric hospitalists should be able to:
Lead family‐centered rounds in an effective manner promoting communication and participation by team members.
Maintain strong diagnostic and relevant procedure skills and be able to provide mentorship in these skills.
Lead patient throughput in a way that optimizes bed flow and care.
Maintain proficiency in administrative skills such as documentation, billing and coding compliance, RVU collection, and contracting and mentor other team members in attaining these skills.
Demonstrate excellent communication skills, including expressive and listening ability, in all interactions with other members of the healthcare team.
Build consensus within the health care team on evidence‐based care management algorithms, hospital policies and related issues.
Identify when healthcare team members may have a conflict affecting patient care delivery and offer appropriate support in a discrete manner.
Delegate team responsibilities in an effective and equitable manner.
Deal constructively in managing conflicts with and among supervisors, staff, and trainees, seeking resolutions that promote productivity and good will.
Effect systems change through use of quality improvement tools such as Plan‐Do‐Study‐Act (PDSA), Failure Mode Effects Analysis (FMEA) and others.
Establish skills in time management.
Run an effective meeting to accomplish outlined goals in a defined time period.
Attitudes
Pediatric hospitalists should be able to:
Demonstrate a consistent level of commitment, responsibility, and accountability in rendering patient care.
Consistently display honesty, integrity, humility, and fairness in working with patients and the family/caregiver, and all members of the healthcare team.
Respect the skills and contributions of all members of the healthcare team.
Pursue continued development of leadership skills through additional training opportunities.
Maintain a professional manner at all times.
Systems Organization and Improvement
In order to improve efficiency and quality in their organizations, pediatric hospitalists should:
Identify and work to resolve barriers to teamwork between healthcare professionals.
Lead interdisciplinary collaboration at the bedside to promote patient safety, quality improvement, and cost‐effective care for children.
Proactively work to assure the healthcare team integrates and sustains family centered care principles.
Copyright © 2010 Society of Hospital Medicine
Oxygen delivery and airway management
Introduction
Respiratory distress and respiratory failure account for a significant number of pediatric emergencies in the acute care and inpatient settings. In these situations, early identification and treatment of respiratory compromise is critical. Appropriate airway management and oxygen delivery will result in reduced morbidity and mortality. Pediatric hospitalists frequently encounter children with respiratory compromise and are often in the best position to provide immediate, life‐saving interventions.
Knowledge
Pediatric hospitalists should be able to:
Review the basic anatomy of the upper respiratory tract and describe the anatomic differences between infants, children, and adolescents.
Describe the various forms of monitoring related to assessment of oxygenation and ventilation, including cardiorespiratory monitors, pulse oximetry, capnography, and blood gas sampling.
List the crucial items to have available at the bedside or in an emergency supply cart in the event of respiratory compromise, including suction, oxygen, oxygen delivery systems, pediatric sizes of advanced airway equipment, and resuscitation medications.
Summarize the steps involved in assessing and securing a patient's airway, including proper airway positioning, suctioning, selection and use of the appropriate airway equipment, and the use of adjunctive medications.
Describe the indications for and uses of different types of airway equipment, including oropharyngeal, nasopharyngeal, laryngeal mask, and tracheal airways.
Compare and contrast low flow and high flow oxygen delivery systems, and give examples of each.
Describe the mechanism of action of heliox and inhaled nitric oxide and list the indications for their use.
List factors that may complicate airway management, including anatomic abnormalities of the face and oropharynx, neurologic impairment, and trauma.
List the indications for consultation with an otorhinolaryngologist, anesthesiologist, or other subspecialist with regard to airway management.
Skills
Pediatric hospitalists should be able to:
Anticipate the need for airway management or oxygen delivery and ensure that all appropriate equipment is readily available.
Perform frequent clinical assessments and recognize when patients need supplemental oxygen or airway management.
Correctly position the pediatric airway using head tilt and jaw thrust maneuvers.
Use suction equipment to clear the airway when necessary.
Select and use the appropriate method for oxygen delivery when indicated.
Select the appropriate airway device and establish a secure airway when indicated.
For patients with established tracheostomy tubes, respond with appropriate actions when the tube becomes obstructed or dislodged.
Select appropriate monitoring and correctly interpret monitor data.
Correctly identify the needs for and efficiently access appropriate consultants to ensure proper airway management.
Implement an appropriate respiratory care plan for ongoing patient management, collaborating with nursing staff, respiratory therapy, subspecialists, and other healthcare providers as indicated.
Attitudes
Pediatric hospitalists should be able to:
Assume responsibility for airway management and oxygen delivery.
Recognize the importance of maintaining skills in airway management and oxygen delivery and participate in relevant continuing education activities.
Communicate effectively with patients and the family/caregiver regarding the need for airway management or oxygen delivery and the care plan.
Systems Organization and Improvement
In order to improve efficiency and quality within their organizations, pediatric hospitalists should:
Lead, coordinate, or participate in the development of hospital systems designed to detect patients with respiratory compromise early and provide an appropriate, rapid response.
Lead, coordinate, or participate in educational initiatives for nurses, physicians, and other healthcare providers related to pediatric advanced life support.
Work with hospital administration to ensure emergency code carts are pediatric‐specific and contain adequate, appropriate equipment.
Lead, coordinate, or participate in peer review or relevant case conferences with subspecialists and other healthcare providers to identify individual areas or systems issues in need if improvement.
Copyright © 2010 Society of Hospital Medicine
Technology dependent children
Introduction
The last several decades have seen a surge in the number of children with special health care needs, currently estimated to account for 13% of all children and for 70% of all child health care expenditures. Many of these children require some form of technological assistance to compensate for loss or impairment of one or more vital functions. Advances in intensive care practices and improved survival have resulted in an increase in the number and complexity of technology dependent infants and children being cared for both on acute inpatient floors and at home. Commonly used devices include gastrostomy and jejunostomy tubes with and without fundoplication, ventricular shunts, baclofen pumps, indwelling central venous catheters, tracheostomies, and various forms of non‐invasive ventilation. Pediatric hospitalists frequently encounter these technology dependent children, and therefore must have a working knowledge of the these devices and technologies, as well as an understanding of the associated challenges that may arise both in and out of the hospital and within the continuum of the child's life. Care coordination for these children has been reported to result in clinical and process improvements, reduced health care costs, and improved family/caregiver satisfaction. The importance of these issues is reflected in the work of the National Center of Medical Home Initiatives for Children with Special Needs and in an American Academy of Pediatrics policy statement, The Medical Home.
Knowledge
Pediatric hospitalists should be able to:
List the indications for placement and removal of common enteral feeding devices such as nasogastric, nasojejunal, percutaneous gastrostomy, surgically performed gastrostomy tube with and without fundoplication, and gastro‐jejunal tube.
Discuss the utility of evaluation techniques for disorders that may require these interventions, attending to therapist, developmental, and radiographic evaluations.
Compare and contrast the risks, benefits, and alternatives of various modes of long term intravenous access and externally implanted, totally implanted, and percutaneously implanted catheter types such as Broviac, Mediport, PICC and others.
Discuss the medical and ethical considerations for the initiation and removal of chronic respiratory support, including interventions such as tracheostomy, bilevel positive airway pressure, continuous positive airway pressure, and others.
Review common acute problems relating to specific medical devices, such as central venous catheter infection and enteral feeding tube dysfunction, and discuss the diagnostic evaluation and treatment of these problems.
Compare and contrast nosocomial infection risk in patients chronically dependent on technology compared to hospitalized patients with acute, limited technology device use.
State how the National Patient Safety Goals relate to the care of these patients, and describe how best practices around these goals are applied when rendering care.
Summarize how common acute systemic illnesses affect the technology dependent child from both short and long term perspectives.
Define pain, anxiety, fear, and depression in patients undergoing evaluation or manipulation of medical devices and explain the interrelationship between them.
Describe the social, emotional and fiscal impact of assessment, initiation, and/or removal of medical devices on the family/caregiver.
Discuss the technical and practical aspects of homecare delivery for technology dependent children and the family/caregiver.
Describe issues or concerns which should prompt referrals to the ethics committee, hospice, or palliative care services.
List the community and educational resources for technology dependent children.
Skills
Pediatric hospitalists should be able to:
Create a comprehensive discharge plan including device care and explicit emergency response instructions for the family/caregiver.
Coordinate care with subspecialists and the primary care provider maintaining the medical home model.
Write a comprehensive yet succinct summary appeal letter to insurers if medically indicated services are denied.
Demonstrate clinical proficiency in basic care of common medical devices as well as emergency management of common complications such as accidental tracheostomy decannulation or gastrostomy tube extrusion.
Clinically evaluate fit and function of devices, attending to the child's age and developmental stage.
Implement and adjust common medications used in conjunction with medical devices.
Coordinate end‐of‐life interdisciplinary discussions between appropriate subspecialists, teams, primary care provider, and the family/caregiver, and implement this care when appropriate.
Attitudes
Pediatric hospitalists should be able to:
Provide leadership to an interdisciplinary team, reflecting awareness that hospitalization is a phase of longitudinal care.
Model communication skills that are clear, compassionate, and sensitive to religious and cultural values of patients and the family/caregiver.
Advocate for medically‐appropriate devices and the support services necessary to maintain these.
Recognize the need to continually assess patient and family/caregiver needs relating to technology dependence within the context of developmental and quality of life concerns.
Collaborate with subspecialists and the primary care provider to ensure coordinated longitudinal care for technology dependent children.
Systems Organization and Improvement
In order to improve efficiency and quality within their organizations, pediatric hospitalists should:
Lead, coordinate or participate in the development and implementation of systems within the hospital to ensure comprehensive patient and family/caregiver‐centered care for the technology dependent child.
Lead, coordinate or participate in quality improvement initiatives to improve care for the technology dependent child.
Collaborate with local, state, and national political groups to educate and champion for equitable access to current technology for all of these children, and for research funding to enhance their future.
Copyright © 2010 Society of Hospital Medicine
Nutrition
Introduction
Optimal nutrition in the hospital setting has been shown to improve outcomes in adult patients, and there is a growing body of evidence that the same is true for pediatric patients. Malnutrition refers to any disorder of nutritional status resulting from a deficiency or excess of nutrient intake, imbalance of essential nutrients, or impaired nutrient metabolism. Malnutrition occurs in up to half of hospitalized children in the United States, but varies considerably by age and disease state. An understanding of the fundamental nutritional requirements of pediatric patients is essential to providing optimal care for hospitalized children. Pediatric hospitalists should be experts in making objective nutritional assessments and managing frequently encountered nutritional problems. Pediatric hospitalists should lead, coordinate, or participate in multidisciplinary efforts to screen for malnutrition and improve the nutritional status of hospitalized pediatric patients.
Knowledge
Pediatric hospitalists should be able to:
Describe the normal growth patterns for children at various ages and the potential effect of malnutrition on growth.
List the anthropometric measurements commonly used to assess acute and chronic nutritional status.
Describe the basic nutritional requirements for hospitalized pediatric patients, based on gestational age, chronologic age, weight, activity level, and other characteristics.
Compare and contrast the composition of human milk versus commonly used commercial formulas, and explain why human milk is superior nutrition for infants.
Describe the differences in composition of commonly used commercial formulas, as well as protein hydrosylate and other special formulas, and list the clinical indications for each type of formula.
Compare and contrast the benefits and costs of blended foods versus commonly used enteral formulas as complete nutritional sources for children receiving gastric, duodenal, or jejunal tube feedings.
List the indications for specific vitamin and mineral supplementation, including exclusive breastfeeding, chronic anti‐epileptic therapy, food allergies resulting in extreme dietary restrictions, and others.
List the factors that place hospitalized pediatric patients at risk for poor nutrition.
Compare and contrast marasmus and kwashiorkor.
Define the term protein‐energy malnutrition.
List the signs and symptoms of common vitamin and mineral deficiencies.
List the indications and contraindications for both enteral and parenteral nutrition, and describe the complications associated with each type of supplemental nutrition.
Discuss the monitoring needs for pediatric patients on chronic enteral or parenteral nutrition attending to electrolyte and mineral disturbances, growth, and other parameters.
Describe the refeeding syndrome and list the risk factors associated with its development.
Explain the importance of nutrition screening, as well as the indications for consultation with a nutritionist, gastroenterologist, or other subspecialist.
Skills
Pediatric hospitalists should be able to:
Use anthropometric data to determine the presence, degree, and chronicity of malnutrition.
Conduct a focused history and physical examination, attending to details that may indicate a particular nutrient, vitamin, or mineral deficiency.
Conduct a directed laboratory evaluation to obtain information about nutritional status and vitamin or mineral deficiencies, as indicated.
Calculate the basic caloric, protein, fat, and fluid requirements for hospitalized pediatric patients, for both daily needs and catch up growth.
Provide lactation support to all mothers, especially those who are experiencing difficulty with initiating or maintaining breastfeeding or milk supply or those who have a complication from breastfeeding, including plugged ducts or mastitis.
Choose an appropriate formula, delivery device, and method of administration when enteral nutrition is required.
Initiate and advance parenteral nutrition using the appropriate initial composition of parenteral nutrition solution, delivery device, and method of administration when parenteral nutrition is required.
Appropriately monitor laboratory values to ensure the efficacy of supplemental nutrition support and to screen for complications.
Recognize and treat complications of both enteral and parenteral nutrition, such as metabolic derangements, infection, and delivery device malfunction.
Recognize and treat the refeeding syndrome.
Consult a nutritionist, gastroenterologist, or other subspecialists when indicated.
Attitudes
Pediatric hospitalists should be able to:
Recognize the importance of screening for malnutrition and optimizing nutritional status for hospitalized pediatric patients.
Communicate effectively with patients, the family/caregiver, and healthcare providers regarding findings and care plans.
Collaborate with a nutritionist or subspecialists to devise and implement a nutrition care plan.
Collaborate with the primary care provider and subspecialists to ensure coordinated, longitudinal care for children requiring specialized nutrition support.
Arrange for an effective and safe transition of care from the inpatient to outpatient providers, preserving the multidisciplinary nature of the nutrition care team when appropriate.
Systems organization and Improvement
In order to improve efficiency and quality within their organizations, pediatric hospitalists should:
Lead, coordinate, or participate in efforts to develop systems that support the initiation and maintenance of breastfeeding for infants
Work with hospital administration, hospital staff, subspecialists, and other services/consultants to promote prompt nutritional screening for all hospitalized patients and multidisciplinary team care to address nutritional problems when indicated.
Lead, coordinate or participate in the development and implementation of cost‐effective, evidence‐based care pathways to standardize the evaluation and management for hospitalized children with nutritional needs
Copyright © 2010 Society of Hospital Medicine
Fluids and electrolyte management
Introduction
Many infants and children are hospitalized in the United States each year for fluid and electrolyte disorders. Dehydration from gastroenteritis alone accounts for more than 200,000 pediatric hospitalizations each year. An understanding of pediatric fluid therapy is one of the most important advances of pediatric medicine and a cornerstone of current inpatient pediatric practice. Although the majority of previously healthy hospitalized children can compensate for errors in calculations of fluid therapy, mistakes, even in healthy children admitted for minor illnesses, can have devastating outcomes. Patients with underlying disease processes are at even greater risk for adverse outcomes if fluids and electrolytes are not meticulously managed. Pediatric hospitalists should be experts at managing frequently encountered fluid and electrolyte abnormalities.
Knowledge
Pediatric hospitalists should be able to:
Discuss the physiology of fluid and electrolyte homeostasis and the changes that occur with growth and development.
Discuss how maintenance fluid calculations are based upon water and electrolyte homeostasis using various methods such as the body surface area or Holliday Segar methods. Describe the methods used for calculation of excessive fluid losses due to causes such as diarrhea, increased ostomy output, burns, and vomiting; identify the best fluid replacement type for each.
Describe common errors in clinical estimations of dehydration and fluid and electrolyte requirements.
Explain the rationale, indications and contraindications for oral rehydration, including the correct glucose and electrolyte composition and technique for administration.
Discuss the benefits of and barriers to use of nasogastric tubes for administering enteral fluids.
Discuss the options and indications for different methods of parenteral fluid administration, including intravenous, intraosseous, and subcutaneous.
Review the indications for administering a parenteral fluid bolus for resuscitation and explain the rationale for the use of isotonic fluids for rehydration.
Discuss the benefits and risks of repeated lab testing and intravenous access placement, including cost, pain, effect on clinical management, family/caregiver perceptions, staff time, and others.
Compare and contrast true hyponatremia with pseudohyponatremia and give examples of conditions in which these exist.
List differential diagnoses for hyponatremia and hypernatremia.
Summarize the management of hypo‐ and hypernatremia, attending to duration of corrective therapy and potential complications during correction.
Distinguish between hyperkalemia and pseudohyperkalemia and give examples of the conditions in which these exist.
List differential diagnoses for hypokalemia and hyperkalemia.
Distinguish hypocalcemia from pseudohypocalcemia and give examples of the conditions in which these exist.
Discuss the interaction of fluid and electrolytes with acid/base balance.
Describe common acid/base disturbances that accompany the most frequently encountered causes of fluid deficit and give examples of exacerbating issues such as underlying co‐morbidity and use of over‐the‐counter medications.
Skills
Pediatric hospitalists should be able to:
Accurately calculate maintenance fluid and electrolyte requirements for hospitalized infants and children.
Promptly adjust maintenance fluids for increased insensible losses and ongoing fluid and electrolyte needs.
Estimate the degree of dehydration for children of various ages based upon clinical symptoms and signs.
Recognize common presenting signs and symptoms in infants and children that are associated with an excess or deficit of each common electrolyte and glucose.
Correctly estimate osmolar disturbance by interpreting electrolyte, glucose and blood urea nitrogen results.
Calculate and administer an isotonic fluid bolus correctly when indicated.
Obtain intravenous or intraosseous access in moderate to severely dehydrated patients.
Assess the success of fluid resuscitation by interpreting clinical change and laboratory values.
Calculate and administer maintenance and deficit fluid replacement for isotonic, hypertonic, and hypotonic dehydration.
Interpret urine and serum electrolytes and osmolality, as well as fluid status (hypo, hyper or isovolemic), to determine the etiology for hyponatremia or hypernatremia.
Correct hyponatremia using appropriate replacement or restriction of fluids, sodium chloride, and medications depending upon the diagnosis.
Correct hypernatremia using an appropriate electrolyte composition and rate of fluid replacement, as well as medications depending upon the diagnosis.
Correct hypoglycemia using an appropriate replacement solution.
Interpret EKG findings in the context of specific electrolyte abnormalities.
Safely prescribe electrolyte replacement therapy and institute proper monitoring for arrhythmias.
Correct symptomatic hyperkalemia using a combination of therapies to stabilize cardiac conduction, redistribute potassium to the intracellular space and remove it from the body.
Attitudes
Pediatric hospitalists should be able to:
Consult pediatric subspecialists appropriately to expedite the diagnosis and management of serious electrolyte disorders.
Recognize the benefits of oral rehydration and advocate for its use when indicated and clinically appropriate.
Coordinate subspecialty and primary care follow up for patients with persistent disturbances at discharge as appropriate.
Consider cost‐effectiveness, pain, and patient safety when creating plans for the treatment of fluid deficits.
Systems Organization and Improvement
In order to improve efficiency and quality within their organizations, pediatric hospitalists should:
Lead, coordinate or participate in plans to develop institutional policies to safely monitor and administer fluids and electrolytes.
Work collaboratively with others such as surgeons, intensivists, and advanced practice nurses to establish venous access when needed.
Lead, coordinate or participate in developing guidelines for the treatment of fluid and electrolyte abnormalities in the hospital and community.
Copyright © 2010 Society of Hospital Medicine
Insulin Infusion in the Non‐ICU Setting
Increasing evidence suggests that in hospitalized adult patients with and without diabetes, hyperglycemia is associated with increased risk of complications, prolonged length of hospitalization, and death.15 Past studies have shown that intensive glucose control in the intensive care unit (ICU) with continuous insulin infusion (CII) improves clinical outcomes by reducing the risk of multiorgan failure, systemic infection, and mortality. Effective management of hyperglycemia, an independent marker of poor outcome,1, 3, 6 is also associated with a decreased length of ICU and hospital stay79 and decreased total hospitalization cost.10 Based on several observational and interventional studies, improved control of blood glucose (BG) has been recommended for most adult patients with critical illness.2, 6, 11
Detrimental effects of hyperglycemia on outcome are not limited to patients in the ICU setting and CII has increasingly been used in non‐ICU settings. In such patients, the presence of hyperglycemia has been associated with prolonged hospital stay, infection, disability after hospital discharge, and death.1, 3, 6 In general medicine and surgery services, however, hyperglycemia is frequently overlooked and inadequately addressed. Numerous reports have shown that sliding scale regular insulin (SSRI) continues to be the most common insulin prescribed regimen in the non‐ICU setting.12 This regimen is challenged by limited and variable efficacy and continued concern for hypoglycemia13; thus, a more structured, target‐driven protocol such as scheduled SC insulin or a CII protocol could facilitate glycemic control in the non‐ICU setting. Recently, we reported that a scheduled regimen using basal‐bolus insulin subcutaneously was safe, effective, and superior to SSRI in controlling BG levels in hospitalized subjects with type 2 diabetes. As in many institutions in the United States, we have used CII protocols as an alternative to subcutaneous (SC) insulin for the management of persistent hyperglycemia in non‐ICU areas during the past 10 years, particularly during the postoperative period, transplant recipients, or patients transferred from the ICU. There is, however, no clinical evidence regarding the safety, efficacy, or outcomes with the use of CII in the non‐ICU setting. Accordingly, we analyzed our experience on the efficacy and safety of CII in the management of hyperglycemia in general medicine and surgical services.
Research Design and Methods
This retrospective chart analysis was conducted in adult patients >18 years of age who were consecutively admitted to the general medical and surgical wards between July 1, 2004 and June 30, 2005 at Emory University Hospital, a 579‐bed tertiary care facility staffed exclusively by Emory University School of Medicine faculty members and residents. The CII protocol, employing regular insulin (Novolin‐R Novo Nordisk Pharmaceuticals, Princeton, NJ) with a very short half‐life, in this study is a dynamic protocol14 that has been available at all nursing stations at Emory Hospital for the past decade (Table 1). The insulin rate is calculated using the formula (BG 60) (multiplier) = units of insulin per hour. The multiplier is a value used to denote the degree of insulin sensitivity based on glucose pattern and response to insulin. The multiplier typically starts at a value of 0.02 and is adjusted by the nurse as needed to achieve target BG levels based on bedside capillary glucose measurements. Blood glucose levels were checked every 1 to 2 hours by the nursing staff (nurse:patient ratio = 1:5) according to the protocol.
| ||
| Date (mm/dd/yyyy): | Time: | Allergies: NKA |
| 1. Begin this protocol and IV fluids on ____/____/____ at __________ (time). Discontinue previous insulin orders when this protocol is started. | ||
| 2. Bedside BG monitoring q 1 h until patient is within target range two consecutive readings, and then obtain BG q 2 h. If the BG falls above or below the targeted range, resume q 1 h readings. (If using A‐line specimen, please use consistently while patient on drip). | ||
| 3. If initial BG >150 mg/dL give Regular Insulin bolus: Dose _____ units. (Dose 0.1 units/kg body weight) | ||
| 4. Insulin drip: 125 units of Regular Insulin in 250 mL 0.9% saline (1 mL of solution = 0.5 units of Insulin). | ||
| 5. Target BG Range on Insulin Drip: _____ mg/dL to _____ mg/dL (Suggested target 80‐100 for ICU patients)* | ||
| For each BG value, recalculate drip rate and disregard previous rate of infusion. | ||
| Calculate Insulin Drip rate: (BG 60) ________ (multiplier) = units of Insulin per hour ( 2 to determine cc/hour) (Typical starting multiplier 0.02 but varies by insulin sensitivity) | ||
| Adjusting Multiplier: | ||
| BG > Target Range: Increase multiplier by 0.01 | ||
| BG within Target Range: No change in multiplier | ||
| BG < Target Range: Decrease multiplier by 0.01 | ||
| 6. Treating Hypoglycemia: | ||
| 6a. BG 60‐80: Give D50W using formula: (100 BG) 0.3 = mL D50W IV Push. Adjust multiplier per protocol above | ||
| 6b. BG <60: Give D50W using formula: (100 BG) 0.3 = mL D50W IV Push | ||
| Decrease insulin drip to 50% of current infusion rate | ||
| Recheck BG in 30 minutes | ||
| BG >80: Decrease multiplier by 0.01 and then return to Step 5 formula | ||
| BG 60‐80: Repeat step 6a | ||
| BG <60: Notify MD and repeat Step 6b | ||
| 7. Continuous IV fluids ______________________ at ____________ mL/hour. (Consider changing to dextrose‐based fluids when BG <250) | ||
| 8. Additional Orders: | ||
Of 1404 patients treated with CII during the hospital stay, 1191 patients received CII in the ICU and 213 patients received CII in non‐ICU areas. The final analysis included a total of 200 non‐ICU patient records after excluding 13 patients with diabetic ketoacidosis, incomplete documentation of glycemic records, or with duration of CII for less than 3 hours. Data collected included demographics, medical history, admission diagnoses, inpatient medications, inpatient laboratory values, bedside BG measurements, insulin doses used, nutrition status during CII, length of stay, disposition at discharge, and mortality rate. Nutrition status was defined in 3 ways: (1) nil per os or nothing by mouth (NPO); (2) oral nutrition (PO‐regular or PO‐liquid); and (3) tube feeds or total parenteral nutrition (TF/TPN). Data collection was limited to the first 10 days of CII use. This study was approved by the Institutional Review Board at Emory University.
The primary aim of the study was to determine the efficacy (mean daily BG levels) and safety (number of hyperglycemic [200 mg/dL] and hypoglycemic [60 mg/dL] events) during CII. We also determined the presence of potential risk factors associated with hypoglycemic and hyperglycemic events (age, body mass index [BMI], nutrition status, renal function, corticosteroid therapy, and use of enteral and parenteral nutrition) during CII.
Statistical Analysis
Two‐sample Wilcoxon tests and analysis of variance (ANOVA) were used to compare continuous variables. Levine's test for homogeneity of variances and log transformations were used when necessary. For categorical variables, chi square (2) analysis was used. Multivariate regression analyses controlling for age, gender, race, history of diabetes mellitus (DM), BMI, Cockcroft‐Gault estimated glomerular filtration rate (GFR), steroid use, nutrition status (via oral route vs. NPO), and number of BG tests were performed based on repeated measures linear models or linear models and were used to determine the influence of demographic and clinical characteristics on the risk of hypoglycemia, hyperglycemia, mortality, and length of stay. Model building followed the backward selection procedure. All data are expressed as mean standard deviation. Statistical significance was defined as P < 0.05.
Statistical Analysis Software (SAS), version 9.1 (SAS Institute, Inc., Cary, NC), was used to perform the statistical analysis.
Results
The cohort of 200 patients consisted of 54% males and 46% females, 53% Caucasian, 37% Black, with a mean age of 52 16 years (Table 2). Forty‐five percent of patients were admitted to the general medicine service and the remaining 55% were admitted to the surgical service for admission diagnoses that included cardiovascular disorders, trauma/surgery gastrointestinal disorders, renal disorders, and infection.
| |
| Age (years) | 52 16 |
| Gender (M/F) | 108/92 |
| Race (W/B/H/O) | 106/74//3/17 |
| Admitting service, Medical/Surgical (%/%) | 45/55 |
| BMI (kg/m2) | 28.4 7.1 |
| Known diabetes/new onset (%/%) | 90/11 |
| Admission blood glucose (mg/dL) | 325 235 |
| A1c (%) | 9.1 3 |
| CrCl (mL/minute) | 59.5 44 |
| On steroids (%) | 82 (41%) |
| Insulin drip duration (hours) | 41.6 37 |
| LOS (days) | 10 9 |
The primary indication for CII was poor glycemic control in 93.4% of patients. Forty‐one percent of subjects were receiving corticosteroids and 16% were continued on the insulin drip after transferring from an ICU. Nearly 90% of subjects had a history of diabetes and 11% were diagnosed with new‐onset diabetes. The mean admission BG concentration was 325 235 mg/dL (mean SD) and the mean A1c in 121 subjects in whom it was measured was 9.1 3%. The mean BG prior to the initiation of CII (323 184) was similar to the admission BG.
Of the 173 subjects that had well‐documented glycemic goals, the BG targeted during CII was 150 mg/dL in 85% of patients while the remaining subjects had a target BG goal that ranged from 70 to 250 mg/dL. The most commonly prescribed BG target goals were 80 to 110 mg/dL (41.6%), 80 to 120 mg/dL (13.9%), and 100 to 150 mg/dL (5.8%).
BG improved rapidly after the initiation of CII. BG on the first day of CII was 182 71 mg/dL; day 2: 142 42 mg/dL; day 3: 131 38 mg/dL; and day 4: 132 43 in response to receiving an average of 84 66 units/day, 71 61 units/day, 70 61 units/day, and 64 29 units/day, respectively (Table 3). Irrespective of the target BG goal, 67% of patients reached BG levels of 150 mg/dL by 48 hours of CII initiation. The duration of CII ranged between 4 and 240 hours, with an average of 41.6 hours and a median of 28 hours. The average insulin infusion rate during CII was 4.29 2.99 units/hour and the mean amount of insulin required to attain glycemic goals was 1.96 1.88 units/kg/day.
| Mean Daily Blood Glucose (mg/dL*) | Mean Daily IV Insulin Dose (units/day) | |
|---|---|---|
| ||
| Preinfusion | 323 184 | N/A |
| Day 1 | 182 71 | 84 66 |
| Day 2 | 142 42 | 71 61 |
| Day 3 | 131 38 | 70 61 |
| Day 4 | 132 43 | 64 29 |
During CII, 48% and 35% of patients had at least 1 episode of hyperglycemia (BG >200 mg/dL) on the second and third day of CII, respectively. Hypoglycemia (BG <60 mg/dL) was noted at least once in 22% of the cohort (day 1: 11%; day 2: 16%; and day 3: 14%); however, severe hypoglycemia (BG <40 mg/dL) only occurred in 5% of subjects. During the CII, 37% of patients experienced a BG <70 mg/dL. When BG targets were stratified (<120 mg/dL vs. 120‐180 mg/dL vs. >180 mg/dL), we found no significant association between the target BG goal and the frequency of hypoglycemic or hyperglycemic events during CII. None of the episodes of hypoglycemia were associated with significant or permanent complications.
The analysis of collected variables for influence on glycemic control (ie, BMI, age, corticosteroid use, renal function, and nutrition status) revealed that subjects with a creatinine level >1.5 mg/dL may have an increased risk of hyperglycemia (BG >200 mg/dL) (P = 0.047) but not hypoglycemia. The analysis also found that younger patients (51 16 years) were more likely to have episodes of hyperglycemia than older patients (57 13 years) (P = 0.027). Hospital length of stay and mortality rate (3%) were not associated with the rate of hyperglycemic or hypoglycemic events.
Eighty‐two percent of patients received nutrition support at some point while on the CII: 48% PO‐regular diet; 14% PO‐liquid diet; and 20% TF/TPN. Due to the titration of nutrition from NPO at CII initiation to PO, NPO status was analyzed in a time‐dependent fashion. Thus, among patients on CII on day 1, day 2, day 3, day 4, and days 510; 34.0%, 26.3%, 11.3%, 12.5%, and 10.5%, respectively, were NPO.
As compared to subjects maintained NPO, subjects that received oral nutrition while on CII had an increased rate of hyperglycemic events (BG >200 mg/dL: 86% vs. 76%, P = 0.19; >300 mg/dL: 57% vs. 53%, P = 0.69; >400 mg/dL: 32% vs. 21%, P = 0.22) and a decreased rate of hypoglycemic events (BG <70 mg/dL: 33% vs. 41%, P = 0.39; BG <60 mg/dL: 20% vs. 26%, P = 0.49; and BG <40 mg/dL: 4% vs. 6%, P = 0.65). The multivariate regression analyses, however, which considered age, gender, race, BMI, renal function, steroid use, history of diabetes, and number of BG tests, showed that nutrition status during CII was associated with increased frequency of hyperglycemic (P = 0.042) and hypoglycemic events (P = 0.086). As compared to NPO, oral intake (PO‐regular or PO‐liquid) was associated with a significantly increased frequency of hyperglycemic (P = 0.012) and hypoglycemic events (P = 0.035). Patients treated with TPN had lower BG values than those not on TPN. Although we observed no increased number of hypoglycemic events, TPN‐treated subjects had higher mortality than non‐TPN treated subjects (P < 0.001).
Discussion
Our study aimed to determine the safety and efficacy of CII in non‐critically‐ill patients with persistent hyperglycemia in general medicine and surgical services. We observed that the use of CII was effective in controlling hyperglycemia, with two‐thirds of patients achieving their target BG 150 mg/dL by 48 hours of insulin infusion. The rate of hypoglycemic events with the use of CII in non‐ICU patients was similar to that reported in recent ICU trials with intensive glycemic control7, 8, 15, 16 and is comparable to that reported in studies using SC insulin therapy in non‐ICU settings.17, 18 The number of hypoglycemic and hyperglycemic events was significantly higher in patients allowed to eat compared to those patients kept NPO during CII. There is substantial observational evidence linking hyperglycemia in hospitalized patients (with and without diabetes) to poor outcomes. There is ongoing debate, however, about the optimal level of BG in hospitalized patients. Early cohort studies as well as randomized controlled trials (RCTs) suggest that intensive treatment of hyperglycemia reduces length of hospital and ICU stay, multiorgan failure and systemic infections, and mortality.7, 9 These positive reports led the American Diabetes Association (ADA) and American Association of Clinical Endocrinologists (AACE) to recommend tight glycemic control (target of 80‐110 mg/dL) in critical care units. Recent multicenter controlled trials, however, have not been able to reproduce these results and in fact, have reported an increased risk of severe hypoglycemia and mortality in ICU patients in association with tight glycemic control.15, 16, 19 New glycemic targets call for more reasonable, achievable, and safer glycemic targets20, 21 in patients receiving CII in the ICU setting. The recent ADA/AACE Inpatient Task Force now recommends against aggressive BG targets of <110 mg/dL for patients in the ICU, and suggests maintaining glucose levels between 140 and 180 mg/dL during insulin therapy. However, lower targets between 110 and 140 mg/dL, while not evidence‐based, may be acceptable in a subset of patients as long as these levels can be achieved safely by a well‐trained staff.
There are no RCTs examining the effect of intensive glycemic control on outcomes or the optimal glycemic target in hospitalized patients outside the ICU setting. However, several observational studies point to a strong association between hyperglycemia and poor clinical outcomes, including prolonged hospital stay, infection, disability after hospital discharge, and death.1, 3, 5 Despite the paucity of randomized controlled trials on general medical‐surgical floors, a premeal BG target of <140 mg/dL with random BG <180 mg/dL are recommended as long as this target can be safely achieved.21
Our study indicates that the use of CII in the non‐ICU setting is effective in improving glycemic control. After the first day of CII, the mean glucose level was within the recommended BG target of <180 mg/dL for patients treated with CII in the ICU. Moreover, the mean daily BG level during CII was lower than those recently reported with the use of SC basal‐bolus and insulin neutral protamine hagedorn (NPH) and regular insulin combinations in non‐ICU settings.17, 18 In the Randomized Study of Basal Bolus Insulin Therapy in the Inpatient Management of Patients with Type 2 Diabetes (RABBIT 2) trial, a study that compared the efficacy and safety of an SC basal‐bolus to a sliding scale insulin regimen, showed that 66% and 38% of patients, respectively, reached a target BG of <140 mg/dL.17 The Comparison of Inpatient Insulin Regimens: DEtemir plus Aspart vs. NPH plus regular in Medical Patients with Type 2 Diabetes (DEAN Trial) trial reported daily mean BG levels after the first day of 160 38 mg/dL and 158 51 mg/dL in the detemir/aspart and NPH/regular group, respectively with an achieved BG target of <140 mg/dL in 45% of patients in the detemir/aspart and in 48% in the NPH/regular18; whereas in this study we observed that most patients reached the target BG goal by 48 hours of the CII regimen.
Increasing evidence indicates that inpatient hypoglycemia is associated with short‐term and long‐term adverse outcomes.22, 23 The incidence of severe hypoglycemia (<40 mg/dL) with intensified glycemic control has ranged between 9.8% and 19%7, 15 vs. <5% in conventional treatment. In the present study, 35% of patients experienced a BG <70 mg/dL, 22% had a BG <60 mg/dL, and 5% of patients had a BG <40 mg/dL. The lower rate of hypoglycemic events with the use of CII in the non‐ICU setting observed in this study is likely the result of a more relaxed glycemic target of 80 to 150 mg/dL for the majority of subjects, as well as fewer severe comorbidities compared to patients in the ICU, where the presence of sepsis or hepatic, adrenal, or renal failure increase the risk of hypoglycemia.2224
Multivariate analyses adjusted for age, gender, race, BMI, renal function, steroid use, history of diabetes, and number of BG tests showed that nutrition status during CII was an important factor associated with increased frequency of hyperglycemic and hypoglycemic events. Compared to subjects maintained NPO, subjects who received oral intake while on CII had a significantly increased rate of hyperglycemic and hypoglycemic events. The increased risk of hypoglycemia for those allowed to eat is expected as the protocol would mandate an increase in the CII rate in response to the prandial BG increase but does not make provisions for BG assessments or CII adjustments in relationship to the meal. These results indicate that in stable patients who are ready to start eating, CII should be stopped and transitioned to SC insulin regimen. In patients who may benefit from the continued use of CII (eg, patients requiring multistep procedures/surgeries), treatment with CII could be continued with supplemental mealtime insulin (intravenous [IV] or SC).
CII may be useful in cases of patients with persistent hyperglycemia despite scheduled SC insulin regimen; in patients where rapid glycemic control may be warranted in order to decrease the risk of increased inflammation and vascular dysfunction in acute coronary syndromes; and to enhance wound healing status post surgical procedures. Other clinical scenarios in which CII may be preferred and no ICU bed is required include cases of new‐onset diabetes with significant hyperglycemia (BG >300 mg/dL), type 1 diabetes poorly controlled with SC insulin, uncontrolled gestational diabetes, parenteral nutrition use, perioperative states, or the use of high‐dose steroids or chemotherapy.
Our findings are limited by the retrospective nature of our study and the evaluation of patients in a single university medical center. Selection bias should be considered in the interpretation of the results since each index case was selected by the attending physician to be treated with CII as opposed to another regimen for inpatient glycemic control. The selection bias, however, may be limited by the fact that the subjects in this study placed on CII seemed to be similar to those in the general hospital population. A previous pilot study from a different academic institution, however, reported that implementing CII protocols in non‐ICU patients is safe and improved glycemic control without increasing hypoglycemia.25 In addition, because most subjects in this study had a history of diabetes prior to admission, these results may not be generalizable to populations with stress‐induced hyperglycemia.
In summary, our study indicates that a CII regimen is an effective option for the management of patients with persistent hyperglycemia in the non‐critical care setting. Most patients achieved and remained within targeted BG levels during CII. The overall rate of hypoglycemic events was similar to that reported in recent randomized clinical trials in the ICU and with SC insulin therapy. The frequency of hypoglycemic and hyperglycemic events was significantly increased in patients allowed to eat during CII suggesting that CII should be stopped and patients should be transitioned to an SC insulin regimen once oral intake is initiated. Future prospective, randomized studies are needed to compare the efficacy and safety of CII protocols to SC insulin protocols in the management of patients with persistent hyperglycemia in the non‐ICU setting.
- ,,,,,.Hyperglycemia: an independent marker of in‐hospital mortality in patients with undiagnosed diabetes.J Clin Endocrinol Metab.2002;87(3):978–982.
- ,,, et al.Outcome benefit of intensive insulin therapy in the critically ill: insulin dose versus glycemic control.Crit Care Med.2003;31(2):359–366.
- ,,, et al.Early postoperative glucose control predicts nosocomial infection rate in diabetic patients.JPEN J Parenter Enteral Nutr.1998;22(2):77–81.
- ,,, et al.Randomized trial of insulin‐glucose infusion followed by subcutaneous insulin treatment in diabetic patients with acute myocardial infarction (DIGAMI study): effects on mortality at 1 year.J Am Coll Cardiol.1995;26(1):57–65.
- ,,,.Glucose control and mortality in critically ill patients.JAMA.2003;290(15):2041–2047.
- ,,, et al.Management of diabetes and hyperglycemia in hospitals.Diabetes Care.2004;27(2):553–597.
- ,,, et al.Intensive insulin therapy in the medical ICU.N Engl J Med.2006;354(5):449–461.
- ,,, et al.Intensive insulin therapy in the critically ill patients.N Engl J Med.2001;345(19):1359–1367.
- ,,, et al.Continuous insulin infusion reduces mortality in patients with diabetes undergoing coronary artery bypass grafting.J Thorac Cardiovasc Surg.2003;125(5):1007–1021.
- ,.Cost analysis of intensive glycemic control in critically ill adult patients.Chest.2006;129(3):644–650.
- ,,, et al.Intensive versus conventional glucose control in critically ill patients.N Engl J Med.2009;360(13):1283–1297.
- ,,, et al.Implementation of a safe and effective insulin infusion protocol in a medical intensive care unit.Diabetes Care.2004;27(2):461–467.
- ,,.Glycemic control and sliding scale insulin use in medical inpatients with diabetes mellitus.Arch Intern Med.1997;157(5):545–552.
- .Diabetes Dek Professional Edition.Eatonton, GA:American Diabetes Association;1993.
- ,,, et al.Intensive insulin therapy and pentastarch resuscitation in severe sepsis.N Engl J Med.2008;358(2):125–139.
- ,,, et al.Intensive insulin therapy and mortality among critically ill patients: a meta‐analysis including NICE‐SUGAR study data.CMAJ.2009;180(8):799–800.
- ,,, et al.Randomized study of basal‐bolus insulin therapy in the inpatient management of patients with type 2 diabetes (RABBIT 2 trial).Diabetes Care.2007;30(9):2181–2186.
- ,,, et al.Comparison of inpatient insulin regimens with detemir plus aspart versus neutral protamine hagedorn plus regular in medical patients with type 2 diabetes.J Clin Endocrinol Metab.2009;94(2):564–569.
- ,,, et al.Strict glycaemic control in patients hospitalised in a mixed medical and surgical intensive care unit: a randomised clinical trial.Crit Care.2008;12(5):R120.
- ,,, et al.Hyperglycemia and acute coronary syndrome: a scientific statement from the American Heart Association Diabetes Committee of the Council on Nutrition, Physical Activity, and Metabolism.Circulation.2008;117(12):1610–1619.
- ,,, et al.American Association of Clinical Endocrinologists/American Diabetes Association: Consensus Statement on Inpatient Glycemic Control.Endocr Pract.2009;15(4):353–369.
- .Blood glucose and its prognostic implications in patients hospitalised with acute myocardial infarction.Diab Vasc Dis Res.2008;5(4):269–275.
- ,.Severe hypoglycemia in critically ill patients: risk factors and outcomes.Crit Care Med.2007;35(10):2262–2267.
- ,,, et al.Evaluation of short‐term consequences of hypoglycemia in an intensive care unit.Crit Care Med.2006;34(11):2714–2718.
- ,,,.New insulin infusion protocol Improves blood glucose control in hospitalized patients without increasing hypoglycemia.Jt Comm J Qual Patient Saf.2005;31(3):141–147.
Increasing evidence suggests that in hospitalized adult patients with and without diabetes, hyperglycemia is associated with increased risk of complications, prolonged length of hospitalization, and death.15 Past studies have shown that intensive glucose control in the intensive care unit (ICU) with continuous insulin infusion (CII) improves clinical outcomes by reducing the risk of multiorgan failure, systemic infection, and mortality. Effective management of hyperglycemia, an independent marker of poor outcome,1, 3, 6 is also associated with a decreased length of ICU and hospital stay79 and decreased total hospitalization cost.10 Based on several observational and interventional studies, improved control of blood glucose (BG) has been recommended for most adult patients with critical illness.2, 6, 11
Detrimental effects of hyperglycemia on outcome are not limited to patients in the ICU setting and CII has increasingly been used in non‐ICU settings. In such patients, the presence of hyperglycemia has been associated with prolonged hospital stay, infection, disability after hospital discharge, and death.1, 3, 6 In general medicine and surgery services, however, hyperglycemia is frequently overlooked and inadequately addressed. Numerous reports have shown that sliding scale regular insulin (SSRI) continues to be the most common insulin prescribed regimen in the non‐ICU setting.12 This regimen is challenged by limited and variable efficacy and continued concern for hypoglycemia13; thus, a more structured, target‐driven protocol such as scheduled SC insulin or a CII protocol could facilitate glycemic control in the non‐ICU setting. Recently, we reported that a scheduled regimen using basal‐bolus insulin subcutaneously was safe, effective, and superior to SSRI in controlling BG levels in hospitalized subjects with type 2 diabetes. As in many institutions in the United States, we have used CII protocols as an alternative to subcutaneous (SC) insulin for the management of persistent hyperglycemia in non‐ICU areas during the past 10 years, particularly during the postoperative period, transplant recipients, or patients transferred from the ICU. There is, however, no clinical evidence regarding the safety, efficacy, or outcomes with the use of CII in the non‐ICU setting. Accordingly, we analyzed our experience on the efficacy and safety of CII in the management of hyperglycemia in general medicine and surgical services.
Research Design and Methods
This retrospective chart analysis was conducted in adult patients >18 years of age who were consecutively admitted to the general medical and surgical wards between July 1, 2004 and June 30, 2005 at Emory University Hospital, a 579‐bed tertiary care facility staffed exclusively by Emory University School of Medicine faculty members and residents. The CII protocol, employing regular insulin (Novolin‐R Novo Nordisk Pharmaceuticals, Princeton, NJ) with a very short half‐life, in this study is a dynamic protocol14 that has been available at all nursing stations at Emory Hospital for the past decade (Table 1). The insulin rate is calculated using the formula (BG 60) (multiplier) = units of insulin per hour. The multiplier is a value used to denote the degree of insulin sensitivity based on glucose pattern and response to insulin. The multiplier typically starts at a value of 0.02 and is adjusted by the nurse as needed to achieve target BG levels based on bedside capillary glucose measurements. Blood glucose levels were checked every 1 to 2 hours by the nursing staff (nurse:patient ratio = 1:5) according to the protocol.
| ||
| Date (mm/dd/yyyy): | Time: | Allergies: NKA |
| 1. Begin this protocol and IV fluids on ____/____/____ at __________ (time). Discontinue previous insulin orders when this protocol is started. | ||
| 2. Bedside BG monitoring q 1 h until patient is within target range two consecutive readings, and then obtain BG q 2 h. If the BG falls above or below the targeted range, resume q 1 h readings. (If using A‐line specimen, please use consistently while patient on drip). | ||
| 3. If initial BG >150 mg/dL give Regular Insulin bolus: Dose _____ units. (Dose 0.1 units/kg body weight) | ||
| 4. Insulin drip: 125 units of Regular Insulin in 250 mL 0.9% saline (1 mL of solution = 0.5 units of Insulin). | ||
| 5. Target BG Range on Insulin Drip: _____ mg/dL to _____ mg/dL (Suggested target 80‐100 for ICU patients)* | ||
| For each BG value, recalculate drip rate and disregard previous rate of infusion. | ||
| Calculate Insulin Drip rate: (BG 60) ________ (multiplier) = units of Insulin per hour ( 2 to determine cc/hour) (Typical starting multiplier 0.02 but varies by insulin sensitivity) | ||
| Adjusting Multiplier: | ||
| BG > Target Range: Increase multiplier by 0.01 | ||
| BG within Target Range: No change in multiplier | ||
| BG < Target Range: Decrease multiplier by 0.01 | ||
| 6. Treating Hypoglycemia: | ||
| 6a. BG 60‐80: Give D50W using formula: (100 BG) 0.3 = mL D50W IV Push. Adjust multiplier per protocol above | ||
| 6b. BG <60: Give D50W using formula: (100 BG) 0.3 = mL D50W IV Push | ||
| Decrease insulin drip to 50% of current infusion rate | ||
| Recheck BG in 30 minutes | ||
| BG >80: Decrease multiplier by 0.01 and then return to Step 5 formula | ||
| BG 60‐80: Repeat step 6a | ||
| BG <60: Notify MD and repeat Step 6b | ||
| 7. Continuous IV fluids ______________________ at ____________ mL/hour. (Consider changing to dextrose‐based fluids when BG <250) | ||
| 8. Additional Orders: | ||
Of 1404 patients treated with CII during the hospital stay, 1191 patients received CII in the ICU and 213 patients received CII in non‐ICU areas. The final analysis included a total of 200 non‐ICU patient records after excluding 13 patients with diabetic ketoacidosis, incomplete documentation of glycemic records, or with duration of CII for less than 3 hours. Data collected included demographics, medical history, admission diagnoses, inpatient medications, inpatient laboratory values, bedside BG measurements, insulin doses used, nutrition status during CII, length of stay, disposition at discharge, and mortality rate. Nutrition status was defined in 3 ways: (1) nil per os or nothing by mouth (NPO); (2) oral nutrition (PO‐regular or PO‐liquid); and (3) tube feeds or total parenteral nutrition (TF/TPN). Data collection was limited to the first 10 days of CII use. This study was approved by the Institutional Review Board at Emory University.
The primary aim of the study was to determine the efficacy (mean daily BG levels) and safety (number of hyperglycemic [200 mg/dL] and hypoglycemic [60 mg/dL] events) during CII. We also determined the presence of potential risk factors associated with hypoglycemic and hyperglycemic events (age, body mass index [BMI], nutrition status, renal function, corticosteroid therapy, and use of enteral and parenteral nutrition) during CII.
Statistical Analysis
Two‐sample Wilcoxon tests and analysis of variance (ANOVA) were used to compare continuous variables. Levine's test for homogeneity of variances and log transformations were used when necessary. For categorical variables, chi square (2) analysis was used. Multivariate regression analyses controlling for age, gender, race, history of diabetes mellitus (DM), BMI, Cockcroft‐Gault estimated glomerular filtration rate (GFR), steroid use, nutrition status (via oral route vs. NPO), and number of BG tests were performed based on repeated measures linear models or linear models and were used to determine the influence of demographic and clinical characteristics on the risk of hypoglycemia, hyperglycemia, mortality, and length of stay. Model building followed the backward selection procedure. All data are expressed as mean standard deviation. Statistical significance was defined as P < 0.05.
Statistical Analysis Software (SAS), version 9.1 (SAS Institute, Inc., Cary, NC), was used to perform the statistical analysis.
Results
The cohort of 200 patients consisted of 54% males and 46% females, 53% Caucasian, 37% Black, with a mean age of 52 16 years (Table 2). Forty‐five percent of patients were admitted to the general medicine service and the remaining 55% were admitted to the surgical service for admission diagnoses that included cardiovascular disorders, trauma/surgery gastrointestinal disorders, renal disorders, and infection.
| |
| Age (years) | 52 16 |
| Gender (M/F) | 108/92 |
| Race (W/B/H/O) | 106/74//3/17 |
| Admitting service, Medical/Surgical (%/%) | 45/55 |
| BMI (kg/m2) | 28.4 7.1 |
| Known diabetes/new onset (%/%) | 90/11 |
| Admission blood glucose (mg/dL) | 325 235 |
| A1c (%) | 9.1 3 |
| CrCl (mL/minute) | 59.5 44 |
| On steroids (%) | 82 (41%) |
| Insulin drip duration (hours) | 41.6 37 |
| LOS (days) | 10 9 |
The primary indication for CII was poor glycemic control in 93.4% of patients. Forty‐one percent of subjects were receiving corticosteroids and 16% were continued on the insulin drip after transferring from an ICU. Nearly 90% of subjects had a history of diabetes and 11% were diagnosed with new‐onset diabetes. The mean admission BG concentration was 325 235 mg/dL (mean SD) and the mean A1c in 121 subjects in whom it was measured was 9.1 3%. The mean BG prior to the initiation of CII (323 184) was similar to the admission BG.
Of the 173 subjects that had well‐documented glycemic goals, the BG targeted during CII was 150 mg/dL in 85% of patients while the remaining subjects had a target BG goal that ranged from 70 to 250 mg/dL. The most commonly prescribed BG target goals were 80 to 110 mg/dL (41.6%), 80 to 120 mg/dL (13.9%), and 100 to 150 mg/dL (5.8%).
BG improved rapidly after the initiation of CII. BG on the first day of CII was 182 71 mg/dL; day 2: 142 42 mg/dL; day 3: 131 38 mg/dL; and day 4: 132 43 in response to receiving an average of 84 66 units/day, 71 61 units/day, 70 61 units/day, and 64 29 units/day, respectively (Table 3). Irrespective of the target BG goal, 67% of patients reached BG levels of 150 mg/dL by 48 hours of CII initiation. The duration of CII ranged between 4 and 240 hours, with an average of 41.6 hours and a median of 28 hours. The average insulin infusion rate during CII was 4.29 2.99 units/hour and the mean amount of insulin required to attain glycemic goals was 1.96 1.88 units/kg/day.
| Mean Daily Blood Glucose (mg/dL*) | Mean Daily IV Insulin Dose (units/day) | |
|---|---|---|
| ||
| Preinfusion | 323 184 | N/A |
| Day 1 | 182 71 | 84 66 |
| Day 2 | 142 42 | 71 61 |
| Day 3 | 131 38 | 70 61 |
| Day 4 | 132 43 | 64 29 |
During CII, 48% and 35% of patients had at least 1 episode of hyperglycemia (BG >200 mg/dL) on the second and third day of CII, respectively. Hypoglycemia (BG <60 mg/dL) was noted at least once in 22% of the cohort (day 1: 11%; day 2: 16%; and day 3: 14%); however, severe hypoglycemia (BG <40 mg/dL) only occurred in 5% of subjects. During the CII, 37% of patients experienced a BG <70 mg/dL. When BG targets were stratified (<120 mg/dL vs. 120‐180 mg/dL vs. >180 mg/dL), we found no significant association between the target BG goal and the frequency of hypoglycemic or hyperglycemic events during CII. None of the episodes of hypoglycemia were associated with significant or permanent complications.
The analysis of collected variables for influence on glycemic control (ie, BMI, age, corticosteroid use, renal function, and nutrition status) revealed that subjects with a creatinine level >1.5 mg/dL may have an increased risk of hyperglycemia (BG >200 mg/dL) (P = 0.047) but not hypoglycemia. The analysis also found that younger patients (51 16 years) were more likely to have episodes of hyperglycemia than older patients (57 13 years) (P = 0.027). Hospital length of stay and mortality rate (3%) were not associated with the rate of hyperglycemic or hypoglycemic events.
Eighty‐two percent of patients received nutrition support at some point while on the CII: 48% PO‐regular diet; 14% PO‐liquid diet; and 20% TF/TPN. Due to the titration of nutrition from NPO at CII initiation to PO, NPO status was analyzed in a time‐dependent fashion. Thus, among patients on CII on day 1, day 2, day 3, day 4, and days 510; 34.0%, 26.3%, 11.3%, 12.5%, and 10.5%, respectively, were NPO.
As compared to subjects maintained NPO, subjects that received oral nutrition while on CII had an increased rate of hyperglycemic events (BG >200 mg/dL: 86% vs. 76%, P = 0.19; >300 mg/dL: 57% vs. 53%, P = 0.69; >400 mg/dL: 32% vs. 21%, P = 0.22) and a decreased rate of hypoglycemic events (BG <70 mg/dL: 33% vs. 41%, P = 0.39; BG <60 mg/dL: 20% vs. 26%, P = 0.49; and BG <40 mg/dL: 4% vs. 6%, P = 0.65). The multivariate regression analyses, however, which considered age, gender, race, BMI, renal function, steroid use, history of diabetes, and number of BG tests, showed that nutrition status during CII was associated with increased frequency of hyperglycemic (P = 0.042) and hypoglycemic events (P = 0.086). As compared to NPO, oral intake (PO‐regular or PO‐liquid) was associated with a significantly increased frequency of hyperglycemic (P = 0.012) and hypoglycemic events (P = 0.035). Patients treated with TPN had lower BG values than those not on TPN. Although we observed no increased number of hypoglycemic events, TPN‐treated subjects had higher mortality than non‐TPN treated subjects (P < 0.001).
Discussion
Our study aimed to determine the safety and efficacy of CII in non‐critically‐ill patients with persistent hyperglycemia in general medicine and surgical services. We observed that the use of CII was effective in controlling hyperglycemia, with two‐thirds of patients achieving their target BG 150 mg/dL by 48 hours of insulin infusion. The rate of hypoglycemic events with the use of CII in non‐ICU patients was similar to that reported in recent ICU trials with intensive glycemic control7, 8, 15, 16 and is comparable to that reported in studies using SC insulin therapy in non‐ICU settings.17, 18 The number of hypoglycemic and hyperglycemic events was significantly higher in patients allowed to eat compared to those patients kept NPO during CII. There is substantial observational evidence linking hyperglycemia in hospitalized patients (with and without diabetes) to poor outcomes. There is ongoing debate, however, about the optimal level of BG in hospitalized patients. Early cohort studies as well as randomized controlled trials (RCTs) suggest that intensive treatment of hyperglycemia reduces length of hospital and ICU stay, multiorgan failure and systemic infections, and mortality.7, 9 These positive reports led the American Diabetes Association (ADA) and American Association of Clinical Endocrinologists (AACE) to recommend tight glycemic control (target of 80‐110 mg/dL) in critical care units. Recent multicenter controlled trials, however, have not been able to reproduce these results and in fact, have reported an increased risk of severe hypoglycemia and mortality in ICU patients in association with tight glycemic control.15, 16, 19 New glycemic targets call for more reasonable, achievable, and safer glycemic targets20, 21 in patients receiving CII in the ICU setting. The recent ADA/AACE Inpatient Task Force now recommends against aggressive BG targets of <110 mg/dL for patients in the ICU, and suggests maintaining glucose levels between 140 and 180 mg/dL during insulin therapy. However, lower targets between 110 and 140 mg/dL, while not evidence‐based, may be acceptable in a subset of patients as long as these levels can be achieved safely by a well‐trained staff.
There are no RCTs examining the effect of intensive glycemic control on outcomes or the optimal glycemic target in hospitalized patients outside the ICU setting. However, several observational studies point to a strong association between hyperglycemia and poor clinical outcomes, including prolonged hospital stay, infection, disability after hospital discharge, and death.1, 3, 5 Despite the paucity of randomized controlled trials on general medical‐surgical floors, a premeal BG target of <140 mg/dL with random BG <180 mg/dL are recommended as long as this target can be safely achieved.21
Our study indicates that the use of CII in the non‐ICU setting is effective in improving glycemic control. After the first day of CII, the mean glucose level was within the recommended BG target of <180 mg/dL for patients treated with CII in the ICU. Moreover, the mean daily BG level during CII was lower than those recently reported with the use of SC basal‐bolus and insulin neutral protamine hagedorn (NPH) and regular insulin combinations in non‐ICU settings.17, 18 In the Randomized Study of Basal Bolus Insulin Therapy in the Inpatient Management of Patients with Type 2 Diabetes (RABBIT 2) trial, a study that compared the efficacy and safety of an SC basal‐bolus to a sliding scale insulin regimen, showed that 66% and 38% of patients, respectively, reached a target BG of <140 mg/dL.17 The Comparison of Inpatient Insulin Regimens: DEtemir plus Aspart vs. NPH plus regular in Medical Patients with Type 2 Diabetes (DEAN Trial) trial reported daily mean BG levels after the first day of 160 38 mg/dL and 158 51 mg/dL in the detemir/aspart and NPH/regular group, respectively with an achieved BG target of <140 mg/dL in 45% of patients in the detemir/aspart and in 48% in the NPH/regular18; whereas in this study we observed that most patients reached the target BG goal by 48 hours of the CII regimen.
Increasing evidence indicates that inpatient hypoglycemia is associated with short‐term and long‐term adverse outcomes.22, 23 The incidence of severe hypoglycemia (<40 mg/dL) with intensified glycemic control has ranged between 9.8% and 19%7, 15 vs. <5% in conventional treatment. In the present study, 35% of patients experienced a BG <70 mg/dL, 22% had a BG <60 mg/dL, and 5% of patients had a BG <40 mg/dL. The lower rate of hypoglycemic events with the use of CII in the non‐ICU setting observed in this study is likely the result of a more relaxed glycemic target of 80 to 150 mg/dL for the majority of subjects, as well as fewer severe comorbidities compared to patients in the ICU, where the presence of sepsis or hepatic, adrenal, or renal failure increase the risk of hypoglycemia.2224
Multivariate analyses adjusted for age, gender, race, BMI, renal function, steroid use, history of diabetes, and number of BG tests showed that nutrition status during CII was an important factor associated with increased frequency of hyperglycemic and hypoglycemic events. Compared to subjects maintained NPO, subjects who received oral intake while on CII had a significantly increased rate of hyperglycemic and hypoglycemic events. The increased risk of hypoglycemia for those allowed to eat is expected as the protocol would mandate an increase in the CII rate in response to the prandial BG increase but does not make provisions for BG assessments or CII adjustments in relationship to the meal. These results indicate that in stable patients who are ready to start eating, CII should be stopped and transitioned to SC insulin regimen. In patients who may benefit from the continued use of CII (eg, patients requiring multistep procedures/surgeries), treatment with CII could be continued with supplemental mealtime insulin (intravenous [IV] or SC).
CII may be useful in cases of patients with persistent hyperglycemia despite scheduled SC insulin regimen; in patients where rapid glycemic control may be warranted in order to decrease the risk of increased inflammation and vascular dysfunction in acute coronary syndromes; and to enhance wound healing status post surgical procedures. Other clinical scenarios in which CII may be preferred and no ICU bed is required include cases of new‐onset diabetes with significant hyperglycemia (BG >300 mg/dL), type 1 diabetes poorly controlled with SC insulin, uncontrolled gestational diabetes, parenteral nutrition use, perioperative states, or the use of high‐dose steroids or chemotherapy.
Our findings are limited by the retrospective nature of our study and the evaluation of patients in a single university medical center. Selection bias should be considered in the interpretation of the results since each index case was selected by the attending physician to be treated with CII as opposed to another regimen for inpatient glycemic control. The selection bias, however, may be limited by the fact that the subjects in this study placed on CII seemed to be similar to those in the general hospital population. A previous pilot study from a different academic institution, however, reported that implementing CII protocols in non‐ICU patients is safe and improved glycemic control without increasing hypoglycemia.25 In addition, because most subjects in this study had a history of diabetes prior to admission, these results may not be generalizable to populations with stress‐induced hyperglycemia.
In summary, our study indicates that a CII regimen is an effective option for the management of patients with persistent hyperglycemia in the non‐critical care setting. Most patients achieved and remained within targeted BG levels during CII. The overall rate of hypoglycemic events was similar to that reported in recent randomized clinical trials in the ICU and with SC insulin therapy. The frequency of hypoglycemic and hyperglycemic events was significantly increased in patients allowed to eat during CII suggesting that CII should be stopped and patients should be transitioned to an SC insulin regimen once oral intake is initiated. Future prospective, randomized studies are needed to compare the efficacy and safety of CII protocols to SC insulin protocols in the management of patients with persistent hyperglycemia in the non‐ICU setting.
- ,,,,,.Hyperglycemia: an independent marker of in‐hospital mortality in patients with undiagnosed diabetes.J Clin Endocrinol Metab.2002;87(3):978–982.
- ,,, et al.Outcome benefit of intensive insulin therapy in the critically ill: insulin dose versus glycemic control.Crit Care Med.2003;31(2):359–366.
- ,,, et al.Early postoperative glucose control predicts nosocomial infection rate in diabetic patients.JPEN J Parenter Enteral Nutr.1998;22(2):77–81.
- ,,, et al.Randomized trial of insulin‐glucose infusion followed by subcutaneous insulin treatment in diabetic patients with acute myocardial infarction (DIGAMI study): effects on mortality at 1 year.J Am Coll Cardiol.1995;26(1):57–65.
- ,,,.Glucose control and mortality in critically ill patients.JAMA.2003;290(15):2041–2047.
- ,,, et al.Management of diabetes and hyperglycemia in hospitals.Diabetes Care.2004;27(2):553–597.
- ,,, et al.Intensive insulin therapy in the medical ICU.N Engl J Med.2006;354(5):449–461.
- ,,, et al.Intensive insulin therapy in the critically ill patients.N Engl J Med.2001;345(19):1359–1367.
- ,,, et al.Continuous insulin infusion reduces mortality in patients with diabetes undergoing coronary artery bypass grafting.J Thorac Cardiovasc Surg.2003;125(5):1007–1021.
- ,.Cost analysis of intensive glycemic control in critically ill adult patients.Chest.2006;129(3):644–650.
- ,,, et al.Intensive versus conventional glucose control in critically ill patients.N Engl J Med.2009;360(13):1283–1297.
- ,,, et al.Implementation of a safe and effective insulin infusion protocol in a medical intensive care unit.Diabetes Care.2004;27(2):461–467.
- ,,.Glycemic control and sliding scale insulin use in medical inpatients with diabetes mellitus.Arch Intern Med.1997;157(5):545–552.
- .Diabetes Dek Professional Edition.Eatonton, GA:American Diabetes Association;1993.
- ,,, et al.Intensive insulin therapy and pentastarch resuscitation in severe sepsis.N Engl J Med.2008;358(2):125–139.
- ,,, et al.Intensive insulin therapy and mortality among critically ill patients: a meta‐analysis including NICE‐SUGAR study data.CMAJ.2009;180(8):799–800.
- ,,, et al.Randomized study of basal‐bolus insulin therapy in the inpatient management of patients with type 2 diabetes (RABBIT 2 trial).Diabetes Care.2007;30(9):2181–2186.
- ,,, et al.Comparison of inpatient insulin regimens with detemir plus aspart versus neutral protamine hagedorn plus regular in medical patients with type 2 diabetes.J Clin Endocrinol Metab.2009;94(2):564–569.
- ,,, et al.Strict glycaemic control in patients hospitalised in a mixed medical and surgical intensive care unit: a randomised clinical trial.Crit Care.2008;12(5):R120.
- ,,, et al.Hyperglycemia and acute coronary syndrome: a scientific statement from the American Heart Association Diabetes Committee of the Council on Nutrition, Physical Activity, and Metabolism.Circulation.2008;117(12):1610–1619.
- ,,, et al.American Association of Clinical Endocrinologists/American Diabetes Association: Consensus Statement on Inpatient Glycemic Control.Endocr Pract.2009;15(4):353–369.
- .Blood glucose and its prognostic implications in patients hospitalised with acute myocardial infarction.Diab Vasc Dis Res.2008;5(4):269–275.
- ,.Severe hypoglycemia in critically ill patients: risk factors and outcomes.Crit Care Med.2007;35(10):2262–2267.
- ,,, et al.Evaluation of short‐term consequences of hypoglycemia in an intensive care unit.Crit Care Med.2006;34(11):2714–2718.
- ,,,.New insulin infusion protocol Improves blood glucose control in hospitalized patients without increasing hypoglycemia.Jt Comm J Qual Patient Saf.2005;31(3):141–147.
Copyright © 2010 Society of Hospital Medicine
Combination Therapy and Surgery Mortality
Vascular surgery is the most morbid of the noncardiac surgeries, with a 30‐day mortality estimated to be 3% to 10% and 6‐month mortality estimated to be 10% to 30%.14 Adverse outcomes are highly correlated with the presence of perioperative ischemia and infarction. Perioperative ischemia is associated with a 9‐fold increase in the odds of unstable angina, nonfatal myocardial infarction, and cardiac death, while a perioperative myocardial infarction increases the odds of death 20‐fold up to 2 years after surgery.57 Prior research has centered on the single or combination use of perioperative beta‐blockers and statins, which has been associated with decreased short‐term and long‐term mortality after vascular surgery,814 with the exceptions of the Metoprolol After Vascular Surgery (MAVS)15 and the Perioperative Beta‐Blockade (POBBLE) studies,16 which were negative beta‐blocker randomized controlled trials exclusively in vascular surgery patients, and the Perioperative Ischemic Evaluation (POISE) study,17 which was the largest perioperative beta‐blocker trial to date in noncardiac surgery, with 41% of the patients undergoing vascular surgery.
There have been few studies assessing clinical outcomes in patients taking multiple concurrent cardioprotective medications. Clinicians are challenged to apply research results to their patients, who generally take multiple drugs. A retrospective cohort study of acute coronary syndrome patients did assess the use of evidence‐based, combination therapies, including aspirin, ACE inhibitors, beta‐blockers, and statins, compared to the use of none of these agents and found an association with decreased 6‐month mortality.18 There are no prior noncardiac surgery studies assessing the concurrent use of multiple possibly cardioprotective drugs. There is 1 cohort study of coronary artery bypass graft surgery patients that assessed aspirin, ACE inhibitor, beta‐blocker, and statin use and found associations with decreased mortality.19 As preoperative coronary revascularization has not been found to produce improved survival after vascular surgery, clarifying which perioperative medicines alone or in combination may improve outcomes becomes even more important.20 We sought to ascertain if the use of concurrent combination aspirin, ACE inhibitors, beta‐blockers, and statins compared to nonuse was associated with a decrease in 6‐month mortality after vascular surgery.
Patients and Methods
Setting and Subjects
All patients presenting for vascular surgery at 5 regional Department of Veterans Affairs (VA) medical centers between January 1998 and March 2005 (3062 patients) were eligible for study entry. Patients with less than 6 months follow‐up were excluded (42 patients). The study included the remaining 3020 patients (comprising 99% of the original population). Our methods have been previously described.8 In brief, we conducted a retrospective cohort study using a regional VA administrative and relational database containing information on both the outpatient and inpatient environments. A record is generated for every contact a patient makes with the VA healthcare system, including prescription medications, laboratory values, demographic information, International Classification of Diseases, 9th Revision (ICD‐9) codes, and vital status. In addition, we used the national VA death index, the VA Beneficiary Identification and Records Locator Subsystem database, which includes Social Security Administration data, to assess vital status. A patient was considered to have a drug exposure (aspirin, ACE inhibitor, beta‐blocker, or statin) if the patient filled or renewed a prescription for the drug within 30 days before surgery. It was determined how many of these drugs were taken during this period, and in which combinations. The Institutional Review Board (IRB) at the Portland VA Medical Center approved the study with a waiver of informed consent.
Data Elements
For every patient we noted the type of vascular surgery (carotid, aortic, lower extremity bypass, or lower extremity amputation), age, sex, comorbid conditions (hypertension, cerebrovascular disease, cancer, diabetes, hyperlipidemia, chronic obstructive pulmonary disease [COPD], chronic kidney disease [CKD], coronary artery disease [CAD], or heart failure), nutritional status (serum albumin), and other medication use (also defined as filling a prescription within 30 days before surgery [insulin and clonidine]). Insulin use was documented to calculate the revised cardiac risk index (RCRI),21 and clonidine was documented to account for as a confounder.22 The RCRI was assigned to each patient. One point was given for each of the following risk factors: use of insulin, CAD, heart failure, cerebrovascular disease, CKD, and high‐risk surgery (intrathoracic, intraperitoneal, or suprainguinal vascular procedures). These variables were defined by ICD‐9 codes. CKD was defined as either an ICD‐9 code for CKD or a serum creatinine >2 mg/dL. Patients were identified by the index vascular surgery using ICD‐9 codes in the VA database, and data were extracted from both the inpatient and outpatient environments.
Statistical Analysis
Patients were included in the analysis if they either died within 6 months or were followed for at least 6 months. Data management and analyses were performed using SAS software, version 9.0. We conducted the univariate analysis of 6‐month mortality using chi‐square analysis and provided unadjusted relative risk estimates for demographic and clinical variables. Demographic variables included age, sex, year, and site of surgery. Clinical variables included preoperative use of insulin and clonidine, preoperative medical conditions, serum albumin, creatinine, RCRI score, and type of surgery.
Bias due to confounding is a problem for studies that cannot randomize subjects into treatment groups. This bias can often be reduced by adjusting for the potentially confounding variables as covariates in regression models. However, when the number of potential confounders is large, as it was in our study, and the number of events, ie, deaths, is small, the resulting regression model can be unstable and the estimates unreliable.23, 24 In such cases, it is necessary to control for confounding using another method. We chose to use propensity scoring and stratification analyses since these methods enable controlling for a large number of covariates using a single variable.
The study drugs were: aspirin, beta‐blockers, statins, and ACE inhibitors. There are 16 combinations with 120 pairwise statistical comparisons possible for these 4 drug exposures. Instead of these multiple comparisons, we chose 4 classifications of combination drug exposure to examine: all 4 drugs compared to none, 3 drugs compared to none, 2 drugs compared to none, and 1 drug compared to none. Four different propensity scores were generated since we studied 4 different drug exposure classes. For each drug exposure class, propensity analyses were performed by using logistic regression to predict the likelihood of use of the drug of interest using all potential demographic and clinical confounding variables. Each subject received a score corresponding to the probability of their having a drug exposure based on the covariates. Scores were divided into quintiles, and these quintiles were used for stratification in Cochran‐Mantel‐Haenszel analyses. Thus, we were able to test the association of patient survival to 6 months with the category of drug exposure comparisons within 30 days before surgery, while controlling for all aforementioned potential confounders. Results of the Breslow‐Day test for homogeneity indicated that no statistically significant differences existed between the results of the propensity quintiles, so the overall summary statistic was reported. All quintiles achieved a balance in the covariates. However, for the 4 study drug exposure class, there were no deaths for the first (n = 173) and second (n = 176) quintiles (corresponding to lower‐risk patients). We therefore excluded these patients from the final analysis.
Variables used in propensity scores included: age, sex, preoperative medical conditions, preoperative clonidine use, nutritional status (serum albumin), RCRI score, and year and location of surgery. To determine whether the propensity score adjustment removed imbalance among the comparisons of the combination drug classes to the no‐drug‐exposure patients, we evaluated associations between each classification of study drug exposure and predictor variables as compared to no‐drug‐exposure patients with both unadjusted chi‐square and propensity‐adjusted Cochran‐Mantel‐Haenszel analyses.
Results
Patient Characteristics
There were 3020 patients with a median age of 67 years, and interquartile range of 59 to 75 years. Ninety‐nine percent were male, and all patients were assessed for death at 6 months after surgery (Table 1). Ten percent (304) had combination all‐4‐drug exposure, 22% (652) had 3‐drug exposure, 24% (736) had 2‐drug exposure, 26% (783) had 1‐drug exposure, and 18% (545) had no study drug exposures. Eight percent (229) of surgeries were aortic, 28% (861) were carotid, 28% (852) were lower extremity amputation, and 36% (1078) were lower extremity bypass. Twenty‐two percent (665) of patients were low risk, with a RCRI of 0, 60% (1822) were moderate risk with a RCRI of 1 to 2, and 18% (553) were high risk with a RCRI of 3. Overall the 6‐month mortality was 9.7% (294). The 6‐month mortality for carotid endarterectomy was 5.0% (43/861), for lower extremity bypass 7.6% (82/1078), for aorta repair 9.2% (21/229), and for lower extremity amputation 17.4% (148/852).
| Variable | Level | N (%) Overall N = 3020 | Relative Risk (95% CI) | Chi Square P‐Value |
|---|---|---|---|---|
| ||||
| Age: year, median (IQR) | 67 (59, 75) | 1.04 (1.031.06) | <0.001* | |
| Sex | Female | 44 (1.5) | 1 | 0.490 |
| Male | 2976 (98.5) | 1.48 (0.464.81) | ||
| Preoperative medical conditions | HTN | 2388 (79.1) | 1.40 (0.011.93) | 0.036 |
| DM | 1455 (48.2) | 1.45 (1.131.84) | 0.003 | |
| COPD | 912 (30.2) | 1.71 (1.342.19) | <0.001 | |
| CA | 674 (22.3) | 1.42 (1.091.86) | 0.012 | |
| CKD | 344 (11.4) | 2.04 (1.492.80) | <0.001 | |
| CAD | 1479 (49.0) | 1.51 (1.181.92) | 0.001 | |
| CHF | 911 (30.2) | 2.41 (1.893.08) | <0.001 | |
| CVA/TIA | 802 (26.6) | 1.08 (0.821.41) | 0.587 | |
| Lipid | 865 (28.6) | 0.81 (0.611.06) | 0.123 | |
| Blood chemistry | Creatinine > 2 | 228 (7.5) | 3.11 (2.224.36) | <0.001 |
| Albumin 3.5 | 629 (20.8) | 3.60 (2.804.62) | <0.001 | |
| Medication use | Aspirin | 1773 (58.7) | 1.12 (0.881.44) | 0.355 |
| ACE, inhibitor | 1238 (41.0) | 0.81 (0.631.04) | 0.090 | |
| Statin | 1214 (40.2) | 0.66 (0.510.86) | 0.001 | |
| Beta blocker | 1202 (39.8) | 0.76 (0.590.98) | 0.031 | |
| Clonidine | 115 (3.8) | 1.65 (0.972.80) | 0.080 | |
| Insulin | 474 (15.7) | 1.47 (1.091.98) | 0.013 | |
| Number of study drugs used | None | 545 (18.0) | 1 | 0.018 |
| One of 4 | 783 (25.9) | 1.06 (0.751.51) | ||
| Two of 4 | 736 (24.4) | 0.94 (0.651.35) | ||
| Three of 4 | 652 (21.6) | 0.73 (0.491.08) | ||
| All four | 304 (10.1) | 0.66 (0.391.09) | ||
| Type of surgery | Carotid | 861 (28.5) | 1 | <0.001 |
| Bypass | 1078 (35.7) | 1.57 (1.072.29) | ||
| Aorta | 229 (7.6) | 1.92 (1.123.31) | ||
| Amputation | 852 (28.2) | 4.00 (2.815.70) | ||
| RCRI category | 0 | 665 (22.0) | 1 | <0.001 |
| 1 | 976 (32.3) | 1.12 (0.761.66) | ||
| 2 | 846 (28.0) | 1.66 (1.142.42) | ||
| 3 | 553 (17.6) | 2.83 (1.934.14) | ||
| Surgery year | 1998 | 539 (17.8) | 1 | 0.804 |
| 1999 | 463 (15.3) | 1.36 (0.892.07) | ||
| 2000 | 418 (13.8) | 1.07 (0.681.68) | ||
| 2001 | 407 (13.5) | 1.23 (0.791.92) | ||
| 2002 | 368 (12.2) | 1.34 (0.962.10) | ||
| 2003 | 371 (12.3) | 1.25 (0.801.97) | ||
| 2004 | 395 (13.1) | 1.17 (0.741.84) | ||
| 2005 | 59 (2.0) | 0.80 (0.282.30) | ||
The most common single‐drug exposure was aspirin, 14% (416), followed by ACE inhibitors, 5% (163) (Table 2). The more common 2‐drug exposures included ACE inhibitors and aspirin, 7% (203), aspirin and beta‐blockers, 5% (161), and aspirin and statins, 5% (141). The common 3‐drug combinations included aspirin, beta‐blockers, and statins, 8% (229); ACE inhibitors, aspirin, and statins, 6% (167); and ACE inhibitors, aspirin, and beta‐blockers, 5% (152). ACE inhibitor exposure was common in all combinations, eg, 20.8% of the 1‐drug group had exposure to an ACE inhibitor, 40.5% in the 2‐drug group, 64.9% in the 3‐drug group, and all patients in the 4‐drug group. Overall, 39.3% of patients in the study had ACE inhibitor exposure. The gross unadjusted mortality for each drug exposure group was 10.6% for the no drug group, 11.2% for the 1‐drug group, 10.1% for the 2‐drug group, 8% for the 3‐drug group, and 7.2% for the 4‐drug group.
| Drugs Used | Presurgery | 6 Months Postsurgery | ||
|---|---|---|---|---|
| Frequency | % | Frequency | % | |
| ||||
| None | 545 | 18.1 | 669 | 24.5 |
| 1 Drug | ||||
| Aspirin | 416 | 53.1 | 169 | 28.3 |
| ACE inhibitor | 163 | 20.8 | 135 | 22.6 |
| Beta‐blocker | 110 | 14.1 | 163 | 27.2 |
| Statin | 94 | 12.0 | 131 | 21.9 |
| All 1 drug | 783 | 100.0 | 598 | 100.0 |
| 2 Drugs | ||||
| Aspirin + ACE inhibitor | 203 | 27.6 | 102 | 14.4 |
| Aspirin + Beta‐blocker | 161 | 21.8 | 117 | 16.5 |
| Aspirin + Statin | 141 | 19.2 | 86 | 12.1 |
| ACE inhibitor + Beta‐blocker | 56 | 7.6 | 103 | 14.5 |
| ACE inhibitor + Statin | 89 | 12.1 | 126 | 17.7 |
| Beta‐blocker + Statin | 86 | 11.7 | 176 | 24.8 |
| All 2 drugs | 36 | 100.0 | 710 | 100.0 |
| 3 Drugs | ||||
| Aspirin + ACE inhibitor + Beta‐blocker | 152 | 23.3 | 96 | 16.5 |
| Aspirin + ACE inhibitor + Statin | 167 | 25.6 | 103 | 17.7 |
| Aspirin + Beta‐ blocker + Statin | 229 | 35.1 | 165 | 28.4 |
| ACE inhibitor + Beta‐blocker Statin | 104 | 16.0 | 218 | 37.4 |
| All 3 drugs | 652 | 100.0 | 582 | 100.0 |
| All 4 drugs | 304 | 10.1 | 167 | 6.1 |
| Total | 3020 | 100.0 | 2726* | 100.0 |
During the 6 complete years of the study (1998‐2004) the frequency of combination exposure for all 4 study drugs increased from 3.5% to 13.4%; 3‐drug exposure also increased, 14.7% to 27.8%; 2‐drug exposure remained relatively stable, 24.5% to 22%; and single‐drug exposure declined, 24.9% to 12.7% (Figure 1). Individual study drug exposures over the 6 years of the study generally also increased with respect to the other combinations: ACE inhibitor use increased, 34.5% to 42.5%; beta‐blocker, 27.8% to 53.4%; statin, 22.6% to 52.2%. The exception was aspirin, which was relatively stable, 54.5% in 1998, and 57.2% in 2004 (Figure 2).

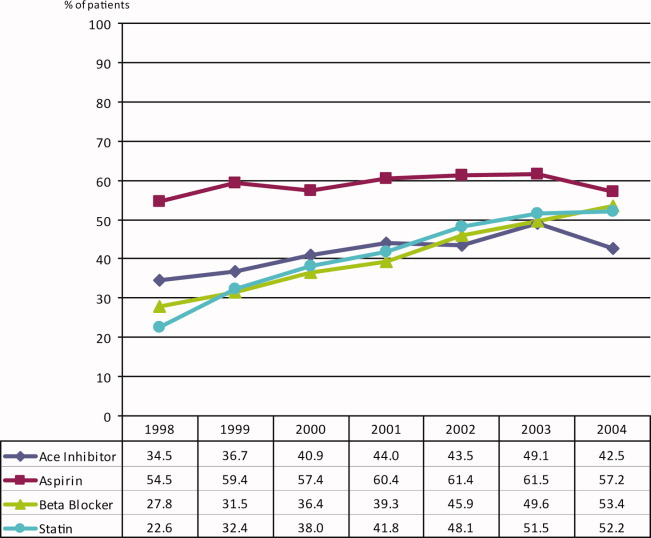
We also compared the use of the study drug exposures at 6 months after surgery to use within 30 days before surgery (Table 2). In the VA healthcare system aspirin is cheaper for some patients to purchase over‐the‐counter. Aspirin is likely underestimated in this dataset. The frequency of follow‐up drug exposure at 6 months was overall similar to the drug exposure within 30 days before surgery. When aspirin was 1 of the combination exposures, the frequencies declined, and when aspirin was not 1 of the exposures, the frequencies generally increased. The frequency of no‐drug exposures increased from 18.1% before surgery to 24.5% 6 months after surgery, and the frequency of all 4 drug exposures decreased from 10.1% to 6.1%, respectively.
Univariate Analysis
There were statistically significant differences in 6‐month mortality for the combination drug exposure classes compared to no‐drug exposure; P value for linear trend = 0.018 (Table 1).
Propensity‐adjusted Analysis
Patients categorized in each combination drug exposure group were significantly different in their demographic and clinical characteristics compared to the no‐drug exposure patients using unadjusted chi‐square P values (Appendix Table 1). However, after the propensity adjustments, only hyperlipidemia was statistically different for the combination 4‐drug exposure patients compared to no‐drug exposure patients (Appendix Table 1). All other demographic and clinical characteristics for the comparison of the drug exposure classes to no‐drug exposure patients had statistically nonsignificant propensity‐adjusted P values. The range of propensity score distribution was fairly comparable for each combination drug exposure group. The Breslow‐Day test for homogeneity was not significant among the quintiles for any of the drug exposure classes (Table 3; Appendix Table 2), indicating that there was not a statistically significant difference in stratum‐specific relative risks between the different quintiles. Therefore, the summary adjusted result was reported for each drug exposure group. Patients with all 4 drug exposures (with the first [n = 173] and second [n = 166] quintiles excluded due to zero deaths) compared to no‐drug exposure patients had a marginally significant association with decreased mortality, overall propensity‐adjusted relative risk (aRR) 0.52 (95% confidence interval [CI], 0.26‐1.01; P = 0.052), number needed to treat (NNT) 19; patients with the combination 3‐drug exposure had a significant association with decreased mortality, aRR 0.60 (95% CI, 0.38‐0.95; P = 0.030), NNT 38; as well as patients with combination 2‐drug exposure, aRR 0.68 (95% CI, 0.46‐0.99; P = 0.043), NNT 170 (Table 3). Patients with 1 drug exposure did not have an association with decreased mortality compared to no‐drug exposure patients, aRR 0.88 (95% CI, 0.63‐1.22; P = 0.445).
| Variable | N (Overall N = 3020) | 6 Mo. Mortality | P Value* | Adjusted Relative Risk (95% CI) of Death* | NNT | |||
|---|---|---|---|---|---|---|---|---|
| Nonuser | User | |||||||
| % | (n/N) | % | (n/N) | |||||
| ||||||||
| 1 Drug vs. no drugs | 1328 | 10.64 | (58/545) | 11.24 | (88/783) | 0.445 | 0.88 (0.631.22) | |
| 2 Drugs vs. no drugs | 1281 | 10.64 | (58/545) | 10.05 | (74/736) | 0.043 | 0.68 (0.460.99) | 170 |
| 3 Drugs vs. no drugs | 1197 | 10.64 | (58/545) | 7.98 | (52/652) | 0.030 | 0.60 (0.380.95) | 38 |
| 4 Drugs vs. no drugs | 510 | 12.56 | (26/207) | 7.26 | (22/303) | 0.052 | 0.52 (0.261.01) | 19 |
Discussion
This retrospective cohort study has demonstrated that the combination use of 4 drugs (aspirin, beta‐blockers, statins, and ACE inhibitors) compared to the use of none of these drugs had a trend toward decreased mortality, with a 49% decrease in propensity‐adjusted 6‐month mortality after vascular surgery and an NNT of 19. In addition, the combination use of 3 drug exposures was significantly associated with a 40% decrease in mortality, with propensity adjustment and NNT of 38; and the 2‐drug combination exposure showed a significant association, with a propensity‐adjusted 32% decreased mortality, and an NNT of 170. Both the unadjusted and adjusted analyses showed a linear trend, suggesting a dose‐response effect of more study‐drug exposure association with less 6‐month mortality and smaller NNT.
The lack of statistical significance for the 4‐drug exposure group is likely due to few patients and events in this group, and the exclusion of the first 2 quintiles (n = 339) due to having zero deaths with which to compare. It is not unusual to exclude patients from analyses in propensity methods. The patients we excluded were low‐risk who had survived to 6‐months after surgery, so they would have also been excluded in a propensity‐matched analysis. We did not perform propensity matching, as we had adequate homogeneity between our quintile strata, and were not powered to perform matching.
This is the first evidence of which we are aware of an association with decreased mortality for the combination perioperative use of aspirin, beta‐blockers, statins, and ACE inhibitors in vascular surgery patients. Aspirin has been associated with decreased mortality in patients undergoing coronary artery bypass graft surgery,25 but the effects of aspirin on noncardiac surgery outcomes is less clear.26
Beta‐blockers and statins have been associated with decreased short‐term and long‐term mortality after vascular surgery in the past,814 but more recent beta‐blocker studies have been negative, introducing controversy for the topic.1517, 27 Beta‐blockers are currently recommended as: Class I (should be used), Evidence Level B (limited population risk strata evaluated) for vascular surgery patients already taking a beta‐blocker or with positive ischemia on stress testing; Class IIa (reasonable to use), Evidence Level B for 1 or more clinical risk factors; or Class IIb (may be considered), Evidence Level B for no clinical risk factors, in the 2007 American College of Cardiology/American Heart Association (ACC/AHA) guidelines for perioperative evaluation.28 Perioperative beta‐blocker trials that have titrated the dose to a goal heart rate have consistently been associated with improved outcomes after vascular surgery,10, 12, 29, 30 and perioperative beta‐blocker trials that have used fixed dosing after surgery have been negative,1517, 27 including the POISE trial, which was associated with increased strokes and mortality.
This is also the first evidence of which we are aware that ACE inhibitors in combination with other drugs may be associated with decreased mortality after vascular surgery. While our study design does not support a causal relationship between ACE inhibitor exposure and decreased mortality, the increasing exposure in each drug exposure group for ACE inhibitors and correlated decreasing mortality is of sufficient interest to warrant further study. The use of ACE inhibitors has been associated with decreased mortality in patients with atherosclerotic vascular disease and CAD.31 There has been a concern expressed in the literature about the perioperative use of ACE inhibitors due to the potential for intraoperative hypotension.3236 Many centers advise patients to discontinue ACE inhibitor use the day before surgery. The number of patients studied remains small. More research is needed to clarify this issue. Use of angiotensin‐receptor blockers was not assessed; their use was considered to be rare, because use was restricted to patients intolerant of ACE inhibitors during the study period.
The 2005 ACC/AHA guideline for patients with peripheral arterial disease recommends the use of aspirin and statins.37 ACE inhibitors are recommended for both asymptomatic and symptomatic peripheral artery disease patients. The 2006 ACC/AHA guidelines for secondary prevention for patients with coronary or other atherosclerotic vascular disease recommends the use of chronic beta‐blockers.38 There appears to be some benefit in mortality from the combination aspirin, beta‐blocker, statin, and ACE inhibitor drug regimen in patients with established atherosclerotic vascular disease.
We expect the frequency of aspirin exposure to be underestimated in this study population (due to over‐the‐counter undocumented use), so our findings may be somewhat underestimated as well. This may also explain why the frequency of aspirin remained constant over time while the other drug exposures increased over time.
Our study has several limitations. First, our design was a retrospective cohort. Propensity analysis attempts to correct for confounding by indication in nonrandomized studies as patients that are exposed to a study drug are different from patients that are not exposed to the same study drug. For example, without adjustment for the propensity scores, the drug exposure classes were significantly associated with demographic and clinical characteristics when compare to the no‐drug‐exposure patients. However, with the propensity score adjustment, these associations were no longer statistically significant, with the exception of hyperlipidemia in patients taking all 4 drugs, which supports a rigorous propensity adjustment. We also controlled for the use of clonidine and serum albumin, both strong predictors of death after noncardiac surgery.22, 39 Second, we utilized administrative ICD‐9 code data for abstraction, and utilized only documented and coded comorbidities in the VA database. Unmeasured confounders may exist. Further, we cannot identify which combinations of specific study drugs were most associated with a reduction in 6‐month mortality, but we believe our data supports the case that all 4 of the study drugs be considered for each patient undergoing vascular surgery. It is important to also note that patient baseline risk, which can be difficult to clarify in retrospective cohort studies, will have a large impact on the results of the NNT. Lastly, this study needs to be repeated in a population that includes a greater number of female participants.
The combination exposure of 2 to 3 study drugs: aspirin, beta‐blockers, statins, and ACE inhibitors was consistently associated with decreased 6‐month mortality after vascular surgery, with a high prevalence of ACE inhibitor use, and the combination exposure of all 4 study drugs was marginally associated with decreased mortality. Consideration for the individual patient undergoing vascular surgery should include whether or not the patient may benefit from these 4 drugs. Further research with prospective and randomized studies is needed to clarify the optimum timing of these drugs and their combination efficacy in vascular surgery patients with attention to patient‐specific risk.
Acknowledgements
The authors thank Martha S. Gerrity, MD, PhD, Portland VA Medical Center, Portland, Oregon, for comments on an earlier version of the manuscript.
- ,,, et al.Postoperative and late survival outcomes after major amputation: findings from the Department of Veterans Affairs National Surgical Quality Improvement Program.Surgery.2001;130(1):21–29.
- ,,,.Perioperative‐ and long‐term mortality rates after major vascular surgery: the relationship to preoperative testing in the Medicare population.Anesth Analg.1999;89(4):849–855.
- ,,, et al.Women have increased risk of perioperative myocardial infarction and higher long‐term mortality rates after lower extremity arterial bypass grafting.J Vasc Surg.1999;29(5):807–812; discussion 12‐13.
- ,,,,,.The influence of perioperative myocardial infarction on long‐term prognosis following elective vascular surgery.Chest.1998;113(3):681–686.
- ,,,,,.Association of perioperative myocardial ischemia with cardiac morbidity and mortality in men undergoing noncardiac surgery. The Study of Perioperative Ischemia Research Group.N Engl J Med.1990;323(26):1781–1788.
- ,,, et al.Perioperative myocardial ischemia in patients undergoing noncardiac surgeryI: Incidence and severity during the 4 day perioperative period. The Study of Perioperative Ischemia (SPI) Research Group.J Am Coll Cardiol.1991;17(4):843–850.
- ,,,,.Perioperative myocardial ischemia in patients undergoing noncardiac surgeryII: Incidence and severity during the 1st week after surgery. The Study of Perioperative Ischemia (SPI) Research Group.J Am Coll Cardiol.1991;17(4):851–857.
- ,,.Association of ambulatory use of statins and beta‐blockers with long‐term mortality after vascular surgery.J Hosp Med.2007;2(4):241–252.
- ,,, et al.Reduction in cardiovascular events after vascular surgery with atorvastatin: a randomized trial.J Vasc Surg.2004;39(5):967–975; discussion 75‐76.
- ,,,.Effect of atenolol on mortality and cardiovascular morbidity after noncardiac surgery. Multicenter Study of Perioperative Ischemia Research Group.N Engl J Med.1996;335(23):1713–1720.
- ,,, et al.Statins are associated with a reduced incidence of perioperative mortality in patients undergoing major noncardiac vascular surgery.Circulation.2003;107(14):1848–1851.
- ,,, et al.The effect of bisoprolol on perioperative mortality and myocardial infarction in high‐risk patients undergoing vascular surgery. Dutch Echocardiographic Cardiac Risk Evaluation Applying Stress Echocardiography Study Group.N Engl J Med.1999;341(24):1789–1794.
- ,,, et al.Prophylactic atenolol reduces postoperative myocardial ischemia. McSPI Research Group.Anesthesiology.1998;88(1):7–17.
- ,,,,,.The effect of preoperative statin therapy on cardiovascular outcomes in patients undergoing infrainguinal vascular surgery.Int J Cardiol.2005;104(3):264–268.
- ,,,,.The effects of perioperative beta‐blockade: results of the Metoprolol after Vascular Surgery (MaVS) study, a randomized controlled trial.Am Heart J.2006;152(5):983–990.
- ,,,,.Perioperative beta‐blockade (POBBLE) for patients undergoing infrarenal vascular surgery: results of a randomized double‐blind controlled trial.J Vasc Surg.2005;41(4):602–609.
- ,,, et al.Effects of extended‐release metoprolol succinate in patients undergoing non‐cardiac surgery (POISE trial): a randomised controlled trial.Lancet.2008;371(9627):1839–1847.
- ,,,,,.Impact of combination evidence‐based medical therapy on mortality in patients with acute coronary syndromes.Circulation.2004;109(6):745–749.
- ,,, et al.Outcomes associated with the use of secondary prevention medications after coronary artery bypass graft surgery.Ann Thorac Surg.2007;83(3):993–1001.
- ,,, et al.Coronary‐artery revascularization before elective major vascular surgery.N Engl J Med.2004;351(27):2795–2804.
- ,,, et al.Derivation and prospective validation of a simple index for prediction of cardiac risk of major noncardiac surgery.Circulation.1999;100(10):1043–1049.
- ,,.Alpha‐2 adrenergic agonists to prevent perioperative cardiovascular complications: a meta‐analysis.Am J Med.2003;114(9):742–752.
- ,,,.Comparison of logistic regression versus propensity score when the number of events is low and there are multiple confounders.Am J Epidemiol.2003;158(3):280–287.
- .Propensity score methods for bias reduction in the comparison of a treatment to a non‐randomized control group.Stat Med.1998;17(19):2265–2281.
- .Aspirin and mortality from coronary bypass surgery.N Engl J Med.2002;347(17):1309–1317.
- ,,,.Systematic review of randomized controlled trials of aspirin and oral anticoagulants in the prevention of graft occlusion and ischemic events after infrainguinal bypass surgery.J Vasc Surg.1999;30(4):701–709.
- ,,, et al.Effect of perioperative beta blockade in patients with diabetes undergoing major non‐cardiac surgery: randomised placebo controlled, blinded multicentre trial.Br Med J (Clin Res Ed).2006;332(7556):1482.
- ,,, et al.ACC/AHA 2007 Guidelines on perioperative cardiovascular evaluation and care for noncardiac surgery: executive summary: a report of the American College of Cardiology/American Heart Association Task Force on Practice Guidelines (Writing Committee to Revise the 2002 Guidelines on Perioperative Cardiovascular Evaluation for Noncardiac Surgery): developed in collaboration with the American Society of Echocardiography, American Society of Nuclear Cardiology, Heart Rhythm Society, Society of Cardiovascular Anesthesiologists, Society for Cardiovascular Angiography and Interventions, Society for Vascular Medicine and Biology, and Society for Vascular Surgery.Circulation.2007;116(17):1971–1996.
- ,,, et al.High‐dose beta‐blockers and tight heart rate control reduce myocardial ischemia and troponin T release in vascular surgery patients.Circulation.2006;114(1 suppl):I344–I349.
- ,,, et al.Should major vascular surgery be delayed because of preoperative cardiac testing in intermediate‐risk patients receiving beta‐blocker therapy with tight heart rate control?J Am Coll Cardiol.2006;48(5):964–969.
- ,,,,,.Effects of an angiotensin‐converting‐enzyme inhibitor, ramipril, on cardiovascular events in high‐risk patients. The Heart Outcomes Prevention Evaluation Study Investigators.N Engl J Med.2000;342(3):145–153.
- ,,,,.The hemodynamic effects of anesthetic induction in vascular surgical patients chronically treated with angiotensin II receptor antagonists.Anesth Analg.1999;89(6):1388–1392.
- ,,,,,.Hemodynamic effects of anesthesia in patients chronically treated with angiotensin‐converting enzyme inhibitors.Anesth Analg.1992;74(6):805–808.
- ,,, et al.Angiotensin system inhibitors in a general surgical population.Anesth Analg.2005;100(3):636–644.
- ,,, et al.Influence of chronic angiotensin‐converting enzyme inhibition on anesthetic induction.Anesthesiology.1994;81(2):299–307.
- ,.Preoperative administration of angiotensin‐converting enzyme inhibitors.Anaesthesist.2007;56(6):557–561.
- ,,, et al.ACC/AHA 2005 Practice guidelines for the management of patients with peripheral arterial disease (lower extremity, renal, mesenteric, and abdominal aortic): executive summarya collaborative report from the American Association for Vascular Surgery/Society for Vascular Surgery, Society for Cardiovascular Angiography and Interventions, Society for Vascular Medicine and Biology, Society of Interventional Radiology, and the ACC/AHA Task Force on Practice Guidelines (Writing committee to develop guidelines for the management of patients with peripheral arterial disease).Circulation.2006;113(11):1474–1547.
- ,,, et al.AHA/ACC guidelines for secondary prevention for patients with coronary and other atherosclerotic vascular disease: 2006 update: endorsed by the National Heart, Lung, and Blood Institute.Circulation.2006;113(19):2363–2372.
- ,,,,,.Preoperative serum albumin level as a predictor of operative mortality and morbidity: results from the National VA Surgical Risk Study.Arch Surg.1999;134(1):36–42.
Vascular surgery is the most morbid of the noncardiac surgeries, with a 30‐day mortality estimated to be 3% to 10% and 6‐month mortality estimated to be 10% to 30%.14 Adverse outcomes are highly correlated with the presence of perioperative ischemia and infarction. Perioperative ischemia is associated with a 9‐fold increase in the odds of unstable angina, nonfatal myocardial infarction, and cardiac death, while a perioperative myocardial infarction increases the odds of death 20‐fold up to 2 years after surgery.57 Prior research has centered on the single or combination use of perioperative beta‐blockers and statins, which has been associated with decreased short‐term and long‐term mortality after vascular surgery,814 with the exceptions of the Metoprolol After Vascular Surgery (MAVS)15 and the Perioperative Beta‐Blockade (POBBLE) studies,16 which were negative beta‐blocker randomized controlled trials exclusively in vascular surgery patients, and the Perioperative Ischemic Evaluation (POISE) study,17 which was the largest perioperative beta‐blocker trial to date in noncardiac surgery, with 41% of the patients undergoing vascular surgery.
There have been few studies assessing clinical outcomes in patients taking multiple concurrent cardioprotective medications. Clinicians are challenged to apply research results to their patients, who generally take multiple drugs. A retrospective cohort study of acute coronary syndrome patients did assess the use of evidence‐based, combination therapies, including aspirin, ACE inhibitors, beta‐blockers, and statins, compared to the use of none of these agents and found an association with decreased 6‐month mortality.18 There are no prior noncardiac surgery studies assessing the concurrent use of multiple possibly cardioprotective drugs. There is 1 cohort study of coronary artery bypass graft surgery patients that assessed aspirin, ACE inhibitor, beta‐blocker, and statin use and found associations with decreased mortality.19 As preoperative coronary revascularization has not been found to produce improved survival after vascular surgery, clarifying which perioperative medicines alone or in combination may improve outcomes becomes even more important.20 We sought to ascertain if the use of concurrent combination aspirin, ACE inhibitors, beta‐blockers, and statins compared to nonuse was associated with a decrease in 6‐month mortality after vascular surgery.
Patients and Methods
Setting and Subjects
All patients presenting for vascular surgery at 5 regional Department of Veterans Affairs (VA) medical centers between January 1998 and March 2005 (3062 patients) were eligible for study entry. Patients with less than 6 months follow‐up were excluded (42 patients). The study included the remaining 3020 patients (comprising 99% of the original population). Our methods have been previously described.8 In brief, we conducted a retrospective cohort study using a regional VA administrative and relational database containing information on both the outpatient and inpatient environments. A record is generated for every contact a patient makes with the VA healthcare system, including prescription medications, laboratory values, demographic information, International Classification of Diseases, 9th Revision (ICD‐9) codes, and vital status. In addition, we used the national VA death index, the VA Beneficiary Identification and Records Locator Subsystem database, which includes Social Security Administration data, to assess vital status. A patient was considered to have a drug exposure (aspirin, ACE inhibitor, beta‐blocker, or statin) if the patient filled or renewed a prescription for the drug within 30 days before surgery. It was determined how many of these drugs were taken during this period, and in which combinations. The Institutional Review Board (IRB) at the Portland VA Medical Center approved the study with a waiver of informed consent.
Data Elements
For every patient we noted the type of vascular surgery (carotid, aortic, lower extremity bypass, or lower extremity amputation), age, sex, comorbid conditions (hypertension, cerebrovascular disease, cancer, diabetes, hyperlipidemia, chronic obstructive pulmonary disease [COPD], chronic kidney disease [CKD], coronary artery disease [CAD], or heart failure), nutritional status (serum albumin), and other medication use (also defined as filling a prescription within 30 days before surgery [insulin and clonidine]). Insulin use was documented to calculate the revised cardiac risk index (RCRI),21 and clonidine was documented to account for as a confounder.22 The RCRI was assigned to each patient. One point was given for each of the following risk factors: use of insulin, CAD, heart failure, cerebrovascular disease, CKD, and high‐risk surgery (intrathoracic, intraperitoneal, or suprainguinal vascular procedures). These variables were defined by ICD‐9 codes. CKD was defined as either an ICD‐9 code for CKD or a serum creatinine >2 mg/dL. Patients were identified by the index vascular surgery using ICD‐9 codes in the VA database, and data were extracted from both the inpatient and outpatient environments.
Statistical Analysis
Patients were included in the analysis if they either died within 6 months or were followed for at least 6 months. Data management and analyses were performed using SAS software, version 9.0. We conducted the univariate analysis of 6‐month mortality using chi‐square analysis and provided unadjusted relative risk estimates for demographic and clinical variables. Demographic variables included age, sex, year, and site of surgery. Clinical variables included preoperative use of insulin and clonidine, preoperative medical conditions, serum albumin, creatinine, RCRI score, and type of surgery.
Bias due to confounding is a problem for studies that cannot randomize subjects into treatment groups. This bias can often be reduced by adjusting for the potentially confounding variables as covariates in regression models. However, when the number of potential confounders is large, as it was in our study, and the number of events, ie, deaths, is small, the resulting regression model can be unstable and the estimates unreliable.23, 24 In such cases, it is necessary to control for confounding using another method. We chose to use propensity scoring and stratification analyses since these methods enable controlling for a large number of covariates using a single variable.
The study drugs were: aspirin, beta‐blockers, statins, and ACE inhibitors. There are 16 combinations with 120 pairwise statistical comparisons possible for these 4 drug exposures. Instead of these multiple comparisons, we chose 4 classifications of combination drug exposure to examine: all 4 drugs compared to none, 3 drugs compared to none, 2 drugs compared to none, and 1 drug compared to none. Four different propensity scores were generated since we studied 4 different drug exposure classes. For each drug exposure class, propensity analyses were performed by using logistic regression to predict the likelihood of use of the drug of interest using all potential demographic and clinical confounding variables. Each subject received a score corresponding to the probability of their having a drug exposure based on the covariates. Scores were divided into quintiles, and these quintiles were used for stratification in Cochran‐Mantel‐Haenszel analyses. Thus, we were able to test the association of patient survival to 6 months with the category of drug exposure comparisons within 30 days before surgery, while controlling for all aforementioned potential confounders. Results of the Breslow‐Day test for homogeneity indicated that no statistically significant differences existed between the results of the propensity quintiles, so the overall summary statistic was reported. All quintiles achieved a balance in the covariates. However, for the 4 study drug exposure class, there were no deaths for the first (n = 173) and second (n = 176) quintiles (corresponding to lower‐risk patients). We therefore excluded these patients from the final analysis.
Variables used in propensity scores included: age, sex, preoperative medical conditions, preoperative clonidine use, nutritional status (serum albumin), RCRI score, and year and location of surgery. To determine whether the propensity score adjustment removed imbalance among the comparisons of the combination drug classes to the no‐drug‐exposure patients, we evaluated associations between each classification of study drug exposure and predictor variables as compared to no‐drug‐exposure patients with both unadjusted chi‐square and propensity‐adjusted Cochran‐Mantel‐Haenszel analyses.
Results
Patient Characteristics
There were 3020 patients with a median age of 67 years, and interquartile range of 59 to 75 years. Ninety‐nine percent were male, and all patients were assessed for death at 6 months after surgery (Table 1). Ten percent (304) had combination all‐4‐drug exposure, 22% (652) had 3‐drug exposure, 24% (736) had 2‐drug exposure, 26% (783) had 1‐drug exposure, and 18% (545) had no study drug exposures. Eight percent (229) of surgeries were aortic, 28% (861) were carotid, 28% (852) were lower extremity amputation, and 36% (1078) were lower extremity bypass. Twenty‐two percent (665) of patients were low risk, with a RCRI of 0, 60% (1822) were moderate risk with a RCRI of 1 to 2, and 18% (553) were high risk with a RCRI of 3. Overall the 6‐month mortality was 9.7% (294). The 6‐month mortality for carotid endarterectomy was 5.0% (43/861), for lower extremity bypass 7.6% (82/1078), for aorta repair 9.2% (21/229), and for lower extremity amputation 17.4% (148/852).
| Variable | Level | N (%) Overall N = 3020 | Relative Risk (95% CI) | Chi Square P‐Value |
|---|---|---|---|---|
| ||||
| Age: year, median (IQR) | 67 (59, 75) | 1.04 (1.031.06) | <0.001* | |
| Sex | Female | 44 (1.5) | 1 | 0.490 |
| Male | 2976 (98.5) | 1.48 (0.464.81) | ||
| Preoperative medical conditions | HTN | 2388 (79.1) | 1.40 (0.011.93) | 0.036 |
| DM | 1455 (48.2) | 1.45 (1.131.84) | 0.003 | |
| COPD | 912 (30.2) | 1.71 (1.342.19) | <0.001 | |
| CA | 674 (22.3) | 1.42 (1.091.86) | 0.012 | |
| CKD | 344 (11.4) | 2.04 (1.492.80) | <0.001 | |
| CAD | 1479 (49.0) | 1.51 (1.181.92) | 0.001 | |
| CHF | 911 (30.2) | 2.41 (1.893.08) | <0.001 | |
| CVA/TIA | 802 (26.6) | 1.08 (0.821.41) | 0.587 | |
| Lipid | 865 (28.6) | 0.81 (0.611.06) | 0.123 | |
| Blood chemistry | Creatinine > 2 | 228 (7.5) | 3.11 (2.224.36) | <0.001 |
| Albumin 3.5 | 629 (20.8) | 3.60 (2.804.62) | <0.001 | |
| Medication use | Aspirin | 1773 (58.7) | 1.12 (0.881.44) | 0.355 |
| ACE, inhibitor | 1238 (41.0) | 0.81 (0.631.04) | 0.090 | |
| Statin | 1214 (40.2) | 0.66 (0.510.86) | 0.001 | |
| Beta blocker | 1202 (39.8) | 0.76 (0.590.98) | 0.031 | |
| Clonidine | 115 (3.8) | 1.65 (0.972.80) | 0.080 | |
| Insulin | 474 (15.7) | 1.47 (1.091.98) | 0.013 | |
| Number of study drugs used | None | 545 (18.0) | 1 | 0.018 |
| One of 4 | 783 (25.9) | 1.06 (0.751.51) | ||
| Two of 4 | 736 (24.4) | 0.94 (0.651.35) | ||
| Three of 4 | 652 (21.6) | 0.73 (0.491.08) | ||
| All four | 304 (10.1) | 0.66 (0.391.09) | ||
| Type of surgery | Carotid | 861 (28.5) | 1 | <0.001 |
| Bypass | 1078 (35.7) | 1.57 (1.072.29) | ||
| Aorta | 229 (7.6) | 1.92 (1.123.31) | ||
| Amputation | 852 (28.2) | 4.00 (2.815.70) | ||
| RCRI category | 0 | 665 (22.0) | 1 | <0.001 |
| 1 | 976 (32.3) | 1.12 (0.761.66) | ||
| 2 | 846 (28.0) | 1.66 (1.142.42) | ||
| 3 | 553 (17.6) | 2.83 (1.934.14) | ||
| Surgery year | 1998 | 539 (17.8) | 1 | 0.804 |
| 1999 | 463 (15.3) | 1.36 (0.892.07) | ||
| 2000 | 418 (13.8) | 1.07 (0.681.68) | ||
| 2001 | 407 (13.5) | 1.23 (0.791.92) | ||
| 2002 | 368 (12.2) | 1.34 (0.962.10) | ||
| 2003 | 371 (12.3) | 1.25 (0.801.97) | ||
| 2004 | 395 (13.1) | 1.17 (0.741.84) | ||
| 2005 | 59 (2.0) | 0.80 (0.282.30) | ||
The most common single‐drug exposure was aspirin, 14% (416), followed by ACE inhibitors, 5% (163) (Table 2). The more common 2‐drug exposures included ACE inhibitors and aspirin, 7% (203), aspirin and beta‐blockers, 5% (161), and aspirin and statins, 5% (141). The common 3‐drug combinations included aspirin, beta‐blockers, and statins, 8% (229); ACE inhibitors, aspirin, and statins, 6% (167); and ACE inhibitors, aspirin, and beta‐blockers, 5% (152). ACE inhibitor exposure was common in all combinations, eg, 20.8% of the 1‐drug group had exposure to an ACE inhibitor, 40.5% in the 2‐drug group, 64.9% in the 3‐drug group, and all patients in the 4‐drug group. Overall, 39.3% of patients in the study had ACE inhibitor exposure. The gross unadjusted mortality for each drug exposure group was 10.6% for the no drug group, 11.2% for the 1‐drug group, 10.1% for the 2‐drug group, 8% for the 3‐drug group, and 7.2% for the 4‐drug group.
| Drugs Used | Presurgery | 6 Months Postsurgery | ||
|---|---|---|---|---|
| Frequency | % | Frequency | % | |
| ||||
| None | 545 | 18.1 | 669 | 24.5 |
| 1 Drug | ||||
| Aspirin | 416 | 53.1 | 169 | 28.3 |
| ACE inhibitor | 163 | 20.8 | 135 | 22.6 |
| Beta‐blocker | 110 | 14.1 | 163 | 27.2 |
| Statin | 94 | 12.0 | 131 | 21.9 |
| All 1 drug | 783 | 100.0 | 598 | 100.0 |
| 2 Drugs | ||||
| Aspirin + ACE inhibitor | 203 | 27.6 | 102 | 14.4 |
| Aspirin + Beta‐blocker | 161 | 21.8 | 117 | 16.5 |
| Aspirin + Statin | 141 | 19.2 | 86 | 12.1 |
| ACE inhibitor + Beta‐blocker | 56 | 7.6 | 103 | 14.5 |
| ACE inhibitor + Statin | 89 | 12.1 | 126 | 17.7 |
| Beta‐blocker + Statin | 86 | 11.7 | 176 | 24.8 |
| All 2 drugs | 36 | 100.0 | 710 | 100.0 |
| 3 Drugs | ||||
| Aspirin + ACE inhibitor + Beta‐blocker | 152 | 23.3 | 96 | 16.5 |
| Aspirin + ACE inhibitor + Statin | 167 | 25.6 | 103 | 17.7 |
| Aspirin + Beta‐ blocker + Statin | 229 | 35.1 | 165 | 28.4 |
| ACE inhibitor + Beta‐blocker Statin | 104 | 16.0 | 218 | 37.4 |
| All 3 drugs | 652 | 100.0 | 582 | 100.0 |
| All 4 drugs | 304 | 10.1 | 167 | 6.1 |
| Total | 3020 | 100.0 | 2726* | 100.0 |
During the 6 complete years of the study (1998‐2004) the frequency of combination exposure for all 4 study drugs increased from 3.5% to 13.4%; 3‐drug exposure also increased, 14.7% to 27.8%; 2‐drug exposure remained relatively stable, 24.5% to 22%; and single‐drug exposure declined, 24.9% to 12.7% (Figure 1). Individual study drug exposures over the 6 years of the study generally also increased with respect to the other combinations: ACE inhibitor use increased, 34.5% to 42.5%; beta‐blocker, 27.8% to 53.4%; statin, 22.6% to 52.2%. The exception was aspirin, which was relatively stable, 54.5% in 1998, and 57.2% in 2004 (Figure 2).
We also compared the use of the study drug exposures at 6 months after surgery to use within 30 days before surgery (Table 2). In the VA healthcare system aspirin is cheaper for some patients to purchase over‐the‐counter. Aspirin is likely underestimated in this dataset. The frequency of follow‐up drug exposure at 6 months was overall similar to the drug exposure within 30 days before surgery. When aspirin was 1 of the combination exposures, the frequencies declined, and when aspirin was not 1 of the exposures, the frequencies generally increased. The frequency of no‐drug exposures increased from 18.1% before surgery to 24.5% 6 months after surgery, and the frequency of all 4 drug exposures decreased from 10.1% to 6.1%, respectively.
Univariate Analysis
There were statistically significant differences in 6‐month mortality for the combination drug exposure classes compared to no‐drug exposure; P value for linear trend = 0.018 (Table 1).
Propensity‐adjusted Analysis
Patients categorized in each combination drug exposure group were significantly different in their demographic and clinical characteristics compared to the no‐drug exposure patients using unadjusted chi‐square P values (Appendix Table 1). However, after the propensity adjustments, only hyperlipidemia was statistically different for the combination 4‐drug exposure patients compared to no‐drug exposure patients (Appendix Table 1). All other demographic and clinical characteristics for the comparison of the drug exposure classes to no‐drug exposure patients had statistically nonsignificant propensity‐adjusted P values. The range of propensity score distribution was fairly comparable for each combination drug exposure group. The Breslow‐Day test for homogeneity was not significant among the quintiles for any of the drug exposure classes (Table 3; Appendix Table 2), indicating that there was not a statistically significant difference in stratum‐specific relative risks between the different quintiles. Therefore, the summary adjusted result was reported for each drug exposure group. Patients with all 4 drug exposures (with the first [n = 173] and second [n = 166] quintiles excluded due to zero deaths) compared to no‐drug exposure patients had a marginally significant association with decreased mortality, overall propensity‐adjusted relative risk (aRR) 0.52 (95% confidence interval [CI], 0.26‐1.01; P = 0.052), number needed to treat (NNT) 19; patients with the combination 3‐drug exposure had a significant association with decreased mortality, aRR 0.60 (95% CI, 0.38‐0.95; P = 0.030), NNT 38; as well as patients with combination 2‐drug exposure, aRR 0.68 (95% CI, 0.46‐0.99; P = 0.043), NNT 170 (Table 3). Patients with 1 drug exposure did not have an association with decreased mortality compared to no‐drug exposure patients, aRR 0.88 (95% CI, 0.63‐1.22; P = 0.445).
| Variable | N (Overall N = 3020) | 6 Mo. Mortality | P Value* | Adjusted Relative Risk (95% CI) of Death* | NNT | |||
|---|---|---|---|---|---|---|---|---|
| Nonuser | User | |||||||
| % | (n/N) | % | (n/N) | |||||
| ||||||||
| 1 Drug vs. no drugs | 1328 | 10.64 | (58/545) | 11.24 | (88/783) | 0.445 | 0.88 (0.631.22) | |
| 2 Drugs vs. no drugs | 1281 | 10.64 | (58/545) | 10.05 | (74/736) | 0.043 | 0.68 (0.460.99) | 170 |
| 3 Drugs vs. no drugs | 1197 | 10.64 | (58/545) | 7.98 | (52/652) | 0.030 | 0.60 (0.380.95) | 38 |
| 4 Drugs vs. no drugs | 510 | 12.56 | (26/207) | 7.26 | (22/303) | 0.052 | 0.52 (0.261.01) | 19 |
Discussion
This retrospective cohort study has demonstrated that the combination use of 4 drugs (aspirin, beta‐blockers, statins, and ACE inhibitors) compared to the use of none of these drugs had a trend toward decreased mortality, with a 49% decrease in propensity‐adjusted 6‐month mortality after vascular surgery and an NNT of 19. In addition, the combination use of 3 drug exposures was significantly associated with a 40% decrease in mortality, with propensity adjustment and NNT of 38; and the 2‐drug combination exposure showed a significant association, with a propensity‐adjusted 32% decreased mortality, and an NNT of 170. Both the unadjusted and adjusted analyses showed a linear trend, suggesting a dose‐response effect of more study‐drug exposure association with less 6‐month mortality and smaller NNT.
The lack of statistical significance for the 4‐drug exposure group is likely due to few patients and events in this group, and the exclusion of the first 2 quintiles (n = 339) due to having zero deaths with which to compare. It is not unusual to exclude patients from analyses in propensity methods. The patients we excluded were low‐risk who had survived to 6‐months after surgery, so they would have also been excluded in a propensity‐matched analysis. We did not perform propensity matching, as we had adequate homogeneity between our quintile strata, and were not powered to perform matching.
This is the first evidence of which we are aware of an association with decreased mortality for the combination perioperative use of aspirin, beta‐blockers, statins, and ACE inhibitors in vascular surgery patients. Aspirin has been associated with decreased mortality in patients undergoing coronary artery bypass graft surgery,25 but the effects of aspirin on noncardiac surgery outcomes is less clear.26
Beta‐blockers and statins have been associated with decreased short‐term and long‐term mortality after vascular surgery in the past,814 but more recent beta‐blocker studies have been negative, introducing controversy for the topic.1517, 27 Beta‐blockers are currently recommended as: Class I (should be used), Evidence Level B (limited population risk strata evaluated) for vascular surgery patients already taking a beta‐blocker or with positive ischemia on stress testing; Class IIa (reasonable to use), Evidence Level B for 1 or more clinical risk factors; or Class IIb (may be considered), Evidence Level B for no clinical risk factors, in the 2007 American College of Cardiology/American Heart Association (ACC/AHA) guidelines for perioperative evaluation.28 Perioperative beta‐blocker trials that have titrated the dose to a goal heart rate have consistently been associated with improved outcomes after vascular surgery,10, 12, 29, 30 and perioperative beta‐blocker trials that have used fixed dosing after surgery have been negative,1517, 27 including the POISE trial, which was associated with increased strokes and mortality.
This is also the first evidence of which we are aware that ACE inhibitors in combination with other drugs may be associated with decreased mortality after vascular surgery. While our study design does not support a causal relationship between ACE inhibitor exposure and decreased mortality, the increasing exposure in each drug exposure group for ACE inhibitors and correlated decreasing mortality is of sufficient interest to warrant further study. The use of ACE inhibitors has been associated with decreased mortality in patients with atherosclerotic vascular disease and CAD.31 There has been a concern expressed in the literature about the perioperative use of ACE inhibitors due to the potential for intraoperative hypotension.3236 Many centers advise patients to discontinue ACE inhibitor use the day before surgery. The number of patients studied remains small. More research is needed to clarify this issue. Use of angiotensin‐receptor blockers was not assessed; their use was considered to be rare, because use was restricted to patients intolerant of ACE inhibitors during the study period.
The 2005 ACC/AHA guideline for patients with peripheral arterial disease recommends the use of aspirin and statins.37 ACE inhibitors are recommended for both asymptomatic and symptomatic peripheral artery disease patients. The 2006 ACC/AHA guidelines for secondary prevention for patients with coronary or other atherosclerotic vascular disease recommends the use of chronic beta‐blockers.38 There appears to be some benefit in mortality from the combination aspirin, beta‐blocker, statin, and ACE inhibitor drug regimen in patients with established atherosclerotic vascular disease.
We expect the frequency of aspirin exposure to be underestimated in this study population (due to over‐the‐counter undocumented use), so our findings may be somewhat underestimated as well. This may also explain why the frequency of aspirin remained constant over time while the other drug exposures increased over time.
Our study has several limitations. First, our design was a retrospective cohort. Propensity analysis attempts to correct for confounding by indication in nonrandomized studies as patients that are exposed to a study drug are different from patients that are not exposed to the same study drug. For example, without adjustment for the propensity scores, the drug exposure classes were significantly associated with demographic and clinical characteristics when compare to the no‐drug‐exposure patients. However, with the propensity score adjustment, these associations were no longer statistically significant, with the exception of hyperlipidemia in patients taking all 4 drugs, which supports a rigorous propensity adjustment. We also controlled for the use of clonidine and serum albumin, both strong predictors of death after noncardiac surgery.22, 39 Second, we utilized administrative ICD‐9 code data for abstraction, and utilized only documented and coded comorbidities in the VA database. Unmeasured confounders may exist. Further, we cannot identify which combinations of specific study drugs were most associated with a reduction in 6‐month mortality, but we believe our data supports the case that all 4 of the study drugs be considered for each patient undergoing vascular surgery. It is important to also note that patient baseline risk, which can be difficult to clarify in retrospective cohort studies, will have a large impact on the results of the NNT. Lastly, this study needs to be repeated in a population that includes a greater number of female participants.
The combination exposure of 2 to 3 study drugs: aspirin, beta‐blockers, statins, and ACE inhibitors was consistently associated with decreased 6‐month mortality after vascular surgery, with a high prevalence of ACE inhibitor use, and the combination exposure of all 4 study drugs was marginally associated with decreased mortality. Consideration for the individual patient undergoing vascular surgery should include whether or not the patient may benefit from these 4 drugs. Further research with prospective and randomized studies is needed to clarify the optimum timing of these drugs and their combination efficacy in vascular surgery patients with attention to patient‐specific risk.
Acknowledgements
The authors thank Martha S. Gerrity, MD, PhD, Portland VA Medical Center, Portland, Oregon, for comments on an earlier version of the manuscript.
- ,,, et al.Postoperative and late survival outcomes after major amputation: findings from the Department of Veterans Affairs National Surgical Quality Improvement Program.Surgery.2001;130(1):21–29.
- ,,,.Perioperative‐ and long‐term mortality rates after major vascular surgery: the relationship to preoperative testing in the Medicare population.Anesth Analg.1999;89(4):849–855.
- ,,, et al.Women have increased risk of perioperative myocardial infarction and higher long‐term mortality rates after lower extremity arterial bypass grafting.J Vasc Surg.1999;29(5):807–812; discussion 12‐13.
- ,,,,,.The influence of perioperative myocardial infarction on long‐term prognosis following elective vascular surgery.Chest.1998;113(3):681–686.
- ,,,,,.Association of perioperative myocardial ischemia with cardiac morbidity and mortality in men undergoing noncardiac surgery. The Study of Perioperative Ischemia Research Group.N Engl J Med.1990;323(26):1781–1788.
- ,,, et al.Perioperative myocardial ischemia in patients undergoing noncardiac surgeryI: Incidence and severity during the 4 day perioperative period. The Study of Perioperative Ischemia (SPI) Research Group.J Am Coll Cardiol.1991;17(4):843–850.
- ,,,,.Perioperative myocardial ischemia in patients undergoing noncardiac surgeryII: Incidence and severity during the 1st week after surgery. The Study of Perioperative Ischemia (SPI) Research Group.J Am Coll Cardiol.1991;17(4):851–857.
- ,,.Association of ambulatory use of statins and beta‐blockers with long‐term mortality after vascular surgery.J Hosp Med.2007;2(4):241–252.
- ,,, et al.Reduction in cardiovascular events after vascular surgery with atorvastatin: a randomized trial.J Vasc Surg.2004;39(5):967–975; discussion 75‐76.
- ,,,.Effect of atenolol on mortality and cardiovascular morbidity after noncardiac surgery. Multicenter Study of Perioperative Ischemia Research Group.N Engl J Med.1996;335(23):1713–1720.
- ,,, et al.Statins are associated with a reduced incidence of perioperative mortality in patients undergoing major noncardiac vascular surgery.Circulation.2003;107(14):1848–1851.
- ,,, et al.The effect of bisoprolol on perioperative mortality and myocardial infarction in high‐risk patients undergoing vascular surgery. Dutch Echocardiographic Cardiac Risk Evaluation Applying Stress Echocardiography Study Group.N Engl J Med.1999;341(24):1789–1794.
- ,,, et al.Prophylactic atenolol reduces postoperative myocardial ischemia. McSPI Research Group.Anesthesiology.1998;88(1):7–17.
- ,,,,,.The effect of preoperative statin therapy on cardiovascular outcomes in patients undergoing infrainguinal vascular surgery.Int J Cardiol.2005;104(3):264–268.
- ,,,,.The effects of perioperative beta‐blockade: results of the Metoprolol after Vascular Surgery (MaVS) study, a randomized controlled trial.Am Heart J.2006;152(5):983–990.
- ,,,,.Perioperative beta‐blockade (POBBLE) for patients undergoing infrarenal vascular surgery: results of a randomized double‐blind controlled trial.J Vasc Surg.2005;41(4):602–609.
- ,,, et al.Effects of extended‐release metoprolol succinate in patients undergoing non‐cardiac surgery (POISE trial): a randomised controlled trial.Lancet.2008;371(9627):1839–1847.
- ,,,,,.Impact of combination evidence‐based medical therapy on mortality in patients with acute coronary syndromes.Circulation.2004;109(6):745–749.
- ,,, et al.Outcomes associated with the use of secondary prevention medications after coronary artery bypass graft surgery.Ann Thorac Surg.2007;83(3):993–1001.
- ,,, et al.Coronary‐artery revascularization before elective major vascular surgery.N Engl J Med.2004;351(27):2795–2804.
- ,,, et al.Derivation and prospective validation of a simple index for prediction of cardiac risk of major noncardiac surgery.Circulation.1999;100(10):1043–1049.
- ,,.Alpha‐2 adrenergic agonists to prevent perioperative cardiovascular complications: a meta‐analysis.Am J Med.2003;114(9):742–752.
- ,,,.Comparison of logistic regression versus propensity score when the number of events is low and there are multiple confounders.Am J Epidemiol.2003;158(3):280–287.
- .Propensity score methods for bias reduction in the comparison of a treatment to a non‐randomized control group.Stat Med.1998;17(19):2265–2281.
- .Aspirin and mortality from coronary bypass surgery.N Engl J Med.2002;347(17):1309–1317.
- ,,,.Systematic review of randomized controlled trials of aspirin and oral anticoagulants in the prevention of graft occlusion and ischemic events after infrainguinal bypass surgery.J Vasc Surg.1999;30(4):701–709.
- ,,, et al.Effect of perioperative beta blockade in patients with diabetes undergoing major non‐cardiac surgery: randomised placebo controlled, blinded multicentre trial.Br Med J (Clin Res Ed).2006;332(7556):1482.
- ,,, et al.ACC/AHA 2007 Guidelines on perioperative cardiovascular evaluation and care for noncardiac surgery: executive summary: a report of the American College of Cardiology/American Heart Association Task Force on Practice Guidelines (Writing Committee to Revise the 2002 Guidelines on Perioperative Cardiovascular Evaluation for Noncardiac Surgery): developed in collaboration with the American Society of Echocardiography, American Society of Nuclear Cardiology, Heart Rhythm Society, Society of Cardiovascular Anesthesiologists, Society for Cardiovascular Angiography and Interventions, Society for Vascular Medicine and Biology, and Society for Vascular Surgery.Circulation.2007;116(17):1971–1996.
- ,,, et al.High‐dose beta‐blockers and tight heart rate control reduce myocardial ischemia and troponin T release in vascular surgery patients.Circulation.2006;114(1 suppl):I344–I349.
- ,,, et al.Should major vascular surgery be delayed because of preoperative cardiac testing in intermediate‐risk patients receiving beta‐blocker therapy with tight heart rate control?J Am Coll Cardiol.2006;48(5):964–969.
- ,,,,,.Effects of an angiotensin‐converting‐enzyme inhibitor, ramipril, on cardiovascular events in high‐risk patients. The Heart Outcomes Prevention Evaluation Study Investigators.N Engl J Med.2000;342(3):145–153.
- ,,,,.The hemodynamic effects of anesthetic induction in vascular surgical patients chronically treated with angiotensin II receptor antagonists.Anesth Analg.1999;89(6):1388–1392.
- ,,,,,.Hemodynamic effects of anesthesia in patients chronically treated with angiotensin‐converting enzyme inhibitors.Anesth Analg.1992;74(6):805–808.
- ,,, et al.Angiotensin system inhibitors in a general surgical population.Anesth Analg.2005;100(3):636–644.
- ,,, et al.Influence of chronic angiotensin‐converting enzyme inhibition on anesthetic induction.Anesthesiology.1994;81(2):299–307.
- ,.Preoperative administration of angiotensin‐converting enzyme inhibitors.Anaesthesist.2007;56(6):557–561.
- ,,, et al.ACC/AHA 2005 Practice guidelines for the management of patients with peripheral arterial disease (lower extremity, renal, mesenteric, and abdominal aortic): executive summarya collaborative report from the American Association for Vascular Surgery/Society for Vascular Surgery, Society for Cardiovascular Angiography and Interventions, Society for Vascular Medicine and Biology, Society of Interventional Radiology, and the ACC/AHA Task Force on Practice Guidelines (Writing committee to develop guidelines for the management of patients with peripheral arterial disease).Circulation.2006;113(11):1474–1547.
- ,,, et al.AHA/ACC guidelines for secondary prevention for patients with coronary and other atherosclerotic vascular disease: 2006 update: endorsed by the National Heart, Lung, and Blood Institute.Circulation.2006;113(19):2363–2372.
- ,,,,,.Preoperative serum albumin level as a predictor of operative mortality and morbidity: results from the National VA Surgical Risk Study.Arch Surg.1999;134(1):36–42.
Copyright © 2010 Society of Hospital Medicine
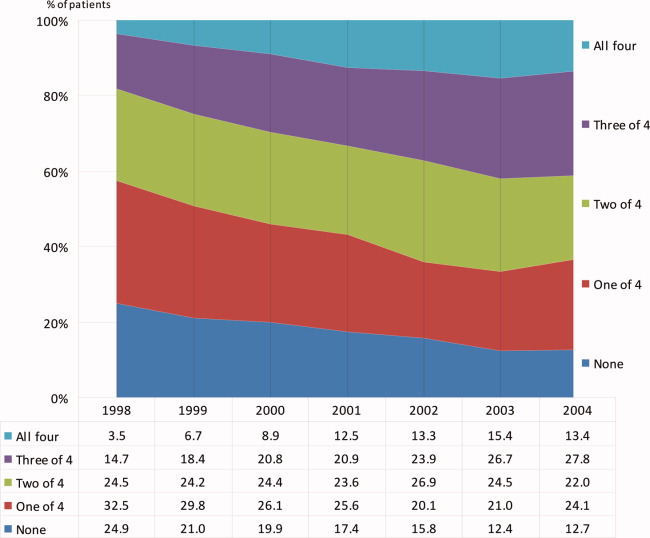
Sigmoid Volvulus
A 63‐year‐old man with multiple medical problems was transferred from a nursing home to the emergency room with progressively worsening diffuse abdominal pain of 3 days' duration. His vital signs were significant for heart rate of 94 beats per minute, blood pressure of 126/84 mmHg, respiratory rate of 20 breaths per minute, and oxygen saturation of 98% on room air. Abdominal examination showed diffuse tenderness in all quadrants. Active bowel sounds were heard; guarding or rigidity was absent. Examination of respiratory and cardiovascular system was unremarkable. His laboratory tests showed leukocytosis with left shift. Topogram done for planning computed tomography (CT) scan of abdomen (Figure 1) showed the following findings:
-
The dilated sigmoid loops (outlined by linear black arrows) have closely apposed medial walls (arrowheads), giving the appearance of a coffee bean. In addition, the apex of the loop is seen under the left hemidiaphragm.
-
The dilated sigmoid loop is seen to overlap the descending colon (the left flank overlap sign). The lateral margin of descending colon is shown with bold white arrows.
-
The level of convergence of the 2 limbs of the loop is seen to lie below the lumbosacral junction and to the left of the midline (inferior convergence sign, shown by the bold black arrow).
-
The small bowel and large bowel loops are dilated due to distal obstruction and are seen overlapping with the distended sigmoid colon.
-
The rectal gas is not visualized.

These features were suggestive of sigmoid volvulus.
Patients with sigmoid volvulus are often in the sixth to eighth decades of life and frequently have concomitant chronic illnesses, such as cardiac, pulmonary, and renal disease, that significantly influence their outcome.14 Males develop sigmoid volvulus more commonly than do females. In a large series of patients with sigmoid volvulus, 30% had a history of psychiatric disease and 13% were institutionalized at the time of diagnosis.4 Abdominal tenderness is present in less than one‐third of patients with volvulus, and severe pain or signs of peritonitis suggest impending or actual colonic necrosis and perforation.
Plain radiograph of the abdomen is usually diagnostic and reveals a dilated ahaustral sigmoid colon with features of closed‐loop obstruction (bent inner‐tube appearance). The apex of the loop usually extends above the T10 vertebra. The various signs described for sigmoid volvulus on plain radiograph and the sensitivity and specificity for these are given in Table 1.5 A diagnosis of sigmoid volvulus can be made with abdominal radiographs alone in as many as 85% of instances.3 A CT scan helps detect the changes of bowel ischemia and can confirm or provide an alternate diagnosis. A single contrast barium enema examination may be done if signs of bowel ischemia or perforation are absent. This may reveal a mucosal spiral pattern or bird's beak appearance (due to abrupt termination of the barium column) at the site of twist.
| Sign | Sensitivity (%) | Specificity (%) |
|---|---|---|
| Distended ahaustral loop | 94 | 20 |
| Apex under left hemidiaphragm | 88 | 100 |
| Apex of loop above T10 vertebra | 71 | 80 |
| Inferior convergence on the left | 53 | 100 |
| Fulcrum below lumbosacral angle | 65 | 80 |
| Approximation of the medial walls of the sigmoid loop | 88 | 80 |
| Left flank overlap sign | 59 | 100 |
In patients with abdominal films most consistent with a sigmoid volvulus, initial rigid or flexible proctosigmoidoscopy may allow prompt decompression of the volvulus. Early recognition and treatment are necessary to prevent mortality. Placement of a rectal tube for 48 hours may minimize the possibility of early recurrence. Successful reduction of sigmoid volvulus also has been reported with colonoscopy; however, the procedure must be performed carefully with minimal insufflation of air (or preferably carbon dioxide) to minimize the risk of perforation of the distended, inflamed bowel. Endoscopic reduction of sigmoid volvulus alone is associated with a recurrence rate of 25% to 50%.1, 2, 6, 7 Hence, elective sigmoid resection and coloproctostomy, or in medically compromised patients, end colostomy, should follow proctoscopic decompression and mechanical preparation of the bowel. Recurrence rates with this approach are 3% to 6%.1, 2, 7 Patients requiring emergent laparotomy for strangulated sigmoid volvulus require sigmoid resection with end colostomy and a Hartmann pouch. The patient's volvulus was successfully decompressed with colonoscopy. He was offered elective sigmoid resection and coloproctostomy as a definitive therapy, which he declined.
- ,,, et al.Sigmoid volvulus in Department of Veterans Affairs Medical Centers.Dis Colon Rectum.2000;43:414–418.
- .Review of sigmoid volvulus: history and results of treatment.Dis Colon Rectum.1982;25:494–501.
- ,,, et al.Volvulus of the colon: incidence and mortality.Ann Surg.1985;202:83–92.
- .Review of sigmoid volvulus: clinical patterns and pathogenesis.Dis Colon Rectum.1982;25:823–830.
- ,,,.Significant plain film findings in sigmoid volvulus.Clin Radiol.1994;49:317–319.
- ,.Volvulus of the sigmoid colon.Ann Surg.1973;177:527–537.
- ,,.Endoscopy in colonic volvulus.Ann Surg.1987;206:1–7.
A 63‐year‐old man with multiple medical problems was transferred from a nursing home to the emergency room with progressively worsening diffuse abdominal pain of 3 days' duration. His vital signs were significant for heart rate of 94 beats per minute, blood pressure of 126/84 mmHg, respiratory rate of 20 breaths per minute, and oxygen saturation of 98% on room air. Abdominal examination showed diffuse tenderness in all quadrants. Active bowel sounds were heard; guarding or rigidity was absent. Examination of respiratory and cardiovascular system was unremarkable. His laboratory tests showed leukocytosis with left shift. Topogram done for planning computed tomography (CT) scan of abdomen (Figure 1) showed the following findings:
-
The dilated sigmoid loops (outlined by linear black arrows) have closely apposed medial walls (arrowheads), giving the appearance of a coffee bean. In addition, the apex of the loop is seen under the left hemidiaphragm.
-
The dilated sigmoid loop is seen to overlap the descending colon (the left flank overlap sign). The lateral margin of descending colon is shown with bold white arrows.
-
The level of convergence of the 2 limbs of the loop is seen to lie below the lumbosacral junction and to the left of the midline (inferior convergence sign, shown by the bold black arrow).
-
The small bowel and large bowel loops are dilated due to distal obstruction and are seen overlapping with the distended sigmoid colon.
-
The rectal gas is not visualized.
These features were suggestive of sigmoid volvulus.
Patients with sigmoid volvulus are often in the sixth to eighth decades of life and frequently have concomitant chronic illnesses, such as cardiac, pulmonary, and renal disease, that significantly influence their outcome.14 Males develop sigmoid volvulus more commonly than do females. In a large series of patients with sigmoid volvulus, 30% had a history of psychiatric disease and 13% were institutionalized at the time of diagnosis.4 Abdominal tenderness is present in less than one‐third of patients with volvulus, and severe pain or signs of peritonitis suggest impending or actual colonic necrosis and perforation.
Plain radiograph of the abdomen is usually diagnostic and reveals a dilated ahaustral sigmoid colon with features of closed‐loop obstruction (bent inner‐tube appearance). The apex of the loop usually extends above the T10 vertebra. The various signs described for sigmoid volvulus on plain radiograph and the sensitivity and specificity for these are given in Table 1.5 A diagnosis of sigmoid volvulus can be made with abdominal radiographs alone in as many as 85% of instances.3 A CT scan helps detect the changes of bowel ischemia and can confirm or provide an alternate diagnosis. A single contrast barium enema examination may be done if signs of bowel ischemia or perforation are absent. This may reveal a mucosal spiral pattern or bird's beak appearance (due to abrupt termination of the barium column) at the site of twist.
| Sign | Sensitivity (%) | Specificity (%) |
|---|---|---|
| Distended ahaustral loop | 94 | 20 |
| Apex under left hemidiaphragm | 88 | 100 |
| Apex of loop above T10 vertebra | 71 | 80 |
| Inferior convergence on the left | 53 | 100 |
| Fulcrum below lumbosacral angle | 65 | 80 |
| Approximation of the medial walls of the sigmoid loop | 88 | 80 |
| Left flank overlap sign | 59 | 100 |
In patients with abdominal films most consistent with a sigmoid volvulus, initial rigid or flexible proctosigmoidoscopy may allow prompt decompression of the volvulus. Early recognition and treatment are necessary to prevent mortality. Placement of a rectal tube for 48 hours may minimize the possibility of early recurrence. Successful reduction of sigmoid volvulus also has been reported with colonoscopy; however, the procedure must be performed carefully with minimal insufflation of air (or preferably carbon dioxide) to minimize the risk of perforation of the distended, inflamed bowel. Endoscopic reduction of sigmoid volvulus alone is associated with a recurrence rate of 25% to 50%.1, 2, 6, 7 Hence, elective sigmoid resection and coloproctostomy, or in medically compromised patients, end colostomy, should follow proctoscopic decompression and mechanical preparation of the bowel. Recurrence rates with this approach are 3% to 6%.1, 2, 7 Patients requiring emergent laparotomy for strangulated sigmoid volvulus require sigmoid resection with end colostomy and a Hartmann pouch. The patient's volvulus was successfully decompressed with colonoscopy. He was offered elective sigmoid resection and coloproctostomy as a definitive therapy, which he declined.
- ,,, et al.Sigmoid volvulus in Department of Veterans Affairs Medical Centers.Dis Colon Rectum.2000;43:414–418.
- .Review of sigmoid volvulus: history and results of treatment.Dis Colon Rectum.1982;25:494–501.
- ,,, et al.Volvulus of the colon: incidence and mortality.Ann Surg.1985;202:83–92.
- .Review of sigmoid volvulus: clinical patterns and pathogenesis.Dis Colon Rectum.1982;25:823–830.
- ,,,.Significant plain film findings in sigmoid volvulus.Clin Radiol.1994;49:317–319.
- ,.Volvulus of the sigmoid colon.Ann Surg.1973;177:527–537.
- ,,.Endoscopy in colonic volvulus.Ann Surg.1987;206:1–7.
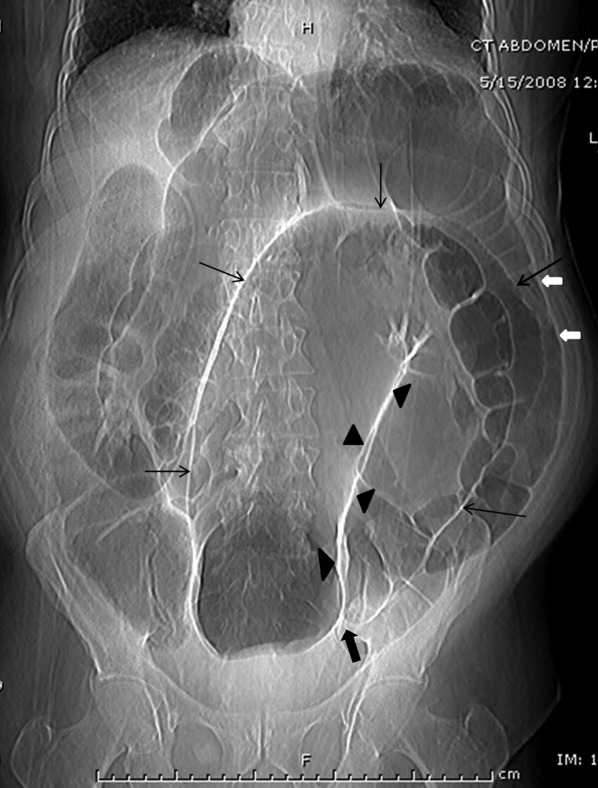
More Than a Plantar Wart
A 56‐year‐old man with a 1‐year history of a verrucous nodule on his left foot presented to our department due to the unexpected growth. He was previously diagnosed with a plantar wart so underwent salicylic ointment application, liquid‐nitrogen cryotherapy and electrocoagulation, with no improvement of the condition.
Clinical examination revealed a 22‐mm flesh‐colored, centrally hypopigmented and ulcerated, exophytic nodule, with an adjacent 5 4 mm pink papule with telangiectasia (Figure 1A and B).

Histological examination established the diagnosis of ulcerated amelanotic malignant melanoma (Clark's level IV, Breslow's thickness of 3 mm) with a satellite nodule. Radical inguinal lymph node dissection yielded a negative result. Total‐body computed tomographic scan was unremarkable. One‐year follow‐up revealed no metastatic disease.
Melanoma of the foot accounts for 3% to 15% of all cutaneous melanoma. In acral skin, melanomas tend to have unusual clinical appearances. Amelanotic variants may masquerade as several benign hyperkeratotic dermatoses (warts, calluses, fungal disorders, foreign bodies, moles, keratoacanthomas, hematomas) increasing misdiagnosis and inadequate treatment rates, with a poorer patient outcome.1 Pedal lesions require close observation and biopsy when diagnostic uncertainty exists or when therapeutic interventions fail.
- ,,,,,.Acral lentiginous melanoma mimicking benign disease: the Emory experience.J Am Acad Dermatol.2003;48:183–188.
A 56‐year‐old man with a 1‐year history of a verrucous nodule on his left foot presented to our department due to the unexpected growth. He was previously diagnosed with a plantar wart so underwent salicylic ointment application, liquid‐nitrogen cryotherapy and electrocoagulation, with no improvement of the condition.
Clinical examination revealed a 22‐mm flesh‐colored, centrally hypopigmented and ulcerated, exophytic nodule, with an adjacent 5 4 mm pink papule with telangiectasia (Figure 1A and B).
Histological examination established the diagnosis of ulcerated amelanotic malignant melanoma (Clark's level IV, Breslow's thickness of 3 mm) with a satellite nodule. Radical inguinal lymph node dissection yielded a negative result. Total‐body computed tomographic scan was unremarkable. One‐year follow‐up revealed no metastatic disease.
Melanoma of the foot accounts for 3% to 15% of all cutaneous melanoma. In acral skin, melanomas tend to have unusual clinical appearances. Amelanotic variants may masquerade as several benign hyperkeratotic dermatoses (warts, calluses, fungal disorders, foreign bodies, moles, keratoacanthomas, hematomas) increasing misdiagnosis and inadequate treatment rates, with a poorer patient outcome.1 Pedal lesions require close observation and biopsy when diagnostic uncertainty exists or when therapeutic interventions fail.
- ,,,,,.Acral lentiginous melanoma mimicking benign disease: the Emory experience.J Am Acad Dermatol.2003;48:183–188.
- ,,,,,.Acral lentiginous melanoma mimicking benign disease: the Emory experience.J Am Acad Dermatol.2003;48:183–188.
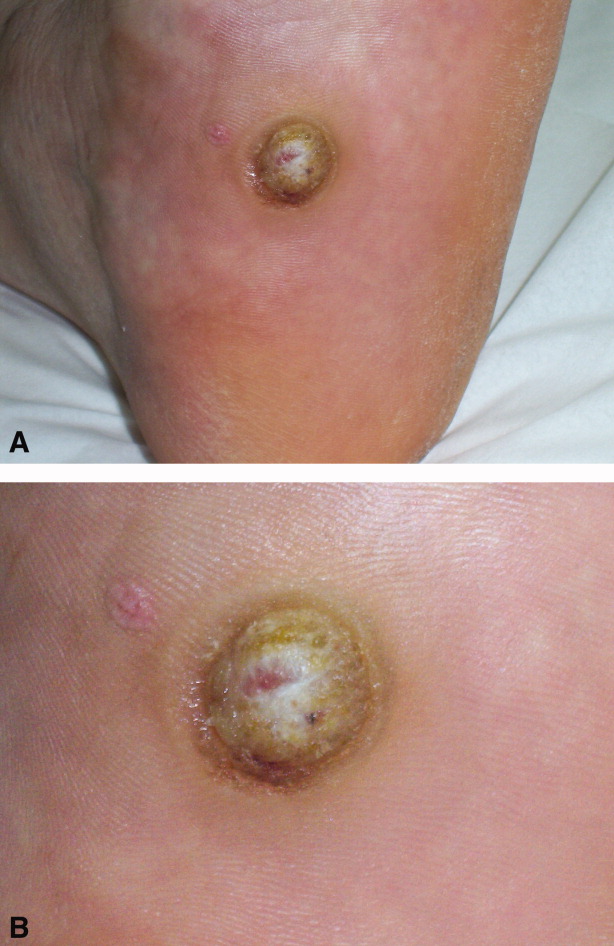
Pneumothorax in a Patient With COPD
A 53‐year‐old man with a history of heavy tobacco use presented with shortness of breath. Eight days prior to his presentation he was diagnosed with multiple rib fractures after suffering an assault. Since then he had developed dyspnea and a nonproductive cough. A chest x‐ray revealed a large pneumothorax on the right with approximately 80% volume loss (arrow, Figure 1).
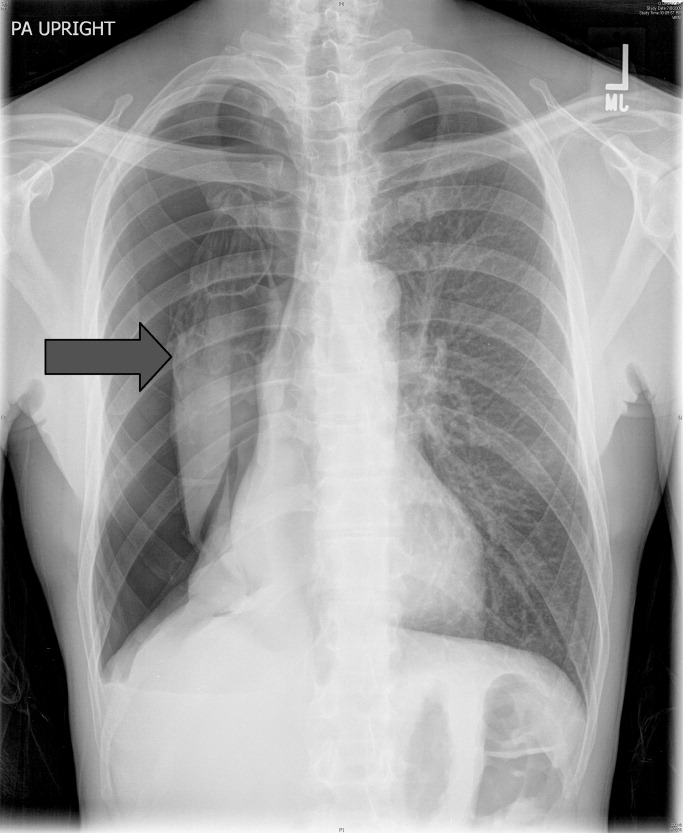
Tube thoracostomy was performed. Repeat chest x‐ray showed that the pneumothorax had resolved, revealing a consolidation likely caused by either reexpansion pulmonary edema1, 2 or, given its location in the superior segment of the right lower lobe, aspiration pneumonia (thin arrow, Figure 2). Also seen in the x‐ray is an old scar (thick arrow, Figure 2) and apical bullous changes with hyperinflated lungs suggestive of chronic obstructive pulmonary disease (COPD).
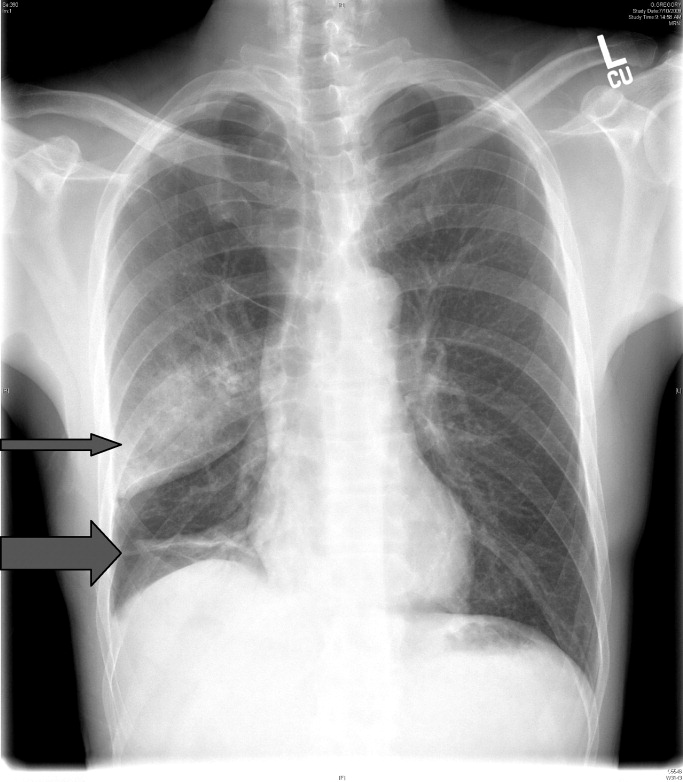
DISCUSSION
Pneumothorax is a common complication of blunt trauma and rib fractures.3 While the patient did not have a preceding diagnosis of COPD, his extensive smoking history and his radiographic changes are consistent with COPD, which is a risk factor for pneumothroax. Secondary pneumothorax is defined as pneumothorax that occurs as a complication of underlying lung disease and is most commonly associated with COPD,4 with rupturing of apical blebs as the proposed mechanism. This patient suffered a pneumothorax due to trauma, but given his COPD he is at increased risk for developing spontaneous pneumothorax in the future.
- .Reexpansion pulmonary edema.Ann Thorac Cardiovasc Surg.2008;14(4):205–209.
- ,.Images in clinical medicine. Reexpansion pulmonary edema after treatment of pneumothorax.N Engl J Med.2006;354(19):2046.
- ,,.Profile of chest trauma in a level I trauma center.J Trauma.2004;57(3):576–581.
- ,,,.Factors related to recurrence of spontaneous pneumothorax.Respirology.2005;10(3):378–384.
A 53‐year‐old man with a history of heavy tobacco use presented with shortness of breath. Eight days prior to his presentation he was diagnosed with multiple rib fractures after suffering an assault. Since then he had developed dyspnea and a nonproductive cough. A chest x‐ray revealed a large pneumothorax on the right with approximately 80% volume loss (arrow, Figure 1).
Tube thoracostomy was performed. Repeat chest x‐ray showed that the pneumothorax had resolved, revealing a consolidation likely caused by either reexpansion pulmonary edema1, 2 or, given its location in the superior segment of the right lower lobe, aspiration pneumonia (thin arrow, Figure 2). Also seen in the x‐ray is an old scar (thick arrow, Figure 2) and apical bullous changes with hyperinflated lungs suggestive of chronic obstructive pulmonary disease (COPD).
DISCUSSION
Pneumothorax is a common complication of blunt trauma and rib fractures.3 While the patient did not have a preceding diagnosis of COPD, his extensive smoking history and his radiographic changes are consistent with COPD, which is a risk factor for pneumothroax. Secondary pneumothorax is defined as pneumothorax that occurs as a complication of underlying lung disease and is most commonly associated with COPD,4 with rupturing of apical blebs as the proposed mechanism. This patient suffered a pneumothorax due to trauma, but given his COPD he is at increased risk for developing spontaneous pneumothorax in the future.
- .Reexpansion pulmonary edema.Ann Thorac Cardiovasc Surg.2008;14(4):205–209.
- ,.Images in clinical medicine. Reexpansion pulmonary edema after treatment of pneumothorax.N Engl J Med.2006;354(19):2046.
- ,,.Profile of chest trauma in a level I trauma center.J Trauma.2004;57(3):576–581.
- ,,,.Factors related to recurrence of spontaneous pneumothorax.Respirology.2005;10(3):378–384.
