User login
Osborn waves: An inverse correlation with core body temperature
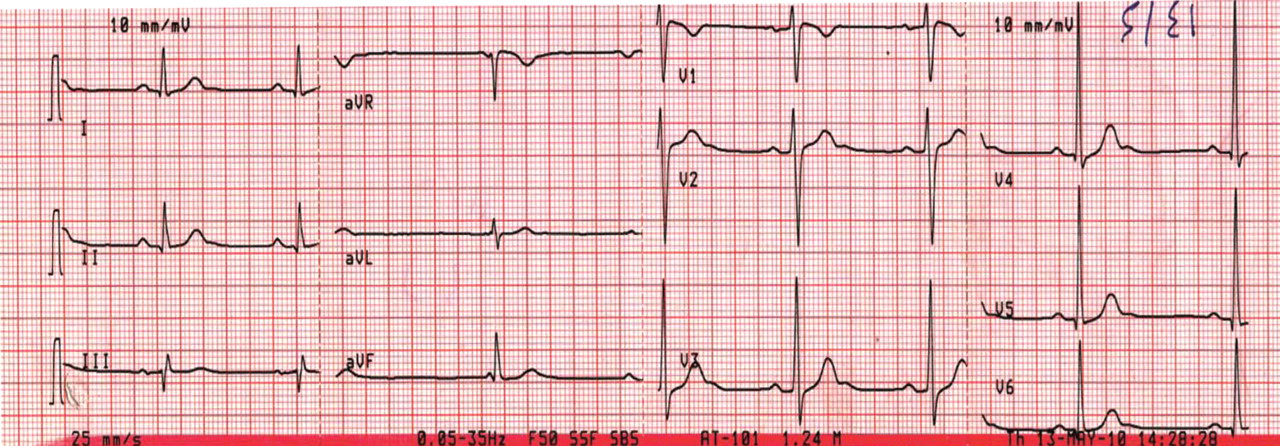
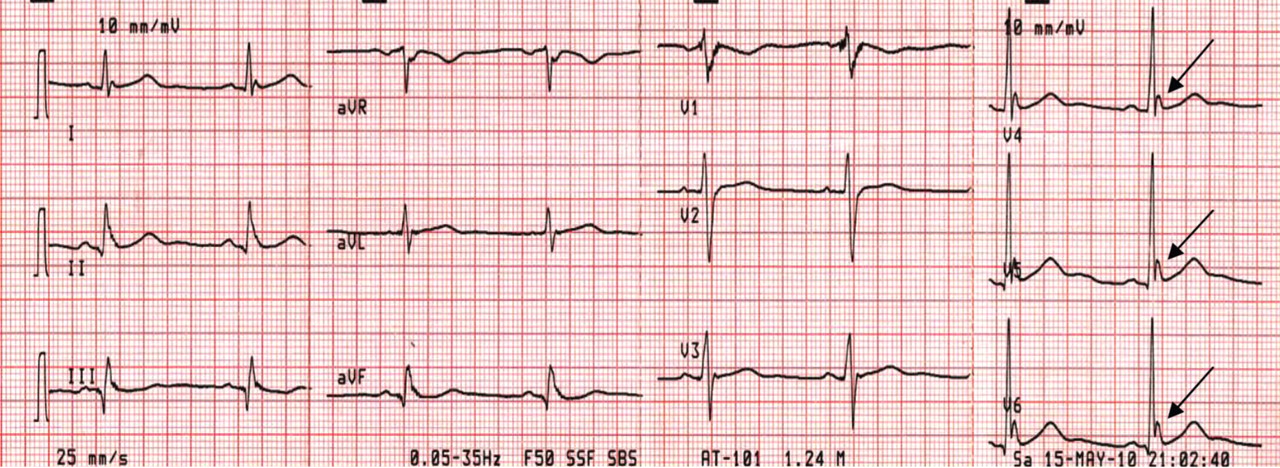
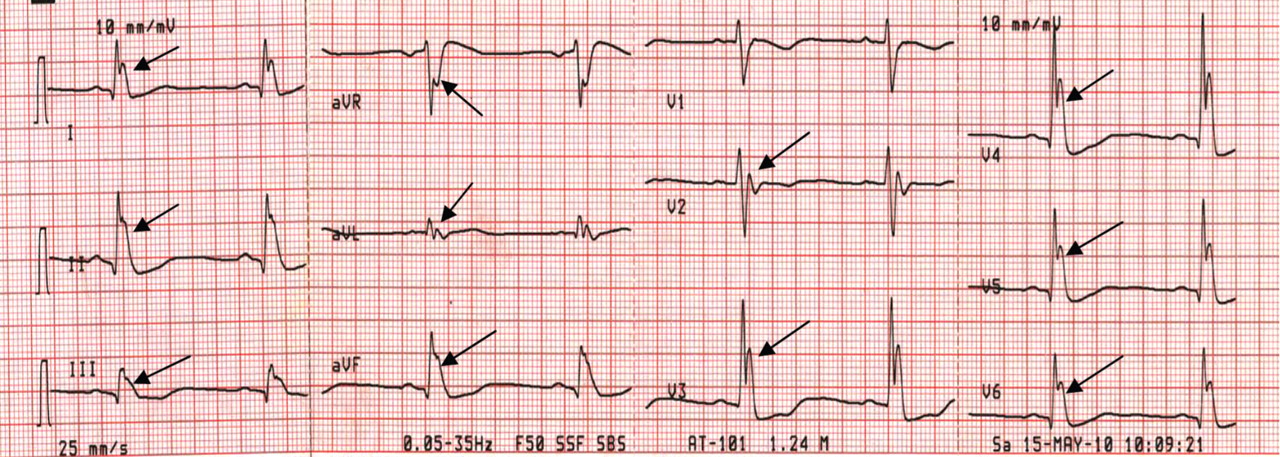
Although Osborn waves are a marker of hypothermia, they also occur in nonhypothermic conditions. Brainstem death is a precursor of the J wave, and this is explained by impaired thermoregulatory ability resulting from hypothalamic dysfunction and subsequent hypothermia.
The three electrocardiograms presented here illustrate several points:
- Classic findings in hypothermia include J waves, sinus bradycardia, prolongation of the PR interval, widening of the QRS complex, and prolongation of the QT interval.
- The lower the core body temperature, the higher the amplitude of the J wave.
- The J wave in brain death (unlike hypothermic causes of the J wave) is not associated with the characteristic signs of shivering in the surface electrocardiogram.
- As hypothermia becomes more profound, the J wave becomes evident in all leads, not only the inferolateral leads.
- Osborn JJ. Experimental hypothermia; respiratory and blood pH changes in relation to cardiac function. Am J Physiol 1953; 175:389–398.
Although Osborn waves are a marker of hypothermia, they also occur in nonhypothermic conditions. Brainstem death is a precursor of the J wave, and this is explained by impaired thermoregulatory ability resulting from hypothalamic dysfunction and subsequent hypothermia.
The three electrocardiograms presented here illustrate several points:
- Classic findings in hypothermia include J waves, sinus bradycardia, prolongation of the PR interval, widening of the QRS complex, and prolongation of the QT interval.
- The lower the core body temperature, the higher the amplitude of the J wave.
- The J wave in brain death (unlike hypothermic causes of the J wave) is not associated with the characteristic signs of shivering in the surface electrocardiogram.
- As hypothermia becomes more profound, the J wave becomes evident in all leads, not only the inferolateral leads.
- Osborn JJ. Experimental hypothermia; respiratory and blood pH changes in relation to cardiac function. Am J Physiol 1953; 175:389–398.
- Osborn JJ. Experimental hypothermia; respiratory and blood pH changes in relation to cardiac function. Am J Physiol 1953; 175:389–398.
An erythematous plaque on the nose
A 38-year-old woman presented with a pruriginous and erythematous lesion on her nose that appeared during periods of cold weather. She said she is completely asymptomatic during the summer months.

Q: What is the most likely diagnosis?
- Lupus pernio
- Rosacea
- Seborrheic dermatitis
- Chilblain lupus erythematosus
- Lupus vulgaris
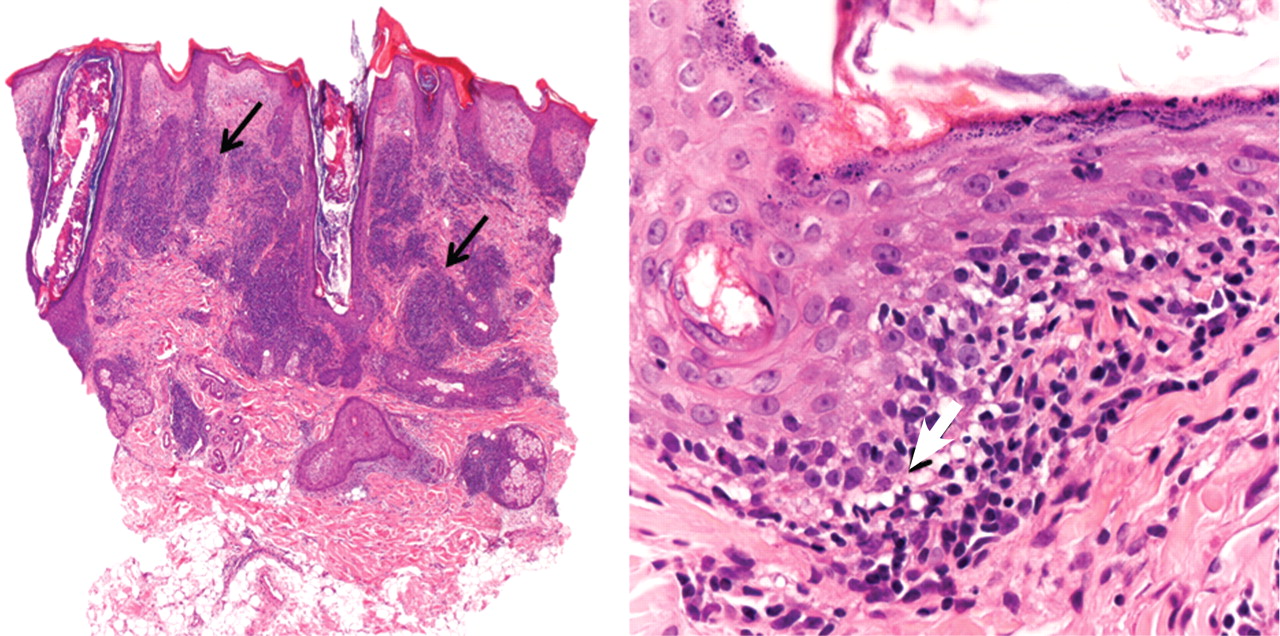
A: The diagnosis is chilblain lupus erythematosus.
The differential diagnosis of an erythematous lesion on the nose of a middle-aged woman also includes rosacea, lupus pernio, lupus vulgaris, and seborrheic dermatitis. Some of these lesions are exacerbated by cold. Usually, the diagnosis is based on clinical findings, but in some cases histologic features on biopsy study confirm the diagnosis.
Lesions of lupus pernio (sarcoidosis) remain unaltered with changes in temperature, and biopsy study usually shows granulomas without caseous necrosis with little inflammatory infiltrate at the periphery.
Rosacea usually gets worse with heat and with alcohol consumption, although it can be exacerbated by cold. Biopsy study shows a nonspecific perivascular and perifollicular lymphohistiocytic infiltrate accompanied occasionally by multinucleated cells.
Seborrheic dermatitis is a papulosquamous disorder characterized by greasy scaling over inflamed skin on the scalp, face, and trunk. Disease activity is increased in winter and spring, with remissions commonly occurring in summer. The histologic features of seborrheic dermatitis are nonspecific; in this case, the histologic features were compatible with chilblain lupus without changes of seborrheic dermatitis.
Lupus vulgaris is a chronic form of cutaneous tuberculosis characterized by redbrown papules with central atrophy. The nose and ears are usually affected. Histologically, granulomatous tubercles with epithelioid cells and caseation necrosis are usually found.
CHILBLAIN LUPUS ERYTHEMATOSUS
Pernio, or chilblain, is a localized inflammatory lesion of the skin resulting from an abnormal response to cold.1 The cutaneous lesions of chilblain may be classified as idiopathic, autoimmune-related (as in systemic lupus erythematosus, subacute cutaneous lupus), and induced by drugs such as terbinafine (Lamisil)2 or infliximab (Remicade).,3
Chilblain lupus is a rare form of cutaneous lupus erythematosus and should not be confused with lupus pernio, which is a misleading name used for a type of cutaneous sarcoidosis.4
Chilblain lupus is characterized by reddish-purple plaques in acral areas (more often the hands and feet, but also the nose and ears) that are induced by exposure to cold—unlike other lesions of lupus erythematosus, which worsen with exposure to sunlight. The main difference from the cutaneous variety of sarcoidosis (lupus pernio) is the histopathologic appearance. In patients with chilblain lupus, epidermal atrophy, perivascular and periadnexal inflammatory infiltrates, and degeneration of the basal layer are found, whereas in lupus pernio (sarcoidosis), we observe granulomas without caseous necrosis, but with few inflammatory infiltrates on the periphery.
PROPOSED DIAGNOSTIC CRITERIA
Su et al5 have proposed diagnostic criteria for chilblain lupus. Their two major criteria are skin lesions in acral locations induced by exposure to cold or a drop in temperature, and evidence of lupus erythematosus in the skin lesions by histopathologic examination or immunofluorescence study. Both of these criteria must be met, plus one of three minor criteria: the coexistence of systemic lupus erythematosus or of skin lesions of discoid lupus erythematosus; response to lupus therapy; and negative results of testing for cryoglobulin and cold agglutinins.
CHILBLAIN LUPUS VS SYSTEMIC LUPUS
Chilblain lupus is an uncommon manifestation of systemic lupus erythematosus, and it is reported to occur in about 20% of patients with that condition.6 Often, the onset of chilblain lupus precedes the systemic disease. Patients with systemic lupus erythematosus and chilblain lupus do not usually present with renal disease, mucosal lesions, or central nervous system involvement. However, Raynaud phenomenon and photosensitivity have been reported to be more frequently associated with chilblain lupus.7
A disorder of peripheral circulation could be involved in the pathogenesis of chilblain lupus, and the association with Raynaud phenomenon, livedo reticularis, antiphospholipid syndrome, and changes in nailfold capillaries supports this hypothesis. Antinuclear antibody and anti-Ro/SS-A antibody are commonly detected in the serum of patients with chilblain lupus, and anti-Ro/SS-A antibody seems to be a major serologic marker of chilblain lupus in patients with systemic lupus erythematosus.7
TREATMENT
Protection from cold by physical measures is very important, as well as the use of topical or oral antibiotics if the lesions are infected. In severe cases unresponsive to topical corticosteroids, a calcium channel blocker is a good therapeutic option; antimalarials, commonly used in the treatment of lupus erythematosus, can also have a positive effect in patients with chilblain lupus.
CASE CONCLUDED
Our patient was advised to protect herself from the cold. Topical corticosteroids and oral hydroxychloroquine (200 mg/day) were prescribed, and they produced a good response. In severe cases, oral corticosteroids, etretinate (Tegison), mycophenolate (CellCept), or thalidomide (Thalomid) may be used.8
- Simon TD, Soep JB, Hollister JR. Pernio in pediatrics. Pediatrics 2005; 116:e472–e475.
- Bonsmann G, Schiller M, Luger TA, Ständer S. Terbinafine-induced subacute cutaneous lupus erythematosus. J Am Acad Dermatol 2001; 44:925–931.
- Richez C, Dumoulin C, Schaeverbeke T. Infliximab induced chilblain lupus in a patient with rheumatoid arthritis. J Rheumatol 2005; 32:760–761.
- Arias-Santiago SA, Girón-Prieto MS, Callejas-Rubio JL, Fernández-Pugnaire MA, Ortego-Centeno N. Lupus pernio or chilblain lupus?: two different entities. Chest 2009; 136:946–947.
- Su WP, Perniciaro C, Rogers RS, White JW. Chilblain lupus erythematosus (lupus pernio): clinical review of the Mayo Clinic experience and proposal of diagnostic criteria. Cutis 1994; 54:395–399.
- Yell JA, Mbuagbaw J, Burge SM. Cutaneous manifestations of systemic lupus erythematosus. Br J Dermatol 1996; 135:355–362.
- Franceschini F, Calzavara-Pinton P, Quinzanini M, et al. Chilblain lupus erythematosus is associated with antibodies to SSA/Ro. Lupus 1999; 8:215–219.
- Bouaziz JD, Barete S, Le Pelletier F, Amoura Z, Piette JC, Francès C. Cutaneous lesions of the digits in systemic lupus erythematosus: 50 cases. Lupus 2007; 16:163–167.
A 38-year-old woman presented with a pruriginous and erythematous lesion on her nose that appeared during periods of cold weather. She said she is completely asymptomatic during the summer months.
Q: What is the most likely diagnosis?
- Lupus pernio
- Rosacea
- Seborrheic dermatitis
- Chilblain lupus erythematosus
- Lupus vulgaris
A: The diagnosis is chilblain lupus erythematosus.
The differential diagnosis of an erythematous lesion on the nose of a middle-aged woman also includes rosacea, lupus pernio, lupus vulgaris, and seborrheic dermatitis. Some of these lesions are exacerbated by cold. Usually, the diagnosis is based on clinical findings, but in some cases histologic features on biopsy study confirm the diagnosis.
Lesions of lupus pernio (sarcoidosis) remain unaltered with changes in temperature, and biopsy study usually shows granulomas without caseous necrosis with little inflammatory infiltrate at the periphery.
Rosacea usually gets worse with heat and with alcohol consumption, although it can be exacerbated by cold. Biopsy study shows a nonspecific perivascular and perifollicular lymphohistiocytic infiltrate accompanied occasionally by multinucleated cells.
Seborrheic dermatitis is a papulosquamous disorder characterized by greasy scaling over inflamed skin on the scalp, face, and trunk. Disease activity is increased in winter and spring, with remissions commonly occurring in summer. The histologic features of seborrheic dermatitis are nonspecific; in this case, the histologic features were compatible with chilblain lupus without changes of seborrheic dermatitis.
Lupus vulgaris is a chronic form of cutaneous tuberculosis characterized by redbrown papules with central atrophy. The nose and ears are usually affected. Histologically, granulomatous tubercles with epithelioid cells and caseation necrosis are usually found.
CHILBLAIN LUPUS ERYTHEMATOSUS
Pernio, or chilblain, is a localized inflammatory lesion of the skin resulting from an abnormal response to cold.1 The cutaneous lesions of chilblain may be classified as idiopathic, autoimmune-related (as in systemic lupus erythematosus, subacute cutaneous lupus), and induced by drugs such as terbinafine (Lamisil)2 or infliximab (Remicade).,3
Chilblain lupus is a rare form of cutaneous lupus erythematosus and should not be confused with lupus pernio, which is a misleading name used for a type of cutaneous sarcoidosis.4
Chilblain lupus is characterized by reddish-purple plaques in acral areas (more often the hands and feet, but also the nose and ears) that are induced by exposure to cold—unlike other lesions of lupus erythematosus, which worsen with exposure to sunlight. The main difference from the cutaneous variety of sarcoidosis (lupus pernio) is the histopathologic appearance. In patients with chilblain lupus, epidermal atrophy, perivascular and periadnexal inflammatory infiltrates, and degeneration of the basal layer are found, whereas in lupus pernio (sarcoidosis), we observe granulomas without caseous necrosis, but with few inflammatory infiltrates on the periphery.
PROPOSED DIAGNOSTIC CRITERIA
Su et al5 have proposed diagnostic criteria for chilblain lupus. Their two major criteria are skin lesions in acral locations induced by exposure to cold or a drop in temperature, and evidence of lupus erythematosus in the skin lesions by histopathologic examination or immunofluorescence study. Both of these criteria must be met, plus one of three minor criteria: the coexistence of systemic lupus erythematosus or of skin lesions of discoid lupus erythematosus; response to lupus therapy; and negative results of testing for cryoglobulin and cold agglutinins.
CHILBLAIN LUPUS VS SYSTEMIC LUPUS
Chilblain lupus is an uncommon manifestation of systemic lupus erythematosus, and it is reported to occur in about 20% of patients with that condition.6 Often, the onset of chilblain lupus precedes the systemic disease. Patients with systemic lupus erythematosus and chilblain lupus do not usually present with renal disease, mucosal lesions, or central nervous system involvement. However, Raynaud phenomenon and photosensitivity have been reported to be more frequently associated with chilblain lupus.7
A disorder of peripheral circulation could be involved in the pathogenesis of chilblain lupus, and the association with Raynaud phenomenon, livedo reticularis, antiphospholipid syndrome, and changes in nailfold capillaries supports this hypothesis. Antinuclear antibody and anti-Ro/SS-A antibody are commonly detected in the serum of patients with chilblain lupus, and anti-Ro/SS-A antibody seems to be a major serologic marker of chilblain lupus in patients with systemic lupus erythematosus.7
TREATMENT
Protection from cold by physical measures is very important, as well as the use of topical or oral antibiotics if the lesions are infected. In severe cases unresponsive to topical corticosteroids, a calcium channel blocker is a good therapeutic option; antimalarials, commonly used in the treatment of lupus erythematosus, can also have a positive effect in patients with chilblain lupus.
CASE CONCLUDED
Our patient was advised to protect herself from the cold. Topical corticosteroids and oral hydroxychloroquine (200 mg/day) were prescribed, and they produced a good response. In severe cases, oral corticosteroids, etretinate (Tegison), mycophenolate (CellCept), or thalidomide (Thalomid) may be used.8
- Simon TD, Soep JB, Hollister JR. Pernio in pediatrics. Pediatrics 2005; 116:e472–e475.
- Bonsmann G, Schiller M, Luger TA, Ständer S. Terbinafine-induced subacute cutaneous lupus erythematosus. J Am Acad Dermatol 2001; 44:925–931.
- Richez C, Dumoulin C, Schaeverbeke T. Infliximab induced chilblain lupus in a patient with rheumatoid arthritis. J Rheumatol 2005; 32:760–761.
- Arias-Santiago SA, Girón-Prieto MS, Callejas-Rubio JL, Fernández-Pugnaire MA, Ortego-Centeno N. Lupus pernio or chilblain lupus?: two different entities. Chest 2009; 136:946–947.
- Su WP, Perniciaro C, Rogers RS, White JW. Chilblain lupus erythematosus (lupus pernio): clinical review of the Mayo Clinic experience and proposal of diagnostic criteria. Cutis 1994; 54:395–399.
- Yell JA, Mbuagbaw J, Burge SM. Cutaneous manifestations of systemic lupus erythematosus. Br J Dermatol 1996; 135:355–362.
- Franceschini F, Calzavara-Pinton P, Quinzanini M, et al. Chilblain lupus erythematosus is associated with antibodies to SSA/Ro. Lupus 1999; 8:215–219.
- Bouaziz JD, Barete S, Le Pelletier F, Amoura Z, Piette JC, Francès C. Cutaneous lesions of the digits in systemic lupus erythematosus: 50 cases. Lupus 2007; 16:163–167.

The bittersweet of steroid therapy

For many of those long-term effects, such as osteoporosis, cushingoid features, skin fragility, and cataracts, all we can do is hope that they don’t occur, since there is little we can do to screen for or prevent them. We have previously discussed steroid-associated osteoporosis in the Journal,1 and strategies for preventing it have been proposed by specialty societies.2 For other complications such as hypertension, weight gain, and glucose intolerance, we can offer common-sense protective suggestions, monitor for them, and intervene if they occur.
In this issue, Dr. M. Cecilia Lansang and Ms. Leighanne Kramer Hustak3 discuss the management of steroid-induced adrenal suppression and diabetes. They offer practical management suggestions but also point out that the evidence base for our treatment decisions is surprisingly limited.
Nearly all patients chronically receiving high-dose glucocorticoid therapy develop glucose intolerance, but knowing when that is happening is not always easy. In patients destined to develop type 2 diabetes, the laboratory or clinical signs of hyperglycemia appear only when the pancreas can no longer maintain the insulin production necessary to overcome peripheral insulin resistance. Steroid-induced diabetes is characterized by increased gluconeogenesis, insulin resistance, and excessive postprandial surges, so fasting glucose levels are not sensitive for this clinical syndrome.
The degree and duration of the chronic hyperinsulinemia and hyperglycemia dictates the risk of microvascular complications and thus will be linked to duration of steroid therapy (unless the steroid is unmasking preexisting mild diabetes). Although issues surrounding tight control of blood glucose levels in the acute setting remain unresolved, I believe that even short-term significant steroid-induced hyperglycemia should be prevented when reasonably possible, at the least keeping in mind the additive ill effects of hyperglycemia and steroid therapy on the risk of nuisance infections such as oral and vaginal candidiasis and urinary tract infections that, in the setting of high-dose steroid therapy, can rapidly turn nasty.
- Dore RK. How to prevent glucocorticoid-induced osteoporosis. Cleve Clin J Med 2010; 77:529–536.
- American College of Rheumatology Ad Hoc Committee on Glucocorticoid-Induced Osteoporosis. Recommendations for the prevention and treatment of glucocorticoid-induced osteoporosis: 2001 update. Arthritis Rheum 2001; 44:1496–1503.
- Lansang MC, Hustak LK. Glucocorticoid-induced diabetes and adrenal suppression: how to detect and manage them. Cleve Clin J Med 2011; 78:748–756.
For many of those long-term effects, such as osteoporosis, cushingoid features, skin fragility, and cataracts, all we can do is hope that they don’t occur, since there is little we can do to screen for or prevent them. We have previously discussed steroid-associated osteoporosis in the Journal,1 and strategies for preventing it have been proposed by specialty societies.2 For other complications such as hypertension, weight gain, and glucose intolerance, we can offer common-sense protective suggestions, monitor for them, and intervene if they occur.
In this issue, Dr. M. Cecilia Lansang and Ms. Leighanne Kramer Hustak3 discuss the management of steroid-induced adrenal suppression and diabetes. They offer practical management suggestions but also point out that the evidence base for our treatment decisions is surprisingly limited.
Nearly all patients chronically receiving high-dose glucocorticoid therapy develop glucose intolerance, but knowing when that is happening is not always easy. In patients destined to develop type 2 diabetes, the laboratory or clinical signs of hyperglycemia appear only when the pancreas can no longer maintain the insulin production necessary to overcome peripheral insulin resistance. Steroid-induced diabetes is characterized by increased gluconeogenesis, insulin resistance, and excessive postprandial surges, so fasting glucose levels are not sensitive for this clinical syndrome.
The degree and duration of the chronic hyperinsulinemia and hyperglycemia dictates the risk of microvascular complications and thus will be linked to duration of steroid therapy (unless the steroid is unmasking preexisting mild diabetes). Although issues surrounding tight control of blood glucose levels in the acute setting remain unresolved, I believe that even short-term significant steroid-induced hyperglycemia should be prevented when reasonably possible, at the least keeping in mind the additive ill effects of hyperglycemia and steroid therapy on the risk of nuisance infections such as oral and vaginal candidiasis and urinary tract infections that, in the setting of high-dose steroid therapy, can rapidly turn nasty.
- Dore RK. How to prevent glucocorticoid-induced osteoporosis. Cleve Clin J Med 2010; 77:529–536.
- American College of Rheumatology Ad Hoc Committee on Glucocorticoid-Induced Osteoporosis. Recommendations for the prevention and treatment of glucocorticoid-induced osteoporosis: 2001 update. Arthritis Rheum 2001; 44:1496–1503.
- Lansang MC, Hustak LK. Glucocorticoid-induced diabetes and adrenal suppression: how to detect and manage them. Cleve Clin J Med 2011; 78:748–756.
Glucocorticoid-induced diabetes and adrenal suppression: How to detect and manage them
Glucocorticoids are commonly prescribed by primary care physicians and specialists alike for multiple medical problems, acute as well as chronic.
However, these useful drugs have adverse effects on multiple endocrine systems, effects that include diabetes (or worsening of hyperglycemia in those with known diabetes), Cushing syndrome, adrenal suppression, osteoporosis (reviewed in the Cleveland Clinic Journal of Medicine in August 2010),1 and dyslipidemia. In addition, suppression of gonadotropins, growth hormone, and, acutely, thyrotropin can ensue.
The focus of this review is on the diabetogenic and adrenal suppressive effects of glucocorticoids and their management. We describe the rationale for choosing specific drugs to counter hyperglycemia, tests for determining adrenal suppression and systemic glucocorticoid absorption, and how and why to taper these drugs.
WIDELY USED DRUGS
Although glucocorticoids (often simply called steroids or corticosteroids, although not all steroids are corticosteroids, and not all corticosteroids are glucocorticoids) are the core treatment for adrenal insufficiency, in most cases they are prescribed for their anti-inflammatory effects. They act through multiple pathways at the cellular and molecular levels, suppressing the cascades that would otherwise result in inflammation and promoting pathways that produce anti-inflammatory proteins.2
In addition to formulations that are intended to have systemic effects, other, “local” formulations are made for specific conditions, such as intra-articular injections for arthritis, epidural injections for lumbar disk pain, eye drops for uveitis, nasal sprays for allergic rhinitis, inhalers for asthma, and topical ointments and creams for eczema. However, as we will discuss, even these preparations can have systemic effects.
GLUCOCORTICOID-INDUCED DIABETES IS COMMON
Glucocorticoids are the most common cause of drug-induced diabetes. Though the exact prevalence is not known, a few observations suggest that glucocorticoid-induced diabetes or hyperglycemia is common:
- In patients with rheumatoid arthritis, mean age 62 years, nearly 9% developed diabetes in the 2 years after starting glucocorticoid treatment, which was a higher rate than expected.3
- In nondiabetic patients with primary renal disease treated with prednisolone 0.75 mg/kg/day, 42% were found to have 2-hour post-lunch plasma glucose concentrations higher than 200 mg/dL but normal fasting glucose levels.4
- In a case-control study, the odds ratio of starting an oral hypoglycemic agent or insulin was 1.77 for patients receiving a hydrocortisone-equivalent dose of 1 to 39 mg/day, 3.02 for 40 to 79 mg/day, 5.82 for 80 to 119 mg/day, and 10.34 for 120 mg/day or more.5 (For a full discussion of glucocorticoid equivalents, see the section below on Cushing syndrome and adrenal suppression.)
- In patients with type 1 diabetes, prednisone 60 mg/day raised the blood glucose levels starting 6 hours after the prednisone dose.6
- Diabetic ketoacidosis and hyperosmolar nonketotic syndrome have been reported as a result of glucocorticoid treatment.7–9
GLUCOCORTICOIDS CAUSE DIABETES MAINLY VIA INSULIN RESISTANCE
The mechanism by which glucocorticoids cause diabetes predominantly involves insulin resistance rather than decreased insulin production. In fact, in a study in healthy volunteers, 10 hydrocortisone infusion resulted in higher insulin production than saline infusion did. (In high doses, however, glucocorticoids have been shown to decrease insulin secretion.11)
Normally, in response to insulin, the liver decreases its output of glucose. Glucocorticoids decrease the liver’s sensitivity to insulin, thereby increasing hepatic glucose output.12 They also inhibit glucose uptake in muscle and fat, reducing insulin sensitivity as much as 60% in healthy volunteers. This seems primarily due to a postreceptor effect, ie, inhibition of glucose transport.13–15
THE PEAK EFFECT OCCURS 4 TO 6 HOURS AFTER DOSING
To understand the optimal time for checking plasma glucose and to apply appropriate treatment, we should consider the pharmacokinetic profile of glucocorticoids.
Studied using the whole-blood lymphocyte proliferation technique, prednisone shows a peak effect at about 4 to 6 hours and a duration of action of 13 to 16 hours.16 This closely resembles what we see in terms of glucose excursion with this drug.17 Two studies of intravenous dexamethasone 10 mg showed that glucose levels rose within 4 hours of injection, but did not pursue this beyond that time frame.18,19
PATIENTS WITHOUT A PREVIOUS DIAGNOSIS OF DIABETES
Be alert for new-onset diabetes
For most diseases treated with glucocorticoids, clinicians can estimate in advance how long the patient will need to take the drug. We can arbitrarily classify the projected exposure as either short-term (3 to 4 weeks or less, such as a 6-day course of methylprednisolone for allergic conditions) or long-term (such as in transplant recipients to prevent rejection or to treat graft-vs-host disease). Hyperglycemia is a potential concern with both short-term and long-term treatment. However, guidelines on checking blood sugar levels, as opposed to relying on symptoms alone, are available only for long-term glucocorticoid treatment.
Patients beginning treatment should be warned of typical diabetes symptoms such as thirst and increased urination and, should these occur, to seek medical attention to have their blood glucose level checked. It is also reasonable to have them return in a week for a random postprandial plasma glucose test in the mid-afternoon.
Why this timing? In most once-daily regimens, glucocorticoids are given in the morning to prevent adrenal suppression (discussed below). In our experience, glucose levels start to rise mid-morning and continue to increase until bedtime. Measuring glucose levels 1 to 2 hours after lunch allows for both the glucocorticoid action and the carbohydrate absorption from lunch to reach their peaks. If hyperglycemia is going to happen, it should be detectable by then. A glucose level of 200 mg/dL or higher should prompt the practitioner to pursue this further.
If glucocorticoid treatment is to continue beyond 3 to 4 weeks, the only population for which there are published guidelines on managing glucocorticoid-related diabetes is transplant recipients. International consensus guidelines, published in 2003, suggest checking the fasting plasma glucose level once a week for the first 4 weeks after transplantation, then at 3 months, at 6 months, and then once a year.20
Though practical, this suggestion does not reflect the fact that glucocorticoids often do not affect fasting plasma glucose, especially if given once daily in the morning at doses of 30 mg or less of prednisone or its equivalent. These guidelines thus may not be applicable to other populations with glucocorticoid-induced diabetes.
The transplant guidelines do mention that an oral glucose tolerance test may be more sensitive, but this is often cumbersome to perform. We believe that checking random postprandial plasma glucose levels is helpful in this regard.
If the patient was at risk of developing diabetes even before receiving a glucocorticoid (for example, if he or she is overweight, has a family history of diabetes, or had a previous hemoglobin A1c of 5.7% or higher), then a fasting plasma glucose level of 126 mg/dL or higher or a hemoglobin A1c of 6.5% or higher might suffice to diagnose diabetes. Results should be confirmed on a separate day in the absence of unequivocal hyperglycemia. Fasting hyperglycemia can also be seen in patients receiving higher once-daily glucocorticoid doses—in our experience, an equivalent of prednisone 40 mg once a day in the morning— or twice-daily dosing.
A hemoglobin A1c checked less than 2 to 3 months after starting glucocorticoid treatment will not be sensitive in picking up glucocorticoid-induced diabetes if the patient did not have underlying diabetes.
Diet and exercise may not be practical
Though diet and exercise are important in managing diabetes, the condition for which the patient is receiving a glucocorticoid may prevent him or her from exercising, at least in the acute phase of the illness.
In addition, though the exact mechanism is not known, glucocorticoids increase hunger, and so decreasing food intake is not easy either. Nonetheless, patients should be familiarized with what carbohydrates are and should be advised to reduce their intake of them.
For suspected type 1 diabetes, start insulin
If type 1 diabetes is suspected, for example, in patients who are lean, younger than 30 years, or who had presented with diabetic ketoacidosis, then insulin should be started. In equivocal cases, insulin therapy can commence while testing is done for C-peptide, glutamic acid decarboxylase antibodies, islet cell antibodies, and insulinoma-associated protein antibodies.
Starting oral antidiabetic drugs
Some patients may have contraindications to specific drugs. For example, metformin (Glucophage) is contraindicated if the serum creatinine level is elevated, an abnormality that renal transplant patients may continue to have.
If the patient has no such contraindications, we have found the following medications suitable in view of their efficacy, low risk of hypoglycemia, or lack of distressing side effects. They will often lower glucose levels enough to achieve capillary blood glucose or fingerstick goals (discussed below). None of them has been specifically approved by the US Food and Drug Administration for glucocorticoid-induced diabetes, but they are approved for type 2 diabetes.
Guidelines from the American Association of Clinical Endocrinologists for type 2 diabetes call for starting monotherapy if the hemoglobin A1c is 6.5% to 7.5%, dual therapy if it is 7.6% to 9%, triple therapy if it is higher than 9% and the patient has no symptoms, and insulin if it is higher than 9% and the patient does have symptoms.22
In terms of estimated average glucose levels, these categories correspond to 140 to 169 mg/dL for monotherapy, 171 to 212 mg/dL for dual therapy, and higher than 212 mg/dL for triple therapy or insulin. Since estimated average levels also include fasting glucose levels (which are lower in glucocorticoid-induced diabetes compared with nonfasting levels), and because we use the American Diabetes Association general hemoglobin A1c goal of less than 7%, we believe that our suggestions below are reasonable.
We divide our recommendations according to initial random (ideally, 1- to 2-hour postprandial) plasma glucose levels.
If the random or 1- to 2-hour post-meal plasma glucose is lower than 220 mg/dL
In this situation the choices are:
- Metformin
- Dipeptidyl peptidase-4 (DPP-4) inhibitors (“gliptins”)
- Meglitinides (“glinides”). The guidelines on new-onset diabetes after transplantation point out that meglitinides may be the safest agents apart from insulin in the renal transplant population, but does acknowledge that efficacies of different oral agents have not been compared in this group.20
- Glucagon-like protein-1 (GLP-1) agonists
- Sulfonylureas. However, the longer-acting forms such as glimepiride (Amaryl) are not suitable if the fasting plasma glucose is not affected.
We have not used thiazolidinediones (“glitazones”) routinely because they can cause weight gain and edema—problems that are already seen with the use of steroids—and have a slower onset of action.
If the random or 1- to 2-hour post-meal plasma glucose is 220 to 300 mg/dL
Often, a combination of drugs or insulin (see below) is needed. However, you can start with one agent and add a second agent within 2 or 3 months (as is recommended for type 2 diabetes).22,23 The following combinations of the agents listed above are supported by published guidelines for type 2 diabetes:
- Metformin plus a sulfonylurea22,23
- Metformin plus a glinide22
- Metformin plus a GLP-1 agonist23
- Metformin plus a DPP-4 inhibitor.22
If the random or 1- to 2-hour post-meal plasma glucose is higher than 300 mg/dL
In our experience, if their plasma glucose levels are this high, patients are experiencing frank symptoms of hyperglycemia.
Insulin addresses those symptoms and avoids the prolonged wait that often results from unsuccessfully starting one agent and then adding another. Of all the available drugs, insulin is the only one that can be used despite multiple underlying illnesses; it does not cause a lot of drug interactions, and the dose can be adjusted upward and downward in increments to fit the patient’s needs, especially when a larger glucocorticoid load is given up front and then is tapered either slowly or rapidly. However, it can cause hypoglycemia and weight gain.
The initial total daily dose of insulin can be based on the patient’s weight. A starting total daily dose of 0.15 to 0.3 U/kg is reasonable— on the lower end if only the postprandial glucose levels are elevated, and on the higher end if both fasting and postprandial glucose levels are affected.
If fasting glucose levels are not elevated, then Neutral Protamine Hagedorn insulin (which is intermediate-acting) or a premixed combination of an intermediate-acting plus a fast- or short-acting insulin can be given once a day before breakfast, or even before lunch if the glucose levels start to rise only after lunch.
If both the fasting and the postprandial glucose levels are elevated, regimens similar to those for type 1 or insulin-requiring type 2 diabetes can be used, except that the ratios of the doses are tilted more toward covering postprandial than fasting hyperglycemia:
- Long-acting insulin plus prandial insulin, in a ratio of 30:70 to 50:50. As glucocorticoids are tapered, the long-acting insulin may have to be discontinued while the prandial doses are continued, since the fasting glucose level decreases first.
- Premixed insulins, with one-half to two-thirds of the dose given before breakfast and the rest before the evening meal, with the possibility of a third injection before lunch. As glucocorticoids are tapered, the evening dose is tapered first.
- Intermediate-acting insulin plus short- or fast-acting insulin in the morning (these two will make up one-half to two-thirds of the total daily dose), short- or fast-acting insulin before the evening meal, and intermediate-acting insulin at bedtime. As glucocorticoids are tapered, the bedtime insulin is tapered first.
Capillary blood glucose (fingerstick) checks
The timing and frequency of fingerstick checks depend on the treatment.
Though postprandial testing is ideal, it is often not practical or convenient. Before lunch, before dinner, and at bedtime are good alternatives since they reflect the pattern of glucose rise throughout the day. For patients on diet and exercise with or without agents other than insulin, testing once or twice a day is reasonable, rotating times before meals (including fasting if this time is affected) and at bedtime.
For patients on insulin, checking two to four times a day initially would help match insulin doses with glucose excursions. For continued care, the American Diabetes Association recommends fingerstick checks three times daily in patients on multiple insulin injections, but it has no specific recommendations for those on once-a-day insulin.21 We have been recommending that our patients on once-daily insulin check at least twice a day.
Goal fingerstick glucose levels that we use are in accordance with the American Diabetes Association guidelines for diabetes in general21:
- Before meals 70 to 130 mg/dL or
- 1 to 2 hours after meals < 180 mg/dL.
During steroid taper, if the glucocorticoid dose is in the lower range (eg, a prednisone-equivalent dose of approximately 7.5 mg per day or less), the fingerstick glucose levels are at the lower end of the target range, and the patient is on a single antidiabetic agent that does not often cause hypoglycemia (eg, metformin), then it is reasonable to ask the patient to not take the antidiabetic medication for 3 to 7 days while continuing to check fingersticks to see if it needs to be resumed. Patients on agents that can cause hypoglycemia need to check more often during the 1 to 3 days after the glucocorticoid dose reduction, as it may take this much time for the glycemic effect to diminish and to adjust the diabetes medication to the appropriate dose.
STARTING GLUCOCORTICOIDS IN PATIENTS WITH KNOWN DIABETES
Fingerstick checks more often
Most patients will already have a glucose meter. They should be instructed to check as discussed above if they do not have a previous diagnosis of diabetes, or to continue as they are doing if they are already checking more often. Patients who have been checking only fasting levels should be instructed to check later in the day, either before or 1 to 2 hours after meals, as discussed above. Patients on oral medications may need additional oral agents or insulin.
Adjust medications if glucose is not at goal
Patients with type 2 diabetes treated with diet and exercise alone can be started on the medications discussed above if their fingerstick readings are not at goal.
If they are already on insulin, we advise them to increase the short- or fast-acting insulins and the morning intermediate-acting insulin by at least 10% to 20% as soon as an elevation in glucose is detected. Long-acting insulin or nighttime intermediate-acting insulin should be increased if fasting glucose levels are affected.
Insulin requirements can double depending on the glucocorticoid dose. In patients with type 1 diabetes who were given prednisone 60 mg orally for 3 days, mean blood glucose levels increased from a baseline of 110 mg/dL at baseline to 149 mg/dL on the days on prednisone.6 The average blood glucose level remained elevated at 141 mg/dL on the day after the last dose of prednisone. The insulin dose increased by 31% to 102% (mean 69%).
CUSHING SYNDROME AND ADRENAL SUPPRESSION
Unlike glucocorticoid-induced diabetes, in which the dilemma is often when to initiate antidiabetic treatment, the question for patients in whom Cushing syndrome or adrenal suppression has developed is when to discontinue glucocorticoids.
Adrenal suppression for the most part goes hand in hand with exogenous Cushing syndrome. If cushingoid features develop, we can infer that the dose of exogenous glucocorticoid exceeds the physiologic needs. This supraphysiologic dosing also leads to suppression of endogenous cortisol production. The suppression occurs at the level of the hypothalamus and pituitary gland, with subsequent atrophy of the part of the adrenal cortex that produces endogenous glucocorticoids.
To understand further the concept of supraphysiologic dosing, the following interconversion of systemic glucocorticoid effects is helpful24,25:
However, there is not much information on interconversion for the local preparations (intra-articular, epidural, inhaled, topical).
Moreover, the definition of supraphysiologic dosing seems to be evolving. Though a total hydrocortisone-equivalent dose of 30 mg/day is still often touted as physiologic replacement, many patients require less. Several studies in the early 1990s, mostly in children and adolescents, showed the mean daily cortisol production rate to be 4.8 to 6.8 mg/m2/day, or closer to 10 to 15 mg/day.26–28 For purposes of this discussion, a physiologic dose will be defined as up to 30 mg hydrocortisone per day or its equivalent.
Adrenal suppression vs insufficiency
Adrenal suppression is often confused with adrenal insufficiency.
Adrenal suppression occurs when cortisol production is decreased because of the presence of exogenous glucocorticoids or other drugs, such as megestrol acetate (Megace), that act on the glucocorticoid receptor. Another situation beyond the scope of this review is excess endogenous cortisol production by an adrenal adenoma or adrenal carcinoma that causes suppression of the contralateral adrenal gland.29
In contrast, adrenal insufficiency is caused by failure of the adrenal gland to produce cortisol as a result of an innate disorder of the adrenal gland (eg, Addison disease) or pituitary gland (eg, pituitary surgery).
Hence, endogenous cortisol production in a patient taking supraphysiologic doses of exogenous glucocorticoids may be suppressed. Recovery of endogenous cortisol production is expected after stopping the exogenous glucocorticoid, though the time to recovery can vary and the patient can be adrenally insufficient if the glucocorticoid is stopped abruptly.
In addition, during times of intercurrent illness, a patient with adrenal suppression may be relatively adrenally insufficient and may need larger doses (“stress doses”) of glucocorticoids, since the adrenal glands may be unable to mount a stress response.29
Local steroids can suppress the adrenal glands
Glucocorticoids are the most common cause of Cushing syndrome. Oral formulations such as dexamethasone, prednisone, and hydrocortisone taken in supraphysiologic doses and for prolonged durations are easily recognized as obvious causes of Cushing syndrome. However, intra-articular, epidural, inhaled, nasal, ocular, and topical steroids—so-called local preparations—have also been linked to Cushing syndrome, and physicians are less likely to recognize them as causes.30–38
In a study in 16 pediatric patients with asthma and 48 controls, inhaled beclomethasone dipropionate (Qvar) 300 to 500 μg daily resulted in adrenal suppression in 100% of patients after 6 to 42 months, as determined by an insulin tolerance test.30
The topical steroid betamethasone (Diprosone) carries a warning that systemic absorption of topical steroids can cause adrenal suppression.39 Intra-articular, intranasal, epidural, and ocular routes are also reported to cause adrenal suppression.32–38
When is adrenal suppression more likely?
Adrenal suppression is more likely in the following situations:
- Longer duration of treatment. Studies have shown that exposure to supraphysiologic steroid doses for 2 weeks or less might already suppress the adrenal glands, but the clinical significance of this is unclear since some recovery already occurs a few days after the glucocorticoids are discontinued.31,40
- Supraphysiologic doses, stronger formulations, longer-acting formulations.41
When is adrenal suppression less likely?
Adrenal suppression is less likely in the following situations:
- Regimens that mimic the diurnal rhythm of cortisol (higher dose in the morning, lower dose in the afternoon)42
- Alternate-day dosing of steroids.43
Steroid withdrawal vs adrenal insufficiency
Another phenomenon that can be confused with adrenal insufficiency or glucocorticoid insufficiency is steroid withdrawal, in which patients experience lethargy, muscle aches, nausea, vomiting, and postural hypotension as glucocorticoids are tapered and their effects wane.42 Increasing the glucocorticoid dose for presumed adrenal insufficiency may delay recovery of the adrenal function and would have to be weighed against the patient’s symptoms.
The following may help distinguish the two: if the patient is on supraphysiologic glucocorticoid doses, then he or she is not glucocorticoid-deficient and is likely suffering from steroid withdrawal. At this point, patients may just need reassurance, symptomatic treatment, or if necessary, a brief (1-week) increase of the previous lowest dose, followed by reevaluation.
With local glucocorticoid preparations that may be systemically absorbed, however, there is no good way of estimating dose equivalence. In these situations, the decision to simply reassure the patient or give symptomatic treatment—as opposed to giving low-dose oral glucocorticoids such as hydrocortisone 5 to 10 mg daily for a week followed by reevaluation— depends on the severity of symptoms and whether the patient has quick access to medical attention should he or she develop an intercurrent illness.
Identifying patients at risk of adrenal suppression
Patients presenting with weight gain or symptoms suggesting Cushing syndrome should be asked about steroid intake and should be prompted to recall possible nonoral routes. In addition, patients presenting with muscle aches and fatigue—symptoms of steroid withdrawal— may have received unrecognized local glucocorticoids that were systemically absorbed, now with diminishing effects.
The ACTH stimulation test for adrenal recovery
Testing can be done to see if the adrenal glands have recovered and glucocorticoid therapy can be discontinued (see Tapering from glucocorticoids, below).
The test most often used is the corticotropin (ACTH) stimulation test. Since the suppression is at the level of the hypothalamus and the pituitary gland, the ACTH stimulation test is an indirect method of assessing hypothalamic and pituitary function in the context of glucocorticoid-induced adrenal suppression. It has good correlation with the insulin tolerance test, the gold-standard test for an intact hypothalamic-pituitary-adrenal axis.
The synthetic ACTH cosyntropin (Cortrosyn) 250 μg is injected intravenously or intramuscularly, and a cortisol level is drawn at baseline and 30 and 60 minutes later. Other doses such as 1 μg or 10 μg have been reported but are not yet widely accepted. A cortisol level of greater than 18 to 20 μg/dL at any time point shows that the adrenals have regained function and the steroids may be discontinued.42 If adrenal suppression persists, weaning from steroids should continue.
In reality, it may not be possible or practical to do an ACTH stimulation test, as not all physicians’ offices have a supply of cosyntropin or the manpower to perform the test correctly. In these cases, weaning can progress with monitoring of symptoms.
Testing for synthetic glucocorticoids in the urine and serum can demonstrate systemic absorption and may be helpful in patients who do not recall receiving steroids.33
Tapering from glucocorticoids
Several tapering schedules have been suggested (although not necessarily validated). Whether and how to taper depend on how long the glucocorticoid has been taken.
If taken for less than 1 week, glucocorticoids can be stopped without tapering, regardless of the dose.
If taken for 1 to 3 weeks, the decision to taper depends on the clinician’s assessment of the patient’s general health or constitution and the illness for which the glucocorticoid was prescribed. For example, if the underlying disease is less likely to flare with a gradual dose reduction, then tapering would be suitable.44
If taken for more than 3 weeks, the practice has been a more rapid taper at the beginning until a physiologic dose is reached. How quickly to reduce the dose depends on whether the underlying illness is expected to flare up, or if the patient might experience steroid withdrawal symptoms.
One schedule is to lower the glucocorticoid dose by an amount equivalent to prednisolone 2.5 mg every 3 to 4 days when above the physiologic dose, then to taper more slowly by 1 mg every 2 to 4 weeks.44 Once the physiologic dose is reached, one can switch to the equivalent dose of hydrocortisone and decrease the dose by 2.5 mg a week until a daily dose of 10 mg a day is reached and maintained for 2 to 3 months, and then perform a test of adrenal function (see above).44 Passing the test implies that the adrenal glands have recovered and the glucocorticoid can be stopped.
Another option is to switch to alternate-day therapy once a physiologic dose is reached and to test 8:00 am cortisol levels, continuing the glucocorticoid and retesting in 4 to 6 weeks if the value is less than 3 μg/dL; stopping the glucocorticoid if the value is higher than 20 μg/dL; and performing an ACTH stimulation test for values in between.45
A review of other tapering regimens for chronic diseases, mostly pulmonary, did not find enough evidence to recommend one particular schedule over another.46 The tapering schedule may have to be adjusted to prevent disease flare and symptoms of steroid withdrawal.
Locally administered steroids. Since the equivalence of systemically absorbed local glucocorticoids is not known, these patients are likely to present when they have symptoms of steroid withdrawal. In this situation, testing adrenal function will help.
- Dore RK. How to prevent glucocorticoid-induced osteoporosis. Cleve Clin J Med 2010; 77:529–536.
- Rhen T, Cidlowski JA. Antiinflammatory action of glucocorticoids—new mechanisms for old drugs. N Engl J Med 2005; 353:1711–1723.
- Panthakalam S, Bhatnagar D, Klimiuk P. The prevalence and management of hyperglycaemia in patients with rheumatoid arthritis on corticosteroid therapy. Scott Med J 2004; 49:139–141.
- Uzu T, Harada T, Sakaguchi M, et al. Glucocorticoid-induced diabetes mellitus: prevalence and risk factors in primary renal diseases. Nephron Clin Pract 2007; 105:c54–c57.
- Gurwitz JH, Bohn RL, Glynn RJ, Monane M, Mogun H, Avorn J. Glucocorticoids and the risk for initiation of hypoglycemic therapy. Arch Intern Med 1994; 154:97–101.
- Bevier WC, Zisser HC, Jovanovic L, et al. Use of continuous glucose monitoring to estimate insulin requirements in patients with type 1 diabetes mellitus during a short course of prednisone. J Diabetes Sci Technol 2008; 2:578–583.
- Cagdas DN, Paç FA, Cakal E. Glucocorticoid-induced diabetic ketoacidosis in acute rheumatic fever. J Cardiovasc Pharmacol Ther 2008; 13:298–300.
- Bedalov A, Balasubramanyam A. Glucocorticoid-induced ketoacidosis in gestational diabetes: sequela of the acute treatment of preterm labor. A case report. Diabetes Care 1997; 20:922–924.
- Yang JY, Cui XL, He XJ. Non-ketotic hyperosmolar coma complicating steroid treatment in childhood nephrosis. Pediatr Nephrol 1995; 9:621–622.
- Nielsen MF, Caumo A, Chandramouli V, et al. Impaired basal glucose effectiveness but unaltered fasting glucose release and gluconeogenesis during short-term hypercortisolemia in healthy subjects. Am J Physiol Endocrinol Metab 2004; 286:E102–E110.
- Matsumoto K, Yamasaki H, Akazawa S, et al. High-dose but not low-dose dexamethasone impairs glucose tolerance by inducing compensatory failure of pancreatic beta-cells in normal men. J Clin Endocrinol Metab 1996; 81:2621–2626.
- Rizza RA, Mandarino LJ, Gerich JE. Cortisol-induced insulin resistance in man: impaired suppression of glucose production and stimulation of glucose utilization due to a postreceptor detect of insulin action. J Clin Endocrinol Metab 1982; 54:131–138.
- Meyuhas O, Reshef L, Gunn JM, Hanson RW, Ballard FJ. Regulation of phosphoenolpyruvate carboxykinase (GTP) in adipose tissue in vivo by glucocorticoids and insulin. Biochem J 1976; 158:1–7.
- Tappy L, Randin D, Vollenweider P, et al. Mechanisms of dexamethasone-induced insulin resistance in healthy humans. J Clin Endocrinol Metab 1994; 79:1063–1069.
- Pagano G, Cavallo-Perin P, Cassader M, et al. An in vivo and in vitro study of the mechanism of prednisone-induced insulin resistance in healthy subjects. J Clin Invest 1983; 72:1814–1820.
- Magee MH, Blum RA, Lates CD, Jusko WJ. Pharmacokinetic/pharmaco-dynamic model for prednisolone inhibition of whole blood lymphocyte proliferation. Br J Clin Pharmacol 2002; 53:474–484.
- Burt MG, Roberts GW, Aguilar-Loza NR, Frith P, Stranks SN. Continuous monitoring of circadian glycemic patterns in patients receiving prednisolone for COPD. J Clin Endocrinol Metab 2011; 96:1789–1796.
- Hans P, Vanthuyne A, Dewandre PY, Brichant JF, Bonhomme V. Blood glucose concentration profile after 10 mg dexamethasone in non-diabetic and type 2 diabetic patients undergoing abdominal surgery. Br J Anaesth 2006; 97:164–170.
- Pasternak JJ, McGregor DG, Lanier WL. Effect of single-dose dexamethasone on blood glucose concentration in patients undergoing craniotomy. J Neurosurg Anesthesiol 2004; 16:122–125.
- Davidson J, Wilkinson A, Dantal J, et al; International Expert Panel. New-onset diabetes after transplantation: 2003 international consensus guidelines. Proceedings of an international expert panel meeting. Barcelona, Spain, 19 February 2003. Transplantation 2003; 75(suppl 10):SS3–SS24.
- American Diabetes Association. Standards of medical care in diabetes— 2011. Diabetes Care 2011; 34(suppl 1):S11–S61.
- Rodbard HW, Jellinger PS, Davidson JA, et al. Statement by an American Association of Clinical Endocrinologists/American College of Endocrinology consensus panel on type 2 diabetes mellitus: an algorithm for glycemic control. Endocr Pract 2009; 15:540–559.
- Nathan DM, Buse JB, Davidson MB, et al; American Diabetes Association; European Association for Study of Diabetes. Medical management of hyperglycemia in type 2 diabetes: a consensus algorithm for the initiation and adjustment of therapy: a consensus statement of the American Diabetes Association and the European Association for the Study of Diabetes. Diabetes Care 2009; 32:193–203.
- Axelrod L. Corticosteroid therapy. In:Becker KL, editor. Principles and Practice of Endocrinology and Metabolism. 3rd ed. Philadelphia, PA: Lippincott Williams and Wilkins; 2000:752–763.
- Ferri FF, editor. Practical Guide to the Care of the Medical Patient. 8th ed. Philadelphia, PA: Mosby/Elsevier; 2011.
- Kerrigan JR, Veldhuis JD, Leyo SA, Iranmanesh A, Rogol AD. Estimation of daily cortisol production and clearance rates in normal pubertal males by deconvolution analysis. J Clin Endocrinol Metab 1993; 76:1505–1510.
- Linder BL, Esteban NV, Yergey AL, Winterer JC, Loriaux DL, Cassorla F. Cortisol production rate in childhood and adolescence. J Pediatr 1990; 117:892–896.
- Esteban NV, Loughlin T, Yergey AL, et al. Daily cortisol production rate in man determined by stable isotope dilution/mass spectrometry. J Clin Endocrinol Metab 1991; 72:39–45.
- Lansang MC, Quinn SL. Adrenal suppression. BMJ BestPractice 2010. http://bestpractice.bmj.com/best-practice/monograph/863/diagnosis/stepby-step.html. Accessed August 19, 2011.
- Zöllner EW. Hypothalamic-pituitary-adrenal axis suppression in asthmatic children on inhaled corticosteroids (part 2)—the risk as determined by gold standard adrenal function tests: a systematic review. Pediatr Allergy Immunol 2007; 18:469–474.
- Schuetz P, Christ-Crain M, Schild U, et al. Effect of a 14-day course of systemic corticosteroids on the hypothalamic-pituitary-adrenal-axis in patients with acute exacerbation of chronic obstructive pulmonary disease. BMC Pulm Med 2008; 8:1.
- Kay J, Findling JW, Raff H. Epidural triamcinolone suppresses the pituitary-adrenal axis in human subjects. Anesth Analg 1994; 79:501–505.
- Lansang MC, Farmer T, Kennedy L. Diagnosing the unrecognized systemic absorption of intra-articular and epidural steroid injections. Endocr Pract 2009; 15:225–228.
- Duclos M, Guinot M, Colsy M, et al. High risk of adrenal insufficiency after a single articular steroid injection in athletes. Med Sci Sports Exerc 2007; 39:1036–1043.
- Bong JL, Connell JM, Lever R. Intranasal betamethasone induced acne and adrenal suppression. Br J Dermatol 2000; 142:579–580.
- Atabek ME, Pirgon O, Unal E. Pituitary-adrenal axis suppression due to topical steroid administration in an infant. Pediatr Int 2007; 49:242–244.
- Ozerdem U, Levi L, Cheng L, Song MK, Scher C, Freeman WR. Systemic toxicity of topical and periocular corticosteroid therapy in an 11-year-old male with posterior uveitis. Am J Ophthalmol 2000; 130:240–241.
- Chiang MY, Sarkar M, Koppens JM, Milles J, Shah P. Exogenous Cushing’s syndrome and topical ocular steroids. Eye (Lond) 2006; 20:725–727.
- Diprolene prescribing information. Schering Corp 2005. www.theodora.com/drugs/diprolene_gel_005_schering.html. Accessed September 27, 2011.
- Villabona CV, Koh C, Panergo J, Reddy A, Fogelfeld L. Adrenocorticotropic hormone stimulation test during high-dose glucocorticoid therapy. Endocr Pract 2009; 15:122–127.
- Ortega E, Rodriguez C, Strand LJ, Segre E. Effects of cloprednol and other corticosteroids on hypothalamic-pituitary-adrenal axis function. J Int Med Res 1976; 4:326–337.
- Axelrod L. Glucocorticoid therapy. Medicine (Baltimore) 1976; 55:39–65.
- Schürmeyer TH, Tsokos GC, Avgerinos PC, et al. Pituitary-adrenal responsiveness to corticotropin-releasing hormone in patients receiving chronic, alternate day glucocorticoid therapy. J Clin Endocrinol Metab 1985; 61:22–27.
- Stewart PM. The adrenal cortex. In:Kronenberg HM, editor. Williams Textbook of Endocrinology. 11th ed. Philadelphia, PA: Saunders/Elsevier; 2008.
- Hopkins RL, Leinung MC. Exogenous Cushing’s syndrome and glucocorticoid withdrawal. Endocrinol Metab Clin North Am 2005; 34:371–384.
- Richter B, Neises G, Clar C. Glucocorticoid withdrawal schemes in chronic medical disorders. A systematic review. Endocrinol Metab Clin North Am 2002; 31:751–778.
Glucocorticoids are commonly prescribed by primary care physicians and specialists alike for multiple medical problems, acute as well as chronic.
However, these useful drugs have adverse effects on multiple endocrine systems, effects that include diabetes (or worsening of hyperglycemia in those with known diabetes), Cushing syndrome, adrenal suppression, osteoporosis (reviewed in the Cleveland Clinic Journal of Medicine in August 2010),1 and dyslipidemia. In addition, suppression of gonadotropins, growth hormone, and, acutely, thyrotropin can ensue.
The focus of this review is on the diabetogenic and adrenal suppressive effects of glucocorticoids and their management. We describe the rationale for choosing specific drugs to counter hyperglycemia, tests for determining adrenal suppression and systemic glucocorticoid absorption, and how and why to taper these drugs.
WIDELY USED DRUGS
Although glucocorticoids (often simply called steroids or corticosteroids, although not all steroids are corticosteroids, and not all corticosteroids are glucocorticoids) are the core treatment for adrenal insufficiency, in most cases they are prescribed for their anti-inflammatory effects. They act through multiple pathways at the cellular and molecular levels, suppressing the cascades that would otherwise result in inflammation and promoting pathways that produce anti-inflammatory proteins.2
In addition to formulations that are intended to have systemic effects, other, “local” formulations are made for specific conditions, such as intra-articular injections for arthritis, epidural injections for lumbar disk pain, eye drops for uveitis, nasal sprays for allergic rhinitis, inhalers for asthma, and topical ointments and creams for eczema. However, as we will discuss, even these preparations can have systemic effects.
GLUCOCORTICOID-INDUCED DIABETES IS COMMON
Glucocorticoids are the most common cause of drug-induced diabetes. Though the exact prevalence is not known, a few observations suggest that glucocorticoid-induced diabetes or hyperglycemia is common:
- In patients with rheumatoid arthritis, mean age 62 years, nearly 9% developed diabetes in the 2 years after starting glucocorticoid treatment, which was a higher rate than expected.3
- In nondiabetic patients with primary renal disease treated with prednisolone 0.75 mg/kg/day, 42% were found to have 2-hour post-lunch plasma glucose concentrations higher than 200 mg/dL but normal fasting glucose levels.4
- In a case-control study, the odds ratio of starting an oral hypoglycemic agent or insulin was 1.77 for patients receiving a hydrocortisone-equivalent dose of 1 to 39 mg/day, 3.02 for 40 to 79 mg/day, 5.82 for 80 to 119 mg/day, and 10.34 for 120 mg/day or more.5 (For a full discussion of glucocorticoid equivalents, see the section below on Cushing syndrome and adrenal suppression.)
- In patients with type 1 diabetes, prednisone 60 mg/day raised the blood glucose levels starting 6 hours after the prednisone dose.6
- Diabetic ketoacidosis and hyperosmolar nonketotic syndrome have been reported as a result of glucocorticoid treatment.7–9
GLUCOCORTICOIDS CAUSE DIABETES MAINLY VIA INSULIN RESISTANCE
The mechanism by which glucocorticoids cause diabetes predominantly involves insulin resistance rather than decreased insulin production. In fact, in a study in healthy volunteers, 10 hydrocortisone infusion resulted in higher insulin production than saline infusion did. (In high doses, however, glucocorticoids have been shown to decrease insulin secretion.11)
Normally, in response to insulin, the liver decreases its output of glucose. Glucocorticoids decrease the liver’s sensitivity to insulin, thereby increasing hepatic glucose output.12 They also inhibit glucose uptake in muscle and fat, reducing insulin sensitivity as much as 60% in healthy volunteers. This seems primarily due to a postreceptor effect, ie, inhibition of glucose transport.13–15
THE PEAK EFFECT OCCURS 4 TO 6 HOURS AFTER DOSING
To understand the optimal time for checking plasma glucose and to apply appropriate treatment, we should consider the pharmacokinetic profile of glucocorticoids.
Studied using the whole-blood lymphocyte proliferation technique, prednisone shows a peak effect at about 4 to 6 hours and a duration of action of 13 to 16 hours.16 This closely resembles what we see in terms of glucose excursion with this drug.17 Two studies of intravenous dexamethasone 10 mg showed that glucose levels rose within 4 hours of injection, but did not pursue this beyond that time frame.18,19
PATIENTS WITHOUT A PREVIOUS DIAGNOSIS OF DIABETES
Be alert for new-onset diabetes
For most diseases treated with glucocorticoids, clinicians can estimate in advance how long the patient will need to take the drug. We can arbitrarily classify the projected exposure as either short-term (3 to 4 weeks or less, such as a 6-day course of methylprednisolone for allergic conditions) or long-term (such as in transplant recipients to prevent rejection or to treat graft-vs-host disease). Hyperglycemia is a potential concern with both short-term and long-term treatment. However, guidelines on checking blood sugar levels, as opposed to relying on symptoms alone, are available only for long-term glucocorticoid treatment.
Patients beginning treatment should be warned of typical diabetes symptoms such as thirst and increased urination and, should these occur, to seek medical attention to have their blood glucose level checked. It is also reasonable to have them return in a week for a random postprandial plasma glucose test in the mid-afternoon.
Why this timing? In most once-daily regimens, glucocorticoids are given in the morning to prevent adrenal suppression (discussed below). In our experience, glucose levels start to rise mid-morning and continue to increase until bedtime. Measuring glucose levels 1 to 2 hours after lunch allows for both the glucocorticoid action and the carbohydrate absorption from lunch to reach their peaks. If hyperglycemia is going to happen, it should be detectable by then. A glucose level of 200 mg/dL or higher should prompt the practitioner to pursue this further.
If glucocorticoid treatment is to continue beyond 3 to 4 weeks, the only population for which there are published guidelines on managing glucocorticoid-related diabetes is transplant recipients. International consensus guidelines, published in 2003, suggest checking the fasting plasma glucose level once a week for the first 4 weeks after transplantation, then at 3 months, at 6 months, and then once a year.20
Though practical, this suggestion does not reflect the fact that glucocorticoids often do not affect fasting plasma glucose, especially if given once daily in the morning at doses of 30 mg or less of prednisone or its equivalent. These guidelines thus may not be applicable to other populations with glucocorticoid-induced diabetes.
The transplant guidelines do mention that an oral glucose tolerance test may be more sensitive, but this is often cumbersome to perform. We believe that checking random postprandial plasma glucose levels is helpful in this regard.
If the patient was at risk of developing diabetes even before receiving a glucocorticoid (for example, if he or she is overweight, has a family history of diabetes, or had a previous hemoglobin A1c of 5.7% or higher), then a fasting plasma glucose level of 126 mg/dL or higher or a hemoglobin A1c of 6.5% or higher might suffice to diagnose diabetes. Results should be confirmed on a separate day in the absence of unequivocal hyperglycemia. Fasting hyperglycemia can also be seen in patients receiving higher once-daily glucocorticoid doses—in our experience, an equivalent of prednisone 40 mg once a day in the morning— or twice-daily dosing.
A hemoglobin A1c checked less than 2 to 3 months after starting glucocorticoid treatment will not be sensitive in picking up glucocorticoid-induced diabetes if the patient did not have underlying diabetes.
Diet and exercise may not be practical
Though diet and exercise are important in managing diabetes, the condition for which the patient is receiving a glucocorticoid may prevent him or her from exercising, at least in the acute phase of the illness.
In addition, though the exact mechanism is not known, glucocorticoids increase hunger, and so decreasing food intake is not easy either. Nonetheless, patients should be familiarized with what carbohydrates are and should be advised to reduce their intake of them.
For suspected type 1 diabetes, start insulin
If type 1 diabetes is suspected, for example, in patients who are lean, younger than 30 years, or who had presented with diabetic ketoacidosis, then insulin should be started. In equivocal cases, insulin therapy can commence while testing is done for C-peptide, glutamic acid decarboxylase antibodies, islet cell antibodies, and insulinoma-associated protein antibodies.
Starting oral antidiabetic drugs
Some patients may have contraindications to specific drugs. For example, metformin (Glucophage) is contraindicated if the serum creatinine level is elevated, an abnormality that renal transplant patients may continue to have.
If the patient has no such contraindications, we have found the following medications suitable in view of their efficacy, low risk of hypoglycemia, or lack of distressing side effects. They will often lower glucose levels enough to achieve capillary blood glucose or fingerstick goals (discussed below). None of them has been specifically approved by the US Food and Drug Administration for glucocorticoid-induced diabetes, but they are approved for type 2 diabetes.
Guidelines from the American Association of Clinical Endocrinologists for type 2 diabetes call for starting monotherapy if the hemoglobin A1c is 6.5% to 7.5%, dual therapy if it is 7.6% to 9%, triple therapy if it is higher than 9% and the patient has no symptoms, and insulin if it is higher than 9% and the patient does have symptoms.22
In terms of estimated average glucose levels, these categories correspond to 140 to 169 mg/dL for monotherapy, 171 to 212 mg/dL for dual therapy, and higher than 212 mg/dL for triple therapy or insulin. Since estimated average levels also include fasting glucose levels (which are lower in glucocorticoid-induced diabetes compared with nonfasting levels), and because we use the American Diabetes Association general hemoglobin A1c goal of less than 7%, we believe that our suggestions below are reasonable.
We divide our recommendations according to initial random (ideally, 1- to 2-hour postprandial) plasma glucose levels.
If the random or 1- to 2-hour post-meal plasma glucose is lower than 220 mg/dL
In this situation the choices are:
- Metformin
- Dipeptidyl peptidase-4 (DPP-4) inhibitors (“gliptins”)
- Meglitinides (“glinides”). The guidelines on new-onset diabetes after transplantation point out that meglitinides may be the safest agents apart from insulin in the renal transplant population, but does acknowledge that efficacies of different oral agents have not been compared in this group.20
- Glucagon-like protein-1 (GLP-1) agonists
- Sulfonylureas. However, the longer-acting forms such as glimepiride (Amaryl) are not suitable if the fasting plasma glucose is not affected.
We have not used thiazolidinediones (“glitazones”) routinely because they can cause weight gain and edema—problems that are already seen with the use of steroids—and have a slower onset of action.
If the random or 1- to 2-hour post-meal plasma glucose is 220 to 300 mg/dL
Often, a combination of drugs or insulin (see below) is needed. However, you can start with one agent and add a second agent within 2 or 3 months (as is recommended for type 2 diabetes).22,23 The following combinations of the agents listed above are supported by published guidelines for type 2 diabetes:
- Metformin plus a sulfonylurea22,23
- Metformin plus a glinide22
- Metformin plus a GLP-1 agonist23
- Metformin plus a DPP-4 inhibitor.22
If the random or 1- to 2-hour post-meal plasma glucose is higher than 300 mg/dL
In our experience, if their plasma glucose levels are this high, patients are experiencing frank symptoms of hyperglycemia.
Insulin addresses those symptoms and avoids the prolonged wait that often results from unsuccessfully starting one agent and then adding another. Of all the available drugs, insulin is the only one that can be used despite multiple underlying illnesses; it does not cause a lot of drug interactions, and the dose can be adjusted upward and downward in increments to fit the patient’s needs, especially when a larger glucocorticoid load is given up front and then is tapered either slowly or rapidly. However, it can cause hypoglycemia and weight gain.
The initial total daily dose of insulin can be based on the patient’s weight. A starting total daily dose of 0.15 to 0.3 U/kg is reasonable— on the lower end if only the postprandial glucose levels are elevated, and on the higher end if both fasting and postprandial glucose levels are affected.
If fasting glucose levels are not elevated, then Neutral Protamine Hagedorn insulin (which is intermediate-acting) or a premixed combination of an intermediate-acting plus a fast- or short-acting insulin can be given once a day before breakfast, or even before lunch if the glucose levels start to rise only after lunch.
If both the fasting and the postprandial glucose levels are elevated, regimens similar to those for type 1 or insulin-requiring type 2 diabetes can be used, except that the ratios of the doses are tilted more toward covering postprandial than fasting hyperglycemia:
- Long-acting insulin plus prandial insulin, in a ratio of 30:70 to 50:50. As glucocorticoids are tapered, the long-acting insulin may have to be discontinued while the prandial doses are continued, since the fasting glucose level decreases first.
- Premixed insulins, with one-half to two-thirds of the dose given before breakfast and the rest before the evening meal, with the possibility of a third injection before lunch. As glucocorticoids are tapered, the evening dose is tapered first.
- Intermediate-acting insulin plus short- or fast-acting insulin in the morning (these two will make up one-half to two-thirds of the total daily dose), short- or fast-acting insulin before the evening meal, and intermediate-acting insulin at bedtime. As glucocorticoids are tapered, the bedtime insulin is tapered first.
Capillary blood glucose (fingerstick) checks
The timing and frequency of fingerstick checks depend on the treatment.
Though postprandial testing is ideal, it is often not practical or convenient. Before lunch, before dinner, and at bedtime are good alternatives since they reflect the pattern of glucose rise throughout the day. For patients on diet and exercise with or without agents other than insulin, testing once or twice a day is reasonable, rotating times before meals (including fasting if this time is affected) and at bedtime.
For patients on insulin, checking two to four times a day initially would help match insulin doses with glucose excursions. For continued care, the American Diabetes Association recommends fingerstick checks three times daily in patients on multiple insulin injections, but it has no specific recommendations for those on once-a-day insulin.21 We have been recommending that our patients on once-daily insulin check at least twice a day.
Goal fingerstick glucose levels that we use are in accordance with the American Diabetes Association guidelines for diabetes in general21:
- Before meals 70 to 130 mg/dL or
- 1 to 2 hours after meals < 180 mg/dL.
During steroid taper, if the glucocorticoid dose is in the lower range (eg, a prednisone-equivalent dose of approximately 7.5 mg per day or less), the fingerstick glucose levels are at the lower end of the target range, and the patient is on a single antidiabetic agent that does not often cause hypoglycemia (eg, metformin), then it is reasonable to ask the patient to not take the antidiabetic medication for 3 to 7 days while continuing to check fingersticks to see if it needs to be resumed. Patients on agents that can cause hypoglycemia need to check more often during the 1 to 3 days after the glucocorticoid dose reduction, as it may take this much time for the glycemic effect to diminish and to adjust the diabetes medication to the appropriate dose.
STARTING GLUCOCORTICOIDS IN PATIENTS WITH KNOWN DIABETES
Fingerstick checks more often
Most patients will already have a glucose meter. They should be instructed to check as discussed above if they do not have a previous diagnosis of diabetes, or to continue as they are doing if they are already checking more often. Patients who have been checking only fasting levels should be instructed to check later in the day, either before or 1 to 2 hours after meals, as discussed above. Patients on oral medications may need additional oral agents or insulin.
Adjust medications if glucose is not at goal
Patients with type 2 diabetes treated with diet and exercise alone can be started on the medications discussed above if their fingerstick readings are not at goal.
If they are already on insulin, we advise them to increase the short- or fast-acting insulins and the morning intermediate-acting insulin by at least 10% to 20% as soon as an elevation in glucose is detected. Long-acting insulin or nighttime intermediate-acting insulin should be increased if fasting glucose levels are affected.
Insulin requirements can double depending on the glucocorticoid dose. In patients with type 1 diabetes who were given prednisone 60 mg orally for 3 days, mean blood glucose levels increased from a baseline of 110 mg/dL at baseline to 149 mg/dL on the days on prednisone.6 The average blood glucose level remained elevated at 141 mg/dL on the day after the last dose of prednisone. The insulin dose increased by 31% to 102% (mean 69%).
CUSHING SYNDROME AND ADRENAL SUPPRESSION
Unlike glucocorticoid-induced diabetes, in which the dilemma is often when to initiate antidiabetic treatment, the question for patients in whom Cushing syndrome or adrenal suppression has developed is when to discontinue glucocorticoids.
Adrenal suppression for the most part goes hand in hand with exogenous Cushing syndrome. If cushingoid features develop, we can infer that the dose of exogenous glucocorticoid exceeds the physiologic needs. This supraphysiologic dosing also leads to suppression of endogenous cortisol production. The suppression occurs at the level of the hypothalamus and pituitary gland, with subsequent atrophy of the part of the adrenal cortex that produces endogenous glucocorticoids.
To understand further the concept of supraphysiologic dosing, the following interconversion of systemic glucocorticoid effects is helpful24,25:
However, there is not much information on interconversion for the local preparations (intra-articular, epidural, inhaled, topical).
Moreover, the definition of supraphysiologic dosing seems to be evolving. Though a total hydrocortisone-equivalent dose of 30 mg/day is still often touted as physiologic replacement, many patients require less. Several studies in the early 1990s, mostly in children and adolescents, showed the mean daily cortisol production rate to be 4.8 to 6.8 mg/m2/day, or closer to 10 to 15 mg/day.26–28 For purposes of this discussion, a physiologic dose will be defined as up to 30 mg hydrocortisone per day or its equivalent.
Adrenal suppression vs insufficiency
Adrenal suppression is often confused with adrenal insufficiency.
Adrenal suppression occurs when cortisol production is decreased because of the presence of exogenous glucocorticoids or other drugs, such as megestrol acetate (Megace), that act on the glucocorticoid receptor. Another situation beyond the scope of this review is excess endogenous cortisol production by an adrenal adenoma or adrenal carcinoma that causes suppression of the contralateral adrenal gland.29
In contrast, adrenal insufficiency is caused by failure of the adrenal gland to produce cortisol as a result of an innate disorder of the adrenal gland (eg, Addison disease) or pituitary gland (eg, pituitary surgery).
Hence, endogenous cortisol production in a patient taking supraphysiologic doses of exogenous glucocorticoids may be suppressed. Recovery of endogenous cortisol production is expected after stopping the exogenous glucocorticoid, though the time to recovery can vary and the patient can be adrenally insufficient if the glucocorticoid is stopped abruptly.
In addition, during times of intercurrent illness, a patient with adrenal suppression may be relatively adrenally insufficient and may need larger doses (“stress doses”) of glucocorticoids, since the adrenal glands may be unable to mount a stress response.29
Local steroids can suppress the adrenal glands
Glucocorticoids are the most common cause of Cushing syndrome. Oral formulations such as dexamethasone, prednisone, and hydrocortisone taken in supraphysiologic doses and for prolonged durations are easily recognized as obvious causes of Cushing syndrome. However, intra-articular, epidural, inhaled, nasal, ocular, and topical steroids—so-called local preparations—have also been linked to Cushing syndrome, and physicians are less likely to recognize them as causes.30–38
In a study in 16 pediatric patients with asthma and 48 controls, inhaled beclomethasone dipropionate (Qvar) 300 to 500 μg daily resulted in adrenal suppression in 100% of patients after 6 to 42 months, as determined by an insulin tolerance test.30
The topical steroid betamethasone (Diprosone) carries a warning that systemic absorption of topical steroids can cause adrenal suppression.39 Intra-articular, intranasal, epidural, and ocular routes are also reported to cause adrenal suppression.32–38
When is adrenal suppression more likely?
Adrenal suppression is more likely in the following situations:
- Longer duration of treatment. Studies have shown that exposure to supraphysiologic steroid doses for 2 weeks or less might already suppress the adrenal glands, but the clinical significance of this is unclear since some recovery already occurs a few days after the glucocorticoids are discontinued.31,40
- Supraphysiologic doses, stronger formulations, longer-acting formulations.41
When is adrenal suppression less likely?
Adrenal suppression is less likely in the following situations:
- Regimens that mimic the diurnal rhythm of cortisol (higher dose in the morning, lower dose in the afternoon)42
- Alternate-day dosing of steroids.43
Steroid withdrawal vs adrenal insufficiency
Another phenomenon that can be confused with adrenal insufficiency or glucocorticoid insufficiency is steroid withdrawal, in which patients experience lethargy, muscle aches, nausea, vomiting, and postural hypotension as glucocorticoids are tapered and their effects wane.42 Increasing the glucocorticoid dose for presumed adrenal insufficiency may delay recovery of the adrenal function and would have to be weighed against the patient’s symptoms.
The following may help distinguish the two: if the patient is on supraphysiologic glucocorticoid doses, then he or she is not glucocorticoid-deficient and is likely suffering from steroid withdrawal. At this point, patients may just need reassurance, symptomatic treatment, or if necessary, a brief (1-week) increase of the previous lowest dose, followed by reevaluation.
With local glucocorticoid preparations that may be systemically absorbed, however, there is no good way of estimating dose equivalence. In these situations, the decision to simply reassure the patient or give symptomatic treatment—as opposed to giving low-dose oral glucocorticoids such as hydrocortisone 5 to 10 mg daily for a week followed by reevaluation— depends on the severity of symptoms and whether the patient has quick access to medical attention should he or she develop an intercurrent illness.
Identifying patients at risk of adrenal suppression
Patients presenting with weight gain or symptoms suggesting Cushing syndrome should be asked about steroid intake and should be prompted to recall possible nonoral routes. In addition, patients presenting with muscle aches and fatigue—symptoms of steroid withdrawal— may have received unrecognized local glucocorticoids that were systemically absorbed, now with diminishing effects.
The ACTH stimulation test for adrenal recovery
Testing can be done to see if the adrenal glands have recovered and glucocorticoid therapy can be discontinued (see Tapering from glucocorticoids, below).
The test most often used is the corticotropin (ACTH) stimulation test. Since the suppression is at the level of the hypothalamus and the pituitary gland, the ACTH stimulation test is an indirect method of assessing hypothalamic and pituitary function in the context of glucocorticoid-induced adrenal suppression. It has good correlation with the insulin tolerance test, the gold-standard test for an intact hypothalamic-pituitary-adrenal axis.
The synthetic ACTH cosyntropin (Cortrosyn) 250 μg is injected intravenously or intramuscularly, and a cortisol level is drawn at baseline and 30 and 60 minutes later. Other doses such as 1 μg or 10 μg have been reported but are not yet widely accepted. A cortisol level of greater than 18 to 20 μg/dL at any time point shows that the adrenals have regained function and the steroids may be discontinued.42 If adrenal suppression persists, weaning from steroids should continue.
In reality, it may not be possible or practical to do an ACTH stimulation test, as not all physicians’ offices have a supply of cosyntropin or the manpower to perform the test correctly. In these cases, weaning can progress with monitoring of symptoms.
Testing for synthetic glucocorticoids in the urine and serum can demonstrate systemic absorption and may be helpful in patients who do not recall receiving steroids.33
Tapering from glucocorticoids
Several tapering schedules have been suggested (although not necessarily validated). Whether and how to taper depend on how long the glucocorticoid has been taken.
If taken for less than 1 week, glucocorticoids can be stopped without tapering, regardless of the dose.
If taken for 1 to 3 weeks, the decision to taper depends on the clinician’s assessment of the patient’s general health or constitution and the illness for which the glucocorticoid was prescribed. For example, if the underlying disease is less likely to flare with a gradual dose reduction, then tapering would be suitable.44
If taken for more than 3 weeks, the practice has been a more rapid taper at the beginning until a physiologic dose is reached. How quickly to reduce the dose depends on whether the underlying illness is expected to flare up, or if the patient might experience steroid withdrawal symptoms.
One schedule is to lower the glucocorticoid dose by an amount equivalent to prednisolone 2.5 mg every 3 to 4 days when above the physiologic dose, then to taper more slowly by 1 mg every 2 to 4 weeks.44 Once the physiologic dose is reached, one can switch to the equivalent dose of hydrocortisone and decrease the dose by 2.5 mg a week until a daily dose of 10 mg a day is reached and maintained for 2 to 3 months, and then perform a test of adrenal function (see above).44 Passing the test implies that the adrenal glands have recovered and the glucocorticoid can be stopped.
Another option is to switch to alternate-day therapy once a physiologic dose is reached and to test 8:00 am cortisol levels, continuing the glucocorticoid and retesting in 4 to 6 weeks if the value is less than 3 μg/dL; stopping the glucocorticoid if the value is higher than 20 μg/dL; and performing an ACTH stimulation test for values in between.45
A review of other tapering regimens for chronic diseases, mostly pulmonary, did not find enough evidence to recommend one particular schedule over another.46 The tapering schedule may have to be adjusted to prevent disease flare and symptoms of steroid withdrawal.
Locally administered steroids. Since the equivalence of systemically absorbed local glucocorticoids is not known, these patients are likely to present when they have symptoms of steroid withdrawal. In this situation, testing adrenal function will help.
- Dore RK. How to prevent glucocorticoid-induced osteoporosis. Cleve Clin J Med 2010; 77:529–536.
- Rhen T, Cidlowski JA. Antiinflammatory action of glucocorticoids—new mechanisms for old drugs. N Engl J Med 2005; 353:1711–1723.
- Panthakalam S, Bhatnagar D, Klimiuk P. The prevalence and management of hyperglycaemia in patients with rheumatoid arthritis on corticosteroid therapy. Scott Med J 2004; 49:139–141.
- Uzu T, Harada T, Sakaguchi M, et al. Glucocorticoid-induced diabetes mellitus: prevalence and risk factors in primary renal diseases. Nephron Clin Pract 2007; 105:c54–c57.
- Gurwitz JH, Bohn RL, Glynn RJ, Monane M, Mogun H, Avorn J. Glucocorticoids and the risk for initiation of hypoglycemic therapy. Arch Intern Med 1994; 154:97–101.
- Bevier WC, Zisser HC, Jovanovic L, et al. Use of continuous glucose monitoring to estimate insulin requirements in patients with type 1 diabetes mellitus during a short course of prednisone. J Diabetes Sci Technol 2008; 2:578–583.
- Cagdas DN, Paç FA, Cakal E. Glucocorticoid-induced diabetic ketoacidosis in acute rheumatic fever. J Cardiovasc Pharmacol Ther 2008; 13:298–300.
- Bedalov A, Balasubramanyam A. Glucocorticoid-induced ketoacidosis in gestational diabetes: sequela of the acute treatment of preterm labor. A case report. Diabetes Care 1997; 20:922–924.
- Yang JY, Cui XL, He XJ. Non-ketotic hyperosmolar coma complicating steroid treatment in childhood nephrosis. Pediatr Nephrol 1995; 9:621–622.
- Nielsen MF, Caumo A, Chandramouli V, et al. Impaired basal glucose effectiveness but unaltered fasting glucose release and gluconeogenesis during short-term hypercortisolemia in healthy subjects. Am J Physiol Endocrinol Metab 2004; 286:E102–E110.
- Matsumoto K, Yamasaki H, Akazawa S, et al. High-dose but not low-dose dexamethasone impairs glucose tolerance by inducing compensatory failure of pancreatic beta-cells in normal men. J Clin Endocrinol Metab 1996; 81:2621–2626.
- Rizza RA, Mandarino LJ, Gerich JE. Cortisol-induced insulin resistance in man: impaired suppression of glucose production and stimulation of glucose utilization due to a postreceptor detect of insulin action. J Clin Endocrinol Metab 1982; 54:131–138.
- Meyuhas O, Reshef L, Gunn JM, Hanson RW, Ballard FJ. Regulation of phosphoenolpyruvate carboxykinase (GTP) in adipose tissue in vivo by glucocorticoids and insulin. Biochem J 1976; 158:1–7.
- Tappy L, Randin D, Vollenweider P, et al. Mechanisms of dexamethasone-induced insulin resistance in healthy humans. J Clin Endocrinol Metab 1994; 79:1063–1069.
- Pagano G, Cavallo-Perin P, Cassader M, et al. An in vivo and in vitro study of the mechanism of prednisone-induced insulin resistance in healthy subjects. J Clin Invest 1983; 72:1814–1820.
- Magee MH, Blum RA, Lates CD, Jusko WJ. Pharmacokinetic/pharmaco-dynamic model for prednisolone inhibition of whole blood lymphocyte proliferation. Br J Clin Pharmacol 2002; 53:474–484.
- Burt MG, Roberts GW, Aguilar-Loza NR, Frith P, Stranks SN. Continuous monitoring of circadian glycemic patterns in patients receiving prednisolone for COPD. J Clin Endocrinol Metab 2011; 96:1789–1796.
- Hans P, Vanthuyne A, Dewandre PY, Brichant JF, Bonhomme V. Blood glucose concentration profile after 10 mg dexamethasone in non-diabetic and type 2 diabetic patients undergoing abdominal surgery. Br J Anaesth 2006; 97:164–170.
- Pasternak JJ, McGregor DG, Lanier WL. Effect of single-dose dexamethasone on blood glucose concentration in patients undergoing craniotomy. J Neurosurg Anesthesiol 2004; 16:122–125.
- Davidson J, Wilkinson A, Dantal J, et al; International Expert Panel. New-onset diabetes after transplantation: 2003 international consensus guidelines. Proceedings of an international expert panel meeting. Barcelona, Spain, 19 February 2003. Transplantation 2003; 75(suppl 10):SS3–SS24.
- American Diabetes Association. Standards of medical care in diabetes— 2011. Diabetes Care 2011; 34(suppl 1):S11–S61.
- Rodbard HW, Jellinger PS, Davidson JA, et al. Statement by an American Association of Clinical Endocrinologists/American College of Endocrinology consensus panel on type 2 diabetes mellitus: an algorithm for glycemic control. Endocr Pract 2009; 15:540–559.
- Nathan DM, Buse JB, Davidson MB, et al; American Diabetes Association; European Association for Study of Diabetes. Medical management of hyperglycemia in type 2 diabetes: a consensus algorithm for the initiation and adjustment of therapy: a consensus statement of the American Diabetes Association and the European Association for the Study of Diabetes. Diabetes Care 2009; 32:193–203.
- Axelrod L. Corticosteroid therapy. In:Becker KL, editor. Principles and Practice of Endocrinology and Metabolism. 3rd ed. Philadelphia, PA: Lippincott Williams and Wilkins; 2000:752–763.
- Ferri FF, editor. Practical Guide to the Care of the Medical Patient. 8th ed. Philadelphia, PA: Mosby/Elsevier; 2011.
- Kerrigan JR, Veldhuis JD, Leyo SA, Iranmanesh A, Rogol AD. Estimation of daily cortisol production and clearance rates in normal pubertal males by deconvolution analysis. J Clin Endocrinol Metab 1993; 76:1505–1510.
- Linder BL, Esteban NV, Yergey AL, Winterer JC, Loriaux DL, Cassorla F. Cortisol production rate in childhood and adolescence. J Pediatr 1990; 117:892–896.
- Esteban NV, Loughlin T, Yergey AL, et al. Daily cortisol production rate in man determined by stable isotope dilution/mass spectrometry. J Clin Endocrinol Metab 1991; 72:39–45.
- Lansang MC, Quinn SL. Adrenal suppression. BMJ BestPractice 2010. http://bestpractice.bmj.com/best-practice/monograph/863/diagnosis/stepby-step.html. Accessed August 19, 2011.
- Zöllner EW. Hypothalamic-pituitary-adrenal axis suppression in asthmatic children on inhaled corticosteroids (part 2)—the risk as determined by gold standard adrenal function tests: a systematic review. Pediatr Allergy Immunol 2007; 18:469–474.
- Schuetz P, Christ-Crain M, Schild U, et al. Effect of a 14-day course of systemic corticosteroids on the hypothalamic-pituitary-adrenal-axis in patients with acute exacerbation of chronic obstructive pulmonary disease. BMC Pulm Med 2008; 8:1.
- Kay J, Findling JW, Raff H. Epidural triamcinolone suppresses the pituitary-adrenal axis in human subjects. Anesth Analg 1994; 79:501–505.
- Lansang MC, Farmer T, Kennedy L. Diagnosing the unrecognized systemic absorption of intra-articular and epidural steroid injections. Endocr Pract 2009; 15:225–228.
- Duclos M, Guinot M, Colsy M, et al. High risk of adrenal insufficiency after a single articular steroid injection in athletes. Med Sci Sports Exerc 2007; 39:1036–1043.
- Bong JL, Connell JM, Lever R. Intranasal betamethasone induced acne and adrenal suppression. Br J Dermatol 2000; 142:579–580.
- Atabek ME, Pirgon O, Unal E. Pituitary-adrenal axis suppression due to topical steroid administration in an infant. Pediatr Int 2007; 49:242–244.
- Ozerdem U, Levi L, Cheng L, Song MK, Scher C, Freeman WR. Systemic toxicity of topical and periocular corticosteroid therapy in an 11-year-old male with posterior uveitis. Am J Ophthalmol 2000; 130:240–241.
- Chiang MY, Sarkar M, Koppens JM, Milles J, Shah P. Exogenous Cushing’s syndrome and topical ocular steroids. Eye (Lond) 2006; 20:725–727.
- Diprolene prescribing information. Schering Corp 2005. www.theodora.com/drugs/diprolene_gel_005_schering.html. Accessed September 27, 2011.
- Villabona CV, Koh C, Panergo J, Reddy A, Fogelfeld L. Adrenocorticotropic hormone stimulation test during high-dose glucocorticoid therapy. Endocr Pract 2009; 15:122–127.
- Ortega E, Rodriguez C, Strand LJ, Segre E. Effects of cloprednol and other corticosteroids on hypothalamic-pituitary-adrenal axis function. J Int Med Res 1976; 4:326–337.
- Axelrod L. Glucocorticoid therapy. Medicine (Baltimore) 1976; 55:39–65.
- Schürmeyer TH, Tsokos GC, Avgerinos PC, et al. Pituitary-adrenal responsiveness to corticotropin-releasing hormone in patients receiving chronic, alternate day glucocorticoid therapy. J Clin Endocrinol Metab 1985; 61:22–27.
- Stewart PM. The adrenal cortex. In:Kronenberg HM, editor. Williams Textbook of Endocrinology. 11th ed. Philadelphia, PA: Saunders/Elsevier; 2008.
- Hopkins RL, Leinung MC. Exogenous Cushing’s syndrome and glucocorticoid withdrawal. Endocrinol Metab Clin North Am 2005; 34:371–384.
- Richter B, Neises G, Clar C. Glucocorticoid withdrawal schemes in chronic medical disorders. A systematic review. Endocrinol Metab Clin North Am 2002; 31:751–778.
KEY POINTS
- Nonfasting plasma glucose levels are more sensitive than fasting levels for detecting glucocorticoid-induced diabetes, and antidiabetic agents that have greater effects on random postprandial plasma glucose levels are more suitable than those that mostly affect fasting levels.
- Even those glucocorticoid formulations that are not intended to have systemic effects (eg, eye drops, inhaled corticosteroids, creams, intra-articular injections) can cause adrenal suppression and, therefore, if they are discontinued, steroid withdrawal and adrenal insufficiency.
- Needed are studies comparing antidiabetic regimens for glucocorticoid-induced hyperglycemia and studies comparing glucocorticoid tapering schedules for adrenal suppression to determine the best way to manage these adverse effects.
Nocturia in the elderly: A wake-up call
Nocturia is common, but elderly patients infrequently volunteer this complaint, and even when they do, some clinicians may dismiss it as simply a part of aging. Nevertheless, nocturia causes significant distress and impairment of quality of life. It is associated with very serious consequences such as depression, social isolation, and a higher risk of death.
In this article, we review the concepts behind frequent nighttime voiding in older adults. We will start with two case scenarios to aid in understanding these concepts; near the end of the article, we will discuss the most appropriate management strategies for these two patients.
CASE SCENARIOS
Case 1: An 82-year-old man with fatigue
An 82-year-old obese white man with a history of hypertension, diabetes, and benign prostatic hyperplasia comes in to see his primary care provider, complaining of fatigue. He wakes up tired and has difficulty completing his daytime tasks. He gets up every 1 to 2 hours at night to urinate and has slow urinary flow and a feeling of incomplete bladder emptying.
See related patient education material
He says his wife has been increasingly bothered by his loud snoring. Recently, he had a car accident when he fell asleep while driving.
Case 2: An 85-year-old woman with incontinence
An 85-year-old white woman is in her family physician’s office with a primary complaint of waking up at least four times at night to urinate, and often ends up soaking her bed or adult diapers. She is bothered by urinary urgency and frequency during the day as well. She denies dysuria and hematuria.
She has a history of hypertension and urinary incontinence, and she has seven children. Her current medications are diltiazem (Cardizem), metoprolol (Toprol), and oxybutynin (Ditropan).
In these two cases, what would account for the nocturia? What would be the best way to help these patients?
THE NORM, NOT THE EXCEPTION
Although nocturia is defined as an awakening by the need to urinate even once in a night, many experts consider that it begins to be clinically significant only when the patient voids at least twice during the night.1
In older adults, nocturia is the norm rather than the exception. Studies done between 1990 and 2009 found that 68.9% to 93% of men age 70 and older get up at least once a night to void. The prevalence in women is somewhat lower, at 74.1% to 77.1%.2 Clinically significant nocturia is present in a majority of the elderly: more than 60% of both men and women.3
An Austrian study4 reported that elderly men got up to urinate a mean of 2.8 times per night, while women got up significantly more often—3.1 times. Women were also bothered more by this symptom, and their quality of life was significantly more decreased.
In another study,5 whites had a significantly higher nocturia ratio (ratio of nighttime urine volume to the 24-hour urine volume) than Asians. Asians, on the other hand, had a significantly higher nocturnal bladder capacity index than whites. (See below for definitions of the various indices of nocturia.) This information implies that nocturia may be a more prominent problem for elderly whites than for other racial groups.
In an epidemiologic study in Sweden,6 the death rate was as much as twice as high in both men and women who had three or more nocturnal voids, even after taking into account the influence of cardiac disease, diabetes mellitus, and stroke.
If nocturia is not addressed in the physician-patient encounter, patients may try to “self-manage” it by restricting their fluid intake or by limiting their social exposure,7 with limited success and with unwanted social isolation.
WHAT CAUSES NOCTURIA?
Advancing age is primary among these factors. Age-related structural changes in the urinary system include decreased functional bladder capacity, a decreased maximum urinary flow rate,6 a decreased ability to postpone urination,8 and an age-related increase in postvoiding residual urine volume.9 The aging kidney is also less able to concentrate urine. Also implicated are histologic changes in the detrusor muscle10 that lead to diminished bladder compliance and, together with detrusor overactivity, result in increased urinary frequency.
Nocturnal polyuria or nocturnal urine overproduction is common in patients with nocturia.11
Although the pathophysiology of nocturnal polyuria is still unclear, some investigators believe that low levels of antidiuretic hormone (ADH) at night are involved, reflecting an alteration in the circadian rhythm seen in diurnal plasma arginine vasopressin levels.12 In patients with nocturnal polyuria, ADH levels drop to very low or undetectable levels at night, which increases nocturnal urine output. In some extreme cases, the low to absent levels of ADH increase nocturnal voiding to 85% of the total 24-hour urine volume.13
Other causes of nocturnal polyuria include mobilization of fluids in patients with edema,14 and autonomic dysfunction. Other biochemical changes that contribute to nocturia include a decrease in nighttime plasma melatonin levels, an increase in nighttime plasma catecholamine levels, an increase in nighttime plasma natriuretic peptide levels, an increase in blood pressure, and an increase in total urine volume.15
A decreased ability to store urine also leads to nocturia. This is caused by decreased nocturnal bladder capacity, more irritative symptoms, and comorbid conditions such as overactive bladder, pelvic floor laxity resulting in pelvic organ prolapse, and, in men, benign prostatic hyperplasia.
Neural inputs to the bladder can also be impaired, as in patients who have diabetes mellitus or spinal stenosis, leading to chronic urinary retention, detrusor dysfunction, nocturia, and incontinence.
WHICH PATIENTS ARE AT RISK?
Obesity is associated with a higher incidence of moderate to severe nocturia.15 Studies have shown that the higher the body mass index, the greater the number of nighttime voids, especially in women.16
Habitually eating at night, with poor daytime appetite, is shown to be associated with increased nighttime diuresis.
Obstructive sleep apnea17 and untreated depressive symptoms such as frequent napping18 are also associated with moderate to severe nocturia.19
Higher systolic blood pressures are associated with more urine production at night. Plasma ADH regulation is also altered, which contributes to nocturnal polyuria.21
Other comorbid conditions associated with nocturia include recurrent cystitis, lung disease, congestive heart failure, neurodegenerative conditions (eg, Alzheimer disease and parkinsonism), and chronic kidney disease.21
Drugs associated with nocturia include cholinesterase inhibitors (for dementia),22 beta-blockers,23 and calcium channel blockers.24
Lifestyle factors. Alcohol and coffee have shown either no or only a mild diuretic effect. Smoking has not been shown to be associated with nocturia.15
Seasonal differences also exist, with increased frequency of nocturia in the winter.25
WHAT ARE THE CLINICAL CONSEQUENCES OF NOCTURIA?
Quality of life can be profoundly affected, and if nocturia is left untreated, it may lead to morbidity and even death. Elderly patients may feel simultaneously debilitated, frustrated, distressed, and puzzled. Nocturia may also increase their fear of falling and may negatively affect personal relationships.26
Falls, injuries. Nocturia exposes elderly patients to injuries such as hip fractures due to falling, significantly increasing the incidence of this injury.26 This occurs as elderly patients get up from bed and walk to the bathroom to void.27 In addition, during the day, superficial and fragmented sleep leads to daytime sleepiness and impaired perception and balance, also increasing the risk of falls.28 The complications of immobility and the need for surgery in many cases lead to debility, increased risk of infections, decubitus ulcers, and death. The risk of hip fractures can lead elderly patients with nocturia to associate this symptom with a fear of falling and can alter their concept of their own age (“Nocturia makes me feel old”),29 further diminishing quality of life.
The estimated medical cost of nocturia-associated falls in the elderly is about $1.5 billion per year, part of the $61 billion in lost productivity due to nocturia in adults.30
Long-term complications (eg, debilitation, poor sleep, obesity, decreased energy), increase the overall mortality rate, especially in patients who report voiding more than three times per night.29 Elderly patients with nocturia also have a greater need for emergency care.31
Nocturia also complicates other comorbid conditions, such as dementia, which increases the risk of urinary incontinence.32 In patients who have had a stroke, nocturia is the most frequent lower urinary tract symptom, and represents a major impact on daily life.33
Sleep disturbance is another important consequence. In one survey,34 nocturia was cited as a cause of poor sleep four times more often than the cause cited next most often, ie, pain. Because the elderly patient is awakened from sleep numerous times throughout the night, nocturia leads to more fatigue,35 lower energy levels, and poorer quality of sleep.36 Depression may be linked to poor sleep, as men with two or more nocturnal episodes were shown to be six times more likely to experience depression.
The patient is not the only person who loses sleep: so do the patient’s family members or sleeping partner.7 It is therefore not surprising that sleep disruption caused by nocturia has been cited as a principal reason for admitting older relatives to care homes.37
The risk of death is higher for elderly patients with coronary heart disease if they have nocturia. The causative link is the hemodynamic changes (increases in blood pressure and heart rate) that accompany awakening and arising, which may cause cardiovascular strain and lead to cardiovascular events. The 12-year survival rate has been shown to be significantly lower in patients with nighttime voiding, making nocturia a highly significant independent predictor of death in coronary heart disease patients.38
HOW TO EVALUATE AN OLDER ADULT WHO PRESENTS WITH NOCTURIA
A thorough history and physical examination are crucial in diagnosing nocturia. The goal is to identify any treatable underlying condition, such as diabetes mellitus, obstructive sleep apnea, diabetes insipidus, overactive bladder, benign prostatic hyperplasia, urinary tract infection, and congestive heart failure. Laboratory tests and imaging studies can help rule out these underlying conditions.
Other important facets in the history that must be elicited are medication use, patterns of fluid intake, and a history of other urinary complaints.39
A voiding diary and indices of nocturia
A voiding diary is extremely useful and should be used whenever possible. Episodes of incontinence, time of voids, volume voided, and frequency and volume of fluid intake are recorded. From the raw data, one can determine the following:
Total nocturnal urine volume, ie, the sum volume of the nighttime voids
Maximum voided volume, ie, the largest single recorded volume voided in a 24-hour period
Nocturia index, ie, the total nocturnal urine volume divided by the maximum voided volume. A nocturia index greater than 1 shows that nocturnal urine production is greater than the functional bladder capacity. Clinically significant nocturia is observed in patients with a nocturia index of 2.1 or greater.
Nocturnal polyuria index, ie, total nocturnal urine volume divided by the 24-hour urine output. A nocturnal polyuria index higher than 33% implies nocturnal polyuria.40
Nocturnal bladder capacity index, ie, the actual number of nightly voids minus the predicted number of nightly voids, which in turn is calculated as the nocturia index minus 1.
It is especially important to encourage patients to make a voiding diary, as some patients may find this cumbersome, and compliance can be low unless its importance is emphasized. A diary over 7 days usually gives meaningful data. The results from the diary typically confirm the presence of nocturnal polyuria or a decrease in bladder capacity, influencing management.41
WHAT ARE THE TREATMENT OPTIONS?
Therapy must be directed at the primary cause, addressing any underlying conditions that can contribute to nocturia. Examples39:
- Tight control of blood sugar for patients with diabetes mellitus
- Treatment of diabetes insipidus
- Referral for patients with primary polydipsia
- Management of hypercalcemia and hypokalemia
- A survey of medications
- Treatment of infections.
Nonpharmacologic measures
Tailored behavioral therapy can also be instituted, but the patient needs to have realistic expectations, as these measures are rarely effective alone.
Avoiding nighttime fluid intake, including alcohol and caffeine, has shown promise.
Wearing compression stockings and elevating the legs in the afternoon decrease the retention of fluid that otherwise would return to the circulation at night.
Identifying and eliminating nighttime influences that disturb sleep has variable efficacy. The use of continuous positive airway pressure helps to treat sleep apnea. Moderate exercise, reducing nonsleep time spent in bed,42 and sleeping in a warm bed43 to decrease cold diuresis have also been shown to improve sleep quality.44 Patients with nocturia may have a disrupted circadian rhythm, and phototherapy may help resynchronize the diurnal rhythm and melatonin secretion.
Pharmacotherapy
Pharmacotherapy of nocturia includes desmopressin (DDAVP) to manage nocturnal polyuria and antimuscarinic agents to manage the patient’s decreased ability to store urine. Alpha-blockers such as tamsulosin (Flomax) and 5-alpha-reductase inhibitors such as finasteride (Proscar) are used for men with benign prostatic hyperplasia. Novel and second-line therapies include diuretics such as furosemide (Lasix), cyclooxygenase-2 inhibitors, as well as botulinum toxin injected directly into the detrusor muscle for overactive bladder.45
Desmopressin in a low oral dose (0.1–0.4 mg) at bedtime can be initiated and the response assessed. Patients with nocturnal polyuria and disorders of the vasopressin system have been found to be more sensitive to desmopressin therapy.46 Fluid retention and hyponatremia can complicate therapy, and desmopressin must be avoided in patients with liver cirrhosis, renal failure, or congestive heart failure.47
Antimuscarinic agents are effective for patients who have lower urinary tract symptoms and for those with a diminished ability to store urine. They act by decreasing both voluntary and involuntary bladder contractions by blocking muscarinic receptors on the detrusor muscle. This reduces the bladder’s ability to contract and the urge to urinate, thereby increasing bladder capacity.48 These agents include oxybutynin (Ditropan), tolterodine (Detrol), solifenacin (Vesicare), and propiverine (not available in the United States).
Diuretics are being used as second-line agents or for patients who cannot tolerate desmopressin.49 Hydrochlorothiazide is taken 8 hours before bedtime to prevent water accumulation before the early sleeping hours.50 Furosemide has also led to a reduction in the mean number of nocturnal voids.51 The effect of these drugs on nocturia are especially beneficial to patients with concomitant hypertension or cardiovascular disease.
Cyclo-oxygenase-2 inhibitors such as celecoxib (Celebrex)52 and other nonsteroidal anti-inflammatory drugs such as diclofenac (Voltaren, others)53 and loxoprofen (not available in the United States)54 have been shown to decrease urine production, detrusor muscle tone, and inflammation, especially in men with benign prostatic hyperplasia.
Botulinum toxin has been used, usually in patients refractory to first-line treatment.44
Table 4 summarizes the treatment strategies for nocturia.
CASES REVISITED
The first patient described above has nocturia caused by several concomitant diseases, ie, hypertension, diabetes, benign prostatic hyperplasia, and obstructive sleep apnea. In addition to controlling his blood pressure and blood sugar, his primary care provider referred him to a pulmonologist, who confirmed obstructive sleep apnea with polysomnography and prescribed nightly use of a continuous positive airway pressure apparatus. A few weeks later, the patient’s nocturia had improved significantly, and his level of fatigue had decreased.
Apart from hypertension, the second patient’s nocturia was mostly attributed to her existing urinary incontinence. Recognizing that her current antihypertensive regimen may worsen nocturia, her family physician changed it to enalapril (Vasotec) and doxazosin (Cardura) and counseled her to restrict her fluid intake 2 hours before bedtime. She was also referred to a gynecologist, who found a moderate degree of cystocele and treated her with a collagen injection. Her nocturia improved significantly.
- Abrams P. Nocturia: the major problem in patients with lower urinary tract symptoms suggestive of benign prostatic obstruction (LUTS/BPO). Eur Urol Suppl 2005; 3(6):8–16.
- Bosch JL, Weiss J. The prevalence and causes of nocturia. J Urol 2010; 184:440–446.
- Tikkinen KA, Johnson TM, Tammela TL, et al. Nocturia frequency, bother, and quality of life: how often is too often? A population-based study in Finland. Eur Urol 2010; 57:488–496.
- Klingler HG, Heidler H, Madersbacher H, Primus G. Nocturia: an Austrian study on the multifactorial etiology of this symptom. Neurourol Urodyn 2009; 28:427–431.
- Mariappan P, Turner KJ, Sothilingam S, Rajan P, Sundram M, Steward LH. Nocturia, nocturia indices and variables from frequency-volume charts are significantly different in Asian and Caucasian men with lower urinary tract symptoms: a prospective comparison study. BJU Int 2007; 100:332–336.
- Asplund R. Mortality in the elderly in relation to nocturnal micturition. BJU Int 1999; 84:297–301.
- Booth J, O’Neil K, Lawrence M, et al. Advancing community nursing practice: detecting and managing nocturia in community-living older people. Final report. 2008. Queens Nursing Institute, Scotland. http://www.qnis.co.uk/documents/Item3.2-finalreportnocturiav2.doc. Accessed 8/22/11
- Kawauchi A, Tanaka Y, Soh J, Ukimura O, Kojima M, Miki T. Causes of nocturnal urinary frequency and reasons for its increase with age in healthy older men. J Urol 2000; 163:81–84.
- Madersbacher S, Pycha A, Schatzl G, Mian C, Klingler CH, Marberger M. The aging lower urinary tract: a comparative urodynamics study of men and women. Urology 1998; 51:206–212.
- Elbedawi A, Yalla SV, Resnick NM. Structural basis of geriatric voiding dysfunction. I: methods of a prospective ultra structural/urodynamics study and an overview of the findings. J Urol 1993; 150:1650–1656.
- Weiss JP, Blaivas JG, Jones M, Wang JT, Guan Z; 037 Study Group. Age related pathogenesis of nocturia in patients with overactive bladder. J Urol 2007; 178:548–551.
- Natsume O, Kaneko Y, Hirayama A, Fujimoto K, Hirao Y. Fluid control in elderly patients with nocturia. Int J Urol 2009; 16:307–313.
- Asplund R. Pharmacotherapy for nocturia in the elderly patient. Drugs Aging 2007; 24:325–343.
- Sugaya K, Nishijima S, Oda M, Owan T, Miyazato M, Ogawa Y. Biochemical and body composition analysis of nocturia in the elderly. Neurourol Urodyn 2008; 27:205–211.
- Shiri R, Hakama M, Häkkinen J, et al. The effects of lifestyle factors on the incidence of nocturia. J Urol 2008; 180:2059–2062.
- Asplund R. Obesity in elderly people with nocturia: cause or consequence? Can J Urol 2007; 14:3424–3428.
- Hardin-Fanning F, Gross JC. The effects of sleep-disordered breathing symptoms on voiding patterns in stroke patients. Urol Nurs 2007; 27:221–229.
- Foley DJ, Vitiello MV, Bliwise DL, Ancoli-Israel S, Monjan AA, Walsh JK. Frequent napping is associated with excessive daytime sleepiness, depression, pain, and nocturia in older adults: findings from the National Sleep Foundation ‘2003 Sleep in America’ Poll. Am J Geriatr Psychiatry 2007; 15:344–350.
- Häkkinen JT, Shiri R, Koskimäki J, Tammela TL, Auvinen A, Hakama M. Depressive symptoms increase the incidence of nocturia: Tampere Aging Male Urologic Study (TAMUS). J Urol 2008; 179:1897–1901.
- Natsume O, Kaneko Y, Hirayama A, Fujimoto K, Hirao Y. Fluid control in elderly patients with nocturia. Int J Urol 2009; 16:307–313.
- Kujubu DA, Aboseif SR. An overview of nocturia and the syndrome of nocturnal polyuria in the elderly. Nat Clin Pract Nephrol 2008; 4:426–435.
- Hashimoto M, Imamura T, Tanimukai S, Kazui H, Mori E. Urinary incontinence: an unrecognized adverse effect with donepezil (letter). Lancet 2000; 356:568.
- Wagg A, Cohen M. Medical therapy for the overactive bladder in the elderly. Age Ageing 2002; 31:241–246.
- Williams G, Donaldson RM. Nifedipine and nocturia. Lancet 1986: 1:738.
- Yoshimura K, Kamoto T, Tsukamoto T, Oshiro K, Kinukawa N, Ogawa O. Seasonal alterations in nocturia and other storage symptoms in three Japanese communities. Urology 2007; 69:864–870.
- Asplund R. Hip fractures, nocturia, and nocturnal polyuria in the elderly. Arch Gerontol Geriatr 2006; 43:319–326.
- Stewart RB, Moore MT, May FE, Marks RG, Hale WE. Nocturia: a risk factor for falls in the elderly. J Am Geriatr Soc 1992; 40:1217–1220.
- van Balen R, Steyerberg EW, Polder JJ, Ribbers TL, Habbema JD, Cools HJ. Hip fracture in elderly patients: outcomes for function, quality of life, and type of residence. Clin Orthop Relat Res 2001; 390:232–243.
- Mock LL, Parmelee PA, Kutner N, Scott J, Johnson TM. Content validation of symptom-specific nocturia quality-of-life instrument developed in men: issues expressed by women, as well as men. Urology 2008; 72:736–742.
- Holm-Larsen T, Weiss J, Langkilde LK. Economic burden of nocturia in the US adult population. J Urol Suppl 2010; 100:332–336.
- Ali A, Snape J. Nocturia in older people: a review of causes, consequences, assessment, and management. Int J Clin Pract 2004; 58:366–373.
- Miu DK, Lau S, Szeto SS. Etiology and predictors of urinary incontinence and its effect on quality of life. Geriatr Gerontol Int 2010; 10:177–182.
- Tibaek S, Gard G, Klarskov P, Iversen HK, Dehlendorff C, Jensen R. Prevalence of lower urinary tract symptoms (LUTS) in stroke patients: a cross-sectional, clinical survey. Neurourol Urodyn 2008; 27:763–771.
- Bliwise DL, Foley DJ, Vitiello MV, Ansari FP, Ancoli-Israel S, Walsh JK. Nocturia and disturbed sleep in the elderly. Sleep Med 2009; 10:540–548.
- Asplund R. Nocturia: consequences for sleep and daytime activities and associated risks. Eur Urol Suppl 2005; 3(6):24–32.
- Hernández C, Estivill E, Prieto M, Badia X. Nocturia in Spanish patients with lower urinary tract symptoms suggestive of benign prostatic hyperplasia (LUTS/BPH). Curr Med Res Opin 2008; 24:1033–1038.
- Pollak CP, Perlick D, Linsner JP, Wenston J, Hsieh F. Sleep problems in the community elderly as predictors of death and nursing home placement. J Community Health 1990; 15:123–135.
- Bursztyn M, Jacob J, Stessman J. Usefulness of nocturia as a mortality risk factor for coronary heart disease among persons born in 1920 or 1921. Am J Cardiol 2006; 98:1311–1315.
- Appell RA, Sand PK. Nocturia: etiology, diagnosis, and treatment. Neurourol Urodyn 2008; 27:34–39.
- Weiss JP, Blaivas JG, Stember DS, Chaikin DC. Evaluation of the etiology of nocturia in men: the nocturia and nocturnal bladder capacity indices. Neurourol Urodyn 1999; 18:559–565.
- Jaffe JS, Ginsberg PC, Silverberg DM, Harkaway RC. The need for voiding diaries in the evaluation of men with nocturia. J Am Osteopath Assoc 2002; 102:261–265.
- Yoshimura K, Terai A. Classification and distribution of symptomatic nocturia with special attention to duration of time in bed: a patient-based study. BJU Int 2005; 95:1259–1262.
- Polderman KH. Mechanisms of action, physiological effects, and complications of hypothermia. Crit Care Med 2009; 37:S186–S202.
- Soda T, Masui K, Okuno H, Terai A, Ogawa O, Yoshimura K. Efficacy of nondrug lifestyle measures for the treatment of nocturia. J Urol 2010; 184:1000–1004.
- Flynn MK, Amundsen CL, Perevich M, Liu F, Webster GD. Outcome of a randomized, double-blind, placebo controlled trial of botulinum A toxin for refractory overactive bladder. J Urol 2009; 181:2608–2615.
- Asplund R, Sundberg B, Bengtsson P. Desmopressin for the treatment of nocturnal polyuria in the elderly: a dose titration study. Br J Urol 1998; 82:642–646.
- Abrams P, Mattiasson A, Lose GR, Robertson GL. The role of desmopressin treatment in adult nocturia. BJU Int 2002; 90:32–36.
- Andersson K. Treatment of the overactive bladder syndrome and detrusor overactivity with antimuscarinic drugs. Continence 2005; 1:1–8.
- Reynard JM, Cannon A, Yang Q, Abrams P. A novel therapy for nocturnal polyuria: a double-blind randomized trial of frusemide against placebo. Br J Urol 1998; 81:215–218.
- Cho MC, Ku JH, Paick JS. Alpha-blocker plus diuretic combination therapy as second-line treatment for nocturia in men with LUTS: a pilot study. Urology 2009; 73:549–553.
- Fu FG, Lavery HJ, Wu DL. Reducing nocturia in the elderly: a randomized placebo-controlled trial of staggered furosemide and desmopressin. Neurourol Urodyn 2011; 30:312–316.
- Falahatkar S, Mokhtari G, Pourezza F, Asgari SA, Kamran AN. Celecoxib for treatment of nocturia caused by benign prostatic hyperplasia: a prospective, randomized, double-blind, placebo-controlled study. Urology 2008; 72:813–816.
- Addla SK, Adeyoju AB, Neilson D, O’Reilly P. Diclofenac for treatment of nocturia caused by nocturnal polyuria: a prospective, randomised, double-blind, placebo-controlled crossover study. Eur Urol 2006; 49:720–725.
- Saito M, Kawatani M, Kinoshita Y, Satoh K, Miyagawa I. Effectiveness of an anti-inflammatory drug, loxoprofen, for patients with nocturia. Int J Urol 2005; 12:779–782.
Nocturia is common, but elderly patients infrequently volunteer this complaint, and even when they do, some clinicians may dismiss it as simply a part of aging. Nevertheless, nocturia causes significant distress and impairment of quality of life. It is associated with very serious consequences such as depression, social isolation, and a higher risk of death.
In this article, we review the concepts behind frequent nighttime voiding in older adults. We will start with two case scenarios to aid in understanding these concepts; near the end of the article, we will discuss the most appropriate management strategies for these two patients.
CASE SCENARIOS
Case 1: An 82-year-old man with fatigue
An 82-year-old obese white man with a history of hypertension, diabetes, and benign prostatic hyperplasia comes in to see his primary care provider, complaining of fatigue. He wakes up tired and has difficulty completing his daytime tasks. He gets up every 1 to 2 hours at night to urinate and has slow urinary flow and a feeling of incomplete bladder emptying.
See related patient education material
He says his wife has been increasingly bothered by his loud snoring. Recently, he had a car accident when he fell asleep while driving.
Case 2: An 85-year-old woman with incontinence
An 85-year-old white woman is in her family physician’s office with a primary complaint of waking up at least four times at night to urinate, and often ends up soaking her bed or adult diapers. She is bothered by urinary urgency and frequency during the day as well. She denies dysuria and hematuria.
She has a history of hypertension and urinary incontinence, and she has seven children. Her current medications are diltiazem (Cardizem), metoprolol (Toprol), and oxybutynin (Ditropan).
In these two cases, what would account for the nocturia? What would be the best way to help these patients?
THE NORM, NOT THE EXCEPTION
Although nocturia is defined as an awakening by the need to urinate even once in a night, many experts consider that it begins to be clinically significant only when the patient voids at least twice during the night.1
In older adults, nocturia is the norm rather than the exception. Studies done between 1990 and 2009 found that 68.9% to 93% of men age 70 and older get up at least once a night to void. The prevalence in women is somewhat lower, at 74.1% to 77.1%.2 Clinically significant nocturia is present in a majority of the elderly: more than 60% of both men and women.3
An Austrian study4 reported that elderly men got up to urinate a mean of 2.8 times per night, while women got up significantly more often—3.1 times. Women were also bothered more by this symptom, and their quality of life was significantly more decreased.
In another study,5 whites had a significantly higher nocturia ratio (ratio of nighttime urine volume to the 24-hour urine volume) than Asians. Asians, on the other hand, had a significantly higher nocturnal bladder capacity index than whites. (See below for definitions of the various indices of nocturia.) This information implies that nocturia may be a more prominent problem for elderly whites than for other racial groups.
In an epidemiologic study in Sweden,6 the death rate was as much as twice as high in both men and women who had three or more nocturnal voids, even after taking into account the influence of cardiac disease, diabetes mellitus, and stroke.
If nocturia is not addressed in the physician-patient encounter, patients may try to “self-manage” it by restricting their fluid intake or by limiting their social exposure,7 with limited success and with unwanted social isolation.
WHAT CAUSES NOCTURIA?
Advancing age is primary among these factors. Age-related structural changes in the urinary system include decreased functional bladder capacity, a decreased maximum urinary flow rate,6 a decreased ability to postpone urination,8 and an age-related increase in postvoiding residual urine volume.9 The aging kidney is also less able to concentrate urine. Also implicated are histologic changes in the detrusor muscle10 that lead to diminished bladder compliance and, together with detrusor overactivity, result in increased urinary frequency.
Nocturnal polyuria or nocturnal urine overproduction is common in patients with nocturia.11
Although the pathophysiology of nocturnal polyuria is still unclear, some investigators believe that low levels of antidiuretic hormone (ADH) at night are involved, reflecting an alteration in the circadian rhythm seen in diurnal plasma arginine vasopressin levels.12 In patients with nocturnal polyuria, ADH levels drop to very low or undetectable levels at night, which increases nocturnal urine output. In some extreme cases, the low to absent levels of ADH increase nocturnal voiding to 85% of the total 24-hour urine volume.13
Other causes of nocturnal polyuria include mobilization of fluids in patients with edema,14 and autonomic dysfunction. Other biochemical changes that contribute to nocturia include a decrease in nighttime plasma melatonin levels, an increase in nighttime plasma catecholamine levels, an increase in nighttime plasma natriuretic peptide levels, an increase in blood pressure, and an increase in total urine volume.15
A decreased ability to store urine also leads to nocturia. This is caused by decreased nocturnal bladder capacity, more irritative symptoms, and comorbid conditions such as overactive bladder, pelvic floor laxity resulting in pelvic organ prolapse, and, in men, benign prostatic hyperplasia.
Neural inputs to the bladder can also be impaired, as in patients who have diabetes mellitus or spinal stenosis, leading to chronic urinary retention, detrusor dysfunction, nocturia, and incontinence.
WHICH PATIENTS ARE AT RISK?
Obesity is associated with a higher incidence of moderate to severe nocturia.15 Studies have shown that the higher the body mass index, the greater the number of nighttime voids, especially in women.16
Habitually eating at night, with poor daytime appetite, is shown to be associated with increased nighttime diuresis.
Obstructive sleep apnea17 and untreated depressive symptoms such as frequent napping18 are also associated with moderate to severe nocturia.19
Higher systolic blood pressures are associated with more urine production at night. Plasma ADH regulation is also altered, which contributes to nocturnal polyuria.21
Other comorbid conditions associated with nocturia include recurrent cystitis, lung disease, congestive heart failure, neurodegenerative conditions (eg, Alzheimer disease and parkinsonism), and chronic kidney disease.21
Drugs associated with nocturia include cholinesterase inhibitors (for dementia),22 beta-blockers,23 and calcium channel blockers.24
Lifestyle factors. Alcohol and coffee have shown either no or only a mild diuretic effect. Smoking has not been shown to be associated with nocturia.15
Seasonal differences also exist, with increased frequency of nocturia in the winter.25
WHAT ARE THE CLINICAL CONSEQUENCES OF NOCTURIA?
Quality of life can be profoundly affected, and if nocturia is left untreated, it may lead to morbidity and even death. Elderly patients may feel simultaneously debilitated, frustrated, distressed, and puzzled. Nocturia may also increase their fear of falling and may negatively affect personal relationships.26
Falls, injuries. Nocturia exposes elderly patients to injuries such as hip fractures due to falling, significantly increasing the incidence of this injury.26 This occurs as elderly patients get up from bed and walk to the bathroom to void.27 In addition, during the day, superficial and fragmented sleep leads to daytime sleepiness and impaired perception and balance, also increasing the risk of falls.28 The complications of immobility and the need for surgery in many cases lead to debility, increased risk of infections, decubitus ulcers, and death. The risk of hip fractures can lead elderly patients with nocturia to associate this symptom with a fear of falling and can alter their concept of their own age (“Nocturia makes me feel old”),29 further diminishing quality of life.
The estimated medical cost of nocturia-associated falls in the elderly is about $1.5 billion per year, part of the $61 billion in lost productivity due to nocturia in adults.30
Long-term complications (eg, debilitation, poor sleep, obesity, decreased energy), increase the overall mortality rate, especially in patients who report voiding more than three times per night.29 Elderly patients with nocturia also have a greater need for emergency care.31
Nocturia also complicates other comorbid conditions, such as dementia, which increases the risk of urinary incontinence.32 In patients who have had a stroke, nocturia is the most frequent lower urinary tract symptom, and represents a major impact on daily life.33
Sleep disturbance is another important consequence. In one survey,34 nocturia was cited as a cause of poor sleep four times more often than the cause cited next most often, ie, pain. Because the elderly patient is awakened from sleep numerous times throughout the night, nocturia leads to more fatigue,35 lower energy levels, and poorer quality of sleep.36 Depression may be linked to poor sleep, as men with two or more nocturnal episodes were shown to be six times more likely to experience depression.
The patient is not the only person who loses sleep: so do the patient’s family members or sleeping partner.7 It is therefore not surprising that sleep disruption caused by nocturia has been cited as a principal reason for admitting older relatives to care homes.37
The risk of death is higher for elderly patients with coronary heart disease if they have nocturia. The causative link is the hemodynamic changes (increases in blood pressure and heart rate) that accompany awakening and arising, which may cause cardiovascular strain and lead to cardiovascular events. The 12-year survival rate has been shown to be significantly lower in patients with nighttime voiding, making nocturia a highly significant independent predictor of death in coronary heart disease patients.38
HOW TO EVALUATE AN OLDER ADULT WHO PRESENTS WITH NOCTURIA
A thorough history and physical examination are crucial in diagnosing nocturia. The goal is to identify any treatable underlying condition, such as diabetes mellitus, obstructive sleep apnea, diabetes insipidus, overactive bladder, benign prostatic hyperplasia, urinary tract infection, and congestive heart failure. Laboratory tests and imaging studies can help rule out these underlying conditions.
Other important facets in the history that must be elicited are medication use, patterns of fluid intake, and a history of other urinary complaints.39
A voiding diary and indices of nocturia
A voiding diary is extremely useful and should be used whenever possible. Episodes of incontinence, time of voids, volume voided, and frequency and volume of fluid intake are recorded. From the raw data, one can determine the following:
Total nocturnal urine volume, ie, the sum volume of the nighttime voids
Maximum voided volume, ie, the largest single recorded volume voided in a 24-hour period
Nocturia index, ie, the total nocturnal urine volume divided by the maximum voided volume. A nocturia index greater than 1 shows that nocturnal urine production is greater than the functional bladder capacity. Clinically significant nocturia is observed in patients with a nocturia index of 2.1 or greater.
Nocturnal polyuria index, ie, total nocturnal urine volume divided by the 24-hour urine output. A nocturnal polyuria index higher than 33% implies nocturnal polyuria.40
Nocturnal bladder capacity index, ie, the actual number of nightly voids minus the predicted number of nightly voids, which in turn is calculated as the nocturia index minus 1.
It is especially important to encourage patients to make a voiding diary, as some patients may find this cumbersome, and compliance can be low unless its importance is emphasized. A diary over 7 days usually gives meaningful data. The results from the diary typically confirm the presence of nocturnal polyuria or a decrease in bladder capacity, influencing management.41
WHAT ARE THE TREATMENT OPTIONS?
Therapy must be directed at the primary cause, addressing any underlying conditions that can contribute to nocturia. Examples39:
- Tight control of blood sugar for patients with diabetes mellitus
- Treatment of diabetes insipidus
- Referral for patients with primary polydipsia
- Management of hypercalcemia and hypokalemia
- A survey of medications
- Treatment of infections.
Nonpharmacologic measures
Tailored behavioral therapy can also be instituted, but the patient needs to have realistic expectations, as these measures are rarely effective alone.
Avoiding nighttime fluid intake, including alcohol and caffeine, has shown promise.
Wearing compression stockings and elevating the legs in the afternoon decrease the retention of fluid that otherwise would return to the circulation at night.
Identifying and eliminating nighttime influences that disturb sleep has variable efficacy. The use of continuous positive airway pressure helps to treat sleep apnea. Moderate exercise, reducing nonsleep time spent in bed,42 and sleeping in a warm bed43 to decrease cold diuresis have also been shown to improve sleep quality.44 Patients with nocturia may have a disrupted circadian rhythm, and phototherapy may help resynchronize the diurnal rhythm and melatonin secretion.
Pharmacotherapy
Pharmacotherapy of nocturia includes desmopressin (DDAVP) to manage nocturnal polyuria and antimuscarinic agents to manage the patient’s decreased ability to store urine. Alpha-blockers such as tamsulosin (Flomax) and 5-alpha-reductase inhibitors such as finasteride (Proscar) are used for men with benign prostatic hyperplasia. Novel and second-line therapies include diuretics such as furosemide (Lasix), cyclooxygenase-2 inhibitors, as well as botulinum toxin injected directly into the detrusor muscle for overactive bladder.45
Desmopressin in a low oral dose (0.1–0.4 mg) at bedtime can be initiated and the response assessed. Patients with nocturnal polyuria and disorders of the vasopressin system have been found to be more sensitive to desmopressin therapy.46 Fluid retention and hyponatremia can complicate therapy, and desmopressin must be avoided in patients with liver cirrhosis, renal failure, or congestive heart failure.47
Antimuscarinic agents are effective for patients who have lower urinary tract symptoms and for those with a diminished ability to store urine. They act by decreasing both voluntary and involuntary bladder contractions by blocking muscarinic receptors on the detrusor muscle. This reduces the bladder’s ability to contract and the urge to urinate, thereby increasing bladder capacity.48 These agents include oxybutynin (Ditropan), tolterodine (Detrol), solifenacin (Vesicare), and propiverine (not available in the United States).
Diuretics are being used as second-line agents or for patients who cannot tolerate desmopressin.49 Hydrochlorothiazide is taken 8 hours before bedtime to prevent water accumulation before the early sleeping hours.50 Furosemide has also led to a reduction in the mean number of nocturnal voids.51 The effect of these drugs on nocturia are especially beneficial to patients with concomitant hypertension or cardiovascular disease.
Cyclo-oxygenase-2 inhibitors such as celecoxib (Celebrex)52 and other nonsteroidal anti-inflammatory drugs such as diclofenac (Voltaren, others)53 and loxoprofen (not available in the United States)54 have been shown to decrease urine production, detrusor muscle tone, and inflammation, especially in men with benign prostatic hyperplasia.
Botulinum toxin has been used, usually in patients refractory to first-line treatment.44
Table 4 summarizes the treatment strategies for nocturia.
CASES REVISITED
The first patient described above has nocturia caused by several concomitant diseases, ie, hypertension, diabetes, benign prostatic hyperplasia, and obstructive sleep apnea. In addition to controlling his blood pressure and blood sugar, his primary care provider referred him to a pulmonologist, who confirmed obstructive sleep apnea with polysomnography and prescribed nightly use of a continuous positive airway pressure apparatus. A few weeks later, the patient’s nocturia had improved significantly, and his level of fatigue had decreased.
Apart from hypertension, the second patient’s nocturia was mostly attributed to her existing urinary incontinence. Recognizing that her current antihypertensive regimen may worsen nocturia, her family physician changed it to enalapril (Vasotec) and doxazosin (Cardura) and counseled her to restrict her fluid intake 2 hours before bedtime. She was also referred to a gynecologist, who found a moderate degree of cystocele and treated her with a collagen injection. Her nocturia improved significantly.
- Abrams P. Nocturia: the major problem in patients with lower urinary tract symptoms suggestive of benign prostatic obstruction (LUTS/BPO). Eur Urol Suppl 2005; 3(6):8–16.
- Bosch JL, Weiss J. The prevalence and causes of nocturia. J Urol 2010; 184:440–446.
- Tikkinen KA, Johnson TM, Tammela TL, et al. Nocturia frequency, bother, and quality of life: how often is too often? A population-based study in Finland. Eur Urol 2010; 57:488–496.
- Klingler HG, Heidler H, Madersbacher H, Primus G. Nocturia: an Austrian study on the multifactorial etiology of this symptom. Neurourol Urodyn 2009; 28:427–431.
- Mariappan P, Turner KJ, Sothilingam S, Rajan P, Sundram M, Steward LH. Nocturia, nocturia indices and variables from frequency-volume charts are significantly different in Asian and Caucasian men with lower urinary tract symptoms: a prospective comparison study. BJU Int 2007; 100:332–336.
- Asplund R. Mortality in the elderly in relation to nocturnal micturition. BJU Int 1999; 84:297–301.
- Booth J, O’Neil K, Lawrence M, et al. Advancing community nursing practice: detecting and managing nocturia in community-living older people. Final report. 2008. Queens Nursing Institute, Scotland. http://www.qnis.co.uk/documents/Item3.2-finalreportnocturiav2.doc. Accessed 8/22/11
- Kawauchi A, Tanaka Y, Soh J, Ukimura O, Kojima M, Miki T. Causes of nocturnal urinary frequency and reasons for its increase with age in healthy older men. J Urol 2000; 163:81–84.
- Madersbacher S, Pycha A, Schatzl G, Mian C, Klingler CH, Marberger M. The aging lower urinary tract: a comparative urodynamics study of men and women. Urology 1998; 51:206–212.
- Elbedawi A, Yalla SV, Resnick NM. Structural basis of geriatric voiding dysfunction. I: methods of a prospective ultra structural/urodynamics study and an overview of the findings. J Urol 1993; 150:1650–1656.
- Weiss JP, Blaivas JG, Jones M, Wang JT, Guan Z; 037 Study Group. Age related pathogenesis of nocturia in patients with overactive bladder. J Urol 2007; 178:548–551.
- Natsume O, Kaneko Y, Hirayama A, Fujimoto K, Hirao Y. Fluid control in elderly patients with nocturia. Int J Urol 2009; 16:307–313.
- Asplund R. Pharmacotherapy for nocturia in the elderly patient. Drugs Aging 2007; 24:325–343.
- Sugaya K, Nishijima S, Oda M, Owan T, Miyazato M, Ogawa Y. Biochemical and body composition analysis of nocturia in the elderly. Neurourol Urodyn 2008; 27:205–211.
- Shiri R, Hakama M, Häkkinen J, et al. The effects of lifestyle factors on the incidence of nocturia. J Urol 2008; 180:2059–2062.
- Asplund R. Obesity in elderly people with nocturia: cause or consequence? Can J Urol 2007; 14:3424–3428.
- Hardin-Fanning F, Gross JC. The effects of sleep-disordered breathing symptoms on voiding patterns in stroke patients. Urol Nurs 2007; 27:221–229.
- Foley DJ, Vitiello MV, Bliwise DL, Ancoli-Israel S, Monjan AA, Walsh JK. Frequent napping is associated with excessive daytime sleepiness, depression, pain, and nocturia in older adults: findings from the National Sleep Foundation ‘2003 Sleep in America’ Poll. Am J Geriatr Psychiatry 2007; 15:344–350.
- Häkkinen JT, Shiri R, Koskimäki J, Tammela TL, Auvinen A, Hakama M. Depressive symptoms increase the incidence of nocturia: Tampere Aging Male Urologic Study (TAMUS). J Urol 2008; 179:1897–1901.
- Natsume O, Kaneko Y, Hirayama A, Fujimoto K, Hirao Y. Fluid control in elderly patients with nocturia. Int J Urol 2009; 16:307–313.
- Kujubu DA, Aboseif SR. An overview of nocturia and the syndrome of nocturnal polyuria in the elderly. Nat Clin Pract Nephrol 2008; 4:426–435.
- Hashimoto M, Imamura T, Tanimukai S, Kazui H, Mori E. Urinary incontinence: an unrecognized adverse effect with donepezil (letter). Lancet 2000; 356:568.
- Wagg A, Cohen M. Medical therapy for the overactive bladder in the elderly. Age Ageing 2002; 31:241–246.
- Williams G, Donaldson RM. Nifedipine and nocturia. Lancet 1986: 1:738.
- Yoshimura K, Kamoto T, Tsukamoto T, Oshiro K, Kinukawa N, Ogawa O. Seasonal alterations in nocturia and other storage symptoms in three Japanese communities. Urology 2007; 69:864–870.
- Asplund R. Hip fractures, nocturia, and nocturnal polyuria in the elderly. Arch Gerontol Geriatr 2006; 43:319–326.
- Stewart RB, Moore MT, May FE, Marks RG, Hale WE. Nocturia: a risk factor for falls in the elderly. J Am Geriatr Soc 1992; 40:1217–1220.
- van Balen R, Steyerberg EW, Polder JJ, Ribbers TL, Habbema JD, Cools HJ. Hip fracture in elderly patients: outcomes for function, quality of life, and type of residence. Clin Orthop Relat Res 2001; 390:232–243.
- Mock LL, Parmelee PA, Kutner N, Scott J, Johnson TM. Content validation of symptom-specific nocturia quality-of-life instrument developed in men: issues expressed by women, as well as men. Urology 2008; 72:736–742.
- Holm-Larsen T, Weiss J, Langkilde LK. Economic burden of nocturia in the US adult population. J Urol Suppl 2010; 100:332–336.
- Ali A, Snape J. Nocturia in older people: a review of causes, consequences, assessment, and management. Int J Clin Pract 2004; 58:366–373.
- Miu DK, Lau S, Szeto SS. Etiology and predictors of urinary incontinence and its effect on quality of life. Geriatr Gerontol Int 2010; 10:177–182.
- Tibaek S, Gard G, Klarskov P, Iversen HK, Dehlendorff C, Jensen R. Prevalence of lower urinary tract symptoms (LUTS) in stroke patients: a cross-sectional, clinical survey. Neurourol Urodyn 2008; 27:763–771.
- Bliwise DL, Foley DJ, Vitiello MV, Ansari FP, Ancoli-Israel S, Walsh JK. Nocturia and disturbed sleep in the elderly. Sleep Med 2009; 10:540–548.
- Asplund R. Nocturia: consequences for sleep and daytime activities and associated risks. Eur Urol Suppl 2005; 3(6):24–32.
- Hernández C, Estivill E, Prieto M, Badia X. Nocturia in Spanish patients with lower urinary tract symptoms suggestive of benign prostatic hyperplasia (LUTS/BPH). Curr Med Res Opin 2008; 24:1033–1038.
- Pollak CP, Perlick D, Linsner JP, Wenston J, Hsieh F. Sleep problems in the community elderly as predictors of death and nursing home placement. J Community Health 1990; 15:123–135.
- Bursztyn M, Jacob J, Stessman J. Usefulness of nocturia as a mortality risk factor for coronary heart disease among persons born in 1920 or 1921. Am J Cardiol 2006; 98:1311–1315.
- Appell RA, Sand PK. Nocturia: etiology, diagnosis, and treatment. Neurourol Urodyn 2008; 27:34–39.
- Weiss JP, Blaivas JG, Stember DS, Chaikin DC. Evaluation of the etiology of nocturia in men: the nocturia and nocturnal bladder capacity indices. Neurourol Urodyn 1999; 18:559–565.
- Jaffe JS, Ginsberg PC, Silverberg DM, Harkaway RC. The need for voiding diaries in the evaluation of men with nocturia. J Am Osteopath Assoc 2002; 102:261–265.
- Yoshimura K, Terai A. Classification and distribution of symptomatic nocturia with special attention to duration of time in bed: a patient-based study. BJU Int 2005; 95:1259–1262.
- Polderman KH. Mechanisms of action, physiological effects, and complications of hypothermia. Crit Care Med 2009; 37:S186–S202.
- Soda T, Masui K, Okuno H, Terai A, Ogawa O, Yoshimura K. Efficacy of nondrug lifestyle measures for the treatment of nocturia. J Urol 2010; 184:1000–1004.
- Flynn MK, Amundsen CL, Perevich M, Liu F, Webster GD. Outcome of a randomized, double-blind, placebo controlled trial of botulinum A toxin for refractory overactive bladder. J Urol 2009; 181:2608–2615.
- Asplund R, Sundberg B, Bengtsson P. Desmopressin for the treatment of nocturnal polyuria in the elderly: a dose titration study. Br J Urol 1998; 82:642–646.
- Abrams P, Mattiasson A, Lose GR, Robertson GL. The role of desmopressin treatment in adult nocturia. BJU Int 2002; 90:32–36.
- Andersson K. Treatment of the overactive bladder syndrome and detrusor overactivity with antimuscarinic drugs. Continence 2005; 1:1–8.
- Reynard JM, Cannon A, Yang Q, Abrams P. A novel therapy for nocturnal polyuria: a double-blind randomized trial of frusemide against placebo. Br J Urol 1998; 81:215–218.
- Cho MC, Ku JH, Paick JS. Alpha-blocker plus diuretic combination therapy as second-line treatment for nocturia in men with LUTS: a pilot study. Urology 2009; 73:549–553.
- Fu FG, Lavery HJ, Wu DL. Reducing nocturia in the elderly: a randomized placebo-controlled trial of staggered furosemide and desmopressin. Neurourol Urodyn 2011; 30:312–316.
- Falahatkar S, Mokhtari G, Pourezza F, Asgari SA, Kamran AN. Celecoxib for treatment of nocturia caused by benign prostatic hyperplasia: a prospective, randomized, double-blind, placebo-controlled study. Urology 2008; 72:813–816.
- Addla SK, Adeyoju AB, Neilson D, O’Reilly P. Diclofenac for treatment of nocturia caused by nocturnal polyuria: a prospective, randomised, double-blind, placebo-controlled crossover study. Eur Urol 2006; 49:720–725.
- Saito M, Kawatani M, Kinoshita Y, Satoh K, Miyagawa I. Effectiveness of an anti-inflammatory drug, loxoprofen, for patients with nocturia. Int J Urol 2005; 12:779–782.
KEY POINTS
- Nocturia is multifactorial and is caused by factors that increase urine production and others that decrease the bladder’s ability to hold urine.
- The first priority in treating nocturia is to identify and treat concomitant conditions that may be contributing to it, such as diabetes mellitus, diabetes insipidus, urinary tract infections, hypercalcemia, and hypokalemia.
- Nonpharmacologic measures can help, but by themselves usually do not solve the problem.
- Drug therapies for nocturia include desmopressin (DDAVP), antimuscarinic agents, alpha-blockers, and 5-alpha reductase inhibitors.
Breast Cancer Guidelines in Theory and Practice
Breast Cancer Screenings Urged by VA
Prolactinoma: A Case Study
A 42-year-old obese woman with type 2 diabetes, diabetic retinopathy, hypertension, and hirsutism presents to discuss an elevated prolactin level of 144.8 ng/mL (normal range, 4.8 to 23.3 ng/mL) found by her Ob-Gyn two months ago. She complained of galactorrhea and no menses for one year. A repeat prolactin level was also elevated, at 109 ng/mL.
A pituitary MRI with contrast showed a “subtle area of delayed enhancement in the right pituitary, consistent with a 5-mm microadenoma.” The patient was prescribed the dopamine agonist cabergoline (0.25 mg, to be taken twice a week), with a plan to follow up in two to three months.
Q: In obtaining a thorough history, what additional questions should be asked of this patient?
There are many causes of hyperprolactinemia. Factors that can increase prolactin secretion include pregnancy, nursing, physiologic stress, estrogen use, polycystic ovary syndrome, hypothyroidism, and chronic renal or hepatic failure. Head trauma, use of certain medications (verapamil, neuroleptics, antipsychotics, and antidepressants), and presence of nonsecretory sellar or suprasellar masses can also increase prolactin levels.
In general, signs and symptoms are due to either the effect of excess hormone secretion (ie, galactorrhea and amenorrhea) or local compression (ie, new-onset or persistent headache, dizziness, visual changes, and vision loss). A review of medications, including estrogen therapy, and history of fertility or gonadal dysfunction should be documented. Elevated prolactin levels can result in secondary hypogonadism.1
Note: While the case patient is female, it should be emphasized that prolactinomas do occur in men. The incidence is, overall, low. In addition to the symptoms listed above, men can present with decreased libido and infertility.1
Q: What additional diagnostic tests should be ordered as part of the work-up of galactorrhea and amenorrhea in this patient?
Laboratory evaluation should include a repeat serum prolactin test, measurements of TSH and free T4, and a pregnancy test. (A serum testosterone level should be checked in men.) If the results come back normal and if other diagnoses are excluded, the most likely diagnosis is a prolactinoma. In this case, a pituitary MRI should be obtained. Visual field testing can be performed in individuals with specific visual complaints, especially loss or impairment of peripheral vision.
Q: What is the incidence of prolactinoma in the general population?
Prolactin-secreting adenomas, or prolactinomas, are the most common type of pituitary adenoma, accounting for approximately 60% overall.1 They occur at a frequency of six to 10 cases per million each year.2 Prolactinomas are almost always benign; malignant tumors are extremely rare.3
Tumors are classified as microadenomas or macroadenomas, depending on the size. A microadenoma is defined as an intrasellar mass less than 10 mm in diameter. A macroadenoma, defined as larger than 10 mm in diameter, can cause enlargement of the sella turcica.1,4 The larger the size of the prolactinoma, the greater the prolactin level and higher the likelihood of mass-effect symptoms.4
Q: What are the options for treatment of a prolactinoma?
There are several options for treatment of prolactinomas. After discussing all of the available options with the patient, the choice of therapy should be determined by the patient’s desires and potential plans for pregnancy. It is acceptable to observe the tumor with serial MRIs and serum prolactin measurements, provided the tumor is very small and the patient is asymptomatic.4
Medication therapy involves treatment with a dopamine agonist, which directly inhibits prolactin secretion by the tumor and therefore suppresses tumor growth. The goal of medication therapy is to suppress the prolactin level to normal range and restore gonadal function. The two dopamine agonists used are bromocriptine and cabergoline.
Bromocriptine was the first drug available in the United States to effectively treat pituitary adenomas. Its most common adverse effects include nausea, vomiting, dizziness, and postural hypotension. These effects can be minimized or avoided if the drug is started at a low dose, gradually increased, and taken at bedtime. The adverse effects usually subside with continued use; however, in some patients they persist and therefore the drug has to be discontinued.
Cabergoline is a non-ergot dopamine agonist that is more efficacious, overall better tolerated, and longer acting than bromocriptine. It is dosed twice weekly, whereas bromocriptine is dosed once daily.4 One factor to consider in a female patient is whether she is of child-bearing age and is interested in conception. Both bromocriptine and cabergoline are designated as category B; however, in animal studies cabergoline has been associated with maternal toxicity, increase in fetal death, and growth retardation and death due to decreased milk secretion by the mother. Therefore, it should only be used during pregnancy if the need has been clearly established.
Dopamine agonists are approximately 80% to 90% effective in decreasing prolactin levels and reducing tumor size in microadenomas and 60% to 70% in macroadenomas. The major drawback of using medication is that it does not always provide permanent results. Hyperprolactinemia and tumor growth can resume upon discontinuation of the drug, even if the patient has taken it for several years.1 The rate of recurrence after discontinuing therapy can be anywhere from 26% to 69%, and the highest likelihood occurs within a year of withdrawal.4 Close clinical follow-up is thus important.
Surgery, typically a transphenoidal resection, is performed by a neurosurgeon. Success of surgery is based on tumor size and basal prolactin level prior to the procedure. It is more effective in restoring normal prolactin levels and resolution of symptoms in microadenomas than in macroadenomas. Progressive vision loss, pituitary apoplexy, and intolerance to dopamine agonists are indications for surgery.1
Radiation therapy is reserved for those patients who have residual tumors postsurgery and have not responded to or are intolerant to dopamine agonists. Response to radiation is slow; it can sometimes take several years to achieve full effect. Gamma-knife radiation is sometimes used, but experience with this procedure is limited thus far in prolactinomas.
Overall, the vast majority of prolactinomas are benign and fairly straightforward to manage clinically.3
REFERENCES
1. Greenspan F, Gardner D. Basic & Clinical Endocrinology, 7th ed. New York: McGraw-Hill; 2004.
2. Ciccarelli A, Daly A, Beckers A. The epidemiology of prolactinomas. Pituitary. 2005;8(1):3-6.
3. Casanueva FF, Molitch ME, Schlechte JA, et al. Guidelines of the Pituitary Society for the diagnosis and management of prolactinomas. Clin Endocrinol (Oxf). 2006;65(2):265-273.
4. Melmed S, Casanueva FF, Hoffman AR, et al. Diagnosis and treatment of hyperprolactinemia: an Endocrine Society Clinical Practice Guideline. J Clinical Endocrinol Metab. 2011;96(2):273-288.
| Clinician Reviews in partnership with |
| Clinician Reviews in partnership with |
| Clinician Reviews in partnership with |
A 42-year-old obese woman with type 2 diabetes, diabetic retinopathy, hypertension, and hirsutism presents to discuss an elevated prolactin level of 144.8 ng/mL (normal range, 4.8 to 23.3 ng/mL) found by her Ob-Gyn two months ago. She complained of galactorrhea and no menses for one year. A repeat prolactin level was also elevated, at 109 ng/mL.
A pituitary MRI with contrast showed a “subtle area of delayed enhancement in the right pituitary, consistent with a 5-mm microadenoma.” The patient was prescribed the dopamine agonist cabergoline (0.25 mg, to be taken twice a week), with a plan to follow up in two to three months.
Q: In obtaining a thorough history, what additional questions should be asked of this patient?
There are many causes of hyperprolactinemia. Factors that can increase prolactin secretion include pregnancy, nursing, physiologic stress, estrogen use, polycystic ovary syndrome, hypothyroidism, and chronic renal or hepatic failure. Head trauma, use of certain medications (verapamil, neuroleptics, antipsychotics, and antidepressants), and presence of nonsecretory sellar or suprasellar masses can also increase prolactin levels.
In general, signs and symptoms are due to either the effect of excess hormone secretion (ie, galactorrhea and amenorrhea) or local compression (ie, new-onset or persistent headache, dizziness, visual changes, and vision loss). A review of medications, including estrogen therapy, and history of fertility or gonadal dysfunction should be documented. Elevated prolactin levels can result in secondary hypogonadism.1
Note: While the case patient is female, it should be emphasized that prolactinomas do occur in men. The incidence is, overall, low. In addition to the symptoms listed above, men can present with decreased libido and infertility.1
Q: What additional diagnostic tests should be ordered as part of the work-up of galactorrhea and amenorrhea in this patient?
Laboratory evaluation should include a repeat serum prolactin test, measurements of TSH and free T4, and a pregnancy test. (A serum testosterone level should be checked in men.) If the results come back normal and if other diagnoses are excluded, the most likely diagnosis is a prolactinoma. In this case, a pituitary MRI should be obtained. Visual field testing can be performed in individuals with specific visual complaints, especially loss or impairment of peripheral vision.
Q: What is the incidence of prolactinoma in the general population?
Prolactin-secreting adenomas, or prolactinomas, are the most common type of pituitary adenoma, accounting for approximately 60% overall.1 They occur at a frequency of six to 10 cases per million each year.2 Prolactinomas are almost always benign; malignant tumors are extremely rare.3
Tumors are classified as microadenomas or macroadenomas, depending on the size. A microadenoma is defined as an intrasellar mass less than 10 mm in diameter. A macroadenoma, defined as larger than 10 mm in diameter, can cause enlargement of the sella turcica.1,4 The larger the size of the prolactinoma, the greater the prolactin level and higher the likelihood of mass-effect symptoms.4
Q: What are the options for treatment of a prolactinoma?
There are several options for treatment of prolactinomas. After discussing all of the available options with the patient, the choice of therapy should be determined by the patient’s desires and potential plans for pregnancy. It is acceptable to observe the tumor with serial MRIs and serum prolactin measurements, provided the tumor is very small and the patient is asymptomatic.4
Medication therapy involves treatment with a dopamine agonist, which directly inhibits prolactin secretion by the tumor and therefore suppresses tumor growth. The goal of medication therapy is to suppress the prolactin level to normal range and restore gonadal function. The two dopamine agonists used are bromocriptine and cabergoline.
Bromocriptine was the first drug available in the United States to effectively treat pituitary adenomas. Its most common adverse effects include nausea, vomiting, dizziness, and postural hypotension. These effects can be minimized or avoided if the drug is started at a low dose, gradually increased, and taken at bedtime. The adverse effects usually subside with continued use; however, in some patients they persist and therefore the drug has to be discontinued.
Cabergoline is a non-ergot dopamine agonist that is more efficacious, overall better tolerated, and longer acting than bromocriptine. It is dosed twice weekly, whereas bromocriptine is dosed once daily.4 One factor to consider in a female patient is whether she is of child-bearing age and is interested in conception. Both bromocriptine and cabergoline are designated as category B; however, in animal studies cabergoline has been associated with maternal toxicity, increase in fetal death, and growth retardation and death due to decreased milk secretion by the mother. Therefore, it should only be used during pregnancy if the need has been clearly established.
Dopamine agonists are approximately 80% to 90% effective in decreasing prolactin levels and reducing tumor size in microadenomas and 60% to 70% in macroadenomas. The major drawback of using medication is that it does not always provide permanent results. Hyperprolactinemia and tumor growth can resume upon discontinuation of the drug, even if the patient has taken it for several years.1 The rate of recurrence after discontinuing therapy can be anywhere from 26% to 69%, and the highest likelihood occurs within a year of withdrawal.4 Close clinical follow-up is thus important.
Surgery, typically a transphenoidal resection, is performed by a neurosurgeon. Success of surgery is based on tumor size and basal prolactin level prior to the procedure. It is more effective in restoring normal prolactin levels and resolution of symptoms in microadenomas than in macroadenomas. Progressive vision loss, pituitary apoplexy, and intolerance to dopamine agonists are indications for surgery.1
Radiation therapy is reserved for those patients who have residual tumors postsurgery and have not responded to or are intolerant to dopamine agonists. Response to radiation is slow; it can sometimes take several years to achieve full effect. Gamma-knife radiation is sometimes used, but experience with this procedure is limited thus far in prolactinomas.
Overall, the vast majority of prolactinomas are benign and fairly straightforward to manage clinically.3
REFERENCES
1. Greenspan F, Gardner D. Basic & Clinical Endocrinology, 7th ed. New York: McGraw-Hill; 2004.
2. Ciccarelli A, Daly A, Beckers A. The epidemiology of prolactinomas. Pituitary. 2005;8(1):3-6.
3. Casanueva FF, Molitch ME, Schlechte JA, et al. Guidelines of the Pituitary Society for the diagnosis and management of prolactinomas. Clin Endocrinol (Oxf). 2006;65(2):265-273.
4. Melmed S, Casanueva FF, Hoffman AR, et al. Diagnosis and treatment of hyperprolactinemia: an Endocrine Society Clinical Practice Guideline. J Clinical Endocrinol Metab. 2011;96(2):273-288.
Change has come again to ICD-9 diagnostic codes
Did you know? When October 1 rolled around a short time ago, so did new codes for you to learn in the International Classification of Diseases, 9th Revision, Clinical Modification (ICD-9-CM).
If you consider that unpleasant news for your billing efforts, I also have what I consider good news: The 2012 fiscal year is the final year for changes to ICD-9-CM codes: On October 1, 2013, the nation switches to 10th Revision (that is, ICD-10-CM) codes. The National Center for Health Statistics has indicated that the only changes to ICD-9 codes permitted from now on are ones describing new diseases that require immediate reporting during this transition/freeze period.
This last set of changes isn’t as massive as what we saw in previous years. Nevertheless, the changes certainly enhance the ability of ObGyn practices to report the reasons for patient encounters.
The major gyn change this year involves reporting vaginal mesh complications. There are several new obstetric codes, too, to enhance reporting of cesarean delivery and management of high-risk OB conditions.
The new codes were added to the national code set on October 1. As in prior years, there is no grace period.
Changes to obstetric codes
ANTIPHOSPHOLIPID ANTIBODY
Antiphospholipid syndrome and lupus anticoagulant are associated with complications of pregnancy that include fetal loss, fetal growth restriction, preeclampsia, thrombosis, and autoimmune thrombocytopenia. Until now, the obstetrician reporting 649.3x (Coagulation defects complicating pregnancy, childbirth, or the puerperium), had only two secondary code options to further describe the patient’s condition: 795.79, used to report a finding of antiphospholipid antibody in a blood specimen, and 289.81, antiphospholipid antibody with hypercoagulable state.
A new code, 286.53 (Antiphospholipid antibody with hemorrhagic disorder), provides a third option when reporting 649.3x.
CHEMICAL PREGNANCY AND BLIGHTED OVUM
Fertility clinics and physicians who specialize in the use of assisted reproductive technology requested a code to identify patients who have what is referred to (imprecisely) as a “false-positive pregnancy,” “chemical pregnancy,” or “biochemical pregnancy.” These terms do not, however, accurately describe a pregnancy achieved using hormone stimulation or other such “chemical” methods.
In some cases, of course, a woman’s pregnancy test comes back positive, indicating a serum human chorionic gonadotropin (hCG) level, but, when she is followed with ultrasonography, no fetus is present—in effect, she has had an early miscarriage. But there has been no ICD-9 code to use at this stage that discriminates between confirmed ectopic pregnancy and confirmed miscarriage—only a code for a laboratory finding.
To improve the specificity of coding, therefore, and to track such pregnancies, existing code 631 (Other abnormal product of conception) has been expanded and divided in two:
| 631.0 | Inappropriate rise (decline) of quantitative hCG in early pregnancy |
| 631.8 | Other abnormal products of conception |
Documentation by the physician that signals that 631.0 should be reported might include a reference to biochemical pregnancy, chemical pregnancy, or an inappropriate level of quantitative hCG for gestational age in early pregnancy. For 631.8 to be reported, documentation might mention such findings as a “blighted ovum” or “fleshy mole.”
Note: Because of this code expansion, the three-digit code 631 will no longer be a valid code for billing purposes.
ELECTIVE CESAREAN DELIVERY BEFORE 39 WEEKS’ GESTATION
ACOG requested new codes for elective cesarean delivery before 39 weeks’ gestation—a scenario that is one of the new markers of quality of care. Whereas ICD-9 has two diagnosis codes that mention cesarean delivery (654.2x, [Previous cesarean delivery not otherwise specified] and 669.71 [Cesarean delivery, without mention of indication]), neither code captures a case in which a woman presents in labor at 37 to 38 weeks’ gestation and the physician determines that it is best to deliver at that time rather than try to take measures that will forestall delivery until the 39th week.
Although ICD-9 already also has a code for early onset of delivery (644.21), it applies only to pregnancies before 37 completed weeks.
The new codes are:
| 649.81 | Onset (spontaneous) of labor after 37 completed weeks of gestation but before 39 completed weeks’ gestation, with delivery by (planned) cesarean section, delivered, with or without mention of antepartum condition |
| 649.82 | Onset (spontaneous) of labor after 37 completed weeks of gestation but before 39 completed weeks’ gestation, with delivery by (planned) cesarean section, delivered, with mention of postpartum complication |
Note: The new code has two options for a fifth digit:
- Reporting a fifth digit 1 indicates that the patient may, or may not, have had a complication in the antepartum period that is related to early onset of labor.
- Reporting a fifth digit 2 indicates that the patient developed a complication after delivery (but before discharge) that is related to the delivery.
For any hospitalization that results in a delivery, you must select a fifth digit 1 or 2; the choice depends on the overriding complication. You may not list code 649.8 twice—i.e., once with a fifth digit 1 and once with a fifth digit 2.
If the patient had a condition that was documented to be why cesarean delivery was medically indicated, list that as a secondary diagnosis—for example, cephalopelvic disproportion (653.4x) or prior cesarean delivery (654.2x).
SUPERVISION OF HIGH-RISK PREGNANCY
Code subcategory V23.4 (Pregnancy with other poor obstetric history) had only two coding options before October 1, 2011: V23.41 (Pregnancy with history of pre-term labor) and V23.49 (Pregnancy with other poor obstetric history).
Ectopic pregnancy. ACOG considers that it is important to track patients who had a prior ectopic pregnancy because such a history gives rise to an increased risk of ectopic pregnancy during the current pregnancy. Therefore, a new code for this status was requested by ACOG, and provided.
Note: Use the new history code only until the patient is confirmed not to have an ectopic pregnancy, if that is the outcome. Once you’ve confirmed that she has only a normal, intrauterine pregnancy, the risk posed by her history no longer has an impact on the current pregnancy. (ICD-9 rules direct you to report conditions that require active intervention or a change in routine care of the pregnancy—not conditions that merely exist without the need for intervention or additional monitoring.)
The new code is:
| V23.42 | Pregnancy with history of ectopic pregnancy |
Fetal viability. There was also no specific code before October 1 to report the need for a sonogram to check fetal viability, especially when a previously confirmed pregnancy comes into question because of the apparent absence of a fetal heartbeat on examination of the mother. In such a case, an additional sonogram might be required beyond the initial scan to confirm fetal demise or a continuing viable pregnancy. Until now, either of these findings could have been reported only with codes that do not accurately describe the situation, such as 659.7 (Abnormality in fetal heart rate or rhythm); V28.89 (Other specified antenatal screening); and V23.89 (Other high-risk pregnancy).
The new code is:
| V23.87 | Pregnancy with inconclusive fetal viability |
Changes to gyn codes
An effective surgical treatment for vaginal vault prolapse is sacrocolpopexy that uses a graft to suspend the upper vagina to the anterior longitudinal ligament of the sacrum. But, regrettably, synthetic graft material has also been associated with erosion of the mesh and subsequent pelvic infection (by erosion into surrounding organs or tissue). Exposure of the mesh in the vagina can also occur (see “Take this simplified approach to correcting exposure of vaginal mesh” in the July 2011 issue, available at obgmanagement.com).
Before October 1, erosion or exposure of mesh (without infection) would have been reported with code 996.39 (Mechanical complication of a genitourinary device, implant and graft) or 996.76 (Other complications due to genitourinary device, implant, and graft). With creation of a new subcategory code, 629.3 (Complication of implanted vaginal mesh and other prosthetic materials), however, these specific complications can be reported and tracked. The new codes also give you a specific linking diagnosis for revision of the mesh.
The two new codes are:
| 629.31 | Erosion of implanted vaginal mesh and other prosthetic materials to surrounding organ or tissue (e.g., into pelvic floor muscles) |
| 629.32 | Exposure of implanted vaginal mesh and other prosthetic materials into vagina (e.g., through the vaginal wall) |
Note: If the patient’s graft material has caused fibrosis, hemorrhage, occlusion, or pain, continue to report 996.76. And, of course, any infection or inflammatory reaction caused by mesh is reported with existing code 996.65.
Because erosion and exposure can occur at the same time, it is proper to report both new codes, if that is the case.
HISTORY OF GESTATIONAL DIABETES
Code V12.2 (Personal history of endocrine, metabolic, and immunity disorders) has been expanded and divided into two five-digit codes:
| V12.21 | Gestational diabetes |
| V12.29 | Other endocrine, metabolic, and immunity disorders |
With this change, four-digit code V12.2 became an invalid diagnosis code; your claim will be denied if you report it as the reason for an encounter.
Note: Code V12.21 may not be reported as a primary diagnosis for an obstetrical patient. Instead, a personal history that may be having an impact on the current pregnancy should be reported with a V23.xx code (Supervision of high risk pregnancy), until (and if) the patient develops a condition.
For example: If a patient had gestational diabetes during a prior pregnancy, she risks developing it again in the current pregnancy. In that case, report V23.49 (Pregnancy with other poor obstetric history) as the primary code and assign V12.21 as the secondary code.
LONG-TERM USE OF BISPHOSPHONATES
In a woman being treated to prevent loss of bone mass, the side-effect profile of the medication and the need to measure its effectiveness require regular follow-up visits. Effective October 1, code V58.68 (Long-term [current] use of bisphosphonates) should be reported for these follow-up visits. The code can be also used to support ordering follow-up bone densitometry.
Medications that might be applicable here are alendronate (Fosamax), ibandronate (Boniva), risedronate (Actonel), and zoledronic acid (Reclast).
Download a free copy of the complete addenda of ICD-9-CM code changes that have been made for fiscal year 2012 at: www.cdc.gov/nchs/icd/icd9cm_addenda_guidelines.htm
We want to hear from you! Tell us what you think.
Strategies and steps for the surgical management of endometriosis
- Resection of an endometrioma in severe disease, using a “stripping” technique
- Ovarian cystectomy
- Resection of endometriosis from the left ligament
- Resection of endometriosis on the bladder
These videos were provided by Anthony Luciano, MD.
Endometriosis affects 7% to 10% of women in the United States, mostly during reproductive years.1 The estimated annual cost for managing the approximately 10 million affected women? More than $17 billion.2 The added cost of this chronic disease, with recurrences of pain and infertility, comes in the form of serious life disruption, emotional suffering, marital and social dysfunction, and diminished productivity.
Although the prevalence of endometriosis is highest during the third and fourth decades of life, the disease is also common in adolescent girls. Indeed, 45% of adolescents who have chronic pelvic pain are found to have endometriosis; if their pain does not respond to an oral contraceptive (OC) or a non-steroidal anti-inflammatory drug, 70% are subsequently found at laparoscopy to have endometriosis.3
What is it?
Endometriosis is the presence of functional endometrial tissue outside the uterus, such as eutopic endometrium. The disease responds to effects of cyclic ovarian hormones, proliferating and bleeding with each menstrual cycle, which often leads to diffuse inflammation, adhesions, and growth of endometriotic nodules or cysts (FIGURE 1).
FIGURE 1 Drainage will not suffice
Surgical management of ovarian endometriomas must go beyond simple drainage, which has little therapeutic value because symptoms recur and endometriomas re-form quickly after simple drainage in almost all patients.Symptoms tend to reflect affected organs:
- Because the pelvic organs are most often involved, the classic symptom triad of the disease comprises dysmenorrhea, dyspareunia, and infertility.
- Urinary urgency, dysuria, dyschezia, and tenesmus are frequent complaints when the bladder or rectosigmoid is involved.
- When distant organs are affected, such as the upper abdomen, diaphragm, lungs, and bowel, the patient may complain of respiratory symptoms, hemoptysis, pneumothorax, shoulder pain, upper abdominal pain, and episodic gastrointestinal dysfunction.
The hallmark of endometriosis is catamenial symptoms, which are usually cyclic and most severe around the time of menses. Clinical signs include palpable tender nodules and fibrosis on the anterior and posterior cul de sac, fixed retroverted or anteverted uterus, and adnexal cystic masses.
Because none of these symptoms or signs is specific for endometriosis, diagnosis relies on laparoscopy, which allows the surgeon to:
- visualize it in its various appearances and locations (FIGURE 2)
- confirm the diagnosis histologically with directed excisional biopsy
- treat it surgically with either excision or ablation.
In this article, we describe various surgical techniques for the management of endometriosis. Beyond resection or ablation of lesions, however, your care should also be directed to postoperative measures to prevent its recurrence and to avoid repeated surgical interventions—which, regrettably, are much too common in women who are afflicted by this enigmatic disease.
FIGURE 2 Endometriosis: A disease of varying appearance
Lesions of endometriosis can be pink, dark, clear, or white on the pelvic sidewall (A), bowel (B), and diaphragm (C); under the rib cage (D); and on the ureter (E) (left ureter shown here).
CASE Severe disease in a young woman
S. D. is a 22-year-old unmarried nulligravida who came to the emergency service complaining of acute onset of severe low abdominal pain, which developed while she was running. She was afebrile and in obvious distress, with diffuse lower abdominal tenderness and guarding, especially on the left side.
Ultrasonography revealed a 7-cm adnexal cystic mass suggestive of endometrioma (FIGURE 3).
Two years before this episode, S. D. underwent laparoscopic resection of a 5-cm endometrioma on the right ovary. Subsequently, she was treated with a cyclic OC, which she discontinued after 1 year because she was not sexually active.
The family history is positive for endometriosis in her mother, who had undergone multiple laparoscopic investigations and, eventually, total hysterectomy with bilateral salpingo-oophorectomy at 40 years of age.
S. D. was treated on the emergency service with analgesics and referred to you for surgical management.
S. D. has severe disease that requires aggressive surgical resection and a lifelong management plan. That plan includes liberal use of medical therapy to prevent recurrence of symptoms and avoid repeated surgical procedures—including the total hysterectomy with bilateral salpingo-oophorectomy that her mother underwent.
What is the best immediate treatment plan? Should you:
- drain the cyst?
- drain it and coagulate or ablate its wall?
- resect the wall of the cyst?
- perform salpingo-oophorectomy?
You also ask yourself: What is the risk of recurrence of endometrioma and its symptoms after each of those treatments? And how can I reduce those risks?
FIGURE 3 Endometrioma
Endometrioma on ultrasonography (A), with its characteristic homogeneous, echogenic appearance and “ground glass” pattern, and through the laparoscope (B). These images are from the patient whose case is described in the text.
Focal point: Ovary
The ovary is the most common organ affected by endometriosis. The presence of ovarian endometriomas, in 17% to 44% of patients who have this disease,4 is often associated with an advanced stage of disease.
In a population of 1,785 patients who were surgically treated for ovarian endometriosis, Redwine reported that only 1% had exclusively ovarian involvement; 99% also had diffuse pelvic disease,5 suggesting that ovarian endometrioma is a marker of extensive disease, which often requires a gynecologic surgeon who has advanced skills and experience in the surgical management of severe endometriosis.
Simple drainage is inadequate
Surgical management of ovarian endometrioma must go beyond simple drainage, which has little therapeutic value because symptoms recur and endometriomas re-form quickly after simple drainage in almost all patients.6 The currently accepted surgical management of endometrioma involves either 1) coagulation and ablation of the wall of the cyst with electrosurgery or laser or 2) removal of the cyst wall from the ovary with blunt and sharp dissection.
Several studies have compared these two techniques, but only two7,8 were prospectively randomized.
Study #1. Beretta and co-workers7 studied 64 patients who had ovarian endometriomas larger than 3 cm and randomized them to cystectomy by complete stripping of the cyst wall or to drainage of fluid followed by electrocoagulation to ablate the endometriosis lesions within the cyst wall. The two groups were followed for 2 years to assess the recurrence of symptoms and the pregnancy rate in the patients who were infertile.
Recurrence of symptoms and the need for medical or surgical intervention occurred with less frequency and much later in the resection group than in the ablation group: 19 months, compared to 9.5 months, postoperatively. The cumulative pregnancy rate 24 months postoperatively was also much higher in the resection group (66.7%) than in the ablative group (23.5%).
Study #2. In a later study,8 Alborzi and colleagues randomized 100 patients who had endometrioma to cystectomy or to drainage and coagulation of the cyst wall. The mean recurrence rate, 2 years postoperatively, was much lower in the excision group (15.8%) than in the ablative group (56.7%). The cumulative pregnancy rate at 12 months was higher in the excision group (54.9%, compared to 23.3%). Furthermore, the reoperation rate at 24 months was much lower in the excision group (5.8%) than in the ablative group (22.9%).
These favorable results for cystectomy over ablation were validated by a Cochrane Review, which concluded that excision of endometriomas is the preferred approach because it provides 1) a more favorable outcome than drainage and ablation, 2) lower rates of recurrence of endometriomas and symptoms, and 3) a much higher spontaneous pregnancy rate in infertile women.9
Although resection of the cyst wall is technically more challenging and takes longer to perform than drainage and ablation, we exclusively perform resection rather than ablation of endometriomas because we believe that more lasting therapeutic effects and reduced recurrence of symptoms and disease justify the extra effort and a longer procedure.
Drawback of cystectomy
A potential risk of cystectomy is that it can diminish ovarian reserve and, in rare cases, induce premature menopause, which can be devastating for women whose main purpose for having surgery is to restore or improve their fertility.
The impact of laparoscopic ovarian cystectomy on ovarian reserve was prospectively studied by Chang and co-workers,10 who measured preoperative and postoperative levels of anti-müllerian hormone (AMH) in 13 women who had endometrioma, 6 who had mature teratoma, and 1 who had mucinous cystadenoma. One week postoperatively, the AMH level decreased significantly overall in all groups. At 4 and 12 weeks postoperatively, however, the AMH level returned to preoperative levels among subjects in the non-endometrioma group but not among subjects who had endometrioma; rather, their level remained statistically lower than the preoperative level during the entire 3 months of follow-up.
Stripping the wall of an endometrioma cyst is more difficult than it is for other benign cysts, such as cystic teratoma or cystadenoma, in which there usually is a well-defined dissection plane between the wall of the cyst and surrounding stromal tissue—allowing for easy and clean separation of the wall. The cyst wall of an endometrioma, on the other hand, is intimately attached to underlying ovarian stroma; lack of a clear cleavage plane between cyst and ovarian stroma often results in unintentional removal of layers of ovarian cortex with underlying follicles, which, in turn, may lead to a reduction in ovarian reserve.
Histologic analyses of resected endometrioma cyst walls have reported follicle-containing ovarian tissue attached to the stripped cyst wall in 54% of cases.11,12 That observation explains why, and how, ovarian reserve can be compromised after resection of endometrioma.
Further risk: Ovarian failure
In rare cases, excision of endometriomas results in complete ovarian failure, described by Busacca and colleagues, who reported three cases of ovarian failure (2.4%) after resection of bilateral endometriomas in 126 patients.13 They attributed ovarian failure to excessive cauterization that compromised vascularization, as well as to excessive removal of ovarian tissue.
It is important, therefore, to strip the thinnest layer of the cyst capsule and to reduce the amount of electrocoagulation of ovarian stroma as much as possible to safeguard functional ovarian tissue.
CASE continued
S. D. was scheduled for laparoscopy to remove the endometrioma and other concurrent pelvic and peritoneal pathology, such as endometriosis and pelvic adhesions. You also scheduled her for hysteroscopy to evaluate the endometrial cavity for potential pathology, such as endometrial polyps and uterine septum, which appear to be more common in women who have endometriosis.
Nawroth and co-workers14 found a much higher incidence of endometriosis in patients who had a septate uterus. Metalliotakis and co-workers15 found congenital uterine malformations to be more common in patients who had endometriosis, compared with controls; uterine septum was, by far, the most common anomaly.
CASE continued
Hysteroscopy revealed a small and broad septum, which was resected sharply with hysteroscopic scissors (FIGURE 4). Laparoscopy revealed a 7-cm endometrioma on the left ovary, with adhesions to the posterior broad ligament and pelvic sidewall. S. D. also had deep implants of endometriosis on the left pelvic sidewall, the posterior cul de sac, the right pelvic sidewall, and the right ovary, which was cohesively adherent to the ovarian fossa.
As you expected, S. D. has stage-IV disease, according to the revised American Fertility Society Classification.
Following adhesiolysis, the endometrioma was resected (see VIDEO 1). Because of the large ovarian defect, the edges of the ovary were approximated with imbricating running 3-0 Vicryl suture. Deep endometriosis was also resected. Superficial endometriosis was peeled off or coagulated using bipolar forceps.
Note: Alternatively, and with comparable results, resection may be performed with a laser or other energy source. We prefer resection, rather than ablation, of deep endometriosis, but no data exists to support one technique over the other.
FIGURE 4 Septate uterus with deep cornua
Through the hysteroscope, a shallow septum is visible at the fundus of the uterus, dividing the upper endometrial cavity into two chambers (A), with deep cornua on the left (B) and right (C). Normal fundal anatomy is restored by septolysis along the avascular plane (D).
Technique: How we resect endometrioma
In removing endometrioma (see VIDEO 2), it is important to grasp the thinnest part of the cyst wall and progressively strip it, to avoid removing excess ovarian tissue and to reduce the risk of compromising ovarian reserve.
After draining the endometrioma of its chocolate-colored fluid, we irrigate and drain the cyst several times with warm lactated Ringers’ solution to promote separation of the cyst wall from underlying stroma and better identify the dissection plane. The cyst wall is inspected by introducing the laparoscope into the cyst to examine its surface, which is often laden with implants of deep and superficial endometriosis.
If we cannot easily identify the plane of dissection along the edges, we may evert the cyst and make an incision at its base to create a wedge between the wall of the cyst and underlying stroma. The edge of the incised wall is then grasped and retracted to create a space between the wall and the underlying stroma, from which it is progressively stripped from the ovary.
Traction and counter-traction are the hallmarks of dissection here; sometimes, we use laparoscopic scissors to sharply resect the ovarian stromal attachments that adhere cohesively to the cyst wall. This technique is continued until the entire cyst wall is removed. When follicle-containing ovarian tissue remains attached to the cyst wall, we introduce the closed tips of the Dolphin forceps between the cyst wall and adjacent follicle-containing stroma, spread the tips apart, and recover the true plane of dissection between the thin wall of the cyst and stroma.
After the wall of the cyst is removed, the ovarian crater invariably bleeds because blood vessels supplying the wall have been separated and opened. Utilizing warm lactated Ringers’ solution, we copiously irrigate the bleeding ovarian stroma to identify each bleeding vessel and, by placing the tips of the micro-bipolar forceps on either side of the bleeder, individually coagulate each vessel, thus inflicting minimal thermal damage to the surrounding stroma.
Pearl. Avoid using Kleppinger forceps to indiscriminately coagulate the bloody stroma in the crater created after the cystectomy, because doing so can result in excessive destruction of ovarian tissue or inadvertent coagulation of hylar vessels that would interrupt the blood supply to the ovary, compromising its function.16
Suturing. Some surgeons find that fenestration, drainage, and coagulation of the cyst wall is acceptable, but we have concerns not only about incomplete ablation of the endometriosis on the cyst wall, which may be responsible for the higher recurrence rate of disease, but also about the risk of thermal injury to underlying follicles, which may compromise ovarian reserve.16
Hemostasis. Once complete hemostasis has been achieved, the decision to approximate (or not) the edges, preferably with fine absorbable suture, is based on how large the defect is and whether or not the edges of the crater spontaneously come together. For large craters, we usually close the ovary with a 3-0 or 4-0 Vicryl continuous suture, imbricating the edges to expose as little suture material as possible to reduce postoperative formation of adhesions, which is common after ovarian surgery.17
Last, we ensure that hemostasis is present. Often we apply an anti-adhesion solution, such as icodextrin 4% (Adept). This agent has been shown to reduce postoperative adhesion formation, especially after laparoscopic surgery for endometriosis.18
A high level of skill is needed
Ovarian endometriomas signal advanced disease; advanced surgical skills are required to treat them adequately. Simple drainage is of little therapeutic value and should seldom be considered a treatment option. Although drainage plus ablation of the cyst wall ameliorates symptoms, excision of endometriomas should be considered preferable because it provides a more favorable outcome, a lower risk of recurrence of endometriomas and symptoms, and a higher rate of spontaneous pregnancy in previously infertile women.7-9
To recap, we advise the surgeon to:
- Manage ovarian endometriomas with resection of the entire cyst wall, grasping and stripping the thinnest layer of the cyst wall without removing underlying functional ovarian stroma.
- Avoid excessive cauterization of the underlying ovarian stroma by utilizing micro-bipolar forceps and applying energy only around bleeding vessels.
- Close stromal defects, when the crater is large and its edges do not spontaneously come together, by approximating the edges with an imbricating resorbable suture.
CASE continued
As in most cases of advanced endometriosis, S. D. also had diffuse implants of deep and superficial endometriosis on the peritoneum of the pelvic sidewalls and on the anterior and posterior cul de sac.
Should you ablate or resect these lesions? Are there advantages to either approach?
Ablation of endometriosis implants may involve either electrocoagulation of the lesion with bipolar energy or laser vaporization/coagulation, which destroys or devitalizes active endometriosis but does not actually remove the lesion. Ablation destroys the lesion without getting a specimen for histologic diagnosis.
Resection of endometriosis implants involves complete removal of the lesion from its epithelial surface to the depth of its base. Resection can be performed with scissors, laser, or monopolar electrosurgery. Resection removes the lesion in its entirety, yielding a histologic diagnosis and allowing you to determine whether, indeed, the entire specimen has been removed.
The question of what is more effective—ablating or resecting endometriosis implants?—was addressed in a prospective study in which 141 patients with endometriosis-related pain were randomized at laparoscopic surgery to either excision or ablation/coagulation of endometriosis lesions.19 Six months postoperatively, the pain score decreased by, on average, 11.2 points in the excision group and 8.7 points in the coagulation/ablative group.
Because the difference in those average pain scores was not statistically significant, however, investigators concluded that the techniques are comparable, with similar efficacy. That interpretation has been criticized because the study was underpowered and included only patients who had mild endometriosis—leaving open the possibility that deep endometriosis may not be adequately treated by electrocoagulation or ablation.
In contrast to superficial endometriosis, which may respond similarly to ablation or resection, deep endometriosis is difficult to ablate either with electrosurgery or a laser because the energy cannot reach deeper layers and active disease is therefore likely to be left behind. Moreover, when endometriosis overlies vital structures, such as the ureter or bowel, ablation of the lesion may cause thermal damage to the underlying organ, and such damage may not manifest until several days later, when the patient experiences, say, urinary leakage in the peritoneum or symptoms of bowel perforation.
FIGURE 5 illustrates a case in which CO2 laser ablation of endometriosis that had been causing deep dyspareunia did not alleviate symptoms. Because those symptoms persisted, the patient was referred to our center, where a second laparoscopy revealed deep nodules of endometriosis, 1 to 2 cm in diameter, extending from the right and the left uterosacral ligaments deep into the perirectal space, bilaterally.
As the bottom panel of FIGURE 5 shows, excised nodules were deep and large; neither laser nor electrosurgery would have been able to ablate or devitalize the deep endometriosis at the base of these 2-cm nodules.
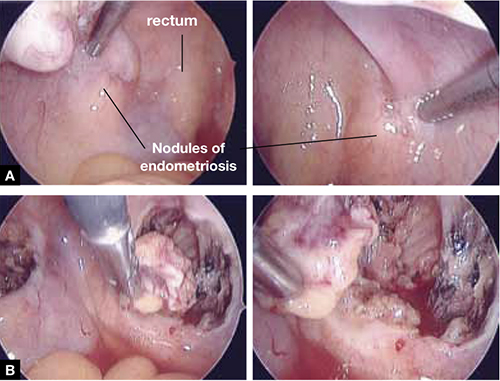
FIGURE 5 Deep nodules present a surgical challenge
These nodules of endometriosis on the right and left uterosacral ligaments (panel A) did not respond to CO2 laser ablation. Upon progressive resection, the implants were found to be deep, extending into the perirectal space (panel B). (See also VIDEO 3, resection of endometriosis from the left uterosacal ligament, close to the ureter.) FIGURE 6, illustrates endometriosis overlying the bladder and left ureter (see also VIDEO 4). Ablation of endometriosis in these areas may be inadequate if it is not deep enough, and dangerous if it goes too deep. As FIGURE 6 shows, excision assures the surgeon that the entire lesion has been removed and that underlying vital structures have been safeguarded.
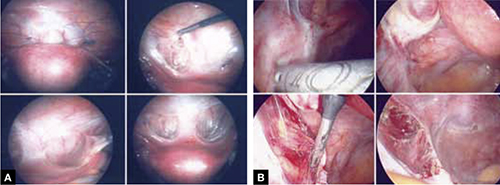
FIGURE 6 Urinary tract involvement
Endometriosis overlying the bladder is grasped, retracted, and resected (panel A). Endometriosis compresses the left ureter (panel B). The peritoneum above the lesion is entered, the ureter is displaced laterally, and the lesion is safely resected.
What we do, and recommend
When endometriosis is superficial and does not overlie vital organs, such as the bladder, ureter, and bowel, ablation and resection may be equally safe and effective. When endometriosis is deep and overlying vital organs, however, complete resection—with careful dissection of the lesion off underlying structures—offers a more complete and a safer surgical approach.
CASE continued
Now that S. D. has been treated surgically by complete excision of endometriosis, adhesions, and endometriomas, you must consider a management plan that will reduce the risks 1) of recurrence of symptoms and disease and 2) that further surgery will be necessary in the future—a risk that, in her case, exceeds 50% because of her young age, nulliparity, and the severity of her disease.20,21 Indeed, you are aware that, had preventive measures been implemented after her initial surgery 2 years earlier, it is unlikely that S. D. would have developed the second endometrioma and most likely that she would not have needed the second surgery.
Prevention of recurrence is necessary—and doable
The importance of implementing preventive measures to reduce the risk of recurrence of endometriosis and its symptoms has been suggested by several studies. It was underscored recently in a prospective, randomized study conducted by Serracchioli and colleagues,22 in which 239 women who had undergone laparoscopic resection of endometriomas were randomly assigned to expectant management (control group), a cyclic oral contraceptive (OC), or a continuous oral contraceptives for 24 months, and evaluated every 6 months.
At the end of the study, recurrence of symptoms occurred in 30% of controls; 15% of subjects taking a cyclic OC; and 7.5% of the subjects taking a continuous OC. The recurrence rate of endometrioma in this study was reduced by 50% (cyclic OC) and 75% (continuous OC).22
Similar results were reported in a case-controlled study by Vercellini and co-workers,23 who found that the risk of recurrence of endometrioma was reduced by 60% when postoperative OCs were used long-term and by 30% when used for a duration of less than 12 months.
These studies suggest that, by suppressing ovulation and inducing a state of hypomenorrhea or amenorrhea, the risk of recurrence of endometriosis and its symptoms can be significantly reduced.
The importance of amenorrhea in reducing the postoperative recurrence of endometriosis and symptoms has been underscored by two important studies that evaluated the role of postoperative endometrial ablation or postoperative insertion of the levonorgestrel intrauterine system (LNG-IUS; Mirena), neither of which suppresses ovulation but both of which induce a state of hypomenorrhea or amenorrhea.24,25
In a prospective randomized study by Bulletti and co-workers,24 28 patients who had symptomatic endometriosis underwent laparoscopic conservative surgery. Endometrial ablation was performed in 14 of the 28. Two years later, all patients underwent second-look laparoscopy; recurrence of endometriosis was found in 9 of the 14 non-ablation patients but in none in the ablation group. Resolution or significant improvement of symptoms were reported in 13 of 14 women in the ablation group but only in 3 of 14 in the non-ablation group—supporting the premise that amenorrhea or hypomenorrhea by itself, without suppressing ovulation, significantly reduces the risk that endometriosis will recur.
Similar beneficial results from hypomenorrhea/amenorrhea on the risk of recurrence of symptoms have been reported when the LNG-IUS is inserted following conservative surgery for endometriosis. In a prospective study by Vercellini and colleagues,25 40 symptomatic patients who had stage-III or stage-IV disease were randomized to either insertion of the LNG-IUS or a control group after conservative laparoscopic surgery. Recurrence of pain was significantly (P = .012) reduced in the LNG-IUS group (45%), compared with the control group (10%). Control subjects were also much less satisfied with their treatment than those who were treated with the LNG-IUS.
The importance of inducing a state of amenorrhea to reduce the risk of disease recurrence was further underscored by a recent study. Shakiba and colleagues26 reported on the recurrence of endometriosis that required further surgery as long as 7 years after the subjects had been surgically treated for symptomatic endometriosis. The need for subsequent surgery was 8% after hysterectomy and bilateral salpingo-oophorectomy; 12% after hysterectomy alone; and 60% after conservative laparoscopy with preservation of both uterus and ovaries.
Taken together, these data show that, unless the patient is rendered amenorrheic or hypomenorrheic, her risk of recurrence exceeds 50%.
It is important, therefore, to consider conservative surgical management of endometriosis as only the beginning of a lifelong management plan. That plan begins with complete resection of all visible endometriosis and adhesions, resection of endometriomas, and restoration of normal anatomy as much as possible.
When endometriosis cannot be completely resected—as when it involves small bowel or the diaphragm, or is diffusely on the large bowel—we recommend medical suppressive therapy. Our preference is depot leuprolide acetate (Lupron Depot), always with add-back therapy to minimize side effects, which include vasomotor symptoms, vaginal dryness, and bone loss,27 until the patient is significantly asymptomatic, which may take 6 to 9 months.
CASE Concluded, with long-term intervention
You counsel S. D. to remain on a low-dose hormonal OC continuously, until such time that she wants to conceive. If a patient does not want to conceive for at least 5 years, the LNG-IUS may be inserted at surgery to induce hypomenorrhea and reduce the risk of recurrence for the next 5 years.
When hormonal contraceptives are inadequate to control symptoms, adding the aromatase enzyme inhibitor letrozole (Femara), 2.5 mg daily for 6 to 9 months, usually alleviates symptoms with minimal side effects, as long as the patient keeps taking a hormonal contraceptive. Using letrozole without hormonal contraception has not been studied; doing so may lead to formation of ovarian cysts, and is therefore not recommended for managing symptomatic endometriosis.
If the patient wants to become pregnant, encourage her to actively undertake fertility treatment as soon as possible after surgery, thereby minimizing the risk of recurrence of symptoms and disease. The best option may be to employ assisted reproductive technology, but patients cannot always afford it; when that is the case, consider controlled ovarian stimulation and intrauterine insemination.
We want to hear from you! Tell us what you think.
1. Bulun S E. Endometriosis. N Engl J Med. 2009;360(3):268-279.
2. Gao X, Outley J, Botteman M, Spalding J, Simon JA, Pashos CL. Economic burden of endometriosis. Fertil Steril. 2006;86(6):1561-1572.
3. Laufer MR, Goitein L, Bush M, Cramer DW, Emans SJ. Prevalence of endometriosis in adolescent girls with chronic pelvic pain not responding conventional therapy. J Pediatr Adolesc Gynecol. 1997;10(4):199-202.
4. Gruppo Italiano per lo studio dell’endometriosi. Prevalence and anatomic distribution of endometriosis in women with selected gynaecological conditions: results from a multicenter Italian study. Hum Reprod. 1994;9(6):1158-1162.
5. Redwine DB. Ovarian endometriosis: a marker for more extensive pelvic and intestinal disease. Fertil Steril. 1999;72(2):319-315.
6. Muzii L, Marana R, Caruana P, Catalano GF, Mancuso S. Laparoscopic findings after transvaginal ultrasound-guided aspiration of ovarian endometriomas. Hum Reprod. 1995;10(11):2902-2903
7. Beretta P, Franchi M, Ghezzi F, Busacca M, Zupi E, Bolis P. Randomized clinical trial of two laparoscopic treatment of endometriomas: cystectomy versus drainage and coagulation. Fertil Steril. 1998;70(6):1176-1180
8. Alborzi S, Momtahan M, Paranezhad ME, Dehbashi S, Zolghadri J, Alborzi S. A prospective randomized study comparing laparoscopic ovarian cystectomy versus fenestration and coagulation in patients with endometriomas. Fertil Steril. 2004;82(6):1633-1637
9. Hart RJ, Hickey M, Maouris P, Buckett W, Garry R. Excisional surgery versus ablative surgery for ovarian endometriomas. Cochrane Database Syst Rev. 2005;(3):CD004992.-
10. Chang HJ, Sang HH, Jung RL, et al. Impact of laparoscopic cystectomy on ovarian reserve: serial changes of serum anti-Müllerian hormone levels. Fertil Steril. 2010;94(1):343-349.
11. Muzii L. Bianchi A Crocè C, Manci N, Panici PB. Laparoscopic excision of ovarian cysts: is the stripping technique a tissue sparing procedure? Fertil Steril. 2002;77(3):609-614.
12. Hachisuga T, Kawarabyashi T. Histopathological analysis of laparoscopically treated ovarian endometriotic cysts with special reference to loss of follicles. Hum Reprod. 2002;17(2):432-435.
13. Busacca M, Riparini J Somigliana E, et al. Postsurgical ovarian failure after laparoscopic excision of bilateral endometriomas. Am J Obstet Gynecol. 2006;195(2):421-425.
14. Nawroth F, Rahimi G, Nawroth C, Foth D, Ludwig M, Schmidt T. Is there an association between septate uterus and endometriosis? Hum Reprod. 2006;21(2):542-546.
15. Matalliotakis IM, Goumenou AG, Matalliotakis M, Arici A. Uterine anomalies in women with endometriosis. J Endometriosis. 2010;2(4):213-217.
16. Li CZ, Liu B, Wen ZQ, Sun Q. The impact of electrocoagulation on ovarian reserve after laparoscopic excision of ovarian cyst: a prospective clinical study of 191 patients. Fertil Steril. 2009;92(4):1428-1435.
17. Luciano DE, Roy G, Luciano AA. Adhesion reformation after laparoscopic adhesiolysis: where what type, and in whom are they most likely to recur. J Minim Invasive Gynecol. 2008;15(1):44-48.
18. Colin CB, Luciano AA, Martin D, et al. Adept (icodextrin 4% solution) reduces adhesions after laparoscopic surgery for adhesiolysis: a double-blind, randomized, controlled study. Fertil Steril. 2007;88(5):1413-1426.
19. Wright J, Lotfallah H, Jones K, Lovell D. A randomized study of excision vs ablation for mild endometriosis. Fertil Steril. 2004;83(6):1830-1836.
20. Cheong Y, Tay P, Luk F, Gan HC, Li TC, Cooke I. Laparoscopic surgery for endometriosis: How often do we need to re-operate? J Obstet Gynaecol. 2008;28(1):82-85.
21. Liu X, Yuan L, Shen F, Zhu Z, Jiang H, Guo SW. Patterns of and risk factors for recurrence in women with ovarian endometriomas. Obstet Gynecol. 2007;109(6):1411-1120.
22. Seracchioli R, Mabrouk M, Frasca C, et al. Long-term cyclic and continuous oral contraceptive therapy and endometriomas recurrence: a randomized controlled trial. Fertil Steril. 2010;93(1):52-56.
23. Vercellini P, Somigliana E, Daguati R, Vigano P, Meroni F, Crosignani PG. Postoperative oral contraceptive exposure and risk of endometrioma recurrence. Am J Obstet Gynecol. 2008;198(5):504.e1-5.
24. Bulletti C, DeZiegler D, Stefanetti M, Cicinelli E, Pelosi E, Flamigni C. Endometriosis: absence of recurrence in patients after endometrial ablation. Hum Reprod. 2001;16(12):2676-2679.
25. Vercellini P, Frontino G, De Giorgi O, Aimi G, Zaina B, Crosignani PG. Comparison of levonorgestrel-releasing intrauterine device versus expectant management after conservative surgery for symptomatic endometriosis: a pilot study. Fertil Steril. 2003;80(2):305-309.
26. Shakiba K, Bena JF, McGill KM, Minger J, Falcone T. Surgical treatment of endometriosis: a 7-year follow-up on the requirement for further surgery. Obstet Gynecol. 2008;111(6):1285-1292.
27. Surrey ES, Hornstein MD. Prolonged GnRH agonist and add-back therapy for symptomatic endometriosis: a long-term follow-up Obstet Gynecol. 2002;99(5 Pt 1):709-719.
- Resection of an endometrioma in severe disease, using a “stripping” technique
- Ovarian cystectomy
- Resection of endometriosis from the left ligament
- Resection of endometriosis on the bladder
These videos were provided by Anthony Luciano, MD.
Endometriosis affects 7% to 10% of women in the United States, mostly during reproductive years.1 The estimated annual cost for managing the approximately 10 million affected women? More than $17 billion.2 The added cost of this chronic disease, with recurrences of pain and infertility, comes in the form of serious life disruption, emotional suffering, marital and social dysfunction, and diminished productivity.
Although the prevalence of endometriosis is highest during the third and fourth decades of life, the disease is also common in adolescent girls. Indeed, 45% of adolescents who have chronic pelvic pain are found to have endometriosis; if their pain does not respond to an oral contraceptive (OC) or a non-steroidal anti-inflammatory drug, 70% are subsequently found at laparoscopy to have endometriosis.3
What is it?
Endometriosis is the presence of functional endometrial tissue outside the uterus, such as eutopic endometrium. The disease responds to effects of cyclic ovarian hormones, proliferating and bleeding with each menstrual cycle, which often leads to diffuse inflammation, adhesions, and growth of endometriotic nodules or cysts (FIGURE 1).
FIGURE 1 Drainage will not suffice
Surgical management of ovarian endometriomas must go beyond simple drainage, which has little therapeutic value because symptoms recur and endometriomas re-form quickly after simple drainage in almost all patients.Symptoms tend to reflect affected organs:
- Because the pelvic organs are most often involved, the classic symptom triad of the disease comprises dysmenorrhea, dyspareunia, and infertility.
- Urinary urgency, dysuria, dyschezia, and tenesmus are frequent complaints when the bladder or rectosigmoid is involved.
- When distant organs are affected, such as the upper abdomen, diaphragm, lungs, and bowel, the patient may complain of respiratory symptoms, hemoptysis, pneumothorax, shoulder pain, upper abdominal pain, and episodic gastrointestinal dysfunction.
The hallmark of endometriosis is catamenial symptoms, which are usually cyclic and most severe around the time of menses. Clinical signs include palpable tender nodules and fibrosis on the anterior and posterior cul de sac, fixed retroverted or anteverted uterus, and adnexal cystic masses.
Because none of these symptoms or signs is specific for endometriosis, diagnosis relies on laparoscopy, which allows the surgeon to:
- visualize it in its various appearances and locations (FIGURE 2)
- confirm the diagnosis histologically with directed excisional biopsy
- treat it surgically with either excision or ablation.
In this article, we describe various surgical techniques for the management of endometriosis. Beyond resection or ablation of lesions, however, your care should also be directed to postoperative measures to prevent its recurrence and to avoid repeated surgical interventions—which, regrettably, are much too common in women who are afflicted by this enigmatic disease.
FIGURE 2 Endometriosis: A disease of varying appearance
Lesions of endometriosis can be pink, dark, clear, or white on the pelvic sidewall (A), bowel (B), and diaphragm (C); under the rib cage (D); and on the ureter (E) (left ureter shown here).
CASE Severe disease in a young woman
S. D. is a 22-year-old unmarried nulligravida who came to the emergency service complaining of acute onset of severe low abdominal pain, which developed while she was running. She was afebrile and in obvious distress, with diffuse lower abdominal tenderness and guarding, especially on the left side.
Ultrasonography revealed a 7-cm adnexal cystic mass suggestive of endometrioma (FIGURE 3).
Two years before this episode, S. D. underwent laparoscopic resection of a 5-cm endometrioma on the right ovary. Subsequently, she was treated with a cyclic OC, which she discontinued after 1 year because she was not sexually active.
The family history is positive for endometriosis in her mother, who had undergone multiple laparoscopic investigations and, eventually, total hysterectomy with bilateral salpingo-oophorectomy at 40 years of age.
S. D. was treated on the emergency service with analgesics and referred to you for surgical management.
S. D. has severe disease that requires aggressive surgical resection and a lifelong management plan. That plan includes liberal use of medical therapy to prevent recurrence of symptoms and avoid repeated surgical procedures—including the total hysterectomy with bilateral salpingo-oophorectomy that her mother underwent.
What is the best immediate treatment plan? Should you:
- drain the cyst?
- drain it and coagulate or ablate its wall?
- resect the wall of the cyst?
- perform salpingo-oophorectomy?
You also ask yourself: What is the risk of recurrence of endometrioma and its symptoms after each of those treatments? And how can I reduce those risks?
FIGURE 3 Endometrioma
Endometrioma on ultrasonography (A), with its characteristic homogeneous, echogenic appearance and “ground glass” pattern, and through the laparoscope (B). These images are from the patient whose case is described in the text.
Focal point: Ovary
The ovary is the most common organ affected by endometriosis. The presence of ovarian endometriomas, in 17% to 44% of patients who have this disease,4 is often associated with an advanced stage of disease.
In a population of 1,785 patients who were surgically treated for ovarian endometriosis, Redwine reported that only 1% had exclusively ovarian involvement; 99% also had diffuse pelvic disease,5 suggesting that ovarian endometrioma is a marker of extensive disease, which often requires a gynecologic surgeon who has advanced skills and experience in the surgical management of severe endometriosis.
Simple drainage is inadequate
Surgical management of ovarian endometrioma must go beyond simple drainage, which has little therapeutic value because symptoms recur and endometriomas re-form quickly after simple drainage in almost all patients.6 The currently accepted surgical management of endometrioma involves either 1) coagulation and ablation of the wall of the cyst with electrosurgery or laser or 2) removal of the cyst wall from the ovary with blunt and sharp dissection.
Several studies have compared these two techniques, but only two7,8 were prospectively randomized.
Study #1. Beretta and co-workers7 studied 64 patients who had ovarian endometriomas larger than 3 cm and randomized them to cystectomy by complete stripping of the cyst wall or to drainage of fluid followed by electrocoagulation to ablate the endometriosis lesions within the cyst wall. The two groups were followed for 2 years to assess the recurrence of symptoms and the pregnancy rate in the patients who were infertile.
Recurrence of symptoms and the need for medical or surgical intervention occurred with less frequency and much later in the resection group than in the ablation group: 19 months, compared to 9.5 months, postoperatively. The cumulative pregnancy rate 24 months postoperatively was also much higher in the resection group (66.7%) than in the ablative group (23.5%).
Study #2. In a later study,8 Alborzi and colleagues randomized 100 patients who had endometrioma to cystectomy or to drainage and coagulation of the cyst wall. The mean recurrence rate, 2 years postoperatively, was much lower in the excision group (15.8%) than in the ablative group (56.7%). The cumulative pregnancy rate at 12 months was higher in the excision group (54.9%, compared to 23.3%). Furthermore, the reoperation rate at 24 months was much lower in the excision group (5.8%) than in the ablative group (22.9%).
These favorable results for cystectomy over ablation were validated by a Cochrane Review, which concluded that excision of endometriomas is the preferred approach because it provides 1) a more favorable outcome than drainage and ablation, 2) lower rates of recurrence of endometriomas and symptoms, and 3) a much higher spontaneous pregnancy rate in infertile women.9
Although resection of the cyst wall is technically more challenging and takes longer to perform than drainage and ablation, we exclusively perform resection rather than ablation of endometriomas because we believe that more lasting therapeutic effects and reduced recurrence of symptoms and disease justify the extra effort and a longer procedure.
Drawback of cystectomy
A potential risk of cystectomy is that it can diminish ovarian reserve and, in rare cases, induce premature menopause, which can be devastating for women whose main purpose for having surgery is to restore or improve their fertility.
The impact of laparoscopic ovarian cystectomy on ovarian reserve was prospectively studied by Chang and co-workers,10 who measured preoperative and postoperative levels of anti-müllerian hormone (AMH) in 13 women who had endometrioma, 6 who had mature teratoma, and 1 who had mucinous cystadenoma. One week postoperatively, the AMH level decreased significantly overall in all groups. At 4 and 12 weeks postoperatively, however, the AMH level returned to preoperative levels among subjects in the non-endometrioma group but not among subjects who had endometrioma; rather, their level remained statistically lower than the preoperative level during the entire 3 months of follow-up.
Stripping the wall of an endometrioma cyst is more difficult than it is for other benign cysts, such as cystic teratoma or cystadenoma, in which there usually is a well-defined dissection plane between the wall of the cyst and surrounding stromal tissue—allowing for easy and clean separation of the wall. The cyst wall of an endometrioma, on the other hand, is intimately attached to underlying ovarian stroma; lack of a clear cleavage plane between cyst and ovarian stroma often results in unintentional removal of layers of ovarian cortex with underlying follicles, which, in turn, may lead to a reduction in ovarian reserve.
Histologic analyses of resected endometrioma cyst walls have reported follicle-containing ovarian tissue attached to the stripped cyst wall in 54% of cases.11,12 That observation explains why, and how, ovarian reserve can be compromised after resection of endometrioma.
Further risk: Ovarian failure
In rare cases, excision of endometriomas results in complete ovarian failure, described by Busacca and colleagues, who reported three cases of ovarian failure (2.4%) after resection of bilateral endometriomas in 126 patients.13 They attributed ovarian failure to excessive cauterization that compromised vascularization, as well as to excessive removal of ovarian tissue.
It is important, therefore, to strip the thinnest layer of the cyst capsule and to reduce the amount of electrocoagulation of ovarian stroma as much as possible to safeguard functional ovarian tissue.
CASE continued
S. D. was scheduled for laparoscopy to remove the endometrioma and other concurrent pelvic and peritoneal pathology, such as endometriosis and pelvic adhesions. You also scheduled her for hysteroscopy to evaluate the endometrial cavity for potential pathology, such as endometrial polyps and uterine septum, which appear to be more common in women who have endometriosis.
Nawroth and co-workers14 found a much higher incidence of endometriosis in patients who had a septate uterus. Metalliotakis and co-workers15 found congenital uterine malformations to be more common in patients who had endometriosis, compared with controls; uterine septum was, by far, the most common anomaly.
CASE continued
Hysteroscopy revealed a small and broad septum, which was resected sharply with hysteroscopic scissors (FIGURE 4). Laparoscopy revealed a 7-cm endometrioma on the left ovary, with adhesions to the posterior broad ligament and pelvic sidewall. S. D. also had deep implants of endometriosis on the left pelvic sidewall, the posterior cul de sac, the right pelvic sidewall, and the right ovary, which was cohesively adherent to the ovarian fossa.
As you expected, S. D. has stage-IV disease, according to the revised American Fertility Society Classification.
Following adhesiolysis, the endometrioma was resected (see VIDEO 1). Because of the large ovarian defect, the edges of the ovary were approximated with imbricating running 3-0 Vicryl suture. Deep endometriosis was also resected. Superficial endometriosis was peeled off or coagulated using bipolar forceps.
Note: Alternatively, and with comparable results, resection may be performed with a laser or other energy source. We prefer resection, rather than ablation, of deep endometriosis, but no data exists to support one technique over the other.
FIGURE 4 Septate uterus with deep cornua
Through the hysteroscope, a shallow septum is visible at the fundus of the uterus, dividing the upper endometrial cavity into two chambers (A), with deep cornua on the left (B) and right (C). Normal fundal anatomy is restored by septolysis along the avascular plane (D).
Technique: How we resect endometrioma
In removing endometrioma (see VIDEO 2), it is important to grasp the thinnest part of the cyst wall and progressively strip it, to avoid removing excess ovarian tissue and to reduce the risk of compromising ovarian reserve.
After draining the endometrioma of its chocolate-colored fluid, we irrigate and drain the cyst several times with warm lactated Ringers’ solution to promote separation of the cyst wall from underlying stroma and better identify the dissection plane. The cyst wall is inspected by introducing the laparoscope into the cyst to examine its surface, which is often laden with implants of deep and superficial endometriosis.
If we cannot easily identify the plane of dissection along the edges, we may evert the cyst and make an incision at its base to create a wedge between the wall of the cyst and underlying stroma. The edge of the incised wall is then grasped and retracted to create a space between the wall and the underlying stroma, from which it is progressively stripped from the ovary.
Traction and counter-traction are the hallmarks of dissection here; sometimes, we use laparoscopic scissors to sharply resect the ovarian stromal attachments that adhere cohesively to the cyst wall. This technique is continued until the entire cyst wall is removed. When follicle-containing ovarian tissue remains attached to the cyst wall, we introduce the closed tips of the Dolphin forceps between the cyst wall and adjacent follicle-containing stroma, spread the tips apart, and recover the true plane of dissection between the thin wall of the cyst and stroma.
After the wall of the cyst is removed, the ovarian crater invariably bleeds because blood vessels supplying the wall have been separated and opened. Utilizing warm lactated Ringers’ solution, we copiously irrigate the bleeding ovarian stroma to identify each bleeding vessel and, by placing the tips of the micro-bipolar forceps on either side of the bleeder, individually coagulate each vessel, thus inflicting minimal thermal damage to the surrounding stroma.
Pearl. Avoid using Kleppinger forceps to indiscriminately coagulate the bloody stroma in the crater created after the cystectomy, because doing so can result in excessive destruction of ovarian tissue or inadvertent coagulation of hylar vessels that would interrupt the blood supply to the ovary, compromising its function.16
Suturing. Some surgeons find that fenestration, drainage, and coagulation of the cyst wall is acceptable, but we have concerns not only about incomplete ablation of the endometriosis on the cyst wall, which may be responsible for the higher recurrence rate of disease, but also about the risk of thermal injury to underlying follicles, which may compromise ovarian reserve.16
Hemostasis. Once complete hemostasis has been achieved, the decision to approximate (or not) the edges, preferably with fine absorbable suture, is based on how large the defect is and whether or not the edges of the crater spontaneously come together. For large craters, we usually close the ovary with a 3-0 or 4-0 Vicryl continuous suture, imbricating the edges to expose as little suture material as possible to reduce postoperative formation of adhesions, which is common after ovarian surgery.17
Last, we ensure that hemostasis is present. Often we apply an anti-adhesion solution, such as icodextrin 4% (Adept). This agent has been shown to reduce postoperative adhesion formation, especially after laparoscopic surgery for endometriosis.18
A high level of skill is needed
Ovarian endometriomas signal advanced disease; advanced surgical skills are required to treat them adequately. Simple drainage is of little therapeutic value and should seldom be considered a treatment option. Although drainage plus ablation of the cyst wall ameliorates symptoms, excision of endometriomas should be considered preferable because it provides a more favorable outcome, a lower risk of recurrence of endometriomas and symptoms, and a higher rate of spontaneous pregnancy in previously infertile women.7-9
To recap, we advise the surgeon to:
- Manage ovarian endometriomas with resection of the entire cyst wall, grasping and stripping the thinnest layer of the cyst wall without removing underlying functional ovarian stroma.
- Avoid excessive cauterization of the underlying ovarian stroma by utilizing micro-bipolar forceps and applying energy only around bleeding vessels.
- Close stromal defects, when the crater is large and its edges do not spontaneously come together, by approximating the edges with an imbricating resorbable suture.
CASE continued
As in most cases of advanced endometriosis, S. D. also had diffuse implants of deep and superficial endometriosis on the peritoneum of the pelvic sidewalls and on the anterior and posterior cul de sac.
Should you ablate or resect these lesions? Are there advantages to either approach?
Ablation of endometriosis implants may involve either electrocoagulation of the lesion with bipolar energy or laser vaporization/coagulation, which destroys or devitalizes active endometriosis but does not actually remove the lesion. Ablation destroys the lesion without getting a specimen for histologic diagnosis.
Resection of endometriosis implants involves complete removal of the lesion from its epithelial surface to the depth of its base. Resection can be performed with scissors, laser, or monopolar electrosurgery. Resection removes the lesion in its entirety, yielding a histologic diagnosis and allowing you to determine whether, indeed, the entire specimen has been removed.
The question of what is more effective—ablating or resecting endometriosis implants?—was addressed in a prospective study in which 141 patients with endometriosis-related pain were randomized at laparoscopic surgery to either excision or ablation/coagulation of endometriosis lesions.19 Six months postoperatively, the pain score decreased by, on average, 11.2 points in the excision group and 8.7 points in the coagulation/ablative group.
Because the difference in those average pain scores was not statistically significant, however, investigators concluded that the techniques are comparable, with similar efficacy. That interpretation has been criticized because the study was underpowered and included only patients who had mild endometriosis—leaving open the possibility that deep endometriosis may not be adequately treated by electrocoagulation or ablation.
In contrast to superficial endometriosis, which may respond similarly to ablation or resection, deep endometriosis is difficult to ablate either with electrosurgery or a laser because the energy cannot reach deeper layers and active disease is therefore likely to be left behind. Moreover, when endometriosis overlies vital structures, such as the ureter or bowel, ablation of the lesion may cause thermal damage to the underlying organ, and such damage may not manifest until several days later, when the patient experiences, say, urinary leakage in the peritoneum or symptoms of bowel perforation.
FIGURE 5 illustrates a case in which CO2 laser ablation of endometriosis that had been causing deep dyspareunia did not alleviate symptoms. Because those symptoms persisted, the patient was referred to our center, where a second laparoscopy revealed deep nodules of endometriosis, 1 to 2 cm in diameter, extending from the right and the left uterosacral ligaments deep into the perirectal space, bilaterally.
As the bottom panel of FIGURE 5 shows, excised nodules were deep and large; neither laser nor electrosurgery would have been able to ablate or devitalize the deep endometriosis at the base of these 2-cm nodules.
FIGURE 5 Deep nodules present a surgical challenge
These nodules of endometriosis on the right and left uterosacral ligaments (panel A) did not respond to CO2 laser ablation. Upon progressive resection, the implants were found to be deep, extending into the perirectal space (panel B). (See also VIDEO 3, resection of endometriosis from the left uterosacal ligament, close to the ureter.) FIGURE 6, illustrates endometriosis overlying the bladder and left ureter (see also VIDEO 4). Ablation of endometriosis in these areas may be inadequate if it is not deep enough, and dangerous if it goes too deep. As FIGURE 6 shows, excision assures the surgeon that the entire lesion has been removed and that underlying vital structures have been safeguarded.
FIGURE 6 Urinary tract involvement
Endometriosis overlying the bladder is grasped, retracted, and resected (panel A). Endometriosis compresses the left ureter (panel B). The peritoneum above the lesion is entered, the ureter is displaced laterally, and the lesion is safely resected.
What we do, and recommend
When endometriosis is superficial and does not overlie vital organs, such as the bladder, ureter, and bowel, ablation and resection may be equally safe and effective. When endometriosis is deep and overlying vital organs, however, complete resection—with careful dissection of the lesion off underlying structures—offers a more complete and a safer surgical approach.
CASE continued
Now that S. D. has been treated surgically by complete excision of endometriosis, adhesions, and endometriomas, you must consider a management plan that will reduce the risks 1) of recurrence of symptoms and disease and 2) that further surgery will be necessary in the future—a risk that, in her case, exceeds 50% because of her young age, nulliparity, and the severity of her disease.20,21 Indeed, you are aware that, had preventive measures been implemented after her initial surgery 2 years earlier, it is unlikely that S. D. would have developed the second endometrioma and most likely that she would not have needed the second surgery.
Prevention of recurrence is necessary—and doable
The importance of implementing preventive measures to reduce the risk of recurrence of endometriosis and its symptoms has been suggested by several studies. It was underscored recently in a prospective, randomized study conducted by Serracchioli and colleagues,22 in which 239 women who had undergone laparoscopic resection of endometriomas were randomly assigned to expectant management (control group), a cyclic oral contraceptive (OC), or a continuous oral contraceptives for 24 months, and evaluated every 6 months.
At the end of the study, recurrence of symptoms occurred in 30% of controls; 15% of subjects taking a cyclic OC; and 7.5% of the subjects taking a continuous OC. The recurrence rate of endometrioma in this study was reduced by 50% (cyclic OC) and 75% (continuous OC).22
Similar results were reported in a case-controlled study by Vercellini and co-workers,23 who found that the risk of recurrence of endometrioma was reduced by 60% when postoperative OCs were used long-term and by 30% when used for a duration of less than 12 months.
These studies suggest that, by suppressing ovulation and inducing a state of hypomenorrhea or amenorrhea, the risk of recurrence of endometriosis and its symptoms can be significantly reduced.
The importance of amenorrhea in reducing the postoperative recurrence of endometriosis and symptoms has been underscored by two important studies that evaluated the role of postoperative endometrial ablation or postoperative insertion of the levonorgestrel intrauterine system (LNG-IUS; Mirena), neither of which suppresses ovulation but both of which induce a state of hypomenorrhea or amenorrhea.24,25
In a prospective randomized study by Bulletti and co-workers,24 28 patients who had symptomatic endometriosis underwent laparoscopic conservative surgery. Endometrial ablation was performed in 14 of the 28. Two years later, all patients underwent second-look laparoscopy; recurrence of endometriosis was found in 9 of the 14 non-ablation patients but in none in the ablation group. Resolution or significant improvement of symptoms were reported in 13 of 14 women in the ablation group but only in 3 of 14 in the non-ablation group—supporting the premise that amenorrhea or hypomenorrhea by itself, without suppressing ovulation, significantly reduces the risk that endometriosis will recur.
Similar beneficial results from hypomenorrhea/amenorrhea on the risk of recurrence of symptoms have been reported when the LNG-IUS is inserted following conservative surgery for endometriosis. In a prospective study by Vercellini and colleagues,25 40 symptomatic patients who had stage-III or stage-IV disease were randomized to either insertion of the LNG-IUS or a control group after conservative laparoscopic surgery. Recurrence of pain was significantly (P = .012) reduced in the LNG-IUS group (45%), compared with the control group (10%). Control subjects were also much less satisfied with their treatment than those who were treated with the LNG-IUS.
The importance of inducing a state of amenorrhea to reduce the risk of disease recurrence was further underscored by a recent study. Shakiba and colleagues26 reported on the recurrence of endometriosis that required further surgery as long as 7 years after the subjects had been surgically treated for symptomatic endometriosis. The need for subsequent surgery was 8% after hysterectomy and bilateral salpingo-oophorectomy; 12% after hysterectomy alone; and 60% after conservative laparoscopy with preservation of both uterus and ovaries.
Taken together, these data show that, unless the patient is rendered amenorrheic or hypomenorrheic, her risk of recurrence exceeds 50%.
It is important, therefore, to consider conservative surgical management of endometriosis as only the beginning of a lifelong management plan. That plan begins with complete resection of all visible endometriosis and adhesions, resection of endometriomas, and restoration of normal anatomy as much as possible.
When endometriosis cannot be completely resected—as when it involves small bowel or the diaphragm, or is diffusely on the large bowel—we recommend medical suppressive therapy. Our preference is depot leuprolide acetate (Lupron Depot), always with add-back therapy to minimize side effects, which include vasomotor symptoms, vaginal dryness, and bone loss,27 until the patient is significantly asymptomatic, which may take 6 to 9 months.
CASE Concluded, with long-term intervention
You counsel S. D. to remain on a low-dose hormonal OC continuously, until such time that she wants to conceive. If a patient does not want to conceive for at least 5 years, the LNG-IUS may be inserted at surgery to induce hypomenorrhea and reduce the risk of recurrence for the next 5 years.
When hormonal contraceptives are inadequate to control symptoms, adding the aromatase enzyme inhibitor letrozole (Femara), 2.5 mg daily for 6 to 9 months, usually alleviates symptoms with minimal side effects, as long as the patient keeps taking a hormonal contraceptive. Using letrozole without hormonal contraception has not been studied; doing so may lead to formation of ovarian cysts, and is therefore not recommended for managing symptomatic endometriosis.
If the patient wants to become pregnant, encourage her to actively undertake fertility treatment as soon as possible after surgery, thereby minimizing the risk of recurrence of symptoms and disease. The best option may be to employ assisted reproductive technology, but patients cannot always afford it; when that is the case, consider controlled ovarian stimulation and intrauterine insemination.
We want to hear from you! Tell us what you think.
1. Bulun S E. Endometriosis. N Engl J Med. 2009;360(3):268-279.
2. Gao X, Outley J, Botteman M, Spalding J, Simon JA, Pashos CL. Economic burden of endometriosis. Fertil Steril. 2006;86(6):1561-1572.
3. Laufer MR, Goitein L, Bush M, Cramer DW, Emans SJ. Prevalence of endometriosis in adolescent girls with chronic pelvic pain not responding conventional therapy. J Pediatr Adolesc Gynecol. 1997;10(4):199-202.
4. Gruppo Italiano per lo studio dell’endometriosi. Prevalence and anatomic distribution of endometriosis in women with selected gynaecological conditions: results from a multicenter Italian study. Hum Reprod. 1994;9(6):1158-1162.
5. Redwine DB. Ovarian endometriosis: a marker for more extensive pelvic and intestinal disease. Fertil Steril. 1999;72(2):319-315.
6. Muzii L, Marana R, Caruana P, Catalano GF, Mancuso S. Laparoscopic findings after transvaginal ultrasound-guided aspiration of ovarian endometriomas. Hum Reprod. 1995;10(11):2902-2903
7. Beretta P, Franchi M, Ghezzi F, Busacca M, Zupi E, Bolis P. Randomized clinical trial of two laparoscopic treatment of endometriomas: cystectomy versus drainage and coagulation. Fertil Steril. 1998;70(6):1176-1180
8. Alborzi S, Momtahan M, Paranezhad ME, Dehbashi S, Zolghadri J, Alborzi S. A prospective randomized study comparing laparoscopic ovarian cystectomy versus fenestration and coagulation in patients with endometriomas. Fertil Steril. 2004;82(6):1633-1637
9. Hart RJ, Hickey M, Maouris P, Buckett W, Garry R. Excisional surgery versus ablative surgery for ovarian endometriomas. Cochrane Database Syst Rev. 2005;(3):CD004992.-
10. Chang HJ, Sang HH, Jung RL, et al. Impact of laparoscopic cystectomy on ovarian reserve: serial changes of serum anti-Müllerian hormone levels. Fertil Steril. 2010;94(1):343-349.
11. Muzii L. Bianchi A Crocè C, Manci N, Panici PB. Laparoscopic excision of ovarian cysts: is the stripping technique a tissue sparing procedure? Fertil Steril. 2002;77(3):609-614.
12. Hachisuga T, Kawarabyashi T. Histopathological analysis of laparoscopically treated ovarian endometriotic cysts with special reference to loss of follicles. Hum Reprod. 2002;17(2):432-435.
13. Busacca M, Riparini J Somigliana E, et al. Postsurgical ovarian failure after laparoscopic excision of bilateral endometriomas. Am J Obstet Gynecol. 2006;195(2):421-425.
14. Nawroth F, Rahimi G, Nawroth C, Foth D, Ludwig M, Schmidt T. Is there an association between septate uterus and endometriosis? Hum Reprod. 2006;21(2):542-546.
15. Matalliotakis IM, Goumenou AG, Matalliotakis M, Arici A. Uterine anomalies in women with endometriosis. J Endometriosis. 2010;2(4):213-217.
16. Li CZ, Liu B, Wen ZQ, Sun Q. The impact of electrocoagulation on ovarian reserve after laparoscopic excision of ovarian cyst: a prospective clinical study of 191 patients. Fertil Steril. 2009;92(4):1428-1435.
17. Luciano DE, Roy G, Luciano AA. Adhesion reformation after laparoscopic adhesiolysis: where what type, and in whom are they most likely to recur. J Minim Invasive Gynecol. 2008;15(1):44-48.
18. Colin CB, Luciano AA, Martin D, et al. Adept (icodextrin 4% solution) reduces adhesions after laparoscopic surgery for adhesiolysis: a double-blind, randomized, controlled study. Fertil Steril. 2007;88(5):1413-1426.
19. Wright J, Lotfallah H, Jones K, Lovell D. A randomized study of excision vs ablation for mild endometriosis. Fertil Steril. 2004;83(6):1830-1836.
20. Cheong Y, Tay P, Luk F, Gan HC, Li TC, Cooke I. Laparoscopic surgery for endometriosis: How often do we need to re-operate? J Obstet Gynaecol. 2008;28(1):82-85.
21. Liu X, Yuan L, Shen F, Zhu Z, Jiang H, Guo SW. Patterns of and risk factors for recurrence in women with ovarian endometriomas. Obstet Gynecol. 2007;109(6):1411-1120.
22. Seracchioli R, Mabrouk M, Frasca C, et al. Long-term cyclic and continuous oral contraceptive therapy and endometriomas recurrence: a randomized controlled trial. Fertil Steril. 2010;93(1):52-56.
23. Vercellini P, Somigliana E, Daguati R, Vigano P, Meroni F, Crosignani PG. Postoperative oral contraceptive exposure and risk of endometrioma recurrence. Am J Obstet Gynecol. 2008;198(5):504.e1-5.
24. Bulletti C, DeZiegler D, Stefanetti M, Cicinelli E, Pelosi E, Flamigni C. Endometriosis: absence of recurrence in patients after endometrial ablation. Hum Reprod. 2001;16(12):2676-2679.
25. Vercellini P, Frontino G, De Giorgi O, Aimi G, Zaina B, Crosignani PG. Comparison of levonorgestrel-releasing intrauterine device versus expectant management after conservative surgery for symptomatic endometriosis: a pilot study. Fertil Steril. 2003;80(2):305-309.
26. Shakiba K, Bena JF, McGill KM, Minger J, Falcone T. Surgical treatment of endometriosis: a 7-year follow-up on the requirement for further surgery. Obstet Gynecol. 2008;111(6):1285-1292.
27. Surrey ES, Hornstein MD. Prolonged GnRH agonist and add-back therapy for symptomatic endometriosis: a long-term follow-up Obstet Gynecol. 2002;99(5 Pt 1):709-719.