User login
Prolactinoma: A Case Study
A 42-year-old obese woman with type 2 diabetes, diabetic retinopathy, hypertension, and hirsutism presents to discuss an elevated prolactin level of 144.8 ng/mL (normal range, 4.8 to 23.3 ng/mL) found by her Ob-Gyn two months ago. She complained of galactorrhea and no menses for one year. A repeat prolactin level was also elevated, at 109 ng/mL.
A pituitary MRI with contrast showed a “subtle area of delayed enhancement in the right pituitary, consistent with a 5-mm microadenoma.” The patient was prescribed the dopamine agonist cabergoline (0.25 mg, to be taken twice a week), with a plan to follow up in two to three months.
Q: In obtaining a thorough history, what additional questions should be asked of this patient?
There are many causes of hyperprolactinemia. Factors that can increase prolactin secretion include pregnancy, nursing, physiologic stress, estrogen use, polycystic ovary syndrome, hypothyroidism, and chronic renal or hepatic failure. Head trauma, use of certain medications (verapamil, neuroleptics, antipsychotics, and antidepressants), and presence of nonsecretory sellar or suprasellar masses can also increase prolactin levels.
In general, signs and symptoms are due to either the effect of excess hormone secretion (ie, galactorrhea and amenorrhea) or local compression (ie, new-onset or persistent headache, dizziness, visual changes, and vision loss). A review of medications, including estrogen therapy, and history of fertility or gonadal dysfunction should be documented. Elevated prolactin levels can result in secondary hypogonadism.1
Note: While the case patient is female, it should be emphasized that prolactinomas do occur in men. The incidence is, overall, low. In addition to the symptoms listed above, men can present with decreased libido and infertility.1
Q: What additional diagnostic tests should be ordered as part of the work-up of galactorrhea and amenorrhea in this patient?
Laboratory evaluation should include a repeat serum prolactin test, measurements of TSH and free T4, and a pregnancy test. (A serum testosterone level should be checked in men.) If the results come back normal and if other diagnoses are excluded, the most likely diagnosis is a prolactinoma. In this case, a pituitary MRI should be obtained. Visual field testing can be performed in individuals with specific visual complaints, especially loss or impairment of peripheral vision.
Q: What is the incidence of prolactinoma in the general population?
Prolactin-secreting adenomas, or prolactinomas, are the most common type of pituitary adenoma, accounting for approximately 60% overall.1 They occur at a frequency of six to 10 cases per million each year.2 Prolactinomas are almost always benign; malignant tumors are extremely rare.3
Tumors are classified as microadenomas or macroadenomas, depending on the size. A microadenoma is defined as an intrasellar mass less than 10 mm in diameter. A macroadenoma, defined as larger than 10 mm in diameter, can cause enlargement of the sella turcica.1,4 The larger the size of the prolactinoma, the greater the prolactin level and higher the likelihood of mass-effect symptoms.4
Q: What are the options for treatment of a prolactinoma?
There are several options for treatment of prolactinomas. After discussing all of the available options with the patient, the choice of therapy should be determined by the patient’s desires and potential plans for pregnancy. It is acceptable to observe the tumor with serial MRIs and serum prolactin measurements, provided the tumor is very small and the patient is asymptomatic.4
Medication therapy involves treatment with a dopamine agonist, which directly inhibits prolactin secretion by the tumor and therefore suppresses tumor growth. The goal of medication therapy is to suppress the prolactin level to normal range and restore gonadal function. The two dopamine agonists used are bromocriptine and cabergoline.
Bromocriptine was the first drug available in the United States to effectively treat pituitary adenomas. Its most common adverse effects include nausea, vomiting, dizziness, and postural hypotension. These effects can be minimized or avoided if the drug is started at a low dose, gradually increased, and taken at bedtime. The adverse effects usually subside with continued use; however, in some patients they persist and therefore the drug has to be discontinued.
Cabergoline is a non-ergot dopamine agonist that is more efficacious, overall better tolerated, and longer acting than bromocriptine. It is dosed twice weekly, whereas bromocriptine is dosed once daily.4 One factor to consider in a female patient is whether she is of child-bearing age and is interested in conception. Both bromocriptine and cabergoline are designated as category B; however, in animal studies cabergoline has been associated with maternal toxicity, increase in fetal death, and growth retardation and death due to decreased milk secretion by the mother. Therefore, it should only be used during pregnancy if the need has been clearly established.
Dopamine agonists are approximately 80% to 90% effective in decreasing prolactin levels and reducing tumor size in microadenomas and 60% to 70% in macroadenomas. The major drawback of using medication is that it does not always provide permanent results. Hyperprolactinemia and tumor growth can resume upon discontinuation of the drug, even if the patient has taken it for several years.1 The rate of recurrence after discontinuing therapy can be anywhere from 26% to 69%, and the highest likelihood occurs within a year of withdrawal.4 Close clinical follow-up is thus important.
Surgery, typically a transphenoidal resection, is performed by a neurosurgeon. Success of surgery is based on tumor size and basal prolactin level prior to the procedure. It is more effective in restoring normal prolactin levels and resolution of symptoms in microadenomas than in macroadenomas. Progressive vision loss, pituitary apoplexy, and intolerance to dopamine agonists are indications for surgery.1
Radiation therapy is reserved for those patients who have residual tumors postsurgery and have not responded to or are intolerant to dopamine agonists. Response to radiation is slow; it can sometimes take several years to achieve full effect. Gamma-knife radiation is sometimes used, but experience with this procedure is limited thus far in prolactinomas.
Overall, the vast majority of prolactinomas are benign and fairly straightforward to manage clinically.3
REFERENCES
1. Greenspan F, Gardner D. Basic & Clinical Endocrinology, 7th ed. New York: McGraw-Hill; 2004.
2. Ciccarelli A, Daly A, Beckers A. The epidemiology of prolactinomas. Pituitary. 2005;8(1):3-6.
3. Casanueva FF, Molitch ME, Schlechte JA, et al. Guidelines of the Pituitary Society for the diagnosis and management of prolactinomas. Clin Endocrinol (Oxf). 2006;65(2):265-273.
4. Melmed S, Casanueva FF, Hoffman AR, et al. Diagnosis and treatment of hyperprolactinemia: an Endocrine Society Clinical Practice Guideline. J Clinical Endocrinol Metab. 2011;96(2):273-288.
| Clinician Reviews in partnership with |

|
| Clinician Reviews in partnership with |
|
|
| Clinician Reviews in partnership with |
|
|
A 42-year-old obese woman with type 2 diabetes, diabetic retinopathy, hypertension, and hirsutism presents to discuss an elevated prolactin level of 144.8 ng/mL (normal range, 4.8 to 23.3 ng/mL) found by her Ob-Gyn two months ago. She complained of galactorrhea and no menses for one year. A repeat prolactin level was also elevated, at 109 ng/mL.
A pituitary MRI with contrast showed a “subtle area of delayed enhancement in the right pituitary, consistent with a 5-mm microadenoma.” The patient was prescribed the dopamine agonist cabergoline (0.25 mg, to be taken twice a week), with a plan to follow up in two to three months.
Q: In obtaining a thorough history, what additional questions should be asked of this patient?
There are many causes of hyperprolactinemia. Factors that can increase prolactin secretion include pregnancy, nursing, physiologic stress, estrogen use, polycystic ovary syndrome, hypothyroidism, and chronic renal or hepatic failure. Head trauma, use of certain medications (verapamil, neuroleptics, antipsychotics, and antidepressants), and presence of nonsecretory sellar or suprasellar masses can also increase prolactin levels.
In general, signs and symptoms are due to either the effect of excess hormone secretion (ie, galactorrhea and amenorrhea) or local compression (ie, new-onset or persistent headache, dizziness, visual changes, and vision loss). A review of medications, including estrogen therapy, and history of fertility or gonadal dysfunction should be documented. Elevated prolactin levels can result in secondary hypogonadism.1
Note: While the case patient is female, it should be emphasized that prolactinomas do occur in men. The incidence is, overall, low. In addition to the symptoms listed above, men can present with decreased libido and infertility.1
Q: What additional diagnostic tests should be ordered as part of the work-up of galactorrhea and amenorrhea in this patient?
Laboratory evaluation should include a repeat serum prolactin test, measurements of TSH and free T4, and a pregnancy test. (A serum testosterone level should be checked in men.) If the results come back normal and if other diagnoses are excluded, the most likely diagnosis is a prolactinoma. In this case, a pituitary MRI should be obtained. Visual field testing can be performed in individuals with specific visual complaints, especially loss or impairment of peripheral vision.
Q: What is the incidence of prolactinoma in the general population?
Prolactin-secreting adenomas, or prolactinomas, are the most common type of pituitary adenoma, accounting for approximately 60% overall.1 They occur at a frequency of six to 10 cases per million each year.2 Prolactinomas are almost always benign; malignant tumors are extremely rare.3
Tumors are classified as microadenomas or macroadenomas, depending on the size. A microadenoma is defined as an intrasellar mass less than 10 mm in diameter. A macroadenoma, defined as larger than 10 mm in diameter, can cause enlargement of the sella turcica.1,4 The larger the size of the prolactinoma, the greater the prolactin level and higher the likelihood of mass-effect symptoms.4
Q: What are the options for treatment of a prolactinoma?
There are several options for treatment of prolactinomas. After discussing all of the available options with the patient, the choice of therapy should be determined by the patient’s desires and potential plans for pregnancy. It is acceptable to observe the tumor with serial MRIs and serum prolactin measurements, provided the tumor is very small and the patient is asymptomatic.4
Medication therapy involves treatment with a dopamine agonist, which directly inhibits prolactin secretion by the tumor and therefore suppresses tumor growth. The goal of medication therapy is to suppress the prolactin level to normal range and restore gonadal function. The two dopamine agonists used are bromocriptine and cabergoline.
Bromocriptine was the first drug available in the United States to effectively treat pituitary adenomas. Its most common adverse effects include nausea, vomiting, dizziness, and postural hypotension. These effects can be minimized or avoided if the drug is started at a low dose, gradually increased, and taken at bedtime. The adverse effects usually subside with continued use; however, in some patients they persist and therefore the drug has to be discontinued.
Cabergoline is a non-ergot dopamine agonist that is more efficacious, overall better tolerated, and longer acting than bromocriptine. It is dosed twice weekly, whereas bromocriptine is dosed once daily.4 One factor to consider in a female patient is whether she is of child-bearing age and is interested in conception. Both bromocriptine and cabergoline are designated as category B; however, in animal studies cabergoline has been associated with maternal toxicity, increase in fetal death, and growth retardation and death due to decreased milk secretion by the mother. Therefore, it should only be used during pregnancy if the need has been clearly established.
Dopamine agonists are approximately 80% to 90% effective in decreasing prolactin levels and reducing tumor size in microadenomas and 60% to 70% in macroadenomas. The major drawback of using medication is that it does not always provide permanent results. Hyperprolactinemia and tumor growth can resume upon discontinuation of the drug, even if the patient has taken it for several years.1 The rate of recurrence after discontinuing therapy can be anywhere from 26% to 69%, and the highest likelihood occurs within a year of withdrawal.4 Close clinical follow-up is thus important.
Surgery, typically a transphenoidal resection, is performed by a neurosurgeon. Success of surgery is based on tumor size and basal prolactin level prior to the procedure. It is more effective in restoring normal prolactin levels and resolution of symptoms in microadenomas than in macroadenomas. Progressive vision loss, pituitary apoplexy, and intolerance to dopamine agonists are indications for surgery.1
Radiation therapy is reserved for those patients who have residual tumors postsurgery and have not responded to or are intolerant to dopamine agonists. Response to radiation is slow; it can sometimes take several years to achieve full effect. Gamma-knife radiation is sometimes used, but experience with this procedure is limited thus far in prolactinomas.
Overall, the vast majority of prolactinomas are benign and fairly straightforward to manage clinically.3
REFERENCES
1. Greenspan F, Gardner D. Basic & Clinical Endocrinology, 7th ed. New York: McGraw-Hill; 2004.
2. Ciccarelli A, Daly A, Beckers A. The epidemiology of prolactinomas. Pituitary. 2005;8(1):3-6.
3. Casanueva FF, Molitch ME, Schlechte JA, et al. Guidelines of the Pituitary Society for the diagnosis and management of prolactinomas. Clin Endocrinol (Oxf). 2006;65(2):265-273.
4. Melmed S, Casanueva FF, Hoffman AR, et al. Diagnosis and treatment of hyperprolactinemia: an Endocrine Society Clinical Practice Guideline. J Clinical Endocrinol Metab. 2011;96(2):273-288.
A 42-year-old obese woman with type 2 diabetes, diabetic retinopathy, hypertension, and hirsutism presents to discuss an elevated prolactin level of 144.8 ng/mL (normal range, 4.8 to 23.3 ng/mL) found by her Ob-Gyn two months ago. She complained of galactorrhea and no menses for one year. A repeat prolactin level was also elevated, at 109 ng/mL.
A pituitary MRI with contrast showed a “subtle area of delayed enhancement in the right pituitary, consistent with a 5-mm microadenoma.” The patient was prescribed the dopamine agonist cabergoline (0.25 mg, to be taken twice a week), with a plan to follow up in two to three months.
Q: In obtaining a thorough history, what additional questions should be asked of this patient?
There are many causes of hyperprolactinemia. Factors that can increase prolactin secretion include pregnancy, nursing, physiologic stress, estrogen use, polycystic ovary syndrome, hypothyroidism, and chronic renal or hepatic failure. Head trauma, use of certain medications (verapamil, neuroleptics, antipsychotics, and antidepressants), and presence of nonsecretory sellar or suprasellar masses can also increase prolactin levels.
In general, signs and symptoms are due to either the effect of excess hormone secretion (ie, galactorrhea and amenorrhea) or local compression (ie, new-onset or persistent headache, dizziness, visual changes, and vision loss). A review of medications, including estrogen therapy, and history of fertility or gonadal dysfunction should be documented. Elevated prolactin levels can result in secondary hypogonadism.1
Note: While the case patient is female, it should be emphasized that prolactinomas do occur in men. The incidence is, overall, low. In addition to the symptoms listed above, men can present with decreased libido and infertility.1
Q: What additional diagnostic tests should be ordered as part of the work-up of galactorrhea and amenorrhea in this patient?
Laboratory evaluation should include a repeat serum prolactin test, measurements of TSH and free T4, and a pregnancy test. (A serum testosterone level should be checked in men.) If the results come back normal and if other diagnoses are excluded, the most likely diagnosis is a prolactinoma. In this case, a pituitary MRI should be obtained. Visual field testing can be performed in individuals with specific visual complaints, especially loss or impairment of peripheral vision.
Q: What is the incidence of prolactinoma in the general population?
Prolactin-secreting adenomas, or prolactinomas, are the most common type of pituitary adenoma, accounting for approximately 60% overall.1 They occur at a frequency of six to 10 cases per million each year.2 Prolactinomas are almost always benign; malignant tumors are extremely rare.3
Tumors are classified as microadenomas or macroadenomas, depending on the size. A microadenoma is defined as an intrasellar mass less than 10 mm in diameter. A macroadenoma, defined as larger than 10 mm in diameter, can cause enlargement of the sella turcica.1,4 The larger the size of the prolactinoma, the greater the prolactin level and higher the likelihood of mass-effect symptoms.4
Q: What are the options for treatment of a prolactinoma?
There are several options for treatment of prolactinomas. After discussing all of the available options with the patient, the choice of therapy should be determined by the patient’s desires and potential plans for pregnancy. It is acceptable to observe the tumor with serial MRIs and serum prolactin measurements, provided the tumor is very small and the patient is asymptomatic.4
Medication therapy involves treatment with a dopamine agonist, which directly inhibits prolactin secretion by the tumor and therefore suppresses tumor growth. The goal of medication therapy is to suppress the prolactin level to normal range and restore gonadal function. The two dopamine agonists used are bromocriptine and cabergoline.
Bromocriptine was the first drug available in the United States to effectively treat pituitary adenomas. Its most common adverse effects include nausea, vomiting, dizziness, and postural hypotension. These effects can be minimized or avoided if the drug is started at a low dose, gradually increased, and taken at bedtime. The adverse effects usually subside with continued use; however, in some patients they persist and therefore the drug has to be discontinued.
Cabergoline is a non-ergot dopamine agonist that is more efficacious, overall better tolerated, and longer acting than bromocriptine. It is dosed twice weekly, whereas bromocriptine is dosed once daily.4 One factor to consider in a female patient is whether she is of child-bearing age and is interested in conception. Both bromocriptine and cabergoline are designated as category B; however, in animal studies cabergoline has been associated with maternal toxicity, increase in fetal death, and growth retardation and death due to decreased milk secretion by the mother. Therefore, it should only be used during pregnancy if the need has been clearly established.
Dopamine agonists are approximately 80% to 90% effective in decreasing prolactin levels and reducing tumor size in microadenomas and 60% to 70% in macroadenomas. The major drawback of using medication is that it does not always provide permanent results. Hyperprolactinemia and tumor growth can resume upon discontinuation of the drug, even if the patient has taken it for several years.1 The rate of recurrence after discontinuing therapy can be anywhere from 26% to 69%, and the highest likelihood occurs within a year of withdrawal.4 Close clinical follow-up is thus important.
Surgery, typically a transphenoidal resection, is performed by a neurosurgeon. Success of surgery is based on tumor size and basal prolactin level prior to the procedure. It is more effective in restoring normal prolactin levels and resolution of symptoms in microadenomas than in macroadenomas. Progressive vision loss, pituitary apoplexy, and intolerance to dopamine agonists are indications for surgery.1
Radiation therapy is reserved for those patients who have residual tumors postsurgery and have not responded to or are intolerant to dopamine agonists. Response to radiation is slow; it can sometimes take several years to achieve full effect. Gamma-knife radiation is sometimes used, but experience with this procedure is limited thus far in prolactinomas.
Overall, the vast majority of prolactinomas are benign and fairly straightforward to manage clinically.3
REFERENCES
1. Greenspan F, Gardner D. Basic & Clinical Endocrinology, 7th ed. New York: McGraw-Hill; 2004.
2. Ciccarelli A, Daly A, Beckers A. The epidemiology of prolactinomas. Pituitary. 2005;8(1):3-6.
3. Casanueva FF, Molitch ME, Schlechte JA, et al. Guidelines of the Pituitary Society for the diagnosis and management of prolactinomas. Clin Endocrinol (Oxf). 2006;65(2):265-273.
4. Melmed S, Casanueva FF, Hoffman AR, et al. Diagnosis and treatment of hyperprolactinemia: an Endocrine Society Clinical Practice Guideline. J Clinical Endocrinol Metab. 2011;96(2):273-288.
Change has come again to ICD-9 diagnostic codes
Did you know? When October 1 rolled around a short time ago, so did new codes for you to learn in the International Classification of Diseases, 9th Revision, Clinical Modification (ICD-9-CM).
If you consider that unpleasant news for your billing efforts, I also have what I consider good news: The 2012 fiscal year is the final year for changes to ICD-9-CM codes: On October 1, 2013, the nation switches to 10th Revision (that is, ICD-10-CM) codes. The National Center for Health Statistics has indicated that the only changes to ICD-9 codes permitted from now on are ones describing new diseases that require immediate reporting during this transition/freeze period.
This last set of changes isn’t as massive as what we saw in previous years. Nevertheless, the changes certainly enhance the ability of ObGyn practices to report the reasons for patient encounters.
The major gyn change this year involves reporting vaginal mesh complications. There are several new obstetric codes, too, to enhance reporting of cesarean delivery and management of high-risk OB conditions.
The new codes were added to the national code set on October 1. As in prior years, there is no grace period.
Changes to obstetric codes
ANTIPHOSPHOLIPID ANTIBODY
Antiphospholipid syndrome and lupus anticoagulant are associated with complications of pregnancy that include fetal loss, fetal growth restriction, preeclampsia, thrombosis, and autoimmune thrombocytopenia. Until now, the obstetrician reporting 649.3x (Coagulation defects complicating pregnancy, childbirth, or the puerperium), had only two secondary code options to further describe the patient’s condition: 795.79, used to report a finding of antiphospholipid antibody in a blood specimen, and 289.81, antiphospholipid antibody with hypercoagulable state.
A new code, 286.53 (Antiphospholipid antibody with hemorrhagic disorder), provides a third option when reporting 649.3x.
CHEMICAL PREGNANCY AND BLIGHTED OVUM
Fertility clinics and physicians who specialize in the use of assisted reproductive technology requested a code to identify patients who have what is referred to (imprecisely) as a “false-positive pregnancy,” “chemical pregnancy,” or “biochemical pregnancy.” These terms do not, however, accurately describe a pregnancy achieved using hormone stimulation or other such “chemical” methods.
In some cases, of course, a woman’s pregnancy test comes back positive, indicating a serum human chorionic gonadotropin (hCG) level, but, when she is followed with ultrasonography, no fetus is present—in effect, she has had an early miscarriage. But there has been no ICD-9 code to use at this stage that discriminates between confirmed ectopic pregnancy and confirmed miscarriage—only a code for a laboratory finding.
To improve the specificity of coding, therefore, and to track such pregnancies, existing code 631 (Other abnormal product of conception) has been expanded and divided in two:
| 631.0 | Inappropriate rise (decline) of quantitative hCG in early pregnancy |
| 631.8 | Other abnormal products of conception |
Documentation by the physician that signals that 631.0 should be reported might include a reference to biochemical pregnancy, chemical pregnancy, or an inappropriate level of quantitative hCG for gestational age in early pregnancy. For 631.8 to be reported, documentation might mention such findings as a “blighted ovum” or “fleshy mole.”
Note: Because of this code expansion, the three-digit code 631 will no longer be a valid code for billing purposes.
ELECTIVE CESAREAN DELIVERY BEFORE 39 WEEKS’ GESTATION
ACOG requested new codes for elective cesarean delivery before 39 weeks’ gestation—a scenario that is one of the new markers of quality of care. Whereas ICD-9 has two diagnosis codes that mention cesarean delivery (654.2x, [Previous cesarean delivery not otherwise specified] and 669.71 [Cesarean delivery, without mention of indication]), neither code captures a case in which a woman presents in labor at 37 to 38 weeks’ gestation and the physician determines that it is best to deliver at that time rather than try to take measures that will forestall delivery until the 39th week.
Although ICD-9 already also has a code for early onset of delivery (644.21), it applies only to pregnancies before 37 completed weeks.
The new codes are:
| 649.81 | Onset (spontaneous) of labor after 37 completed weeks of gestation but before 39 completed weeks’ gestation, with delivery by (planned) cesarean section, delivered, with or without mention of antepartum condition |
| 649.82 | Onset (spontaneous) of labor after 37 completed weeks of gestation but before 39 completed weeks’ gestation, with delivery by (planned) cesarean section, delivered, with mention of postpartum complication |
Note: The new code has two options for a fifth digit:
- Reporting a fifth digit 1 indicates that the patient may, or may not, have had a complication in the antepartum period that is related to early onset of labor.
- Reporting a fifth digit 2 indicates that the patient developed a complication after delivery (but before discharge) that is related to the delivery.
For any hospitalization that results in a delivery, you must select a fifth digit 1 or 2; the choice depends on the overriding complication. You may not list code 649.8 twice—i.e., once with a fifth digit 1 and once with a fifth digit 2.
If the patient had a condition that was documented to be why cesarean delivery was medically indicated, list that as a secondary diagnosis—for example, cephalopelvic disproportion (653.4x) or prior cesarean delivery (654.2x).
SUPERVISION OF HIGH-RISK PREGNANCY
Code subcategory V23.4 (Pregnancy with other poor obstetric history) had only two coding options before October 1, 2011: V23.41 (Pregnancy with history of pre-term labor) and V23.49 (Pregnancy with other poor obstetric history).
Ectopic pregnancy. ACOG considers that it is important to track patients who had a prior ectopic pregnancy because such a history gives rise to an increased risk of ectopic pregnancy during the current pregnancy. Therefore, a new code for this status was requested by ACOG, and provided.
Note: Use the new history code only until the patient is confirmed not to have an ectopic pregnancy, if that is the outcome. Once you’ve confirmed that she has only a normal, intrauterine pregnancy, the risk posed by her history no longer has an impact on the current pregnancy. (ICD-9 rules direct you to report conditions that require active intervention or a change in routine care of the pregnancy—not conditions that merely exist without the need for intervention or additional monitoring.)
The new code is:
| V23.42 | Pregnancy with history of ectopic pregnancy |
Fetal viability. There was also no specific code before October 1 to report the need for a sonogram to check fetal viability, especially when a previously confirmed pregnancy comes into question because of the apparent absence of a fetal heartbeat on examination of the mother. In such a case, an additional sonogram might be required beyond the initial scan to confirm fetal demise or a continuing viable pregnancy. Until now, either of these findings could have been reported only with codes that do not accurately describe the situation, such as 659.7 (Abnormality in fetal heart rate or rhythm); V28.89 (Other specified antenatal screening); and V23.89 (Other high-risk pregnancy).
The new code is:
| V23.87 | Pregnancy with inconclusive fetal viability |
Changes to gyn codes
An effective surgical treatment for vaginal vault prolapse is sacrocolpopexy that uses a graft to suspend the upper vagina to the anterior longitudinal ligament of the sacrum. But, regrettably, synthetic graft material has also been associated with erosion of the mesh and subsequent pelvic infection (by erosion into surrounding organs or tissue). Exposure of the mesh in the vagina can also occur (see “Take this simplified approach to correcting exposure of vaginal mesh” in the July 2011 issue, available at obgmanagement.com).
Before October 1, erosion or exposure of mesh (without infection) would have been reported with code 996.39 (Mechanical complication of a genitourinary device, implant and graft) or 996.76 (Other complications due to genitourinary device, implant, and graft). With creation of a new subcategory code, 629.3 (Complication of implanted vaginal mesh and other prosthetic materials), however, these specific complications can be reported and tracked. The new codes also give you a specific linking diagnosis for revision of the mesh.
The two new codes are:
| 629.31 | Erosion of implanted vaginal mesh and other prosthetic materials to surrounding organ or tissue (e.g., into pelvic floor muscles) |
| 629.32 | Exposure of implanted vaginal mesh and other prosthetic materials into vagina (e.g., through the vaginal wall) |
Note: If the patient’s graft material has caused fibrosis, hemorrhage, occlusion, or pain, continue to report 996.76. And, of course, any infection or inflammatory reaction caused by mesh is reported with existing code 996.65.
Because erosion and exposure can occur at the same time, it is proper to report both new codes, if that is the case.
HISTORY OF GESTATIONAL DIABETES
Code V12.2 (Personal history of endocrine, metabolic, and immunity disorders) has been expanded and divided into two five-digit codes:
| V12.21 | Gestational diabetes |
| V12.29 | Other endocrine, metabolic, and immunity disorders |
With this change, four-digit code V12.2 became an invalid diagnosis code; your claim will be denied if you report it as the reason for an encounter.
Note: Code V12.21 may not be reported as a primary diagnosis for an obstetrical patient. Instead, a personal history that may be having an impact on the current pregnancy should be reported with a V23.xx code (Supervision of high risk pregnancy), until (and if) the patient develops a condition.
For example: If a patient had gestational diabetes during a prior pregnancy, she risks developing it again in the current pregnancy. In that case, report V23.49 (Pregnancy with other poor obstetric history) as the primary code and assign V12.21 as the secondary code.
LONG-TERM USE OF BISPHOSPHONATES
In a woman being treated to prevent loss of bone mass, the side-effect profile of the medication and the need to measure its effectiveness require regular follow-up visits. Effective October 1, code V58.68 (Long-term [current] use of bisphosphonates) should be reported for these follow-up visits. The code can be also used to support ordering follow-up bone densitometry.
Medications that might be applicable here are alendronate (Fosamax), ibandronate (Boniva), risedronate (Actonel), and zoledronic acid (Reclast).
Download a free copy of the complete addenda of ICD-9-CM code changes that have been made for fiscal year 2012 at: www.cdc.gov/nchs/icd/icd9cm_addenda_guidelines.htm
We want to hear from you! Tell us what you think.
Did you know? When October 1 rolled around a short time ago, so did new codes for you to learn in the International Classification of Diseases, 9th Revision, Clinical Modification (ICD-9-CM).
If you consider that unpleasant news for your billing efforts, I also have what I consider good news: The 2012 fiscal year is the final year for changes to ICD-9-CM codes: On October 1, 2013, the nation switches to 10th Revision (that is, ICD-10-CM) codes. The National Center for Health Statistics has indicated that the only changes to ICD-9 codes permitted from now on are ones describing new diseases that require immediate reporting during this transition/freeze period.
This last set of changes isn’t as massive as what we saw in previous years. Nevertheless, the changes certainly enhance the ability of ObGyn practices to report the reasons for patient encounters.
The major gyn change this year involves reporting vaginal mesh complications. There are several new obstetric codes, too, to enhance reporting of cesarean delivery and management of high-risk OB conditions.
The new codes were added to the national code set on October 1. As in prior years, there is no grace period.
Changes to obstetric codes
ANTIPHOSPHOLIPID ANTIBODY
Antiphospholipid syndrome and lupus anticoagulant are associated with complications of pregnancy that include fetal loss, fetal growth restriction, preeclampsia, thrombosis, and autoimmune thrombocytopenia. Until now, the obstetrician reporting 649.3x (Coagulation defects complicating pregnancy, childbirth, or the puerperium), had only two secondary code options to further describe the patient’s condition: 795.79, used to report a finding of antiphospholipid antibody in a blood specimen, and 289.81, antiphospholipid antibody with hypercoagulable state.
A new code, 286.53 (Antiphospholipid antibody with hemorrhagic disorder), provides a third option when reporting 649.3x.
CHEMICAL PREGNANCY AND BLIGHTED OVUM
Fertility clinics and physicians who specialize in the use of assisted reproductive technology requested a code to identify patients who have what is referred to (imprecisely) as a “false-positive pregnancy,” “chemical pregnancy,” or “biochemical pregnancy.” These terms do not, however, accurately describe a pregnancy achieved using hormone stimulation or other such “chemical” methods.
In some cases, of course, a woman’s pregnancy test comes back positive, indicating a serum human chorionic gonadotropin (hCG) level, but, when she is followed with ultrasonography, no fetus is present—in effect, she has had an early miscarriage. But there has been no ICD-9 code to use at this stage that discriminates between confirmed ectopic pregnancy and confirmed miscarriage—only a code for a laboratory finding.
To improve the specificity of coding, therefore, and to track such pregnancies, existing code 631 (Other abnormal product of conception) has been expanded and divided in two:
| 631.0 | Inappropriate rise (decline) of quantitative hCG in early pregnancy |
| 631.8 | Other abnormal products of conception |
Documentation by the physician that signals that 631.0 should be reported might include a reference to biochemical pregnancy, chemical pregnancy, or an inappropriate level of quantitative hCG for gestational age in early pregnancy. For 631.8 to be reported, documentation might mention such findings as a “blighted ovum” or “fleshy mole.”
Note: Because of this code expansion, the three-digit code 631 will no longer be a valid code for billing purposes.
ELECTIVE CESAREAN DELIVERY BEFORE 39 WEEKS’ GESTATION
ACOG requested new codes for elective cesarean delivery before 39 weeks’ gestation—a scenario that is one of the new markers of quality of care. Whereas ICD-9 has two diagnosis codes that mention cesarean delivery (654.2x, [Previous cesarean delivery not otherwise specified] and 669.71 [Cesarean delivery, without mention of indication]), neither code captures a case in which a woman presents in labor at 37 to 38 weeks’ gestation and the physician determines that it is best to deliver at that time rather than try to take measures that will forestall delivery until the 39th week.
Although ICD-9 already also has a code for early onset of delivery (644.21), it applies only to pregnancies before 37 completed weeks.
The new codes are:
| 649.81 | Onset (spontaneous) of labor after 37 completed weeks of gestation but before 39 completed weeks’ gestation, with delivery by (planned) cesarean section, delivered, with or without mention of antepartum condition |
| 649.82 | Onset (spontaneous) of labor after 37 completed weeks of gestation but before 39 completed weeks’ gestation, with delivery by (planned) cesarean section, delivered, with mention of postpartum complication |
Note: The new code has two options for a fifth digit:
- Reporting a fifth digit 1 indicates that the patient may, or may not, have had a complication in the antepartum period that is related to early onset of labor.
- Reporting a fifth digit 2 indicates that the patient developed a complication after delivery (but before discharge) that is related to the delivery.
For any hospitalization that results in a delivery, you must select a fifth digit 1 or 2; the choice depends on the overriding complication. You may not list code 649.8 twice—i.e., once with a fifth digit 1 and once with a fifth digit 2.
If the patient had a condition that was documented to be why cesarean delivery was medically indicated, list that as a secondary diagnosis—for example, cephalopelvic disproportion (653.4x) or prior cesarean delivery (654.2x).
SUPERVISION OF HIGH-RISK PREGNANCY
Code subcategory V23.4 (Pregnancy with other poor obstetric history) had only two coding options before October 1, 2011: V23.41 (Pregnancy with history of pre-term labor) and V23.49 (Pregnancy with other poor obstetric history).
Ectopic pregnancy. ACOG considers that it is important to track patients who had a prior ectopic pregnancy because such a history gives rise to an increased risk of ectopic pregnancy during the current pregnancy. Therefore, a new code for this status was requested by ACOG, and provided.
Note: Use the new history code only until the patient is confirmed not to have an ectopic pregnancy, if that is the outcome. Once you’ve confirmed that she has only a normal, intrauterine pregnancy, the risk posed by her history no longer has an impact on the current pregnancy. (ICD-9 rules direct you to report conditions that require active intervention or a change in routine care of the pregnancy—not conditions that merely exist without the need for intervention or additional monitoring.)
The new code is:
| V23.42 | Pregnancy with history of ectopic pregnancy |
Fetal viability. There was also no specific code before October 1 to report the need for a sonogram to check fetal viability, especially when a previously confirmed pregnancy comes into question because of the apparent absence of a fetal heartbeat on examination of the mother. In such a case, an additional sonogram might be required beyond the initial scan to confirm fetal demise or a continuing viable pregnancy. Until now, either of these findings could have been reported only with codes that do not accurately describe the situation, such as 659.7 (Abnormality in fetal heart rate or rhythm); V28.89 (Other specified antenatal screening); and V23.89 (Other high-risk pregnancy).
The new code is:
| V23.87 | Pregnancy with inconclusive fetal viability |
Changes to gyn codes
An effective surgical treatment for vaginal vault prolapse is sacrocolpopexy that uses a graft to suspend the upper vagina to the anterior longitudinal ligament of the sacrum. But, regrettably, synthetic graft material has also been associated with erosion of the mesh and subsequent pelvic infection (by erosion into surrounding organs or tissue). Exposure of the mesh in the vagina can also occur (see “Take this simplified approach to correcting exposure of vaginal mesh” in the July 2011 issue, available at obgmanagement.com).
Before October 1, erosion or exposure of mesh (without infection) would have been reported with code 996.39 (Mechanical complication of a genitourinary device, implant and graft) or 996.76 (Other complications due to genitourinary device, implant, and graft). With creation of a new subcategory code, 629.3 (Complication of implanted vaginal mesh and other prosthetic materials), however, these specific complications can be reported and tracked. The new codes also give you a specific linking diagnosis for revision of the mesh.
The two new codes are:
| 629.31 | Erosion of implanted vaginal mesh and other prosthetic materials to surrounding organ or tissue (e.g., into pelvic floor muscles) |
| 629.32 | Exposure of implanted vaginal mesh and other prosthetic materials into vagina (e.g., through the vaginal wall) |
Note: If the patient’s graft material has caused fibrosis, hemorrhage, occlusion, or pain, continue to report 996.76. And, of course, any infection or inflammatory reaction caused by mesh is reported with existing code 996.65.
Because erosion and exposure can occur at the same time, it is proper to report both new codes, if that is the case.
HISTORY OF GESTATIONAL DIABETES
Code V12.2 (Personal history of endocrine, metabolic, and immunity disorders) has been expanded and divided into two five-digit codes:
| V12.21 | Gestational diabetes |
| V12.29 | Other endocrine, metabolic, and immunity disorders |
With this change, four-digit code V12.2 became an invalid diagnosis code; your claim will be denied if you report it as the reason for an encounter.
Note: Code V12.21 may not be reported as a primary diagnosis for an obstetrical patient. Instead, a personal history that may be having an impact on the current pregnancy should be reported with a V23.xx code (Supervision of high risk pregnancy), until (and if) the patient develops a condition.
For example: If a patient had gestational diabetes during a prior pregnancy, she risks developing it again in the current pregnancy. In that case, report V23.49 (Pregnancy with other poor obstetric history) as the primary code and assign V12.21 as the secondary code.
LONG-TERM USE OF BISPHOSPHONATES
In a woman being treated to prevent loss of bone mass, the side-effect profile of the medication and the need to measure its effectiveness require regular follow-up visits. Effective October 1, code V58.68 (Long-term [current] use of bisphosphonates) should be reported for these follow-up visits. The code can be also used to support ordering follow-up bone densitometry.
Medications that might be applicable here are alendronate (Fosamax), ibandronate (Boniva), risedronate (Actonel), and zoledronic acid (Reclast).
Download a free copy of the complete addenda of ICD-9-CM code changes that have been made for fiscal year 2012 at: www.cdc.gov/nchs/icd/icd9cm_addenda_guidelines.htm
We want to hear from you! Tell us what you think.
Did you know? When October 1 rolled around a short time ago, so did new codes for you to learn in the International Classification of Diseases, 9th Revision, Clinical Modification (ICD-9-CM).
If you consider that unpleasant news for your billing efforts, I also have what I consider good news: The 2012 fiscal year is the final year for changes to ICD-9-CM codes: On October 1, 2013, the nation switches to 10th Revision (that is, ICD-10-CM) codes. The National Center for Health Statistics has indicated that the only changes to ICD-9 codes permitted from now on are ones describing new diseases that require immediate reporting during this transition/freeze period.
This last set of changes isn’t as massive as what we saw in previous years. Nevertheless, the changes certainly enhance the ability of ObGyn practices to report the reasons for patient encounters.
The major gyn change this year involves reporting vaginal mesh complications. There are several new obstetric codes, too, to enhance reporting of cesarean delivery and management of high-risk OB conditions.
The new codes were added to the national code set on October 1. As in prior years, there is no grace period.
Changes to obstetric codes
ANTIPHOSPHOLIPID ANTIBODY
Antiphospholipid syndrome and lupus anticoagulant are associated with complications of pregnancy that include fetal loss, fetal growth restriction, preeclampsia, thrombosis, and autoimmune thrombocytopenia. Until now, the obstetrician reporting 649.3x (Coagulation defects complicating pregnancy, childbirth, or the puerperium), had only two secondary code options to further describe the patient’s condition: 795.79, used to report a finding of antiphospholipid antibody in a blood specimen, and 289.81, antiphospholipid antibody with hypercoagulable state.
A new code, 286.53 (Antiphospholipid antibody with hemorrhagic disorder), provides a third option when reporting 649.3x.
CHEMICAL PREGNANCY AND BLIGHTED OVUM
Fertility clinics and physicians who specialize in the use of assisted reproductive technology requested a code to identify patients who have what is referred to (imprecisely) as a “false-positive pregnancy,” “chemical pregnancy,” or “biochemical pregnancy.” These terms do not, however, accurately describe a pregnancy achieved using hormone stimulation or other such “chemical” methods.
In some cases, of course, a woman’s pregnancy test comes back positive, indicating a serum human chorionic gonadotropin (hCG) level, but, when she is followed with ultrasonography, no fetus is present—in effect, she has had an early miscarriage. But there has been no ICD-9 code to use at this stage that discriminates between confirmed ectopic pregnancy and confirmed miscarriage—only a code for a laboratory finding.
To improve the specificity of coding, therefore, and to track such pregnancies, existing code 631 (Other abnormal product of conception) has been expanded and divided in two:
| 631.0 | Inappropriate rise (decline) of quantitative hCG in early pregnancy |
| 631.8 | Other abnormal products of conception |
Documentation by the physician that signals that 631.0 should be reported might include a reference to biochemical pregnancy, chemical pregnancy, or an inappropriate level of quantitative hCG for gestational age in early pregnancy. For 631.8 to be reported, documentation might mention such findings as a “blighted ovum” or “fleshy mole.”
Note: Because of this code expansion, the three-digit code 631 will no longer be a valid code for billing purposes.
ELECTIVE CESAREAN DELIVERY BEFORE 39 WEEKS’ GESTATION
ACOG requested new codes for elective cesarean delivery before 39 weeks’ gestation—a scenario that is one of the new markers of quality of care. Whereas ICD-9 has two diagnosis codes that mention cesarean delivery (654.2x, [Previous cesarean delivery not otherwise specified] and 669.71 [Cesarean delivery, without mention of indication]), neither code captures a case in which a woman presents in labor at 37 to 38 weeks’ gestation and the physician determines that it is best to deliver at that time rather than try to take measures that will forestall delivery until the 39th week.
Although ICD-9 already also has a code for early onset of delivery (644.21), it applies only to pregnancies before 37 completed weeks.
The new codes are:
| 649.81 | Onset (spontaneous) of labor after 37 completed weeks of gestation but before 39 completed weeks’ gestation, with delivery by (planned) cesarean section, delivered, with or without mention of antepartum condition |
| 649.82 | Onset (spontaneous) of labor after 37 completed weeks of gestation but before 39 completed weeks’ gestation, with delivery by (planned) cesarean section, delivered, with mention of postpartum complication |
Note: The new code has two options for a fifth digit:
- Reporting a fifth digit 1 indicates that the patient may, or may not, have had a complication in the antepartum period that is related to early onset of labor.
- Reporting a fifth digit 2 indicates that the patient developed a complication after delivery (but before discharge) that is related to the delivery.
For any hospitalization that results in a delivery, you must select a fifth digit 1 or 2; the choice depends on the overriding complication. You may not list code 649.8 twice—i.e., once with a fifth digit 1 and once with a fifth digit 2.
If the patient had a condition that was documented to be why cesarean delivery was medically indicated, list that as a secondary diagnosis—for example, cephalopelvic disproportion (653.4x) or prior cesarean delivery (654.2x).
SUPERVISION OF HIGH-RISK PREGNANCY
Code subcategory V23.4 (Pregnancy with other poor obstetric history) had only two coding options before October 1, 2011: V23.41 (Pregnancy with history of pre-term labor) and V23.49 (Pregnancy with other poor obstetric history).
Ectopic pregnancy. ACOG considers that it is important to track patients who had a prior ectopic pregnancy because such a history gives rise to an increased risk of ectopic pregnancy during the current pregnancy. Therefore, a new code for this status was requested by ACOG, and provided.
Note: Use the new history code only until the patient is confirmed not to have an ectopic pregnancy, if that is the outcome. Once you’ve confirmed that she has only a normal, intrauterine pregnancy, the risk posed by her history no longer has an impact on the current pregnancy. (ICD-9 rules direct you to report conditions that require active intervention or a change in routine care of the pregnancy—not conditions that merely exist without the need for intervention or additional monitoring.)
The new code is:
| V23.42 | Pregnancy with history of ectopic pregnancy |
Fetal viability. There was also no specific code before October 1 to report the need for a sonogram to check fetal viability, especially when a previously confirmed pregnancy comes into question because of the apparent absence of a fetal heartbeat on examination of the mother. In such a case, an additional sonogram might be required beyond the initial scan to confirm fetal demise or a continuing viable pregnancy. Until now, either of these findings could have been reported only with codes that do not accurately describe the situation, such as 659.7 (Abnormality in fetal heart rate or rhythm); V28.89 (Other specified antenatal screening); and V23.89 (Other high-risk pregnancy).
The new code is:
| V23.87 | Pregnancy with inconclusive fetal viability |
Changes to gyn codes
An effective surgical treatment for vaginal vault prolapse is sacrocolpopexy that uses a graft to suspend the upper vagina to the anterior longitudinal ligament of the sacrum. But, regrettably, synthetic graft material has also been associated with erosion of the mesh and subsequent pelvic infection (by erosion into surrounding organs or tissue). Exposure of the mesh in the vagina can also occur (see “Take this simplified approach to correcting exposure of vaginal mesh” in the July 2011 issue, available at obgmanagement.com).
Before October 1, erosion or exposure of mesh (without infection) would have been reported with code 996.39 (Mechanical complication of a genitourinary device, implant and graft) or 996.76 (Other complications due to genitourinary device, implant, and graft). With creation of a new subcategory code, 629.3 (Complication of implanted vaginal mesh and other prosthetic materials), however, these specific complications can be reported and tracked. The new codes also give you a specific linking diagnosis for revision of the mesh.
The two new codes are:
| 629.31 | Erosion of implanted vaginal mesh and other prosthetic materials to surrounding organ or tissue (e.g., into pelvic floor muscles) |
| 629.32 | Exposure of implanted vaginal mesh and other prosthetic materials into vagina (e.g., through the vaginal wall) |
Note: If the patient’s graft material has caused fibrosis, hemorrhage, occlusion, or pain, continue to report 996.76. And, of course, any infection or inflammatory reaction caused by mesh is reported with existing code 996.65.
Because erosion and exposure can occur at the same time, it is proper to report both new codes, if that is the case.
HISTORY OF GESTATIONAL DIABETES
Code V12.2 (Personal history of endocrine, metabolic, and immunity disorders) has been expanded and divided into two five-digit codes:
| V12.21 | Gestational diabetes |
| V12.29 | Other endocrine, metabolic, and immunity disorders |
With this change, four-digit code V12.2 became an invalid diagnosis code; your claim will be denied if you report it as the reason for an encounter.
Note: Code V12.21 may not be reported as a primary diagnosis for an obstetrical patient. Instead, a personal history that may be having an impact on the current pregnancy should be reported with a V23.xx code (Supervision of high risk pregnancy), until (and if) the patient develops a condition.
For example: If a patient had gestational diabetes during a prior pregnancy, she risks developing it again in the current pregnancy. In that case, report V23.49 (Pregnancy with other poor obstetric history) as the primary code and assign V12.21 as the secondary code.
LONG-TERM USE OF BISPHOSPHONATES
In a woman being treated to prevent loss of bone mass, the side-effect profile of the medication and the need to measure its effectiveness require regular follow-up visits. Effective October 1, code V58.68 (Long-term [current] use of bisphosphonates) should be reported for these follow-up visits. The code can be also used to support ordering follow-up bone densitometry.
Medications that might be applicable here are alendronate (Fosamax), ibandronate (Boniva), risedronate (Actonel), and zoledronic acid (Reclast).
Download a free copy of the complete addenda of ICD-9-CM code changes that have been made for fiscal year 2012 at: www.cdc.gov/nchs/icd/icd9cm_addenda_guidelines.htm
We want to hear from you! Tell us what you think.
Strategies and steps for the surgical management of endometriosis
- Resection of an endometrioma in severe disease, using a “stripping” technique
- Ovarian cystectomy
- Resection of endometriosis from the left ligament
- Resection of endometriosis on the bladder
These videos were provided by Anthony Luciano, MD.
Endometriosis affects 7% to 10% of women in the United States, mostly during reproductive years.1 The estimated annual cost for managing the approximately 10 million affected women? More than $17 billion.2 The added cost of this chronic disease, with recurrences of pain and infertility, comes in the form of serious life disruption, emotional suffering, marital and social dysfunction, and diminished productivity.
Although the prevalence of endometriosis is highest during the third and fourth decades of life, the disease is also common in adolescent girls. Indeed, 45% of adolescents who have chronic pelvic pain are found to have endometriosis; if their pain does not respond to an oral contraceptive (OC) or a non-steroidal anti-inflammatory drug, 70% are subsequently found at laparoscopy to have endometriosis.3
What is it?
Endometriosis is the presence of functional endometrial tissue outside the uterus, such as eutopic endometrium. The disease responds to effects of cyclic ovarian hormones, proliferating and bleeding with each menstrual cycle, which often leads to diffuse inflammation, adhesions, and growth of endometriotic nodules or cysts (FIGURE 1).
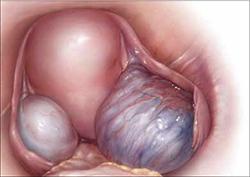
FIGURE 1 Drainage will not suffice
Surgical management of ovarian endometriomas must go beyond simple drainage, which has little therapeutic value because symptoms recur and endometriomas re-form quickly after simple drainage in almost all patients.Symptoms tend to reflect affected organs:
- Because the pelvic organs are most often involved, the classic symptom triad of the disease comprises dysmenorrhea, dyspareunia, and infertility.
- Urinary urgency, dysuria, dyschezia, and tenesmus are frequent complaints when the bladder or rectosigmoid is involved.
- When distant organs are affected, such as the upper abdomen, diaphragm, lungs, and bowel, the patient may complain of respiratory symptoms, hemoptysis, pneumothorax, shoulder pain, upper abdominal pain, and episodic gastrointestinal dysfunction.
The hallmark of endometriosis is catamenial symptoms, which are usually cyclic and most severe around the time of menses. Clinical signs include palpable tender nodules and fibrosis on the anterior and posterior cul de sac, fixed retroverted or anteverted uterus, and adnexal cystic masses.
Because none of these symptoms or signs is specific for endometriosis, diagnosis relies on laparoscopy, which allows the surgeon to:
- visualize it in its various appearances and locations (FIGURE 2)
- confirm the diagnosis histologically with directed excisional biopsy
- treat it surgically with either excision or ablation.
In this article, we describe various surgical techniques for the management of endometriosis. Beyond resection or ablation of lesions, however, your care should also be directed to postoperative measures to prevent its recurrence and to avoid repeated surgical interventions—which, regrettably, are much too common in women who are afflicted by this enigmatic disease.
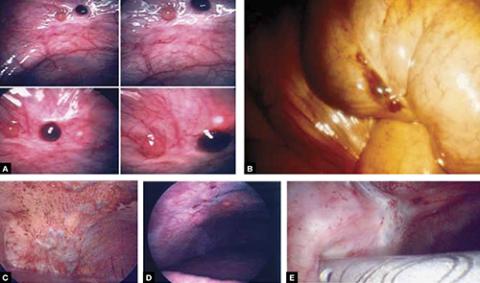
FIGURE 2 Endometriosis: A disease of varying appearance
Lesions of endometriosis can be pink, dark, clear, or white on the pelvic sidewall (A), bowel (B), and diaphragm (C); under the rib cage (D); and on the ureter (E) (left ureter shown here).
CASE Severe disease in a young woman
S. D. is a 22-year-old unmarried nulligravida who came to the emergency service complaining of acute onset of severe low abdominal pain, which developed while she was running. She was afebrile and in obvious distress, with diffuse lower abdominal tenderness and guarding, especially on the left side.
Ultrasonography revealed a 7-cm adnexal cystic mass suggestive of endometrioma (FIGURE 3).
Two years before this episode, S. D. underwent laparoscopic resection of a 5-cm endometrioma on the right ovary. Subsequently, she was treated with a cyclic OC, which she discontinued after 1 year because she was not sexually active.
The family history is positive for endometriosis in her mother, who had undergone multiple laparoscopic investigations and, eventually, total hysterectomy with bilateral salpingo-oophorectomy at 40 years of age.
S. D. was treated on the emergency service with analgesics and referred to you for surgical management.
S. D. has severe disease that requires aggressive surgical resection and a lifelong management plan. That plan includes liberal use of medical therapy to prevent recurrence of symptoms and avoid repeated surgical procedures—including the total hysterectomy with bilateral salpingo-oophorectomy that her mother underwent.
What is the best immediate treatment plan? Should you:
- drain the cyst?
- drain it and coagulate or ablate its wall?
- resect the wall of the cyst?
- perform salpingo-oophorectomy?
You also ask yourself: What is the risk of recurrence of endometrioma and its symptoms after each of those treatments? And how can I reduce those risks?
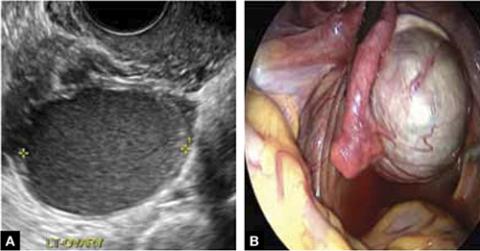
FIGURE 3 Endometrioma
Endometrioma on ultrasonography (A), with its characteristic homogeneous, echogenic appearance and “ground glass” pattern, and through the laparoscope (B). These images are from the patient whose case is described in the text.
Focal point: Ovary
The ovary is the most common organ affected by endometriosis. The presence of ovarian endometriomas, in 17% to 44% of patients who have this disease,4 is often associated with an advanced stage of disease.
In a population of 1,785 patients who were surgically treated for ovarian endometriosis, Redwine reported that only 1% had exclusively ovarian involvement; 99% also had diffuse pelvic disease,5 suggesting that ovarian endometrioma is a marker of extensive disease, which often requires a gynecologic surgeon who has advanced skills and experience in the surgical management of severe endometriosis.
Simple drainage is inadequate
Surgical management of ovarian endometrioma must go beyond simple drainage, which has little therapeutic value because symptoms recur and endometriomas re-form quickly after simple drainage in almost all patients.6 The currently accepted surgical management of endometrioma involves either 1) coagulation and ablation of the wall of the cyst with electrosurgery or laser or 2) removal of the cyst wall from the ovary with blunt and sharp dissection.
Several studies have compared these two techniques, but only two7,8 were prospectively randomized.
Study #1. Beretta and co-workers7 studied 64 patients who had ovarian endometriomas larger than 3 cm and randomized them to cystectomy by complete stripping of the cyst wall or to drainage of fluid followed by electrocoagulation to ablate the endometriosis lesions within the cyst wall. The two groups were followed for 2 years to assess the recurrence of symptoms and the pregnancy rate in the patients who were infertile.
Recurrence of symptoms and the need for medical or surgical intervention occurred with less frequency and much later in the resection group than in the ablation group: 19 months, compared to 9.5 months, postoperatively. The cumulative pregnancy rate 24 months postoperatively was also much higher in the resection group (66.7%) than in the ablative group (23.5%).
Study #2. In a later study,8 Alborzi and colleagues randomized 100 patients who had endometrioma to cystectomy or to drainage and coagulation of the cyst wall. The mean recurrence rate, 2 years postoperatively, was much lower in the excision group (15.8%) than in the ablative group (56.7%). The cumulative pregnancy rate at 12 months was higher in the excision group (54.9%, compared to 23.3%). Furthermore, the reoperation rate at 24 months was much lower in the excision group (5.8%) than in the ablative group (22.9%).
These favorable results for cystectomy over ablation were validated by a Cochrane Review, which concluded that excision of endometriomas is the preferred approach because it provides 1) a more favorable outcome than drainage and ablation, 2) lower rates of recurrence of endometriomas and symptoms, and 3) a much higher spontaneous pregnancy rate in infertile women.9
Although resection of the cyst wall is technically more challenging and takes longer to perform than drainage and ablation, we exclusively perform resection rather than ablation of endometriomas because we believe that more lasting therapeutic effects and reduced recurrence of symptoms and disease justify the extra effort and a longer procedure.
Drawback of cystectomy
A potential risk of cystectomy is that it can diminish ovarian reserve and, in rare cases, induce premature menopause, which can be devastating for women whose main purpose for having surgery is to restore or improve their fertility.
The impact of laparoscopic ovarian cystectomy on ovarian reserve was prospectively studied by Chang and co-workers,10 who measured preoperative and postoperative levels of anti-müllerian hormone (AMH) in 13 women who had endometrioma, 6 who had mature teratoma, and 1 who had mucinous cystadenoma. One week postoperatively, the AMH level decreased significantly overall in all groups. At 4 and 12 weeks postoperatively, however, the AMH level returned to preoperative levels among subjects in the non-endometrioma group but not among subjects who had endometrioma; rather, their level remained statistically lower than the preoperative level during the entire 3 months of follow-up.
Stripping the wall of an endometrioma cyst is more difficult than it is for other benign cysts, such as cystic teratoma or cystadenoma, in which there usually is a well-defined dissection plane between the wall of the cyst and surrounding stromal tissue—allowing for easy and clean separation of the wall. The cyst wall of an endometrioma, on the other hand, is intimately attached to underlying ovarian stroma; lack of a clear cleavage plane between cyst and ovarian stroma often results in unintentional removal of layers of ovarian cortex with underlying follicles, which, in turn, may lead to a reduction in ovarian reserve.
Histologic analyses of resected endometrioma cyst walls have reported follicle-containing ovarian tissue attached to the stripped cyst wall in 54% of cases.11,12 That observation explains why, and how, ovarian reserve can be compromised after resection of endometrioma.
Further risk: Ovarian failure
In rare cases, excision of endometriomas results in complete ovarian failure, described by Busacca and colleagues, who reported three cases of ovarian failure (2.4%) after resection of bilateral endometriomas in 126 patients.13 They attributed ovarian failure to excessive cauterization that compromised vascularization, as well as to excessive removal of ovarian tissue.
It is important, therefore, to strip the thinnest layer of the cyst capsule and to reduce the amount of electrocoagulation of ovarian stroma as much as possible to safeguard functional ovarian tissue.
CASE continued
S. D. was scheduled for laparoscopy to remove the endometrioma and other concurrent pelvic and peritoneal pathology, such as endometriosis and pelvic adhesions. You also scheduled her for hysteroscopy to evaluate the endometrial cavity for potential pathology, such as endometrial polyps and uterine septum, which appear to be more common in women who have endometriosis.
Nawroth and co-workers14 found a much higher incidence of endometriosis in patients who had a septate uterus. Metalliotakis and co-workers15 found congenital uterine malformations to be more common in patients who had endometriosis, compared with controls; uterine septum was, by far, the most common anomaly.
CASE continued
Hysteroscopy revealed a small and broad septum, which was resected sharply with hysteroscopic scissors (FIGURE 4). Laparoscopy revealed a 7-cm endometrioma on the left ovary, with adhesions to the posterior broad ligament and pelvic sidewall. S. D. also had deep implants of endometriosis on the left pelvic sidewall, the posterior cul de sac, the right pelvic sidewall, and the right ovary, which was cohesively adherent to the ovarian fossa.
As you expected, S. D. has stage-IV disease, according to the revised American Fertility Society Classification.
Following adhesiolysis, the endometrioma was resected (see VIDEO 1). Because of the large ovarian defect, the edges of the ovary were approximated with imbricating running 3-0 Vicryl suture. Deep endometriosis was also resected. Superficial endometriosis was peeled off or coagulated using bipolar forceps.
Note: Alternatively, and with comparable results, resection may be performed with a laser or other energy source. We prefer resection, rather than ablation, of deep endometriosis, but no data exists to support one technique over the other.
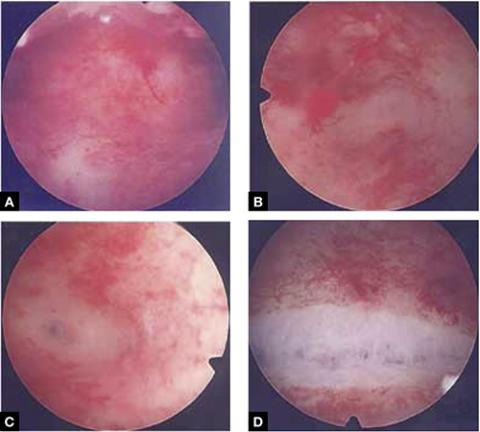
FIGURE 4 Septate uterus with deep cornua
Through the hysteroscope, a shallow septum is visible at the fundus of the uterus, dividing the upper endometrial cavity into two chambers (A), with deep cornua on the left (B) and right (C). Normal fundal anatomy is restored by septolysis along the avascular plane (D).
Technique: How we resect endometrioma
In removing endometrioma (see VIDEO 2), it is important to grasp the thinnest part of the cyst wall and progressively strip it, to avoid removing excess ovarian tissue and to reduce the risk of compromising ovarian reserve.
After draining the endometrioma of its chocolate-colored fluid, we irrigate and drain the cyst several times with warm lactated Ringers’ solution to promote separation of the cyst wall from underlying stroma and better identify the dissection plane. The cyst wall is inspected by introducing the laparoscope into the cyst to examine its surface, which is often laden with implants of deep and superficial endometriosis.
If we cannot easily identify the plane of dissection along the edges, we may evert the cyst and make an incision at its base to create a wedge between the wall of the cyst and underlying stroma. The edge of the incised wall is then grasped and retracted to create a space between the wall and the underlying stroma, from which it is progressively stripped from the ovary.
Traction and counter-traction are the hallmarks of dissection here; sometimes, we use laparoscopic scissors to sharply resect the ovarian stromal attachments that adhere cohesively to the cyst wall. This technique is continued until the entire cyst wall is removed. When follicle-containing ovarian tissue remains attached to the cyst wall, we introduce the closed tips of the Dolphin forceps between the cyst wall and adjacent follicle-containing stroma, spread the tips apart, and recover the true plane of dissection between the thin wall of the cyst and stroma.
After the wall of the cyst is removed, the ovarian crater invariably bleeds because blood vessels supplying the wall have been separated and opened. Utilizing warm lactated Ringers’ solution, we copiously irrigate the bleeding ovarian stroma to identify each bleeding vessel and, by placing the tips of the micro-bipolar forceps on either side of the bleeder, individually coagulate each vessel, thus inflicting minimal thermal damage to the surrounding stroma.
Pearl. Avoid using Kleppinger forceps to indiscriminately coagulate the bloody stroma in the crater created after the cystectomy, because doing so can result in excessive destruction of ovarian tissue or inadvertent coagulation of hylar vessels that would interrupt the blood supply to the ovary, compromising its function.16
Suturing. Some surgeons find that fenestration, drainage, and coagulation of the cyst wall is acceptable, but we have concerns not only about incomplete ablation of the endometriosis on the cyst wall, which may be responsible for the higher recurrence rate of disease, but also about the risk of thermal injury to underlying follicles, which may compromise ovarian reserve.16
Hemostasis. Once complete hemostasis has been achieved, the decision to approximate (or not) the edges, preferably with fine absorbable suture, is based on how large the defect is and whether or not the edges of the crater spontaneously come together. For large craters, we usually close the ovary with a 3-0 or 4-0 Vicryl continuous suture, imbricating the edges to expose as little suture material as possible to reduce postoperative formation of adhesions, which is common after ovarian surgery.17
Last, we ensure that hemostasis is present. Often we apply an anti-adhesion solution, such as icodextrin 4% (Adept). This agent has been shown to reduce postoperative adhesion formation, especially after laparoscopic surgery for endometriosis.18
A high level of skill is needed
Ovarian endometriomas signal advanced disease; advanced surgical skills are required to treat them adequately. Simple drainage is of little therapeutic value and should seldom be considered a treatment option. Although drainage plus ablation of the cyst wall ameliorates symptoms, excision of endometriomas should be considered preferable because it provides a more favorable outcome, a lower risk of recurrence of endometriomas and symptoms, and a higher rate of spontaneous pregnancy in previously infertile women.7-9
To recap, we advise the surgeon to:
- Manage ovarian endometriomas with resection of the entire cyst wall, grasping and stripping the thinnest layer of the cyst wall without removing underlying functional ovarian stroma.
- Avoid excessive cauterization of the underlying ovarian stroma by utilizing micro-bipolar forceps and applying energy only around bleeding vessels.
- Close stromal defects, when the crater is large and its edges do not spontaneously come together, by approximating the edges with an imbricating resorbable suture.
CASE continued
As in most cases of advanced endometriosis, S. D. also had diffuse implants of deep and superficial endometriosis on the peritoneum of the pelvic sidewalls and on the anterior and posterior cul de sac.
Should you ablate or resect these lesions? Are there advantages to either approach?
Ablation of endometriosis implants may involve either electrocoagulation of the lesion with bipolar energy or laser vaporization/coagulation, which destroys or devitalizes active endometriosis but does not actually remove the lesion. Ablation destroys the lesion without getting a specimen for histologic diagnosis.
Resection of endometriosis implants involves complete removal of the lesion from its epithelial surface to the depth of its base. Resection can be performed with scissors, laser, or monopolar electrosurgery. Resection removes the lesion in its entirety, yielding a histologic diagnosis and allowing you to determine whether, indeed, the entire specimen has been removed.
The question of what is more effective—ablating or resecting endometriosis implants?—was addressed in a prospective study in which 141 patients with endometriosis-related pain were randomized at laparoscopic surgery to either excision or ablation/coagulation of endometriosis lesions.19 Six months postoperatively, the pain score decreased by, on average, 11.2 points in the excision group and 8.7 points in the coagulation/ablative group.
Because the difference in those average pain scores was not statistically significant, however, investigators concluded that the techniques are comparable, with similar efficacy. That interpretation has been criticized because the study was underpowered and included only patients who had mild endometriosis—leaving open the possibility that deep endometriosis may not be adequately treated by electrocoagulation or ablation.
In contrast to superficial endometriosis, which may respond similarly to ablation or resection, deep endometriosis is difficult to ablate either with electrosurgery or a laser because the energy cannot reach deeper layers and active disease is therefore likely to be left behind. Moreover, when endometriosis overlies vital structures, such as the ureter or bowel, ablation of the lesion may cause thermal damage to the underlying organ, and such damage may not manifest until several days later, when the patient experiences, say, urinary leakage in the peritoneum or symptoms of bowel perforation.
FIGURE 5 illustrates a case in which CO2 laser ablation of endometriosis that had been causing deep dyspareunia did not alleviate symptoms. Because those symptoms persisted, the patient was referred to our center, where a second laparoscopy revealed deep nodules of endometriosis, 1 to 2 cm in diameter, extending from the right and the left uterosacral ligaments deep into the perirectal space, bilaterally.
As the bottom panel of FIGURE 5 shows, excised nodules were deep and large; neither laser nor electrosurgery would have been able to ablate or devitalize the deep endometriosis at the base of these 2-cm nodules.
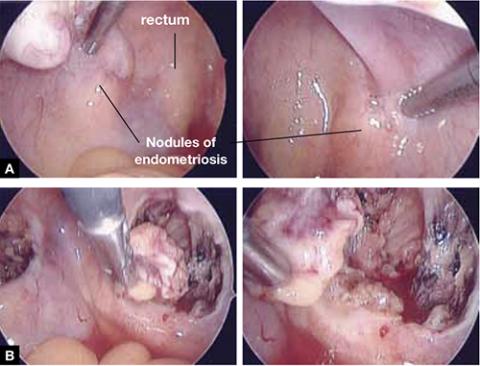
FIGURE 5 Deep nodules present a surgical challenge
These nodules of endometriosis on the right and left uterosacral ligaments (panel A) did not respond to CO2 laser ablation. Upon progressive resection, the implants were found to be deep, extending into the perirectal space (panel B). (See also VIDEO 3, resection of endometriosis from the left uterosacal ligament, close to the ureter.) FIGURE 6, illustrates endometriosis overlying the bladder and left ureter (see also VIDEO 4). Ablation of endometriosis in these areas may be inadequate if it is not deep enough, and dangerous if it goes too deep. As FIGURE 6 shows, excision assures the surgeon that the entire lesion has been removed and that underlying vital structures have been safeguarded.
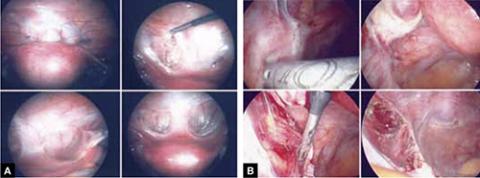
FIGURE 6 Urinary tract involvement
Endometriosis overlying the bladder is grasped, retracted, and resected (panel A). Endometriosis compresses the left ureter (panel B). The peritoneum above the lesion is entered, the ureter is displaced laterally, and the lesion is safely resected.
What we do, and recommend
When endometriosis is superficial and does not overlie vital organs, such as the bladder, ureter, and bowel, ablation and resection may be equally safe and effective. When endometriosis is deep and overlying vital organs, however, complete resection—with careful dissection of the lesion off underlying structures—offers a more complete and a safer surgical approach.
CASE continued
Now that S. D. has been treated surgically by complete excision of endometriosis, adhesions, and endometriomas, you must consider a management plan that will reduce the risks 1) of recurrence of symptoms and disease and 2) that further surgery will be necessary in the future—a risk that, in her case, exceeds 50% because of her young age, nulliparity, and the severity of her disease.20,21 Indeed, you are aware that, had preventive measures been implemented after her initial surgery 2 years earlier, it is unlikely that S. D. would have developed the second endometrioma and most likely that she would not have needed the second surgery.
Prevention of recurrence is necessary—and doable
The importance of implementing preventive measures to reduce the risk of recurrence of endometriosis and its symptoms has been suggested by several studies. It was underscored recently in a prospective, randomized study conducted by Serracchioli and colleagues,22 in which 239 women who had undergone laparoscopic resection of endometriomas were randomly assigned to expectant management (control group), a cyclic oral contraceptive (OC), or a continuous oral contraceptives for 24 months, and evaluated every 6 months.
At the end of the study, recurrence of symptoms occurred in 30% of controls; 15% of subjects taking a cyclic OC; and 7.5% of the subjects taking a continuous OC. The recurrence rate of endometrioma in this study was reduced by 50% (cyclic OC) and 75% (continuous OC).22
Similar results were reported in a case-controlled study by Vercellini and co-workers,23 who found that the risk of recurrence of endometrioma was reduced by 60% when postoperative OCs were used long-term and by 30% when used for a duration of less than 12 months.
These studies suggest that, by suppressing ovulation and inducing a state of hypomenorrhea or amenorrhea, the risk of recurrence of endometriosis and its symptoms can be significantly reduced.
The importance of amenorrhea in reducing the postoperative recurrence of endometriosis and symptoms has been underscored by two important studies that evaluated the role of postoperative endometrial ablation or postoperative insertion of the levonorgestrel intrauterine system (LNG-IUS; Mirena), neither of which suppresses ovulation but both of which induce a state of hypomenorrhea or amenorrhea.24,25
In a prospective randomized study by Bulletti and co-workers,24 28 patients who had symptomatic endometriosis underwent laparoscopic conservative surgery. Endometrial ablation was performed in 14 of the 28. Two years later, all patients underwent second-look laparoscopy; recurrence of endometriosis was found in 9 of the 14 non-ablation patients but in none in the ablation group. Resolution or significant improvement of symptoms were reported in 13 of 14 women in the ablation group but only in 3 of 14 in the non-ablation group—supporting the premise that amenorrhea or hypomenorrhea by itself, without suppressing ovulation, significantly reduces the risk that endometriosis will recur.
Similar beneficial results from hypomenorrhea/amenorrhea on the risk of recurrence of symptoms have been reported when the LNG-IUS is inserted following conservative surgery for endometriosis. In a prospective study by Vercellini and colleagues,25 40 symptomatic patients who had stage-III or stage-IV disease were randomized to either insertion of the LNG-IUS or a control group after conservative laparoscopic surgery. Recurrence of pain was significantly (P = .012) reduced in the LNG-IUS group (45%), compared with the control group (10%). Control subjects were also much less satisfied with their treatment than those who were treated with the LNG-IUS.
The importance of inducing a state of amenorrhea to reduce the risk of disease recurrence was further underscored by a recent study. Shakiba and colleagues26 reported on the recurrence of endometriosis that required further surgery as long as 7 years after the subjects had been surgically treated for symptomatic endometriosis. The need for subsequent surgery was 8% after hysterectomy and bilateral salpingo-oophorectomy; 12% after hysterectomy alone; and 60% after conservative laparoscopy with preservation of both uterus and ovaries.
Taken together, these data show that, unless the patient is rendered amenorrheic or hypomenorrheic, her risk of recurrence exceeds 50%.
It is important, therefore, to consider conservative surgical management of endometriosis as only the beginning of a lifelong management plan. That plan begins with complete resection of all visible endometriosis and adhesions, resection of endometriomas, and restoration of normal anatomy as much as possible.
When endometriosis cannot be completely resected—as when it involves small bowel or the diaphragm, or is diffusely on the large bowel—we recommend medical suppressive therapy. Our preference is depot leuprolide acetate (Lupron Depot), always with add-back therapy to minimize side effects, which include vasomotor symptoms, vaginal dryness, and bone loss,27 until the patient is significantly asymptomatic, which may take 6 to 9 months.
CASE Concluded, with long-term intervention
You counsel S. D. to remain on a low-dose hormonal OC continuously, until such time that she wants to conceive. If a patient does not want to conceive for at least 5 years, the LNG-IUS may be inserted at surgery to induce hypomenorrhea and reduce the risk of recurrence for the next 5 years.
When hormonal contraceptives are inadequate to control symptoms, adding the aromatase enzyme inhibitor letrozole (Femara), 2.5 mg daily for 6 to 9 months, usually alleviates symptoms with minimal side effects, as long as the patient keeps taking a hormonal contraceptive. Using letrozole without hormonal contraception has not been studied; doing so may lead to formation of ovarian cysts, and is therefore not recommended for managing symptomatic endometriosis.
If the patient wants to become pregnant, encourage her to actively undertake fertility treatment as soon as possible after surgery, thereby minimizing the risk of recurrence of symptoms and disease. The best option may be to employ assisted reproductive technology, but patients cannot always afford it; when that is the case, consider controlled ovarian stimulation and intrauterine insemination.
We want to hear from you! Tell us what you think.
1. Bulun S E. Endometriosis. N Engl J Med. 2009;360(3):268-279.
2. Gao X, Outley J, Botteman M, Spalding J, Simon JA, Pashos CL. Economic burden of endometriosis. Fertil Steril. 2006;86(6):1561-1572.
3. Laufer MR, Goitein L, Bush M, Cramer DW, Emans SJ. Prevalence of endometriosis in adolescent girls with chronic pelvic pain not responding conventional therapy. J Pediatr Adolesc Gynecol. 1997;10(4):199-202.
4. Gruppo Italiano per lo studio dell’endometriosi. Prevalence and anatomic distribution of endometriosis in women with selected gynaecological conditions: results from a multicenter Italian study. Hum Reprod. 1994;9(6):1158-1162.
5. Redwine DB. Ovarian endometriosis: a marker for more extensive pelvic and intestinal disease. Fertil Steril. 1999;72(2):319-315.
6. Muzii L, Marana R, Caruana P, Catalano GF, Mancuso S. Laparoscopic findings after transvaginal ultrasound-guided aspiration of ovarian endometriomas. Hum Reprod. 1995;10(11):2902-2903
7. Beretta P, Franchi M, Ghezzi F, Busacca M, Zupi E, Bolis P. Randomized clinical trial of two laparoscopic treatment of endometriomas: cystectomy versus drainage and coagulation. Fertil Steril. 1998;70(6):1176-1180
8. Alborzi S, Momtahan M, Paranezhad ME, Dehbashi S, Zolghadri J, Alborzi S. A prospective randomized study comparing laparoscopic ovarian cystectomy versus fenestration and coagulation in patients with endometriomas. Fertil Steril. 2004;82(6):1633-1637
9. Hart RJ, Hickey M, Maouris P, Buckett W, Garry R. Excisional surgery versus ablative surgery for ovarian endometriomas. Cochrane Database Syst Rev. 2005;(3):CD004992.-
10. Chang HJ, Sang HH, Jung RL, et al. Impact of laparoscopic cystectomy on ovarian reserve: serial changes of serum anti-Müllerian hormone levels. Fertil Steril. 2010;94(1):343-349.
11. Muzii L. Bianchi A Crocè C, Manci N, Panici PB. Laparoscopic excision of ovarian cysts: is the stripping technique a tissue sparing procedure? Fertil Steril. 2002;77(3):609-614.
12. Hachisuga T, Kawarabyashi T. Histopathological analysis of laparoscopically treated ovarian endometriotic cysts with special reference to loss of follicles. Hum Reprod. 2002;17(2):432-435.
13. Busacca M, Riparini J Somigliana E, et al. Postsurgical ovarian failure after laparoscopic excision of bilateral endometriomas. Am J Obstet Gynecol. 2006;195(2):421-425.
14. Nawroth F, Rahimi G, Nawroth C, Foth D, Ludwig M, Schmidt T. Is there an association between septate uterus and endometriosis? Hum Reprod. 2006;21(2):542-546.
15. Matalliotakis IM, Goumenou AG, Matalliotakis M, Arici A. Uterine anomalies in women with endometriosis. J Endometriosis. 2010;2(4):213-217.
16. Li CZ, Liu B, Wen ZQ, Sun Q. The impact of electrocoagulation on ovarian reserve after laparoscopic excision of ovarian cyst: a prospective clinical study of 191 patients. Fertil Steril. 2009;92(4):1428-1435.
17. Luciano DE, Roy G, Luciano AA. Adhesion reformation after laparoscopic adhesiolysis: where what type, and in whom are they most likely to recur. J Minim Invasive Gynecol. 2008;15(1):44-48.
18. Colin CB, Luciano AA, Martin D, et al. Adept (icodextrin 4% solution) reduces adhesions after laparoscopic surgery for adhesiolysis: a double-blind, randomized, controlled study. Fertil Steril. 2007;88(5):1413-1426.
19. Wright J, Lotfallah H, Jones K, Lovell D. A randomized study of excision vs ablation for mild endometriosis. Fertil Steril. 2004;83(6):1830-1836.
20. Cheong Y, Tay P, Luk F, Gan HC, Li TC, Cooke I. Laparoscopic surgery for endometriosis: How often do we need to re-operate? J Obstet Gynaecol. 2008;28(1):82-85.
21. Liu X, Yuan L, Shen F, Zhu Z, Jiang H, Guo SW. Patterns of and risk factors for recurrence in women with ovarian endometriomas. Obstet Gynecol. 2007;109(6):1411-1120.
22. Seracchioli R, Mabrouk M, Frasca C, et al. Long-term cyclic and continuous oral contraceptive therapy and endometriomas recurrence: a randomized controlled trial. Fertil Steril. 2010;93(1):52-56.
23. Vercellini P, Somigliana E, Daguati R, Vigano P, Meroni F, Crosignani PG. Postoperative oral contraceptive exposure and risk of endometrioma recurrence. Am J Obstet Gynecol. 2008;198(5):504.e1-5.
24. Bulletti C, DeZiegler D, Stefanetti M, Cicinelli E, Pelosi E, Flamigni C. Endometriosis: absence of recurrence in patients after endometrial ablation. Hum Reprod. 2001;16(12):2676-2679.
25. Vercellini P, Frontino G, De Giorgi O, Aimi G, Zaina B, Crosignani PG. Comparison of levonorgestrel-releasing intrauterine device versus expectant management after conservative surgery for symptomatic endometriosis: a pilot study. Fertil Steril. 2003;80(2):305-309.
26. Shakiba K, Bena JF, McGill KM, Minger J, Falcone T. Surgical treatment of endometriosis: a 7-year follow-up on the requirement for further surgery. Obstet Gynecol. 2008;111(6):1285-1292.
27. Surrey ES, Hornstein MD. Prolonged GnRH agonist and add-back therapy for symptomatic endometriosis: a long-term follow-up Obstet Gynecol. 2002;99(5 Pt 1):709-719.
- Resection of an endometrioma in severe disease, using a “stripping” technique
- Ovarian cystectomy
- Resection of endometriosis from the left ligament
- Resection of endometriosis on the bladder
These videos were provided by Anthony Luciano, MD.
Endometriosis affects 7% to 10% of women in the United States, mostly during reproductive years.1 The estimated annual cost for managing the approximately 10 million affected women? More than $17 billion.2 The added cost of this chronic disease, with recurrences of pain and infertility, comes in the form of serious life disruption, emotional suffering, marital and social dysfunction, and diminished productivity.
Although the prevalence of endometriosis is highest during the third and fourth decades of life, the disease is also common in adolescent girls. Indeed, 45% of adolescents who have chronic pelvic pain are found to have endometriosis; if their pain does not respond to an oral contraceptive (OC) or a non-steroidal anti-inflammatory drug, 70% are subsequently found at laparoscopy to have endometriosis.3
What is it?
Endometriosis is the presence of functional endometrial tissue outside the uterus, such as eutopic endometrium. The disease responds to effects of cyclic ovarian hormones, proliferating and bleeding with each menstrual cycle, which often leads to diffuse inflammation, adhesions, and growth of endometriotic nodules or cysts (FIGURE 1).
FIGURE 1 Drainage will not suffice
Surgical management of ovarian endometriomas must go beyond simple drainage, which has little therapeutic value because symptoms recur and endometriomas re-form quickly after simple drainage in almost all patients.Symptoms tend to reflect affected organs:
- Because the pelvic organs are most often involved, the classic symptom triad of the disease comprises dysmenorrhea, dyspareunia, and infertility.
- Urinary urgency, dysuria, dyschezia, and tenesmus are frequent complaints when the bladder or rectosigmoid is involved.
- When distant organs are affected, such as the upper abdomen, diaphragm, lungs, and bowel, the patient may complain of respiratory symptoms, hemoptysis, pneumothorax, shoulder pain, upper abdominal pain, and episodic gastrointestinal dysfunction.
The hallmark of endometriosis is catamenial symptoms, which are usually cyclic and most severe around the time of menses. Clinical signs include palpable tender nodules and fibrosis on the anterior and posterior cul de sac, fixed retroverted or anteverted uterus, and adnexal cystic masses.
Because none of these symptoms or signs is specific for endometriosis, diagnosis relies on laparoscopy, which allows the surgeon to:
- visualize it in its various appearances and locations (FIGURE 2)
- confirm the diagnosis histologically with directed excisional biopsy
- treat it surgically with either excision or ablation.
In this article, we describe various surgical techniques for the management of endometriosis. Beyond resection or ablation of lesions, however, your care should also be directed to postoperative measures to prevent its recurrence and to avoid repeated surgical interventions—which, regrettably, are much too common in women who are afflicted by this enigmatic disease.
FIGURE 2 Endometriosis: A disease of varying appearance
Lesions of endometriosis can be pink, dark, clear, or white on the pelvic sidewall (A), bowel (B), and diaphragm (C); under the rib cage (D); and on the ureter (E) (left ureter shown here).
CASE Severe disease in a young woman
S. D. is a 22-year-old unmarried nulligravida who came to the emergency service complaining of acute onset of severe low abdominal pain, which developed while she was running. She was afebrile and in obvious distress, with diffuse lower abdominal tenderness and guarding, especially on the left side.
Ultrasonography revealed a 7-cm adnexal cystic mass suggestive of endometrioma (FIGURE 3).
Two years before this episode, S. D. underwent laparoscopic resection of a 5-cm endometrioma on the right ovary. Subsequently, she was treated with a cyclic OC, which she discontinued after 1 year because she was not sexually active.
The family history is positive for endometriosis in her mother, who had undergone multiple laparoscopic investigations and, eventually, total hysterectomy with bilateral salpingo-oophorectomy at 40 years of age.
S. D. was treated on the emergency service with analgesics and referred to you for surgical management.
S. D. has severe disease that requires aggressive surgical resection and a lifelong management plan. That plan includes liberal use of medical therapy to prevent recurrence of symptoms and avoid repeated surgical procedures—including the total hysterectomy with bilateral salpingo-oophorectomy that her mother underwent.
What is the best immediate treatment plan? Should you:
- drain the cyst?
- drain it and coagulate or ablate its wall?
- resect the wall of the cyst?
- perform salpingo-oophorectomy?
You also ask yourself: What is the risk of recurrence of endometrioma and its symptoms after each of those treatments? And how can I reduce those risks?
FIGURE 3 Endometrioma
Endometrioma on ultrasonography (A), with its characteristic homogeneous, echogenic appearance and “ground glass” pattern, and through the laparoscope (B). These images are from the patient whose case is described in the text.
Focal point: Ovary
The ovary is the most common organ affected by endometriosis. The presence of ovarian endometriomas, in 17% to 44% of patients who have this disease,4 is often associated with an advanced stage of disease.
In a population of 1,785 patients who were surgically treated for ovarian endometriosis, Redwine reported that only 1% had exclusively ovarian involvement; 99% also had diffuse pelvic disease,5 suggesting that ovarian endometrioma is a marker of extensive disease, which often requires a gynecologic surgeon who has advanced skills and experience in the surgical management of severe endometriosis.
Simple drainage is inadequate
Surgical management of ovarian endometrioma must go beyond simple drainage, which has little therapeutic value because symptoms recur and endometriomas re-form quickly after simple drainage in almost all patients.6 The currently accepted surgical management of endometrioma involves either 1) coagulation and ablation of the wall of the cyst with electrosurgery or laser or 2) removal of the cyst wall from the ovary with blunt and sharp dissection.
Several studies have compared these two techniques, but only two7,8 were prospectively randomized.
Study #1. Beretta and co-workers7 studied 64 patients who had ovarian endometriomas larger than 3 cm and randomized them to cystectomy by complete stripping of the cyst wall or to drainage of fluid followed by electrocoagulation to ablate the endometriosis lesions within the cyst wall. The two groups were followed for 2 years to assess the recurrence of symptoms and the pregnancy rate in the patients who were infertile.
Recurrence of symptoms and the need for medical or surgical intervention occurred with less frequency and much later in the resection group than in the ablation group: 19 months, compared to 9.5 months, postoperatively. The cumulative pregnancy rate 24 months postoperatively was also much higher in the resection group (66.7%) than in the ablative group (23.5%).
Study #2. In a later study,8 Alborzi and colleagues randomized 100 patients who had endometrioma to cystectomy or to drainage and coagulation of the cyst wall. The mean recurrence rate, 2 years postoperatively, was much lower in the excision group (15.8%) than in the ablative group (56.7%). The cumulative pregnancy rate at 12 months was higher in the excision group (54.9%, compared to 23.3%). Furthermore, the reoperation rate at 24 months was much lower in the excision group (5.8%) than in the ablative group (22.9%).
These favorable results for cystectomy over ablation were validated by a Cochrane Review, which concluded that excision of endometriomas is the preferred approach because it provides 1) a more favorable outcome than drainage and ablation, 2) lower rates of recurrence of endometriomas and symptoms, and 3) a much higher spontaneous pregnancy rate in infertile women.9
Although resection of the cyst wall is technically more challenging and takes longer to perform than drainage and ablation, we exclusively perform resection rather than ablation of endometriomas because we believe that more lasting therapeutic effects and reduced recurrence of symptoms and disease justify the extra effort and a longer procedure.
Drawback of cystectomy
A potential risk of cystectomy is that it can diminish ovarian reserve and, in rare cases, induce premature menopause, which can be devastating for women whose main purpose for having surgery is to restore or improve their fertility.
The impact of laparoscopic ovarian cystectomy on ovarian reserve was prospectively studied by Chang and co-workers,10 who measured preoperative and postoperative levels of anti-müllerian hormone (AMH) in 13 women who had endometrioma, 6 who had mature teratoma, and 1 who had mucinous cystadenoma. One week postoperatively, the AMH level decreased significantly overall in all groups. At 4 and 12 weeks postoperatively, however, the AMH level returned to preoperative levels among subjects in the non-endometrioma group but not among subjects who had endometrioma; rather, their level remained statistically lower than the preoperative level during the entire 3 months of follow-up.
Stripping the wall of an endometrioma cyst is more difficult than it is for other benign cysts, such as cystic teratoma or cystadenoma, in which there usually is a well-defined dissection plane between the wall of the cyst and surrounding stromal tissue—allowing for easy and clean separation of the wall. The cyst wall of an endometrioma, on the other hand, is intimately attached to underlying ovarian stroma; lack of a clear cleavage plane between cyst and ovarian stroma often results in unintentional removal of layers of ovarian cortex with underlying follicles, which, in turn, may lead to a reduction in ovarian reserve.
Histologic analyses of resected endometrioma cyst walls have reported follicle-containing ovarian tissue attached to the stripped cyst wall in 54% of cases.11,12 That observation explains why, and how, ovarian reserve can be compromised after resection of endometrioma.
Further risk: Ovarian failure
In rare cases, excision of endometriomas results in complete ovarian failure, described by Busacca and colleagues, who reported three cases of ovarian failure (2.4%) after resection of bilateral endometriomas in 126 patients.13 They attributed ovarian failure to excessive cauterization that compromised vascularization, as well as to excessive removal of ovarian tissue.
It is important, therefore, to strip the thinnest layer of the cyst capsule and to reduce the amount of electrocoagulation of ovarian stroma as much as possible to safeguard functional ovarian tissue.
CASE continued
S. D. was scheduled for laparoscopy to remove the endometrioma and other concurrent pelvic and peritoneal pathology, such as endometriosis and pelvic adhesions. You also scheduled her for hysteroscopy to evaluate the endometrial cavity for potential pathology, such as endometrial polyps and uterine septum, which appear to be more common in women who have endometriosis.
Nawroth and co-workers14 found a much higher incidence of endometriosis in patients who had a septate uterus. Metalliotakis and co-workers15 found congenital uterine malformations to be more common in patients who had endometriosis, compared with controls; uterine septum was, by far, the most common anomaly.
CASE continued
Hysteroscopy revealed a small and broad septum, which was resected sharply with hysteroscopic scissors (FIGURE 4). Laparoscopy revealed a 7-cm endometrioma on the left ovary, with adhesions to the posterior broad ligament and pelvic sidewall. S. D. also had deep implants of endometriosis on the left pelvic sidewall, the posterior cul de sac, the right pelvic sidewall, and the right ovary, which was cohesively adherent to the ovarian fossa.
As you expected, S. D. has stage-IV disease, according to the revised American Fertility Society Classification.
Following adhesiolysis, the endometrioma was resected (see VIDEO 1). Because of the large ovarian defect, the edges of the ovary were approximated with imbricating running 3-0 Vicryl suture. Deep endometriosis was also resected. Superficial endometriosis was peeled off or coagulated using bipolar forceps.
Note: Alternatively, and with comparable results, resection may be performed with a laser or other energy source. We prefer resection, rather than ablation, of deep endometriosis, but no data exists to support one technique over the other.
FIGURE 4 Septate uterus with deep cornua
Through the hysteroscope, a shallow septum is visible at the fundus of the uterus, dividing the upper endometrial cavity into two chambers (A), with deep cornua on the left (B) and right (C). Normal fundal anatomy is restored by septolysis along the avascular plane (D).
Technique: How we resect endometrioma
In removing endometrioma (see VIDEO 2), it is important to grasp the thinnest part of the cyst wall and progressively strip it, to avoid removing excess ovarian tissue and to reduce the risk of compromising ovarian reserve.
After draining the endometrioma of its chocolate-colored fluid, we irrigate and drain the cyst several times with warm lactated Ringers’ solution to promote separation of the cyst wall from underlying stroma and better identify the dissection plane. The cyst wall is inspected by introducing the laparoscope into the cyst to examine its surface, which is often laden with implants of deep and superficial endometriosis.
If we cannot easily identify the plane of dissection along the edges, we may evert the cyst and make an incision at its base to create a wedge between the wall of the cyst and underlying stroma. The edge of the incised wall is then grasped and retracted to create a space between the wall and the underlying stroma, from which it is progressively stripped from the ovary.
Traction and counter-traction are the hallmarks of dissection here; sometimes, we use laparoscopic scissors to sharply resect the ovarian stromal attachments that adhere cohesively to the cyst wall. This technique is continued until the entire cyst wall is removed. When follicle-containing ovarian tissue remains attached to the cyst wall, we introduce the closed tips of the Dolphin forceps between the cyst wall and adjacent follicle-containing stroma, spread the tips apart, and recover the true plane of dissection between the thin wall of the cyst and stroma.
After the wall of the cyst is removed, the ovarian crater invariably bleeds because blood vessels supplying the wall have been separated and opened. Utilizing warm lactated Ringers’ solution, we copiously irrigate the bleeding ovarian stroma to identify each bleeding vessel and, by placing the tips of the micro-bipolar forceps on either side of the bleeder, individually coagulate each vessel, thus inflicting minimal thermal damage to the surrounding stroma.
Pearl. Avoid using Kleppinger forceps to indiscriminately coagulate the bloody stroma in the crater created after the cystectomy, because doing so can result in excessive destruction of ovarian tissue or inadvertent coagulation of hylar vessels that would interrupt the blood supply to the ovary, compromising its function.16
Suturing. Some surgeons find that fenestration, drainage, and coagulation of the cyst wall is acceptable, but we have concerns not only about incomplete ablation of the endometriosis on the cyst wall, which may be responsible for the higher recurrence rate of disease, but also about the risk of thermal injury to underlying follicles, which may compromise ovarian reserve.16
Hemostasis. Once complete hemostasis has been achieved, the decision to approximate (or not) the edges, preferably with fine absorbable suture, is based on how large the defect is and whether or not the edges of the crater spontaneously come together. For large craters, we usually close the ovary with a 3-0 or 4-0 Vicryl continuous suture, imbricating the edges to expose as little suture material as possible to reduce postoperative formation of adhesions, which is common after ovarian surgery.17
Last, we ensure that hemostasis is present. Often we apply an anti-adhesion solution, such as icodextrin 4% (Adept). This agent has been shown to reduce postoperative adhesion formation, especially after laparoscopic surgery for endometriosis.18
A high level of skill is needed
Ovarian endometriomas signal advanced disease; advanced surgical skills are required to treat them adequately. Simple drainage is of little therapeutic value and should seldom be considered a treatment option. Although drainage plus ablation of the cyst wall ameliorates symptoms, excision of endometriomas should be considered preferable because it provides a more favorable outcome, a lower risk of recurrence of endometriomas and symptoms, and a higher rate of spontaneous pregnancy in previously infertile women.7-9
To recap, we advise the surgeon to:
- Manage ovarian endometriomas with resection of the entire cyst wall, grasping and stripping the thinnest layer of the cyst wall without removing underlying functional ovarian stroma.
- Avoid excessive cauterization of the underlying ovarian stroma by utilizing micro-bipolar forceps and applying energy only around bleeding vessels.
- Close stromal defects, when the crater is large and its edges do not spontaneously come together, by approximating the edges with an imbricating resorbable suture.
CASE continued
As in most cases of advanced endometriosis, S. D. also had diffuse implants of deep and superficial endometriosis on the peritoneum of the pelvic sidewalls and on the anterior and posterior cul de sac.
Should you ablate or resect these lesions? Are there advantages to either approach?
Ablation of endometriosis implants may involve either electrocoagulation of the lesion with bipolar energy or laser vaporization/coagulation, which destroys or devitalizes active endometriosis but does not actually remove the lesion. Ablation destroys the lesion without getting a specimen for histologic diagnosis.
Resection of endometriosis implants involves complete removal of the lesion from its epithelial surface to the depth of its base. Resection can be performed with scissors, laser, or monopolar electrosurgery. Resection removes the lesion in its entirety, yielding a histologic diagnosis and allowing you to determine whether, indeed, the entire specimen has been removed.
The question of what is more effective—ablating or resecting endometriosis implants?—was addressed in a prospective study in which 141 patients with endometriosis-related pain were randomized at laparoscopic surgery to either excision or ablation/coagulation of endometriosis lesions.19 Six months postoperatively, the pain score decreased by, on average, 11.2 points in the excision group and 8.7 points in the coagulation/ablative group.
Because the difference in those average pain scores was not statistically significant, however, investigators concluded that the techniques are comparable, with similar efficacy. That interpretation has been criticized because the study was underpowered and included only patients who had mild endometriosis—leaving open the possibility that deep endometriosis may not be adequately treated by electrocoagulation or ablation.
In contrast to superficial endometriosis, which may respond similarly to ablation or resection, deep endometriosis is difficult to ablate either with electrosurgery or a laser because the energy cannot reach deeper layers and active disease is therefore likely to be left behind. Moreover, when endometriosis overlies vital structures, such as the ureter or bowel, ablation of the lesion may cause thermal damage to the underlying organ, and such damage may not manifest until several days later, when the patient experiences, say, urinary leakage in the peritoneum or symptoms of bowel perforation.
FIGURE 5 illustrates a case in which CO2 laser ablation of endometriosis that had been causing deep dyspareunia did not alleviate symptoms. Because those symptoms persisted, the patient was referred to our center, where a second laparoscopy revealed deep nodules of endometriosis, 1 to 2 cm in diameter, extending from the right and the left uterosacral ligaments deep into the perirectal space, bilaterally.
As the bottom panel of FIGURE 5 shows, excised nodules were deep and large; neither laser nor electrosurgery would have been able to ablate or devitalize the deep endometriosis at the base of these 2-cm nodules.
FIGURE 5 Deep nodules present a surgical challenge
These nodules of endometriosis on the right and left uterosacral ligaments (panel A) did not respond to CO2 laser ablation. Upon progressive resection, the implants were found to be deep, extending into the perirectal space (panel B). (See also VIDEO 3, resection of endometriosis from the left uterosacal ligament, close to the ureter.) FIGURE 6, illustrates endometriosis overlying the bladder and left ureter (see also VIDEO 4). Ablation of endometriosis in these areas may be inadequate if it is not deep enough, and dangerous if it goes too deep. As FIGURE 6 shows, excision assures the surgeon that the entire lesion has been removed and that underlying vital structures have been safeguarded.
FIGURE 6 Urinary tract involvement
Endometriosis overlying the bladder is grasped, retracted, and resected (panel A). Endometriosis compresses the left ureter (panel B). The peritoneum above the lesion is entered, the ureter is displaced laterally, and the lesion is safely resected.
What we do, and recommend
When endometriosis is superficial and does not overlie vital organs, such as the bladder, ureter, and bowel, ablation and resection may be equally safe and effective. When endometriosis is deep and overlying vital organs, however, complete resection—with careful dissection of the lesion off underlying structures—offers a more complete and a safer surgical approach.
CASE continued
Now that S. D. has been treated surgically by complete excision of endometriosis, adhesions, and endometriomas, you must consider a management plan that will reduce the risks 1) of recurrence of symptoms and disease and 2) that further surgery will be necessary in the future—a risk that, in her case, exceeds 50% because of her young age, nulliparity, and the severity of her disease.20,21 Indeed, you are aware that, had preventive measures been implemented after her initial surgery 2 years earlier, it is unlikely that S. D. would have developed the second endometrioma and most likely that she would not have needed the second surgery.
Prevention of recurrence is necessary—and doable
The importance of implementing preventive measures to reduce the risk of recurrence of endometriosis and its symptoms has been suggested by several studies. It was underscored recently in a prospective, randomized study conducted by Serracchioli and colleagues,22 in which 239 women who had undergone laparoscopic resection of endometriomas were randomly assigned to expectant management (control group), a cyclic oral contraceptive (OC), or a continuous oral contraceptives for 24 months, and evaluated every 6 months.
At the end of the study, recurrence of symptoms occurred in 30% of controls; 15% of subjects taking a cyclic OC; and 7.5% of the subjects taking a continuous OC. The recurrence rate of endometrioma in this study was reduced by 50% (cyclic OC) and 75% (continuous OC).22
Similar results were reported in a case-controlled study by Vercellini and co-workers,23 who found that the risk of recurrence of endometrioma was reduced by 60% when postoperative OCs were used long-term and by 30% when used for a duration of less than 12 months.
These studies suggest that, by suppressing ovulation and inducing a state of hypomenorrhea or amenorrhea, the risk of recurrence of endometriosis and its symptoms can be significantly reduced.
The importance of amenorrhea in reducing the postoperative recurrence of endometriosis and symptoms has been underscored by two important studies that evaluated the role of postoperative endometrial ablation or postoperative insertion of the levonorgestrel intrauterine system (LNG-IUS; Mirena), neither of which suppresses ovulation but both of which induce a state of hypomenorrhea or amenorrhea.24,25
In a prospective randomized study by Bulletti and co-workers,24 28 patients who had symptomatic endometriosis underwent laparoscopic conservative surgery. Endometrial ablation was performed in 14 of the 28. Two years later, all patients underwent second-look laparoscopy; recurrence of endometriosis was found in 9 of the 14 non-ablation patients but in none in the ablation group. Resolution or significant improvement of symptoms were reported in 13 of 14 women in the ablation group but only in 3 of 14 in the non-ablation group—supporting the premise that amenorrhea or hypomenorrhea by itself, without suppressing ovulation, significantly reduces the risk that endometriosis will recur.
Similar beneficial results from hypomenorrhea/amenorrhea on the risk of recurrence of symptoms have been reported when the LNG-IUS is inserted following conservative surgery for endometriosis. In a prospective study by Vercellini and colleagues,25 40 symptomatic patients who had stage-III or stage-IV disease were randomized to either insertion of the LNG-IUS or a control group after conservative laparoscopic surgery. Recurrence of pain was significantly (P = .012) reduced in the LNG-IUS group (45%), compared with the control group (10%). Control subjects were also much less satisfied with their treatment than those who were treated with the LNG-IUS.
The importance of inducing a state of amenorrhea to reduce the risk of disease recurrence was further underscored by a recent study. Shakiba and colleagues26 reported on the recurrence of endometriosis that required further surgery as long as 7 years after the subjects had been surgically treated for symptomatic endometriosis. The need for subsequent surgery was 8% after hysterectomy and bilateral salpingo-oophorectomy; 12% after hysterectomy alone; and 60% after conservative laparoscopy with preservation of both uterus and ovaries.
Taken together, these data show that, unless the patient is rendered amenorrheic or hypomenorrheic, her risk of recurrence exceeds 50%.
It is important, therefore, to consider conservative surgical management of endometriosis as only the beginning of a lifelong management plan. That plan begins with complete resection of all visible endometriosis and adhesions, resection of endometriomas, and restoration of normal anatomy as much as possible.
When endometriosis cannot be completely resected—as when it involves small bowel or the diaphragm, or is diffusely on the large bowel—we recommend medical suppressive therapy. Our preference is depot leuprolide acetate (Lupron Depot), always with add-back therapy to minimize side effects, which include vasomotor symptoms, vaginal dryness, and bone loss,27 until the patient is significantly asymptomatic, which may take 6 to 9 months.
CASE Concluded, with long-term intervention
You counsel S. D. to remain on a low-dose hormonal OC continuously, until such time that she wants to conceive. If a patient does not want to conceive for at least 5 years, the LNG-IUS may be inserted at surgery to induce hypomenorrhea and reduce the risk of recurrence for the next 5 years.
When hormonal contraceptives are inadequate to control symptoms, adding the aromatase enzyme inhibitor letrozole (Femara), 2.5 mg daily for 6 to 9 months, usually alleviates symptoms with minimal side effects, as long as the patient keeps taking a hormonal contraceptive. Using letrozole without hormonal contraception has not been studied; doing so may lead to formation of ovarian cysts, and is therefore not recommended for managing symptomatic endometriosis.
If the patient wants to become pregnant, encourage her to actively undertake fertility treatment as soon as possible after surgery, thereby minimizing the risk of recurrence of symptoms and disease. The best option may be to employ assisted reproductive technology, but patients cannot always afford it; when that is the case, consider controlled ovarian stimulation and intrauterine insemination.
We want to hear from you! Tell us what you think.
- Resection of an endometrioma in severe disease, using a “stripping” technique
- Ovarian cystectomy
- Resection of endometriosis from the left ligament
- Resection of endometriosis on the bladder
These videos were provided by Anthony Luciano, MD.
Endometriosis affects 7% to 10% of women in the United States, mostly during reproductive years.1 The estimated annual cost for managing the approximately 10 million affected women? More than $17 billion.2 The added cost of this chronic disease, with recurrences of pain and infertility, comes in the form of serious life disruption, emotional suffering, marital and social dysfunction, and diminished productivity.
Although the prevalence of endometriosis is highest during the third and fourth decades of life, the disease is also common in adolescent girls. Indeed, 45% of adolescents who have chronic pelvic pain are found to have endometriosis; if their pain does not respond to an oral contraceptive (OC) or a non-steroidal anti-inflammatory drug, 70% are subsequently found at laparoscopy to have endometriosis.3
What is it?
Endometriosis is the presence of functional endometrial tissue outside the uterus, such as eutopic endometrium. The disease responds to effects of cyclic ovarian hormones, proliferating and bleeding with each menstrual cycle, which often leads to diffuse inflammation, adhesions, and growth of endometriotic nodules or cysts (FIGURE 1).
FIGURE 1 Drainage will not suffice
Surgical management of ovarian endometriomas must go beyond simple drainage, which has little therapeutic value because symptoms recur and endometriomas re-form quickly after simple drainage in almost all patients.Symptoms tend to reflect affected organs:
- Because the pelvic organs are most often involved, the classic symptom triad of the disease comprises dysmenorrhea, dyspareunia, and infertility.
- Urinary urgency, dysuria, dyschezia, and tenesmus are frequent complaints when the bladder or rectosigmoid is involved.
- When distant organs are affected, such as the upper abdomen, diaphragm, lungs, and bowel, the patient may complain of respiratory symptoms, hemoptysis, pneumothorax, shoulder pain, upper abdominal pain, and episodic gastrointestinal dysfunction.
The hallmark of endometriosis is catamenial symptoms, which are usually cyclic and most severe around the time of menses. Clinical signs include palpable tender nodules and fibrosis on the anterior and posterior cul de sac, fixed retroverted or anteverted uterus, and adnexal cystic masses.
Because none of these symptoms or signs is specific for endometriosis, diagnosis relies on laparoscopy, which allows the surgeon to:
- visualize it in its various appearances and locations (FIGURE 2)
- confirm the diagnosis histologically with directed excisional biopsy
- treat it surgically with either excision or ablation.
In this article, we describe various surgical techniques for the management of endometriosis. Beyond resection or ablation of lesions, however, your care should also be directed to postoperative measures to prevent its recurrence and to avoid repeated surgical interventions—which, regrettably, are much too common in women who are afflicted by this enigmatic disease.
FIGURE 2 Endometriosis: A disease of varying appearance
Lesions of endometriosis can be pink, dark, clear, or white on the pelvic sidewall (A), bowel (B), and diaphragm (C); under the rib cage (D); and on the ureter (E) (left ureter shown here).
CASE Severe disease in a young woman
S. D. is a 22-year-old unmarried nulligravida who came to the emergency service complaining of acute onset of severe low abdominal pain, which developed while she was running. She was afebrile and in obvious distress, with diffuse lower abdominal tenderness and guarding, especially on the left side.
Ultrasonography revealed a 7-cm adnexal cystic mass suggestive of endometrioma (FIGURE 3).
Two years before this episode, S. D. underwent laparoscopic resection of a 5-cm endometrioma on the right ovary. Subsequently, she was treated with a cyclic OC, which she discontinued after 1 year because she was not sexually active.
The family history is positive for endometriosis in her mother, who had undergone multiple laparoscopic investigations and, eventually, total hysterectomy with bilateral salpingo-oophorectomy at 40 years of age.
S. D. was treated on the emergency service with analgesics and referred to you for surgical management.
S. D. has severe disease that requires aggressive surgical resection and a lifelong management plan. That plan includes liberal use of medical therapy to prevent recurrence of symptoms and avoid repeated surgical procedures—including the total hysterectomy with bilateral salpingo-oophorectomy that her mother underwent.
What is the best immediate treatment plan? Should you:
- drain the cyst?
- drain it and coagulate or ablate its wall?
- resect the wall of the cyst?
- perform salpingo-oophorectomy?
You also ask yourself: What is the risk of recurrence of endometrioma and its symptoms after each of those treatments? And how can I reduce those risks?
FIGURE 3 Endometrioma
Endometrioma on ultrasonography (A), with its characteristic homogeneous, echogenic appearance and “ground glass” pattern, and through the laparoscope (B). These images are from the patient whose case is described in the text.
Focal point: Ovary
The ovary is the most common organ affected by endometriosis. The presence of ovarian endometriomas, in 17% to 44% of patients who have this disease,4 is often associated with an advanced stage of disease.
In a population of 1,785 patients who were surgically treated for ovarian endometriosis, Redwine reported that only 1% had exclusively ovarian involvement; 99% also had diffuse pelvic disease,5 suggesting that ovarian endometrioma is a marker of extensive disease, which often requires a gynecologic surgeon who has advanced skills and experience in the surgical management of severe endometriosis.
Simple drainage is inadequate
Surgical management of ovarian endometrioma must go beyond simple drainage, which has little therapeutic value because symptoms recur and endometriomas re-form quickly after simple drainage in almost all patients.6 The currently accepted surgical management of endometrioma involves either 1) coagulation and ablation of the wall of the cyst with electrosurgery or laser or 2) removal of the cyst wall from the ovary with blunt and sharp dissection.
Several studies have compared these two techniques, but only two7,8 were prospectively randomized.
Study #1. Beretta and co-workers7 studied 64 patients who had ovarian endometriomas larger than 3 cm and randomized them to cystectomy by complete stripping of the cyst wall or to drainage of fluid followed by electrocoagulation to ablate the endometriosis lesions within the cyst wall. The two groups were followed for 2 years to assess the recurrence of symptoms and the pregnancy rate in the patients who were infertile.
Recurrence of symptoms and the need for medical or surgical intervention occurred with less frequency and much later in the resection group than in the ablation group: 19 months, compared to 9.5 months, postoperatively. The cumulative pregnancy rate 24 months postoperatively was also much higher in the resection group (66.7%) than in the ablative group (23.5%).
Study #2. In a later study,8 Alborzi and colleagues randomized 100 patients who had endometrioma to cystectomy or to drainage and coagulation of the cyst wall. The mean recurrence rate, 2 years postoperatively, was much lower in the excision group (15.8%) than in the ablative group (56.7%). The cumulative pregnancy rate at 12 months was higher in the excision group (54.9%, compared to 23.3%). Furthermore, the reoperation rate at 24 months was much lower in the excision group (5.8%) than in the ablative group (22.9%).
These favorable results for cystectomy over ablation were validated by a Cochrane Review, which concluded that excision of endometriomas is the preferred approach because it provides 1) a more favorable outcome than drainage and ablation, 2) lower rates of recurrence of endometriomas and symptoms, and 3) a much higher spontaneous pregnancy rate in infertile women.9
Although resection of the cyst wall is technically more challenging and takes longer to perform than drainage and ablation, we exclusively perform resection rather than ablation of endometriomas because we believe that more lasting therapeutic effects and reduced recurrence of symptoms and disease justify the extra effort and a longer procedure.
Drawback of cystectomy
A potential risk of cystectomy is that it can diminish ovarian reserve and, in rare cases, induce premature menopause, which can be devastating for women whose main purpose for having surgery is to restore or improve their fertility.
The impact of laparoscopic ovarian cystectomy on ovarian reserve was prospectively studied by Chang and co-workers,10 who measured preoperative and postoperative levels of anti-müllerian hormone (AMH) in 13 women who had endometrioma, 6 who had mature teratoma, and 1 who had mucinous cystadenoma. One week postoperatively, the AMH level decreased significantly overall in all groups. At 4 and 12 weeks postoperatively, however, the AMH level returned to preoperative levels among subjects in the non-endometrioma group but not among subjects who had endometrioma; rather, their level remained statistically lower than the preoperative level during the entire 3 months of follow-up.
Stripping the wall of an endometrioma cyst is more difficult than it is for other benign cysts, such as cystic teratoma or cystadenoma, in which there usually is a well-defined dissection plane between the wall of the cyst and surrounding stromal tissue—allowing for easy and clean separation of the wall. The cyst wall of an endometrioma, on the other hand, is intimately attached to underlying ovarian stroma; lack of a clear cleavage plane between cyst and ovarian stroma often results in unintentional removal of layers of ovarian cortex with underlying follicles, which, in turn, may lead to a reduction in ovarian reserve.
Histologic analyses of resected endometrioma cyst walls have reported follicle-containing ovarian tissue attached to the stripped cyst wall in 54% of cases.11,12 That observation explains why, and how, ovarian reserve can be compromised after resection of endometrioma.
Further risk: Ovarian failure
In rare cases, excision of endometriomas results in complete ovarian failure, described by Busacca and colleagues, who reported three cases of ovarian failure (2.4%) after resection of bilateral endometriomas in 126 patients.13 They attributed ovarian failure to excessive cauterization that compromised vascularization, as well as to excessive removal of ovarian tissue.
It is important, therefore, to strip the thinnest layer of the cyst capsule and to reduce the amount of electrocoagulation of ovarian stroma as much as possible to safeguard functional ovarian tissue.
CASE continued
S. D. was scheduled for laparoscopy to remove the endometrioma and other concurrent pelvic and peritoneal pathology, such as endometriosis and pelvic adhesions. You also scheduled her for hysteroscopy to evaluate the endometrial cavity for potential pathology, such as endometrial polyps and uterine septum, which appear to be more common in women who have endometriosis.
Nawroth and co-workers14 found a much higher incidence of endometriosis in patients who had a septate uterus. Metalliotakis and co-workers15 found congenital uterine malformations to be more common in patients who had endometriosis, compared with controls; uterine septum was, by far, the most common anomaly.
CASE continued
Hysteroscopy revealed a small and broad septum, which was resected sharply with hysteroscopic scissors (FIGURE 4). Laparoscopy revealed a 7-cm endometrioma on the left ovary, with adhesions to the posterior broad ligament and pelvic sidewall. S. D. also had deep implants of endometriosis on the left pelvic sidewall, the posterior cul de sac, the right pelvic sidewall, and the right ovary, which was cohesively adherent to the ovarian fossa.
As you expected, S. D. has stage-IV disease, according to the revised American Fertility Society Classification.
Following adhesiolysis, the endometrioma was resected (see VIDEO 1). Because of the large ovarian defect, the edges of the ovary were approximated with imbricating running 3-0 Vicryl suture. Deep endometriosis was also resected. Superficial endometriosis was peeled off or coagulated using bipolar forceps.
Note: Alternatively, and with comparable results, resection may be performed with a laser or other energy source. We prefer resection, rather than ablation, of deep endometriosis, but no data exists to support one technique over the other.
FIGURE 4 Septate uterus with deep cornua
Through the hysteroscope, a shallow septum is visible at the fundus of the uterus, dividing the upper endometrial cavity into two chambers (A), with deep cornua on the left (B) and right (C). Normal fundal anatomy is restored by septolysis along the avascular plane (D).
Technique: How we resect endometrioma
In removing endometrioma (see VIDEO 2), it is important to grasp the thinnest part of the cyst wall and progressively strip it, to avoid removing excess ovarian tissue and to reduce the risk of compromising ovarian reserve.
After draining the endometrioma of its chocolate-colored fluid, we irrigate and drain the cyst several times with warm lactated Ringers’ solution to promote separation of the cyst wall from underlying stroma and better identify the dissection plane. The cyst wall is inspected by introducing the laparoscope into the cyst to examine its surface, which is often laden with implants of deep and superficial endometriosis.
If we cannot easily identify the plane of dissection along the edges, we may evert the cyst and make an incision at its base to create a wedge between the wall of the cyst and underlying stroma. The edge of the incised wall is then grasped and retracted to create a space between the wall and the underlying stroma, from which it is progressively stripped from the ovary.
Traction and counter-traction are the hallmarks of dissection here; sometimes, we use laparoscopic scissors to sharply resect the ovarian stromal attachments that adhere cohesively to the cyst wall. This technique is continued until the entire cyst wall is removed. When follicle-containing ovarian tissue remains attached to the cyst wall, we introduce the closed tips of the Dolphin forceps between the cyst wall and adjacent follicle-containing stroma, spread the tips apart, and recover the true plane of dissection between the thin wall of the cyst and stroma.
After the wall of the cyst is removed, the ovarian crater invariably bleeds because blood vessels supplying the wall have been separated and opened. Utilizing warm lactated Ringers’ solution, we copiously irrigate the bleeding ovarian stroma to identify each bleeding vessel and, by placing the tips of the micro-bipolar forceps on either side of the bleeder, individually coagulate each vessel, thus inflicting minimal thermal damage to the surrounding stroma.
Pearl. Avoid using Kleppinger forceps to indiscriminately coagulate the bloody stroma in the crater created after the cystectomy, because doing so can result in excessive destruction of ovarian tissue or inadvertent coagulation of hylar vessels that would interrupt the blood supply to the ovary, compromising its function.16
Suturing. Some surgeons find that fenestration, drainage, and coagulation of the cyst wall is acceptable, but we have concerns not only about incomplete ablation of the endometriosis on the cyst wall, which may be responsible for the higher recurrence rate of disease, but also about the risk of thermal injury to underlying follicles, which may compromise ovarian reserve.16
Hemostasis. Once complete hemostasis has been achieved, the decision to approximate (or not) the edges, preferably with fine absorbable suture, is based on how large the defect is and whether or not the edges of the crater spontaneously come together. For large craters, we usually close the ovary with a 3-0 or 4-0 Vicryl continuous suture, imbricating the edges to expose as little suture material as possible to reduce postoperative formation of adhesions, which is common after ovarian surgery.17
Last, we ensure that hemostasis is present. Often we apply an anti-adhesion solution, such as icodextrin 4% (Adept). This agent has been shown to reduce postoperative adhesion formation, especially after laparoscopic surgery for endometriosis.18
A high level of skill is needed
Ovarian endometriomas signal advanced disease; advanced surgical skills are required to treat them adequately. Simple drainage is of little therapeutic value and should seldom be considered a treatment option. Although drainage plus ablation of the cyst wall ameliorates symptoms, excision of endometriomas should be considered preferable because it provides a more favorable outcome, a lower risk of recurrence of endometriomas and symptoms, and a higher rate of spontaneous pregnancy in previously infertile women.7-9
To recap, we advise the surgeon to:
- Manage ovarian endometriomas with resection of the entire cyst wall, grasping and stripping the thinnest layer of the cyst wall without removing underlying functional ovarian stroma.
- Avoid excessive cauterization of the underlying ovarian stroma by utilizing micro-bipolar forceps and applying energy only around bleeding vessels.
- Close stromal defects, when the crater is large and its edges do not spontaneously come together, by approximating the edges with an imbricating resorbable suture.
CASE continued
As in most cases of advanced endometriosis, S. D. also had diffuse implants of deep and superficial endometriosis on the peritoneum of the pelvic sidewalls and on the anterior and posterior cul de sac.
Should you ablate or resect these lesions? Are there advantages to either approach?
Ablation of endometriosis implants may involve either electrocoagulation of the lesion with bipolar energy or laser vaporization/coagulation, which destroys or devitalizes active endometriosis but does not actually remove the lesion. Ablation destroys the lesion without getting a specimen for histologic diagnosis.
Resection of endometriosis implants involves complete removal of the lesion from its epithelial surface to the depth of its base. Resection can be performed with scissors, laser, or monopolar electrosurgery. Resection removes the lesion in its entirety, yielding a histologic diagnosis and allowing you to determine whether, indeed, the entire specimen has been removed.
The question of what is more effective—ablating or resecting endometriosis implants?—was addressed in a prospective study in which 141 patients with endometriosis-related pain were randomized at laparoscopic surgery to either excision or ablation/coagulation of endometriosis lesions.19 Six months postoperatively, the pain score decreased by, on average, 11.2 points in the excision group and 8.7 points in the coagulation/ablative group.
Because the difference in those average pain scores was not statistically significant, however, investigators concluded that the techniques are comparable, with similar efficacy. That interpretation has been criticized because the study was underpowered and included only patients who had mild endometriosis—leaving open the possibility that deep endometriosis may not be adequately treated by electrocoagulation or ablation.
In contrast to superficial endometriosis, which may respond similarly to ablation or resection, deep endometriosis is difficult to ablate either with electrosurgery or a laser because the energy cannot reach deeper layers and active disease is therefore likely to be left behind. Moreover, when endometriosis overlies vital structures, such as the ureter or bowel, ablation of the lesion may cause thermal damage to the underlying organ, and such damage may not manifest until several days later, when the patient experiences, say, urinary leakage in the peritoneum or symptoms of bowel perforation.
FIGURE 5 illustrates a case in which CO2 laser ablation of endometriosis that had been causing deep dyspareunia did not alleviate symptoms. Because those symptoms persisted, the patient was referred to our center, where a second laparoscopy revealed deep nodules of endometriosis, 1 to 2 cm in diameter, extending from the right and the left uterosacral ligaments deep into the perirectal space, bilaterally.
As the bottom panel of FIGURE 5 shows, excised nodules were deep and large; neither laser nor electrosurgery would have been able to ablate or devitalize the deep endometriosis at the base of these 2-cm nodules.
FIGURE 5 Deep nodules present a surgical challenge
These nodules of endometriosis on the right and left uterosacral ligaments (panel A) did not respond to CO2 laser ablation. Upon progressive resection, the implants were found to be deep, extending into the perirectal space (panel B). (See also VIDEO 3, resection of endometriosis from the left uterosacal ligament, close to the ureter.) FIGURE 6, illustrates endometriosis overlying the bladder and left ureter (see also VIDEO 4). Ablation of endometriosis in these areas may be inadequate if it is not deep enough, and dangerous if it goes too deep. As FIGURE 6 shows, excision assures the surgeon that the entire lesion has been removed and that underlying vital structures have been safeguarded.
FIGURE 6 Urinary tract involvement
Endometriosis overlying the bladder is grasped, retracted, and resected (panel A). Endometriosis compresses the left ureter (panel B). The peritoneum above the lesion is entered, the ureter is displaced laterally, and the lesion is safely resected.
What we do, and recommend
When endometriosis is superficial and does not overlie vital organs, such as the bladder, ureter, and bowel, ablation and resection may be equally safe and effective. When endometriosis is deep and overlying vital organs, however, complete resection—with careful dissection of the lesion off underlying structures—offers a more complete and a safer surgical approach.
CASE continued
Now that S. D. has been treated surgically by complete excision of endometriosis, adhesions, and endometriomas, you must consider a management plan that will reduce the risks 1) of recurrence of symptoms and disease and 2) that further surgery will be necessary in the future—a risk that, in her case, exceeds 50% because of her young age, nulliparity, and the severity of her disease.20,21 Indeed, you are aware that, had preventive measures been implemented after her initial surgery 2 years earlier, it is unlikely that S. D. would have developed the second endometrioma and most likely that she would not have needed the second surgery.
Prevention of recurrence is necessary—and doable
The importance of implementing preventive measures to reduce the risk of recurrence of endometriosis and its symptoms has been suggested by several studies. It was underscored recently in a prospective, randomized study conducted by Serracchioli and colleagues,22 in which 239 women who had undergone laparoscopic resection of endometriomas were randomly assigned to expectant management (control group), a cyclic oral contraceptive (OC), or a continuous oral contraceptives for 24 months, and evaluated every 6 months.
At the end of the study, recurrence of symptoms occurred in 30% of controls; 15% of subjects taking a cyclic OC; and 7.5% of the subjects taking a continuous OC. The recurrence rate of endometrioma in this study was reduced by 50% (cyclic OC) and 75% (continuous OC).22
Similar results were reported in a case-controlled study by Vercellini and co-workers,23 who found that the risk of recurrence of endometrioma was reduced by 60% when postoperative OCs were used long-term and by 30% when used for a duration of less than 12 months.
These studies suggest that, by suppressing ovulation and inducing a state of hypomenorrhea or amenorrhea, the risk of recurrence of endometriosis and its symptoms can be significantly reduced.
The importance of amenorrhea in reducing the postoperative recurrence of endometriosis and symptoms has been underscored by two important studies that evaluated the role of postoperative endometrial ablation or postoperative insertion of the levonorgestrel intrauterine system (LNG-IUS; Mirena), neither of which suppresses ovulation but both of which induce a state of hypomenorrhea or amenorrhea.24,25
In a prospective randomized study by Bulletti and co-workers,24 28 patients who had symptomatic endometriosis underwent laparoscopic conservative surgery. Endometrial ablation was performed in 14 of the 28. Two years later, all patients underwent second-look laparoscopy; recurrence of endometriosis was found in 9 of the 14 non-ablation patients but in none in the ablation group. Resolution or significant improvement of symptoms were reported in 13 of 14 women in the ablation group but only in 3 of 14 in the non-ablation group—supporting the premise that amenorrhea or hypomenorrhea by itself, without suppressing ovulation, significantly reduces the risk that endometriosis will recur.
Similar beneficial results from hypomenorrhea/amenorrhea on the risk of recurrence of symptoms have been reported when the LNG-IUS is inserted following conservative surgery for endometriosis. In a prospective study by Vercellini and colleagues,25 40 symptomatic patients who had stage-III or stage-IV disease were randomized to either insertion of the LNG-IUS or a control group after conservative laparoscopic surgery. Recurrence of pain was significantly (P = .012) reduced in the LNG-IUS group (45%), compared with the control group (10%). Control subjects were also much less satisfied with their treatment than those who were treated with the LNG-IUS.
The importance of inducing a state of amenorrhea to reduce the risk of disease recurrence was further underscored by a recent study. Shakiba and colleagues26 reported on the recurrence of endometriosis that required further surgery as long as 7 years after the subjects had been surgically treated for symptomatic endometriosis. The need for subsequent surgery was 8% after hysterectomy and bilateral salpingo-oophorectomy; 12% after hysterectomy alone; and 60% after conservative laparoscopy with preservation of both uterus and ovaries.
Taken together, these data show that, unless the patient is rendered amenorrheic or hypomenorrheic, her risk of recurrence exceeds 50%.
It is important, therefore, to consider conservative surgical management of endometriosis as only the beginning of a lifelong management plan. That plan begins with complete resection of all visible endometriosis and adhesions, resection of endometriomas, and restoration of normal anatomy as much as possible.
When endometriosis cannot be completely resected—as when it involves small bowel or the diaphragm, or is diffusely on the large bowel—we recommend medical suppressive therapy. Our preference is depot leuprolide acetate (Lupron Depot), always with add-back therapy to minimize side effects, which include vasomotor symptoms, vaginal dryness, and bone loss,27 until the patient is significantly asymptomatic, which may take 6 to 9 months.
CASE Concluded, with long-term intervention
You counsel S. D. to remain on a low-dose hormonal OC continuously, until such time that she wants to conceive. If a patient does not want to conceive for at least 5 years, the LNG-IUS may be inserted at surgery to induce hypomenorrhea and reduce the risk of recurrence for the next 5 years.
When hormonal contraceptives are inadequate to control symptoms, adding the aromatase enzyme inhibitor letrozole (Femara), 2.5 mg daily for 6 to 9 months, usually alleviates symptoms with minimal side effects, as long as the patient keeps taking a hormonal contraceptive. Using letrozole without hormonal contraception has not been studied; doing so may lead to formation of ovarian cysts, and is therefore not recommended for managing symptomatic endometriosis.
If the patient wants to become pregnant, encourage her to actively undertake fertility treatment as soon as possible after surgery, thereby minimizing the risk of recurrence of symptoms and disease. The best option may be to employ assisted reproductive technology, but patients cannot always afford it; when that is the case, consider controlled ovarian stimulation and intrauterine insemination.
We want to hear from you! Tell us what you think.
1. Bulun S E. Endometriosis. N Engl J Med. 2009;360(3):268-279.
2. Gao X, Outley J, Botteman M, Spalding J, Simon JA, Pashos CL. Economic burden of endometriosis. Fertil Steril. 2006;86(6):1561-1572.
3. Laufer MR, Goitein L, Bush M, Cramer DW, Emans SJ. Prevalence of endometriosis in adolescent girls with chronic pelvic pain not responding conventional therapy. J Pediatr Adolesc Gynecol. 1997;10(4):199-202.
4. Gruppo Italiano per lo studio dell’endometriosi. Prevalence and anatomic distribution of endometriosis in women with selected gynaecological conditions: results from a multicenter Italian study. Hum Reprod. 1994;9(6):1158-1162.
5. Redwine DB. Ovarian endometriosis: a marker for more extensive pelvic and intestinal disease. Fertil Steril. 1999;72(2):319-315.
6. Muzii L, Marana R, Caruana P, Catalano GF, Mancuso S. Laparoscopic findings after transvaginal ultrasound-guided aspiration of ovarian endometriomas. Hum Reprod. 1995;10(11):2902-2903
7. Beretta P, Franchi M, Ghezzi F, Busacca M, Zupi E, Bolis P. Randomized clinical trial of two laparoscopic treatment of endometriomas: cystectomy versus drainage and coagulation. Fertil Steril. 1998;70(6):1176-1180
8. Alborzi S, Momtahan M, Paranezhad ME, Dehbashi S, Zolghadri J, Alborzi S. A prospective randomized study comparing laparoscopic ovarian cystectomy versus fenestration and coagulation in patients with endometriomas. Fertil Steril. 2004;82(6):1633-1637
9. Hart RJ, Hickey M, Maouris P, Buckett W, Garry R. Excisional surgery versus ablative surgery for ovarian endometriomas. Cochrane Database Syst Rev. 2005;(3):CD004992.-
10. Chang HJ, Sang HH, Jung RL, et al. Impact of laparoscopic cystectomy on ovarian reserve: serial changes of serum anti-Müllerian hormone levels. Fertil Steril. 2010;94(1):343-349.
11. Muzii L. Bianchi A Crocè C, Manci N, Panici PB. Laparoscopic excision of ovarian cysts: is the stripping technique a tissue sparing procedure? Fertil Steril. 2002;77(3):609-614.
12. Hachisuga T, Kawarabyashi T. Histopathological analysis of laparoscopically treated ovarian endometriotic cysts with special reference to loss of follicles. Hum Reprod. 2002;17(2):432-435.
13. Busacca M, Riparini J Somigliana E, et al. Postsurgical ovarian failure after laparoscopic excision of bilateral endometriomas. Am J Obstet Gynecol. 2006;195(2):421-425.
14. Nawroth F, Rahimi G, Nawroth C, Foth D, Ludwig M, Schmidt T. Is there an association between septate uterus and endometriosis? Hum Reprod. 2006;21(2):542-546.
15. Matalliotakis IM, Goumenou AG, Matalliotakis M, Arici A. Uterine anomalies in women with endometriosis. J Endometriosis. 2010;2(4):213-217.
16. Li CZ, Liu B, Wen ZQ, Sun Q. The impact of electrocoagulation on ovarian reserve after laparoscopic excision of ovarian cyst: a prospective clinical study of 191 patients. Fertil Steril. 2009;92(4):1428-1435.
17. Luciano DE, Roy G, Luciano AA. Adhesion reformation after laparoscopic adhesiolysis: where what type, and in whom are they most likely to recur. J Minim Invasive Gynecol. 2008;15(1):44-48.
18. Colin CB, Luciano AA, Martin D, et al. Adept (icodextrin 4% solution) reduces adhesions after laparoscopic surgery for adhesiolysis: a double-blind, randomized, controlled study. Fertil Steril. 2007;88(5):1413-1426.
19. Wright J, Lotfallah H, Jones K, Lovell D. A randomized study of excision vs ablation for mild endometriosis. Fertil Steril. 2004;83(6):1830-1836.
20. Cheong Y, Tay P, Luk F, Gan HC, Li TC, Cooke I. Laparoscopic surgery for endometriosis: How often do we need to re-operate? J Obstet Gynaecol. 2008;28(1):82-85.
21. Liu X, Yuan L, Shen F, Zhu Z, Jiang H, Guo SW. Patterns of and risk factors for recurrence in women with ovarian endometriomas. Obstet Gynecol. 2007;109(6):1411-1120.
22. Seracchioli R, Mabrouk M, Frasca C, et al. Long-term cyclic and continuous oral contraceptive therapy and endometriomas recurrence: a randomized controlled trial. Fertil Steril. 2010;93(1):52-56.
23. Vercellini P, Somigliana E, Daguati R, Vigano P, Meroni F, Crosignani PG. Postoperative oral contraceptive exposure and risk of endometrioma recurrence. Am J Obstet Gynecol. 2008;198(5):504.e1-5.
24. Bulletti C, DeZiegler D, Stefanetti M, Cicinelli E, Pelosi E, Flamigni C. Endometriosis: absence of recurrence in patients after endometrial ablation. Hum Reprod. 2001;16(12):2676-2679.
25. Vercellini P, Frontino G, De Giorgi O, Aimi G, Zaina B, Crosignani PG. Comparison of levonorgestrel-releasing intrauterine device versus expectant management after conservative surgery for symptomatic endometriosis: a pilot study. Fertil Steril. 2003;80(2):305-309.
26. Shakiba K, Bena JF, McGill KM, Minger J, Falcone T. Surgical treatment of endometriosis: a 7-year follow-up on the requirement for further surgery. Obstet Gynecol. 2008;111(6):1285-1292.
27. Surrey ES, Hornstein MD. Prolonged GnRH agonist and add-back therapy for symptomatic endometriosis: a long-term follow-up Obstet Gynecol. 2002;99(5 Pt 1):709-719.
1. Bulun S E. Endometriosis. N Engl J Med. 2009;360(3):268-279.
2. Gao X, Outley J, Botteman M, Spalding J, Simon JA, Pashos CL. Economic burden of endometriosis. Fertil Steril. 2006;86(6):1561-1572.
3. Laufer MR, Goitein L, Bush M, Cramer DW, Emans SJ. Prevalence of endometriosis in adolescent girls with chronic pelvic pain not responding conventional therapy. J Pediatr Adolesc Gynecol. 1997;10(4):199-202.
4. Gruppo Italiano per lo studio dell’endometriosi. Prevalence and anatomic distribution of endometriosis in women with selected gynaecological conditions: results from a multicenter Italian study. Hum Reprod. 1994;9(6):1158-1162.
5. Redwine DB. Ovarian endometriosis: a marker for more extensive pelvic and intestinal disease. Fertil Steril. 1999;72(2):319-315.
6. Muzii L, Marana R, Caruana P, Catalano GF, Mancuso S. Laparoscopic findings after transvaginal ultrasound-guided aspiration of ovarian endometriomas. Hum Reprod. 1995;10(11):2902-2903
7. Beretta P, Franchi M, Ghezzi F, Busacca M, Zupi E, Bolis P. Randomized clinical trial of two laparoscopic treatment of endometriomas: cystectomy versus drainage and coagulation. Fertil Steril. 1998;70(6):1176-1180
8. Alborzi S, Momtahan M, Paranezhad ME, Dehbashi S, Zolghadri J, Alborzi S. A prospective randomized study comparing laparoscopic ovarian cystectomy versus fenestration and coagulation in patients with endometriomas. Fertil Steril. 2004;82(6):1633-1637
9. Hart RJ, Hickey M, Maouris P, Buckett W, Garry R. Excisional surgery versus ablative surgery for ovarian endometriomas. Cochrane Database Syst Rev. 2005;(3):CD004992.-
10. Chang HJ, Sang HH, Jung RL, et al. Impact of laparoscopic cystectomy on ovarian reserve: serial changes of serum anti-Müllerian hormone levels. Fertil Steril. 2010;94(1):343-349.
11. Muzii L. Bianchi A Crocè C, Manci N, Panici PB. Laparoscopic excision of ovarian cysts: is the stripping technique a tissue sparing procedure? Fertil Steril. 2002;77(3):609-614.
12. Hachisuga T, Kawarabyashi T. Histopathological analysis of laparoscopically treated ovarian endometriotic cysts with special reference to loss of follicles. Hum Reprod. 2002;17(2):432-435.
13. Busacca M, Riparini J Somigliana E, et al. Postsurgical ovarian failure after laparoscopic excision of bilateral endometriomas. Am J Obstet Gynecol. 2006;195(2):421-425.
14. Nawroth F, Rahimi G, Nawroth C, Foth D, Ludwig M, Schmidt T. Is there an association between septate uterus and endometriosis? Hum Reprod. 2006;21(2):542-546.
15. Matalliotakis IM, Goumenou AG, Matalliotakis M, Arici A. Uterine anomalies in women with endometriosis. J Endometriosis. 2010;2(4):213-217.
16. Li CZ, Liu B, Wen ZQ, Sun Q. The impact of electrocoagulation on ovarian reserve after laparoscopic excision of ovarian cyst: a prospective clinical study of 191 patients. Fertil Steril. 2009;92(4):1428-1435.
17. Luciano DE, Roy G, Luciano AA. Adhesion reformation after laparoscopic adhesiolysis: where what type, and in whom are they most likely to recur. J Minim Invasive Gynecol. 2008;15(1):44-48.
18. Colin CB, Luciano AA, Martin D, et al. Adept (icodextrin 4% solution) reduces adhesions after laparoscopic surgery for adhesiolysis: a double-blind, randomized, controlled study. Fertil Steril. 2007;88(5):1413-1426.
19. Wright J, Lotfallah H, Jones K, Lovell D. A randomized study of excision vs ablation for mild endometriosis. Fertil Steril. 2004;83(6):1830-1836.
20. Cheong Y, Tay P, Luk F, Gan HC, Li TC, Cooke I. Laparoscopic surgery for endometriosis: How often do we need to re-operate? J Obstet Gynaecol. 2008;28(1):82-85.
21. Liu X, Yuan L, Shen F, Zhu Z, Jiang H, Guo SW. Patterns of and risk factors for recurrence in women with ovarian endometriomas. Obstet Gynecol. 2007;109(6):1411-1120.
22. Seracchioli R, Mabrouk M, Frasca C, et al. Long-term cyclic and continuous oral contraceptive therapy and endometriomas recurrence: a randomized controlled trial. Fertil Steril. 2010;93(1):52-56.
23. Vercellini P, Somigliana E, Daguati R, Vigano P, Meroni F, Crosignani PG. Postoperative oral contraceptive exposure and risk of endometrioma recurrence. Am J Obstet Gynecol. 2008;198(5):504.e1-5.
24. Bulletti C, DeZiegler D, Stefanetti M, Cicinelli E, Pelosi E, Flamigni C. Endometriosis: absence of recurrence in patients after endometrial ablation. Hum Reprod. 2001;16(12):2676-2679.
25. Vercellini P, Frontino G, De Giorgi O, Aimi G, Zaina B, Crosignani PG. Comparison of levonorgestrel-releasing intrauterine device versus expectant management after conservative surgery for symptomatic endometriosis: a pilot study. Fertil Steril. 2003;80(2):305-309.
26. Shakiba K, Bena JF, McGill KM, Minger J, Falcone T. Surgical treatment of endometriosis: a 7-year follow-up on the requirement for further surgery. Obstet Gynecol. 2008;111(6):1285-1292.
27. Surrey ES, Hornstein MD. Prolonged GnRH agonist and add-back therapy for symptomatic endometriosis: a long-term follow-up Obstet Gynecol. 2002;99(5 Pt 1):709-719.
Identifying cognitive impairment during the Annual Wellness Visit: Who can you trust?
Purpose Assessing for cognitive impairment is now mandated as part of the Medicare Annual Wellness Visit. This offers an unparalleled opportunity for early detection and treatment of dementia. However, physician observation supplemented by reports of patients and informants may be less effective than an objective screening test to achieve this goal.
Methods We used visual analog cognition scales (VACS) to quantify patient and informant subjective impressions of cognitive ability and compared these scales with the Folstein Mini-Mental State Exam (MMSE) and the Memory Orientation Screening Test (MOST) on a sample of 201 elderly patients seen for neuropsychological evaluation in a tertiary memory evaluation center. Outcome measures included dementia severity and scores from 3 standardized memory tests. Depression was also considered.
Results Patients were unable to judge their own cognition. Family informants rated only slightly better. Both screening tests outperformed patients and informants. The MOST was significantly better than the MMSE for determining dementia severity and memory for the total sample, as well as a subsample of patients who were less impaired and more typical of independent community-dwelling elders. Depression did not influence the test relationships.
Conclusions Neither patient nor informant subjective reports of cognition should be relied on to identify cognitive impairment within the Annual Wellness Visit. Providers would be best served by using a valid and reliable screening test for dementia.
As of January 2011, physicians are required to include detection of cognitive impairment as part of their health risk assessment in the Medicare Annual Wellness Visit.1 The Centers for Medicare and Medicaid Services (CMS) specifically mandate an “assessment of an individual’s cognitive function by direct observation, with due consideration of information obtained by way of patient report, concerns raised by family members, friends, caretakers, or others.”2 Unfortunately, these means of assessment may be unreliable.
Why observation alone won’t work. Physicians often fail to identify cognitive impairment3-5 until it becomes quite severe.6-8 This failure to diagnose may be due to time constraints,9,10 a focus on other health measures,11 or the lack of appropriate and usable tools.11-14 Reliance on patient self-report is also likely to be a flawed approach.15 A recent study found that most patients with dementia in a community sample denied they had memory problems.16 This is consistent with our clinical experience of 30 years in a tertiary memory assessment practice. These patients believe they are no worse off than their contemporaries and minimize or rationalize even demonstrable memory and functional problems. “I remember everything I need to remember” is a common response to the question, “How is your memory?”
During the comment period preceding implementation of the CMS regulation, 38 national organizations comprising the Partnership to Fight Chronic Disease17 argued that reliance on subjective measures alone is inadequate to achieve the stated goal of the legislation. We share this concern.
Improving cognition assessment. Although family complaints have been viewed as valid in at least 1 commonly used screening instrument, the AD8 (with more than 2 of 8 complaints likely to aid in dementia detection)18 does not reflect severity of impairment, nor does it provide a score to follow a patient’s course over time.
To better quantify the subjective perceptions of cognition by patients and their families, we developed the Visual Analog Cognition Scale (VACS)—which we’ll describe in a bit—and added it to our protocol of neuropsychological tests for dementia. Visual analog scales are well-accepted measures for a variety of subjective phenomena,19 including pain,20 treatment response,21 sleep,22 affective states,23 and quality of life.24 We designed this current study to delineate the degree to which patient or informant perspective could assist physicians in the identification process.
We examined VACS responses from a consecutive sample of patients seen in our practice from July through December 2010. Our goal was to quantify the perceptions of patients and their informants regarding patients’ cognitive states across 5 important areas and to determine the relationship between these ratings and the objective results of neuropsychological evaluation. We also wanted to measure the relative accuracy of such subjective ratings with that of 2 validated screening tools, the Folstein Mini-Mental State Exam (MMSE)25 and the recently published Memory Orientation Screening Test (MOST), which we developed.26
Methods
Subjects
We administered the VACS to 201 patients as part of a 4-hour comprehensive neuropsychological evaluation. Patients were referred by community-based physicians, typically in primary care, neurology, or psychiatry. The sample was 66% female (n=133), with an average age of 78.5 (±6.8) years and an average education of 13.2 (±3.2) years. Of the 201 patients, 7 could not complete the VACS because of confusion or visual impairment; 20 had no accompanying informant. Of the 181 accompanied patients, 89 informants were grown children (49%), 64 were spouses (35%), 12 were siblings (7%), and 16 were friends or paid caregivers (9%).
Procedure
An administrative assistant handed each patient and informant the VACS as they checked in at the front desk. We asked them to fill out the questionnaire in the waiting room and advised them not to discuss their ratings with each other. We then conducted a comprehensive neuropsychological evaluation of the patient while another clinician separately interviewed the informant regarding the patient’s current health, cognitive and emotional symptoms, and daily function.
Instruments
The VACS is a 5-item, visual analog scale with parallel forms for patients (VACS-P) and informants (VACS-I). The form instructs the user to “Rate yourself (or the patient with whom you came) in each of these 5 areas by circling a number that best describes how you (they) are doing.” The 5 areas and their descriptions are:
- Attention: Keeping focused, avoiding being distracted, completing tasks
- Initiation: Starting tasks, following through, staying busy and active
- Judgment: Figuring things out and making good decisions
- Memory: Remembering new information and how to do things
- Self-care: Dressing, bathing, preparing food.
Each area has a visual analog scale of 1 to 10 below it, with each number occupying a box in a continuous sequence. Words appear above some of the numbers to help anchor the ratings in a systematic way: 1=very poor; 4=fair; 7=good; 10=very good.
The MMSE and its properties are well known. The MOST is a 29-point scale comprising 3-word recall, orientation to 6 date-and-time items, unforewarned recall of 12 pictured household items, and an 8-point clock drawing score. The validation study, using a total sample exceeding 1000 patients, demonstrated the MOST correlated highly and significantly (Pearson’s correlation coefficient [r]=0.81; P<.001) with dementia severity and 3 standardized memory tests. At a cutoff score of 18 points, it produced a 0.90 area under the curve (AUC) (95% confidence interval [CI], 0.87-0.94), with a sensitivity of 0.85 and specificity of 0.76, correctly classifying 83% of patients. Test-retest reliability was r≥0.90; P<.001 for both shorter (average 2-month) and longer (average 9-month) intervals.
With each patient, we conducted a diagnostic interview and administered a battery of standardized neuropsychological tests to assess intelligence, attention, executive function, language, and memory. The measures of primary interest for this investigation were the MOST, MMSE, delayed story memory (Wechsler Memory Scale-Revised [WMS-R] Logical Memory-II, or LM-II),27 delayed visual memory (WMS-R Visual Recall-II, or VR-II), delayed recall of a 12-item repeated presentation list of common grocery store items (Shopping List Test-Recall, or SLT-R), and the 15-item Geriatric Depression Scale (GDS-15).28 Additionally, each psychologist made a clinical diagnosis, according to Diagnostic and Statistical Manual of Mental Disorders [Fourth Edition] (DSM-IV)29 criteria and rated the patient’s dementia severity (DS) on a 0-to-3 Clinical Dementia Rating-type scale.30 We based diagnoses and severity ratings on age- and education-adjusted neuropsychological test scores, medical and psychiatric history, patient interview, and separate interview with a family informant.
Statistical methods
We calculated VACS totals for each patient and informant. Total VACS scores ranged from 5 to 50. MOST scores, comprising 3-word recall, 6-item orientation, 12-item list memory, and an 8-point clock drawing score, ranged from 0 to 29. We used the MMSE in the traditional method, counting the first error in spelling WORLD backwards, yielding a result of 0 to 30. The GDS score, 0 to 15, reflected the number of items indicating depression. We computed neuropsychological tests using standard scoring techniques. We rated dementia severity as: 0=normal cognition; 0.5=mild cognitive impairment; 1.0=mild dementia; 2.0=moderate dementia; and 3.0=severe dementia. We also assigned half-point ratings from 1 to 3.
We compared MOST, MMSE, VACS-P, and VACS-I scores with dementia severity and the 3 neuropsychological tests of delayed memory and the GDS-15. We computed Pearson’s correlation coefficients and their levels of significance vs 0. Tests of significant differences between correlations used Fisher’s z-transformation and tested the normalized difference vs 0.
Results
Diagnoses and dementia severity levels are listed in TABLE 1. TABLE 2 presents the mean scores for predictor and outcome variables. Correlations and significance ratings between the VACS-P, VACS-I, MOST, and MMSE with the criterion variables of Dementia Severity Rating, LM-II, VR-II, SLT-R, and GDS-15 are shown in TABLE 3.
Patients, on average, rated themselves as having “good” cognition overall. There was no difference in patient self-ratings between the top quartile of dementia severity (mean=34.6; SD= 8.6) and those in the lowest quartile (mean=36.4; SD=9.0). Informants rated the patients, on average, as having only “fair” cognition. Objective neuropsychological tests, however, found the patients, on average, to be mild to moderately demented and to have mild to moderate impairment on objective memory tests. Most patients were not depressed, with an average GDS score well below the clinical cutoff of 7 or more items. However, 30 of the 194 (15.5%) who completed the VACS-P fell into the clinical range for depression.
Patient self-ratings did not correlate (r=0.02) with dementia severity or with any of the 3 standardized memory tests. Informant scores correlated modestly with dementia severity and memory tests, but were significantly higher (P<.001) than those of the patients. Both the MOST (r=–0.86) and the MMSE (r=–0.76) had much stronger and highly significant (P<.001) correlations with dementia severity and with the memory measures (r=0.49–0.70). In addition, the MOST and MMSE were significantly (P<.001) better correlated with dementia severity and objective memory scores than were the informant ratings. Only the MMSE correlation with visual recall (P=.06) did not surpass that of the informant.
The MOST had a significantly higher correlation than the MMSE with dementia severity (P<.01) and with each of the 3 memory tests (P<.05). The MOST and MMSE scores were not related to level of depression (r=–0.01 and –0.03). Patient reports correlated significantly with depression level (r=–0.40; P<.001) as did those of the informants (r=–0.22; P<.01). Nevertheless, depression did not appear to be responsible for the limited relationship between patient self-ratings and objective test scores for cognition. When clinically depressed (GDS≥7) patients were removed from the analysis (remaining n=166), there was no significant improvement in the correlation between subjective ratings and objective scores.
We conducted a secondary analysis of patients whose cognition ranged between normal and mild-to-moderate dementia to see if more cognitively intact individuals would be more accurate at self-rating. In this subsample (n=127; mean age=77.3 years; 57% females), patient self-reports again did not correlate significantly (r=0.05) with dementia severity. Informant ratings remained modest, but significant (r=–0.25; P=.004) and statistically better (P<.05) than those of the patients. The MOST (r=–0.69; P<.001) and the MMSE (r=–0.54; P<.001) remained well-correlated with dementia severity and again outperformed the informant ratings (MOST, P<.001; MMSE, P<.05).
TABLE 1
Cognition diagnoses and severity levels in 201 consecutively evaluated elderly patients
| Diagnosis | n (%) |
|---|---|
| Normal cognition | 8 (4.0) |
| Mild cognitive impairment | 32 (15.9) |
| Dementia of all types | 161 (80.1) |
| – Alzheimer’s disease | 90 (55.9) |
| – Vascular dementia | 62 (38.5) |
| – Frontotemporal dementia | 4 (2.5) |
| – Other dementia | 5 (3.1) |
| Dementia severity rating | |
| Normal (0) | 8 (4.0) |
| Mild cognitive impairment (0.5) | 32 (15.9) |
| Mild dementia (1.0) | 42 (20.9) |
| Mild-moderate dementia (1.5) | 45 (22.4) |
| Moderate dementia (2.0) | 38 (18.9) |
| Moderate–severe dementia (2.5) | 27 (13.4) |
| Severe dementia (3.0) | 9 (4.5) |
TABLE 2
Mean test scores for predictor and outcome variables
| Predictor variables | Mean (SD) | Outcome variables | Mean (SD) |
|---|---|---|---|
| MOST | 15.5 (5.7) | Dementia Severity Rating | 1.5 (0.8) |
| MMSE | 23.2 (4.7) | LM-II | 6.4 (8.2) |
| VACS-P | 35.6 (8.4) | VR-II | 5.4 (7.7) |
| VACS-I | 27.6 (10.2) | SLT-R | 4.3 (3.1) |
| GDS-15 | 3.3 (3.3) | ||
| GDS-15, Geriatric Depression Scale-15; LM-II, Logical Memory-II; MMSE, Mini-Mental State Examination; MOST, Memory Orientation Screening Test; SD, standard deviation; SLT-R, Shopping List Test-Recall; VACS-I, Visual Analog Cognition Scale- Informant; VACS-P, Visual Analog Cognition Scale-Patient; VR-II, Visual Recall-II. | |||
TABLE 3
How the MOST, MMSE, and VACS predictor variables compared with outcome measures
| Correlations of MOST, MMSE, VACS-P, and VACS-I to criterion measures | Pairwise comparison of correlations of MOST, MMSE, and VACS-I to criterion measures (absolute values) | |||||||||||||
|---|---|---|---|---|---|---|---|---|---|---|---|---|---|---|
| MOST (n=201) | MMSE (n=201) | VACS-P (n=194) | VACS-I (n=181) | MOST vs MMSE | MOST vs VACS-I | MMSE vs VACS-I | ||||||||
| Pearson’s correlation coefficient (P value*) | Z-ratio (P value*) | |||||||||||||
| r | P | r | P | r | P | r | P | Z | P | Z | P | Z | P | |
| Dementia severity | –0.86 | <.001 | –0.76 | <.001 | 0.02 | .78 | –0.36 | <.001 | 2.835 | .005 | 8.723 | <.001 | 5.954 | <.001 |
| LM-II | 0.67 | <.001 | 0.52 | <.001 | –0.03 | .68 | 0.20 | .007 | 2.245 | .025 | 5.72 | <.001 | 3.533 | <.001 |
| VR-II | 0.65 | <.001 | 0.49 | <.001 | –0.02 | .78 | 0.33 | <.001 | 2.481 | .013 | 4.29 | <.001 | 1.872 | .061 |
| SLT-R | 0.70 | <.001 | 0.56 | <.001 | 0.01 | .89 | 0.28 | .001 | 2.223 | .026 | 5.735 | <.001 | 3.564 | <.001 |
| GDS-15 | –0.01 | .89 | –0.03 | .67 | –0.40 | <.001 | –0.22 | .003 | ||||||
| GDS-15, Geriatric Depression Scale-15; LM-II, Logical Memory II; MMSE, Mini-Mental State Examination; MOST, Memory Orientation Screening Test; SLT-R, Shopping List Test-Recall; VACS-I, Visual Analog Cognition Scale-Informant; VACS-P, Visual Analog Cognition Scale-Patient; VR-II, Visual Recall II. *The minimum acceptable measure of statistical significance was .05. Pearson’s correlation coefficient (at left) measures the strength of relationship between 2 variables. It can range from 0.0 (no correlation) to –1.0 or 1.0 (perfect correlation). The larger the number, the stronger the relationship. A negative coefficient indicates an inverse relationship. Z-ratio (at right) reflects the size, or magnitude, of the difference between 2 correlations. | ||||||||||||||
DISCUSSION
Results of this study demonstrate that patients referred for specialized memory evaluation had virtually no idea of the degree of their cognitive impairment. Patients, on average, rated their function in 5 critical areas of cognition and behavior as “good.” While 80% of these patients demonstrated dementia on formal evaluation, more than 95% rated themselves as having good or very good cognition. Their ratings did not correlate with any objective memory measures or expert clinician opinion.
Patient and informant ratings are unreliable. Patients with better cognition, who might visit their doctor alone for the Annual Wellness Visit and would appear more intact, were no better at judging their cognition than the total patient sample. Both the patients with good cognition and those with dementia rated themselves equally unimpaired. This finding is not unique to the visual analog scale that we used in this study. When 148 self-nominated “cognitively healthy” community-dwelling elders took the MOST and a battery of neuropsychological tests as part of a norming study for the MOST,31 more than 20% would be classified as having dementia based on their memory and executive function test scores. These findings strongly suggest that patients cannot be relied on to inform their physician of cognitive impairment.
While informants possessed some knowledge about a patient’s cognitive status and were able to supply helpful anecdotal information, their ratings correlated only modestly with objectively measured cognition. This is not surprising given the volume of research demonstrating rater and observer bias.
Rely instead on an objective cognitive screening test. Of greatest relevance, these results indicate that an objective cognitive screening test is more accurate in identifying and measuring cognitive impairment than is the rating of a patient or an informant. Both the MOST and MMSE outperformed patients and informants in assessing patients’ severity of cognitive impairment, including those with milder problems. This last finding is particularly important given that less impaired patients are more likely to visit their doctor without an informant and to appear relatively intact when interviewed or observed by the physician.17 Without an objective test, their cognitive impairment would likely be missed.32
The MOST outperformed the MMSE in detecting dementia and determining disease severity on a sample of 700 patients, and demonstrated twice the sensitivity for disease detection in those who were mildly impaired.26 The current study confirms that the MOST has a significantly higher correlation with dementia severity than does the MMSE, and significantly higher correlations with longer standardized memory tests.
MOST, MMSE test-taking time varies, too. Time constraints are an important consideration in a medical office. The average time to administer the MOST on cognitively impaired patients (a group that is slower to perform than patients with normal cognition) is 4.5 minutes.26 The MMSE, by comparison, takes 10 minutes or more.33,34
Cognition is as measurable as body mass index, blood pressure, height, weight, and level of depression, also mandated in the Annual Wellness Visit. Numbers are easily recorded and compared, while impressions or even a positive (>2) AD8 score are less precise. Provider observation, even if informed by family report, is not as sound a basis for risk analysis, treatment planning, or future monitoring as is an objective measure. Because several current screening tests for dementia possess known reliabilities over time,26,33,35 the physician can periodically repeat such a test to assess treatment response and ongoing risk.
Is there a place for a subjective rating scale? Possibly. A waiting room tool such as the VACS, combined with an objective test, may alert the clinician to a patient with anosognosia. These patients require different management strategies if treatment is to be effective. The care team faces an even greater challenge if an informant shares the patient’s lack of awareness. Conversely, a favorable cognitive screening result and a high score from the informant would give all parties assurance that cognition was normal.
Study limitations. The primary limitation of this study is that it was conducted in a tertiary memory center, where most patients have either suspected or demonstrated cognitive deficits. The relative proportion of normal to impaired patients is, consequently, different from that found in the primary care office, in which about 15% would have mild cognitive impairment36 and a similar percentage would have dementia.37 A replication of this study in such an environment would be helpful. On the other hand, without a companion neuropsychological evaluation as a criterion, the accuracy of self- or informant-report is more difficult to measure. As noted above, 20% of elders volunteering for a study on “normal cognitive functioning” showed significant objective deficits.31
Assessment of cognitive impairment in the primary care physician’s office is uniquely challenging. Physicians are taught to respond to the complaints of patients. But when a patient has dementia, that approach does not work. Family reports are helpful, but not sufficiently accurate. The recent Alzheimer’s Association report37 notes that “Medicare’s new Annual Wellness Visit includes assessment for possible cognitive impairment,” but also points out that “many existing barriers affect the ability or willingness of individuals and their caregivers to recognize cognitive impairment and to discuss it with their physician.” We agree, and we believe that a sound approach to this problem would be for primary care physicians to consistently use an objective tool to measure cognitive functioning in the Annual Wellness Visit and in follow-up visits. A score that reflects the current level of cognition, provides diagnostic information, and reflects change in cognitive status over time will optimize this unique opportunity for earlier detection and potentially earlier treatment of dementia.
CORRESPONDENCE
Mitchell Clionsky, PhD, ABPP (CN), Clionsky Neuro Systems, 155 Maple Street, Suite 203, Springfield, MA 01105; [email protected]
1. 111th US Congress. Patient protection and affordable care act. HR3590, section. 4103. Medicare coverage of annual wellness visit: providing a personalized prevention plan. Available at: http://thomas.loc.gov/cgi-bin/bdquery/z?d111:H.R.3590:#. Accessed February 19, 2011.
2. Department of Health and Human Services, Centers for Medicare and Medicaid Services. Amendment to HR 3590, section 4103, subpart B §410.15 (v). Fed Regist. November 29, 2010;75:73613-73614.
3. Boustani M, Peterson B, Hanson L, et al. Screening for dementia in primary care: a summary of the evidence for the US Preventive Services Task Force. Ann Intern Med. 2003;138:927-937.
4. Valcour VG, Masaki KH, Curb JD, et al. The detection of dementia in the primary care setting. Arch Intern Med. 2000;160:2964-2968.
5. Ganguli M, Rodriguez E, Mulsant B, et al. Detection and management of cognitive impairment in primary care. J Am Geriatr Soc. 2004;52:1668-1675.
6. Chodosh J, Petitti DB, Elliot M, et al. Physician recognition of cognitive impairment: evaluating the need for improvement. J Am Geriatr Soc. 2004;52:1051-1059.
7. Boise L, Neal MB, Kaye J. Dementia assessment in primary care: results from a study in three managed care systems. J Gerontol A Biol Sci Med Sci. 2004;59:M621-M626.
8. Callahan C, Hendrie H, Tierney W. Documentation and evaluation of cognitive impairment in elderly primary care patients. Ann Intern Med. 1995;122:422-429.
9. Boise L, Camicioli R, Morgan DL, et al. Diagnosing dementia: perspectives of primary care physicians. Gerontologist. 1999;39:457-464.
10. Tai-Seale M, McGuire TG, Zhang W. Time allocation in primary care office visits. Health Serv Res. 2007;42:1871-1894.
11. Boise L, Eckstrom E, Fagnan, L. The Rural Older Adult Memory (ROAM) study: a practice-based intervention to improve dementia screening and diagnosis. J Am Board Fam Med. 2010;23:486-498.
12. Brown J, Pengas G, Dawson K, et al. Self administered cognitive screening test for detection of Alzheimer’s disease cross sectional study. BMJ. 2009;338:b2030.-
13. Solomon P, Hirschoff Kelly B, et al. A 7 minute neurocognitive screening battery highly sensitive to Alzheimer’s disease. Arch Neurol. 1998;55:349-355.
14. Borson S, Scanlon J, Brush M, et al. The Mini-Cog: a cognitive vital signs measure for dementia screening. Int J Geriatr Psychiatry. 2000;15:1021-1027.
15. Sevush S, Leve N. Denial of memory deficit in Alzheimer’s disease. Am J Psychiatry. 1993;150:748-751.
16. Lehmann S, Black B, Shore A, et al. Living alone with dementia: lack of awareness adds to functional and cognitive vulnerabilities. Int Psychogeriatr. 2010;22:778-784.
17. Partnership to Fight Chronic Disease. Letter submitted via Internet to Donald Berwick, MD, Administrator; Centers for Medicare and Medicaid Services. Available at: http://www.google.com/url?sa=t&source=web&cd=3&ved=0CCsQFjAC&url=https%3A%2F%2Fwww.thenationalcouncil.org%2Fgalleries%2Fpolicy-file%2FMedicare%2520Wellness%2520visit%2520-%2520final.pdf&ei=W2x_ToCRMuzTiAL1xIi7Aw&usg=AFQjCNFPWOe8s5xD117o0zfwOpZ69rskAw. Accessed February 19, 2011.
18. Galvin JE, Roe CM, Powlishta KK, et al. The AD8, a brief informant interview to detect dementia. Neurology. 2005;65:559-561.
19. Marsh-Richard D, Hatzis E, Mathias C, et al. Adaptive visual analog scales (AVAS): a modifiable software program for the creation, administration, and scoring of visual analog scales. Behav Res Methods. 2009;41:99-106.
20. Keller S, Bann C, Dodd S, et al. Validity of the Brief Pain Inventory for use in documenting the outcomes of patients with noncancer pain. Clin J Pain. 2004;20:309-318.
21. LaStayo P, Larsen S, Smith S, et al. Feasibility and efficacy of eccentric exercise with older cancer survivors. J Geriatr Phys Ther. 2010;33:135-140.
22. Zisapel N, Tarrasch R, Laudon M. A comparison of visual analog scale and categorical ratings in assessing patients’ estimate of sleep quality. In: Lader MH, Cardinali DP, Pandi-Perumal SR, eds. Sleep and Sleep Disorders. New York, NY: Springer Science+Business Media; 2006:220–224.
23. Kindler C, Harms C, Amsler F, et al. The visual analog scale allows effective measurement of preoperative anxiety and detection of patients’ anesthetic concerns. Anesth Analg. 2000;90:706-712.
24. Bruce B, Fries JF. The Stanford Health Assessment Questionnaire: dimensions and practical applications. Health Qual Life Outcomes. 2003;1:20.-
25. Folstein MF, Folstein SE, McHugh PR. “Mini-Mental State”: a practical method for grading cognitive states of patients for the clinician. J Psychiatr Res. 1975;12:189-198.
26. Clionsky M, Clionsky E. Development and validation of the Memory Orientation Screening Test (MOST™): a better screening test for dementia. Am J Alzheimers Dis Other Demen. 2010;25:650-656.
27. Wechsler D. Wechsler Memory Scale–Revised. New York, NY: Psychological Corporation; 1987.
28. Sheikh JI, Yesavage JA. Geriatric Depression Scale (GDS): Recent evidence and development of a shorter version. Clin Gerontol. 1986;5:165-173.
29. American Psychiatric Association. Diagnostic and Statistical Manual of Mental Disorders. 4th ed. Washington, DC: American Psychiatric Association; 1994.
30. Morris JC. The Clinical Dementia Rating Scale (CDR): current version and scoring rules. Neurology. 1993;43:2412-2414.
31. NIH Clinical Trials Registry. Further validation of the Memory Orientation Screening Test (MOST): a 5-minute screening test for dementia in primary care practice. Available at: http://clinicaltrials.gov. Identifier NCT01057602. Last updated February 7, 2010. Accessed March 4, 2011.
32. Bradford A, Kunik M, Schulz P, et al. Missed and delayed diagnosis of dementia in primary care: prevalence and contributing factors. Alzheimer Dis Assoc Disord. 2009;23:306-314.
33. Pezzotti P, Scalmana S, Mastromattei A, et al. The accuracy of the MMSE in detecting cognitive impairment when administered by general practitioners: a prospective observational study. BMC Fam Pract. 2008;9:29.-
34. Lorentz L. Primary Care Tools for Clinicians: A Compendium of Forms, Questionnaires, and Rating Scales for Everyday Practice. St. Louis, Mo: Elsevier Mosby; 2005.
35. Solomon P, Pendlebury W. Recognition of Alzheimer’s disease: the 7 minute screen. Fam Med. 1998;30:265-271.
36. Peterson R. Mild cognitive impairment. N Engl J Med. 2011;364:2227-2234.
37. Alzheimer’s Association. 2011 Alzheimer’s disease facts and figures. Alzheimers Dement. 2011;7:208-244.
Purpose Assessing for cognitive impairment is now mandated as part of the Medicare Annual Wellness Visit. This offers an unparalleled opportunity for early detection and treatment of dementia. However, physician observation supplemented by reports of patients and informants may be less effective than an objective screening test to achieve this goal.
Methods We used visual analog cognition scales (VACS) to quantify patient and informant subjective impressions of cognitive ability and compared these scales with the Folstein Mini-Mental State Exam (MMSE) and the Memory Orientation Screening Test (MOST) on a sample of 201 elderly patients seen for neuropsychological evaluation in a tertiary memory evaluation center. Outcome measures included dementia severity and scores from 3 standardized memory tests. Depression was also considered.
Results Patients were unable to judge their own cognition. Family informants rated only slightly better. Both screening tests outperformed patients and informants. The MOST was significantly better than the MMSE for determining dementia severity and memory for the total sample, as well as a subsample of patients who were less impaired and more typical of independent community-dwelling elders. Depression did not influence the test relationships.
Conclusions Neither patient nor informant subjective reports of cognition should be relied on to identify cognitive impairment within the Annual Wellness Visit. Providers would be best served by using a valid and reliable screening test for dementia.
As of January 2011, physicians are required to include detection of cognitive impairment as part of their health risk assessment in the Medicare Annual Wellness Visit.1 The Centers for Medicare and Medicaid Services (CMS) specifically mandate an “assessment of an individual’s cognitive function by direct observation, with due consideration of information obtained by way of patient report, concerns raised by family members, friends, caretakers, or others.”2 Unfortunately, these means of assessment may be unreliable.
Why observation alone won’t work. Physicians often fail to identify cognitive impairment3-5 until it becomes quite severe.6-8 This failure to diagnose may be due to time constraints,9,10 a focus on other health measures,11 or the lack of appropriate and usable tools.11-14 Reliance on patient self-report is also likely to be a flawed approach.15 A recent study found that most patients with dementia in a community sample denied they had memory problems.16 This is consistent with our clinical experience of 30 years in a tertiary memory assessment practice. These patients believe they are no worse off than their contemporaries and minimize or rationalize even demonstrable memory and functional problems. “I remember everything I need to remember” is a common response to the question, “How is your memory?”
During the comment period preceding implementation of the CMS regulation, 38 national organizations comprising the Partnership to Fight Chronic Disease17 argued that reliance on subjective measures alone is inadequate to achieve the stated goal of the legislation. We share this concern.
Improving cognition assessment. Although family complaints have been viewed as valid in at least 1 commonly used screening instrument, the AD8 (with more than 2 of 8 complaints likely to aid in dementia detection)18 does not reflect severity of impairment, nor does it provide a score to follow a patient’s course over time.
To better quantify the subjective perceptions of cognition by patients and their families, we developed the Visual Analog Cognition Scale (VACS)—which we’ll describe in a bit—and added it to our protocol of neuropsychological tests for dementia. Visual analog scales are well-accepted measures for a variety of subjective phenomena,19 including pain,20 treatment response,21 sleep,22 affective states,23 and quality of life.24 We designed this current study to delineate the degree to which patient or informant perspective could assist physicians in the identification process.
We examined VACS responses from a consecutive sample of patients seen in our practice from July through December 2010. Our goal was to quantify the perceptions of patients and their informants regarding patients’ cognitive states across 5 important areas and to determine the relationship between these ratings and the objective results of neuropsychological evaluation. We also wanted to measure the relative accuracy of such subjective ratings with that of 2 validated screening tools, the Folstein Mini-Mental State Exam (MMSE)25 and the recently published Memory Orientation Screening Test (MOST), which we developed.26
Methods
Subjects
We administered the VACS to 201 patients as part of a 4-hour comprehensive neuropsychological evaluation. Patients were referred by community-based physicians, typically in primary care, neurology, or psychiatry. The sample was 66% female (n=133), with an average age of 78.5 (±6.8) years and an average education of 13.2 (±3.2) years. Of the 201 patients, 7 could not complete the VACS because of confusion or visual impairment; 20 had no accompanying informant. Of the 181 accompanied patients, 89 informants were grown children (49%), 64 were spouses (35%), 12 were siblings (7%), and 16 were friends or paid caregivers (9%).
Procedure
An administrative assistant handed each patient and informant the VACS as they checked in at the front desk. We asked them to fill out the questionnaire in the waiting room and advised them not to discuss their ratings with each other. We then conducted a comprehensive neuropsychological evaluation of the patient while another clinician separately interviewed the informant regarding the patient’s current health, cognitive and emotional symptoms, and daily function.
Instruments
The VACS is a 5-item, visual analog scale with parallel forms for patients (VACS-P) and informants (VACS-I). The form instructs the user to “Rate yourself (or the patient with whom you came) in each of these 5 areas by circling a number that best describes how you (they) are doing.” The 5 areas and their descriptions are:
- Attention: Keeping focused, avoiding being distracted, completing tasks
- Initiation: Starting tasks, following through, staying busy and active
- Judgment: Figuring things out and making good decisions
- Memory: Remembering new information and how to do things
- Self-care: Dressing, bathing, preparing food.
Each area has a visual analog scale of 1 to 10 below it, with each number occupying a box in a continuous sequence. Words appear above some of the numbers to help anchor the ratings in a systematic way: 1=very poor; 4=fair; 7=good; 10=very good.
The MMSE and its properties are well known. The MOST is a 29-point scale comprising 3-word recall, orientation to 6 date-and-time items, unforewarned recall of 12 pictured household items, and an 8-point clock drawing score. The validation study, using a total sample exceeding 1000 patients, demonstrated the MOST correlated highly and significantly (Pearson’s correlation coefficient [r]=0.81; P<.001) with dementia severity and 3 standardized memory tests. At a cutoff score of 18 points, it produced a 0.90 area under the curve (AUC) (95% confidence interval [CI], 0.87-0.94), with a sensitivity of 0.85 and specificity of 0.76, correctly classifying 83% of patients. Test-retest reliability was r≥0.90; P<.001 for both shorter (average 2-month) and longer (average 9-month) intervals.
With each patient, we conducted a diagnostic interview and administered a battery of standardized neuropsychological tests to assess intelligence, attention, executive function, language, and memory. The measures of primary interest for this investigation were the MOST, MMSE, delayed story memory (Wechsler Memory Scale-Revised [WMS-R] Logical Memory-II, or LM-II),27 delayed visual memory (WMS-R Visual Recall-II, or VR-II), delayed recall of a 12-item repeated presentation list of common grocery store items (Shopping List Test-Recall, or SLT-R), and the 15-item Geriatric Depression Scale (GDS-15).28 Additionally, each psychologist made a clinical diagnosis, according to Diagnostic and Statistical Manual of Mental Disorders [Fourth Edition] (DSM-IV)29 criteria and rated the patient’s dementia severity (DS) on a 0-to-3 Clinical Dementia Rating-type scale.30 We based diagnoses and severity ratings on age- and education-adjusted neuropsychological test scores, medical and psychiatric history, patient interview, and separate interview with a family informant.
Statistical methods
We calculated VACS totals for each patient and informant. Total VACS scores ranged from 5 to 50. MOST scores, comprising 3-word recall, 6-item orientation, 12-item list memory, and an 8-point clock drawing score, ranged from 0 to 29. We used the MMSE in the traditional method, counting the first error in spelling WORLD backwards, yielding a result of 0 to 30. The GDS score, 0 to 15, reflected the number of items indicating depression. We computed neuropsychological tests using standard scoring techniques. We rated dementia severity as: 0=normal cognition; 0.5=mild cognitive impairment; 1.0=mild dementia; 2.0=moderate dementia; and 3.0=severe dementia. We also assigned half-point ratings from 1 to 3.
We compared MOST, MMSE, VACS-P, and VACS-I scores with dementia severity and the 3 neuropsychological tests of delayed memory and the GDS-15. We computed Pearson’s correlation coefficients and their levels of significance vs 0. Tests of significant differences between correlations used Fisher’s z-transformation and tested the normalized difference vs 0.
Results
Diagnoses and dementia severity levels are listed in TABLE 1. TABLE 2 presents the mean scores for predictor and outcome variables. Correlations and significance ratings between the VACS-P, VACS-I, MOST, and MMSE with the criterion variables of Dementia Severity Rating, LM-II, VR-II, SLT-R, and GDS-15 are shown in TABLE 3.
Patients, on average, rated themselves as having “good” cognition overall. There was no difference in patient self-ratings between the top quartile of dementia severity (mean=34.6; SD= 8.6) and those in the lowest quartile (mean=36.4; SD=9.0). Informants rated the patients, on average, as having only “fair” cognition. Objective neuropsychological tests, however, found the patients, on average, to be mild to moderately demented and to have mild to moderate impairment on objective memory tests. Most patients were not depressed, with an average GDS score well below the clinical cutoff of 7 or more items. However, 30 of the 194 (15.5%) who completed the VACS-P fell into the clinical range for depression.
Patient self-ratings did not correlate (r=0.02) with dementia severity or with any of the 3 standardized memory tests. Informant scores correlated modestly with dementia severity and memory tests, but were significantly higher (P<.001) than those of the patients. Both the MOST (r=–0.86) and the MMSE (r=–0.76) had much stronger and highly significant (P<.001) correlations with dementia severity and with the memory measures (r=0.49–0.70). In addition, the MOST and MMSE were significantly (P<.001) better correlated with dementia severity and objective memory scores than were the informant ratings. Only the MMSE correlation with visual recall (P=.06) did not surpass that of the informant.
The MOST had a significantly higher correlation than the MMSE with dementia severity (P<.01) and with each of the 3 memory tests (P<.05). The MOST and MMSE scores were not related to level of depression (r=–0.01 and –0.03). Patient reports correlated significantly with depression level (r=–0.40; P<.001) as did those of the informants (r=–0.22; P<.01). Nevertheless, depression did not appear to be responsible for the limited relationship between patient self-ratings and objective test scores for cognition. When clinically depressed (GDS≥7) patients were removed from the analysis (remaining n=166), there was no significant improvement in the correlation between subjective ratings and objective scores.
We conducted a secondary analysis of patients whose cognition ranged between normal and mild-to-moderate dementia to see if more cognitively intact individuals would be more accurate at self-rating. In this subsample (n=127; mean age=77.3 years; 57% females), patient self-reports again did not correlate significantly (r=0.05) with dementia severity. Informant ratings remained modest, but significant (r=–0.25; P=.004) and statistically better (P<.05) than those of the patients. The MOST (r=–0.69; P<.001) and the MMSE (r=–0.54; P<.001) remained well-correlated with dementia severity and again outperformed the informant ratings (MOST, P<.001; MMSE, P<.05).
TABLE 1
Cognition diagnoses and severity levels in 201 consecutively evaluated elderly patients
| Diagnosis | n (%) |
|---|---|
| Normal cognition | 8 (4.0) |
| Mild cognitive impairment | 32 (15.9) |
| Dementia of all types | 161 (80.1) |
| – Alzheimer’s disease | 90 (55.9) |
| – Vascular dementia | 62 (38.5) |
| – Frontotemporal dementia | 4 (2.5) |
| – Other dementia | 5 (3.1) |
| Dementia severity rating | |
| Normal (0) | 8 (4.0) |
| Mild cognitive impairment (0.5) | 32 (15.9) |
| Mild dementia (1.0) | 42 (20.9) |
| Mild-moderate dementia (1.5) | 45 (22.4) |
| Moderate dementia (2.0) | 38 (18.9) |
| Moderate–severe dementia (2.5) | 27 (13.4) |
| Severe dementia (3.0) | 9 (4.5) |
TABLE 2
Mean test scores for predictor and outcome variables
| Predictor variables | Mean (SD) | Outcome variables | Mean (SD) |
|---|---|---|---|
| MOST | 15.5 (5.7) | Dementia Severity Rating | 1.5 (0.8) |
| MMSE | 23.2 (4.7) | LM-II | 6.4 (8.2) |
| VACS-P | 35.6 (8.4) | VR-II | 5.4 (7.7) |
| VACS-I | 27.6 (10.2) | SLT-R | 4.3 (3.1) |
| GDS-15 | 3.3 (3.3) | ||
| GDS-15, Geriatric Depression Scale-15; LM-II, Logical Memory-II; MMSE, Mini-Mental State Examination; MOST, Memory Orientation Screening Test; SD, standard deviation; SLT-R, Shopping List Test-Recall; VACS-I, Visual Analog Cognition Scale- Informant; VACS-P, Visual Analog Cognition Scale-Patient; VR-II, Visual Recall-II. | |||
TABLE 3
How the MOST, MMSE, and VACS predictor variables compared with outcome measures
| Correlations of MOST, MMSE, VACS-P, and VACS-I to criterion measures | Pairwise comparison of correlations of MOST, MMSE, and VACS-I to criterion measures (absolute values) | |||||||||||||
|---|---|---|---|---|---|---|---|---|---|---|---|---|---|---|
| MOST (n=201) | MMSE (n=201) | VACS-P (n=194) | VACS-I (n=181) | MOST vs MMSE | MOST vs VACS-I | MMSE vs VACS-I | ||||||||
| Pearson’s correlation coefficient (P value*) | Z-ratio (P value*) | |||||||||||||
| r | P | r | P | r | P | r | P | Z | P | Z | P | Z | P | |
| Dementia severity | –0.86 | <.001 | –0.76 | <.001 | 0.02 | .78 | –0.36 | <.001 | 2.835 | .005 | 8.723 | <.001 | 5.954 | <.001 |
| LM-II | 0.67 | <.001 | 0.52 | <.001 | –0.03 | .68 | 0.20 | .007 | 2.245 | .025 | 5.72 | <.001 | 3.533 | <.001 |
| VR-II | 0.65 | <.001 | 0.49 | <.001 | –0.02 | .78 | 0.33 | <.001 | 2.481 | .013 | 4.29 | <.001 | 1.872 | .061 |
| SLT-R | 0.70 | <.001 | 0.56 | <.001 | 0.01 | .89 | 0.28 | .001 | 2.223 | .026 | 5.735 | <.001 | 3.564 | <.001 |
| GDS-15 | –0.01 | .89 | –0.03 | .67 | –0.40 | <.001 | –0.22 | .003 | ||||||
| GDS-15, Geriatric Depression Scale-15; LM-II, Logical Memory II; MMSE, Mini-Mental State Examination; MOST, Memory Orientation Screening Test; SLT-R, Shopping List Test-Recall; VACS-I, Visual Analog Cognition Scale-Informant; VACS-P, Visual Analog Cognition Scale-Patient; VR-II, Visual Recall II. *The minimum acceptable measure of statistical significance was .05. Pearson’s correlation coefficient (at left) measures the strength of relationship between 2 variables. It can range from 0.0 (no correlation) to –1.0 or 1.0 (perfect correlation). The larger the number, the stronger the relationship. A negative coefficient indicates an inverse relationship. Z-ratio (at right) reflects the size, or magnitude, of the difference between 2 correlations. | ||||||||||||||
DISCUSSION
Results of this study demonstrate that patients referred for specialized memory evaluation had virtually no idea of the degree of their cognitive impairment. Patients, on average, rated their function in 5 critical areas of cognition and behavior as “good.” While 80% of these patients demonstrated dementia on formal evaluation, more than 95% rated themselves as having good or very good cognition. Their ratings did not correlate with any objective memory measures or expert clinician opinion.
Patient and informant ratings are unreliable. Patients with better cognition, who might visit their doctor alone for the Annual Wellness Visit and would appear more intact, were no better at judging their cognition than the total patient sample. Both the patients with good cognition and those with dementia rated themselves equally unimpaired. This finding is not unique to the visual analog scale that we used in this study. When 148 self-nominated “cognitively healthy” community-dwelling elders took the MOST and a battery of neuropsychological tests as part of a norming study for the MOST,31 more than 20% would be classified as having dementia based on their memory and executive function test scores. These findings strongly suggest that patients cannot be relied on to inform their physician of cognitive impairment.
While informants possessed some knowledge about a patient’s cognitive status and were able to supply helpful anecdotal information, their ratings correlated only modestly with objectively measured cognition. This is not surprising given the volume of research demonstrating rater and observer bias.
Rely instead on an objective cognitive screening test. Of greatest relevance, these results indicate that an objective cognitive screening test is more accurate in identifying and measuring cognitive impairment than is the rating of a patient or an informant. Both the MOST and MMSE outperformed patients and informants in assessing patients’ severity of cognitive impairment, including those with milder problems. This last finding is particularly important given that less impaired patients are more likely to visit their doctor without an informant and to appear relatively intact when interviewed or observed by the physician.17 Without an objective test, their cognitive impairment would likely be missed.32
The MOST outperformed the MMSE in detecting dementia and determining disease severity on a sample of 700 patients, and demonstrated twice the sensitivity for disease detection in those who were mildly impaired.26 The current study confirms that the MOST has a significantly higher correlation with dementia severity than does the MMSE, and significantly higher correlations with longer standardized memory tests.
MOST, MMSE test-taking time varies, too. Time constraints are an important consideration in a medical office. The average time to administer the MOST on cognitively impaired patients (a group that is slower to perform than patients with normal cognition) is 4.5 minutes.26 The MMSE, by comparison, takes 10 minutes or more.33,34
Cognition is as measurable as body mass index, blood pressure, height, weight, and level of depression, also mandated in the Annual Wellness Visit. Numbers are easily recorded and compared, while impressions or even a positive (>2) AD8 score are less precise. Provider observation, even if informed by family report, is not as sound a basis for risk analysis, treatment planning, or future monitoring as is an objective measure. Because several current screening tests for dementia possess known reliabilities over time,26,33,35 the physician can periodically repeat such a test to assess treatment response and ongoing risk.
Is there a place for a subjective rating scale? Possibly. A waiting room tool such as the VACS, combined with an objective test, may alert the clinician to a patient with anosognosia. These patients require different management strategies if treatment is to be effective. The care team faces an even greater challenge if an informant shares the patient’s lack of awareness. Conversely, a favorable cognitive screening result and a high score from the informant would give all parties assurance that cognition was normal.
Study limitations. The primary limitation of this study is that it was conducted in a tertiary memory center, where most patients have either suspected or demonstrated cognitive deficits. The relative proportion of normal to impaired patients is, consequently, different from that found in the primary care office, in which about 15% would have mild cognitive impairment36 and a similar percentage would have dementia.37 A replication of this study in such an environment would be helpful. On the other hand, without a companion neuropsychological evaluation as a criterion, the accuracy of self- or informant-report is more difficult to measure. As noted above, 20% of elders volunteering for a study on “normal cognitive functioning” showed significant objective deficits.31
Assessment of cognitive impairment in the primary care physician’s office is uniquely challenging. Physicians are taught to respond to the complaints of patients. But when a patient has dementia, that approach does not work. Family reports are helpful, but not sufficiently accurate. The recent Alzheimer’s Association report37 notes that “Medicare’s new Annual Wellness Visit includes assessment for possible cognitive impairment,” but also points out that “many existing barriers affect the ability or willingness of individuals and their caregivers to recognize cognitive impairment and to discuss it with their physician.” We agree, and we believe that a sound approach to this problem would be for primary care physicians to consistently use an objective tool to measure cognitive functioning in the Annual Wellness Visit and in follow-up visits. A score that reflects the current level of cognition, provides diagnostic information, and reflects change in cognitive status over time will optimize this unique opportunity for earlier detection and potentially earlier treatment of dementia.
CORRESPONDENCE
Mitchell Clionsky, PhD, ABPP (CN), Clionsky Neuro Systems, 155 Maple Street, Suite 203, Springfield, MA 01105; [email protected]
Purpose Assessing for cognitive impairment is now mandated as part of the Medicare Annual Wellness Visit. This offers an unparalleled opportunity for early detection and treatment of dementia. However, physician observation supplemented by reports of patients and informants may be less effective than an objective screening test to achieve this goal.
Methods We used visual analog cognition scales (VACS) to quantify patient and informant subjective impressions of cognitive ability and compared these scales with the Folstein Mini-Mental State Exam (MMSE) and the Memory Orientation Screening Test (MOST) on a sample of 201 elderly patients seen for neuropsychological evaluation in a tertiary memory evaluation center. Outcome measures included dementia severity and scores from 3 standardized memory tests. Depression was also considered.
Results Patients were unable to judge their own cognition. Family informants rated only slightly better. Both screening tests outperformed patients and informants. The MOST was significantly better than the MMSE for determining dementia severity and memory for the total sample, as well as a subsample of patients who were less impaired and more typical of independent community-dwelling elders. Depression did not influence the test relationships.
Conclusions Neither patient nor informant subjective reports of cognition should be relied on to identify cognitive impairment within the Annual Wellness Visit. Providers would be best served by using a valid and reliable screening test for dementia.
As of January 2011, physicians are required to include detection of cognitive impairment as part of their health risk assessment in the Medicare Annual Wellness Visit.1 The Centers for Medicare and Medicaid Services (CMS) specifically mandate an “assessment of an individual’s cognitive function by direct observation, with due consideration of information obtained by way of patient report, concerns raised by family members, friends, caretakers, or others.”2 Unfortunately, these means of assessment may be unreliable.
Why observation alone won’t work. Physicians often fail to identify cognitive impairment3-5 until it becomes quite severe.6-8 This failure to diagnose may be due to time constraints,9,10 a focus on other health measures,11 or the lack of appropriate and usable tools.11-14 Reliance on patient self-report is also likely to be a flawed approach.15 A recent study found that most patients with dementia in a community sample denied they had memory problems.16 This is consistent with our clinical experience of 30 years in a tertiary memory assessment practice. These patients believe they are no worse off than their contemporaries and minimize or rationalize even demonstrable memory and functional problems. “I remember everything I need to remember” is a common response to the question, “How is your memory?”
During the comment period preceding implementation of the CMS regulation, 38 national organizations comprising the Partnership to Fight Chronic Disease17 argued that reliance on subjective measures alone is inadequate to achieve the stated goal of the legislation. We share this concern.
Improving cognition assessment. Although family complaints have been viewed as valid in at least 1 commonly used screening instrument, the AD8 (with more than 2 of 8 complaints likely to aid in dementia detection)18 does not reflect severity of impairment, nor does it provide a score to follow a patient’s course over time.
To better quantify the subjective perceptions of cognition by patients and their families, we developed the Visual Analog Cognition Scale (VACS)—which we’ll describe in a bit—and added it to our protocol of neuropsychological tests for dementia. Visual analog scales are well-accepted measures for a variety of subjective phenomena,19 including pain,20 treatment response,21 sleep,22 affective states,23 and quality of life.24 We designed this current study to delineate the degree to which patient or informant perspective could assist physicians in the identification process.
We examined VACS responses from a consecutive sample of patients seen in our practice from July through December 2010. Our goal was to quantify the perceptions of patients and their informants regarding patients’ cognitive states across 5 important areas and to determine the relationship between these ratings and the objective results of neuropsychological evaluation. We also wanted to measure the relative accuracy of such subjective ratings with that of 2 validated screening tools, the Folstein Mini-Mental State Exam (MMSE)25 and the recently published Memory Orientation Screening Test (MOST), which we developed.26
Methods
Subjects
We administered the VACS to 201 patients as part of a 4-hour comprehensive neuropsychological evaluation. Patients were referred by community-based physicians, typically in primary care, neurology, or psychiatry. The sample was 66% female (n=133), with an average age of 78.5 (±6.8) years and an average education of 13.2 (±3.2) years. Of the 201 patients, 7 could not complete the VACS because of confusion or visual impairment; 20 had no accompanying informant. Of the 181 accompanied patients, 89 informants were grown children (49%), 64 were spouses (35%), 12 were siblings (7%), and 16 were friends or paid caregivers (9%).
Procedure
An administrative assistant handed each patient and informant the VACS as they checked in at the front desk. We asked them to fill out the questionnaire in the waiting room and advised them not to discuss their ratings with each other. We then conducted a comprehensive neuropsychological evaluation of the patient while another clinician separately interviewed the informant regarding the patient’s current health, cognitive and emotional symptoms, and daily function.
Instruments
The VACS is a 5-item, visual analog scale with parallel forms for patients (VACS-P) and informants (VACS-I). The form instructs the user to “Rate yourself (or the patient with whom you came) in each of these 5 areas by circling a number that best describes how you (they) are doing.” The 5 areas and their descriptions are:
- Attention: Keeping focused, avoiding being distracted, completing tasks
- Initiation: Starting tasks, following through, staying busy and active
- Judgment: Figuring things out and making good decisions
- Memory: Remembering new information and how to do things
- Self-care: Dressing, bathing, preparing food.
Each area has a visual analog scale of 1 to 10 below it, with each number occupying a box in a continuous sequence. Words appear above some of the numbers to help anchor the ratings in a systematic way: 1=very poor; 4=fair; 7=good; 10=very good.
The MMSE and its properties are well known. The MOST is a 29-point scale comprising 3-word recall, orientation to 6 date-and-time items, unforewarned recall of 12 pictured household items, and an 8-point clock drawing score. The validation study, using a total sample exceeding 1000 patients, demonstrated the MOST correlated highly and significantly (Pearson’s correlation coefficient [r]=0.81; P<.001) with dementia severity and 3 standardized memory tests. At a cutoff score of 18 points, it produced a 0.90 area under the curve (AUC) (95% confidence interval [CI], 0.87-0.94), with a sensitivity of 0.85 and specificity of 0.76, correctly classifying 83% of patients. Test-retest reliability was r≥0.90; P<.001 for both shorter (average 2-month) and longer (average 9-month) intervals.
With each patient, we conducted a diagnostic interview and administered a battery of standardized neuropsychological tests to assess intelligence, attention, executive function, language, and memory. The measures of primary interest for this investigation were the MOST, MMSE, delayed story memory (Wechsler Memory Scale-Revised [WMS-R] Logical Memory-II, or LM-II),27 delayed visual memory (WMS-R Visual Recall-II, or VR-II), delayed recall of a 12-item repeated presentation list of common grocery store items (Shopping List Test-Recall, or SLT-R), and the 15-item Geriatric Depression Scale (GDS-15).28 Additionally, each psychologist made a clinical diagnosis, according to Diagnostic and Statistical Manual of Mental Disorders [Fourth Edition] (DSM-IV)29 criteria and rated the patient’s dementia severity (DS) on a 0-to-3 Clinical Dementia Rating-type scale.30 We based diagnoses and severity ratings on age- and education-adjusted neuropsychological test scores, medical and psychiatric history, patient interview, and separate interview with a family informant.
Statistical methods
We calculated VACS totals for each patient and informant. Total VACS scores ranged from 5 to 50. MOST scores, comprising 3-word recall, 6-item orientation, 12-item list memory, and an 8-point clock drawing score, ranged from 0 to 29. We used the MMSE in the traditional method, counting the first error in spelling WORLD backwards, yielding a result of 0 to 30. The GDS score, 0 to 15, reflected the number of items indicating depression. We computed neuropsychological tests using standard scoring techniques. We rated dementia severity as: 0=normal cognition; 0.5=mild cognitive impairment; 1.0=mild dementia; 2.0=moderate dementia; and 3.0=severe dementia. We also assigned half-point ratings from 1 to 3.
We compared MOST, MMSE, VACS-P, and VACS-I scores with dementia severity and the 3 neuropsychological tests of delayed memory and the GDS-15. We computed Pearson’s correlation coefficients and their levels of significance vs 0. Tests of significant differences between correlations used Fisher’s z-transformation and tested the normalized difference vs 0.
Results
Diagnoses and dementia severity levels are listed in TABLE 1. TABLE 2 presents the mean scores for predictor and outcome variables. Correlations and significance ratings between the VACS-P, VACS-I, MOST, and MMSE with the criterion variables of Dementia Severity Rating, LM-II, VR-II, SLT-R, and GDS-15 are shown in TABLE 3.
Patients, on average, rated themselves as having “good” cognition overall. There was no difference in patient self-ratings between the top quartile of dementia severity (mean=34.6; SD= 8.6) and those in the lowest quartile (mean=36.4; SD=9.0). Informants rated the patients, on average, as having only “fair” cognition. Objective neuropsychological tests, however, found the patients, on average, to be mild to moderately demented and to have mild to moderate impairment on objective memory tests. Most patients were not depressed, with an average GDS score well below the clinical cutoff of 7 or more items. However, 30 of the 194 (15.5%) who completed the VACS-P fell into the clinical range for depression.
Patient self-ratings did not correlate (r=0.02) with dementia severity or with any of the 3 standardized memory tests. Informant scores correlated modestly with dementia severity and memory tests, but were significantly higher (P<.001) than those of the patients. Both the MOST (r=–0.86) and the MMSE (r=–0.76) had much stronger and highly significant (P<.001) correlations with dementia severity and with the memory measures (r=0.49–0.70). In addition, the MOST and MMSE were significantly (P<.001) better correlated with dementia severity and objective memory scores than were the informant ratings. Only the MMSE correlation with visual recall (P=.06) did not surpass that of the informant.
The MOST had a significantly higher correlation than the MMSE with dementia severity (P<.01) and with each of the 3 memory tests (P<.05). The MOST and MMSE scores were not related to level of depression (r=–0.01 and –0.03). Patient reports correlated significantly with depression level (r=–0.40; P<.001) as did those of the informants (r=–0.22; P<.01). Nevertheless, depression did not appear to be responsible for the limited relationship between patient self-ratings and objective test scores for cognition. When clinically depressed (GDS≥7) patients were removed from the analysis (remaining n=166), there was no significant improvement in the correlation between subjective ratings and objective scores.
We conducted a secondary analysis of patients whose cognition ranged between normal and mild-to-moderate dementia to see if more cognitively intact individuals would be more accurate at self-rating. In this subsample (n=127; mean age=77.3 years; 57% females), patient self-reports again did not correlate significantly (r=0.05) with dementia severity. Informant ratings remained modest, but significant (r=–0.25; P=.004) and statistically better (P<.05) than those of the patients. The MOST (r=–0.69; P<.001) and the MMSE (r=–0.54; P<.001) remained well-correlated with dementia severity and again outperformed the informant ratings (MOST, P<.001; MMSE, P<.05).
TABLE 1
Cognition diagnoses and severity levels in 201 consecutively evaluated elderly patients
| Diagnosis | n (%) |
|---|---|
| Normal cognition | 8 (4.0) |
| Mild cognitive impairment | 32 (15.9) |
| Dementia of all types | 161 (80.1) |
| – Alzheimer’s disease | 90 (55.9) |
| – Vascular dementia | 62 (38.5) |
| – Frontotemporal dementia | 4 (2.5) |
| – Other dementia | 5 (3.1) |
| Dementia severity rating | |
| Normal (0) | 8 (4.0) |
| Mild cognitive impairment (0.5) | 32 (15.9) |
| Mild dementia (1.0) | 42 (20.9) |
| Mild-moderate dementia (1.5) | 45 (22.4) |
| Moderate dementia (2.0) | 38 (18.9) |
| Moderate–severe dementia (2.5) | 27 (13.4) |
| Severe dementia (3.0) | 9 (4.5) |
TABLE 2
Mean test scores for predictor and outcome variables
| Predictor variables | Mean (SD) | Outcome variables | Mean (SD) |
|---|---|---|---|
| MOST | 15.5 (5.7) | Dementia Severity Rating | 1.5 (0.8) |
| MMSE | 23.2 (4.7) | LM-II | 6.4 (8.2) |
| VACS-P | 35.6 (8.4) | VR-II | 5.4 (7.7) |
| VACS-I | 27.6 (10.2) | SLT-R | 4.3 (3.1) |
| GDS-15 | 3.3 (3.3) | ||
| GDS-15, Geriatric Depression Scale-15; LM-II, Logical Memory-II; MMSE, Mini-Mental State Examination; MOST, Memory Orientation Screening Test; SD, standard deviation; SLT-R, Shopping List Test-Recall; VACS-I, Visual Analog Cognition Scale- Informant; VACS-P, Visual Analog Cognition Scale-Patient; VR-II, Visual Recall-II. | |||
TABLE 3
How the MOST, MMSE, and VACS predictor variables compared with outcome measures
| Correlations of MOST, MMSE, VACS-P, and VACS-I to criterion measures | Pairwise comparison of correlations of MOST, MMSE, and VACS-I to criterion measures (absolute values) | |||||||||||||
|---|---|---|---|---|---|---|---|---|---|---|---|---|---|---|
| MOST (n=201) | MMSE (n=201) | VACS-P (n=194) | VACS-I (n=181) | MOST vs MMSE | MOST vs VACS-I | MMSE vs VACS-I | ||||||||
| Pearson’s correlation coefficient (P value*) | Z-ratio (P value*) | |||||||||||||
| r | P | r | P | r | P | r | P | Z | P | Z | P | Z | P | |
| Dementia severity | –0.86 | <.001 | –0.76 | <.001 | 0.02 | .78 | –0.36 | <.001 | 2.835 | .005 | 8.723 | <.001 | 5.954 | <.001 |
| LM-II | 0.67 | <.001 | 0.52 | <.001 | –0.03 | .68 | 0.20 | .007 | 2.245 | .025 | 5.72 | <.001 | 3.533 | <.001 |
| VR-II | 0.65 | <.001 | 0.49 | <.001 | –0.02 | .78 | 0.33 | <.001 | 2.481 | .013 | 4.29 | <.001 | 1.872 | .061 |
| SLT-R | 0.70 | <.001 | 0.56 | <.001 | 0.01 | .89 | 0.28 | .001 | 2.223 | .026 | 5.735 | <.001 | 3.564 | <.001 |
| GDS-15 | –0.01 | .89 | –0.03 | .67 | –0.40 | <.001 | –0.22 | .003 | ||||||
| GDS-15, Geriatric Depression Scale-15; LM-II, Logical Memory II; MMSE, Mini-Mental State Examination; MOST, Memory Orientation Screening Test; SLT-R, Shopping List Test-Recall; VACS-I, Visual Analog Cognition Scale-Informant; VACS-P, Visual Analog Cognition Scale-Patient; VR-II, Visual Recall II. *The minimum acceptable measure of statistical significance was .05. Pearson’s correlation coefficient (at left) measures the strength of relationship between 2 variables. It can range from 0.0 (no correlation) to –1.0 or 1.0 (perfect correlation). The larger the number, the stronger the relationship. A negative coefficient indicates an inverse relationship. Z-ratio (at right) reflects the size, or magnitude, of the difference between 2 correlations. | ||||||||||||||
DISCUSSION
Results of this study demonstrate that patients referred for specialized memory evaluation had virtually no idea of the degree of their cognitive impairment. Patients, on average, rated their function in 5 critical areas of cognition and behavior as “good.” While 80% of these patients demonstrated dementia on formal evaluation, more than 95% rated themselves as having good or very good cognition. Their ratings did not correlate with any objective memory measures or expert clinician opinion.
Patient and informant ratings are unreliable. Patients with better cognition, who might visit their doctor alone for the Annual Wellness Visit and would appear more intact, were no better at judging their cognition than the total patient sample. Both the patients with good cognition and those with dementia rated themselves equally unimpaired. This finding is not unique to the visual analog scale that we used in this study. When 148 self-nominated “cognitively healthy” community-dwelling elders took the MOST and a battery of neuropsychological tests as part of a norming study for the MOST,31 more than 20% would be classified as having dementia based on their memory and executive function test scores. These findings strongly suggest that patients cannot be relied on to inform their physician of cognitive impairment.
While informants possessed some knowledge about a patient’s cognitive status and were able to supply helpful anecdotal information, their ratings correlated only modestly with objectively measured cognition. This is not surprising given the volume of research demonstrating rater and observer bias.
Rely instead on an objective cognitive screening test. Of greatest relevance, these results indicate that an objective cognitive screening test is more accurate in identifying and measuring cognitive impairment than is the rating of a patient or an informant. Both the MOST and MMSE outperformed patients and informants in assessing patients’ severity of cognitive impairment, including those with milder problems. This last finding is particularly important given that less impaired patients are more likely to visit their doctor without an informant and to appear relatively intact when interviewed or observed by the physician.17 Without an objective test, their cognitive impairment would likely be missed.32
The MOST outperformed the MMSE in detecting dementia and determining disease severity on a sample of 700 patients, and demonstrated twice the sensitivity for disease detection in those who were mildly impaired.26 The current study confirms that the MOST has a significantly higher correlation with dementia severity than does the MMSE, and significantly higher correlations with longer standardized memory tests.
MOST, MMSE test-taking time varies, too. Time constraints are an important consideration in a medical office. The average time to administer the MOST on cognitively impaired patients (a group that is slower to perform than patients with normal cognition) is 4.5 minutes.26 The MMSE, by comparison, takes 10 minutes or more.33,34
Cognition is as measurable as body mass index, blood pressure, height, weight, and level of depression, also mandated in the Annual Wellness Visit. Numbers are easily recorded and compared, while impressions or even a positive (>2) AD8 score are less precise. Provider observation, even if informed by family report, is not as sound a basis for risk analysis, treatment planning, or future monitoring as is an objective measure. Because several current screening tests for dementia possess known reliabilities over time,26,33,35 the physician can periodically repeat such a test to assess treatment response and ongoing risk.
Is there a place for a subjective rating scale? Possibly. A waiting room tool such as the VACS, combined with an objective test, may alert the clinician to a patient with anosognosia. These patients require different management strategies if treatment is to be effective. The care team faces an even greater challenge if an informant shares the patient’s lack of awareness. Conversely, a favorable cognitive screening result and a high score from the informant would give all parties assurance that cognition was normal.
Study limitations. The primary limitation of this study is that it was conducted in a tertiary memory center, where most patients have either suspected or demonstrated cognitive deficits. The relative proportion of normal to impaired patients is, consequently, different from that found in the primary care office, in which about 15% would have mild cognitive impairment36 and a similar percentage would have dementia.37 A replication of this study in such an environment would be helpful. On the other hand, without a companion neuropsychological evaluation as a criterion, the accuracy of self- or informant-report is more difficult to measure. As noted above, 20% of elders volunteering for a study on “normal cognitive functioning” showed significant objective deficits.31
Assessment of cognitive impairment in the primary care physician’s office is uniquely challenging. Physicians are taught to respond to the complaints of patients. But when a patient has dementia, that approach does not work. Family reports are helpful, but not sufficiently accurate. The recent Alzheimer’s Association report37 notes that “Medicare’s new Annual Wellness Visit includes assessment for possible cognitive impairment,” but also points out that “many existing barriers affect the ability or willingness of individuals and their caregivers to recognize cognitive impairment and to discuss it with their physician.” We agree, and we believe that a sound approach to this problem would be for primary care physicians to consistently use an objective tool to measure cognitive functioning in the Annual Wellness Visit and in follow-up visits. A score that reflects the current level of cognition, provides diagnostic information, and reflects change in cognitive status over time will optimize this unique opportunity for earlier detection and potentially earlier treatment of dementia.
CORRESPONDENCE
Mitchell Clionsky, PhD, ABPP (CN), Clionsky Neuro Systems, 155 Maple Street, Suite 203, Springfield, MA 01105; [email protected]
1. 111th US Congress. Patient protection and affordable care act. HR3590, section. 4103. Medicare coverage of annual wellness visit: providing a personalized prevention plan. Available at: http://thomas.loc.gov/cgi-bin/bdquery/z?d111:H.R.3590:#. Accessed February 19, 2011.
2. Department of Health and Human Services, Centers for Medicare and Medicaid Services. Amendment to HR 3590, section 4103, subpart B §410.15 (v). Fed Regist. November 29, 2010;75:73613-73614.
3. Boustani M, Peterson B, Hanson L, et al. Screening for dementia in primary care: a summary of the evidence for the US Preventive Services Task Force. Ann Intern Med. 2003;138:927-937.
4. Valcour VG, Masaki KH, Curb JD, et al. The detection of dementia in the primary care setting. Arch Intern Med. 2000;160:2964-2968.
5. Ganguli M, Rodriguez E, Mulsant B, et al. Detection and management of cognitive impairment in primary care. J Am Geriatr Soc. 2004;52:1668-1675.
6. Chodosh J, Petitti DB, Elliot M, et al. Physician recognition of cognitive impairment: evaluating the need for improvement. J Am Geriatr Soc. 2004;52:1051-1059.
7. Boise L, Neal MB, Kaye J. Dementia assessment in primary care: results from a study in three managed care systems. J Gerontol A Biol Sci Med Sci. 2004;59:M621-M626.
8. Callahan C, Hendrie H, Tierney W. Documentation and evaluation of cognitive impairment in elderly primary care patients. Ann Intern Med. 1995;122:422-429.
9. Boise L, Camicioli R, Morgan DL, et al. Diagnosing dementia: perspectives of primary care physicians. Gerontologist. 1999;39:457-464.
10. Tai-Seale M, McGuire TG, Zhang W. Time allocation in primary care office visits. Health Serv Res. 2007;42:1871-1894.
11. Boise L, Eckstrom E, Fagnan, L. The Rural Older Adult Memory (ROAM) study: a practice-based intervention to improve dementia screening and diagnosis. J Am Board Fam Med. 2010;23:486-498.
12. Brown J, Pengas G, Dawson K, et al. Self administered cognitive screening test for detection of Alzheimer’s disease cross sectional study. BMJ. 2009;338:b2030.-
13. Solomon P, Hirschoff Kelly B, et al. A 7 minute neurocognitive screening battery highly sensitive to Alzheimer’s disease. Arch Neurol. 1998;55:349-355.
14. Borson S, Scanlon J, Brush M, et al. The Mini-Cog: a cognitive vital signs measure for dementia screening. Int J Geriatr Psychiatry. 2000;15:1021-1027.
15. Sevush S, Leve N. Denial of memory deficit in Alzheimer’s disease. Am J Psychiatry. 1993;150:748-751.
16. Lehmann S, Black B, Shore A, et al. Living alone with dementia: lack of awareness adds to functional and cognitive vulnerabilities. Int Psychogeriatr. 2010;22:778-784.
17. Partnership to Fight Chronic Disease. Letter submitted via Internet to Donald Berwick, MD, Administrator; Centers for Medicare and Medicaid Services. Available at: http://www.google.com/url?sa=t&source=web&cd=3&ved=0CCsQFjAC&url=https%3A%2F%2Fwww.thenationalcouncil.org%2Fgalleries%2Fpolicy-file%2FMedicare%2520Wellness%2520visit%2520-%2520final.pdf&ei=W2x_ToCRMuzTiAL1xIi7Aw&usg=AFQjCNFPWOe8s5xD117o0zfwOpZ69rskAw. Accessed February 19, 2011.
18. Galvin JE, Roe CM, Powlishta KK, et al. The AD8, a brief informant interview to detect dementia. Neurology. 2005;65:559-561.
19. Marsh-Richard D, Hatzis E, Mathias C, et al. Adaptive visual analog scales (AVAS): a modifiable software program for the creation, administration, and scoring of visual analog scales. Behav Res Methods. 2009;41:99-106.
20. Keller S, Bann C, Dodd S, et al. Validity of the Brief Pain Inventory for use in documenting the outcomes of patients with noncancer pain. Clin J Pain. 2004;20:309-318.
21. LaStayo P, Larsen S, Smith S, et al. Feasibility and efficacy of eccentric exercise with older cancer survivors. J Geriatr Phys Ther. 2010;33:135-140.
22. Zisapel N, Tarrasch R, Laudon M. A comparison of visual analog scale and categorical ratings in assessing patients’ estimate of sleep quality. In: Lader MH, Cardinali DP, Pandi-Perumal SR, eds. Sleep and Sleep Disorders. New York, NY: Springer Science+Business Media; 2006:220–224.
23. Kindler C, Harms C, Amsler F, et al. The visual analog scale allows effective measurement of preoperative anxiety and detection of patients’ anesthetic concerns. Anesth Analg. 2000;90:706-712.
24. Bruce B, Fries JF. The Stanford Health Assessment Questionnaire: dimensions and practical applications. Health Qual Life Outcomes. 2003;1:20.-
25. Folstein MF, Folstein SE, McHugh PR. “Mini-Mental State”: a practical method for grading cognitive states of patients for the clinician. J Psychiatr Res. 1975;12:189-198.
26. Clionsky M, Clionsky E. Development and validation of the Memory Orientation Screening Test (MOST™): a better screening test for dementia. Am J Alzheimers Dis Other Demen. 2010;25:650-656.
27. Wechsler D. Wechsler Memory Scale–Revised. New York, NY: Psychological Corporation; 1987.
28. Sheikh JI, Yesavage JA. Geriatric Depression Scale (GDS): Recent evidence and development of a shorter version. Clin Gerontol. 1986;5:165-173.
29. American Psychiatric Association. Diagnostic and Statistical Manual of Mental Disorders. 4th ed. Washington, DC: American Psychiatric Association; 1994.
30. Morris JC. The Clinical Dementia Rating Scale (CDR): current version and scoring rules. Neurology. 1993;43:2412-2414.
31. NIH Clinical Trials Registry. Further validation of the Memory Orientation Screening Test (MOST): a 5-minute screening test for dementia in primary care practice. Available at: http://clinicaltrials.gov. Identifier NCT01057602. Last updated February 7, 2010. Accessed March 4, 2011.
32. Bradford A, Kunik M, Schulz P, et al. Missed and delayed diagnosis of dementia in primary care: prevalence and contributing factors. Alzheimer Dis Assoc Disord. 2009;23:306-314.
33. Pezzotti P, Scalmana S, Mastromattei A, et al. The accuracy of the MMSE in detecting cognitive impairment when administered by general practitioners: a prospective observational study. BMC Fam Pract. 2008;9:29.-
34. Lorentz L. Primary Care Tools for Clinicians: A Compendium of Forms, Questionnaires, and Rating Scales for Everyday Practice. St. Louis, Mo: Elsevier Mosby; 2005.
35. Solomon P, Pendlebury W. Recognition of Alzheimer’s disease: the 7 minute screen. Fam Med. 1998;30:265-271.
36. Peterson R. Mild cognitive impairment. N Engl J Med. 2011;364:2227-2234.
37. Alzheimer’s Association. 2011 Alzheimer’s disease facts and figures. Alzheimers Dement. 2011;7:208-244.
1. 111th US Congress. Patient protection and affordable care act. HR3590, section. 4103. Medicare coverage of annual wellness visit: providing a personalized prevention plan. Available at: http://thomas.loc.gov/cgi-bin/bdquery/z?d111:H.R.3590:#. Accessed February 19, 2011.
2. Department of Health and Human Services, Centers for Medicare and Medicaid Services. Amendment to HR 3590, section 4103, subpart B §410.15 (v). Fed Regist. November 29, 2010;75:73613-73614.
3. Boustani M, Peterson B, Hanson L, et al. Screening for dementia in primary care: a summary of the evidence for the US Preventive Services Task Force. Ann Intern Med. 2003;138:927-937.
4. Valcour VG, Masaki KH, Curb JD, et al. The detection of dementia in the primary care setting. Arch Intern Med. 2000;160:2964-2968.
5. Ganguli M, Rodriguez E, Mulsant B, et al. Detection and management of cognitive impairment in primary care. J Am Geriatr Soc. 2004;52:1668-1675.
6. Chodosh J, Petitti DB, Elliot M, et al. Physician recognition of cognitive impairment: evaluating the need for improvement. J Am Geriatr Soc. 2004;52:1051-1059.
7. Boise L, Neal MB, Kaye J. Dementia assessment in primary care: results from a study in three managed care systems. J Gerontol A Biol Sci Med Sci. 2004;59:M621-M626.
8. Callahan C, Hendrie H, Tierney W. Documentation and evaluation of cognitive impairment in elderly primary care patients. Ann Intern Med. 1995;122:422-429.
9. Boise L, Camicioli R, Morgan DL, et al. Diagnosing dementia: perspectives of primary care physicians. Gerontologist. 1999;39:457-464.
10. Tai-Seale M, McGuire TG, Zhang W. Time allocation in primary care office visits. Health Serv Res. 2007;42:1871-1894.
11. Boise L, Eckstrom E, Fagnan, L. The Rural Older Adult Memory (ROAM) study: a practice-based intervention to improve dementia screening and diagnosis. J Am Board Fam Med. 2010;23:486-498.
12. Brown J, Pengas G, Dawson K, et al. Self administered cognitive screening test for detection of Alzheimer’s disease cross sectional study. BMJ. 2009;338:b2030.-
13. Solomon P, Hirschoff Kelly B, et al. A 7 minute neurocognitive screening battery highly sensitive to Alzheimer’s disease. Arch Neurol. 1998;55:349-355.
14. Borson S, Scanlon J, Brush M, et al. The Mini-Cog: a cognitive vital signs measure for dementia screening. Int J Geriatr Psychiatry. 2000;15:1021-1027.
15. Sevush S, Leve N. Denial of memory deficit in Alzheimer’s disease. Am J Psychiatry. 1993;150:748-751.
16. Lehmann S, Black B, Shore A, et al. Living alone with dementia: lack of awareness adds to functional and cognitive vulnerabilities. Int Psychogeriatr. 2010;22:778-784.
17. Partnership to Fight Chronic Disease. Letter submitted via Internet to Donald Berwick, MD, Administrator; Centers for Medicare and Medicaid Services. Available at: http://www.google.com/url?sa=t&source=web&cd=3&ved=0CCsQFjAC&url=https%3A%2F%2Fwww.thenationalcouncil.org%2Fgalleries%2Fpolicy-file%2FMedicare%2520Wellness%2520visit%2520-%2520final.pdf&ei=W2x_ToCRMuzTiAL1xIi7Aw&usg=AFQjCNFPWOe8s5xD117o0zfwOpZ69rskAw. Accessed February 19, 2011.
18. Galvin JE, Roe CM, Powlishta KK, et al. The AD8, a brief informant interview to detect dementia. Neurology. 2005;65:559-561.
19. Marsh-Richard D, Hatzis E, Mathias C, et al. Adaptive visual analog scales (AVAS): a modifiable software program for the creation, administration, and scoring of visual analog scales. Behav Res Methods. 2009;41:99-106.
20. Keller S, Bann C, Dodd S, et al. Validity of the Brief Pain Inventory for use in documenting the outcomes of patients with noncancer pain. Clin J Pain. 2004;20:309-318.
21. LaStayo P, Larsen S, Smith S, et al. Feasibility and efficacy of eccentric exercise with older cancer survivors. J Geriatr Phys Ther. 2010;33:135-140.
22. Zisapel N, Tarrasch R, Laudon M. A comparison of visual analog scale and categorical ratings in assessing patients’ estimate of sleep quality. In: Lader MH, Cardinali DP, Pandi-Perumal SR, eds. Sleep and Sleep Disorders. New York, NY: Springer Science+Business Media; 2006:220–224.
23. Kindler C, Harms C, Amsler F, et al. The visual analog scale allows effective measurement of preoperative anxiety and detection of patients’ anesthetic concerns. Anesth Analg. 2000;90:706-712.
24. Bruce B, Fries JF. The Stanford Health Assessment Questionnaire: dimensions and practical applications. Health Qual Life Outcomes. 2003;1:20.-
25. Folstein MF, Folstein SE, McHugh PR. “Mini-Mental State”: a practical method for grading cognitive states of patients for the clinician. J Psychiatr Res. 1975;12:189-198.
26. Clionsky M, Clionsky E. Development and validation of the Memory Orientation Screening Test (MOST™): a better screening test for dementia. Am J Alzheimers Dis Other Demen. 2010;25:650-656.
27. Wechsler D. Wechsler Memory Scale–Revised. New York, NY: Psychological Corporation; 1987.
28. Sheikh JI, Yesavage JA. Geriatric Depression Scale (GDS): Recent evidence and development of a shorter version. Clin Gerontol. 1986;5:165-173.
29. American Psychiatric Association. Diagnostic and Statistical Manual of Mental Disorders. 4th ed. Washington, DC: American Psychiatric Association; 1994.
30. Morris JC. The Clinical Dementia Rating Scale (CDR): current version and scoring rules. Neurology. 1993;43:2412-2414.
31. NIH Clinical Trials Registry. Further validation of the Memory Orientation Screening Test (MOST): a 5-minute screening test for dementia in primary care practice. Available at: http://clinicaltrials.gov. Identifier NCT01057602. Last updated February 7, 2010. Accessed March 4, 2011.
32. Bradford A, Kunik M, Schulz P, et al. Missed and delayed diagnosis of dementia in primary care: prevalence and contributing factors. Alzheimer Dis Assoc Disord. 2009;23:306-314.
33. Pezzotti P, Scalmana S, Mastromattei A, et al. The accuracy of the MMSE in detecting cognitive impairment when administered by general practitioners: a prospective observational study. BMC Fam Pract. 2008;9:29.-
34. Lorentz L. Primary Care Tools for Clinicians: A Compendium of Forms, Questionnaires, and Rating Scales for Everyday Practice. St. Louis, Mo: Elsevier Mosby; 2005.
35. Solomon P, Pendlebury W. Recognition of Alzheimer’s disease: the 7 minute screen. Fam Med. 1998;30:265-271.
36. Peterson R. Mild cognitive impairment. N Engl J Med. 2011;364:2227-2234.
37. Alzheimer’s Association. 2011 Alzheimer’s disease facts and figures. Alzheimers Dement. 2011;7:208-244.
Getting injured runners back on track
• Advise patients with metatarsalgia to use metatarsal pads, consider orthotics, use contrast baths, and avoid high heels and pointy-toed shoes. C
• Recommend that runners with stress fractures of the foot have at least 4 weeks of rest before a gradual return to activity. C
• Consider short-term physical therapy for patients with plantar fasciitis to enable them to learn proper stretching and strengthening techniques. C
Strength of recommendation (SOR)
A Good-quality patient-oriented evidence
B Inconsistent or limited-quality patient-oriented evidence
C Consensus, usual practice, opinion, disease-oriented evidence, case series
CASE Jim F, 40 years old and overweight (BMI=28 kg/m2), has come to see you because of foot pain that began shortly after he took up running. Jim tells you that turning 40 was “an eye opener” that prompted him to “get healthy.” He says that while he was a competitive athlete in high school, he never ran regularly—until he embarked on a running program 3 months ago.
Jim denies acute injury, bruising, swelling, redness, fever, or chills, but states that the pain, which he describes as dull and achy, is gradually getting worse. It hurts the most when he stands for long periods of time. He says that he occasionally takes ibuprofen for the foot pain, but has not tried icing or stretching. When you ask him what kind of sneakers he wears during his runs, Jim reports that his running shoes—purchased at a discount store—are about 5 years old.
Participation in running has grown by more than 40% in the United States in the past decade.1 As a result, patients like Jim are bound to have their share of aches, pains, and injuries that prompt them to visit their family physician. And that’s where this review can help. This rundown of the most common foot pain diagnoses, as well as the at-a-glance summaries of the differential diagnosis (TABLE 1)2-5 and treatment options (TABLE 2),3,6-25 can help you quickly get patients the relief they need to return to running.
TABLE 1
Differential diagnosis for runners’ foot pain2-5
| Symptom | Differential diagnosis |
|---|---|
| Foot pain |
|
| Heel pain |
|
| *Represents a more common diagnosis. | |
TABLE 2
Diagnosing and treating common runners’ injuries
| Diagnosis | History | Physical exam | Interventions |
|---|---|---|---|
| Metatarsalgia | Plantar foot pain, insidious onset; occasional swelling, bruising, or deformity | Tenderness of MT heads; possible edema or hyperkeratosis; negative tuning fork test | Footwear: cushioning, wide toe box, MT pads; consider orthotics. Contrast baths; NSAIDs6-9 |
| Stress fracture | Pain, insidious onset, increasing in intensity and duration | Localized TTP; possible swelling or bruising; positive tuning fork test; X-rays/MRI may be helpful | Boot for minimum of 3-4 weeks, followed by PT for foot/ankle ROM, strength, proprioception Ice, acetaminophen (NSAIDs controversial)10-12 Progressive return to running* |
| Plantar fasciitis | Plantar foot/heel pain, worse with first steps in AM and after prolonged weight-bearing | TTP at medial calcaneal tubercle | Relative rest, NSAIDs, PT for HEP, Graston technique, taping; possible night splinting13-15 Consider ESWT, corticosteroid injection for refractory cases16-18 |
| MAT | Posterior heel/Achilles pain in midportion; insidious onset, increasing in intensity, worse with activity | Tenderness midportion Achilles; possible tendon thickening; warmth, crepitus, nodules | Relative rest; PT for eccentric exercises; heel lift, with or without orthotics19-22 Consider PRP, prolotherapy, ESWT, or ultrasound in refractory cases†23,24 Surgical intervention rarely indicated3 |
| IAT | Posterior heel/Achilles pain in insertion of Achilles; insidious onset, increasing in intensity; swelling possible; worse with activity | Tenderness with or without swelling; deformity at Achilles insertion | Relative rest; footwear modification (heel lift, possibly with orthotics); PT for eccentric exercises, though less valuable than for MAT†25 |
| *Starting with cross-training exercise, progressing to running on a treadmill, then to running outdoors. †Corticosteroid injection contraindicated. ESWT, extracorporeal shock wave therapy; HEP, home exercise program; IAT, insertional Achilles tendinopathy; MAT, midportion Achilles tendinopathy; MRI, magnetic resonance imaging; MT, metatarsal; NSAIDs, nonsteroidal anti-inflammatory drugs; PRP, plasma-rich protein; PT, physical therapy; ROM, range of motion; TTP, tenderness to palpation. | |||
Metatarsalgia: Pain on the plantar surface
Typically associated with a recent increase in activity or change in footwear, metatarsalgia is defined by pain on the plantar surface of the forefoot in the area of the metatarsal heads. The second, third, and fourth metatarsals are the most common offenders, and the pain may or may not be accompanied by swelling, bruising, or deformity.
Mechanical irregularities in the foot are thought to contribute to the development of metatarsalgia, which is typically inflammatory in nature. Physical exam often reveals tenderness at the affected metatarsal heads, with or without pain in the corresponding metatarsophalangeal joint, and occasionally, with overlying edema or hyperkeratosis.
Tuning fork test. Commonly used but weakly supported, this diagnostic test is performed by applying a vibrating tuning fork to a site of possible fracture. If the maneuver produces focal pain, the test is positive and may be helpful in ruling in metatarsal stress fractures.26
Treatment: Change shoes, consider NSAIDs. Treatment for metatarsalgia begins conservatively, with a change in footwear. High heels or pointy-toed shoes should be avoided, and metatarsal pads (FIGURE 1) can be placed inside the shoes to help off-load the metatarsal head.6 The pads come prefabricated or can be custom made, and are typically placed by physical therapists to ensure proper placement. Orthotics should also be considered, as they can help normalize abnormal foot mechanics that may contribute to metatarsalgia.7,8 (See “A word about runners’ footwear”.9,27-31)
Metatarsalgia is believed to be an inflammatory process, and NSAIDs may be helpful. Contrast baths—alternately submerging the affected foot in a basin of hot (but not scalding) water for 1 to 2 minutes, then immersing it in cold water for 30 to 60 seconds and repeating the process for about 20 minutes once or twice daily—may be helpful. Magnetic insoles are not recommended, as they have been found to be no better than sham insoles.32 Rarely, surgical repair of underlying mechanical abnormalities is indicated for treatment of refractory metatarsalgia.
CASE On examination, Jim F has no swelling, but some hyperkeratosis overlying the second and third metatarsal heads. He has tenderness to palpation at these heads as well as the corresponding metatarsophalangeal joints, and a negative tuning fork test.
You advise Jim that he has metatarsalgia, educate him about the pathophysiology of this condition, and give him a prescription for a nonsteroidal anti-inflammatory drug. You suggest he use contrast baths—and explain how this is done—once or twice a day and refer him to physical therapy for proper placement of metatarsal pads in his shoes, and schedule an appointment for a 6-week follow-up.
Return to running. There is no firm recommendation regarding abstaining from running with metatarsalgia. Advise patients to use pain as a guide in determining the intensity and duration of activity.
FIGURE 1
Treatment for metatarsalgia is conservative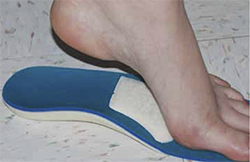
In addition to changing to more comfortable footwear, patients with metatarsalgia can place metatarsal pads like the one shown here in their shoes to ease the metatarsal load.
The proper footwear for runners is subject to considerable debate, with arguments supported by contradictory evidence. What is known, however, is that running shoes should:
- be a comfortable fit with cushioning chosen to accommodate arch type
- be replaced after running 300 to 500 miles or every 12 months, whichever comes first27,28
- be purchased from a sporting goods or running store, rather than at a discount retailer. That’s because the shoes sold at discount stores are often older, and breakdown of the protective cushioning is more likely to have occurred prior to purchase.28
The most expensive shoe is not automatically the best choice for the runner, however. Some studies have found no benefit in foot strike pressures with expensive cushioned running shoes compared with low- or medium-cost brands.29 Shoes should be selected based on comfort, although the patient’s arch type should also be considered when selecting running footwear.30
Barefoot running shoes, designed to simulate barefoot running, are also an option. As with cushioned running shoes, evidence regarding barefoot running is contradictory. Some studies suggest that running mechanics are improved with barefoot running or barefoot running shoes; others have had unfavorable or inconsistent results, indicating a need for further research.9,31
Stress fracture: Tenderness and pain of insidious onset
Stress fractures of the foot (SFF)—overuse injuries also known as fatigue fractures—are common in recreational runners. They are thought to result from microtraumas, which alone are not sufficient to break bone but together overwhelm the bone’s natural ability to remodel and recover over time. SFF are characterized by tenderness and pain of insidious onset, and typically occur when more than one training variable (eg, frequency, duration, and intensity) is changed simultaneously. SFF can also result from a change in exercise mechanics, such as foot strike.
Stress fractures can occur in any bone in the foot, but are most common in the metatarsal bones, specifically the mid or distal portion of the second or third metatarsal, or the tarsal navicular.2,33 On examination, the patient will have tenderness to palpation, often well localized. A positive tuning fork test (see page 647) is highly suggestive of a stress fracture.
Some studies suggest that barefoot running or barefoot running shoes improve running mechanics; other studies have had unfavorable or inconsistent results.
In female runners, stress fractures may be associated with the female athlete triad—osteoporosis or osteopenia, disordered eating (specifically caloric deficiency and low BMI), and amenorrhea. In addition to the major long-term health problems that may result from even one component of the triad, SFF may be a short-term consequence.34
Although SFF is a clinical diagnosis, x-rays—including 3-view plain films of the foot, with the area of concern clearly noted on the order—are recommended. Magnetic resonance imaging may be used for secondary imaging if doubt about the source of the pain remains.35
Of note: Occasionally, a metatarsal stress fracture progresses to a frank fracture, specifically of the metaphyseal-diaphyseal junction of the fifth metatarsal—known as a Jones fracture. This type of fracture has a high rate of malunion or nonunion.36 If there is any suspicion of a fracture in this area, consider a referral to a sports medicine specialist or orthopedic surgeon.
Treatment: Icing, analgesics, and a boot. Standard treatment for SFF includes icing for 15 to 20 minutes up to 3 times a day for a minimum of 72 hours after injury, but may be continued throughout the healing period. Analgesics such as acetaminophen and a walking boot for 3 to 4 weeks, with follow-up at 3 weeks, should also be implemented. Recent evidence suggests that NSAIDs may hinder the bone healing process, and their use in treating SFF is controversial.10-12
Weaning from the boot can begin when the patient is pain free with the boot on, usually by 3 to 4 weeks. Patients often progress quickly from wearing the boot at all times to wearing it only outside of the house, to not wearing it at all. Advise patients who need to walk long distances for a good portion of the day to keep the boot nearby and to put it on if the pain returns.
Once weaning from the boot begins, physical therapy (PT) should be considered to help the patient regain foot and ankle range of motion (ROM), proprioception, and strength. Once he or she learns the exercises, rehabilitation can be accomplished with a home exercise program. Foot deformities, such as pes planus or pes cavus, may indicate a need for orthotics. A well-structured athletic shoe may help to prevent future injury.7,8
Return to running. Once adequate ROM and strength in the foot and ankle are recovered, the patient can begin to resume activity, starting with a low-impact cross-training exercise, such as a stationary bike or elliptical, for a week or 2. A patient who remains pain free can progress from cross-training to running on a treadmill for another week or 2, then gradually switch to outdoor running.
Plantar fasciitis: Heel pain with an insidious onset
Plantar fasciitis is one of the most common causes of heel pain in athletes (primarily runners) and nonathletes alike. Plantar fasciitis may be associated with acute trauma, but is more commonly insidious in onset. The diagnosis is clinical and rarely requires imaging.
Pain associated with plantar fasciitis may be described as sharp and stabbing or dull and aching. It is on the plantar surface of the heel, sometimes radiating to the arch, and may localize to the insertion of the plantar fascia on the medial calcaneal tubercle (FIGURE 2). The pain is typically most severe with the first few steps in the morning or after other periods of prolonged rest. It usually improves after a few steps, but may return later in the day. Plantar fasciitis does not cause paresthesias or other neurologic symptoms, so their presence is suggestive of a different diagnosis, such as nerve entrapment, compartment syndrome, or tarsal tunnel syndrome.3,5
Treatment: It’s multifactorial. NSAIDs are commonly used. Relative rest is recommended, but cross training may be considered to maintain fitness.37 Short-term PT is also recommended to teach the patient proper stretching and strengthening techniques in the form of a home exercise plan. Modalities such as iontophoresis (a system of transdermal delivery of medication with the use of electrical currents), Graston (a form of instrument-assisted soft tissue mobilization), and taping may be incorporated into PT, as well.13
Night splinting may also be used to keep the foot in a dorsiflexed position. A splint can be purchased without a prescription and prevents the plantar fascia from shortening overnight by providing a continuous passive stretch, thus reducing pain with first steps.14
Orthotics may also help to reduce symptom severity and duration, and studies have found no difference in outcomes with prefabricated vs custom-made devices.15 Another treatment to consider, particularly for recalcitrant cases of plantar fasciitis, is extracorporeal shock wave therapy, which has been studied for more than a decade with conflicting results.16 Corticosteroid injection may also be used for treatment-refractory plantar fasciitis, but caution is required, as the injection may increase the risk of rupture of the plantar fascia.17,18
Return to running. There are no set guidelines for when an athlete with plantar fasciitis can return to running. Typically, after 2 to 4 weeks of relative rest and other treatments, the runner can begin to transition from cross-training to treadmill running.
FIGURE 2
Severe pain with first steps of the day
The pain of plantar fasciitis—often most severe first thing in the morning—may localize to the insertion of the plantar fascia on the medial calcaneal tubercle, as shown above.
Achilles tendinopathy: An overuse injury
Achilles tendinopathy (AT) is typically an overuse injury incurred by athletes, although it is sometimes seen in patients who are sedentary and overweight. With a prevalence among runners of approximately 11%, AT is sometimes called the “runners’ disease.”4
Tendinopathy is a more accurate description than tendonitis, as histologic studies of affected Achilles tendons suggest that AT is a degenerative, rather than an inflammatory, condition.38 A diagnosis of AT can be further classified as midportion or insertional.
Midportion Achilles tendinopathy (MAT), characterized by pain that occurs in the body of the Achilles tendon and worsens with activity, is often a clinical diagnosis. Physical findings suggestive of MAT are tenderness to palpation of the midportion of the Achilles tendon, with thickening of the tendon, warmth, crepitus, or palpable nodules in the tendon body. Onset is insidious and is commonly associated with an increase in activity.
Treatment: Orthotics or a heel lift. Like that of plantar fasciitis, treatment of midportion Achilles tendinopathy is primarily conservative. The use of orthotics, or a heel lift, is one of the most cost-effective interventions, and they are widely used, despite limited evidence of efficacy.39 Custom orthotics are costly, and patients often benefit from trying prefabricated orthotics first to determine whether they will help.
Eccentric exercises. One of the most studied interventions for MAT is eccentric exercise training. Studies of eccentric exercises have been very favorable, and the exercises can be taught during routine PT sessions.19-22 Modalities such as ultrasound therapy and extracorporeal shock wave therapy (ESWT) have also been studied. But because results have been inconsistent, they are generally reserved for treatment-refractory cases.23
In patients with no contraindications, NSAIDs may be a good choice for pain management with relatively favorable results in the literature.24 Corticosteroid injections should not be used, as they have been directly linked to rupture of the Achilles tendon.23
Other interventions, such as plasma-rich protein injections and prolotherapy—a technique in which an irritant is injected into the tendon in an attempt to create an inflammatory reaction, thus increasing local blood flow and healing—are being studied for the treatment of AT, but are not routinely used or covered by insurance for this purpose. Surgical intervention may be considered for patients whose symptoms last for more than 3 to 6 months despite conservative treatment.
Insertional Achilles tendinopathy (IAT) can be clinically differentiated from MAT by the location of symptoms and tenderness to palpation at the insertion site of the Achilles into the calcaneous. Like MAT, IAT is exacerbated by activity. Other conditions that may contribute to, or be mistaken for, IAT are a Haglund deformity and retrocalcaneal bursitis.
Treatment: Footwear modification. Treatment of IAT, like that of MAT, is primarily conservative. Orthotics or heel lifts are commonly used. However, there is greater emphasis on footwear modification due to the mechanical irritation and resultant posterior heel swelling often associated with IAT. While eccentric exercises play a role in IAT treatment, the benefits are limited.25
As with MAT, corticosteroid injections are contraindicated due to the risk of tendon rupture. Modalities such as ultrasound, ESWT, plasma-rich protein, and prolotherapy lack sufficient evidence to be widely recommended.
For refractory cases of IAT, surgical intervention often relieves the pain.
Return to running. After an initial rest of 2 to 4 weeks, patients may return to running while completing therapy. It’s not necessary to wait until the patient is completely pain free, but pain should be used to guide decisions about intensity and duration of activity.
CASE When Jim returns 6 weeks later, he reports that he took 3 weeks off from running because of the pain. Initially, he used contrast baths daily, Jim says, but now he uses them only when he is symptomatic, and he discontinued the NSAID a few weeks ago. Jim tells you he went to the local running store for a new pair of running shoes and that he is now able to run at his previous pace while remaining relatively pain free.
CORRESPONDENCE Jessica Favero Butts, MD, One American Square, Suite 185, Indianapolis, IN 46282; [email protected]
1. Sporting Goods Manufacturers Association (SGMA) 2010 Sports & Fitness Participation Report. Silver Spring, Md: SGMA; 2011.
2. Tuan K, Wu S, Sennett B. Stress fractures in athletes: risk fractures, diagnosis, and management. Orthopedics. 2004;27:583-593.
3. Wapner KL, Parekh SG. Heel pain. In: DeLee J, Drez D, Miller M, eds. DeLee and Drez’s Orthopaedic Sports Medicine. 3rd ed. Philadelphia, Pa: Saunders; 2010:2030–2056.
4. Lysholm J, Wiklander J. Injuries in runners. Am J Sports Med. 1987;15:168-171.
5. Guyton G, Gomez L, Mann R. Entrapment neuropathies of the foot. In: DeLee J, Drez D, Miller M, eds. DeLee and Drez’s Orthopaedic Sports Medicine. 3rd ed. Philadelphia, Pa: Saunders; 2010:2057–2063.
6. Kang JH, Chen MD, Chen SC, et al. Correlations between subjective treatment responses and plantar pressure parameters of metatarsal pad treatment in metatarsalgia patients: a prospective study. BMC Musculoskelet Disord. 2006;7:95.-
7. MacLean CL, van Emmerik R, Hamill J. Influence of custom foot orthotic intervention on lower extremity intralimb coupling during a 30-minute run. J Appl Biomech. 2010;26:390-399.
8. MacLean CL, Davis IS, Hamill J. Short- and long-term influences of a custom foot orthotic intervention on lower extremity dynamics. Clin J Sport Med. 2008;18:338-343.
9. Bishop M, Fiolkowski P, Conrad B, et al. Athletic footwear, leg stiffness, and running kinematics. J Athl Train. 2006;41:387-392.
10. Burd TA, Hughes MS, Anglen JO. Heterotopic ossification prophylaxis with indomethacin increases the risk of long-bone nonunion. J Bone Joint Surg Br. 2003;85:700-705.
11. Butcher CK, Marsh DR. Nonsteroidal anti-inflammatory drugs delay tibial fracture union. Injury. 1996;27:375.-
12. Yates JE, Shah SH. Do NSAIDS impede fracture healing? J Fam Pract. 2011;60:41-42.
13. Hyland M, Webber-Gaffney A, Cohen L. Randomized controlled trial of calcaneal taping, sham taping, and plantar fascia stretching for the short-term management of plantar heel pain. J Orthop Sports Phys Ther. 2006;36:364-371.
14. Powell M, Post WR, Keener J, et al. Effective treatment of chronic plantar fasciitis with dorsiflexion night splints: a crossover prospective randomized outcome study. Foot Ankle Int. 1998;19:10-18.
15. Baldassin V, Gomes CR, Beraldo PS. Effectiveness of prefabricated and customized foot orthoses made from low-cost foam for noncomplicated plantar fasciitis: a randomized controlled trial. Arch Phys Med Rehabil. 2009;90:701-706.
16. Rompe JD, Furia J, Weil L, et al. Shock wave therapy for chronic plantar fasciopathy. Br Med Bull. 2007;81-82:183-208.
17. Kleinman M, Gross AF. Achilles tendon rupture following steroid injection. Report of three cases. J Bone Joint Surg Am. 1983;65:1345-1347.
18. Hamilton B, Remedios D, Loosemore M, et al. Achilles tendon rupture in an elite athlete following multiple injection therapies. J Sci Med Sport. 2008;11:566-568.
19. Wasielewski NJ, Kotsko KM. Does eccentric exercise reduce pain and improve strength in physically active adults with symptomatic lower extremity tendinosis? A systematic review. J Athl Train. 2007;42:409-421.
20. Kingma JJ, de Knikker R, Wittink HM, et al. Eccentric overload training in patients with chronic Achilles tendinopathy: a systematic review. Br J Sports Med. 2007;41:e3.-
21. Norregaard J, Larsen CC, Bieler T, et al. Eccentric exercise in treatment of Achilles tendinopathy. Scand J Med Sci Sports. 2007;17:133-138.
22. Roos EM, Engstrom M, Lagerquist A, et al. Clinical improvement after 6 weeks of eccentric exercise in patients with mid-portion Achilles tendinopathy – a randomized trial with 1-year follow-up. Scand J Med Sci Sports. 2004;14:286-295.
23. Magnusse RA, Dunn WR, Thompson AB. Nonoperative treatment of midportion Achilles tendinopathy: a systematic review. Clin J Sports Med. 2009;19:54-64.
24. McShane JM, Ostick B, McCabe F. Noninsertional Achilles tendinopathy: pathology and management. Curr Sports Med Rep. 2007;6:288-292.
25. Fahlstrom M, Jonsson P, Lorentzon R, et al. Chronic Achilles tendon pain treated with eccentric calf-muscle training. Knee Surg Sports Traumatol Arthrosc. 2003;11:327-333.
26. Lesho EP. Can tuning forks replace bone scans for identification of tibial stress fractures? Mil Med. 1997;162:802-803.
27. Clinghan R, Arnold GP, Drew TS, et al. Do you get value for money when you buy an expensive pair of running shoes? Br J Sports Med. 2008;42:189-193.
28. Butler RJ, Davis IS, Hamill J. Interaction of arch type and footwear on running mechanics. Am J Sports Med. 2006;34:1998-2005.
29. Divert C, Mornieux G, Freychat P, et al. Barefoot-shot running differences: shoe or mass effect? Int J Sports Med. 2008;29:512-518.
30. Taunton JE, Ryan MB, Clement DB, et al. A prospective study of running injuries: the Vancouver Sun Run “In Training” clinics. Br J Sports Med. 2003;37:239-244.
31. Verdejo R, Mills NJ. Heel-shoe interactions and the durability of EVA foam running-shoe midsoles. J Biomech. 2004;37:1379-1386.
32. Winemiller MH, Billow RG, Laskowski ER, et al. Effect of magnetic vs sham-magnetic insoles on nonspecific foot pain in the workplace: a randomized, double-blind, placebo-controlled trial. Mayo Clin Proc. 2005;80:1138-1145.
33. Logan K. Stress fractures in the adolescent athlete. Pediatr Ann. 2007;36:738-745.
34. Thein-Nissenbaum JM, Carr KE. Female athlete triad syndrome in the high school athlete. Phys Ther Sport. 2011;12:108-116.
35. Umans H. Imaging sports medicine injuries of the foot and toes. Clin Sports Med. 2006;25:763-780.
36. Vorlat P, Achtergael W, Haentjens P. Predictors of outcome of non-displaced fractures of the base of the fifth metatarsal. Int Orthop. 2007;31:5-10.
37. Dyck D, Boyajian-O’Neill L. Plantar fasciitis. Clin J Sports Med. 2004;14:305-309.
38. Alfredson H, Thorsen K, Lorentzon R. In situ microdialysis in tendon tissue: high levels of glutamate, but not prostaglandin E2 in chronic Achilles tendon pain. Knee Surg Sports Traumatol Arthrosc. 1999;7:378-381.
39. Seligman DA, Dawson DR. Customized heel pads and soft orthotics to treat heel pain and plantar fasciitis. Arch Phys Med Rehab. 2003;84:1564-1567.
• Advise patients with metatarsalgia to use metatarsal pads, consider orthotics, use contrast baths, and avoid high heels and pointy-toed shoes. C
• Recommend that runners with stress fractures of the foot have at least 4 weeks of rest before a gradual return to activity. C
• Consider short-term physical therapy for patients with plantar fasciitis to enable them to learn proper stretching and strengthening techniques. C
Strength of recommendation (SOR)
A Good-quality patient-oriented evidence
B Inconsistent or limited-quality patient-oriented evidence
C Consensus, usual practice, opinion, disease-oriented evidence, case series
CASE Jim F, 40 years old and overweight (BMI=28 kg/m2), has come to see you because of foot pain that began shortly after he took up running. Jim tells you that turning 40 was “an eye opener” that prompted him to “get healthy.” He says that while he was a competitive athlete in high school, he never ran regularly—until he embarked on a running program 3 months ago.
Jim denies acute injury, bruising, swelling, redness, fever, or chills, but states that the pain, which he describes as dull and achy, is gradually getting worse. It hurts the most when he stands for long periods of time. He says that he occasionally takes ibuprofen for the foot pain, but has not tried icing or stretching. When you ask him what kind of sneakers he wears during his runs, Jim reports that his running shoes—purchased at a discount store—are about 5 years old.
Participation in running has grown by more than 40% in the United States in the past decade.1 As a result, patients like Jim are bound to have their share of aches, pains, and injuries that prompt them to visit their family physician. And that’s where this review can help. This rundown of the most common foot pain diagnoses, as well as the at-a-glance summaries of the differential diagnosis (TABLE 1)2-5 and treatment options (TABLE 2),3,6-25 can help you quickly get patients the relief they need to return to running.
TABLE 1
Differential diagnosis for runners’ foot pain2-5
| Symptom | Differential diagnosis |
|---|---|
| Foot pain |
|
| Heel pain |
|
| *Represents a more common diagnosis. | |
TABLE 2
Diagnosing and treating common runners’ injuries
| Diagnosis | History | Physical exam | Interventions |
|---|---|---|---|
| Metatarsalgia | Plantar foot pain, insidious onset; occasional swelling, bruising, or deformity | Tenderness of MT heads; possible edema or hyperkeratosis; negative tuning fork test | Footwear: cushioning, wide toe box, MT pads; consider orthotics. Contrast baths; NSAIDs6-9 |
| Stress fracture | Pain, insidious onset, increasing in intensity and duration | Localized TTP; possible swelling or bruising; positive tuning fork test; X-rays/MRI may be helpful | Boot for minimum of 3-4 weeks, followed by PT for foot/ankle ROM, strength, proprioception Ice, acetaminophen (NSAIDs controversial)10-12 Progressive return to running* |
| Plantar fasciitis | Plantar foot/heel pain, worse with first steps in AM and after prolonged weight-bearing | TTP at medial calcaneal tubercle | Relative rest, NSAIDs, PT for HEP, Graston technique, taping; possible night splinting13-15 Consider ESWT, corticosteroid injection for refractory cases16-18 |
| MAT | Posterior heel/Achilles pain in midportion; insidious onset, increasing in intensity, worse with activity | Tenderness midportion Achilles; possible tendon thickening; warmth, crepitus, nodules | Relative rest; PT for eccentric exercises; heel lift, with or without orthotics19-22 Consider PRP, prolotherapy, ESWT, or ultrasound in refractory cases†23,24 Surgical intervention rarely indicated3 |
| IAT | Posterior heel/Achilles pain in insertion of Achilles; insidious onset, increasing in intensity; swelling possible; worse with activity | Tenderness with or without swelling; deformity at Achilles insertion | Relative rest; footwear modification (heel lift, possibly with orthotics); PT for eccentric exercises, though less valuable than for MAT†25 |
| *Starting with cross-training exercise, progressing to running on a treadmill, then to running outdoors. †Corticosteroid injection contraindicated. ESWT, extracorporeal shock wave therapy; HEP, home exercise program; IAT, insertional Achilles tendinopathy; MAT, midportion Achilles tendinopathy; MRI, magnetic resonance imaging; MT, metatarsal; NSAIDs, nonsteroidal anti-inflammatory drugs; PRP, plasma-rich protein; PT, physical therapy; ROM, range of motion; TTP, tenderness to palpation. | |||
Metatarsalgia: Pain on the plantar surface
Typically associated with a recent increase in activity or change in footwear, metatarsalgia is defined by pain on the plantar surface of the forefoot in the area of the metatarsal heads. The second, third, and fourth metatarsals are the most common offenders, and the pain may or may not be accompanied by swelling, bruising, or deformity.
Mechanical irregularities in the foot are thought to contribute to the development of metatarsalgia, which is typically inflammatory in nature. Physical exam often reveals tenderness at the affected metatarsal heads, with or without pain in the corresponding metatarsophalangeal joint, and occasionally, with overlying edema or hyperkeratosis.
Tuning fork test. Commonly used but weakly supported, this diagnostic test is performed by applying a vibrating tuning fork to a site of possible fracture. If the maneuver produces focal pain, the test is positive and may be helpful in ruling in metatarsal stress fractures.26
Treatment: Change shoes, consider NSAIDs. Treatment for metatarsalgia begins conservatively, with a change in footwear. High heels or pointy-toed shoes should be avoided, and metatarsal pads (FIGURE 1) can be placed inside the shoes to help off-load the metatarsal head.6 The pads come prefabricated or can be custom made, and are typically placed by physical therapists to ensure proper placement. Orthotics should also be considered, as they can help normalize abnormal foot mechanics that may contribute to metatarsalgia.7,8 (See “A word about runners’ footwear”.9,27-31)
Metatarsalgia is believed to be an inflammatory process, and NSAIDs may be helpful. Contrast baths—alternately submerging the affected foot in a basin of hot (but not scalding) water for 1 to 2 minutes, then immersing it in cold water for 30 to 60 seconds and repeating the process for about 20 minutes once or twice daily—may be helpful. Magnetic insoles are not recommended, as they have been found to be no better than sham insoles.32 Rarely, surgical repair of underlying mechanical abnormalities is indicated for treatment of refractory metatarsalgia.
CASE On examination, Jim F has no swelling, but some hyperkeratosis overlying the second and third metatarsal heads. He has tenderness to palpation at these heads as well as the corresponding metatarsophalangeal joints, and a negative tuning fork test.
You advise Jim that he has metatarsalgia, educate him about the pathophysiology of this condition, and give him a prescription for a nonsteroidal anti-inflammatory drug. You suggest he use contrast baths—and explain how this is done—once or twice a day and refer him to physical therapy for proper placement of metatarsal pads in his shoes, and schedule an appointment for a 6-week follow-up.
Return to running. There is no firm recommendation regarding abstaining from running with metatarsalgia. Advise patients to use pain as a guide in determining the intensity and duration of activity.
FIGURE 1
Treatment for metatarsalgia is conservative
In addition to changing to more comfortable footwear, patients with metatarsalgia can place metatarsal pads like the one shown here in their shoes to ease the metatarsal load.
The proper footwear for runners is subject to considerable debate, with arguments supported by contradictory evidence. What is known, however, is that running shoes should:
- be a comfortable fit with cushioning chosen to accommodate arch type
- be replaced after running 300 to 500 miles or every 12 months, whichever comes first27,28
- be purchased from a sporting goods or running store, rather than at a discount retailer. That’s because the shoes sold at discount stores are often older, and breakdown of the protective cushioning is more likely to have occurred prior to purchase.28
The most expensive shoe is not automatically the best choice for the runner, however. Some studies have found no benefit in foot strike pressures with expensive cushioned running shoes compared with low- or medium-cost brands.29 Shoes should be selected based on comfort, although the patient’s arch type should also be considered when selecting running footwear.30
Barefoot running shoes, designed to simulate barefoot running, are also an option. As with cushioned running shoes, evidence regarding barefoot running is contradictory. Some studies suggest that running mechanics are improved with barefoot running or barefoot running shoes; others have had unfavorable or inconsistent results, indicating a need for further research.9,31
Stress fracture: Tenderness and pain of insidious onset
Stress fractures of the foot (SFF)—overuse injuries also known as fatigue fractures—are common in recreational runners. They are thought to result from microtraumas, which alone are not sufficient to break bone but together overwhelm the bone’s natural ability to remodel and recover over time. SFF are characterized by tenderness and pain of insidious onset, and typically occur when more than one training variable (eg, frequency, duration, and intensity) is changed simultaneously. SFF can also result from a change in exercise mechanics, such as foot strike.
Stress fractures can occur in any bone in the foot, but are most common in the metatarsal bones, specifically the mid or distal portion of the second or third metatarsal, or the tarsal navicular.2,33 On examination, the patient will have tenderness to palpation, often well localized. A positive tuning fork test (see page 647) is highly suggestive of a stress fracture.
Some studies suggest that barefoot running or barefoot running shoes improve running mechanics; other studies have had unfavorable or inconsistent results.
In female runners, stress fractures may be associated with the female athlete triad—osteoporosis or osteopenia, disordered eating (specifically caloric deficiency and low BMI), and amenorrhea. In addition to the major long-term health problems that may result from even one component of the triad, SFF may be a short-term consequence.34
Although SFF is a clinical diagnosis, x-rays—including 3-view plain films of the foot, with the area of concern clearly noted on the order—are recommended. Magnetic resonance imaging may be used for secondary imaging if doubt about the source of the pain remains.35
Of note: Occasionally, a metatarsal stress fracture progresses to a frank fracture, specifically of the metaphyseal-diaphyseal junction of the fifth metatarsal—known as a Jones fracture. This type of fracture has a high rate of malunion or nonunion.36 If there is any suspicion of a fracture in this area, consider a referral to a sports medicine specialist or orthopedic surgeon.
Treatment: Icing, analgesics, and a boot. Standard treatment for SFF includes icing for 15 to 20 minutes up to 3 times a day for a minimum of 72 hours after injury, but may be continued throughout the healing period. Analgesics such as acetaminophen and a walking boot for 3 to 4 weeks, with follow-up at 3 weeks, should also be implemented. Recent evidence suggests that NSAIDs may hinder the bone healing process, and their use in treating SFF is controversial.10-12
Weaning from the boot can begin when the patient is pain free with the boot on, usually by 3 to 4 weeks. Patients often progress quickly from wearing the boot at all times to wearing it only outside of the house, to not wearing it at all. Advise patients who need to walk long distances for a good portion of the day to keep the boot nearby and to put it on if the pain returns.
Once weaning from the boot begins, physical therapy (PT) should be considered to help the patient regain foot and ankle range of motion (ROM), proprioception, and strength. Once he or she learns the exercises, rehabilitation can be accomplished with a home exercise program. Foot deformities, such as pes planus or pes cavus, may indicate a need for orthotics. A well-structured athletic shoe may help to prevent future injury.7,8
Return to running. Once adequate ROM and strength in the foot and ankle are recovered, the patient can begin to resume activity, starting with a low-impact cross-training exercise, such as a stationary bike or elliptical, for a week or 2. A patient who remains pain free can progress from cross-training to running on a treadmill for another week or 2, then gradually switch to outdoor running.
Plantar fasciitis: Heel pain with an insidious onset
Plantar fasciitis is one of the most common causes of heel pain in athletes (primarily runners) and nonathletes alike. Plantar fasciitis may be associated with acute trauma, but is more commonly insidious in onset. The diagnosis is clinical and rarely requires imaging.
Pain associated with plantar fasciitis may be described as sharp and stabbing or dull and aching. It is on the plantar surface of the heel, sometimes radiating to the arch, and may localize to the insertion of the plantar fascia on the medial calcaneal tubercle (FIGURE 2). The pain is typically most severe with the first few steps in the morning or after other periods of prolonged rest. It usually improves after a few steps, but may return later in the day. Plantar fasciitis does not cause paresthesias or other neurologic symptoms, so their presence is suggestive of a different diagnosis, such as nerve entrapment, compartment syndrome, or tarsal tunnel syndrome.3,5
Treatment: It’s multifactorial. NSAIDs are commonly used. Relative rest is recommended, but cross training may be considered to maintain fitness.37 Short-term PT is also recommended to teach the patient proper stretching and strengthening techniques in the form of a home exercise plan. Modalities such as iontophoresis (a system of transdermal delivery of medication with the use of electrical currents), Graston (a form of instrument-assisted soft tissue mobilization), and taping may be incorporated into PT, as well.13
Night splinting may also be used to keep the foot in a dorsiflexed position. A splint can be purchased without a prescription and prevents the plantar fascia from shortening overnight by providing a continuous passive stretch, thus reducing pain with first steps.14
Orthotics may also help to reduce symptom severity and duration, and studies have found no difference in outcomes with prefabricated vs custom-made devices.15 Another treatment to consider, particularly for recalcitrant cases of plantar fasciitis, is extracorporeal shock wave therapy, which has been studied for more than a decade with conflicting results.16 Corticosteroid injection may also be used for treatment-refractory plantar fasciitis, but caution is required, as the injection may increase the risk of rupture of the plantar fascia.17,18
Return to running. There are no set guidelines for when an athlete with plantar fasciitis can return to running. Typically, after 2 to 4 weeks of relative rest and other treatments, the runner can begin to transition from cross-training to treadmill running.
FIGURE 2
Severe pain with first steps of the day
The pain of plantar fasciitis—often most severe first thing in the morning—may localize to the insertion of the plantar fascia on the medial calcaneal tubercle, as shown above.
Achilles tendinopathy: An overuse injury
Achilles tendinopathy (AT) is typically an overuse injury incurred by athletes, although it is sometimes seen in patients who are sedentary and overweight. With a prevalence among runners of approximately 11%, AT is sometimes called the “runners’ disease.”4
Tendinopathy is a more accurate description than tendonitis, as histologic studies of affected Achilles tendons suggest that AT is a degenerative, rather than an inflammatory, condition.38 A diagnosis of AT can be further classified as midportion or insertional.
Midportion Achilles tendinopathy (MAT), characterized by pain that occurs in the body of the Achilles tendon and worsens with activity, is often a clinical diagnosis. Physical findings suggestive of MAT are tenderness to palpation of the midportion of the Achilles tendon, with thickening of the tendon, warmth, crepitus, or palpable nodules in the tendon body. Onset is insidious and is commonly associated with an increase in activity.
Treatment: Orthotics or a heel lift. Like that of plantar fasciitis, treatment of midportion Achilles tendinopathy is primarily conservative. The use of orthotics, or a heel lift, is one of the most cost-effective interventions, and they are widely used, despite limited evidence of efficacy.39 Custom orthotics are costly, and patients often benefit from trying prefabricated orthotics first to determine whether they will help.
Eccentric exercises. One of the most studied interventions for MAT is eccentric exercise training. Studies of eccentric exercises have been very favorable, and the exercises can be taught during routine PT sessions.19-22 Modalities such as ultrasound therapy and extracorporeal shock wave therapy (ESWT) have also been studied. But because results have been inconsistent, they are generally reserved for treatment-refractory cases.23
In patients with no contraindications, NSAIDs may be a good choice for pain management with relatively favorable results in the literature.24 Corticosteroid injections should not be used, as they have been directly linked to rupture of the Achilles tendon.23
Other interventions, such as plasma-rich protein injections and prolotherapy—a technique in which an irritant is injected into the tendon in an attempt to create an inflammatory reaction, thus increasing local blood flow and healing—are being studied for the treatment of AT, but are not routinely used or covered by insurance for this purpose. Surgical intervention may be considered for patients whose symptoms last for more than 3 to 6 months despite conservative treatment.
Insertional Achilles tendinopathy (IAT) can be clinically differentiated from MAT by the location of symptoms and tenderness to palpation at the insertion site of the Achilles into the calcaneous. Like MAT, IAT is exacerbated by activity. Other conditions that may contribute to, or be mistaken for, IAT are a Haglund deformity and retrocalcaneal bursitis.
Treatment: Footwear modification. Treatment of IAT, like that of MAT, is primarily conservative. Orthotics or heel lifts are commonly used. However, there is greater emphasis on footwear modification due to the mechanical irritation and resultant posterior heel swelling often associated with IAT. While eccentric exercises play a role in IAT treatment, the benefits are limited.25
As with MAT, corticosteroid injections are contraindicated due to the risk of tendon rupture. Modalities such as ultrasound, ESWT, plasma-rich protein, and prolotherapy lack sufficient evidence to be widely recommended.
For refractory cases of IAT, surgical intervention often relieves the pain.
Return to running. After an initial rest of 2 to 4 weeks, patients may return to running while completing therapy. It’s not necessary to wait until the patient is completely pain free, but pain should be used to guide decisions about intensity and duration of activity.
CASE When Jim returns 6 weeks later, he reports that he took 3 weeks off from running because of the pain. Initially, he used contrast baths daily, Jim says, but now he uses them only when he is symptomatic, and he discontinued the NSAID a few weeks ago. Jim tells you he went to the local running store for a new pair of running shoes and that he is now able to run at his previous pace while remaining relatively pain free.
CORRESPONDENCE Jessica Favero Butts, MD, One American Square, Suite 185, Indianapolis, IN 46282; [email protected]
• Advise patients with metatarsalgia to use metatarsal pads, consider orthotics, use contrast baths, and avoid high heels and pointy-toed shoes. C
• Recommend that runners with stress fractures of the foot have at least 4 weeks of rest before a gradual return to activity. C
• Consider short-term physical therapy for patients with plantar fasciitis to enable them to learn proper stretching and strengthening techniques. C
Strength of recommendation (SOR)
A Good-quality patient-oriented evidence
B Inconsistent or limited-quality patient-oriented evidence
C Consensus, usual practice, opinion, disease-oriented evidence, case series
CASE Jim F, 40 years old and overweight (BMI=28 kg/m2), has come to see you because of foot pain that began shortly after he took up running. Jim tells you that turning 40 was “an eye opener” that prompted him to “get healthy.” He says that while he was a competitive athlete in high school, he never ran regularly—until he embarked on a running program 3 months ago.
Jim denies acute injury, bruising, swelling, redness, fever, or chills, but states that the pain, which he describes as dull and achy, is gradually getting worse. It hurts the most when he stands for long periods of time. He says that he occasionally takes ibuprofen for the foot pain, but has not tried icing or stretching. When you ask him what kind of sneakers he wears during his runs, Jim reports that his running shoes—purchased at a discount store—are about 5 years old.
Participation in running has grown by more than 40% in the United States in the past decade.1 As a result, patients like Jim are bound to have their share of aches, pains, and injuries that prompt them to visit their family physician. And that’s where this review can help. This rundown of the most common foot pain diagnoses, as well as the at-a-glance summaries of the differential diagnosis (TABLE 1)2-5 and treatment options (TABLE 2),3,6-25 can help you quickly get patients the relief they need to return to running.
TABLE 1
Differential diagnosis for runners’ foot pain2-5
| Symptom | Differential diagnosis |
|---|---|
| Foot pain |
|
| Heel pain |
|
| *Represents a more common diagnosis. | |
TABLE 2
Diagnosing and treating common runners’ injuries
| Diagnosis | History | Physical exam | Interventions |
|---|---|---|---|
| Metatarsalgia | Plantar foot pain, insidious onset; occasional swelling, bruising, or deformity | Tenderness of MT heads; possible edema or hyperkeratosis; negative tuning fork test | Footwear: cushioning, wide toe box, MT pads; consider orthotics. Contrast baths; NSAIDs6-9 |
| Stress fracture | Pain, insidious onset, increasing in intensity and duration | Localized TTP; possible swelling or bruising; positive tuning fork test; X-rays/MRI may be helpful | Boot for minimum of 3-4 weeks, followed by PT for foot/ankle ROM, strength, proprioception Ice, acetaminophen (NSAIDs controversial)10-12 Progressive return to running* |
| Plantar fasciitis | Plantar foot/heel pain, worse with first steps in AM and after prolonged weight-bearing | TTP at medial calcaneal tubercle | Relative rest, NSAIDs, PT for HEP, Graston technique, taping; possible night splinting13-15 Consider ESWT, corticosteroid injection for refractory cases16-18 |
| MAT | Posterior heel/Achilles pain in midportion; insidious onset, increasing in intensity, worse with activity | Tenderness midportion Achilles; possible tendon thickening; warmth, crepitus, nodules | Relative rest; PT for eccentric exercises; heel lift, with or without orthotics19-22 Consider PRP, prolotherapy, ESWT, or ultrasound in refractory cases†23,24 Surgical intervention rarely indicated3 |
| IAT | Posterior heel/Achilles pain in insertion of Achilles; insidious onset, increasing in intensity; swelling possible; worse with activity | Tenderness with or without swelling; deformity at Achilles insertion | Relative rest; footwear modification (heel lift, possibly with orthotics); PT for eccentric exercises, though less valuable than for MAT†25 |
| *Starting with cross-training exercise, progressing to running on a treadmill, then to running outdoors. †Corticosteroid injection contraindicated. ESWT, extracorporeal shock wave therapy; HEP, home exercise program; IAT, insertional Achilles tendinopathy; MAT, midportion Achilles tendinopathy; MRI, magnetic resonance imaging; MT, metatarsal; NSAIDs, nonsteroidal anti-inflammatory drugs; PRP, plasma-rich protein; PT, physical therapy; ROM, range of motion; TTP, tenderness to palpation. | |||
Metatarsalgia: Pain on the plantar surface
Typically associated with a recent increase in activity or change in footwear, metatarsalgia is defined by pain on the plantar surface of the forefoot in the area of the metatarsal heads. The second, third, and fourth metatarsals are the most common offenders, and the pain may or may not be accompanied by swelling, bruising, or deformity.
Mechanical irregularities in the foot are thought to contribute to the development of metatarsalgia, which is typically inflammatory in nature. Physical exam often reveals tenderness at the affected metatarsal heads, with or without pain in the corresponding metatarsophalangeal joint, and occasionally, with overlying edema or hyperkeratosis.
Tuning fork test. Commonly used but weakly supported, this diagnostic test is performed by applying a vibrating tuning fork to a site of possible fracture. If the maneuver produces focal pain, the test is positive and may be helpful in ruling in metatarsal stress fractures.26
Treatment: Change shoes, consider NSAIDs. Treatment for metatarsalgia begins conservatively, with a change in footwear. High heels or pointy-toed shoes should be avoided, and metatarsal pads (FIGURE 1) can be placed inside the shoes to help off-load the metatarsal head.6 The pads come prefabricated or can be custom made, and are typically placed by physical therapists to ensure proper placement. Orthotics should also be considered, as they can help normalize abnormal foot mechanics that may contribute to metatarsalgia.7,8 (See “A word about runners’ footwear”.9,27-31)
Metatarsalgia is believed to be an inflammatory process, and NSAIDs may be helpful. Contrast baths—alternately submerging the affected foot in a basin of hot (but not scalding) water for 1 to 2 minutes, then immersing it in cold water for 30 to 60 seconds and repeating the process for about 20 minutes once or twice daily—may be helpful. Magnetic insoles are not recommended, as they have been found to be no better than sham insoles.32 Rarely, surgical repair of underlying mechanical abnormalities is indicated for treatment of refractory metatarsalgia.
CASE On examination, Jim F has no swelling, but some hyperkeratosis overlying the second and third metatarsal heads. He has tenderness to palpation at these heads as well as the corresponding metatarsophalangeal joints, and a negative tuning fork test.
You advise Jim that he has metatarsalgia, educate him about the pathophysiology of this condition, and give him a prescription for a nonsteroidal anti-inflammatory drug. You suggest he use contrast baths—and explain how this is done—once or twice a day and refer him to physical therapy for proper placement of metatarsal pads in his shoes, and schedule an appointment for a 6-week follow-up.
Return to running. There is no firm recommendation regarding abstaining from running with metatarsalgia. Advise patients to use pain as a guide in determining the intensity and duration of activity.
FIGURE 1
Treatment for metatarsalgia is conservative
In addition to changing to more comfortable footwear, patients with metatarsalgia can place metatarsal pads like the one shown here in their shoes to ease the metatarsal load.
The proper footwear for runners is subject to considerable debate, with arguments supported by contradictory evidence. What is known, however, is that running shoes should:
- be a comfortable fit with cushioning chosen to accommodate arch type
- be replaced after running 300 to 500 miles or every 12 months, whichever comes first27,28
- be purchased from a sporting goods or running store, rather than at a discount retailer. That’s because the shoes sold at discount stores are often older, and breakdown of the protective cushioning is more likely to have occurred prior to purchase.28
The most expensive shoe is not automatically the best choice for the runner, however. Some studies have found no benefit in foot strike pressures with expensive cushioned running shoes compared with low- or medium-cost brands.29 Shoes should be selected based on comfort, although the patient’s arch type should also be considered when selecting running footwear.30
Barefoot running shoes, designed to simulate barefoot running, are also an option. As with cushioned running shoes, evidence regarding barefoot running is contradictory. Some studies suggest that running mechanics are improved with barefoot running or barefoot running shoes; others have had unfavorable or inconsistent results, indicating a need for further research.9,31
Stress fracture: Tenderness and pain of insidious onset
Stress fractures of the foot (SFF)—overuse injuries also known as fatigue fractures—are common in recreational runners. They are thought to result from microtraumas, which alone are not sufficient to break bone but together overwhelm the bone’s natural ability to remodel and recover over time. SFF are characterized by tenderness and pain of insidious onset, and typically occur when more than one training variable (eg, frequency, duration, and intensity) is changed simultaneously. SFF can also result from a change in exercise mechanics, such as foot strike.
Stress fractures can occur in any bone in the foot, but are most common in the metatarsal bones, specifically the mid or distal portion of the second or third metatarsal, or the tarsal navicular.2,33 On examination, the patient will have tenderness to palpation, often well localized. A positive tuning fork test (see page 647) is highly suggestive of a stress fracture.
Some studies suggest that barefoot running or barefoot running shoes improve running mechanics; other studies have had unfavorable or inconsistent results.
In female runners, stress fractures may be associated with the female athlete triad—osteoporosis or osteopenia, disordered eating (specifically caloric deficiency and low BMI), and amenorrhea. In addition to the major long-term health problems that may result from even one component of the triad, SFF may be a short-term consequence.34
Although SFF is a clinical diagnosis, x-rays—including 3-view plain films of the foot, with the area of concern clearly noted on the order—are recommended. Magnetic resonance imaging may be used for secondary imaging if doubt about the source of the pain remains.35
Of note: Occasionally, a metatarsal stress fracture progresses to a frank fracture, specifically of the metaphyseal-diaphyseal junction of the fifth metatarsal—known as a Jones fracture. This type of fracture has a high rate of malunion or nonunion.36 If there is any suspicion of a fracture in this area, consider a referral to a sports medicine specialist or orthopedic surgeon.
Treatment: Icing, analgesics, and a boot. Standard treatment for SFF includes icing for 15 to 20 minutes up to 3 times a day for a minimum of 72 hours after injury, but may be continued throughout the healing period. Analgesics such as acetaminophen and a walking boot for 3 to 4 weeks, with follow-up at 3 weeks, should also be implemented. Recent evidence suggests that NSAIDs may hinder the bone healing process, and their use in treating SFF is controversial.10-12
Weaning from the boot can begin when the patient is pain free with the boot on, usually by 3 to 4 weeks. Patients often progress quickly from wearing the boot at all times to wearing it only outside of the house, to not wearing it at all. Advise patients who need to walk long distances for a good portion of the day to keep the boot nearby and to put it on if the pain returns.
Once weaning from the boot begins, physical therapy (PT) should be considered to help the patient regain foot and ankle range of motion (ROM), proprioception, and strength. Once he or she learns the exercises, rehabilitation can be accomplished with a home exercise program. Foot deformities, such as pes planus or pes cavus, may indicate a need for orthotics. A well-structured athletic shoe may help to prevent future injury.7,8
Return to running. Once adequate ROM and strength in the foot and ankle are recovered, the patient can begin to resume activity, starting with a low-impact cross-training exercise, such as a stationary bike or elliptical, for a week or 2. A patient who remains pain free can progress from cross-training to running on a treadmill for another week or 2, then gradually switch to outdoor running.
Plantar fasciitis: Heel pain with an insidious onset
Plantar fasciitis is one of the most common causes of heel pain in athletes (primarily runners) and nonathletes alike. Plantar fasciitis may be associated with acute trauma, but is more commonly insidious in onset. The diagnosis is clinical and rarely requires imaging.
Pain associated with plantar fasciitis may be described as sharp and stabbing or dull and aching. It is on the plantar surface of the heel, sometimes radiating to the arch, and may localize to the insertion of the plantar fascia on the medial calcaneal tubercle (FIGURE 2). The pain is typically most severe with the first few steps in the morning or after other periods of prolonged rest. It usually improves after a few steps, but may return later in the day. Plantar fasciitis does not cause paresthesias or other neurologic symptoms, so their presence is suggestive of a different diagnosis, such as nerve entrapment, compartment syndrome, or tarsal tunnel syndrome.3,5
Treatment: It’s multifactorial. NSAIDs are commonly used. Relative rest is recommended, but cross training may be considered to maintain fitness.37 Short-term PT is also recommended to teach the patient proper stretching and strengthening techniques in the form of a home exercise plan. Modalities such as iontophoresis (a system of transdermal delivery of medication with the use of electrical currents), Graston (a form of instrument-assisted soft tissue mobilization), and taping may be incorporated into PT, as well.13
Night splinting may also be used to keep the foot in a dorsiflexed position. A splint can be purchased without a prescription and prevents the plantar fascia from shortening overnight by providing a continuous passive stretch, thus reducing pain with first steps.14
Orthotics may also help to reduce symptom severity and duration, and studies have found no difference in outcomes with prefabricated vs custom-made devices.15 Another treatment to consider, particularly for recalcitrant cases of plantar fasciitis, is extracorporeal shock wave therapy, which has been studied for more than a decade with conflicting results.16 Corticosteroid injection may also be used for treatment-refractory plantar fasciitis, but caution is required, as the injection may increase the risk of rupture of the plantar fascia.17,18
Return to running. There are no set guidelines for when an athlete with plantar fasciitis can return to running. Typically, after 2 to 4 weeks of relative rest and other treatments, the runner can begin to transition from cross-training to treadmill running.
FIGURE 2
Severe pain with first steps of the day
The pain of plantar fasciitis—often most severe first thing in the morning—may localize to the insertion of the plantar fascia on the medial calcaneal tubercle, as shown above.
Achilles tendinopathy: An overuse injury
Achilles tendinopathy (AT) is typically an overuse injury incurred by athletes, although it is sometimes seen in patients who are sedentary and overweight. With a prevalence among runners of approximately 11%, AT is sometimes called the “runners’ disease.”4
Tendinopathy is a more accurate description than tendonitis, as histologic studies of affected Achilles tendons suggest that AT is a degenerative, rather than an inflammatory, condition.38 A diagnosis of AT can be further classified as midportion or insertional.
Midportion Achilles tendinopathy (MAT), characterized by pain that occurs in the body of the Achilles tendon and worsens with activity, is often a clinical diagnosis. Physical findings suggestive of MAT are tenderness to palpation of the midportion of the Achilles tendon, with thickening of the tendon, warmth, crepitus, or palpable nodules in the tendon body. Onset is insidious and is commonly associated with an increase in activity.
Treatment: Orthotics or a heel lift. Like that of plantar fasciitis, treatment of midportion Achilles tendinopathy is primarily conservative. The use of orthotics, or a heel lift, is one of the most cost-effective interventions, and they are widely used, despite limited evidence of efficacy.39 Custom orthotics are costly, and patients often benefit from trying prefabricated orthotics first to determine whether they will help.
Eccentric exercises. One of the most studied interventions for MAT is eccentric exercise training. Studies of eccentric exercises have been very favorable, and the exercises can be taught during routine PT sessions.19-22 Modalities such as ultrasound therapy and extracorporeal shock wave therapy (ESWT) have also been studied. But because results have been inconsistent, they are generally reserved for treatment-refractory cases.23
In patients with no contraindications, NSAIDs may be a good choice for pain management with relatively favorable results in the literature.24 Corticosteroid injections should not be used, as they have been directly linked to rupture of the Achilles tendon.23
Other interventions, such as plasma-rich protein injections and prolotherapy—a technique in which an irritant is injected into the tendon in an attempt to create an inflammatory reaction, thus increasing local blood flow and healing—are being studied for the treatment of AT, but are not routinely used or covered by insurance for this purpose. Surgical intervention may be considered for patients whose symptoms last for more than 3 to 6 months despite conservative treatment.
Insertional Achilles tendinopathy (IAT) can be clinically differentiated from MAT by the location of symptoms and tenderness to palpation at the insertion site of the Achilles into the calcaneous. Like MAT, IAT is exacerbated by activity. Other conditions that may contribute to, or be mistaken for, IAT are a Haglund deformity and retrocalcaneal bursitis.
Treatment: Footwear modification. Treatment of IAT, like that of MAT, is primarily conservative. Orthotics or heel lifts are commonly used. However, there is greater emphasis on footwear modification due to the mechanical irritation and resultant posterior heel swelling often associated with IAT. While eccentric exercises play a role in IAT treatment, the benefits are limited.25
As with MAT, corticosteroid injections are contraindicated due to the risk of tendon rupture. Modalities such as ultrasound, ESWT, plasma-rich protein, and prolotherapy lack sufficient evidence to be widely recommended.
For refractory cases of IAT, surgical intervention often relieves the pain.
Return to running. After an initial rest of 2 to 4 weeks, patients may return to running while completing therapy. It’s not necessary to wait until the patient is completely pain free, but pain should be used to guide decisions about intensity and duration of activity.
CASE When Jim returns 6 weeks later, he reports that he took 3 weeks off from running because of the pain. Initially, he used contrast baths daily, Jim says, but now he uses them only when he is symptomatic, and he discontinued the NSAID a few weeks ago. Jim tells you he went to the local running store for a new pair of running shoes and that he is now able to run at his previous pace while remaining relatively pain free.
CORRESPONDENCE Jessica Favero Butts, MD, One American Square, Suite 185, Indianapolis, IN 46282; [email protected]
1. Sporting Goods Manufacturers Association (SGMA) 2010 Sports & Fitness Participation Report. Silver Spring, Md: SGMA; 2011.
2. Tuan K, Wu S, Sennett B. Stress fractures in athletes: risk fractures, diagnosis, and management. Orthopedics. 2004;27:583-593.
3. Wapner KL, Parekh SG. Heel pain. In: DeLee J, Drez D, Miller M, eds. DeLee and Drez’s Orthopaedic Sports Medicine. 3rd ed. Philadelphia, Pa: Saunders; 2010:2030–2056.
4. Lysholm J, Wiklander J. Injuries in runners. Am J Sports Med. 1987;15:168-171.
5. Guyton G, Gomez L, Mann R. Entrapment neuropathies of the foot. In: DeLee J, Drez D, Miller M, eds. DeLee and Drez’s Orthopaedic Sports Medicine. 3rd ed. Philadelphia, Pa: Saunders; 2010:2057–2063.
6. Kang JH, Chen MD, Chen SC, et al. Correlations between subjective treatment responses and plantar pressure parameters of metatarsal pad treatment in metatarsalgia patients: a prospective study. BMC Musculoskelet Disord. 2006;7:95.-
7. MacLean CL, van Emmerik R, Hamill J. Influence of custom foot orthotic intervention on lower extremity intralimb coupling during a 30-minute run. J Appl Biomech. 2010;26:390-399.
8. MacLean CL, Davis IS, Hamill J. Short- and long-term influences of a custom foot orthotic intervention on lower extremity dynamics. Clin J Sport Med. 2008;18:338-343.
9. Bishop M, Fiolkowski P, Conrad B, et al. Athletic footwear, leg stiffness, and running kinematics. J Athl Train. 2006;41:387-392.
10. Burd TA, Hughes MS, Anglen JO. Heterotopic ossification prophylaxis with indomethacin increases the risk of long-bone nonunion. J Bone Joint Surg Br. 2003;85:700-705.
11. Butcher CK, Marsh DR. Nonsteroidal anti-inflammatory drugs delay tibial fracture union. Injury. 1996;27:375.-
12. Yates JE, Shah SH. Do NSAIDS impede fracture healing? J Fam Pract. 2011;60:41-42.
13. Hyland M, Webber-Gaffney A, Cohen L. Randomized controlled trial of calcaneal taping, sham taping, and plantar fascia stretching for the short-term management of plantar heel pain. J Orthop Sports Phys Ther. 2006;36:364-371.
14. Powell M, Post WR, Keener J, et al. Effective treatment of chronic plantar fasciitis with dorsiflexion night splints: a crossover prospective randomized outcome study. Foot Ankle Int. 1998;19:10-18.
15. Baldassin V, Gomes CR, Beraldo PS. Effectiveness of prefabricated and customized foot orthoses made from low-cost foam for noncomplicated plantar fasciitis: a randomized controlled trial. Arch Phys Med Rehabil. 2009;90:701-706.
16. Rompe JD, Furia J, Weil L, et al. Shock wave therapy for chronic plantar fasciopathy. Br Med Bull. 2007;81-82:183-208.
17. Kleinman M, Gross AF. Achilles tendon rupture following steroid injection. Report of three cases. J Bone Joint Surg Am. 1983;65:1345-1347.
18. Hamilton B, Remedios D, Loosemore M, et al. Achilles tendon rupture in an elite athlete following multiple injection therapies. J Sci Med Sport. 2008;11:566-568.
19. Wasielewski NJ, Kotsko KM. Does eccentric exercise reduce pain and improve strength in physically active adults with symptomatic lower extremity tendinosis? A systematic review. J Athl Train. 2007;42:409-421.
20. Kingma JJ, de Knikker R, Wittink HM, et al. Eccentric overload training in patients with chronic Achilles tendinopathy: a systematic review. Br J Sports Med. 2007;41:e3.-
21. Norregaard J, Larsen CC, Bieler T, et al. Eccentric exercise in treatment of Achilles tendinopathy. Scand J Med Sci Sports. 2007;17:133-138.
22. Roos EM, Engstrom M, Lagerquist A, et al. Clinical improvement after 6 weeks of eccentric exercise in patients with mid-portion Achilles tendinopathy – a randomized trial with 1-year follow-up. Scand J Med Sci Sports. 2004;14:286-295.
23. Magnusse RA, Dunn WR, Thompson AB. Nonoperative treatment of midportion Achilles tendinopathy: a systematic review. Clin J Sports Med. 2009;19:54-64.
24. McShane JM, Ostick B, McCabe F. Noninsertional Achilles tendinopathy: pathology and management. Curr Sports Med Rep. 2007;6:288-292.
25. Fahlstrom M, Jonsson P, Lorentzon R, et al. Chronic Achilles tendon pain treated with eccentric calf-muscle training. Knee Surg Sports Traumatol Arthrosc. 2003;11:327-333.
26. Lesho EP. Can tuning forks replace bone scans for identification of tibial stress fractures? Mil Med. 1997;162:802-803.
27. Clinghan R, Arnold GP, Drew TS, et al. Do you get value for money when you buy an expensive pair of running shoes? Br J Sports Med. 2008;42:189-193.
28. Butler RJ, Davis IS, Hamill J. Interaction of arch type and footwear on running mechanics. Am J Sports Med. 2006;34:1998-2005.
29. Divert C, Mornieux G, Freychat P, et al. Barefoot-shot running differences: shoe or mass effect? Int J Sports Med. 2008;29:512-518.
30. Taunton JE, Ryan MB, Clement DB, et al. A prospective study of running injuries: the Vancouver Sun Run “In Training” clinics. Br J Sports Med. 2003;37:239-244.
31. Verdejo R, Mills NJ. Heel-shoe interactions and the durability of EVA foam running-shoe midsoles. J Biomech. 2004;37:1379-1386.
32. Winemiller MH, Billow RG, Laskowski ER, et al. Effect of magnetic vs sham-magnetic insoles on nonspecific foot pain in the workplace: a randomized, double-blind, placebo-controlled trial. Mayo Clin Proc. 2005;80:1138-1145.
33. Logan K. Stress fractures in the adolescent athlete. Pediatr Ann. 2007;36:738-745.
34. Thein-Nissenbaum JM, Carr KE. Female athlete triad syndrome in the high school athlete. Phys Ther Sport. 2011;12:108-116.
35. Umans H. Imaging sports medicine injuries of the foot and toes. Clin Sports Med. 2006;25:763-780.
36. Vorlat P, Achtergael W, Haentjens P. Predictors of outcome of non-displaced fractures of the base of the fifth metatarsal. Int Orthop. 2007;31:5-10.
37. Dyck D, Boyajian-O’Neill L. Plantar fasciitis. Clin J Sports Med. 2004;14:305-309.
38. Alfredson H, Thorsen K, Lorentzon R. In situ microdialysis in tendon tissue: high levels of glutamate, but not prostaglandin E2 in chronic Achilles tendon pain. Knee Surg Sports Traumatol Arthrosc. 1999;7:378-381.
39. Seligman DA, Dawson DR. Customized heel pads and soft orthotics to treat heel pain and plantar fasciitis. Arch Phys Med Rehab. 2003;84:1564-1567.
1. Sporting Goods Manufacturers Association (SGMA) 2010 Sports & Fitness Participation Report. Silver Spring, Md: SGMA; 2011.
2. Tuan K, Wu S, Sennett B. Stress fractures in athletes: risk fractures, diagnosis, and management. Orthopedics. 2004;27:583-593.
3. Wapner KL, Parekh SG. Heel pain. In: DeLee J, Drez D, Miller M, eds. DeLee and Drez’s Orthopaedic Sports Medicine. 3rd ed. Philadelphia, Pa: Saunders; 2010:2030–2056.
4. Lysholm J, Wiklander J. Injuries in runners. Am J Sports Med. 1987;15:168-171.
5. Guyton G, Gomez L, Mann R. Entrapment neuropathies of the foot. In: DeLee J, Drez D, Miller M, eds. DeLee and Drez’s Orthopaedic Sports Medicine. 3rd ed. Philadelphia, Pa: Saunders; 2010:2057–2063.
6. Kang JH, Chen MD, Chen SC, et al. Correlations between subjective treatment responses and plantar pressure parameters of metatarsal pad treatment in metatarsalgia patients: a prospective study. BMC Musculoskelet Disord. 2006;7:95.-
7. MacLean CL, van Emmerik R, Hamill J. Influence of custom foot orthotic intervention on lower extremity intralimb coupling during a 30-minute run. J Appl Biomech. 2010;26:390-399.
8. MacLean CL, Davis IS, Hamill J. Short- and long-term influences of a custom foot orthotic intervention on lower extremity dynamics. Clin J Sport Med. 2008;18:338-343.
9. Bishop M, Fiolkowski P, Conrad B, et al. Athletic footwear, leg stiffness, and running kinematics. J Athl Train. 2006;41:387-392.
10. Burd TA, Hughes MS, Anglen JO. Heterotopic ossification prophylaxis with indomethacin increases the risk of long-bone nonunion. J Bone Joint Surg Br. 2003;85:700-705.
11. Butcher CK, Marsh DR. Nonsteroidal anti-inflammatory drugs delay tibial fracture union. Injury. 1996;27:375.-
12. Yates JE, Shah SH. Do NSAIDS impede fracture healing? J Fam Pract. 2011;60:41-42.
13. Hyland M, Webber-Gaffney A, Cohen L. Randomized controlled trial of calcaneal taping, sham taping, and plantar fascia stretching for the short-term management of plantar heel pain. J Orthop Sports Phys Ther. 2006;36:364-371.
14. Powell M, Post WR, Keener J, et al. Effective treatment of chronic plantar fasciitis with dorsiflexion night splints: a crossover prospective randomized outcome study. Foot Ankle Int. 1998;19:10-18.
15. Baldassin V, Gomes CR, Beraldo PS. Effectiveness of prefabricated and customized foot orthoses made from low-cost foam for noncomplicated plantar fasciitis: a randomized controlled trial. Arch Phys Med Rehabil. 2009;90:701-706.
16. Rompe JD, Furia J, Weil L, et al. Shock wave therapy for chronic plantar fasciopathy. Br Med Bull. 2007;81-82:183-208.
17. Kleinman M, Gross AF. Achilles tendon rupture following steroid injection. Report of three cases. J Bone Joint Surg Am. 1983;65:1345-1347.
18. Hamilton B, Remedios D, Loosemore M, et al. Achilles tendon rupture in an elite athlete following multiple injection therapies. J Sci Med Sport. 2008;11:566-568.
19. Wasielewski NJ, Kotsko KM. Does eccentric exercise reduce pain and improve strength in physically active adults with symptomatic lower extremity tendinosis? A systematic review. J Athl Train. 2007;42:409-421.
20. Kingma JJ, de Knikker R, Wittink HM, et al. Eccentric overload training in patients with chronic Achilles tendinopathy: a systematic review. Br J Sports Med. 2007;41:e3.-
21. Norregaard J, Larsen CC, Bieler T, et al. Eccentric exercise in treatment of Achilles tendinopathy. Scand J Med Sci Sports. 2007;17:133-138.
22. Roos EM, Engstrom M, Lagerquist A, et al. Clinical improvement after 6 weeks of eccentric exercise in patients with mid-portion Achilles tendinopathy – a randomized trial with 1-year follow-up. Scand J Med Sci Sports. 2004;14:286-295.
23. Magnusse RA, Dunn WR, Thompson AB. Nonoperative treatment of midportion Achilles tendinopathy: a systematic review. Clin J Sports Med. 2009;19:54-64.
24. McShane JM, Ostick B, McCabe F. Noninsertional Achilles tendinopathy: pathology and management. Curr Sports Med Rep. 2007;6:288-292.
25. Fahlstrom M, Jonsson P, Lorentzon R, et al. Chronic Achilles tendon pain treated with eccentric calf-muscle training. Knee Surg Sports Traumatol Arthrosc. 2003;11:327-333.
26. Lesho EP. Can tuning forks replace bone scans for identification of tibial stress fractures? Mil Med. 1997;162:802-803.
27. Clinghan R, Arnold GP, Drew TS, et al. Do you get value for money when you buy an expensive pair of running shoes? Br J Sports Med. 2008;42:189-193.
28. Butler RJ, Davis IS, Hamill J. Interaction of arch type and footwear on running mechanics. Am J Sports Med. 2006;34:1998-2005.
29. Divert C, Mornieux G, Freychat P, et al. Barefoot-shot running differences: shoe or mass effect? Int J Sports Med. 2008;29:512-518.
30. Taunton JE, Ryan MB, Clement DB, et al. A prospective study of running injuries: the Vancouver Sun Run “In Training” clinics. Br J Sports Med. 2003;37:239-244.
31. Verdejo R, Mills NJ. Heel-shoe interactions and the durability of EVA foam running-shoe midsoles. J Biomech. 2004;37:1379-1386.
32. Winemiller MH, Billow RG, Laskowski ER, et al. Effect of magnetic vs sham-magnetic insoles on nonspecific foot pain in the workplace: a randomized, double-blind, placebo-controlled trial. Mayo Clin Proc. 2005;80:1138-1145.
33. Logan K. Stress fractures in the adolescent athlete. Pediatr Ann. 2007;36:738-745.
34. Thein-Nissenbaum JM, Carr KE. Female athlete triad syndrome in the high school athlete. Phys Ther Sport. 2011;12:108-116.
35. Umans H. Imaging sports medicine injuries of the foot and toes. Clin Sports Med. 2006;25:763-780.
36. Vorlat P, Achtergael W, Haentjens P. Predictors of outcome of non-displaced fractures of the base of the fifth metatarsal. Int Orthop. 2007;31:5-10.
37. Dyck D, Boyajian-O’Neill L. Plantar fasciitis. Clin J Sports Med. 2004;14:305-309.
38. Alfredson H, Thorsen K, Lorentzon R. In situ microdialysis in tendon tissue: high levels of glutamate, but not prostaglandin E2 in chronic Achilles tendon pain. Knee Surg Sports Traumatol Arthrosc. 1999;7:378-381.
39. Seligman DA, Dawson DR. Customized heel pads and soft orthotics to treat heel pain and plantar fasciitis. Arch Phys Med Rehab. 2003;84:1564-1567.
Treatment-resistant OCD: Options beyond first-line medications
Obsessive-compulsive disorder (OCD) is marked by recurrent and persistent anxiety-provoking thoughts (obsessions) accompanied by repetitive behaviors (compulsions) that focus on alleviating distress caused by obsessive thoughts. Although patients recognize the obsessions and compulsions are unreasonable, these thoughts and behaviors remain time-consuming and impair function. Even when they appropriately identify and treat OCD, clinicians often face “treatment-resistant” (or “treatment-refractory”) patients who do not respond adequately to standard therapies (Box).1 Several factors contribute to treatment resistance, including those related to the patient, the environment, the clinician/health system, and pathology (Table 1).2 An estimated 10% to 40% of patients with OCD are treatment-resistant.2
This article discusses the range of options for addressing resistant OCD, including augmenting first-line treatments with pharmacotherapy, psychotherapy, or reversible or irreversible forms of neuromodulation.
Treatment resistance generally refers to lack of sufficient improvement despite multiple adequate and appropriate treatment trials. However, there are no universally accepted definitions or metrics of treatment resistance, and often it is operationally defined. For mood disorders, it may be defined by failure to remit or respond clinically (50% reduction in symptoms) despite ≥2 adequate antidepressant trials or failure to respond clinically despite adequate medication trials across several neurotransmitter classes. The terms treatment resistant and treatment refractory are synonymous; they refer to the same phenomenon and are used interchangeably in the literature. Including the terms “remission” and “recovery” when judging treatment efficacy for anxiety disorders can be limiting because of the chronic and often unrelenting nature of these conditions.
One review proposed categorizing obsessive-compulsive disorder treatment response into several stages along a spectrum, ranging from complete recovery (or remission) to full or partial response to non-response (or completely refractory).1 However it is defined, treatment resistance in anxiety disorders likely is characterized by minimal restoration of function despite several appropriate treatment exposures.
Table 1
Factors that contribute to treatment resistance in obsessive-compulsive disorder
| Patient |
| Disease severity Medical comorbidity Psychiatric comorbidity (mood, personality, and/or substance use disorders) Treatment nonadherence Cultural factors |
| Environment |
| Childhood stressors (trauma, abuse) Long-term persistent stressors (psychosocial, occupational, financial) Life stages |
| Clinician/health system |
| Lack of knowledge in primary care (brief treatment duration, subtherapeutic dosing) Lack of psychotherapeutic training Limited doctor-patient relationship (eg, availability/cost of treatment) |
| Pathology-related |
Underlying disease pathophysiology (largely unknown):
Syndromal variation (differing presentations over time) Treatment limitations (limited empirical studies, nonrepresentative study samples) |
| Source: Reference 2 |
First-line pharmacotherapy
Clomipramine or a selective serotonin reuptake inhibitor (SSRI) are considered first-line treatments for OCD. Although some evidence indicates that clomipramine may have greater efficacy than SSRIs, its poor tolerability and potential lethality in overdose make it a less practical first choice in treatment-naïve patients.3,4 SSRIs generally are well tolerated and have a favorable safety profile. Nearly all SSRIs have randomized clinical trials (RCTs) and FDA indications that support their use in OCD. SSRI choice may be guided by patient or prescriber preference because no evidence suggests that 1 SSRI is superior to another for treating OCD.5 In contrast to major depressive disorder, in OCD there is a dose-response relationship for SSRI treatment; higher doses typically are required to achieve response or remission.6,7
Augmentation and other options
Patients who have not responded to at least 2 adequate trials of first-line medications may benefit from an augmentation strategy or treatment with an unconventional agent. Such cases should be managed by a specialist who has experience in treating OCD and with careful consideration of potential risks of these interventions.
Evidence suggests the following pharmacotherapies may effectively treat OCD and may be warranted for treatment-resistant patients.
Serotonergic agents
Supratherapeutic SSRI doses. Evidence suggests that supratherapeutic doses of SSRIs may be effective, which may be a logical first step when treating patients already taking an SSRI who have not responded. In a multi-center, double-blind study comparing sertraline, 200 mg/d, to sertraline, 250 to 400 mg/d, the latter group showed significantly greater symptom improvement.8 Citalopram may not be suitable for this approach because of the recent FDA announcement regarding dose-dependent QTc prolongation associated with this medication.9
Serotonin-norepinephrine reuptake inhibitors (SNRIs). In the only double-blind, placebo-controlled study of venlafaxine for OCD, the drug was not significantly more effective than placebo.10 This study was small (N = 30). There are sufficient positive results from open-label and blinded comparator studies that venlafaxine generally is accepted as an effective and well-tolerated treatment for OCD at doses ≥225 mg/d.11
Duloxetine also may be effective in treating OCD. One case series reported improvement in 3 of 4 SSRI nonresponders who were switched to this medication and rapidly titrated to 120 mg/d.12
Clomipramine/SSRI augmentation. For patients who have not responded to an SSRI, several open-label trials support adding clomipramine.13 Conversely, SSRI augmentation for patients who have not adequately responded to clomipramine may be effective.14 With any dual therapy with serotonergic agents, monitor patients for signs and symptoms of serotonin syndrome.
IV clomipramine. By bypassing first-pass metabolism, IV clomipramine rapidly achieves high plasma levels. In a double-blind, placebo-controlled study of 54 OCD patients who were nonresponsive to oral clomipramine, IV clomipramine was more effective than placebo.15 An additional study found IV clomipramine is more effective when pulse loaded than when titrated gradually.16
Pindolol. The beta blocker pindolol acts as an antagonist of presynaptic 5-HT1A autoreceptors, increasing serotonergic signaling. A small double-blind, placebo-controlled trial (N = 14) found a significant decrease in Yale-Brown Obsessive Compulsive Scale (Y-BOCS) score with pindolol augmentation, 2.5 mg, 3 times daily, among patients who did not respond to ≥3 serotonin reuptake inhibitor (SRI) trials.17 Pindolol augmentation showed modest effects in 2 open-label studies.18,19 However, another small double-blind, placebo-controlled study (N = 15) found no difference between placebo and fluvoxamine augmented with pindolol.20
Ondansetron. A 5-HT3 receptor antagonist, ondansetron is used primarily as an antiemetic but has been shown to have anxiolytic properties in animal studies. In an open-label study of 8 patients with non–treatment refractory OCD, 3 achieved clinical response (at least 35% reduction in Y-BOCS score) with ondansetron monotherapy dosed at 1 mg, 3 times daily.21 In a subsequent single-blind trial with 14 treatment-resistant patients, 9 responded (at least 25% reduction in Y-BOCS score).22
Other medications
Antipsychotics. Most studies examining antipsychotic monotherapy for OCD have been negative. One exception was a small, open-label trial of aripiprazole monotherapy (N = 8) that found modest efficacy among non–treatment refractory patients.23 Augmentation with antipsychotics, however, has been well studied and there is good evidence of efficacy for this approach. Double-blind, placebo-controlled studies have supported the efficacy of augmenting SRIs with haloperidol, risperidone, olanzapine, quetiapine, and aripiprazole.24-26 Several case reports suggest ziprasidone may be an effective SRI adjunct, but 1 retrospective study found it was inferior to quetiapine.27
Benzodiazepines. Case reports present positive effects of clonazepam and alprazolam for OCD, but double-blind, placebo-controlled trials for monotherapy or adjunctive clonazepam have been negative.28,29 Furthermore, cognitive impairment and potential for dependence associated with benzodiazepines weigh against their use in OCD.
Opioids. A double-blind, placebo controlled crossover study of 23 patients with treatment-refractory OCD found once-weekly oral morphine added to patients’ current regimen significantly reduced Y-BOCS score vs placebo. Patients received 30 mg the first week and 15 to 45 mg the next week, depending on response or side effects.30 A case report and a small open-label trial support the efficacy of tramadol, a weak agonist of the μ opioid receptor and an inhibitor of serotonin and norepinephrine transporters, as monotherapy and as an adjunct to fluoxetine.31,32 Because patients with OCD may be particularly vulnerable to dependence and intentional or accidental overdose via opioid/benzodiazepine combinations, evaluate the risks and benefits before initiating an opioid.
Psychostimulants. Sparse but good evidence supports the efficacy of dextroamphetamine monotherapy for OCD.33,34 There are no positive studies of methylphenidate and several case reports of methylphenidate-induced OCD symptoms.35
N-methyl-D-aspartate (NMDA) antagonists. Increased glutamatergic neurotransmission has been implicated in the pathophysiology of OCD, which suggests a possible role for glutamate receptor antagonists. In an open-label trial, memantine, an NMDA antagonist used primarily to treat dementia, was associated with clinical response (>25% reduction in Y-BOCS scores) in 6 of 14 patients with treatment-refractory OCD.36 Several case reports and an open-label trial support the efficacy of riluzole—which is indicated for treating amyotrophic lateral sclerosis—as an adjunct for treatment-refractory OCD.37 Although its exact mechanism of action is unclear, riluzole’s effects are thought to be mediated via reduction in glutamatergic neurotransmission. IV ketamine has reported anti-OCD effects in a case report of a woman with treatment-resistant OCD. These effects occurred almost immediately and persisted for several days.38
Hallucinogens. Psilocybin, psilocin, and lysergic acid diethylamide have reported anti-OCD properties.39 As schedule I substances, however, they are not available outside of sanctioned research protocols and may carry substantial risk. Nonetheless, their efficacy suggests that other compounds that share their mechanism of action—namely agonism of 5-HT2A and 5-HT2C receptors—may merit investigation as potential treatments for OCD.
Psychotherapy
Cognitive-behavioral therapy (CBT) has been shown to be effective for OCD as monotherapy and augmentation to pharmacotherapy. CBT consists of cognitive and behavioral components, typically involving some form of cognitive restructuring and exposure response prevention. Although these 2 types of interventions arise from independent traditions, in CBT they are frequently intertwined, particularly when the focus of OCD patients’ anxiety is ego-dystonic thoughts.
One benefit of CBT over pharmacotherapy is that effects persist after treatment is terminated. A recent prospective study found CBT was effective for treatment-refractory OCD, with 74% of patients demonstrating clinical response after 20 to 25 sessions over 2 months and 61% maintaining clinical response 1 year after treatment.40 CBT administered remotely via teleconference, also known as “teletherapy,” has shown efficacy for OCD.41
Alternative medicine
Despite widespread use of herbal remedies for OCD, no trials have shown a strong positive effect. Both Hypericum perforatum (St. John’s wort) and Silybum marianum (milk thistle) have been used to treat obsessive and compulsive symptoms; however, placebo-controlled trials did not find any significant differences in symptoms or side effects between treatment groups.42,43 Lower-quality studies have reported modest effects for mindfulness meditation, yoga, and acupuncture.44
Because many patients continue to use complementary and alternative medicine therapies despite the lack of data on efficacy, it is important to monitor for potential interactions with prescription medications. St. John’s wort interacts with many medications because of induction of the cytochrome P450 (CYP) isoenzymes 3A4 and 2C9. This interaction may lower blood levels of alprazolam and clonazepam (3A4). Combining St. John’s wort with SSRIs increases the risk of serotonin syndrome. Milk thistle inhibits CYP450 isoenzyme 3A4, and may increase serum levels of other medications metabolized by this pathway.
Invasive therapies
Invasive options may be considered after several pharmacotherapeutic and psychotherapeutic approaches have not been effective or when significant functional impairment remains (Table 2). These therapies typically are reserved for patients whose treatment resistance is strongest.
Electroconvulsive therapy (ECT). Although ECT is an effective tool for treatment-resistant mood disorders or treatment-resistant anxiety complicated by severe depression, studies have not found ECT to be effective for OCD. One uncontrolled case series reported considerable improvements in OCD patients the year after ECT, although improvement was correlated with improved depression scores.45
Vagal nerve stimulation (VNS). In an open-label study of 7 OCD patients who received VNS, 3 were acute responders—characterized by a ≥25% improvement on the Y-BOCS—and 2 received continued benefits at 4-year follow up (2 patients dropped out).46
Repetitive transcranial magnetic stimulation (rTMS). A meta-analysis of 3 RCTs of rTMS for patients with OCD did not yield a large or statistically significant effect.47 Limitations of these trials included asymmetric stimulation sites (eg, left vs right only), limited stimulation sites (dorsolateral prefrontal cortex), different stimulation frequencies between studies, and a lack of sham stimulation conditions. A more recent RCT and subsequent review described moderate efficacy (defined by ≥25% decrease in Y-BOCS scores) compared with sham stimulations in OCD patients at 4 weeks, using the supplementary motor area as a stimulation site.48,49
The main limitation of rTMS is the inability to penetrate deeper brain structures implicated in OCD (eg, caudate nucleus, thalamus, anterior capsule fiber tracts), as well as a lack of specificity in stimulation site.
Surgical approaches. Cingulotomy is the most commonly employed surgical procedure for OCD in North America, likely because of a combination of clinical efficacy and low morbidity and mortality rates.50 Of the >1,000 cingulotomies that have been performed at Massachusetts General Hospital, no deaths or postoperative infections have been reported and 2 subdural hematomas have occurred.50 Common postsurgical side effects include transient headache, nausea, or difficulty urinating. The most serious common side effect—postoperative seizures—has been reported in 1% to 9% of cases.
Outcomes for these procedures cannot be fully assessed until at least 6 months to 2 years after the procedure, which suggests postoperative neural reorganization plays an important role in recovery. Direct comparisons of each lesion approach within studies are extremely rare. Overall, long-term outcomes of these approaches have demonstrated significant therapeutic effects of each of these procedures. Reported response rates vary between 30% to 70%, when applied to remission, response (≥35% Y-BOCS reduction), and functional improvements in quality of life.50
Deep brain stimulation (DBS). With this approach, small electrodes are inserted under precise stereotactic MRI guidance. The advantage of DBS over ablative surgery is the ability to adjust and customize neurostimulation. Following implantation, modifiable parameters of electrode stimulation include electrode polarity, intensity, frequency, and laterality. A specially trained psychiatrist can conduct parameter optimization during long-term follow-up.
The first trial of DBS for OCD was reported in 1999 (N = 4), with the initial target selected based on the site of anterior capsulotomy. Three patients derived clinically observed benefit, although no validated questionnaires were administered.51 Since then, at least 7 studies with blinded stimulation have been conducted, totaling 62 patients.52
In recent years, structures adjacent to the internal capsule also have been targeted based on the approach employed in ventral capsulotomy. Across all trials, response rates for this approach consistently have been in the 50% range, with average Y-BOCS score reductions ranging from 6.8 to 31 points.53 Some patients have reported rapid improvements in anhedonia, and this approach is being employed in treatment-resistant depression.
Postoperative complications occur more often with DBS than with lesion approaches because of the prosthetic nature of the procedure (eg, increased risk of infection, lead malfunction, etc.). Additionally, batteries must be periodically explanted and replaced. Reported stimulation-related side effects include mood changes (transient sadness, anxiety, euphoria, and hypomania), sensory disturbances (olfactory, gustatory, and motor sensations), and cognitive changes (confusion and forgetfulness). These side effects typically are stimulation-dependent and disappear after altering stimulation parameters.
Table 2
Invasive therapies for treatment-resistant OCD
| Therapy | Quality of evidence |
|---|---|
| Reversible | |
| Electroconvulsive therapy | Poor |
| Vagal nerve stimulation | Poor |
| Repetitive transcranial magnetic stimulation | Limited |
| Irreversible (surgical) | |
| Anterior capsulotomy. Target: anterior limb of the internal capsule | Fair |
| Anterior cingulotomy. Target: anterior cingulate and cingulum bundle | Fair |
| Subcaudate tractotomy. Target: substantia innominata, just inferior to the caudate nucleus | Fair |
| Limbic leucotomy. Target: anterior cingulotomy combined with subcaudate tractotomy | Fair |
| Deep brain stimulation. Multiple targets | Fair |
| OCD: obsessive-compulsive disorder | |
Related Resources
- American Psychiatric Association. Treatment of patients with obsessive-compulsive disorder. www.psychiatryonline.com/pracGuide/pracGuideTopic_10.aspx.
- Hyman BM, Pedrick C. The OCD workbook. Your guide to breaking free from obsessive compulsive disorder. 3rd ed. Oakland, CA: New Harbinger Publications Inc; 2010.
- Baer L. Getting control: overcoming your obsessions and compulsions. Revised ed. New York, NY: Plume; 2000.
Drug Brand Names
- Alprazolam • Xanax
- Aripiprazole • Abilify
- Citalopram • Celexa
- Clomipramine • Anafranil
- Clonazepam • Klonopin
- Dextroamphetamine • Adderall
- Duloxetine • Cymbalta
- Fluoxetine • Prozac
- Fluvoxamine • Luvox
- Haloperidol • Haldol
- Ketamine • Ketalar
- Memantine • Namenda
- Methylphenidate • Ritalin
- Morphine • MS Contin
- Olanzapine • Zyprexa
- Ondansetron • Zofran
- Pindolol • Visken
- Quetiapine • Seroquel
- Riluzole • Rilutek
- Risperidone • Risperdal
- Sertraline • Zoloft
- Tramadol • Ultram
- Venlafaxine • Effexor
- Ziprasidone • Geodon
Disclosures
Drs. Khalsa and Schiffman report no financial relationship with any company whose products are mentioned in this article or with manufacturers of competing products.
Dr. Bystritsky receives grant support from AstraZeneca, Brainways, Takeda, and Transcept and is a founder, stockholder, and consultant for BrainSonix.
1. Pallanti S, Quercioli L. Treatment-refractory obsessive-compulsive disorder: methodological issues operational definitions and therapeutic lines. Prog Neuropsychopharmacol Biol Psychiatry. 2006;30(3):400-412.
2. Bystritsky A. Treatment-resistant anxiety disorders. Mol Psychiatry. 2006;11(9):805-814.
3. Denys D. Pharmacotherapy of obsessive-compulsive disorder and obsessive-compulsive spectrum disorders. Psychiatr Clin North Am. 2006;29(2):553-584 xi.
4. Ackerman DL, Greenland S. Multivariate meta-analysis of controlled drug studies for obsessive-compulsive disorder. J Clin Psychopharmacol. 2002;22(3):309-317.
5. Soomro GM, Altman D, Rajagopal S, et al. Selective serotonin re-uptake inhibitors (SSRIs) versus placebo for obsessive compulsive disorder (OCD). Cochrane Database Syst Rev. 2008;(1):CD001765.-
6. Bloch MH, McGuire J, Landeros-Weisenberger A, et al. Meta-analysis of the dose-response relationship of SSRI in obsessive-compulsive disorder. Mol Psychiatry. 2010;15(8):850-855.
7. Koran LM, Hanna GL, Hollander E, et al. American Psychiatric Association. Practice guideline for the treatment of patients with obsessive-compulsive disorder. Am J Psychiatry. 2007;164(7 suppl):5-53.
8. Ninan PT, Koran LM, Kiev A, et al. High-dose sertraline strategy for nonresponders to acute treatment for obsessive-compulsive disorder: a multicenter double-blind trial. J Clin Psychiatry. 2006;67(1):15-22.
9. Food and Drug Administration. FDA drug safety communication: abnormal heart rhythms associated with high doses of Celexa (citalopram hydrobromide). http://www.fda.gov/Drugs/DrugSafety/ucm269086.htm#sa. Published August 24 2011. Accessed September 27, 2011.
10. Yaryura-Tobias JA, Neziroglu FA. Venlafaxine in obsessive-compulsive disorder. Arch Gen Psychiatry. 1996;53(7):653-654.
11. Phelps NJ, Cates ME. The role of venlafaxine in the treatment of obsessive-compulsive disorder. Ann Pharmacother. 2005;39(1):136-140.
12. Dell’osso B, Mundo E, Marazziti D, et al. Switching from serotonin reuptake inhibitors to duloxetine in patients with resistant obsessive compulsive disorder: a case series. J Psychopharmacol. 2008;22(2):210-213.
13. Pallanti S, Quercioli L, Paiva RS, et al. Citalopram for treatment-resistant obsessive-compulsive disorder. Eur Psychiatry. 1999;14:101-106.
14. Ravizza L, Barzega G, Bellino S, et al. Therapeutic effect and safety of adjunctive risperidone in refractory obsessive-compulsive disorder (OCD). Psychopharmacol Bull. 1996;32:677-682.
15. Fallon BA, Liebowitz MR, Campeas R, et al. Intravenous clomipramine for obsessive-compulsive disorder refractory to oral clomipramine: a placebo-controlled study. Arch Gen Psychiatry. 1998;55:918-924.
16. Koran LM, Pallanti S, Paiva RS, et al. Pulse loading versus gradual dosing of intravenous clomipramine in obsessive-compulsive disorder. Eur Neuropsychopharmacol. 1998;8:121-126.
17. Dannon PN, Sasson Y, Hirschmann S, et al. Pindolol augmentation in treatment-resistant obsessive compulsive disorder: a double-blind placebo controlled trial. Eur Neuropsychopharmacol. 2000;10:165-169.
18. Koran LM, Mueller K, Maloney A. Will pindolol augment the response to a serotonin reuptake inhibitor in obsessive-compulsive disorder? J Clin Psychopharmacol. 1996;16:253-254.
19. Hewlett WA, Vinogradov S, Agras WS. Clomipramine clonazepam, and clonidine treatment of obsessive-compulsive disorder. J Clin Psychopharmacol. 1992;12:420-430.
20. Mundo E, Guglielmo E, Bellodi L. Effect of adjuvant pindolol on the antiobsessional response to fluvoxamine: a double-blind placebo-controlled study. Int Clin Psychopharmacol. 1998;13:219-224.
21. Hewlett WA, Schmid SP, Salomon RM. Pilot trial of ondansetron in the treatment of 8 patients with obsessive-compulsive disorder. J Clin Psychiatry. 2003;64:1025-1030.
22. Pallanti S, Bernardi S, Antonini S, et al. Ondansetron augmentation in treatment-resistant obsessive-compulsive disorder: a preliminary, single-blind, prospective study. CNS Drugs. 2009;23(12):1047-1055.
23. Connor KM, Payne VM, Gadde KM, et al. The use of aripiprazole in obsessive-compulsive disorder: preliminary observations in 8 patients. J Clin Psychiatry. 2005;66:49-51.
24. Komossa K, Depping AM, Meyer M, et al. Second-generation antipsychotics for obsessive compulsive disorder. Cochrane Database Syst Rev. 2010;(12):CD008141.-
25. Bloch MH, Landeros-Weisenberger A, Kelmendi B, et al. A systematic review: antipsychotic augmentation with treatment refractory obsessive-compulsive disorder. Mol Psychiatry. 2006;11(7):622-632.
26. Muscatello MR, Bruno A, Pandolfo G, et al. Effect of aripiprazole augmentation of serotonin reuptake inhibitors or clomipramine in treatment-resistant obsessive-compulsive disorder: a double-blind, placebo-controlled study. J Clin Psychopharmacol. 2011;31(2):174-179.
27. Savas HA, Yumru M, Ozen ME. Quetiapine and ziprasidone as adjuncts in treatment-resistant obsessive-compulsive disorder: a retrospective comparative study. Clin Drug Investig. 2008;28(7):439-442.
28. Hollander E, Kaplan A, Stahl SM. A double-blind placebo-controlled trial of clonazepam in obsessive-compulsive disorder. World J Biol Psychiatry. 2003;4:30-34.
29. Crockett BA, Churchill E, Davidson JR. A double-blind combination study of clonazepam with sertraline in obsessive-compulsive disorder. Ann Clin Psychiatry. 2004;16(3):127-132.
30. Koran LM, Aboujaoude E, Bullock KD, et al. Double-blind treatment with oral morphine in treatment-resistant obsessive-compulsive disorder. J Clin Psychiatry. 2005;66(3):353-359.
31. Shapira NA, Keck PE Jr, Goldsmith TD, et al. Open-label pilot study of tramadol hydrochloride in treatment-refractory obsessive-compulsive disorder. Depress Anxiety. 1997;6:170-173.
32. Goldsmith TB, Shapira NA, Keck PE Jr. Rapid remission of OCD with tramadol hydrochloride. Am J Psychiatry. 1999;156(4):660-661.
33. Insel TR, Hamilton JA, Guttmacher LB, et al. D-amphetamine in obsessive-compulsive disorder. Psychopharmacology (Berl). 1983;80:231-235.
34. Joffe RT, Swinson RP, Levitt AJ. Acute psychostimulant challenge in primary obsessive-compulsive disorder. J Clin Psychopharmacol. 1991;11:237-241.
35. Woolley JB, Heyman I. Dexamphetamine for obsessive-compulsive disorder. Am J Psychiatry. 2003;160:183.-
36. Aboujaoude E, Barry JJ, Gamel N. Memantine augmentation in treatment-resistant obsessive-compulsive disorder: an open-label trial. J Clin Psychopharmacol. 2009;29(1):51-55.
37. Coric V, Taskiran S, Pittenger C, et al. Riluzole augmentation in treatment-resistant obsessive-compulsive disorder: an open-label trial. Biol Psychiatry. 2005;58(5):424-428.
38. Rodriguez CI, Kegeles LS, Flood P, et al. Rapid resolution of obsessions after an infusion of intravenous ketamine in a patient with treatment-resistant obsessive-compulsive disorder. J Clin Psychiatry. 2011;72(4):567-569.
39. Leonard HL, Rapoport JL. Relief of obsessive-compulsive symptoms by LSD and psilocin. Am J Psychiatry. 1987;144(9):1239-1240.
40. Anand N, Sudhir PM, Math SB, et al. Cognitive behavior therapy in medication non-responders with obsessive-compulsive disorder: a prospective 1-year follow-up study. J Anxiety Disord. 2011;25(7):939-945.
41. Himle JA, Fischer DJ, Muroff JR, et al. Videoconferencing-based cognitive-behavioral therapy for obsessive-compulsive disorder. Behav Res Ther. 2006;44(12):1821-1829.
42. Kobak KA, Taylor LV, Bystritsky A, et al. St John’s wort versus placebo in obsessive-compulsive disorder: results from a double-blind study. Int Clin Psychopharmacol. 2005;20(6):299-304.
43. Sayyah M, Boostani H, Pakseresht S, et al. Comparison of Silybum marianum (L.) Gaertn. with fluoxetine in the treatment of obsessive-compulsive Disorder. Prog Neuropsychopharmacol Biol Psychiatry. 2010;34(2):362-365.
44. Sarris J, Camfield D, Berk M. Complementary medicine self-help, and lifestyle interventions for obsessive compulsive disorder (OCD) and the OCD spectrum: a systematic review. J Affect Disord. 2011 (epub ahead of print).
45. Beale MD, Kellner CH, Pritchett JT, et al. ECT for OCD. J Clin Psychiatry. 1995;56(2):81-82.
46. George MS, Ward HE Jr, Ninan PT, et al. A pilot study of vagus nerve stimulation (VNS) for treatment-resistant anxiety disorders. Brain Stimul. 2008;1(2):112-121.
47. Slotema CW, Blom JD, Hoek HW, et al. Should we expand the toolbox of psychiatric treatment methods to include repetitive transcranial magnetic stimulation (rTMS)? A meta-analysis of the efficacy of rTMS in psychiatric disorders. J Clin Psychiatry. 2010;71(7):873-884.
48. Mantovani A, Simpson HB, Fallon BA, et al. Randomized sham-controlled trial of repetitive transcranial magnetic stimulation in treatment-resistant obsessive-compulsive disorder. Int J Neuropsychopharmacol. 2010;13(2):217-227.
49. Blom RM, Figee M, Vulink N, et al. Update on repetitive transcranial magnetic stimulation in obsessive-compulsive disorder: different targets. Curr Psychiatry Rep. 2011;13(4):289-294.
50. Greenberg BD, Rauch SL, Haber SN. Invasive circuitry-based neurotherapeutics: stereotactic ablation and deep brain stimulation for OCD. Neuropsychopharmacology. 2010;35(1):317-336.
51. Nuttin B, Cosyns P, Demeulemeester H, et al. Electrical stimulation in anterior limbs of internal capsules in patients with obsessive-compulsive disorder. Lancet. 1999;354(9189):1526.-
52. de Koning PP, Figee M, van den Munckhof P, et al. Current status of deep brain stimulation for obsessive-compulsive disorder: a clinical review of different targets. Curr Psychiatry Rep. 2011;13(4):274-282.
53. Greenberg BD, Gabriels LA, Malone DA, Jr, et al. Deep brain stimulation of the ventral internal capsule/ventral striatum for obsessive-compulsive disorder: worldwide experience. Mol Psychiatry. 2010;15(1):64-79.
Obsessive-compulsive disorder (OCD) is marked by recurrent and persistent anxiety-provoking thoughts (obsessions) accompanied by repetitive behaviors (compulsions) that focus on alleviating distress caused by obsessive thoughts. Although patients recognize the obsessions and compulsions are unreasonable, these thoughts and behaviors remain time-consuming and impair function. Even when they appropriately identify and treat OCD, clinicians often face “treatment-resistant” (or “treatment-refractory”) patients who do not respond adequately to standard therapies (Box).1 Several factors contribute to treatment resistance, including those related to the patient, the environment, the clinician/health system, and pathology (Table 1).2 An estimated 10% to 40% of patients with OCD are treatment-resistant.2
This article discusses the range of options for addressing resistant OCD, including augmenting first-line treatments with pharmacotherapy, psychotherapy, or reversible or irreversible forms of neuromodulation.
Treatment resistance generally refers to lack of sufficient improvement despite multiple adequate and appropriate treatment trials. However, there are no universally accepted definitions or metrics of treatment resistance, and often it is operationally defined. For mood disorders, it may be defined by failure to remit or respond clinically (50% reduction in symptoms) despite ≥2 adequate antidepressant trials or failure to respond clinically despite adequate medication trials across several neurotransmitter classes. The terms treatment resistant and treatment refractory are synonymous; they refer to the same phenomenon and are used interchangeably in the literature. Including the terms “remission” and “recovery” when judging treatment efficacy for anxiety disorders can be limiting because of the chronic and often unrelenting nature of these conditions.
One review proposed categorizing obsessive-compulsive disorder treatment response into several stages along a spectrum, ranging from complete recovery (or remission) to full or partial response to non-response (or completely refractory).1 However it is defined, treatment resistance in anxiety disorders likely is characterized by minimal restoration of function despite several appropriate treatment exposures.
Table 1
Factors that contribute to treatment resistance in obsessive-compulsive disorder
| Patient |
| Disease severity Medical comorbidity Psychiatric comorbidity (mood, personality, and/or substance use disorders) Treatment nonadherence Cultural factors |
| Environment |
| Childhood stressors (trauma, abuse) Long-term persistent stressors (psychosocial, occupational, financial) Life stages |
| Clinician/health system |
| Lack of knowledge in primary care (brief treatment duration, subtherapeutic dosing) Lack of psychotherapeutic training Limited doctor-patient relationship (eg, availability/cost of treatment) |
| Pathology-related |
Underlying disease pathophysiology (largely unknown):
Syndromal variation (differing presentations over time) Treatment limitations (limited empirical studies, nonrepresentative study samples) |
| Source: Reference 2 |
First-line pharmacotherapy
Clomipramine or a selective serotonin reuptake inhibitor (SSRI) are considered first-line treatments for OCD. Although some evidence indicates that clomipramine may have greater efficacy than SSRIs, its poor tolerability and potential lethality in overdose make it a less practical first choice in treatment-naïve patients.3,4 SSRIs generally are well tolerated and have a favorable safety profile. Nearly all SSRIs have randomized clinical trials (RCTs) and FDA indications that support their use in OCD. SSRI choice may be guided by patient or prescriber preference because no evidence suggests that 1 SSRI is superior to another for treating OCD.5 In contrast to major depressive disorder, in OCD there is a dose-response relationship for SSRI treatment; higher doses typically are required to achieve response or remission.6,7
Augmentation and other options
Patients who have not responded to at least 2 adequate trials of first-line medications may benefit from an augmentation strategy or treatment with an unconventional agent. Such cases should be managed by a specialist who has experience in treating OCD and with careful consideration of potential risks of these interventions.
Evidence suggests the following pharmacotherapies may effectively treat OCD and may be warranted for treatment-resistant patients.
Serotonergic agents
Supratherapeutic SSRI doses. Evidence suggests that supratherapeutic doses of SSRIs may be effective, which may be a logical first step when treating patients already taking an SSRI who have not responded. In a multi-center, double-blind study comparing sertraline, 200 mg/d, to sertraline, 250 to 400 mg/d, the latter group showed significantly greater symptom improvement.8 Citalopram may not be suitable for this approach because of the recent FDA announcement regarding dose-dependent QTc prolongation associated with this medication.9
Serotonin-norepinephrine reuptake inhibitors (SNRIs). In the only double-blind, placebo-controlled study of venlafaxine for OCD, the drug was not significantly more effective than placebo.10 This study was small (N = 30). There are sufficient positive results from open-label and blinded comparator studies that venlafaxine generally is accepted as an effective and well-tolerated treatment for OCD at doses ≥225 mg/d.11
Duloxetine also may be effective in treating OCD. One case series reported improvement in 3 of 4 SSRI nonresponders who were switched to this medication and rapidly titrated to 120 mg/d.12
Clomipramine/SSRI augmentation. For patients who have not responded to an SSRI, several open-label trials support adding clomipramine.13 Conversely, SSRI augmentation for patients who have not adequately responded to clomipramine may be effective.14 With any dual therapy with serotonergic agents, monitor patients for signs and symptoms of serotonin syndrome.
IV clomipramine. By bypassing first-pass metabolism, IV clomipramine rapidly achieves high plasma levels. In a double-blind, placebo-controlled study of 54 OCD patients who were nonresponsive to oral clomipramine, IV clomipramine was more effective than placebo.15 An additional study found IV clomipramine is more effective when pulse loaded than when titrated gradually.16
Pindolol. The beta blocker pindolol acts as an antagonist of presynaptic 5-HT1A autoreceptors, increasing serotonergic signaling. A small double-blind, placebo-controlled trial (N = 14) found a significant decrease in Yale-Brown Obsessive Compulsive Scale (Y-BOCS) score with pindolol augmentation, 2.5 mg, 3 times daily, among patients who did not respond to ≥3 serotonin reuptake inhibitor (SRI) trials.17 Pindolol augmentation showed modest effects in 2 open-label studies.18,19 However, another small double-blind, placebo-controlled study (N = 15) found no difference between placebo and fluvoxamine augmented with pindolol.20
Ondansetron. A 5-HT3 receptor antagonist, ondansetron is used primarily as an antiemetic but has been shown to have anxiolytic properties in animal studies. In an open-label study of 8 patients with non–treatment refractory OCD, 3 achieved clinical response (at least 35% reduction in Y-BOCS score) with ondansetron monotherapy dosed at 1 mg, 3 times daily.21 In a subsequent single-blind trial with 14 treatment-resistant patients, 9 responded (at least 25% reduction in Y-BOCS score).22
Other medications
Antipsychotics. Most studies examining antipsychotic monotherapy for OCD have been negative. One exception was a small, open-label trial of aripiprazole monotherapy (N = 8) that found modest efficacy among non–treatment refractory patients.23 Augmentation with antipsychotics, however, has been well studied and there is good evidence of efficacy for this approach. Double-blind, placebo-controlled studies have supported the efficacy of augmenting SRIs with haloperidol, risperidone, olanzapine, quetiapine, and aripiprazole.24-26 Several case reports suggest ziprasidone may be an effective SRI adjunct, but 1 retrospective study found it was inferior to quetiapine.27
Benzodiazepines. Case reports present positive effects of clonazepam and alprazolam for OCD, but double-blind, placebo-controlled trials for monotherapy or adjunctive clonazepam have been negative.28,29 Furthermore, cognitive impairment and potential for dependence associated with benzodiazepines weigh against their use in OCD.
Opioids. A double-blind, placebo controlled crossover study of 23 patients with treatment-refractory OCD found once-weekly oral morphine added to patients’ current regimen significantly reduced Y-BOCS score vs placebo. Patients received 30 mg the first week and 15 to 45 mg the next week, depending on response or side effects.30 A case report and a small open-label trial support the efficacy of tramadol, a weak agonist of the μ opioid receptor and an inhibitor of serotonin and norepinephrine transporters, as monotherapy and as an adjunct to fluoxetine.31,32 Because patients with OCD may be particularly vulnerable to dependence and intentional or accidental overdose via opioid/benzodiazepine combinations, evaluate the risks and benefits before initiating an opioid.
Psychostimulants. Sparse but good evidence supports the efficacy of dextroamphetamine monotherapy for OCD.33,34 There are no positive studies of methylphenidate and several case reports of methylphenidate-induced OCD symptoms.35
N-methyl-D-aspartate (NMDA) antagonists. Increased glutamatergic neurotransmission has been implicated in the pathophysiology of OCD, which suggests a possible role for glutamate receptor antagonists. In an open-label trial, memantine, an NMDA antagonist used primarily to treat dementia, was associated with clinical response (>25% reduction in Y-BOCS scores) in 6 of 14 patients with treatment-refractory OCD.36 Several case reports and an open-label trial support the efficacy of riluzole—which is indicated for treating amyotrophic lateral sclerosis—as an adjunct for treatment-refractory OCD.37 Although its exact mechanism of action is unclear, riluzole’s effects are thought to be mediated via reduction in glutamatergic neurotransmission. IV ketamine has reported anti-OCD effects in a case report of a woman with treatment-resistant OCD. These effects occurred almost immediately and persisted for several days.38
Hallucinogens. Psilocybin, psilocin, and lysergic acid diethylamide have reported anti-OCD properties.39 As schedule I substances, however, they are not available outside of sanctioned research protocols and may carry substantial risk. Nonetheless, their efficacy suggests that other compounds that share their mechanism of action—namely agonism of 5-HT2A and 5-HT2C receptors—may merit investigation as potential treatments for OCD.
Psychotherapy
Cognitive-behavioral therapy (CBT) has been shown to be effective for OCD as monotherapy and augmentation to pharmacotherapy. CBT consists of cognitive and behavioral components, typically involving some form of cognitive restructuring and exposure response prevention. Although these 2 types of interventions arise from independent traditions, in CBT they are frequently intertwined, particularly when the focus of OCD patients’ anxiety is ego-dystonic thoughts.
One benefit of CBT over pharmacotherapy is that effects persist after treatment is terminated. A recent prospective study found CBT was effective for treatment-refractory OCD, with 74% of patients demonstrating clinical response after 20 to 25 sessions over 2 months and 61% maintaining clinical response 1 year after treatment.40 CBT administered remotely via teleconference, also known as “teletherapy,” has shown efficacy for OCD.41
Alternative medicine
Despite widespread use of herbal remedies for OCD, no trials have shown a strong positive effect. Both Hypericum perforatum (St. John’s wort) and Silybum marianum (milk thistle) have been used to treat obsessive and compulsive symptoms; however, placebo-controlled trials did not find any significant differences in symptoms or side effects between treatment groups.42,43 Lower-quality studies have reported modest effects for mindfulness meditation, yoga, and acupuncture.44
Because many patients continue to use complementary and alternative medicine therapies despite the lack of data on efficacy, it is important to monitor for potential interactions with prescription medications. St. John’s wort interacts with many medications because of induction of the cytochrome P450 (CYP) isoenzymes 3A4 and 2C9. This interaction may lower blood levels of alprazolam and clonazepam (3A4). Combining St. John’s wort with SSRIs increases the risk of serotonin syndrome. Milk thistle inhibits CYP450 isoenzyme 3A4, and may increase serum levels of other medications metabolized by this pathway.
Invasive therapies
Invasive options may be considered after several pharmacotherapeutic and psychotherapeutic approaches have not been effective or when significant functional impairment remains (Table 2). These therapies typically are reserved for patients whose treatment resistance is strongest.
Electroconvulsive therapy (ECT). Although ECT is an effective tool for treatment-resistant mood disorders or treatment-resistant anxiety complicated by severe depression, studies have not found ECT to be effective for OCD. One uncontrolled case series reported considerable improvements in OCD patients the year after ECT, although improvement was correlated with improved depression scores.45
Vagal nerve stimulation (VNS). In an open-label study of 7 OCD patients who received VNS, 3 were acute responders—characterized by a ≥25% improvement on the Y-BOCS—and 2 received continued benefits at 4-year follow up (2 patients dropped out).46
Repetitive transcranial magnetic stimulation (rTMS). A meta-analysis of 3 RCTs of rTMS for patients with OCD did not yield a large or statistically significant effect.47 Limitations of these trials included asymmetric stimulation sites (eg, left vs right only), limited stimulation sites (dorsolateral prefrontal cortex), different stimulation frequencies between studies, and a lack of sham stimulation conditions. A more recent RCT and subsequent review described moderate efficacy (defined by ≥25% decrease in Y-BOCS scores) compared with sham stimulations in OCD patients at 4 weeks, using the supplementary motor area as a stimulation site.48,49
The main limitation of rTMS is the inability to penetrate deeper brain structures implicated in OCD (eg, caudate nucleus, thalamus, anterior capsule fiber tracts), as well as a lack of specificity in stimulation site.
Surgical approaches. Cingulotomy is the most commonly employed surgical procedure for OCD in North America, likely because of a combination of clinical efficacy and low morbidity and mortality rates.50 Of the >1,000 cingulotomies that have been performed at Massachusetts General Hospital, no deaths or postoperative infections have been reported and 2 subdural hematomas have occurred.50 Common postsurgical side effects include transient headache, nausea, or difficulty urinating. The most serious common side effect—postoperative seizures—has been reported in 1% to 9% of cases.
Outcomes for these procedures cannot be fully assessed until at least 6 months to 2 years after the procedure, which suggests postoperative neural reorganization plays an important role in recovery. Direct comparisons of each lesion approach within studies are extremely rare. Overall, long-term outcomes of these approaches have demonstrated significant therapeutic effects of each of these procedures. Reported response rates vary between 30% to 70%, when applied to remission, response (≥35% Y-BOCS reduction), and functional improvements in quality of life.50
Deep brain stimulation (DBS). With this approach, small electrodes are inserted under precise stereotactic MRI guidance. The advantage of DBS over ablative surgery is the ability to adjust and customize neurostimulation. Following implantation, modifiable parameters of electrode stimulation include electrode polarity, intensity, frequency, and laterality. A specially trained psychiatrist can conduct parameter optimization during long-term follow-up.
The first trial of DBS for OCD was reported in 1999 (N = 4), with the initial target selected based on the site of anterior capsulotomy. Three patients derived clinically observed benefit, although no validated questionnaires were administered.51 Since then, at least 7 studies with blinded stimulation have been conducted, totaling 62 patients.52
In recent years, structures adjacent to the internal capsule also have been targeted based on the approach employed in ventral capsulotomy. Across all trials, response rates for this approach consistently have been in the 50% range, with average Y-BOCS score reductions ranging from 6.8 to 31 points.53 Some patients have reported rapid improvements in anhedonia, and this approach is being employed in treatment-resistant depression.
Postoperative complications occur more often with DBS than with lesion approaches because of the prosthetic nature of the procedure (eg, increased risk of infection, lead malfunction, etc.). Additionally, batteries must be periodically explanted and replaced. Reported stimulation-related side effects include mood changes (transient sadness, anxiety, euphoria, and hypomania), sensory disturbances (olfactory, gustatory, and motor sensations), and cognitive changes (confusion and forgetfulness). These side effects typically are stimulation-dependent and disappear after altering stimulation parameters.
Table 2
Invasive therapies for treatment-resistant OCD
| Therapy | Quality of evidence |
|---|---|
| Reversible | |
| Electroconvulsive therapy | Poor |
| Vagal nerve stimulation | Poor |
| Repetitive transcranial magnetic stimulation | Limited |
| Irreversible (surgical) | |
| Anterior capsulotomy. Target: anterior limb of the internal capsule | Fair |
| Anterior cingulotomy. Target: anterior cingulate and cingulum bundle | Fair |
| Subcaudate tractotomy. Target: substantia innominata, just inferior to the caudate nucleus | Fair |
| Limbic leucotomy. Target: anterior cingulotomy combined with subcaudate tractotomy | Fair |
| Deep brain stimulation. Multiple targets | Fair |
| OCD: obsessive-compulsive disorder | |
Related Resources
- American Psychiatric Association. Treatment of patients with obsessive-compulsive disorder. www.psychiatryonline.com/pracGuide/pracGuideTopic_10.aspx.
- Hyman BM, Pedrick C. The OCD workbook. Your guide to breaking free from obsessive compulsive disorder. 3rd ed. Oakland, CA: New Harbinger Publications Inc; 2010.
- Baer L. Getting control: overcoming your obsessions and compulsions. Revised ed. New York, NY: Plume; 2000.
Drug Brand Names
- Alprazolam • Xanax
- Aripiprazole • Abilify
- Citalopram • Celexa
- Clomipramine • Anafranil
- Clonazepam • Klonopin
- Dextroamphetamine • Adderall
- Duloxetine • Cymbalta
- Fluoxetine • Prozac
- Fluvoxamine • Luvox
- Haloperidol • Haldol
- Ketamine • Ketalar
- Memantine • Namenda
- Methylphenidate • Ritalin
- Morphine • MS Contin
- Olanzapine • Zyprexa
- Ondansetron • Zofran
- Pindolol • Visken
- Quetiapine • Seroquel
- Riluzole • Rilutek
- Risperidone • Risperdal
- Sertraline • Zoloft
- Tramadol • Ultram
- Venlafaxine • Effexor
- Ziprasidone • Geodon
Disclosures
Drs. Khalsa and Schiffman report no financial relationship with any company whose products are mentioned in this article or with manufacturers of competing products.
Dr. Bystritsky receives grant support from AstraZeneca, Brainways, Takeda, and Transcept and is a founder, stockholder, and consultant for BrainSonix.
Obsessive-compulsive disorder (OCD) is marked by recurrent and persistent anxiety-provoking thoughts (obsessions) accompanied by repetitive behaviors (compulsions) that focus on alleviating distress caused by obsessive thoughts. Although patients recognize the obsessions and compulsions are unreasonable, these thoughts and behaviors remain time-consuming and impair function. Even when they appropriately identify and treat OCD, clinicians often face “treatment-resistant” (or “treatment-refractory”) patients who do not respond adequately to standard therapies (Box).1 Several factors contribute to treatment resistance, including those related to the patient, the environment, the clinician/health system, and pathology (Table 1).2 An estimated 10% to 40% of patients with OCD are treatment-resistant.2
This article discusses the range of options for addressing resistant OCD, including augmenting first-line treatments with pharmacotherapy, psychotherapy, or reversible or irreversible forms of neuromodulation.
Treatment resistance generally refers to lack of sufficient improvement despite multiple adequate and appropriate treatment trials. However, there are no universally accepted definitions or metrics of treatment resistance, and often it is operationally defined. For mood disorders, it may be defined by failure to remit or respond clinically (50% reduction in symptoms) despite ≥2 adequate antidepressant trials or failure to respond clinically despite adequate medication trials across several neurotransmitter classes. The terms treatment resistant and treatment refractory are synonymous; they refer to the same phenomenon and are used interchangeably in the literature. Including the terms “remission” and “recovery” when judging treatment efficacy for anxiety disorders can be limiting because of the chronic and often unrelenting nature of these conditions.
One review proposed categorizing obsessive-compulsive disorder treatment response into several stages along a spectrum, ranging from complete recovery (or remission) to full or partial response to non-response (or completely refractory).1 However it is defined, treatment resistance in anxiety disorders likely is characterized by minimal restoration of function despite several appropriate treatment exposures.
Table 1
Factors that contribute to treatment resistance in obsessive-compulsive disorder
| Patient |
| Disease severity Medical comorbidity Psychiatric comorbidity (mood, personality, and/or substance use disorders) Treatment nonadherence Cultural factors |
| Environment |
| Childhood stressors (trauma, abuse) Long-term persistent stressors (psychosocial, occupational, financial) Life stages |
| Clinician/health system |
| Lack of knowledge in primary care (brief treatment duration, subtherapeutic dosing) Lack of psychotherapeutic training Limited doctor-patient relationship (eg, availability/cost of treatment) |
| Pathology-related |
Underlying disease pathophysiology (largely unknown):
Syndromal variation (differing presentations over time) Treatment limitations (limited empirical studies, nonrepresentative study samples) |
| Source: Reference 2 |
First-line pharmacotherapy
Clomipramine or a selective serotonin reuptake inhibitor (SSRI) are considered first-line treatments for OCD. Although some evidence indicates that clomipramine may have greater efficacy than SSRIs, its poor tolerability and potential lethality in overdose make it a less practical first choice in treatment-naïve patients.3,4 SSRIs generally are well tolerated and have a favorable safety profile. Nearly all SSRIs have randomized clinical trials (RCTs) and FDA indications that support their use in OCD. SSRI choice may be guided by patient or prescriber preference because no evidence suggests that 1 SSRI is superior to another for treating OCD.5 In contrast to major depressive disorder, in OCD there is a dose-response relationship for SSRI treatment; higher doses typically are required to achieve response or remission.6,7
Augmentation and other options
Patients who have not responded to at least 2 adequate trials of first-line medications may benefit from an augmentation strategy or treatment with an unconventional agent. Such cases should be managed by a specialist who has experience in treating OCD and with careful consideration of potential risks of these interventions.
Evidence suggests the following pharmacotherapies may effectively treat OCD and may be warranted for treatment-resistant patients.
Serotonergic agents
Supratherapeutic SSRI doses. Evidence suggests that supratherapeutic doses of SSRIs may be effective, which may be a logical first step when treating patients already taking an SSRI who have not responded. In a multi-center, double-blind study comparing sertraline, 200 mg/d, to sertraline, 250 to 400 mg/d, the latter group showed significantly greater symptom improvement.8 Citalopram may not be suitable for this approach because of the recent FDA announcement regarding dose-dependent QTc prolongation associated with this medication.9
Serotonin-norepinephrine reuptake inhibitors (SNRIs). In the only double-blind, placebo-controlled study of venlafaxine for OCD, the drug was not significantly more effective than placebo.10 This study was small (N = 30). There are sufficient positive results from open-label and blinded comparator studies that venlafaxine generally is accepted as an effective and well-tolerated treatment for OCD at doses ≥225 mg/d.11
Duloxetine also may be effective in treating OCD. One case series reported improvement in 3 of 4 SSRI nonresponders who were switched to this medication and rapidly titrated to 120 mg/d.12
Clomipramine/SSRI augmentation. For patients who have not responded to an SSRI, several open-label trials support adding clomipramine.13 Conversely, SSRI augmentation for patients who have not adequately responded to clomipramine may be effective.14 With any dual therapy with serotonergic agents, monitor patients for signs and symptoms of serotonin syndrome.
IV clomipramine. By bypassing first-pass metabolism, IV clomipramine rapidly achieves high plasma levels. In a double-blind, placebo-controlled study of 54 OCD patients who were nonresponsive to oral clomipramine, IV clomipramine was more effective than placebo.15 An additional study found IV clomipramine is more effective when pulse loaded than when titrated gradually.16
Pindolol. The beta blocker pindolol acts as an antagonist of presynaptic 5-HT1A autoreceptors, increasing serotonergic signaling. A small double-blind, placebo-controlled trial (N = 14) found a significant decrease in Yale-Brown Obsessive Compulsive Scale (Y-BOCS) score with pindolol augmentation, 2.5 mg, 3 times daily, among patients who did not respond to ≥3 serotonin reuptake inhibitor (SRI) trials.17 Pindolol augmentation showed modest effects in 2 open-label studies.18,19 However, another small double-blind, placebo-controlled study (N = 15) found no difference between placebo and fluvoxamine augmented with pindolol.20
Ondansetron. A 5-HT3 receptor antagonist, ondansetron is used primarily as an antiemetic but has been shown to have anxiolytic properties in animal studies. In an open-label study of 8 patients with non–treatment refractory OCD, 3 achieved clinical response (at least 35% reduction in Y-BOCS score) with ondansetron monotherapy dosed at 1 mg, 3 times daily.21 In a subsequent single-blind trial with 14 treatment-resistant patients, 9 responded (at least 25% reduction in Y-BOCS score).22
Other medications
Antipsychotics. Most studies examining antipsychotic monotherapy for OCD have been negative. One exception was a small, open-label trial of aripiprazole monotherapy (N = 8) that found modest efficacy among non–treatment refractory patients.23 Augmentation with antipsychotics, however, has been well studied and there is good evidence of efficacy for this approach. Double-blind, placebo-controlled studies have supported the efficacy of augmenting SRIs with haloperidol, risperidone, olanzapine, quetiapine, and aripiprazole.24-26 Several case reports suggest ziprasidone may be an effective SRI adjunct, but 1 retrospective study found it was inferior to quetiapine.27
Benzodiazepines. Case reports present positive effects of clonazepam and alprazolam for OCD, but double-blind, placebo-controlled trials for monotherapy or adjunctive clonazepam have been negative.28,29 Furthermore, cognitive impairment and potential for dependence associated with benzodiazepines weigh against their use in OCD.
Opioids. A double-blind, placebo controlled crossover study of 23 patients with treatment-refractory OCD found once-weekly oral morphine added to patients’ current regimen significantly reduced Y-BOCS score vs placebo. Patients received 30 mg the first week and 15 to 45 mg the next week, depending on response or side effects.30 A case report and a small open-label trial support the efficacy of tramadol, a weak agonist of the μ opioid receptor and an inhibitor of serotonin and norepinephrine transporters, as monotherapy and as an adjunct to fluoxetine.31,32 Because patients with OCD may be particularly vulnerable to dependence and intentional or accidental overdose via opioid/benzodiazepine combinations, evaluate the risks and benefits before initiating an opioid.
Psychostimulants. Sparse but good evidence supports the efficacy of dextroamphetamine monotherapy for OCD.33,34 There are no positive studies of methylphenidate and several case reports of methylphenidate-induced OCD symptoms.35
N-methyl-D-aspartate (NMDA) antagonists. Increased glutamatergic neurotransmission has been implicated in the pathophysiology of OCD, which suggests a possible role for glutamate receptor antagonists. In an open-label trial, memantine, an NMDA antagonist used primarily to treat dementia, was associated with clinical response (>25% reduction in Y-BOCS scores) in 6 of 14 patients with treatment-refractory OCD.36 Several case reports and an open-label trial support the efficacy of riluzole—which is indicated for treating amyotrophic lateral sclerosis—as an adjunct for treatment-refractory OCD.37 Although its exact mechanism of action is unclear, riluzole’s effects are thought to be mediated via reduction in glutamatergic neurotransmission. IV ketamine has reported anti-OCD effects in a case report of a woman with treatment-resistant OCD. These effects occurred almost immediately and persisted for several days.38
Hallucinogens. Psilocybin, psilocin, and lysergic acid diethylamide have reported anti-OCD properties.39 As schedule I substances, however, they are not available outside of sanctioned research protocols and may carry substantial risk. Nonetheless, their efficacy suggests that other compounds that share their mechanism of action—namely agonism of 5-HT2A and 5-HT2C receptors—may merit investigation as potential treatments for OCD.
Psychotherapy
Cognitive-behavioral therapy (CBT) has been shown to be effective for OCD as monotherapy and augmentation to pharmacotherapy. CBT consists of cognitive and behavioral components, typically involving some form of cognitive restructuring and exposure response prevention. Although these 2 types of interventions arise from independent traditions, in CBT they are frequently intertwined, particularly when the focus of OCD patients’ anxiety is ego-dystonic thoughts.
One benefit of CBT over pharmacotherapy is that effects persist after treatment is terminated. A recent prospective study found CBT was effective for treatment-refractory OCD, with 74% of patients demonstrating clinical response after 20 to 25 sessions over 2 months and 61% maintaining clinical response 1 year after treatment.40 CBT administered remotely via teleconference, also known as “teletherapy,” has shown efficacy for OCD.41
Alternative medicine
Despite widespread use of herbal remedies for OCD, no trials have shown a strong positive effect. Both Hypericum perforatum (St. John’s wort) and Silybum marianum (milk thistle) have been used to treat obsessive and compulsive symptoms; however, placebo-controlled trials did not find any significant differences in symptoms or side effects between treatment groups.42,43 Lower-quality studies have reported modest effects for mindfulness meditation, yoga, and acupuncture.44
Because many patients continue to use complementary and alternative medicine therapies despite the lack of data on efficacy, it is important to monitor for potential interactions with prescription medications. St. John’s wort interacts with many medications because of induction of the cytochrome P450 (CYP) isoenzymes 3A4 and 2C9. This interaction may lower blood levels of alprazolam and clonazepam (3A4). Combining St. John’s wort with SSRIs increases the risk of serotonin syndrome. Milk thistle inhibits CYP450 isoenzyme 3A4, and may increase serum levels of other medications metabolized by this pathway.
Invasive therapies
Invasive options may be considered after several pharmacotherapeutic and psychotherapeutic approaches have not been effective or when significant functional impairment remains (Table 2). These therapies typically are reserved for patients whose treatment resistance is strongest.
Electroconvulsive therapy (ECT). Although ECT is an effective tool for treatment-resistant mood disorders or treatment-resistant anxiety complicated by severe depression, studies have not found ECT to be effective for OCD. One uncontrolled case series reported considerable improvements in OCD patients the year after ECT, although improvement was correlated with improved depression scores.45
Vagal nerve stimulation (VNS). In an open-label study of 7 OCD patients who received VNS, 3 were acute responders—characterized by a ≥25% improvement on the Y-BOCS—and 2 received continued benefits at 4-year follow up (2 patients dropped out).46
Repetitive transcranial magnetic stimulation (rTMS). A meta-analysis of 3 RCTs of rTMS for patients with OCD did not yield a large or statistically significant effect.47 Limitations of these trials included asymmetric stimulation sites (eg, left vs right only), limited stimulation sites (dorsolateral prefrontal cortex), different stimulation frequencies between studies, and a lack of sham stimulation conditions. A more recent RCT and subsequent review described moderate efficacy (defined by ≥25% decrease in Y-BOCS scores) compared with sham stimulations in OCD patients at 4 weeks, using the supplementary motor area as a stimulation site.48,49
The main limitation of rTMS is the inability to penetrate deeper brain structures implicated in OCD (eg, caudate nucleus, thalamus, anterior capsule fiber tracts), as well as a lack of specificity in stimulation site.
Surgical approaches. Cingulotomy is the most commonly employed surgical procedure for OCD in North America, likely because of a combination of clinical efficacy and low morbidity and mortality rates.50 Of the >1,000 cingulotomies that have been performed at Massachusetts General Hospital, no deaths or postoperative infections have been reported and 2 subdural hematomas have occurred.50 Common postsurgical side effects include transient headache, nausea, or difficulty urinating. The most serious common side effect—postoperative seizures—has been reported in 1% to 9% of cases.
Outcomes for these procedures cannot be fully assessed until at least 6 months to 2 years after the procedure, which suggests postoperative neural reorganization plays an important role in recovery. Direct comparisons of each lesion approach within studies are extremely rare. Overall, long-term outcomes of these approaches have demonstrated significant therapeutic effects of each of these procedures. Reported response rates vary between 30% to 70%, when applied to remission, response (≥35% Y-BOCS reduction), and functional improvements in quality of life.50
Deep brain stimulation (DBS). With this approach, small electrodes are inserted under precise stereotactic MRI guidance. The advantage of DBS over ablative surgery is the ability to adjust and customize neurostimulation. Following implantation, modifiable parameters of electrode stimulation include electrode polarity, intensity, frequency, and laterality. A specially trained psychiatrist can conduct parameter optimization during long-term follow-up.
The first trial of DBS for OCD was reported in 1999 (N = 4), with the initial target selected based on the site of anterior capsulotomy. Three patients derived clinically observed benefit, although no validated questionnaires were administered.51 Since then, at least 7 studies with blinded stimulation have been conducted, totaling 62 patients.52
In recent years, structures adjacent to the internal capsule also have been targeted based on the approach employed in ventral capsulotomy. Across all trials, response rates for this approach consistently have been in the 50% range, with average Y-BOCS score reductions ranging from 6.8 to 31 points.53 Some patients have reported rapid improvements in anhedonia, and this approach is being employed in treatment-resistant depression.
Postoperative complications occur more often with DBS than with lesion approaches because of the prosthetic nature of the procedure (eg, increased risk of infection, lead malfunction, etc.). Additionally, batteries must be periodically explanted and replaced. Reported stimulation-related side effects include mood changes (transient sadness, anxiety, euphoria, and hypomania), sensory disturbances (olfactory, gustatory, and motor sensations), and cognitive changes (confusion and forgetfulness). These side effects typically are stimulation-dependent and disappear after altering stimulation parameters.
Table 2
Invasive therapies for treatment-resistant OCD
| Therapy | Quality of evidence |
|---|---|
| Reversible | |
| Electroconvulsive therapy | Poor |
| Vagal nerve stimulation | Poor |
| Repetitive transcranial magnetic stimulation | Limited |
| Irreversible (surgical) | |
| Anterior capsulotomy. Target: anterior limb of the internal capsule | Fair |
| Anterior cingulotomy. Target: anterior cingulate and cingulum bundle | Fair |
| Subcaudate tractotomy. Target: substantia innominata, just inferior to the caudate nucleus | Fair |
| Limbic leucotomy. Target: anterior cingulotomy combined with subcaudate tractotomy | Fair |
| Deep brain stimulation. Multiple targets | Fair |
| OCD: obsessive-compulsive disorder | |
Related Resources
- American Psychiatric Association. Treatment of patients with obsessive-compulsive disorder. www.psychiatryonline.com/pracGuide/pracGuideTopic_10.aspx.
- Hyman BM, Pedrick C. The OCD workbook. Your guide to breaking free from obsessive compulsive disorder. 3rd ed. Oakland, CA: New Harbinger Publications Inc; 2010.
- Baer L. Getting control: overcoming your obsessions and compulsions. Revised ed. New York, NY: Plume; 2000.
Drug Brand Names
- Alprazolam • Xanax
- Aripiprazole • Abilify
- Citalopram • Celexa
- Clomipramine • Anafranil
- Clonazepam • Klonopin
- Dextroamphetamine • Adderall
- Duloxetine • Cymbalta
- Fluoxetine • Prozac
- Fluvoxamine • Luvox
- Haloperidol • Haldol
- Ketamine • Ketalar
- Memantine • Namenda
- Methylphenidate • Ritalin
- Morphine • MS Contin
- Olanzapine • Zyprexa
- Ondansetron • Zofran
- Pindolol • Visken
- Quetiapine • Seroquel
- Riluzole • Rilutek
- Risperidone • Risperdal
- Sertraline • Zoloft
- Tramadol • Ultram
- Venlafaxine • Effexor
- Ziprasidone • Geodon
Disclosures
Drs. Khalsa and Schiffman report no financial relationship with any company whose products are mentioned in this article or with manufacturers of competing products.
Dr. Bystritsky receives grant support from AstraZeneca, Brainways, Takeda, and Transcept and is a founder, stockholder, and consultant for BrainSonix.
1. Pallanti S, Quercioli L. Treatment-refractory obsessive-compulsive disorder: methodological issues operational definitions and therapeutic lines. Prog Neuropsychopharmacol Biol Psychiatry. 2006;30(3):400-412.
2. Bystritsky A. Treatment-resistant anxiety disorders. Mol Psychiatry. 2006;11(9):805-814.
3. Denys D. Pharmacotherapy of obsessive-compulsive disorder and obsessive-compulsive spectrum disorders. Psychiatr Clin North Am. 2006;29(2):553-584 xi.
4. Ackerman DL, Greenland S. Multivariate meta-analysis of controlled drug studies for obsessive-compulsive disorder. J Clin Psychopharmacol. 2002;22(3):309-317.
5. Soomro GM, Altman D, Rajagopal S, et al. Selective serotonin re-uptake inhibitors (SSRIs) versus placebo for obsessive compulsive disorder (OCD). Cochrane Database Syst Rev. 2008;(1):CD001765.-
6. Bloch MH, McGuire J, Landeros-Weisenberger A, et al. Meta-analysis of the dose-response relationship of SSRI in obsessive-compulsive disorder. Mol Psychiatry. 2010;15(8):850-855.
7. Koran LM, Hanna GL, Hollander E, et al. American Psychiatric Association. Practice guideline for the treatment of patients with obsessive-compulsive disorder. Am J Psychiatry. 2007;164(7 suppl):5-53.
8. Ninan PT, Koran LM, Kiev A, et al. High-dose sertraline strategy for nonresponders to acute treatment for obsessive-compulsive disorder: a multicenter double-blind trial. J Clin Psychiatry. 2006;67(1):15-22.
9. Food and Drug Administration. FDA drug safety communication: abnormal heart rhythms associated with high doses of Celexa (citalopram hydrobromide). http://www.fda.gov/Drugs/DrugSafety/ucm269086.htm#sa. Published August 24 2011. Accessed September 27, 2011.
10. Yaryura-Tobias JA, Neziroglu FA. Venlafaxine in obsessive-compulsive disorder. Arch Gen Psychiatry. 1996;53(7):653-654.
11. Phelps NJ, Cates ME. The role of venlafaxine in the treatment of obsessive-compulsive disorder. Ann Pharmacother. 2005;39(1):136-140.
12. Dell’osso B, Mundo E, Marazziti D, et al. Switching from serotonin reuptake inhibitors to duloxetine in patients with resistant obsessive compulsive disorder: a case series. J Psychopharmacol. 2008;22(2):210-213.
13. Pallanti S, Quercioli L, Paiva RS, et al. Citalopram for treatment-resistant obsessive-compulsive disorder. Eur Psychiatry. 1999;14:101-106.
14. Ravizza L, Barzega G, Bellino S, et al. Therapeutic effect and safety of adjunctive risperidone in refractory obsessive-compulsive disorder (OCD). Psychopharmacol Bull. 1996;32:677-682.
15. Fallon BA, Liebowitz MR, Campeas R, et al. Intravenous clomipramine for obsessive-compulsive disorder refractory to oral clomipramine: a placebo-controlled study. Arch Gen Psychiatry. 1998;55:918-924.
16. Koran LM, Pallanti S, Paiva RS, et al. Pulse loading versus gradual dosing of intravenous clomipramine in obsessive-compulsive disorder. Eur Neuropsychopharmacol. 1998;8:121-126.
17. Dannon PN, Sasson Y, Hirschmann S, et al. Pindolol augmentation in treatment-resistant obsessive compulsive disorder: a double-blind placebo controlled trial. Eur Neuropsychopharmacol. 2000;10:165-169.
18. Koran LM, Mueller K, Maloney A. Will pindolol augment the response to a serotonin reuptake inhibitor in obsessive-compulsive disorder? J Clin Psychopharmacol. 1996;16:253-254.
19. Hewlett WA, Vinogradov S, Agras WS. Clomipramine clonazepam, and clonidine treatment of obsessive-compulsive disorder. J Clin Psychopharmacol. 1992;12:420-430.
20. Mundo E, Guglielmo E, Bellodi L. Effect of adjuvant pindolol on the antiobsessional response to fluvoxamine: a double-blind placebo-controlled study. Int Clin Psychopharmacol. 1998;13:219-224.
21. Hewlett WA, Schmid SP, Salomon RM. Pilot trial of ondansetron in the treatment of 8 patients with obsessive-compulsive disorder. J Clin Psychiatry. 2003;64:1025-1030.
22. Pallanti S, Bernardi S, Antonini S, et al. Ondansetron augmentation in treatment-resistant obsessive-compulsive disorder: a preliminary, single-blind, prospective study. CNS Drugs. 2009;23(12):1047-1055.
23. Connor KM, Payne VM, Gadde KM, et al. The use of aripiprazole in obsessive-compulsive disorder: preliminary observations in 8 patients. J Clin Psychiatry. 2005;66:49-51.
24. Komossa K, Depping AM, Meyer M, et al. Second-generation antipsychotics for obsessive compulsive disorder. Cochrane Database Syst Rev. 2010;(12):CD008141.-
25. Bloch MH, Landeros-Weisenberger A, Kelmendi B, et al. A systematic review: antipsychotic augmentation with treatment refractory obsessive-compulsive disorder. Mol Psychiatry. 2006;11(7):622-632.
26. Muscatello MR, Bruno A, Pandolfo G, et al. Effect of aripiprazole augmentation of serotonin reuptake inhibitors or clomipramine in treatment-resistant obsessive-compulsive disorder: a double-blind, placebo-controlled study. J Clin Psychopharmacol. 2011;31(2):174-179.
27. Savas HA, Yumru M, Ozen ME. Quetiapine and ziprasidone as adjuncts in treatment-resistant obsessive-compulsive disorder: a retrospective comparative study. Clin Drug Investig. 2008;28(7):439-442.
28. Hollander E, Kaplan A, Stahl SM. A double-blind placebo-controlled trial of clonazepam in obsessive-compulsive disorder. World J Biol Psychiatry. 2003;4:30-34.
29. Crockett BA, Churchill E, Davidson JR. A double-blind combination study of clonazepam with sertraline in obsessive-compulsive disorder. Ann Clin Psychiatry. 2004;16(3):127-132.
30. Koran LM, Aboujaoude E, Bullock KD, et al. Double-blind treatment with oral morphine in treatment-resistant obsessive-compulsive disorder. J Clin Psychiatry. 2005;66(3):353-359.
31. Shapira NA, Keck PE Jr, Goldsmith TD, et al. Open-label pilot study of tramadol hydrochloride in treatment-refractory obsessive-compulsive disorder. Depress Anxiety. 1997;6:170-173.
32. Goldsmith TB, Shapira NA, Keck PE Jr. Rapid remission of OCD with tramadol hydrochloride. Am J Psychiatry. 1999;156(4):660-661.
33. Insel TR, Hamilton JA, Guttmacher LB, et al. D-amphetamine in obsessive-compulsive disorder. Psychopharmacology (Berl). 1983;80:231-235.
34. Joffe RT, Swinson RP, Levitt AJ. Acute psychostimulant challenge in primary obsessive-compulsive disorder. J Clin Psychopharmacol. 1991;11:237-241.
35. Woolley JB, Heyman I. Dexamphetamine for obsessive-compulsive disorder. Am J Psychiatry. 2003;160:183.-
36. Aboujaoude E, Barry JJ, Gamel N. Memantine augmentation in treatment-resistant obsessive-compulsive disorder: an open-label trial. J Clin Psychopharmacol. 2009;29(1):51-55.
37. Coric V, Taskiran S, Pittenger C, et al. Riluzole augmentation in treatment-resistant obsessive-compulsive disorder: an open-label trial. Biol Psychiatry. 2005;58(5):424-428.
38. Rodriguez CI, Kegeles LS, Flood P, et al. Rapid resolution of obsessions after an infusion of intravenous ketamine in a patient with treatment-resistant obsessive-compulsive disorder. J Clin Psychiatry. 2011;72(4):567-569.
39. Leonard HL, Rapoport JL. Relief of obsessive-compulsive symptoms by LSD and psilocin. Am J Psychiatry. 1987;144(9):1239-1240.
40. Anand N, Sudhir PM, Math SB, et al. Cognitive behavior therapy in medication non-responders with obsessive-compulsive disorder: a prospective 1-year follow-up study. J Anxiety Disord. 2011;25(7):939-945.
41. Himle JA, Fischer DJ, Muroff JR, et al. Videoconferencing-based cognitive-behavioral therapy for obsessive-compulsive disorder. Behav Res Ther. 2006;44(12):1821-1829.
42. Kobak KA, Taylor LV, Bystritsky A, et al. St John’s wort versus placebo in obsessive-compulsive disorder: results from a double-blind study. Int Clin Psychopharmacol. 2005;20(6):299-304.
43. Sayyah M, Boostani H, Pakseresht S, et al. Comparison of Silybum marianum (L.) Gaertn. with fluoxetine in the treatment of obsessive-compulsive Disorder. Prog Neuropsychopharmacol Biol Psychiatry. 2010;34(2):362-365.
44. Sarris J, Camfield D, Berk M. Complementary medicine self-help, and lifestyle interventions for obsessive compulsive disorder (OCD) and the OCD spectrum: a systematic review. J Affect Disord. 2011 (epub ahead of print).
45. Beale MD, Kellner CH, Pritchett JT, et al. ECT for OCD. J Clin Psychiatry. 1995;56(2):81-82.
46. George MS, Ward HE Jr, Ninan PT, et al. A pilot study of vagus nerve stimulation (VNS) for treatment-resistant anxiety disorders. Brain Stimul. 2008;1(2):112-121.
47. Slotema CW, Blom JD, Hoek HW, et al. Should we expand the toolbox of psychiatric treatment methods to include repetitive transcranial magnetic stimulation (rTMS)? A meta-analysis of the efficacy of rTMS in psychiatric disorders. J Clin Psychiatry. 2010;71(7):873-884.
48. Mantovani A, Simpson HB, Fallon BA, et al. Randomized sham-controlled trial of repetitive transcranial magnetic stimulation in treatment-resistant obsessive-compulsive disorder. Int J Neuropsychopharmacol. 2010;13(2):217-227.
49. Blom RM, Figee M, Vulink N, et al. Update on repetitive transcranial magnetic stimulation in obsessive-compulsive disorder: different targets. Curr Psychiatry Rep. 2011;13(4):289-294.
50. Greenberg BD, Rauch SL, Haber SN. Invasive circuitry-based neurotherapeutics: stereotactic ablation and deep brain stimulation for OCD. Neuropsychopharmacology. 2010;35(1):317-336.
51. Nuttin B, Cosyns P, Demeulemeester H, et al. Electrical stimulation in anterior limbs of internal capsules in patients with obsessive-compulsive disorder. Lancet. 1999;354(9189):1526.-
52. de Koning PP, Figee M, van den Munckhof P, et al. Current status of deep brain stimulation for obsessive-compulsive disorder: a clinical review of different targets. Curr Psychiatry Rep. 2011;13(4):274-282.
53. Greenberg BD, Gabriels LA, Malone DA, Jr, et al. Deep brain stimulation of the ventral internal capsule/ventral striatum for obsessive-compulsive disorder: worldwide experience. Mol Psychiatry. 2010;15(1):64-79.
1. Pallanti S, Quercioli L. Treatment-refractory obsessive-compulsive disorder: methodological issues operational definitions and therapeutic lines. Prog Neuropsychopharmacol Biol Psychiatry. 2006;30(3):400-412.
2. Bystritsky A. Treatment-resistant anxiety disorders. Mol Psychiatry. 2006;11(9):805-814.
3. Denys D. Pharmacotherapy of obsessive-compulsive disorder and obsessive-compulsive spectrum disorders. Psychiatr Clin North Am. 2006;29(2):553-584 xi.
4. Ackerman DL, Greenland S. Multivariate meta-analysis of controlled drug studies for obsessive-compulsive disorder. J Clin Psychopharmacol. 2002;22(3):309-317.
5. Soomro GM, Altman D, Rajagopal S, et al. Selective serotonin re-uptake inhibitors (SSRIs) versus placebo for obsessive compulsive disorder (OCD). Cochrane Database Syst Rev. 2008;(1):CD001765.-
6. Bloch MH, McGuire J, Landeros-Weisenberger A, et al. Meta-analysis of the dose-response relationship of SSRI in obsessive-compulsive disorder. Mol Psychiatry. 2010;15(8):850-855.
7. Koran LM, Hanna GL, Hollander E, et al. American Psychiatric Association. Practice guideline for the treatment of patients with obsessive-compulsive disorder. Am J Psychiatry. 2007;164(7 suppl):5-53.
8. Ninan PT, Koran LM, Kiev A, et al. High-dose sertraline strategy for nonresponders to acute treatment for obsessive-compulsive disorder: a multicenter double-blind trial. J Clin Psychiatry. 2006;67(1):15-22.
9. Food and Drug Administration. FDA drug safety communication: abnormal heart rhythms associated with high doses of Celexa (citalopram hydrobromide). http://www.fda.gov/Drugs/DrugSafety/ucm269086.htm#sa. Published August 24 2011. Accessed September 27, 2011.
10. Yaryura-Tobias JA, Neziroglu FA. Venlafaxine in obsessive-compulsive disorder. Arch Gen Psychiatry. 1996;53(7):653-654.
11. Phelps NJ, Cates ME. The role of venlafaxine in the treatment of obsessive-compulsive disorder. Ann Pharmacother. 2005;39(1):136-140.
12. Dell’osso B, Mundo E, Marazziti D, et al. Switching from serotonin reuptake inhibitors to duloxetine in patients with resistant obsessive compulsive disorder: a case series. J Psychopharmacol. 2008;22(2):210-213.
13. Pallanti S, Quercioli L, Paiva RS, et al. Citalopram for treatment-resistant obsessive-compulsive disorder. Eur Psychiatry. 1999;14:101-106.
14. Ravizza L, Barzega G, Bellino S, et al. Therapeutic effect and safety of adjunctive risperidone in refractory obsessive-compulsive disorder (OCD). Psychopharmacol Bull. 1996;32:677-682.
15. Fallon BA, Liebowitz MR, Campeas R, et al. Intravenous clomipramine for obsessive-compulsive disorder refractory to oral clomipramine: a placebo-controlled study. Arch Gen Psychiatry. 1998;55:918-924.
16. Koran LM, Pallanti S, Paiva RS, et al. Pulse loading versus gradual dosing of intravenous clomipramine in obsessive-compulsive disorder. Eur Neuropsychopharmacol. 1998;8:121-126.
17. Dannon PN, Sasson Y, Hirschmann S, et al. Pindolol augmentation in treatment-resistant obsessive compulsive disorder: a double-blind placebo controlled trial. Eur Neuropsychopharmacol. 2000;10:165-169.
18. Koran LM, Mueller K, Maloney A. Will pindolol augment the response to a serotonin reuptake inhibitor in obsessive-compulsive disorder? J Clin Psychopharmacol. 1996;16:253-254.
19. Hewlett WA, Vinogradov S, Agras WS. Clomipramine clonazepam, and clonidine treatment of obsessive-compulsive disorder. J Clin Psychopharmacol. 1992;12:420-430.
20. Mundo E, Guglielmo E, Bellodi L. Effect of adjuvant pindolol on the antiobsessional response to fluvoxamine: a double-blind placebo-controlled study. Int Clin Psychopharmacol. 1998;13:219-224.
21. Hewlett WA, Schmid SP, Salomon RM. Pilot trial of ondansetron in the treatment of 8 patients with obsessive-compulsive disorder. J Clin Psychiatry. 2003;64:1025-1030.
22. Pallanti S, Bernardi S, Antonini S, et al. Ondansetron augmentation in treatment-resistant obsessive-compulsive disorder: a preliminary, single-blind, prospective study. CNS Drugs. 2009;23(12):1047-1055.
23. Connor KM, Payne VM, Gadde KM, et al. The use of aripiprazole in obsessive-compulsive disorder: preliminary observations in 8 patients. J Clin Psychiatry. 2005;66:49-51.
24. Komossa K, Depping AM, Meyer M, et al. Second-generation antipsychotics for obsessive compulsive disorder. Cochrane Database Syst Rev. 2010;(12):CD008141.-
25. Bloch MH, Landeros-Weisenberger A, Kelmendi B, et al. A systematic review: antipsychotic augmentation with treatment refractory obsessive-compulsive disorder. Mol Psychiatry. 2006;11(7):622-632.
26. Muscatello MR, Bruno A, Pandolfo G, et al. Effect of aripiprazole augmentation of serotonin reuptake inhibitors or clomipramine in treatment-resistant obsessive-compulsive disorder: a double-blind, placebo-controlled study. J Clin Psychopharmacol. 2011;31(2):174-179.
27. Savas HA, Yumru M, Ozen ME. Quetiapine and ziprasidone as adjuncts in treatment-resistant obsessive-compulsive disorder: a retrospective comparative study. Clin Drug Investig. 2008;28(7):439-442.
28. Hollander E, Kaplan A, Stahl SM. A double-blind placebo-controlled trial of clonazepam in obsessive-compulsive disorder. World J Biol Psychiatry. 2003;4:30-34.
29. Crockett BA, Churchill E, Davidson JR. A double-blind combination study of clonazepam with sertraline in obsessive-compulsive disorder. Ann Clin Psychiatry. 2004;16(3):127-132.
30. Koran LM, Aboujaoude E, Bullock KD, et al. Double-blind treatment with oral morphine in treatment-resistant obsessive-compulsive disorder. J Clin Psychiatry. 2005;66(3):353-359.
31. Shapira NA, Keck PE Jr, Goldsmith TD, et al. Open-label pilot study of tramadol hydrochloride in treatment-refractory obsessive-compulsive disorder. Depress Anxiety. 1997;6:170-173.
32. Goldsmith TB, Shapira NA, Keck PE Jr. Rapid remission of OCD with tramadol hydrochloride. Am J Psychiatry. 1999;156(4):660-661.
33. Insel TR, Hamilton JA, Guttmacher LB, et al. D-amphetamine in obsessive-compulsive disorder. Psychopharmacology (Berl). 1983;80:231-235.
34. Joffe RT, Swinson RP, Levitt AJ. Acute psychostimulant challenge in primary obsessive-compulsive disorder. J Clin Psychopharmacol. 1991;11:237-241.
35. Woolley JB, Heyman I. Dexamphetamine for obsessive-compulsive disorder. Am J Psychiatry. 2003;160:183.-
36. Aboujaoude E, Barry JJ, Gamel N. Memantine augmentation in treatment-resistant obsessive-compulsive disorder: an open-label trial. J Clin Psychopharmacol. 2009;29(1):51-55.
37. Coric V, Taskiran S, Pittenger C, et al. Riluzole augmentation in treatment-resistant obsessive-compulsive disorder: an open-label trial. Biol Psychiatry. 2005;58(5):424-428.
38. Rodriguez CI, Kegeles LS, Flood P, et al. Rapid resolution of obsessions after an infusion of intravenous ketamine in a patient with treatment-resistant obsessive-compulsive disorder. J Clin Psychiatry. 2011;72(4):567-569.
39. Leonard HL, Rapoport JL. Relief of obsessive-compulsive symptoms by LSD and psilocin. Am J Psychiatry. 1987;144(9):1239-1240.
40. Anand N, Sudhir PM, Math SB, et al. Cognitive behavior therapy in medication non-responders with obsessive-compulsive disorder: a prospective 1-year follow-up study. J Anxiety Disord. 2011;25(7):939-945.
41. Himle JA, Fischer DJ, Muroff JR, et al. Videoconferencing-based cognitive-behavioral therapy for obsessive-compulsive disorder. Behav Res Ther. 2006;44(12):1821-1829.
42. Kobak KA, Taylor LV, Bystritsky A, et al. St John’s wort versus placebo in obsessive-compulsive disorder: results from a double-blind study. Int Clin Psychopharmacol. 2005;20(6):299-304.
43. Sayyah M, Boostani H, Pakseresht S, et al. Comparison of Silybum marianum (L.) Gaertn. with fluoxetine in the treatment of obsessive-compulsive Disorder. Prog Neuropsychopharmacol Biol Psychiatry. 2010;34(2):362-365.
44. Sarris J, Camfield D, Berk M. Complementary medicine self-help, and lifestyle interventions for obsessive compulsive disorder (OCD) and the OCD spectrum: a systematic review. J Affect Disord. 2011 (epub ahead of print).
45. Beale MD, Kellner CH, Pritchett JT, et al. ECT for OCD. J Clin Psychiatry. 1995;56(2):81-82.
46. George MS, Ward HE Jr, Ninan PT, et al. A pilot study of vagus nerve stimulation (VNS) for treatment-resistant anxiety disorders. Brain Stimul. 2008;1(2):112-121.
47. Slotema CW, Blom JD, Hoek HW, et al. Should we expand the toolbox of psychiatric treatment methods to include repetitive transcranial magnetic stimulation (rTMS)? A meta-analysis of the efficacy of rTMS in psychiatric disorders. J Clin Psychiatry. 2010;71(7):873-884.
48. Mantovani A, Simpson HB, Fallon BA, et al. Randomized sham-controlled trial of repetitive transcranial magnetic stimulation in treatment-resistant obsessive-compulsive disorder. Int J Neuropsychopharmacol. 2010;13(2):217-227.
49. Blom RM, Figee M, Vulink N, et al. Update on repetitive transcranial magnetic stimulation in obsessive-compulsive disorder: different targets. Curr Psychiatry Rep. 2011;13(4):289-294.
50. Greenberg BD, Rauch SL, Haber SN. Invasive circuitry-based neurotherapeutics: stereotactic ablation and deep brain stimulation for OCD. Neuropsychopharmacology. 2010;35(1):317-336.
51. Nuttin B, Cosyns P, Demeulemeester H, et al. Electrical stimulation in anterior limbs of internal capsules in patients with obsessive-compulsive disorder. Lancet. 1999;354(9189):1526.-
52. de Koning PP, Figee M, van den Munckhof P, et al. Current status of deep brain stimulation for obsessive-compulsive disorder: a clinical review of different targets. Curr Psychiatry Rep. 2011;13(4):274-282.
53. Greenberg BD, Gabriels LA, Malone DA, Jr, et al. Deep brain stimulation of the ventral internal capsule/ventral striatum for obsessive-compulsive disorder: worldwide experience. Mol Psychiatry. 2010;15(1):64-79.
Sharpening the Saw
In 1863, Abraham Lincoln established a Thursday in November as a national day for Thanksgiving. Previous U.S. presidents and Congresses had intermittently appointed days for thanksgiving. After 1863, November became an annual tradition.
A day of thanksgiving can become a day for reflection and self-renewal. It is a time to go beyond thankfulness for mind (knowledge) and body (technical skills). It is also a day to renew the spirit (psyche).
Stephen Covey’s book "The 7 Habits of Highly Effective People" lists habit No. 7 as "Sharpen the Saw." He points out that a sharp saw cuts wood faster, but many people behave as if they are too busy cutting wood to stop and sharpen the saw. This actually makes them even slower and less productive. Tools accomplish more when they are properly taken care of. The same is true for people.
Many other self-help books offer similar advice. Self-renewal is partly letting go of baggage that is weighing you down. It is partly adjusting attitude, as the motivational cliché proclaims: "You can’t change the wind, but you can adjust your sails." It is partly developing strategies for the upcoming week, month, or year.
Medical conferences offer opportunities to update one’s knowledge through continuing medical education. Occasionally these opportunities are training sessions to learn new skills, which might be surgical procedures or even tasks on a computer. However, the most critical item to be updated is the aspiration of the physician himself or herself. Medicine is a calling. In the long run, instilling and maintaining the attitudes and vision of a vocation, in one’s self and one’s colleagues, is the most important activity of a professional.
Instilling Values Through Initiation
The Hippocratic Oath has been around for millennia. One of the recent additions to the rituals of health care has been the White Coat Ceremony. In just 20 years, the annual ritual has become prevalent at the majority of medical schools, as well as colleges of pharmacy and advanced nursing programs. The ritual has even spread internationally. Detractors say there isn’t empirical data about the long term benefits of a White Coat Ceremony, but I find support for it in analogous examples that have a longer history.
Whether it is a church, a fraternity or sorority, or a secular organization, initiation ceremonies are ubiquitous. It is hard to believe that these rites would continue if the senior leadership didn’t reflect back on their careers and assess the rites as valuable. Recently, I had the opportunity to visit the Harry S. Truman Library and Museum in Independence, Mo. A small part of the exhibit was dedicated to his joining the Masons.
The exhibit noted that: "The Masonic Order offered ethical guidance, companionship, and acceptance among other Masons, wherever he might travel." And more specifically, it had a quote from Truman:
"The Scottish Rite has done its best to make a man of me, but they had such a grade of material to start with that they did a poor job I fear. It is the most impressive ceremony I ever saw or read. If a man doesn’t try better after seeing it, he has a screw loose somewhere."
Truman was initially known in Washington D.C. as "the Senator from Pendergast." T.J. Pendergast was a political boss in Kansas City very similar to the more famous Al Capone who ran Chicago. Pendergast was instrumental in getting Truman elected, which led many senators to shun Harry. But within a few years, he was the senator spearheading investigations into corruption and quality problems in the manufacture of military equipment during World War II.
Maintaining the Vision
Aspirational rituals alone do not guarantee ethical behavior. But history demonstrates that professional behavior is better with rituals than without them. Since an oath alone isn’t adequate, it seems prudent for a profession to add another layer of social regulation, such as empowering patients with lists of rights and responsibilities. But initiation ceremonies and regulation aren’t enough. To be a great profession, worthy of the public’s trust and status, individual physicians must periodically refine and reaffirm the values, ideals, and goals that called them to care for others. There are many ways this can be done.
The highly effective physician realizes that keeping up to date reading the medical literature is important, but she can help her patients even more by reading one less journal article a month and using that time to make a habit of renewing her commitment to her core values. On Nov. 19, 1863, 1 week before that national day of Thanksgiving, President Lincoln took a train ride to a small town in Pennsylvania. He went to dedicate a cemetery. He talked eloquently about dedication and devotion to a cause. It takes but 2 minutes each Nov. 19 for me to recite his Gettysburg Address. I am not devoted to exactly the same cause, but I still find it inspirational.
It is important to have an activity that prompts and promotes sharpening the saw. As you may have surmised, personally, I like to visit museums.
Dr. Powell is associate professor of pediatrics at Saint Louis University and a pediatric hospitalist at SSM Cardinal Glennon Children’s Medical Center in St. Louis.
In 1863, Abraham Lincoln established a Thursday in November as a national day for Thanksgiving. Previous U.S. presidents and Congresses had intermittently appointed days for thanksgiving. After 1863, November became an annual tradition.
A day of thanksgiving can become a day for reflection and self-renewal. It is a time to go beyond thankfulness for mind (knowledge) and body (technical skills). It is also a day to renew the spirit (psyche).
Stephen Covey’s book "The 7 Habits of Highly Effective People" lists habit No. 7 as "Sharpen the Saw." He points out that a sharp saw cuts wood faster, but many people behave as if they are too busy cutting wood to stop and sharpen the saw. This actually makes them even slower and less productive. Tools accomplish more when they are properly taken care of. The same is true for people.
Many other self-help books offer similar advice. Self-renewal is partly letting go of baggage that is weighing you down. It is partly adjusting attitude, as the motivational cliché proclaims: "You can’t change the wind, but you can adjust your sails." It is partly developing strategies for the upcoming week, month, or year.
Medical conferences offer opportunities to update one’s knowledge through continuing medical education. Occasionally these opportunities are training sessions to learn new skills, which might be surgical procedures or even tasks on a computer. However, the most critical item to be updated is the aspiration of the physician himself or herself. Medicine is a calling. In the long run, instilling and maintaining the attitudes and vision of a vocation, in one’s self and one’s colleagues, is the most important activity of a professional.
Instilling Values Through Initiation
The Hippocratic Oath has been around for millennia. One of the recent additions to the rituals of health care has been the White Coat Ceremony. In just 20 years, the annual ritual has become prevalent at the majority of medical schools, as well as colleges of pharmacy and advanced nursing programs. The ritual has even spread internationally. Detractors say there isn’t empirical data about the long term benefits of a White Coat Ceremony, but I find support for it in analogous examples that have a longer history.
Whether it is a church, a fraternity or sorority, or a secular organization, initiation ceremonies are ubiquitous. It is hard to believe that these rites would continue if the senior leadership didn’t reflect back on their careers and assess the rites as valuable. Recently, I had the opportunity to visit the Harry S. Truman Library and Museum in Independence, Mo. A small part of the exhibit was dedicated to his joining the Masons.
The exhibit noted that: "The Masonic Order offered ethical guidance, companionship, and acceptance among other Masons, wherever he might travel." And more specifically, it had a quote from Truman:
"The Scottish Rite has done its best to make a man of me, but they had such a grade of material to start with that they did a poor job I fear. It is the most impressive ceremony I ever saw or read. If a man doesn’t try better after seeing it, he has a screw loose somewhere."
Truman was initially known in Washington D.C. as "the Senator from Pendergast." T.J. Pendergast was a political boss in Kansas City very similar to the more famous Al Capone who ran Chicago. Pendergast was instrumental in getting Truman elected, which led many senators to shun Harry. But within a few years, he was the senator spearheading investigations into corruption and quality problems in the manufacture of military equipment during World War II.
Maintaining the Vision
Aspirational rituals alone do not guarantee ethical behavior. But history demonstrates that professional behavior is better with rituals than without them. Since an oath alone isn’t adequate, it seems prudent for a profession to add another layer of social regulation, such as empowering patients with lists of rights and responsibilities. But initiation ceremonies and regulation aren’t enough. To be a great profession, worthy of the public’s trust and status, individual physicians must periodically refine and reaffirm the values, ideals, and goals that called them to care for others. There are many ways this can be done.
The highly effective physician realizes that keeping up to date reading the medical literature is important, but she can help her patients even more by reading one less journal article a month and using that time to make a habit of renewing her commitment to her core values. On Nov. 19, 1863, 1 week before that national day of Thanksgiving, President Lincoln took a train ride to a small town in Pennsylvania. He went to dedicate a cemetery. He talked eloquently about dedication and devotion to a cause. It takes but 2 minutes each Nov. 19 for me to recite his Gettysburg Address. I am not devoted to exactly the same cause, but I still find it inspirational.
It is important to have an activity that prompts and promotes sharpening the saw. As you may have surmised, personally, I like to visit museums.
Dr. Powell is associate professor of pediatrics at Saint Louis University and a pediatric hospitalist at SSM Cardinal Glennon Children’s Medical Center in St. Louis.
In 1863, Abraham Lincoln established a Thursday in November as a national day for Thanksgiving. Previous U.S. presidents and Congresses had intermittently appointed days for thanksgiving. After 1863, November became an annual tradition.
A day of thanksgiving can become a day for reflection and self-renewal. It is a time to go beyond thankfulness for mind (knowledge) and body (technical skills). It is also a day to renew the spirit (psyche).
Stephen Covey’s book "The 7 Habits of Highly Effective People" lists habit No. 7 as "Sharpen the Saw." He points out that a sharp saw cuts wood faster, but many people behave as if they are too busy cutting wood to stop and sharpen the saw. This actually makes them even slower and less productive. Tools accomplish more when they are properly taken care of. The same is true for people.
Many other self-help books offer similar advice. Self-renewal is partly letting go of baggage that is weighing you down. It is partly adjusting attitude, as the motivational cliché proclaims: "You can’t change the wind, but you can adjust your sails." It is partly developing strategies for the upcoming week, month, or year.
Medical conferences offer opportunities to update one’s knowledge through continuing medical education. Occasionally these opportunities are training sessions to learn new skills, which might be surgical procedures or even tasks on a computer. However, the most critical item to be updated is the aspiration of the physician himself or herself. Medicine is a calling. In the long run, instilling and maintaining the attitudes and vision of a vocation, in one’s self and one’s colleagues, is the most important activity of a professional.
Instilling Values Through Initiation
The Hippocratic Oath has been around for millennia. One of the recent additions to the rituals of health care has been the White Coat Ceremony. In just 20 years, the annual ritual has become prevalent at the majority of medical schools, as well as colleges of pharmacy and advanced nursing programs. The ritual has even spread internationally. Detractors say there isn’t empirical data about the long term benefits of a White Coat Ceremony, but I find support for it in analogous examples that have a longer history.
Whether it is a church, a fraternity or sorority, or a secular organization, initiation ceremonies are ubiquitous. It is hard to believe that these rites would continue if the senior leadership didn’t reflect back on their careers and assess the rites as valuable. Recently, I had the opportunity to visit the Harry S. Truman Library and Museum in Independence, Mo. A small part of the exhibit was dedicated to his joining the Masons.
The exhibit noted that: "The Masonic Order offered ethical guidance, companionship, and acceptance among other Masons, wherever he might travel." And more specifically, it had a quote from Truman:
"The Scottish Rite has done its best to make a man of me, but they had such a grade of material to start with that they did a poor job I fear. It is the most impressive ceremony I ever saw or read. If a man doesn’t try better after seeing it, he has a screw loose somewhere."
Truman was initially known in Washington D.C. as "the Senator from Pendergast." T.J. Pendergast was a political boss in Kansas City very similar to the more famous Al Capone who ran Chicago. Pendergast was instrumental in getting Truman elected, which led many senators to shun Harry. But within a few years, he was the senator spearheading investigations into corruption and quality problems in the manufacture of military equipment during World War II.
Maintaining the Vision
Aspirational rituals alone do not guarantee ethical behavior. But history demonstrates that professional behavior is better with rituals than without them. Since an oath alone isn’t adequate, it seems prudent for a profession to add another layer of social regulation, such as empowering patients with lists of rights and responsibilities. But initiation ceremonies and regulation aren’t enough. To be a great profession, worthy of the public’s trust and status, individual physicians must periodically refine and reaffirm the values, ideals, and goals that called them to care for others. There are many ways this can be done.
The highly effective physician realizes that keeping up to date reading the medical literature is important, but she can help her patients even more by reading one less journal article a month and using that time to make a habit of renewing her commitment to her core values. On Nov. 19, 1863, 1 week before that national day of Thanksgiving, President Lincoln took a train ride to a small town in Pennsylvania. He went to dedicate a cemetery. He talked eloquently about dedication and devotion to a cause. It takes but 2 minutes each Nov. 19 for me to recite his Gettysburg Address. I am not devoted to exactly the same cause, but I still find it inspirational.
It is important to have an activity that prompts and promotes sharpening the saw. As you may have surmised, personally, I like to visit museums.
Dr. Powell is associate professor of pediatrics at Saint Louis University and a pediatric hospitalist at SSM Cardinal Glennon Children’s Medical Center in St. Louis.
Contarini's Syndrome
The application of Ockham's razor, or the law of parsimony, to clinical reasoning implies selecting the competing hypothesis that makes the fewest new assumptions based on known factors. Thus, the prevailing hypothesis when confronting a patient with a bilateral pleural effusion would be that a single disease likely explains the accumulation of pleural fluid on both sides. Although the principle of diagnostic parsimony has become axiomatic for the differential diagnosis of diseases, it might not hold true for all cases. That is, the counterpart to Ockham's razor, known as Hickam's dictum, states that patients can have as many diseases as they damn well please. An example is Contarini's condition. Francesco Contarini (1556‐1624) died 1 year after he became the 95th Doge of Venice. The postmortem study revealed a right pleural effusion, probably due to heart failure and a contralateral empyema.1 Since then, it became apparent that bilateral pleural effusions might have more than a single explanation. To improve knowledge of this entity, coined as Contarini's condition by Kutty and Varkey in 1978,2 we systematically searched for cases from a large prospectively maintained pleural fluid database at the Arnau de Vilanova University Hospital (Lleida, Spain), a 470‐bed general medical center serving a population of 400,000 inhabitants. An analysis of previously documented cases was also performed.
Information was gathered from all consecutive patients who have undergone pleural fluid aspiration and analysis during the last 16 years at our institution. Medical records were screened of those patients submitted to bilateral thoracentesis, during a single hospital admission, that resulted in pleural fluids with markedly different biochemical characteristics. Written informed consent was obtained from all patients to use their clinical data in future investigations. The local ethics committee approved this study. In addition, the Embase and PubMed databases were searched using the keywords Contarini's condition, Contarini's syndrome, and bilateral pleural effusion to identify all previously reported cases. Pleural effusion etiology and definition of transudate/exudate were established by standard criteria. Specifically, complicated parapneumonic effusion referred to those pneumonia‐associated non‐purulent effusions that needed a tube thoracostomy for resolution.
Of 2605 patients from our database, 546 (21%) had bilateral pleural effusions, mostly due to heart failure (286 patients) and malignancy (102 patients). There were only 5 (0.9%) patients who had bilateral effusions of different etiologies which, added to an additional 7 patients identified via literature review,1‐7 totaled 12 cases. Their characteristics are summarized in Table 1. However, it should be noted that 4 of the 7 previously reported cases were described as the concurrence of chylothorax and malignant effusion.3‐5, 7 This combination may result from a common causative factor (ie, lymphoma or metastatic carcinoma), thus bringing into question their status as valid examples of Contarini's condition. Aside from these cases, bacterial infections (ie, parapneumonics and empyema) represent the most common coexisting disease in Contarini's cases, particularly in association with heart failure (50% of the cases). The reason behind this is that pneumonia may precipitate an acute decompensation of heart failure. In a recent study, 7.4% of 33,130 patients developed heart failure during hospitalization for pneumonia.8
| Reports | Age/Sex | Characteristics of the Right‐Sided Effusion | Characteristics of the Left‐Sided Effusion | Right/Left‐Sided Effusion Diagnoses | Notes |
|---|---|---|---|---|---|
| |||||
| Reference | |||||
| Jarcho1 | 68/M | Watery | Pus | Heart failure/empyema | The patient was named Francesco Contarini. Final diagnoses result from a retrospective interpretation of the autopsy study performed 3 centuries earlier. |
| Kutty and Varkey2 | 57/M | Lymphocytic exudate with negative culture | Neuthophilic exudate with positive culture for S. aureus | Probable malignant (leukemia)/empyema | No cytological or histological pleural studies were performed on the right side. |
| Lawton et al.3 | 57/F | Straw‐colored, positive malignant cytology | Chylous, positive malignant cytology | Malignant (SVC syndrome)/malignant chylothorax | The autopsy study showed tumor thrombosis of SVC and metastatic mediastinal lymphadenopathy from an ovarian adenocarcinoma. |
| Fred4 | ND/M | Chylous with negative cytology | Bloody, with positive cytology consistent with lymphoma | Chylothorax/malignant | Lymphoma could have eventually explained both chylothorax and malignant effusion. |
| Brannen and Berman5 | 48/F | Chylous with negative cytology | Straw‐colored exudate with negative cytology | Chylothorax/probable malignant | A non‐Hodgkin's lymphoma was responsible for the bilateral effusions. Pleural fluid triglyceride levels were not available on the left side. |
| Dixit et al.6 | 23/M | Pus, positive culture for S. aureus | Lymphocytic exudate, smear positive for acid‐fast bacilli | Empyema/tuberculosis | The patient tested positive for HIV infection. |
| Khan et al.7 | 46/F | Serous, positive cytology | Milky, negative for malignancy | Malignant/chylothorax | The patient had metastatic ovarian carcinoma. |
| Current series | |||||
| Patient 1 | 79/M | Neutrophilic exudate with normal pH and glucose; negative cytology and culture | Transudate | Subphrenic abscess/hypervolemia due to perioperative excessive volume load | The patient had acute cholecystitis. |
| Patient 2 | 49/F | Transudate | Neutrophilic exudate with pH 7.1, glucose 1 mg/dL, and detection of pneumococcal antigen in pleural fluid | Pericardial disease/simple parapneumonic effusion | Pericardial involvement was considered secondary to pneumococcal disease. Left‐sided effusion cured only with antibiotics. |
| Patient 3 | 73/M | Neutrophilic exudate with pH 7, glucose 9 mg/dL, and negative cultures and cytology | Borderline lymphocytic exudate with normal pH and glucose, and negative cultures and cytology | Complicated parapneumonic effusion/radiation pleuritis | The patient had a history of radiotherapy for a gastric adenocarcinoma. |
| Patient 4 | 57/M | Pus | Transudate | Empyema/heart failure | |
| Patient 5 | 76/M | Transudate | Neutrophilic exudate with pH 7.1 and negative cultures | Heart failure/complicated parapneumonic effusion | |
Kalomenidis et al. studied 27 patients with bilateral pleural effusions who underwent bilateral thoracentesis to determine if the findings were the same.9 They found that the main biochemical and cellular features on both sides were generally similar, except for 2 (7.5%) cases which had significantly different pleural fluid lactate dehydrogenase (LDH) levels. Although a plausible explanation for the latter was not given, this circumstance did not change the categorization of the effusions. The authors concluded that bilateral diagnostic thoracenteses were not necessary unless there was a specific clinical indication. The fact that most patients with bilateral pleural effusions are submitted to a unilateral thoracentesis may have resulted in an underestimation of the current prevalence of Contarini's syndrome. In our series, differing lung and pleural computed tomographic (CT) imaging characteristics between both hemithoraces was the primary reason for performing bilateral pleural taps in all 5 cases. After the dual diagnosis, the corresponding patients benefited from an additional therapeutic intervention, mainly treatment for heart failure. Therefore, the rationale to exceptionally consider a bilateral diagnostic thoracentesis is to avoid missing significant pathology by sampling the wrong pleural space (in particular, one caused by heart failure) and thus failing to properly diagnose contralateral exudative effusion with an attendant serious etiology.
In conclusion, Contarini's syndrome is a rare and distinct entity, but probably underdiagnosed. Although a bilateral pleural fluid aspiration is seldom justified in routine clinical practice, it should be considered if any of the following are met: unilateral parenchymal lung involvement, significantly disparate‐sized effusions, markedly different attenuation values (Hounsfield units) or appearance (eg, unilateral pleural loculations or enhancement) on CT, atypical clinical findings (fever or pleuritic chest pain in the context of decompensated heart failure), resolution of pleural effusion only on 1 side, and the diagnosis of pleural diseases usually associated with unilateral effusions (eg, pneumonia). However, it should be stressed that these are expert, rather than evidence‐based, recommendations.
- .Empyema or hydrothorax in the ninety‐five Doge of Venice.Bull N Y Acad Med.1970;46:378–385.
- ,.“Contarini's condition:” bilateral pleural effusion with markedly different characteristics.Chest1978;74:679–680.
- ,,.Co‐existent chylous and serous pleural effusions associated with ovarian cancer: a case report of Contarini's syndrome.Eur J Surg Oncol.1985;11:177–178.
- .Contarini's condition.South Med J.1992;85:33–34.
- ,.Contarini's condition: paradise regained.South Med J.1992;85:1153–1154.
- ,,.Contarini's syndrome in a HIV positive patient.J Assoc Physicians India2004;52:841–842.
- ,,,.Contarini syndrome resulting from ovarian carcinoma [abstract].Chest2007;132:703S.
- ,,, et al.Incidence of cardiovascular events after hospital admission for pneumonia.Am J Med.2011;124:244–251.
- ,,, et al.Patient with bilateral pleural effusion. Are the findings the same in each fluid?Chest2003;124:167–176.
The application of Ockham's razor, or the law of parsimony, to clinical reasoning implies selecting the competing hypothesis that makes the fewest new assumptions based on known factors. Thus, the prevailing hypothesis when confronting a patient with a bilateral pleural effusion would be that a single disease likely explains the accumulation of pleural fluid on both sides. Although the principle of diagnostic parsimony has become axiomatic for the differential diagnosis of diseases, it might not hold true for all cases. That is, the counterpart to Ockham's razor, known as Hickam's dictum, states that patients can have as many diseases as they damn well please. An example is Contarini's condition. Francesco Contarini (1556‐1624) died 1 year after he became the 95th Doge of Venice. The postmortem study revealed a right pleural effusion, probably due to heart failure and a contralateral empyema.1 Since then, it became apparent that bilateral pleural effusions might have more than a single explanation. To improve knowledge of this entity, coined as Contarini's condition by Kutty and Varkey in 1978,2 we systematically searched for cases from a large prospectively maintained pleural fluid database at the Arnau de Vilanova University Hospital (Lleida, Spain), a 470‐bed general medical center serving a population of 400,000 inhabitants. An analysis of previously documented cases was also performed.
Information was gathered from all consecutive patients who have undergone pleural fluid aspiration and analysis during the last 16 years at our institution. Medical records were screened of those patients submitted to bilateral thoracentesis, during a single hospital admission, that resulted in pleural fluids with markedly different biochemical characteristics. Written informed consent was obtained from all patients to use their clinical data in future investigations. The local ethics committee approved this study. In addition, the Embase and PubMed databases were searched using the keywords Contarini's condition, Contarini's syndrome, and bilateral pleural effusion to identify all previously reported cases. Pleural effusion etiology and definition of transudate/exudate were established by standard criteria. Specifically, complicated parapneumonic effusion referred to those pneumonia‐associated non‐purulent effusions that needed a tube thoracostomy for resolution.
Of 2605 patients from our database, 546 (21%) had bilateral pleural effusions, mostly due to heart failure (286 patients) and malignancy (102 patients). There were only 5 (0.9%) patients who had bilateral effusions of different etiologies which, added to an additional 7 patients identified via literature review,1‐7 totaled 12 cases. Their characteristics are summarized in Table 1. However, it should be noted that 4 of the 7 previously reported cases were described as the concurrence of chylothorax and malignant effusion.3‐5, 7 This combination may result from a common causative factor (ie, lymphoma or metastatic carcinoma), thus bringing into question their status as valid examples of Contarini's condition. Aside from these cases, bacterial infections (ie, parapneumonics and empyema) represent the most common coexisting disease in Contarini's cases, particularly in association with heart failure (50% of the cases). The reason behind this is that pneumonia may precipitate an acute decompensation of heart failure. In a recent study, 7.4% of 33,130 patients developed heart failure during hospitalization for pneumonia.8
| Reports | Age/Sex | Characteristics of the Right‐Sided Effusion | Characteristics of the Left‐Sided Effusion | Right/Left‐Sided Effusion Diagnoses | Notes |
|---|---|---|---|---|---|
| |||||
| Reference | |||||
| Jarcho1 | 68/M | Watery | Pus | Heart failure/empyema | The patient was named Francesco Contarini. Final diagnoses result from a retrospective interpretation of the autopsy study performed 3 centuries earlier. |
| Kutty and Varkey2 | 57/M | Lymphocytic exudate with negative culture | Neuthophilic exudate with positive culture for S. aureus | Probable malignant (leukemia)/empyema | No cytological or histological pleural studies were performed on the right side. |
| Lawton et al.3 | 57/F | Straw‐colored, positive malignant cytology | Chylous, positive malignant cytology | Malignant (SVC syndrome)/malignant chylothorax | The autopsy study showed tumor thrombosis of SVC and metastatic mediastinal lymphadenopathy from an ovarian adenocarcinoma. |
| Fred4 | ND/M | Chylous with negative cytology | Bloody, with positive cytology consistent with lymphoma | Chylothorax/malignant | Lymphoma could have eventually explained both chylothorax and malignant effusion. |
| Brannen and Berman5 | 48/F | Chylous with negative cytology | Straw‐colored exudate with negative cytology | Chylothorax/probable malignant | A non‐Hodgkin's lymphoma was responsible for the bilateral effusions. Pleural fluid triglyceride levels were not available on the left side. |
| Dixit et al.6 | 23/M | Pus, positive culture for S. aureus | Lymphocytic exudate, smear positive for acid‐fast bacilli | Empyema/tuberculosis | The patient tested positive for HIV infection. |
| Khan et al.7 | 46/F | Serous, positive cytology | Milky, negative for malignancy | Malignant/chylothorax | The patient had metastatic ovarian carcinoma. |
| Current series | |||||
| Patient 1 | 79/M | Neutrophilic exudate with normal pH and glucose; negative cytology and culture | Transudate | Subphrenic abscess/hypervolemia due to perioperative excessive volume load | The patient had acute cholecystitis. |
| Patient 2 | 49/F | Transudate | Neutrophilic exudate with pH 7.1, glucose 1 mg/dL, and detection of pneumococcal antigen in pleural fluid | Pericardial disease/simple parapneumonic effusion | Pericardial involvement was considered secondary to pneumococcal disease. Left‐sided effusion cured only with antibiotics. |
| Patient 3 | 73/M | Neutrophilic exudate with pH 7, glucose 9 mg/dL, and negative cultures and cytology | Borderline lymphocytic exudate with normal pH and glucose, and negative cultures and cytology | Complicated parapneumonic effusion/radiation pleuritis | The patient had a history of radiotherapy for a gastric adenocarcinoma. |
| Patient 4 | 57/M | Pus | Transudate | Empyema/heart failure | |
| Patient 5 | 76/M | Transudate | Neutrophilic exudate with pH 7.1 and negative cultures | Heart failure/complicated parapneumonic effusion | |
Kalomenidis et al. studied 27 patients with bilateral pleural effusions who underwent bilateral thoracentesis to determine if the findings were the same.9 They found that the main biochemical and cellular features on both sides were generally similar, except for 2 (7.5%) cases which had significantly different pleural fluid lactate dehydrogenase (LDH) levels. Although a plausible explanation for the latter was not given, this circumstance did not change the categorization of the effusions. The authors concluded that bilateral diagnostic thoracenteses were not necessary unless there was a specific clinical indication. The fact that most patients with bilateral pleural effusions are submitted to a unilateral thoracentesis may have resulted in an underestimation of the current prevalence of Contarini's syndrome. In our series, differing lung and pleural computed tomographic (CT) imaging characteristics between both hemithoraces was the primary reason for performing bilateral pleural taps in all 5 cases. After the dual diagnosis, the corresponding patients benefited from an additional therapeutic intervention, mainly treatment for heart failure. Therefore, the rationale to exceptionally consider a bilateral diagnostic thoracentesis is to avoid missing significant pathology by sampling the wrong pleural space (in particular, one caused by heart failure) and thus failing to properly diagnose contralateral exudative effusion with an attendant serious etiology.
In conclusion, Contarini's syndrome is a rare and distinct entity, but probably underdiagnosed. Although a bilateral pleural fluid aspiration is seldom justified in routine clinical practice, it should be considered if any of the following are met: unilateral parenchymal lung involvement, significantly disparate‐sized effusions, markedly different attenuation values (Hounsfield units) or appearance (eg, unilateral pleural loculations or enhancement) on CT, atypical clinical findings (fever or pleuritic chest pain in the context of decompensated heart failure), resolution of pleural effusion only on 1 side, and the diagnosis of pleural diseases usually associated with unilateral effusions (eg, pneumonia). However, it should be stressed that these are expert, rather than evidence‐based, recommendations.
The application of Ockham's razor, or the law of parsimony, to clinical reasoning implies selecting the competing hypothesis that makes the fewest new assumptions based on known factors. Thus, the prevailing hypothesis when confronting a patient with a bilateral pleural effusion would be that a single disease likely explains the accumulation of pleural fluid on both sides. Although the principle of diagnostic parsimony has become axiomatic for the differential diagnosis of diseases, it might not hold true for all cases. That is, the counterpart to Ockham's razor, known as Hickam's dictum, states that patients can have as many diseases as they damn well please. An example is Contarini's condition. Francesco Contarini (1556‐1624) died 1 year after he became the 95th Doge of Venice. The postmortem study revealed a right pleural effusion, probably due to heart failure and a contralateral empyema.1 Since then, it became apparent that bilateral pleural effusions might have more than a single explanation. To improve knowledge of this entity, coined as Contarini's condition by Kutty and Varkey in 1978,2 we systematically searched for cases from a large prospectively maintained pleural fluid database at the Arnau de Vilanova University Hospital (Lleida, Spain), a 470‐bed general medical center serving a population of 400,000 inhabitants. An analysis of previously documented cases was also performed.
Information was gathered from all consecutive patients who have undergone pleural fluid aspiration and analysis during the last 16 years at our institution. Medical records were screened of those patients submitted to bilateral thoracentesis, during a single hospital admission, that resulted in pleural fluids with markedly different biochemical characteristics. Written informed consent was obtained from all patients to use their clinical data in future investigations. The local ethics committee approved this study. In addition, the Embase and PubMed databases were searched using the keywords Contarini's condition, Contarini's syndrome, and bilateral pleural effusion to identify all previously reported cases. Pleural effusion etiology and definition of transudate/exudate were established by standard criteria. Specifically, complicated parapneumonic effusion referred to those pneumonia‐associated non‐purulent effusions that needed a tube thoracostomy for resolution.
Of 2605 patients from our database, 546 (21%) had bilateral pleural effusions, mostly due to heart failure (286 patients) and malignancy (102 patients). There were only 5 (0.9%) patients who had bilateral effusions of different etiologies which, added to an additional 7 patients identified via literature review,1‐7 totaled 12 cases. Their characteristics are summarized in Table 1. However, it should be noted that 4 of the 7 previously reported cases were described as the concurrence of chylothorax and malignant effusion.3‐5, 7 This combination may result from a common causative factor (ie, lymphoma or metastatic carcinoma), thus bringing into question their status as valid examples of Contarini's condition. Aside from these cases, bacterial infections (ie, parapneumonics and empyema) represent the most common coexisting disease in Contarini's cases, particularly in association with heart failure (50% of the cases). The reason behind this is that pneumonia may precipitate an acute decompensation of heart failure. In a recent study, 7.4% of 33,130 patients developed heart failure during hospitalization for pneumonia.8
| Reports | Age/Sex | Characteristics of the Right‐Sided Effusion | Characteristics of the Left‐Sided Effusion | Right/Left‐Sided Effusion Diagnoses | Notes |
|---|---|---|---|---|---|
| |||||
| Reference | |||||
| Jarcho1 | 68/M | Watery | Pus | Heart failure/empyema | The patient was named Francesco Contarini. Final diagnoses result from a retrospective interpretation of the autopsy study performed 3 centuries earlier. |
| Kutty and Varkey2 | 57/M | Lymphocytic exudate with negative culture | Neuthophilic exudate with positive culture for S. aureus | Probable malignant (leukemia)/empyema | No cytological or histological pleural studies were performed on the right side. |
| Lawton et al.3 | 57/F | Straw‐colored, positive malignant cytology | Chylous, positive malignant cytology | Malignant (SVC syndrome)/malignant chylothorax | The autopsy study showed tumor thrombosis of SVC and metastatic mediastinal lymphadenopathy from an ovarian adenocarcinoma. |
| Fred4 | ND/M | Chylous with negative cytology | Bloody, with positive cytology consistent with lymphoma | Chylothorax/malignant | Lymphoma could have eventually explained both chylothorax and malignant effusion. |
| Brannen and Berman5 | 48/F | Chylous with negative cytology | Straw‐colored exudate with negative cytology | Chylothorax/probable malignant | A non‐Hodgkin's lymphoma was responsible for the bilateral effusions. Pleural fluid triglyceride levels were not available on the left side. |
| Dixit et al.6 | 23/M | Pus, positive culture for S. aureus | Lymphocytic exudate, smear positive for acid‐fast bacilli | Empyema/tuberculosis | The patient tested positive for HIV infection. |
| Khan et al.7 | 46/F | Serous, positive cytology | Milky, negative for malignancy | Malignant/chylothorax | The patient had metastatic ovarian carcinoma. |
| Current series | |||||
| Patient 1 | 79/M | Neutrophilic exudate with normal pH and glucose; negative cytology and culture | Transudate | Subphrenic abscess/hypervolemia due to perioperative excessive volume load | The patient had acute cholecystitis. |
| Patient 2 | 49/F | Transudate | Neutrophilic exudate with pH 7.1, glucose 1 mg/dL, and detection of pneumococcal antigen in pleural fluid | Pericardial disease/simple parapneumonic effusion | Pericardial involvement was considered secondary to pneumococcal disease. Left‐sided effusion cured only with antibiotics. |
| Patient 3 | 73/M | Neutrophilic exudate with pH 7, glucose 9 mg/dL, and negative cultures and cytology | Borderline lymphocytic exudate with normal pH and glucose, and negative cultures and cytology | Complicated parapneumonic effusion/radiation pleuritis | The patient had a history of radiotherapy for a gastric adenocarcinoma. |
| Patient 4 | 57/M | Pus | Transudate | Empyema/heart failure | |
| Patient 5 | 76/M | Transudate | Neutrophilic exudate with pH 7.1 and negative cultures | Heart failure/complicated parapneumonic effusion | |
Kalomenidis et al. studied 27 patients with bilateral pleural effusions who underwent bilateral thoracentesis to determine if the findings were the same.9 They found that the main biochemical and cellular features on both sides were generally similar, except for 2 (7.5%) cases which had significantly different pleural fluid lactate dehydrogenase (LDH) levels. Although a plausible explanation for the latter was not given, this circumstance did not change the categorization of the effusions. The authors concluded that bilateral diagnostic thoracenteses were not necessary unless there was a specific clinical indication. The fact that most patients with bilateral pleural effusions are submitted to a unilateral thoracentesis may have resulted in an underestimation of the current prevalence of Contarini's syndrome. In our series, differing lung and pleural computed tomographic (CT) imaging characteristics between both hemithoraces was the primary reason for performing bilateral pleural taps in all 5 cases. After the dual diagnosis, the corresponding patients benefited from an additional therapeutic intervention, mainly treatment for heart failure. Therefore, the rationale to exceptionally consider a bilateral diagnostic thoracentesis is to avoid missing significant pathology by sampling the wrong pleural space (in particular, one caused by heart failure) and thus failing to properly diagnose contralateral exudative effusion with an attendant serious etiology.
In conclusion, Contarini's syndrome is a rare and distinct entity, but probably underdiagnosed. Although a bilateral pleural fluid aspiration is seldom justified in routine clinical practice, it should be considered if any of the following are met: unilateral parenchymal lung involvement, significantly disparate‐sized effusions, markedly different attenuation values (Hounsfield units) or appearance (eg, unilateral pleural loculations or enhancement) on CT, atypical clinical findings (fever or pleuritic chest pain in the context of decompensated heart failure), resolution of pleural effusion only on 1 side, and the diagnosis of pleural diseases usually associated with unilateral effusions (eg, pneumonia). However, it should be stressed that these are expert, rather than evidence‐based, recommendations.
- .Empyema or hydrothorax in the ninety‐five Doge of Venice.Bull N Y Acad Med.1970;46:378–385.
- ,.“Contarini's condition:” bilateral pleural effusion with markedly different characteristics.Chest1978;74:679–680.
- ,,.Co‐existent chylous and serous pleural effusions associated with ovarian cancer: a case report of Contarini's syndrome.Eur J Surg Oncol.1985;11:177–178.
- .Contarini's condition.South Med J.1992;85:33–34.
- ,.Contarini's condition: paradise regained.South Med J.1992;85:1153–1154.
- ,,.Contarini's syndrome in a HIV positive patient.J Assoc Physicians India2004;52:841–842.
- ,,,.Contarini syndrome resulting from ovarian carcinoma [abstract].Chest2007;132:703S.
- ,,, et al.Incidence of cardiovascular events after hospital admission for pneumonia.Am J Med.2011;124:244–251.
- ,,, et al.Patient with bilateral pleural effusion. Are the findings the same in each fluid?Chest2003;124:167–176.
- .Empyema or hydrothorax in the ninety‐five Doge of Venice.Bull N Y Acad Med.1970;46:378–385.
- ,.“Contarini's condition:” bilateral pleural effusion with markedly different characteristics.Chest1978;74:679–680.
- ,,.Co‐existent chylous and serous pleural effusions associated with ovarian cancer: a case report of Contarini's syndrome.Eur J Surg Oncol.1985;11:177–178.
- .Contarini's condition.South Med J.1992;85:33–34.
- ,.Contarini's condition: paradise regained.South Med J.1992;85:1153–1154.
- ,,.Contarini's syndrome in a HIV positive patient.J Assoc Physicians India2004;52:841–842.
- ,,,.Contarini syndrome resulting from ovarian carcinoma [abstract].Chest2007;132:703S.
- ,,, et al.Incidence of cardiovascular events after hospital admission for pneumonia.Am J Med.2011;124:244–251.
- ,,, et al.Patient with bilateral pleural effusion. Are the findings the same in each fluid?Chest2003;124:167–176.
Patient Satisfaction with Hospital Care
Over the past decade, hospital medicine has been the nation's fastest‐growing medical specialty. According to the American Hospital Association's (AHA) 2009 survey, 58% of United States (US) hospitals now have hospital medicine programs, and for hospitals with 200 or more beds, this figure is 89%.1 In 2009, the AHA estimated that the number of US hospitalists would increase to over 34,000 by 2011, over double that of the 16,000 present in 2005.1 Studies demonstrate that, compared to a system where primary care physicians provide inpatient care, the hospitalist model improves efficiency while maintaining at least equal patient outcomes.211 However, scant data exist as to the effects of hospitalists on patient satisfaction.12 Understanding how care models affect patient experience is vital in the current environment of healthcare reform and performance reporting, especially in light of the Centers for Medicare and Medicaid Services' (CMS) efforts to link the patient experience to reimbursement through value‐based purchasing.13 Value‐based purchasing is a strategy to encourage and reward excellence in healthcare delivery through differential reimbursement based on defined performance measures. As one part of value‐based purchasing, hospital reimbursement will be linked to patient‐experience measures, including patient ratings of their doctor's ability to communicate with them and other questions assessing patient satisfaction with their hospital stay.14
In the outpatient setting, trust is the variable most strongly associated with patient satisfaction.1518 In contrast to PCPs, who may develop relationships with patients over years, hospitalists often first meet a patient in the hospital and must engender trust quickly. In addition, hospitalists work in shifts and may not be responsible for the same patients each day. Since continuity is positively related to trust,19, 20 there is reason to believe satisfaction with hospitalist care might be lower than satisfaction with care provided by PCPs. We report on 8295 patients and 6 years experience with hospitalist programs at 3 hospitals. Based on the known link between continuity and patient satisfaction, we hypothesized that patient satisfaction would be lower with hospitalists than with primary care internists.
METHODS
Setting
Our study was conducted at 3 Western Massachusetts hospitals affiliated with Baystate Health, an integrated healthcare delivery system. These included 2 small community hospitals (<100 beds) and a 653‐bed tertiary care, academic teaching hospital. Hospitalist services were established at the tertiary care center in 2001 and at the community hospitals in 2004 and 2005; the programs have evolved over time. In addition, the tertiary care center has 3 different hospitalist groups: an academic group that is employed by the hospital and works with house staff, a hospitalist service that is owned by the hospital and cares for patients from specific outpatient practices, and one that is privately owned caring for patients from another group of practices. The community hospitals each have a single, hospital‐owned service. Primary care physicians also provide inpatient care at all 3 institutions, although their number has decreased over time as the hospitalist programs have grown. All hospitalist services varied in the number of consecutive days in a rounding cycle (degree of continuity), and which services had an admitting team (single initial physician encounter with a different rounding physician) versus a single physician being both the admitting and rounding physician. Consequently, continuity, as measured by the number of different physicians caring for an individual patient during 1 hospitalization, would be expected to vary depending on the type of hospitalist service and the length of stay. Likewise, patients admitted by their primary care physician's office may have been cared for by either their PCP or a practice colleague. All hospitalists and PCPs care for inpatients having similar hospital experiences, as all aspects of a patient's care (including the medical wards, nursing staff, discharge planners, and information systems) are identical, regardless of physician designation. The study was approved by Baystate Health System's Institutional Review Board.
Data Collection
Since February 2001, Baystate Health, in conjunction with Professional Research Consultants, Inc (PRC), has conducted scripted postdischarge patient satisfaction telephone interviews of random discharged adult medicine patients, with Hospital Consumer Assessment of Healthcare Providers and Systems (HCAHPS) questions added in January 2007. Approximately 50 surveys per quarter, per hospital floor, were conducted. Trained PRC staff assessed up to 115 variables encompassing the inpatient experience. We limited our analysis to those domains that reflected satisfaction with physician care, including satisfaction with physician care quality, physician communication, physician behavior, and pain management. The survey responses were scored, depending on question type, with: never, sometimes, usually, always (HCAHPS); or excellent, very good, good, fair, poor (PRC). Each score was converted to a numeric equivalent, with the highest score (4 or 5, depending on scale used) being best and 1 being worst. The specific questions are included in Supporting Appendix A in the online version of this article.
Additional patient information for respondents was extracted from the hospitals' billing database, using medical record numbers, and included age, gender, admission year, education level, language, illness severity, emergency room (ER) admission status, institution, and attending physician type (academic hospitalist [AH], hospital‐owned hospitalist [HOH], private hospitalist [PH], or primary care physician [PCP]). It was not possible to distinguish whether PCP patients were cared for by their own PCP or a colleague from the same practice.
Statistical Analysis
Patient satisfaction data were derived from survey responses of adult inpatients cared for by hospitalists or PCPs between January 1, 2003 and March 31, 2009. The primary outcome was patient‐reported satisfaction with physician care quality measured on a 5‐point Likert scale. In a secondary analysis, physician groups were compared on the proportion of responses that were excellent (a score of 5 on the Likert scale) and the proportion that were poor (a score of 1). Other secondary outcomes included patient satisfaction ratings of physician behavior, pain management, and communication. Averages and percent ranking excellent and poor were calculated for each hospitalist group and for PCPs. Other outcomes analyzed included average patient satisfaction with physician care quality, both over time and stratified by the presence or absence of having an established PCP prior to admission.
In view of the large sample size, Likert‐scale responses were analyzed as continuous outcomes. For unadjusted comparisons among hospitalist groups, t tests and 1‐way ANOVAs were conducted for the scales scores, while chi‐square tests were used for dichotomous outcomes. For multivariable analyses, multiple linear regression was used for continuous outcomes. For dichotomous outcomes, adjusted prevalence ratios were estimated using Poisson regression with robust standard errors.21 All multivariable models controlled for sex, marital status, illness severity, age group, ethnicity, length of stay, and emergency room admission. Observations with missing data were excluded from analyses. Differences in bivariable and multivariable analyses were considered significant at a critical test level of 5%. Prevalence ratios are reported with 95% confidence intervals. All analyses were conducted in Stata, version 11 (StataCorp, College Station, TX).
RESULTS
Of patients who were reached by telephone, 87% agreed to participate in the hospital survey. However, most patients could not be reached by phone; thus our estimated response rate, including those who could not be reached, was 27%. For the subset of patients interviewed using the HCAHPS protocol, the response rate was 40%. Our final sample included 8295 patients (3597 cared for by 59 hospitalists and 4698 by 288 PCPs) interviewed between 2003 and 2009. Three‐quarters of the patients were from the tertiary care center, whereas 17% and 8% were from each of the community hospitals (see Supporting Appendix B in the online version of this article). Patient characteristics appear in Table 1. Patients cared for by hospitalists were similar to those cared for by PCPs in terms of age, sex, marital status, education, and language, but hospitalist patients were more likely to have been admitted through the emergency department (93% vs 84%, P < 0.001) and less likely to be white (83% vs 85%, P = 0.01). Patients cared for by hospitalists also had higher average illness severity score (2.2 0.8 vs 2.0 0.8, P < 0.001), longer average LOS (4.3 4.3 vs 4.0 3.6, P < 0.001), and lower mean perceived health score (2.8 1.2 vs 3.0 1.2, P = 0.01).
| Characteristic | PCP N = 4698 | Hospitalist N = 3597 | P Value |
|---|---|---|---|
| |||
| Age (mean, SD) | 63.5 (16.6) | 63.7 (16.3) | 0.53 |
| Male sex (%) | 44.9 | 46.2 | 0.28 |
| White race (%) | 85.3 | 83.2 | 0.01 |
| Married (%) | 49.1 | 48.7 | 0.69 |
| English spoken at home (%) | 96.0 | 97.0 | 0.09 |
| At least some college education (%) | 47.1 | 43.7 | 0.22 |
| Admitted through the emergency department (%) | 84.3 | 92.5 | <0.001 |
| Average illness severity rating (mean, SD) | 2.0 (0.8) | 2.2 (0.8) | <0.001 |
| Average perceived health score (mean, SD) | 3.0 (1.2) | 2.8 (1.2) | 0.01 |
| Average length of stay (days) (mean, SD) | 4.0 (3.6) | 4.3 (4.3) | <0.001 |
| Discharged home (%) | 87.9 | 88.5 | 0.73 |
Unadjusted patient reported satisfaction with physician care quality was slightly greater for PCPs than hospitalists (4.25 vs 4.19, P = 0.009). After multivariable adjustment, the difference was attenuated but persisted (4.24 vs 4.20, P = 0.04). We found no statistical difference among the hospitals or the specific hospitalist groups in terms of satisfaction with overall physician care quality (Figure 1). There were no statistical differences in patient satisfaction ratings of hospitalist and PCPs for the subdomains of behavior, pain, and communication (Table 2). There were also no differences in the proportion of patients cared for by hospitalists or PCPs who rated their physicians in the highest satisfaction category (79% vs 81%, P = 0.17) or the lowest (5% vs 5%, P = 0.19). Among patients cared for by academic hospitalists, there was no difference in satisfaction rating between those patients who had a designated primary care physician in the outpatient setting and those who did not (4.22 0.94 vs 4.19 0.94, P = 0.97). Finally, satisfaction with both hospitalists and PCPs showed equivalent rates of improvement over time (Figure 2).
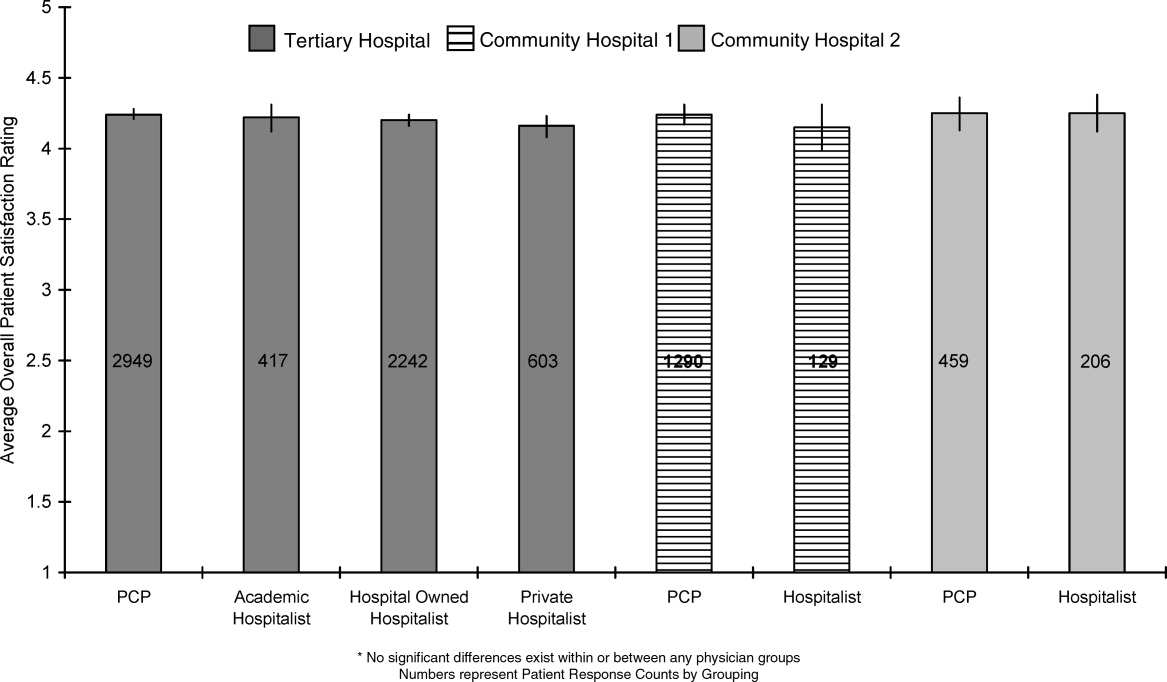
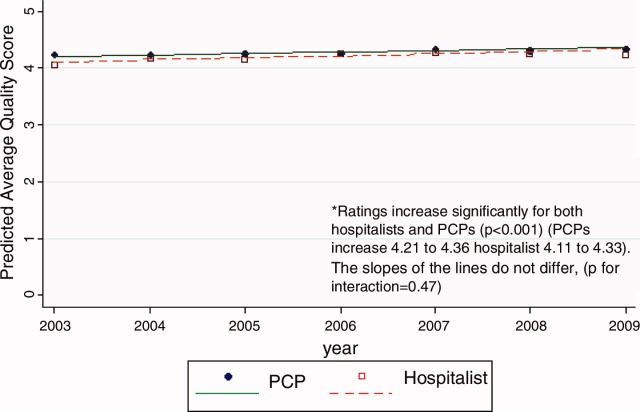
| PCP | Hospitalist | P Value | ||
|---|---|---|---|---|
| ||||
| Satisfaction | Overall, you would rate the quality of doctor care as:* | 4.24 [4.21, 4.27] | 4.20 [4.17, 4.23] | 0.04 |
| Behavior | Doctors treated you with courtesy/respect | 3.77 [3.73, 3.82] | 3.78 [3.73, 3.82] | 0.88 |
| Pain control | Pain management by hospital staff* | 4.11 [4.08, 4.14] | 4.09 [4.05, 4.12] | 0.35 |
| Pain well controlled | 3.55 [3.47, 3.63] | 3.48 [3.41, 3.55] | 0.23 | |
| Staff did everything to help with pain | 3.73 [3.66, 3.80] | 3.68 [3.62, 3.75] | 0.33 | |
| Communication skills | Doctors listened carefully to you | 3.66 [3.61, 3.72] | 3.67 [3.62, 3.72] | 0.83 |
| Doctors explained things in an understandable way | 3.60 [3.54, 3.66] | 3.61 [3.56, 3.67] | 0.73 | |
| Doctor's communication* | 4.02 [3.97, 4.07] | 3.98 [3.93, 4.03] | 0.27 | |
| Doctor discussed your anxiety/fears* | 4.00 [3.96, 4.03] | 3.97 [3.93, 4.01] | 0.26 | |
| Doctor involved you in decisions* | 4.00 [3.95, 4.06] | 3.98 [3.93, 4.03] | 0.49 | |
DISCUSSION
In this observational study of over 8200 patients cared for over 6 years by 347 physicians at 3 hospitals, we found that patient satisfaction with inpatient care provided by hospitalists and primary care doctors was almost identical. As we hypothesized, overall satisfaction with physician care quality, our primary outcome, was slightly greater with primary care doctors; however, the observed difference, 0.04 on a scale of 1 to 5, cannot be considered clinically significant. All patients were generally satisfied (4.2‐4.3 rating on 5‐point scale) with their inpatient care, and satisfaction scores increased over time. We also found no differences among the specific domains of satisfaction, including communication skills, pain control, and physician behavior. Finally, we found no significant difference in patient satisfaction with physician care quality among the different hospitalist services.
Previous studies of patient satisfaction conducted in the outpatient setting found that continuity of care was an important determinant of trust and, consequently, overall satisfaction.15, 16, 19, 20, 22 Because hospitalist models introduce discontinuity, they might be expected to undermine satisfaction. Surprisingly, few studies have addressed this issue. In a review of the hospitalist studies through 2002, Wachter and Goldman found 19 studies, 5 of which measured patient satisfaction.23 Three of these were conducted on teaching services and compared designated faculty hospitalists to traditional ward attendings, who rotated onto the inpatient services 1 to 2 months per year. Primary care doctors were excluded.2426 A fourth study provided a descriptive narrative of the development of the first hospitalist program in Minneapolis, Minnesota, and anecdotally noted no difference in patient satisfaction between the hospitalist and traditional model, but presented no data because the satisfaction surveys were not designed with publication in mind.27 The only study to actually assess whether patient satisfaction was greater with hospitalists or PCPs was an observational study by Davis et al., conducted in 1 rural hospital during the first year of its hospitalist program. In that study, 2 hospitalists were compared to 17 PCPs, and patient satisfaction surveys were available for approximately 44 patients managed by hospitalists and 168 patients managed by PCPs. Specific data were not reported, but it was noted that there was no statistical difference in satisfaction between those cared for by hospitalists versus PCPs.28 On the basis of these studies, Wachter and Goldman concluded that surveys of patients who were cared for by hospitalists show high levels of satisfaction, no lower than that of similar patients cared for by their own primary physicians.23 Wachter and Goldman's review has been highly cited, and we could find no subsequent studies addressing this issue. Our study provides the first real evidence to support this conclusion, including data from 59 hospitalists practicing in 5 separate hospitalist programs at 3 different hospitals.
Our finding that hospitalists maintain satisfaction despite a lack of continuity suggests that other aspects of care may be more important to patient satisfaction. Larson et al. found that physician ability to meet patient's information needs was positively associated with patient satisfaction.29 Similarly, Tarrant et al. found that patient's trust in a physician improved with increasing communication, interpersonal care, and knowledge of the patient. Interestingly, continuity, ie. the proportion of visits to the usual general practitioner (GP) or duration with the practice, did not correlate with trust.30 Finally, a systematic review of determinants of outpatient satisfaction found that continuity has a variable effect on satisfaction. Subjective continuity measures, such as whether patients saw their regular physician on the day they were surveyed, were consistently associated with patient satisfaction, however, quantitative measures including relationship duration were not.31
It is also possible that patients believe they value continuity more than they actually do. In 1 survey of inpatients with an established PCP yet cared for by a hospitalist, most agreed that patients receive better care and have more trust in physicians with whom they have long‐term relationships. Yet most also had positive opinions of their hospital care.32 Similarly, in a survey of over 2500 outpatients, 92% rated continuity as very important or important, but the majority was unwilling to expend substantial personal time (88%), defined as driving greater than 60 minutes, or money (82%), defined as spending an additional $20 to $40 a month, to maintain continuity with their PCP.33 Our study appears to confirm the lack of connection between continuity and satisfaction. Even those patients who valued continuity, as evidenced by having an established PCP, were as satisfied with hospitalist physician care as patients who had no established PCP.
Our study has several limitations. First, we report on outcomes of 3 institutions within a single healthcare system, within a limited geographic area. Although our sample included a wide range of patient demographics, hundreds of physicians, and multiple hospitalist models, it is possible that some hospitalist models may provide greater or lesser satisfaction than those we observed. Second, our study was observational, and thus subject to selection bias and confounding. Patients cared for by the hospitalists differed in a number of ways from those cared for by PCPs. We controlled for identifiable confounders such as illness severity, self‐perceived health, and admission through the emergency department, but the possibility exists that additional unidentified factors could have affected our results. It is possible other drivers of patient satisfaction, such as amenities, nursing, or food, could have influenced our findings. However, this is unlikely because all patient groups shared these components of hospital experience equally. Third, only a minority of patients could be reached for interview. This is typical for post‐hospitalization surveys, and our response rate of 40% for HCAHPS patients compared favorably to the 2010 HCAHPS national average of 33%.34 Still, the responses of those who could not be reached may have differed from those who were interviewed. Fourth, we identified hospitalists and PCPs by the attending of record, but we were unable to tell who provided care to the patient on any given day. Thus, we could not determine to what extent patients cared for by PCPs were actually seen by their own doctor, as opposed to an associated physician within the practice. Nevertheless, our results are representative of the care model provided by PCPs in the hospital. Similarly, we could not know or compare the number of different attending physicians each patient experienced during their hospitalization. Higher turnover of inpatient physicians may have affected patient satisfaction scores independent of attending physician designation. These are potentially important measures of relationship duration, yet whether duration affects patient satisfaction remains undecided.1618, 20, 28, 30, 32, 33 We assessed satisfaction using HCAHPS questions, in order to provide objective and meaningful comparisons across hospitals. The HCAHPS instrument, however, is intended to assess patient satisfaction with doctors in general, not with subgroups or individuals, and responses in our study were uniformly high. A more sensitive survey instrument may have yielded different results. Finally, it is possible that individual physicians may possess lower satisfaction scores than others, making the results not representative of hospitalist models as much as specific doctors' care quality. We think this is unlikely since surveys reached over 8000 patients, over 6 years, representing the care of 347 individual physicians. However, hospital medicine is a rapidly evolving field with many divergent organizational structures, and patient satisfaction is bound to fluctuate while there exists high variability in how care is provided.
Over the past decade, the hospitalist model has become one of the dominant models for care of medical inpatients. Compared to the traditional model in which PCPs provide inpatient care, the hospitalist model has a number of advantages, including continuous on‐site coverage for increasingly acute patients, specialization, and incentives aligned with the hospital to provide efficient, high‐quality care. One concern that remains, however, is that patients may not trust doctors they first meet in the hospital or may be dissatisfied with the lack of continuity from day to day. Our findings are reassuring in this regard. Although patients cared for by hospitalists were slightly less satisfied, the differences could not be considered clinically meaningful and should be outweighed by gains in quality and efficiency. Furthermore, hospitalists can expect to fare well under value‐based purchasing. Given the rapid ascension of hospital medicine programs, prospective comparisons of hospitalists and PCPs may no longer be feasible. Future research might employ survey instruments designed specifically to measure patient experience under hospitalist care in order to identify methods to maximize patient satisfaction within the hospitalist model.
Acknowledgements
Jane Garb, MS, Academic Affairs, Baystate Medical Center, contributed to the initial database management and statistical analysis. She received no financial compensation. Dr Adrianne Seiler has received written permission for acknowledgement from Ms Garb.
Dr Adrianne Seiler made substantial contributions to our manuscript's conception and design, data acquisition, analysis, and interpretation, manuscript drafting and critical revision, and administrative support. Dr Paul Visintainer made substantial contributions to our manuscript's data analysis and interpretation, manuscript critical revision, and statistical analysis. Michael Ehresman and Richard Brzostek made substantial contributions to our manuscript's data acquisition, manuscript critical revision, and administrative support. Dr Evan Benjamin made substantial contributions to our manuscript's conception and design, analysis and interpretation of data, manuscript drafting, and administrative support. Dr Winthrop Whitcomb made substantial contributions to our manuscript's data analysis and interpretation, and manuscript critical revision. Dr Michael Rothberg made substantial contributions to our manuscript's conception and design, data analysis and interpretation, manuscript critical revision, and supervision.
- American Hospital Association Annual Survey Database.Fiscal Year2009.
- ,,,,.Quality of care for patients hospitalized with heart failure: assessing the impact of hospitalists.Arch Intern Med.2002;162:1251–1256.
- ,,,,,.Outcomes of care by hospitalists, general internists, and family physicians.N Engl J Med.2007;357:2589–2600.
- ,,,.Comparison of hospitalists and nonhospitalists regarding core measures of pneumonia care.Am J Manag Care.2007;13:129–132.
- ,,,.Comparison of processes and outcomes of pneumonia care between hospitalists and community‐based primary care physicians.Mayo Clin Proc.2002;77:1053–1058.
- ,,,.Comparison of hospitalists and nonhospitalists in inpatient length of stay adjusting for patient and physician characteristics.J Gen Intern Med.2004;19:1127–1132.
- ,,.Comparison of practice patterns of hospitalists and community physicians in the care of patients with congestive heart failure.J Hosp Med.2008;3:35–41.
- ,,, et al.Effects of physician experience on costs and outcomes on an academic general medicine service: results of a trial of hospitalists.Ann Intern Med.2002;137:866–874.
- ,,,,,.The value of a hospitalist service: efficient care for the aging population?Chest.2001;119:580–589.
- ,,,,.Comparison of hospital costs and length of stay associated with general internists and hospitalist physicians at a community hospital.Am J Manag Care.2004;10:626–630.
- ,,,,.Hospitalist care and length of stay in patients requiring complex discharge planning and close clinical monitoring.Arch Intern Med.2007;167:1869–1874.
- ,.The impact of hospitalists on the cost and quality of inpatient care in the United States: a research synthesis.Med Care Res Rev.2005;62(4):379–406.
- US Department of Health and Human Services Medicare Hospital Value‐Based Purchasing Plan Development Issues Paper. 1st Public Listening Session January 17, 2007. Available at: https://www.cms. gov/AcuteInpatientPPS/downloads/hospital_VBP_plan_issues_paper. pdf. Accessed on May 26, 2011.
- Hospital Value‐Based Purchasing: Measure Explanations. Available at: http://www.healthcare.gov/news/factsheets/valuebasedpurchasing 04292011b.html. Accessed on May 26, 2011.
- ,,,,,.Linking primary care performance to outcomes of care.J Fam Pract.1998;47:213–220.
- ,.Interpersonal continuity of care and patient satisfaction: a critical review.Ann Fam Med.2004;2:445–451.
- ,.Does continuity of care improve patient outcomes?J Fam Pract.2004;53:974–980.
- ,,,.Continuity of care and other determinants of patient satisfaction with primary care.J Gen Intern Med.2005;20:226–233.
- ,,,,.Continuity of care and trust in one's physician: evidence from primary care in the United States and the United Kingdom.Fam Med.2001;33:22–27.
- ,,,,.Patients' trust in their physicians: effects of choice, continuity, and payment method.J Gen Intern Med.1998;13:681–686.
- ,.Alternatives for logistic regression in cross‐sectional studies: an empirical comparison of models that directly estimate the prevalence ratio.BMC Med Res Methodol.2003;3:21.
- ,,, et al.Continuity of outpatient medical care in elderly men. A randomized trial.JAMA.1984;252:2413–2417.
- ,.The hospitalist movement 5 years later.JAMA.2002;287:487–494.
- ,,, et al.The effect of a hospitalist service with nurse discharge planner on patient care in an academic teaching hospital.Am J Med.2001;111(8):627–632.
- ,,, et al.Decreased length of stay, costs and mortality in a randomized trial of academic hospitalists.J Gen Intern Med.2001;16(suppl):S208.
- ,,,,.Reorganizing an academic medical service: impact on cost, quality, patient satisfaction, and education.JAMA.1998;279(19):1560–1565.
- .The Park Nicollet experience in establishing a hospitalist system.Ann Intern Med.1999;130:350–354.
- ,,,,,.Effects of hospitalists on cost, outcomes, and patient satisfaction in a rural health system.Am J Med.2000;108:621–626.
- ,,,.The relationship between meeting patients' information needs and their satisfaction with hospital care and general health status outcomes.Int J Qual Health Care.1996;8:447–456.
- ,,.Factors associated with patients' trust in their general practitioner: a cross‐sectional survey.Br J Gen Pract.2003;53:798–800.
- ,,.The relationship between continuity and patient satisfaction: a systematic review.Fam Pract.2010;27:171–178.
- ,,.How do patients view the role of the primary care physician in inpatient care?Dis Mon.2002;48:230–238.
- ,.Patient attitudes toward continuity of care.Arch Intern Med.2003;163:909–912.
- Summary of HCAHPS Survey Results. Available at: http://www. hcahpsonline.org/files/12–13‐10_Summary_of_HCAHPS_Survey_ Results_December_2010.pdf. Accessed on May 27,2011.
Over the past decade, hospital medicine has been the nation's fastest‐growing medical specialty. According to the American Hospital Association's (AHA) 2009 survey, 58% of United States (US) hospitals now have hospital medicine programs, and for hospitals with 200 or more beds, this figure is 89%.1 In 2009, the AHA estimated that the number of US hospitalists would increase to over 34,000 by 2011, over double that of the 16,000 present in 2005.1 Studies demonstrate that, compared to a system where primary care physicians provide inpatient care, the hospitalist model improves efficiency while maintaining at least equal patient outcomes.211 However, scant data exist as to the effects of hospitalists on patient satisfaction.12 Understanding how care models affect patient experience is vital in the current environment of healthcare reform and performance reporting, especially in light of the Centers for Medicare and Medicaid Services' (CMS) efforts to link the patient experience to reimbursement through value‐based purchasing.13 Value‐based purchasing is a strategy to encourage and reward excellence in healthcare delivery through differential reimbursement based on defined performance measures. As one part of value‐based purchasing, hospital reimbursement will be linked to patient‐experience measures, including patient ratings of their doctor's ability to communicate with them and other questions assessing patient satisfaction with their hospital stay.14
In the outpatient setting, trust is the variable most strongly associated with patient satisfaction.1518 In contrast to PCPs, who may develop relationships with patients over years, hospitalists often first meet a patient in the hospital and must engender trust quickly. In addition, hospitalists work in shifts and may not be responsible for the same patients each day. Since continuity is positively related to trust,19, 20 there is reason to believe satisfaction with hospitalist care might be lower than satisfaction with care provided by PCPs. We report on 8295 patients and 6 years experience with hospitalist programs at 3 hospitals. Based on the known link between continuity and patient satisfaction, we hypothesized that patient satisfaction would be lower with hospitalists than with primary care internists.
METHODS
Setting
Our study was conducted at 3 Western Massachusetts hospitals affiliated with Baystate Health, an integrated healthcare delivery system. These included 2 small community hospitals (<100 beds) and a 653‐bed tertiary care, academic teaching hospital. Hospitalist services were established at the tertiary care center in 2001 and at the community hospitals in 2004 and 2005; the programs have evolved over time. In addition, the tertiary care center has 3 different hospitalist groups: an academic group that is employed by the hospital and works with house staff, a hospitalist service that is owned by the hospital and cares for patients from specific outpatient practices, and one that is privately owned caring for patients from another group of practices. The community hospitals each have a single, hospital‐owned service. Primary care physicians also provide inpatient care at all 3 institutions, although their number has decreased over time as the hospitalist programs have grown. All hospitalist services varied in the number of consecutive days in a rounding cycle (degree of continuity), and which services had an admitting team (single initial physician encounter with a different rounding physician) versus a single physician being both the admitting and rounding physician. Consequently, continuity, as measured by the number of different physicians caring for an individual patient during 1 hospitalization, would be expected to vary depending on the type of hospitalist service and the length of stay. Likewise, patients admitted by their primary care physician's office may have been cared for by either their PCP or a practice colleague. All hospitalists and PCPs care for inpatients having similar hospital experiences, as all aspects of a patient's care (including the medical wards, nursing staff, discharge planners, and information systems) are identical, regardless of physician designation. The study was approved by Baystate Health System's Institutional Review Board.
Data Collection
Since February 2001, Baystate Health, in conjunction with Professional Research Consultants, Inc (PRC), has conducted scripted postdischarge patient satisfaction telephone interviews of random discharged adult medicine patients, with Hospital Consumer Assessment of Healthcare Providers and Systems (HCAHPS) questions added in January 2007. Approximately 50 surveys per quarter, per hospital floor, were conducted. Trained PRC staff assessed up to 115 variables encompassing the inpatient experience. We limited our analysis to those domains that reflected satisfaction with physician care, including satisfaction with physician care quality, physician communication, physician behavior, and pain management. The survey responses were scored, depending on question type, with: never, sometimes, usually, always (HCAHPS); or excellent, very good, good, fair, poor (PRC). Each score was converted to a numeric equivalent, with the highest score (4 or 5, depending on scale used) being best and 1 being worst. The specific questions are included in Supporting Appendix A in the online version of this article.
Additional patient information for respondents was extracted from the hospitals' billing database, using medical record numbers, and included age, gender, admission year, education level, language, illness severity, emergency room (ER) admission status, institution, and attending physician type (academic hospitalist [AH], hospital‐owned hospitalist [HOH], private hospitalist [PH], or primary care physician [PCP]). It was not possible to distinguish whether PCP patients were cared for by their own PCP or a colleague from the same practice.
Statistical Analysis
Patient satisfaction data were derived from survey responses of adult inpatients cared for by hospitalists or PCPs between January 1, 2003 and March 31, 2009. The primary outcome was patient‐reported satisfaction with physician care quality measured on a 5‐point Likert scale. In a secondary analysis, physician groups were compared on the proportion of responses that were excellent (a score of 5 on the Likert scale) and the proportion that were poor (a score of 1). Other secondary outcomes included patient satisfaction ratings of physician behavior, pain management, and communication. Averages and percent ranking excellent and poor were calculated for each hospitalist group and for PCPs. Other outcomes analyzed included average patient satisfaction with physician care quality, both over time and stratified by the presence or absence of having an established PCP prior to admission.
In view of the large sample size, Likert‐scale responses were analyzed as continuous outcomes. For unadjusted comparisons among hospitalist groups, t tests and 1‐way ANOVAs were conducted for the scales scores, while chi‐square tests were used for dichotomous outcomes. For multivariable analyses, multiple linear regression was used for continuous outcomes. For dichotomous outcomes, adjusted prevalence ratios were estimated using Poisson regression with robust standard errors.21 All multivariable models controlled for sex, marital status, illness severity, age group, ethnicity, length of stay, and emergency room admission. Observations with missing data were excluded from analyses. Differences in bivariable and multivariable analyses were considered significant at a critical test level of 5%. Prevalence ratios are reported with 95% confidence intervals. All analyses were conducted in Stata, version 11 (StataCorp, College Station, TX).
RESULTS
Of patients who were reached by telephone, 87% agreed to participate in the hospital survey. However, most patients could not be reached by phone; thus our estimated response rate, including those who could not be reached, was 27%. For the subset of patients interviewed using the HCAHPS protocol, the response rate was 40%. Our final sample included 8295 patients (3597 cared for by 59 hospitalists and 4698 by 288 PCPs) interviewed between 2003 and 2009. Three‐quarters of the patients were from the tertiary care center, whereas 17% and 8% were from each of the community hospitals (see Supporting Appendix B in the online version of this article). Patient characteristics appear in Table 1. Patients cared for by hospitalists were similar to those cared for by PCPs in terms of age, sex, marital status, education, and language, but hospitalist patients were more likely to have been admitted through the emergency department (93% vs 84%, P < 0.001) and less likely to be white (83% vs 85%, P = 0.01). Patients cared for by hospitalists also had higher average illness severity score (2.2 0.8 vs 2.0 0.8, P < 0.001), longer average LOS (4.3 4.3 vs 4.0 3.6, P < 0.001), and lower mean perceived health score (2.8 1.2 vs 3.0 1.2, P = 0.01).
| Characteristic | PCP N = 4698 | Hospitalist N = 3597 | P Value |
|---|---|---|---|
| |||
| Age (mean, SD) | 63.5 (16.6) | 63.7 (16.3) | 0.53 |
| Male sex (%) | 44.9 | 46.2 | 0.28 |
| White race (%) | 85.3 | 83.2 | 0.01 |
| Married (%) | 49.1 | 48.7 | 0.69 |
| English spoken at home (%) | 96.0 | 97.0 | 0.09 |
| At least some college education (%) | 47.1 | 43.7 | 0.22 |
| Admitted through the emergency department (%) | 84.3 | 92.5 | <0.001 |
| Average illness severity rating (mean, SD) | 2.0 (0.8) | 2.2 (0.8) | <0.001 |
| Average perceived health score (mean, SD) | 3.0 (1.2) | 2.8 (1.2) | 0.01 |
| Average length of stay (days) (mean, SD) | 4.0 (3.6) | 4.3 (4.3) | <0.001 |
| Discharged home (%) | 87.9 | 88.5 | 0.73 |
Unadjusted patient reported satisfaction with physician care quality was slightly greater for PCPs than hospitalists (4.25 vs 4.19, P = 0.009). After multivariable adjustment, the difference was attenuated but persisted (4.24 vs 4.20, P = 0.04). We found no statistical difference among the hospitals or the specific hospitalist groups in terms of satisfaction with overall physician care quality (Figure 1). There were no statistical differences in patient satisfaction ratings of hospitalist and PCPs for the subdomains of behavior, pain, and communication (Table 2). There were also no differences in the proportion of patients cared for by hospitalists or PCPs who rated their physicians in the highest satisfaction category (79% vs 81%, P = 0.17) or the lowest (5% vs 5%, P = 0.19). Among patients cared for by academic hospitalists, there was no difference in satisfaction rating between those patients who had a designated primary care physician in the outpatient setting and those who did not (4.22 0.94 vs 4.19 0.94, P = 0.97). Finally, satisfaction with both hospitalists and PCPs showed equivalent rates of improvement over time (Figure 2).
| PCP | Hospitalist | P Value | ||
|---|---|---|---|---|
| ||||
| Satisfaction | Overall, you would rate the quality of doctor care as:* | 4.24 [4.21, 4.27] | 4.20 [4.17, 4.23] | 0.04 |
| Behavior | Doctors treated you with courtesy/respect | 3.77 [3.73, 3.82] | 3.78 [3.73, 3.82] | 0.88 |
| Pain control | Pain management by hospital staff* | 4.11 [4.08, 4.14] | 4.09 [4.05, 4.12] | 0.35 |
| Pain well controlled | 3.55 [3.47, 3.63] | 3.48 [3.41, 3.55] | 0.23 | |
| Staff did everything to help with pain | 3.73 [3.66, 3.80] | 3.68 [3.62, 3.75] | 0.33 | |
| Communication skills | Doctors listened carefully to you | 3.66 [3.61, 3.72] | 3.67 [3.62, 3.72] | 0.83 |
| Doctors explained things in an understandable way | 3.60 [3.54, 3.66] | 3.61 [3.56, 3.67] | 0.73 | |
| Doctor's communication* | 4.02 [3.97, 4.07] | 3.98 [3.93, 4.03] | 0.27 | |
| Doctor discussed your anxiety/fears* | 4.00 [3.96, 4.03] | 3.97 [3.93, 4.01] | 0.26 | |
| Doctor involved you in decisions* | 4.00 [3.95, 4.06] | 3.98 [3.93, 4.03] | 0.49 | |
DISCUSSION
In this observational study of over 8200 patients cared for over 6 years by 347 physicians at 3 hospitals, we found that patient satisfaction with inpatient care provided by hospitalists and primary care doctors was almost identical. As we hypothesized, overall satisfaction with physician care quality, our primary outcome, was slightly greater with primary care doctors; however, the observed difference, 0.04 on a scale of 1 to 5, cannot be considered clinically significant. All patients were generally satisfied (4.2‐4.3 rating on 5‐point scale) with their inpatient care, and satisfaction scores increased over time. We also found no differences among the specific domains of satisfaction, including communication skills, pain control, and physician behavior. Finally, we found no significant difference in patient satisfaction with physician care quality among the different hospitalist services.
Previous studies of patient satisfaction conducted in the outpatient setting found that continuity of care was an important determinant of trust and, consequently, overall satisfaction.15, 16, 19, 20, 22 Because hospitalist models introduce discontinuity, they might be expected to undermine satisfaction. Surprisingly, few studies have addressed this issue. In a review of the hospitalist studies through 2002, Wachter and Goldman found 19 studies, 5 of which measured patient satisfaction.23 Three of these were conducted on teaching services and compared designated faculty hospitalists to traditional ward attendings, who rotated onto the inpatient services 1 to 2 months per year. Primary care doctors were excluded.2426 A fourth study provided a descriptive narrative of the development of the first hospitalist program in Minneapolis, Minnesota, and anecdotally noted no difference in patient satisfaction between the hospitalist and traditional model, but presented no data because the satisfaction surveys were not designed with publication in mind.27 The only study to actually assess whether patient satisfaction was greater with hospitalists or PCPs was an observational study by Davis et al., conducted in 1 rural hospital during the first year of its hospitalist program. In that study, 2 hospitalists were compared to 17 PCPs, and patient satisfaction surveys were available for approximately 44 patients managed by hospitalists and 168 patients managed by PCPs. Specific data were not reported, but it was noted that there was no statistical difference in satisfaction between those cared for by hospitalists versus PCPs.28 On the basis of these studies, Wachter and Goldman concluded that surveys of patients who were cared for by hospitalists show high levels of satisfaction, no lower than that of similar patients cared for by their own primary physicians.23 Wachter and Goldman's review has been highly cited, and we could find no subsequent studies addressing this issue. Our study provides the first real evidence to support this conclusion, including data from 59 hospitalists practicing in 5 separate hospitalist programs at 3 different hospitals.
Our finding that hospitalists maintain satisfaction despite a lack of continuity suggests that other aspects of care may be more important to patient satisfaction. Larson et al. found that physician ability to meet patient's information needs was positively associated with patient satisfaction.29 Similarly, Tarrant et al. found that patient's trust in a physician improved with increasing communication, interpersonal care, and knowledge of the patient. Interestingly, continuity, ie. the proportion of visits to the usual general practitioner (GP) or duration with the practice, did not correlate with trust.30 Finally, a systematic review of determinants of outpatient satisfaction found that continuity has a variable effect on satisfaction. Subjective continuity measures, such as whether patients saw their regular physician on the day they were surveyed, were consistently associated with patient satisfaction, however, quantitative measures including relationship duration were not.31
It is also possible that patients believe they value continuity more than they actually do. In 1 survey of inpatients with an established PCP yet cared for by a hospitalist, most agreed that patients receive better care and have more trust in physicians with whom they have long‐term relationships. Yet most also had positive opinions of their hospital care.32 Similarly, in a survey of over 2500 outpatients, 92% rated continuity as very important or important, but the majority was unwilling to expend substantial personal time (88%), defined as driving greater than 60 minutes, or money (82%), defined as spending an additional $20 to $40 a month, to maintain continuity with their PCP.33 Our study appears to confirm the lack of connection between continuity and satisfaction. Even those patients who valued continuity, as evidenced by having an established PCP, were as satisfied with hospitalist physician care as patients who had no established PCP.
Our study has several limitations. First, we report on outcomes of 3 institutions within a single healthcare system, within a limited geographic area. Although our sample included a wide range of patient demographics, hundreds of physicians, and multiple hospitalist models, it is possible that some hospitalist models may provide greater or lesser satisfaction than those we observed. Second, our study was observational, and thus subject to selection bias and confounding. Patients cared for by the hospitalists differed in a number of ways from those cared for by PCPs. We controlled for identifiable confounders such as illness severity, self‐perceived health, and admission through the emergency department, but the possibility exists that additional unidentified factors could have affected our results. It is possible other drivers of patient satisfaction, such as amenities, nursing, or food, could have influenced our findings. However, this is unlikely because all patient groups shared these components of hospital experience equally. Third, only a minority of patients could be reached for interview. This is typical for post‐hospitalization surveys, and our response rate of 40% for HCAHPS patients compared favorably to the 2010 HCAHPS national average of 33%.34 Still, the responses of those who could not be reached may have differed from those who were interviewed. Fourth, we identified hospitalists and PCPs by the attending of record, but we were unable to tell who provided care to the patient on any given day. Thus, we could not determine to what extent patients cared for by PCPs were actually seen by their own doctor, as opposed to an associated physician within the practice. Nevertheless, our results are representative of the care model provided by PCPs in the hospital. Similarly, we could not know or compare the number of different attending physicians each patient experienced during their hospitalization. Higher turnover of inpatient physicians may have affected patient satisfaction scores independent of attending physician designation. These are potentially important measures of relationship duration, yet whether duration affects patient satisfaction remains undecided.1618, 20, 28, 30, 32, 33 We assessed satisfaction using HCAHPS questions, in order to provide objective and meaningful comparisons across hospitals. The HCAHPS instrument, however, is intended to assess patient satisfaction with doctors in general, not with subgroups or individuals, and responses in our study were uniformly high. A more sensitive survey instrument may have yielded different results. Finally, it is possible that individual physicians may possess lower satisfaction scores than others, making the results not representative of hospitalist models as much as specific doctors' care quality. We think this is unlikely since surveys reached over 8000 patients, over 6 years, representing the care of 347 individual physicians. However, hospital medicine is a rapidly evolving field with many divergent organizational structures, and patient satisfaction is bound to fluctuate while there exists high variability in how care is provided.
Over the past decade, the hospitalist model has become one of the dominant models for care of medical inpatients. Compared to the traditional model in which PCPs provide inpatient care, the hospitalist model has a number of advantages, including continuous on‐site coverage for increasingly acute patients, specialization, and incentives aligned with the hospital to provide efficient, high‐quality care. One concern that remains, however, is that patients may not trust doctors they first meet in the hospital or may be dissatisfied with the lack of continuity from day to day. Our findings are reassuring in this regard. Although patients cared for by hospitalists were slightly less satisfied, the differences could not be considered clinically meaningful and should be outweighed by gains in quality and efficiency. Furthermore, hospitalists can expect to fare well under value‐based purchasing. Given the rapid ascension of hospital medicine programs, prospective comparisons of hospitalists and PCPs may no longer be feasible. Future research might employ survey instruments designed specifically to measure patient experience under hospitalist care in order to identify methods to maximize patient satisfaction within the hospitalist model.
Acknowledgements
Jane Garb, MS, Academic Affairs, Baystate Medical Center, contributed to the initial database management and statistical analysis. She received no financial compensation. Dr Adrianne Seiler has received written permission for acknowledgement from Ms Garb.
Dr Adrianne Seiler made substantial contributions to our manuscript's conception and design, data acquisition, analysis, and interpretation, manuscript drafting and critical revision, and administrative support. Dr Paul Visintainer made substantial contributions to our manuscript's data analysis and interpretation, manuscript critical revision, and statistical analysis. Michael Ehresman and Richard Brzostek made substantial contributions to our manuscript's data acquisition, manuscript critical revision, and administrative support. Dr Evan Benjamin made substantial contributions to our manuscript's conception and design, analysis and interpretation of data, manuscript drafting, and administrative support. Dr Winthrop Whitcomb made substantial contributions to our manuscript's data analysis and interpretation, and manuscript critical revision. Dr Michael Rothberg made substantial contributions to our manuscript's conception and design, data analysis and interpretation, manuscript critical revision, and supervision.
Over the past decade, hospital medicine has been the nation's fastest‐growing medical specialty. According to the American Hospital Association's (AHA) 2009 survey, 58% of United States (US) hospitals now have hospital medicine programs, and for hospitals with 200 or more beds, this figure is 89%.1 In 2009, the AHA estimated that the number of US hospitalists would increase to over 34,000 by 2011, over double that of the 16,000 present in 2005.1 Studies demonstrate that, compared to a system where primary care physicians provide inpatient care, the hospitalist model improves efficiency while maintaining at least equal patient outcomes.211 However, scant data exist as to the effects of hospitalists on patient satisfaction.12 Understanding how care models affect patient experience is vital in the current environment of healthcare reform and performance reporting, especially in light of the Centers for Medicare and Medicaid Services' (CMS) efforts to link the patient experience to reimbursement through value‐based purchasing.13 Value‐based purchasing is a strategy to encourage and reward excellence in healthcare delivery through differential reimbursement based on defined performance measures. As one part of value‐based purchasing, hospital reimbursement will be linked to patient‐experience measures, including patient ratings of their doctor's ability to communicate with them and other questions assessing patient satisfaction with their hospital stay.14
In the outpatient setting, trust is the variable most strongly associated with patient satisfaction.1518 In contrast to PCPs, who may develop relationships with patients over years, hospitalists often first meet a patient in the hospital and must engender trust quickly. In addition, hospitalists work in shifts and may not be responsible for the same patients each day. Since continuity is positively related to trust,19, 20 there is reason to believe satisfaction with hospitalist care might be lower than satisfaction with care provided by PCPs. We report on 8295 patients and 6 years experience with hospitalist programs at 3 hospitals. Based on the known link between continuity and patient satisfaction, we hypothesized that patient satisfaction would be lower with hospitalists than with primary care internists.
METHODS
Setting
Our study was conducted at 3 Western Massachusetts hospitals affiliated with Baystate Health, an integrated healthcare delivery system. These included 2 small community hospitals (<100 beds) and a 653‐bed tertiary care, academic teaching hospital. Hospitalist services were established at the tertiary care center in 2001 and at the community hospitals in 2004 and 2005; the programs have evolved over time. In addition, the tertiary care center has 3 different hospitalist groups: an academic group that is employed by the hospital and works with house staff, a hospitalist service that is owned by the hospital and cares for patients from specific outpatient practices, and one that is privately owned caring for patients from another group of practices. The community hospitals each have a single, hospital‐owned service. Primary care physicians also provide inpatient care at all 3 institutions, although their number has decreased over time as the hospitalist programs have grown. All hospitalist services varied in the number of consecutive days in a rounding cycle (degree of continuity), and which services had an admitting team (single initial physician encounter with a different rounding physician) versus a single physician being both the admitting and rounding physician. Consequently, continuity, as measured by the number of different physicians caring for an individual patient during 1 hospitalization, would be expected to vary depending on the type of hospitalist service and the length of stay. Likewise, patients admitted by their primary care physician's office may have been cared for by either their PCP or a practice colleague. All hospitalists and PCPs care for inpatients having similar hospital experiences, as all aspects of a patient's care (including the medical wards, nursing staff, discharge planners, and information systems) are identical, regardless of physician designation. The study was approved by Baystate Health System's Institutional Review Board.
Data Collection
Since February 2001, Baystate Health, in conjunction with Professional Research Consultants, Inc (PRC), has conducted scripted postdischarge patient satisfaction telephone interviews of random discharged adult medicine patients, with Hospital Consumer Assessment of Healthcare Providers and Systems (HCAHPS) questions added in January 2007. Approximately 50 surveys per quarter, per hospital floor, were conducted. Trained PRC staff assessed up to 115 variables encompassing the inpatient experience. We limited our analysis to those domains that reflected satisfaction with physician care, including satisfaction with physician care quality, physician communication, physician behavior, and pain management. The survey responses were scored, depending on question type, with: never, sometimes, usually, always (HCAHPS); or excellent, very good, good, fair, poor (PRC). Each score was converted to a numeric equivalent, with the highest score (4 or 5, depending on scale used) being best and 1 being worst. The specific questions are included in Supporting Appendix A in the online version of this article.
Additional patient information for respondents was extracted from the hospitals' billing database, using medical record numbers, and included age, gender, admission year, education level, language, illness severity, emergency room (ER) admission status, institution, and attending physician type (academic hospitalist [AH], hospital‐owned hospitalist [HOH], private hospitalist [PH], or primary care physician [PCP]). It was not possible to distinguish whether PCP patients were cared for by their own PCP or a colleague from the same practice.
Statistical Analysis
Patient satisfaction data were derived from survey responses of adult inpatients cared for by hospitalists or PCPs between January 1, 2003 and March 31, 2009. The primary outcome was patient‐reported satisfaction with physician care quality measured on a 5‐point Likert scale. In a secondary analysis, physician groups were compared on the proportion of responses that were excellent (a score of 5 on the Likert scale) and the proportion that were poor (a score of 1). Other secondary outcomes included patient satisfaction ratings of physician behavior, pain management, and communication. Averages and percent ranking excellent and poor were calculated for each hospitalist group and for PCPs. Other outcomes analyzed included average patient satisfaction with physician care quality, both over time and stratified by the presence or absence of having an established PCP prior to admission.
In view of the large sample size, Likert‐scale responses were analyzed as continuous outcomes. For unadjusted comparisons among hospitalist groups, t tests and 1‐way ANOVAs were conducted for the scales scores, while chi‐square tests were used for dichotomous outcomes. For multivariable analyses, multiple linear regression was used for continuous outcomes. For dichotomous outcomes, adjusted prevalence ratios were estimated using Poisson regression with robust standard errors.21 All multivariable models controlled for sex, marital status, illness severity, age group, ethnicity, length of stay, and emergency room admission. Observations with missing data were excluded from analyses. Differences in bivariable and multivariable analyses were considered significant at a critical test level of 5%. Prevalence ratios are reported with 95% confidence intervals. All analyses were conducted in Stata, version 11 (StataCorp, College Station, TX).
RESULTS
Of patients who were reached by telephone, 87% agreed to participate in the hospital survey. However, most patients could not be reached by phone; thus our estimated response rate, including those who could not be reached, was 27%. For the subset of patients interviewed using the HCAHPS protocol, the response rate was 40%. Our final sample included 8295 patients (3597 cared for by 59 hospitalists and 4698 by 288 PCPs) interviewed between 2003 and 2009. Three‐quarters of the patients were from the tertiary care center, whereas 17% and 8% were from each of the community hospitals (see Supporting Appendix B in the online version of this article). Patient characteristics appear in Table 1. Patients cared for by hospitalists were similar to those cared for by PCPs in terms of age, sex, marital status, education, and language, but hospitalist patients were more likely to have been admitted through the emergency department (93% vs 84%, P < 0.001) and less likely to be white (83% vs 85%, P = 0.01). Patients cared for by hospitalists also had higher average illness severity score (2.2 0.8 vs 2.0 0.8, P < 0.001), longer average LOS (4.3 4.3 vs 4.0 3.6, P < 0.001), and lower mean perceived health score (2.8 1.2 vs 3.0 1.2, P = 0.01).
| Characteristic | PCP N = 4698 | Hospitalist N = 3597 | P Value |
|---|---|---|---|
| |||
| Age (mean, SD) | 63.5 (16.6) | 63.7 (16.3) | 0.53 |
| Male sex (%) | 44.9 | 46.2 | 0.28 |
| White race (%) | 85.3 | 83.2 | 0.01 |
| Married (%) | 49.1 | 48.7 | 0.69 |
| English spoken at home (%) | 96.0 | 97.0 | 0.09 |
| At least some college education (%) | 47.1 | 43.7 | 0.22 |
| Admitted through the emergency department (%) | 84.3 | 92.5 | <0.001 |
| Average illness severity rating (mean, SD) | 2.0 (0.8) | 2.2 (0.8) | <0.001 |
| Average perceived health score (mean, SD) | 3.0 (1.2) | 2.8 (1.2) | 0.01 |
| Average length of stay (days) (mean, SD) | 4.0 (3.6) | 4.3 (4.3) | <0.001 |
| Discharged home (%) | 87.9 | 88.5 | 0.73 |
Unadjusted patient reported satisfaction with physician care quality was slightly greater for PCPs than hospitalists (4.25 vs 4.19, P = 0.009). After multivariable adjustment, the difference was attenuated but persisted (4.24 vs 4.20, P = 0.04). We found no statistical difference among the hospitals or the specific hospitalist groups in terms of satisfaction with overall physician care quality (Figure 1). There were no statistical differences in patient satisfaction ratings of hospitalist and PCPs for the subdomains of behavior, pain, and communication (Table 2). There were also no differences in the proportion of patients cared for by hospitalists or PCPs who rated their physicians in the highest satisfaction category (79% vs 81%, P = 0.17) or the lowest (5% vs 5%, P = 0.19). Among patients cared for by academic hospitalists, there was no difference in satisfaction rating between those patients who had a designated primary care physician in the outpatient setting and those who did not (4.22 0.94 vs 4.19 0.94, P = 0.97). Finally, satisfaction with both hospitalists and PCPs showed equivalent rates of improvement over time (Figure 2).
| PCP | Hospitalist | P Value | ||
|---|---|---|---|---|
| ||||
| Satisfaction | Overall, you would rate the quality of doctor care as:* | 4.24 [4.21, 4.27] | 4.20 [4.17, 4.23] | 0.04 |
| Behavior | Doctors treated you with courtesy/respect | 3.77 [3.73, 3.82] | 3.78 [3.73, 3.82] | 0.88 |
| Pain control | Pain management by hospital staff* | 4.11 [4.08, 4.14] | 4.09 [4.05, 4.12] | 0.35 |
| Pain well controlled | 3.55 [3.47, 3.63] | 3.48 [3.41, 3.55] | 0.23 | |
| Staff did everything to help with pain | 3.73 [3.66, 3.80] | 3.68 [3.62, 3.75] | 0.33 | |
| Communication skills | Doctors listened carefully to you | 3.66 [3.61, 3.72] | 3.67 [3.62, 3.72] | 0.83 |
| Doctors explained things in an understandable way | 3.60 [3.54, 3.66] | 3.61 [3.56, 3.67] | 0.73 | |
| Doctor's communication* | 4.02 [3.97, 4.07] | 3.98 [3.93, 4.03] | 0.27 | |
| Doctor discussed your anxiety/fears* | 4.00 [3.96, 4.03] | 3.97 [3.93, 4.01] | 0.26 | |
| Doctor involved you in decisions* | 4.00 [3.95, 4.06] | 3.98 [3.93, 4.03] | 0.49 | |
DISCUSSION
In this observational study of over 8200 patients cared for over 6 years by 347 physicians at 3 hospitals, we found that patient satisfaction with inpatient care provided by hospitalists and primary care doctors was almost identical. As we hypothesized, overall satisfaction with physician care quality, our primary outcome, was slightly greater with primary care doctors; however, the observed difference, 0.04 on a scale of 1 to 5, cannot be considered clinically significant. All patients were generally satisfied (4.2‐4.3 rating on 5‐point scale) with their inpatient care, and satisfaction scores increased over time. We also found no differences among the specific domains of satisfaction, including communication skills, pain control, and physician behavior. Finally, we found no significant difference in patient satisfaction with physician care quality among the different hospitalist services.
Previous studies of patient satisfaction conducted in the outpatient setting found that continuity of care was an important determinant of trust and, consequently, overall satisfaction.15, 16, 19, 20, 22 Because hospitalist models introduce discontinuity, they might be expected to undermine satisfaction. Surprisingly, few studies have addressed this issue. In a review of the hospitalist studies through 2002, Wachter and Goldman found 19 studies, 5 of which measured patient satisfaction.23 Three of these were conducted on teaching services and compared designated faculty hospitalists to traditional ward attendings, who rotated onto the inpatient services 1 to 2 months per year. Primary care doctors were excluded.2426 A fourth study provided a descriptive narrative of the development of the first hospitalist program in Minneapolis, Minnesota, and anecdotally noted no difference in patient satisfaction between the hospitalist and traditional model, but presented no data because the satisfaction surveys were not designed with publication in mind.27 The only study to actually assess whether patient satisfaction was greater with hospitalists or PCPs was an observational study by Davis et al., conducted in 1 rural hospital during the first year of its hospitalist program. In that study, 2 hospitalists were compared to 17 PCPs, and patient satisfaction surveys were available for approximately 44 patients managed by hospitalists and 168 patients managed by PCPs. Specific data were not reported, but it was noted that there was no statistical difference in satisfaction between those cared for by hospitalists versus PCPs.28 On the basis of these studies, Wachter and Goldman concluded that surveys of patients who were cared for by hospitalists show high levels of satisfaction, no lower than that of similar patients cared for by their own primary physicians.23 Wachter and Goldman's review has been highly cited, and we could find no subsequent studies addressing this issue. Our study provides the first real evidence to support this conclusion, including data from 59 hospitalists practicing in 5 separate hospitalist programs at 3 different hospitals.
Our finding that hospitalists maintain satisfaction despite a lack of continuity suggests that other aspects of care may be more important to patient satisfaction. Larson et al. found that physician ability to meet patient's information needs was positively associated with patient satisfaction.29 Similarly, Tarrant et al. found that patient's trust in a physician improved with increasing communication, interpersonal care, and knowledge of the patient. Interestingly, continuity, ie. the proportion of visits to the usual general practitioner (GP) or duration with the practice, did not correlate with trust.30 Finally, a systematic review of determinants of outpatient satisfaction found that continuity has a variable effect on satisfaction. Subjective continuity measures, such as whether patients saw their regular physician on the day they were surveyed, were consistently associated with patient satisfaction, however, quantitative measures including relationship duration were not.31
It is also possible that patients believe they value continuity more than they actually do. In 1 survey of inpatients with an established PCP yet cared for by a hospitalist, most agreed that patients receive better care and have more trust in physicians with whom they have long‐term relationships. Yet most also had positive opinions of their hospital care.32 Similarly, in a survey of over 2500 outpatients, 92% rated continuity as very important or important, but the majority was unwilling to expend substantial personal time (88%), defined as driving greater than 60 minutes, or money (82%), defined as spending an additional $20 to $40 a month, to maintain continuity with their PCP.33 Our study appears to confirm the lack of connection between continuity and satisfaction. Even those patients who valued continuity, as evidenced by having an established PCP, were as satisfied with hospitalist physician care as patients who had no established PCP.
Our study has several limitations. First, we report on outcomes of 3 institutions within a single healthcare system, within a limited geographic area. Although our sample included a wide range of patient demographics, hundreds of physicians, and multiple hospitalist models, it is possible that some hospitalist models may provide greater or lesser satisfaction than those we observed. Second, our study was observational, and thus subject to selection bias and confounding. Patients cared for by the hospitalists differed in a number of ways from those cared for by PCPs. We controlled for identifiable confounders such as illness severity, self‐perceived health, and admission through the emergency department, but the possibility exists that additional unidentified factors could have affected our results. It is possible other drivers of patient satisfaction, such as amenities, nursing, or food, could have influenced our findings. However, this is unlikely because all patient groups shared these components of hospital experience equally. Third, only a minority of patients could be reached for interview. This is typical for post‐hospitalization surveys, and our response rate of 40% for HCAHPS patients compared favorably to the 2010 HCAHPS national average of 33%.34 Still, the responses of those who could not be reached may have differed from those who were interviewed. Fourth, we identified hospitalists and PCPs by the attending of record, but we were unable to tell who provided care to the patient on any given day. Thus, we could not determine to what extent patients cared for by PCPs were actually seen by their own doctor, as opposed to an associated physician within the practice. Nevertheless, our results are representative of the care model provided by PCPs in the hospital. Similarly, we could not know or compare the number of different attending physicians each patient experienced during their hospitalization. Higher turnover of inpatient physicians may have affected patient satisfaction scores independent of attending physician designation. These are potentially important measures of relationship duration, yet whether duration affects patient satisfaction remains undecided.1618, 20, 28, 30, 32, 33 We assessed satisfaction using HCAHPS questions, in order to provide objective and meaningful comparisons across hospitals. The HCAHPS instrument, however, is intended to assess patient satisfaction with doctors in general, not with subgroups or individuals, and responses in our study were uniformly high. A more sensitive survey instrument may have yielded different results. Finally, it is possible that individual physicians may possess lower satisfaction scores than others, making the results not representative of hospitalist models as much as specific doctors' care quality. We think this is unlikely since surveys reached over 8000 patients, over 6 years, representing the care of 347 individual physicians. However, hospital medicine is a rapidly evolving field with many divergent organizational structures, and patient satisfaction is bound to fluctuate while there exists high variability in how care is provided.
Over the past decade, the hospitalist model has become one of the dominant models for care of medical inpatients. Compared to the traditional model in which PCPs provide inpatient care, the hospitalist model has a number of advantages, including continuous on‐site coverage for increasingly acute patients, specialization, and incentives aligned with the hospital to provide efficient, high‐quality care. One concern that remains, however, is that patients may not trust doctors they first meet in the hospital or may be dissatisfied with the lack of continuity from day to day. Our findings are reassuring in this regard. Although patients cared for by hospitalists were slightly less satisfied, the differences could not be considered clinically meaningful and should be outweighed by gains in quality and efficiency. Furthermore, hospitalists can expect to fare well under value‐based purchasing. Given the rapid ascension of hospital medicine programs, prospective comparisons of hospitalists and PCPs may no longer be feasible. Future research might employ survey instruments designed specifically to measure patient experience under hospitalist care in order to identify methods to maximize patient satisfaction within the hospitalist model.
Acknowledgements
Jane Garb, MS, Academic Affairs, Baystate Medical Center, contributed to the initial database management and statistical analysis. She received no financial compensation. Dr Adrianne Seiler has received written permission for acknowledgement from Ms Garb.
Dr Adrianne Seiler made substantial contributions to our manuscript's conception and design, data acquisition, analysis, and interpretation, manuscript drafting and critical revision, and administrative support. Dr Paul Visintainer made substantial contributions to our manuscript's data analysis and interpretation, manuscript critical revision, and statistical analysis. Michael Ehresman and Richard Brzostek made substantial contributions to our manuscript's data acquisition, manuscript critical revision, and administrative support. Dr Evan Benjamin made substantial contributions to our manuscript's conception and design, analysis and interpretation of data, manuscript drafting, and administrative support. Dr Winthrop Whitcomb made substantial contributions to our manuscript's data analysis and interpretation, and manuscript critical revision. Dr Michael Rothberg made substantial contributions to our manuscript's conception and design, data analysis and interpretation, manuscript critical revision, and supervision.
- American Hospital Association Annual Survey Database.Fiscal Year2009.
- ,,,,.Quality of care for patients hospitalized with heart failure: assessing the impact of hospitalists.Arch Intern Med.2002;162:1251–1256.
- ,,,,,.Outcomes of care by hospitalists, general internists, and family physicians.N Engl J Med.2007;357:2589–2600.
- ,,,.Comparison of hospitalists and nonhospitalists regarding core measures of pneumonia care.Am J Manag Care.2007;13:129–132.
- ,,,.Comparison of processes and outcomes of pneumonia care between hospitalists and community‐based primary care physicians.Mayo Clin Proc.2002;77:1053–1058.
- ,,,.Comparison of hospitalists and nonhospitalists in inpatient length of stay adjusting for patient and physician characteristics.J Gen Intern Med.2004;19:1127–1132.
- ,,.Comparison of practice patterns of hospitalists and community physicians in the care of patients with congestive heart failure.J Hosp Med.2008;3:35–41.
- ,,, et al.Effects of physician experience on costs and outcomes on an academic general medicine service: results of a trial of hospitalists.Ann Intern Med.2002;137:866–874.
- ,,,,,.The value of a hospitalist service: efficient care for the aging population?Chest.2001;119:580–589.
- ,,,,.Comparison of hospital costs and length of stay associated with general internists and hospitalist physicians at a community hospital.Am J Manag Care.2004;10:626–630.
- ,,,,.Hospitalist care and length of stay in patients requiring complex discharge planning and close clinical monitoring.Arch Intern Med.2007;167:1869–1874.
- ,.The impact of hospitalists on the cost and quality of inpatient care in the United States: a research synthesis.Med Care Res Rev.2005;62(4):379–406.
- US Department of Health and Human Services Medicare Hospital Value‐Based Purchasing Plan Development Issues Paper. 1st Public Listening Session January 17, 2007. Available at: https://www.cms. gov/AcuteInpatientPPS/downloads/hospital_VBP_plan_issues_paper. pdf. Accessed on May 26, 2011.
- Hospital Value‐Based Purchasing: Measure Explanations. Available at: http://www.healthcare.gov/news/factsheets/valuebasedpurchasing 04292011b.html. Accessed on May 26, 2011.
- ,,,,,.Linking primary care performance to outcomes of care.J Fam Pract.1998;47:213–220.
- ,.Interpersonal continuity of care and patient satisfaction: a critical review.Ann Fam Med.2004;2:445–451.
- ,.Does continuity of care improve patient outcomes?J Fam Pract.2004;53:974–980.
- ,,,.Continuity of care and other determinants of patient satisfaction with primary care.J Gen Intern Med.2005;20:226–233.
- ,,,,.Continuity of care and trust in one's physician: evidence from primary care in the United States and the United Kingdom.Fam Med.2001;33:22–27.
- ,,,,.Patients' trust in their physicians: effects of choice, continuity, and payment method.J Gen Intern Med.1998;13:681–686.
- ,.Alternatives for logistic regression in cross‐sectional studies: an empirical comparison of models that directly estimate the prevalence ratio.BMC Med Res Methodol.2003;3:21.
- ,,, et al.Continuity of outpatient medical care in elderly men. A randomized trial.JAMA.1984;252:2413–2417.
- ,.The hospitalist movement 5 years later.JAMA.2002;287:487–494.
- ,,, et al.The effect of a hospitalist service with nurse discharge planner on patient care in an academic teaching hospital.Am J Med.2001;111(8):627–632.
- ,,, et al.Decreased length of stay, costs and mortality in a randomized trial of academic hospitalists.J Gen Intern Med.2001;16(suppl):S208.
- ,,,,.Reorganizing an academic medical service: impact on cost, quality, patient satisfaction, and education.JAMA.1998;279(19):1560–1565.
- .The Park Nicollet experience in establishing a hospitalist system.Ann Intern Med.1999;130:350–354.
- ,,,,,.Effects of hospitalists on cost, outcomes, and patient satisfaction in a rural health system.Am J Med.2000;108:621–626.
- ,,,.The relationship between meeting patients' information needs and their satisfaction with hospital care and general health status outcomes.Int J Qual Health Care.1996;8:447–456.
- ,,.Factors associated with patients' trust in their general practitioner: a cross‐sectional survey.Br J Gen Pract.2003;53:798–800.
- ,,.The relationship between continuity and patient satisfaction: a systematic review.Fam Pract.2010;27:171–178.
- ,,.How do patients view the role of the primary care physician in inpatient care?Dis Mon.2002;48:230–238.
- ,.Patient attitudes toward continuity of care.Arch Intern Med.2003;163:909–912.
- Summary of HCAHPS Survey Results. Available at: http://www. hcahpsonline.org/files/12–13‐10_Summary_of_HCAHPS_Survey_ Results_December_2010.pdf. Accessed on May 27,2011.
- American Hospital Association Annual Survey Database.Fiscal Year2009.
- ,,,,.Quality of care for patients hospitalized with heart failure: assessing the impact of hospitalists.Arch Intern Med.2002;162:1251–1256.
- ,,,,,.Outcomes of care by hospitalists, general internists, and family physicians.N Engl J Med.2007;357:2589–2600.
- ,,,.Comparison of hospitalists and nonhospitalists regarding core measures of pneumonia care.Am J Manag Care.2007;13:129–132.
- ,,,.Comparison of processes and outcomes of pneumonia care between hospitalists and community‐based primary care physicians.Mayo Clin Proc.2002;77:1053–1058.
- ,,,.Comparison of hospitalists and nonhospitalists in inpatient length of stay adjusting for patient and physician characteristics.J Gen Intern Med.2004;19:1127–1132.
- ,,.Comparison of practice patterns of hospitalists and community physicians in the care of patients with congestive heart failure.J Hosp Med.2008;3:35–41.
- ,,, et al.Effects of physician experience on costs and outcomes on an academic general medicine service: results of a trial of hospitalists.Ann Intern Med.2002;137:866–874.
- ,,,,,.The value of a hospitalist service: efficient care for the aging population?Chest.2001;119:580–589.
- ,,,,.Comparison of hospital costs and length of stay associated with general internists and hospitalist physicians at a community hospital.Am J Manag Care.2004;10:626–630.
- ,,,,.Hospitalist care and length of stay in patients requiring complex discharge planning and close clinical monitoring.Arch Intern Med.2007;167:1869–1874.
- ,.The impact of hospitalists on the cost and quality of inpatient care in the United States: a research synthesis.Med Care Res Rev.2005;62(4):379–406.
- US Department of Health and Human Services Medicare Hospital Value‐Based Purchasing Plan Development Issues Paper. 1st Public Listening Session January 17, 2007. Available at: https://www.cms. gov/AcuteInpatientPPS/downloads/hospital_VBP_plan_issues_paper. pdf. Accessed on May 26, 2011.
- Hospital Value‐Based Purchasing: Measure Explanations. Available at: http://www.healthcare.gov/news/factsheets/valuebasedpurchasing 04292011b.html. Accessed on May 26, 2011.
- ,,,,,.Linking primary care performance to outcomes of care.J Fam Pract.1998;47:213–220.
- ,.Interpersonal continuity of care and patient satisfaction: a critical review.Ann Fam Med.2004;2:445–451.
- ,.Does continuity of care improve patient outcomes?J Fam Pract.2004;53:974–980.
- ,,,.Continuity of care and other determinants of patient satisfaction with primary care.J Gen Intern Med.2005;20:226–233.
- ,,,,.Continuity of care and trust in one's physician: evidence from primary care in the United States and the United Kingdom.Fam Med.2001;33:22–27.
- ,,,,.Patients' trust in their physicians: effects of choice, continuity, and payment method.J Gen Intern Med.1998;13:681–686.
- ,.Alternatives for logistic regression in cross‐sectional studies: an empirical comparison of models that directly estimate the prevalence ratio.BMC Med Res Methodol.2003;3:21.
- ,,, et al.Continuity of outpatient medical care in elderly men. A randomized trial.JAMA.1984;252:2413–2417.
- ,.The hospitalist movement 5 years later.JAMA.2002;287:487–494.
- ,,, et al.The effect of a hospitalist service with nurse discharge planner on patient care in an academic teaching hospital.Am J Med.2001;111(8):627–632.
- ,,, et al.Decreased length of stay, costs and mortality in a randomized trial of academic hospitalists.J Gen Intern Med.2001;16(suppl):S208.
- ,,,,.Reorganizing an academic medical service: impact on cost, quality, patient satisfaction, and education.JAMA.1998;279(19):1560–1565.
- .The Park Nicollet experience in establishing a hospitalist system.Ann Intern Med.1999;130:350–354.
- ,,,,,.Effects of hospitalists on cost, outcomes, and patient satisfaction in a rural health system.Am J Med.2000;108:621–626.
- ,,,.The relationship between meeting patients' information needs and their satisfaction with hospital care and general health status outcomes.Int J Qual Health Care.1996;8:447–456.
- ,,.Factors associated with patients' trust in their general practitioner: a cross‐sectional survey.Br J Gen Pract.2003;53:798–800.
- ,,.The relationship between continuity and patient satisfaction: a systematic review.Fam Pract.2010;27:171–178.
- ,,.How do patients view the role of the primary care physician in inpatient care?Dis Mon.2002;48:230–238.
- ,.Patient attitudes toward continuity of care.Arch Intern Med.2003;163:909–912.
- Summary of HCAHPS Survey Results. Available at: http://www. hcahpsonline.org/files/12–13‐10_Summary_of_HCAHPS_Survey_ Results_December_2010.pdf. Accessed on May 27,2011.
Copyright © 2011 Society of Hospital Medicine
Insulin Administration Errors
Diabetes care in the inpatient setting requires coordination between multiple service providers. Breakdowns in this process occur at all levels leading to potential serious harm.1 Error rates focusing on multiple areas related to diabetes care, including the inpatient provision of insulin, have been described as high as 19.5% in 14,000 patients surveyed in the United Kingdom.2 Missteps are important, as insulin prescribing errors are more commonly associated with patient harm.3 In the United States, medication errors related to provision of care to critically ill patients has been documented, but, to our knowledge, no such reports regarding general medical or surgical wards exist.4
Insulin errors can result from a wide range of possible reasons including: incorrect medication reconciliation, prescribing errors, dispensing errors, administration errors, suboptimal meal timing, or errors in communication for discharge plans regarding diabetes care. Examining each of these areas as a whole could be a daunting task. As such, we sought to examine 1 portion of insulin provision as an initial focus for performance improvement at our institution. Our purpose was to describe the rates of errors associated with insulin administration at our single academic medical center on general medicine and surgical wards.
Methods
Study patients for this observational, prospective snapshot were identified by electronic medical records in 4 consecutive weeks in April 2009 at Barnes‐Jewish Hospital (St Louis, MO), a 1200 bed academic medical center. This study was approved by the Washington University in St Louis School of Medicine Human Studies Committee, and the requirement for informed consent was waived.
On day 1 of each snapshot period, all patients on the identified wards were examined to determine if insulin was currently active as part of the inpatient medication orders. If active, this patient was enrolled into the evaluation data set. No patients were excluded if insulin was currently ordered. Four inpatient areas were selected to provide a representation of the non‐critically ill patient population at our institution. The 4 areas selected were: a cardiac care ward (typical census = 24), a general medicine ward (typical census = 24), an abdominal transplant ward (typical census = 18), and a general surgery ward (typical census = 22). Taken together, these areas represent about 20% of the total non‐critically ill patient population at our hospital. The transplant area was chosen because it represents a high‐risk population with medication (corticosteroid)‐induced diabetes. Nursing and physician care are typically exclusive in these areas, and very little crossover among these healthcare providers would have occurred among the units surveyed during the study period.
Each patient included on day 1 of each audit period was followed for a total of up to 7 days. Patients were only enrolled on day 1 of each audit period. Four survey periods were conducted, providing an evaluation of 28 days of insulin therapy in the studied units. Four periods were selected to pick up more patients on day 1 of each audit period. Electronic records of medication administration and evaluation of paper chart orders provided the information for insulin administration error rates. Additionally, physician notes regarding patients' histories and home insulin use were reviewed for background information for our patient population. Prospective daily assessments of insulin orders, doses charted, nursing notes, and blood glucose values were conducted for potential errors in insulin administration.
All definitions of insulin administration errors were defined prior to data collection. The investigators reviewed available literature involving insulin errors, and found no standardized definitions or previously published assessments at the time of inception of our study. As such, we examined our own clinical practice for areas of potential concern related to insulin administration. The following error categories were identified: transcription errors (eg, insulin glargine 10 units qpm written, but order transcribed and carried out as 20 units qpm); greater than 1 hour between obtained point‐of‐care blood glucose value and provision of correctional (sliding‐scale) insulin; insulin held without a physician order present in the medical records; missing documentation of insulin doses (glucose value of 150 mg/dL present, but no documented correctional dose corresponding to this value present in medical record); premeal and correctional insulin given at separate times; and no documentation of physician notification for hypoglycemia. Other reasons for potential insulin administration errors were collected if deemed pertinent by the individual auditors.
At the time of our survey, a standardized subcutaneous insulin administration order set was utilized in all of the surveyed units. As computerized physician order entry was not yet available at our institution, all orders were transcribed electronically from paper orders. This insulin order set has been in place for 5 years. Once initiated, all portions of the order set are initiated, including communication to nurses regarding glucose measuring times, requirement for documentation of hypoglycemia, and proposed glucose goals. A survey of insulin orders during the audit time revealed that >97% of all insulin orders were initiated from this standardized order set. These order sets encouraged the provision of physiological insulin (basal‐bolus) using insulin glargine and insulin aspart in eligible individuals. Although no systematic, standardized goal for glucose attainment was promoted, a fasting blood glucose of 90‐130 mg/dL and post‐prandial value of 180 mg/dL was encouraged. The order sets had a stated requirement of physician contact for all blood glucose values 70 mg/dL. Although lack of documentation of hypoglycemia may not be directly considered an error associated with administration of insulin, the research group decided to include this provision in the definition of administration errors, given the ability of this parameter to provide a sense of overall completeness of insulin orders and as a marker of collaborative practice in the management of inpatient hyperglycemia.
Nurses documented glucose values and responses in electronic medical administration records as a matter of routine. Point‐of‐care glucose values were obtained by either patient care technicians or nurses on each individual ward. As an academic medical institution, physicians were frequently paged by other members of the healthcare team.
Each auditor (E.N.D., A.L., L.L.W., K.A.H.) reviewed 1 consistent unit during the audit period. All data for insulin administration errors were tabulated, and descriptive rates of errors were used on a per‐patient or per‐stay basis
Results
A total of 116 patient‐audit periods were identified during the 28‐day study period (Table 1). Sixty‐five patients were on surgical services, and 51 were on medicine services, representing 378 inpatient days. Median length of stay was 3.5 days. Home insulin use was evident in 49% of the surveyed population. Patients' mean A1C (data available within 3 months prior to admission) was 8.1% (n = 41). Inpatient insulin regimens on day 1 included correctional insulin only (51.7% of cases). Regimens containing neutral protamine Hagedorn (NPH) or glargine also included correctional insulin in 95% of cases, and premeal insulin in 35%. Regimens including both premeal insulin and correctional insulin occurred in 25% of the patients. Diet status indicated that 83% of the population was taking an oral diet on day 1, and 13% were nil per os (nothing by mouth [NPO]).
| Characteristic | Result |
|---|---|
| |
| Mean age, years | 59 |
| Mean body mass index | 30.9 |
| Male | 58% |
| Reason for admission | |
| Diabetes‐related | 7 (6%) |
| Cardiovascular | 23 (19.8%) |
| Infection/sepsis | 12 (10.3%) |
| Transplant | 10 (8.6%) |
| Vascular surgery | 10 (8.6%) |
| Transplant complication | 8 (6.9%) |
| Other | 46 (39.6%) |
| History of diabetes | |
| DM1 | 7 (6%) |
| DM2 | 77 (67%) |
| Steroid‐induced | 8 (7%) |
| No history of diabetes | 24 (20%) |
| Most recent A1C (n = 41) (mean) | 8.1% |
| Home insulin use | 57 (49%) |
| Hospital NPH, day 1 | 14 (12.0%) |
| Hospital glargine, day 1 | 33 (28.4%) |
| Hospital correctional insulin only, day 1 | 60 (51.7%) |
| Day 1 diet | |
| Prudent diabetic | 58 (50%) |
| NPO | 15 (13%) |
| Other | 38 (32.7%) |
| Tube feeds | 3 (2.6%) |
| TPN | 2 (1.7%) |
A total of 199 administration errors occurred at a rate of 1.72 errors/patient‐period and 0.53 errors/patient day (Table 2). Missing documentation of doses (15.5% of all patients) and insulin being held without an order (25% of patients) were the most frequently occurring events. Errors classified as other were found in 13.1% of the defined events. These other errors consisted of not carrying out correctional dose insulin orders appropriately (eg, blood sugar value of 149 mg/dL should have resulted in a correctional dose of 2 units, but 3 units were documented as given instead), timing errors related to provision of mealtime insulin apart from documented provision of a meal, or not following the required documentation for insulin pumps.
| Category | No. of events (% Out of 199 Total Errors) |
|---|---|
| Transcription error | 15 (7.5) |
| Greater than 1 hr between blood sugar evaluation and insulin administration | 20 (10.1) |
| Insulin held without a physician order | 36 (18.1) |
| Missing documentation of insulin doses | 58 (29.1) |
| Premeal and correctional insulin given at separate time | 19 (9.5) |
| No documentation of physician notification of hypoglycemia | 25 (12.6) |
| Other | 26 (13.1) |
Forty‐two patients (36%) experienced no errors in insulin administration, 18 patients experienced 1 error, 21 patients had 2 errors, and 11 patients had 3 errors. The remainder of the patients (n = 23; 19.9%) had 4 or more errors during their observation period. Were similar across the units surveyed. Frequency of errors remained consistent regardless of reason for admission, history of diabetes or insulin use at home, or length of stay. Most errors occurred on days 1 and 2 of the hospital stay. Error rates and types were consistent across all units surveyed.
Discussion/Conclusion
We found that insulin administration errors were common in our inpatient snapshot of non‐critically ill patients. In our observational evaluation, 64% of patients had at least 1 error related to insulin administration. Errors related to missing documentation of scheduled doses, or doses held without a prescriber order, were the most common. Implications of missed or held doses could range from unclear approaches for dose adjustment due to missing information, incorrect titration due to incomplete information, or hypoglycemia and hyperglycemia.
This observed rate of error is much higher than the described error rate of 19.5% reported in the United Kingdom.2 This difference in error rates most likely reflects a difference in focus, as investigators in that national effort focused on prescriber error, aberrations in blood glucose values, and readmission rates. Our evaluation in assessing error rates regarding insulin administration supports the use of personnel keenly aware of the processes related to insulin administration, and provides insight into the importance of evaluating small portions of insulin provision (administration vs prescribing, etc) in assessing grounds for improvement in care. It is important to note that our findings may be exaggerated and are not entirely comparable to a study with a different scope and size.
Our snapshot tool and baseline evaluation is a simple method that could be undertaken at many institutions. As such, this methodology and error estimate serves as a gauge for future comparisons and areas for intervention. Limitations of our assessment include the small portion of patients audited during our evaluation versus using a snapshot of our entire hospital, utilizing nonstandardized criteria for determination of insulin errors, and the lack of correlation of clinical significance (aberrations in glucose values) with errors observed. Also, this single‐institution review may not be generalizable to all institutions. Additionally, we only examined errors related to administration of insulin. Other areas that would complete the picture, related to diabetic therapies and outcomes, would need to include prescribing errors or dispensing errors and relate these to glycemic outcomes. Assessment of these additional errors may have revealed more clinically important events that were not revealed in this small snapshot. Lastly, clinical endpoints such as intensive care unit (ICU) transfers, mortality, or readmissions were not assessed in this small study.
We are fortunate that many of these errors were apparently clinically silent, but in a subset of patients, the risk is real and life‐threatening. Risk occurs at both ends of the glucose spectrum, with the low end receiving the greatest attention. Severe hypoglycemia with harm and inpatient diabetic ketoacidosis have been qualified as newer events by Medicare. Hypoglycemia in the ICU population (40 mg/dL) is an independent marker of mortality.5 Hypoglycemia (50 mg/dL) has been associated with heart attacks, strokes, and death in the outpatient setting.6
The ability to safely control blood sugar in the hospital requires that medications are administered on time, and that communication occurs between the prescribing provider and the nursing staff providing care. Along with the case‐by‐case implications regarding the need for accurate administration of insulin for subsequent titration and determination of discharge prescriptions for patients with diabetes, there are many implications regarding the assessment of inpatient provision of insulin on determining institutional practices based on previous performance. If insulin administration is not accurately provided or documented, institutions will find it difficult to correctly make changes to insulin protocols for targeting future improvements. Our evaluation indicates an obvious need for quality improvement with 18.1% of the errors reflecting holding insulin without an order, and 12.6% of the errors showing no documentation for the physician being notified of hypoglycemia requiring treatment. The need to foster structured nurse‐physician communication will play a critical role in any process improvement. Communication is key for the optimal provision of insulin in the inpatient setting. Computerized order entry and bar‐code guided administration of doses of insulin may fix some types of the errors (transcription and missed documentation, respectively). That said, one of the largest impacts of this survey may reveal that these errors may not be fixed by technology, but may require more targeted and difficult interventions, such as continuing education and holding clinicians accountable. This study provides insight into the complicated issues regarding inpatient insulin administration and, due to its systematic approach, has given direction for process and system improvements.
- .Patient safety and inpatient glycemic control: translating concepts into action.Endocr Pract.2006;12:49–55.
- ,,,,.Safer administration of insulin: summary of a safety report from the National Patient Safety Agency.BMJ.341:883.
- ,,,,,.Medication administration errors in adult patients in the ICU.Intensive Care Med.2001;27(10):1592–1598.
- United States Pharmacopeia. MEDMARX 5th anniversary data report. A chartbook of 2003 findings and trends 1999–2003. Available at: http://www.usp.org/products/medMarx/index.html?USP_Print. Accessed December 1,2010.
- ,,, et al.Intensive insulin therapy in the medical ICU.N Engl J Med.2006;354:449–461.
- The ADVANCE Trial Collaborative Group.Intensive blood glucose control and vascular outcomes in patients with type 2 diabetes.N Engl J Med.2008;358:2560–2572.
Diabetes care in the inpatient setting requires coordination between multiple service providers. Breakdowns in this process occur at all levels leading to potential serious harm.1 Error rates focusing on multiple areas related to diabetes care, including the inpatient provision of insulin, have been described as high as 19.5% in 14,000 patients surveyed in the United Kingdom.2 Missteps are important, as insulin prescribing errors are more commonly associated with patient harm.3 In the United States, medication errors related to provision of care to critically ill patients has been documented, but, to our knowledge, no such reports regarding general medical or surgical wards exist.4
Insulin errors can result from a wide range of possible reasons including: incorrect medication reconciliation, prescribing errors, dispensing errors, administration errors, suboptimal meal timing, or errors in communication for discharge plans regarding diabetes care. Examining each of these areas as a whole could be a daunting task. As such, we sought to examine 1 portion of insulin provision as an initial focus for performance improvement at our institution. Our purpose was to describe the rates of errors associated with insulin administration at our single academic medical center on general medicine and surgical wards.
Methods
Study patients for this observational, prospective snapshot were identified by electronic medical records in 4 consecutive weeks in April 2009 at Barnes‐Jewish Hospital (St Louis, MO), a 1200 bed academic medical center. This study was approved by the Washington University in St Louis School of Medicine Human Studies Committee, and the requirement for informed consent was waived.
On day 1 of each snapshot period, all patients on the identified wards were examined to determine if insulin was currently active as part of the inpatient medication orders. If active, this patient was enrolled into the evaluation data set. No patients were excluded if insulin was currently ordered. Four inpatient areas were selected to provide a representation of the non‐critically ill patient population at our institution. The 4 areas selected were: a cardiac care ward (typical census = 24), a general medicine ward (typical census = 24), an abdominal transplant ward (typical census = 18), and a general surgery ward (typical census = 22). Taken together, these areas represent about 20% of the total non‐critically ill patient population at our hospital. The transplant area was chosen because it represents a high‐risk population with medication (corticosteroid)‐induced diabetes. Nursing and physician care are typically exclusive in these areas, and very little crossover among these healthcare providers would have occurred among the units surveyed during the study period.
Each patient included on day 1 of each audit period was followed for a total of up to 7 days. Patients were only enrolled on day 1 of each audit period. Four survey periods were conducted, providing an evaluation of 28 days of insulin therapy in the studied units. Four periods were selected to pick up more patients on day 1 of each audit period. Electronic records of medication administration and evaluation of paper chart orders provided the information for insulin administration error rates. Additionally, physician notes regarding patients' histories and home insulin use were reviewed for background information for our patient population. Prospective daily assessments of insulin orders, doses charted, nursing notes, and blood glucose values were conducted for potential errors in insulin administration.
All definitions of insulin administration errors were defined prior to data collection. The investigators reviewed available literature involving insulin errors, and found no standardized definitions or previously published assessments at the time of inception of our study. As such, we examined our own clinical practice for areas of potential concern related to insulin administration. The following error categories were identified: transcription errors (eg, insulin glargine 10 units qpm written, but order transcribed and carried out as 20 units qpm); greater than 1 hour between obtained point‐of‐care blood glucose value and provision of correctional (sliding‐scale) insulin; insulin held without a physician order present in the medical records; missing documentation of insulin doses (glucose value of 150 mg/dL present, but no documented correctional dose corresponding to this value present in medical record); premeal and correctional insulin given at separate times; and no documentation of physician notification for hypoglycemia. Other reasons for potential insulin administration errors were collected if deemed pertinent by the individual auditors.
At the time of our survey, a standardized subcutaneous insulin administration order set was utilized in all of the surveyed units. As computerized physician order entry was not yet available at our institution, all orders were transcribed electronically from paper orders. This insulin order set has been in place for 5 years. Once initiated, all portions of the order set are initiated, including communication to nurses regarding glucose measuring times, requirement for documentation of hypoglycemia, and proposed glucose goals. A survey of insulin orders during the audit time revealed that >97% of all insulin orders were initiated from this standardized order set. These order sets encouraged the provision of physiological insulin (basal‐bolus) using insulin glargine and insulin aspart in eligible individuals. Although no systematic, standardized goal for glucose attainment was promoted, a fasting blood glucose of 90‐130 mg/dL and post‐prandial value of 180 mg/dL was encouraged. The order sets had a stated requirement of physician contact for all blood glucose values 70 mg/dL. Although lack of documentation of hypoglycemia may not be directly considered an error associated with administration of insulin, the research group decided to include this provision in the definition of administration errors, given the ability of this parameter to provide a sense of overall completeness of insulin orders and as a marker of collaborative practice in the management of inpatient hyperglycemia.
Nurses documented glucose values and responses in electronic medical administration records as a matter of routine. Point‐of‐care glucose values were obtained by either patient care technicians or nurses on each individual ward. As an academic medical institution, physicians were frequently paged by other members of the healthcare team.
Each auditor (E.N.D., A.L., L.L.W., K.A.H.) reviewed 1 consistent unit during the audit period. All data for insulin administration errors were tabulated, and descriptive rates of errors were used on a per‐patient or per‐stay basis
Results
A total of 116 patient‐audit periods were identified during the 28‐day study period (Table 1). Sixty‐five patients were on surgical services, and 51 were on medicine services, representing 378 inpatient days. Median length of stay was 3.5 days. Home insulin use was evident in 49% of the surveyed population. Patients' mean A1C (data available within 3 months prior to admission) was 8.1% (n = 41). Inpatient insulin regimens on day 1 included correctional insulin only (51.7% of cases). Regimens containing neutral protamine Hagedorn (NPH) or glargine also included correctional insulin in 95% of cases, and premeal insulin in 35%. Regimens including both premeal insulin and correctional insulin occurred in 25% of the patients. Diet status indicated that 83% of the population was taking an oral diet on day 1, and 13% were nil per os (nothing by mouth [NPO]).
| Characteristic | Result |
|---|---|
| |
| Mean age, years | 59 |
| Mean body mass index | 30.9 |
| Male | 58% |
| Reason for admission | |
| Diabetes‐related | 7 (6%) |
| Cardiovascular | 23 (19.8%) |
| Infection/sepsis | 12 (10.3%) |
| Transplant | 10 (8.6%) |
| Vascular surgery | 10 (8.6%) |
| Transplant complication | 8 (6.9%) |
| Other | 46 (39.6%) |
| History of diabetes | |
| DM1 | 7 (6%) |
| DM2 | 77 (67%) |
| Steroid‐induced | 8 (7%) |
| No history of diabetes | 24 (20%) |
| Most recent A1C (n = 41) (mean) | 8.1% |
| Home insulin use | 57 (49%) |
| Hospital NPH, day 1 | 14 (12.0%) |
| Hospital glargine, day 1 | 33 (28.4%) |
| Hospital correctional insulin only, day 1 | 60 (51.7%) |
| Day 1 diet | |
| Prudent diabetic | 58 (50%) |
| NPO | 15 (13%) |
| Other | 38 (32.7%) |
| Tube feeds | 3 (2.6%) |
| TPN | 2 (1.7%) |
A total of 199 administration errors occurred at a rate of 1.72 errors/patient‐period and 0.53 errors/patient day (Table 2). Missing documentation of doses (15.5% of all patients) and insulin being held without an order (25% of patients) were the most frequently occurring events. Errors classified as other were found in 13.1% of the defined events. These other errors consisted of not carrying out correctional dose insulin orders appropriately (eg, blood sugar value of 149 mg/dL should have resulted in a correctional dose of 2 units, but 3 units were documented as given instead), timing errors related to provision of mealtime insulin apart from documented provision of a meal, or not following the required documentation for insulin pumps.
| Category | No. of events (% Out of 199 Total Errors) |
|---|---|
| Transcription error | 15 (7.5) |
| Greater than 1 hr between blood sugar evaluation and insulin administration | 20 (10.1) |
| Insulin held without a physician order | 36 (18.1) |
| Missing documentation of insulin doses | 58 (29.1) |
| Premeal and correctional insulin given at separate time | 19 (9.5) |
| No documentation of physician notification of hypoglycemia | 25 (12.6) |
| Other | 26 (13.1) |
Forty‐two patients (36%) experienced no errors in insulin administration, 18 patients experienced 1 error, 21 patients had 2 errors, and 11 patients had 3 errors. The remainder of the patients (n = 23; 19.9%) had 4 or more errors during their observation period. Were similar across the units surveyed. Frequency of errors remained consistent regardless of reason for admission, history of diabetes or insulin use at home, or length of stay. Most errors occurred on days 1 and 2 of the hospital stay. Error rates and types were consistent across all units surveyed.
Discussion/Conclusion
We found that insulin administration errors were common in our inpatient snapshot of non‐critically ill patients. In our observational evaluation, 64% of patients had at least 1 error related to insulin administration. Errors related to missing documentation of scheduled doses, or doses held without a prescriber order, were the most common. Implications of missed or held doses could range from unclear approaches for dose adjustment due to missing information, incorrect titration due to incomplete information, or hypoglycemia and hyperglycemia.
This observed rate of error is much higher than the described error rate of 19.5% reported in the United Kingdom.2 This difference in error rates most likely reflects a difference in focus, as investigators in that national effort focused on prescriber error, aberrations in blood glucose values, and readmission rates. Our evaluation in assessing error rates regarding insulin administration supports the use of personnel keenly aware of the processes related to insulin administration, and provides insight into the importance of evaluating small portions of insulin provision (administration vs prescribing, etc) in assessing grounds for improvement in care. It is important to note that our findings may be exaggerated and are not entirely comparable to a study with a different scope and size.
Our snapshot tool and baseline evaluation is a simple method that could be undertaken at many institutions. As such, this methodology and error estimate serves as a gauge for future comparisons and areas for intervention. Limitations of our assessment include the small portion of patients audited during our evaluation versus using a snapshot of our entire hospital, utilizing nonstandardized criteria for determination of insulin errors, and the lack of correlation of clinical significance (aberrations in glucose values) with errors observed. Also, this single‐institution review may not be generalizable to all institutions. Additionally, we only examined errors related to administration of insulin. Other areas that would complete the picture, related to diabetic therapies and outcomes, would need to include prescribing errors or dispensing errors and relate these to glycemic outcomes. Assessment of these additional errors may have revealed more clinically important events that were not revealed in this small snapshot. Lastly, clinical endpoints such as intensive care unit (ICU) transfers, mortality, or readmissions were not assessed in this small study.
We are fortunate that many of these errors were apparently clinically silent, but in a subset of patients, the risk is real and life‐threatening. Risk occurs at both ends of the glucose spectrum, with the low end receiving the greatest attention. Severe hypoglycemia with harm and inpatient diabetic ketoacidosis have been qualified as newer events by Medicare. Hypoglycemia in the ICU population (40 mg/dL) is an independent marker of mortality.5 Hypoglycemia (50 mg/dL) has been associated with heart attacks, strokes, and death in the outpatient setting.6
The ability to safely control blood sugar in the hospital requires that medications are administered on time, and that communication occurs between the prescribing provider and the nursing staff providing care. Along with the case‐by‐case implications regarding the need for accurate administration of insulin for subsequent titration and determination of discharge prescriptions for patients with diabetes, there are many implications regarding the assessment of inpatient provision of insulin on determining institutional practices based on previous performance. If insulin administration is not accurately provided or documented, institutions will find it difficult to correctly make changes to insulin protocols for targeting future improvements. Our evaluation indicates an obvious need for quality improvement with 18.1% of the errors reflecting holding insulin without an order, and 12.6% of the errors showing no documentation for the physician being notified of hypoglycemia requiring treatment. The need to foster structured nurse‐physician communication will play a critical role in any process improvement. Communication is key for the optimal provision of insulin in the inpatient setting. Computerized order entry and bar‐code guided administration of doses of insulin may fix some types of the errors (transcription and missed documentation, respectively). That said, one of the largest impacts of this survey may reveal that these errors may not be fixed by technology, but may require more targeted and difficult interventions, such as continuing education and holding clinicians accountable. This study provides insight into the complicated issues regarding inpatient insulin administration and, due to its systematic approach, has given direction for process and system improvements.
Diabetes care in the inpatient setting requires coordination between multiple service providers. Breakdowns in this process occur at all levels leading to potential serious harm.1 Error rates focusing on multiple areas related to diabetes care, including the inpatient provision of insulin, have been described as high as 19.5% in 14,000 patients surveyed in the United Kingdom.2 Missteps are important, as insulin prescribing errors are more commonly associated with patient harm.3 In the United States, medication errors related to provision of care to critically ill patients has been documented, but, to our knowledge, no such reports regarding general medical or surgical wards exist.4
Insulin errors can result from a wide range of possible reasons including: incorrect medication reconciliation, prescribing errors, dispensing errors, administration errors, suboptimal meal timing, or errors in communication for discharge plans regarding diabetes care. Examining each of these areas as a whole could be a daunting task. As such, we sought to examine 1 portion of insulin provision as an initial focus for performance improvement at our institution. Our purpose was to describe the rates of errors associated with insulin administration at our single academic medical center on general medicine and surgical wards.
Methods
Study patients for this observational, prospective snapshot were identified by electronic medical records in 4 consecutive weeks in April 2009 at Barnes‐Jewish Hospital (St Louis, MO), a 1200 bed academic medical center. This study was approved by the Washington University in St Louis School of Medicine Human Studies Committee, and the requirement for informed consent was waived.
On day 1 of each snapshot period, all patients on the identified wards were examined to determine if insulin was currently active as part of the inpatient medication orders. If active, this patient was enrolled into the evaluation data set. No patients were excluded if insulin was currently ordered. Four inpatient areas were selected to provide a representation of the non‐critically ill patient population at our institution. The 4 areas selected were: a cardiac care ward (typical census = 24), a general medicine ward (typical census = 24), an abdominal transplant ward (typical census = 18), and a general surgery ward (typical census = 22). Taken together, these areas represent about 20% of the total non‐critically ill patient population at our hospital. The transplant area was chosen because it represents a high‐risk population with medication (corticosteroid)‐induced diabetes. Nursing and physician care are typically exclusive in these areas, and very little crossover among these healthcare providers would have occurred among the units surveyed during the study period.
Each patient included on day 1 of each audit period was followed for a total of up to 7 days. Patients were only enrolled on day 1 of each audit period. Four survey periods were conducted, providing an evaluation of 28 days of insulin therapy in the studied units. Four periods were selected to pick up more patients on day 1 of each audit period. Electronic records of medication administration and evaluation of paper chart orders provided the information for insulin administration error rates. Additionally, physician notes regarding patients' histories and home insulin use were reviewed for background information for our patient population. Prospective daily assessments of insulin orders, doses charted, nursing notes, and blood glucose values were conducted for potential errors in insulin administration.
All definitions of insulin administration errors were defined prior to data collection. The investigators reviewed available literature involving insulin errors, and found no standardized definitions or previously published assessments at the time of inception of our study. As such, we examined our own clinical practice for areas of potential concern related to insulin administration. The following error categories were identified: transcription errors (eg, insulin glargine 10 units qpm written, but order transcribed and carried out as 20 units qpm); greater than 1 hour between obtained point‐of‐care blood glucose value and provision of correctional (sliding‐scale) insulin; insulin held without a physician order present in the medical records; missing documentation of insulin doses (glucose value of 150 mg/dL present, but no documented correctional dose corresponding to this value present in medical record); premeal and correctional insulin given at separate times; and no documentation of physician notification for hypoglycemia. Other reasons for potential insulin administration errors were collected if deemed pertinent by the individual auditors.
At the time of our survey, a standardized subcutaneous insulin administration order set was utilized in all of the surveyed units. As computerized physician order entry was not yet available at our institution, all orders were transcribed electronically from paper orders. This insulin order set has been in place for 5 years. Once initiated, all portions of the order set are initiated, including communication to nurses regarding glucose measuring times, requirement for documentation of hypoglycemia, and proposed glucose goals. A survey of insulin orders during the audit time revealed that >97% of all insulin orders were initiated from this standardized order set. These order sets encouraged the provision of physiological insulin (basal‐bolus) using insulin glargine and insulin aspart in eligible individuals. Although no systematic, standardized goal for glucose attainment was promoted, a fasting blood glucose of 90‐130 mg/dL and post‐prandial value of 180 mg/dL was encouraged. The order sets had a stated requirement of physician contact for all blood glucose values 70 mg/dL. Although lack of documentation of hypoglycemia may not be directly considered an error associated with administration of insulin, the research group decided to include this provision in the definition of administration errors, given the ability of this parameter to provide a sense of overall completeness of insulin orders and as a marker of collaborative practice in the management of inpatient hyperglycemia.
Nurses documented glucose values and responses in electronic medical administration records as a matter of routine. Point‐of‐care glucose values were obtained by either patient care technicians or nurses on each individual ward. As an academic medical institution, physicians were frequently paged by other members of the healthcare team.
Each auditor (E.N.D., A.L., L.L.W., K.A.H.) reviewed 1 consistent unit during the audit period. All data for insulin administration errors were tabulated, and descriptive rates of errors were used on a per‐patient or per‐stay basis
Results
A total of 116 patient‐audit periods were identified during the 28‐day study period (Table 1). Sixty‐five patients were on surgical services, and 51 were on medicine services, representing 378 inpatient days. Median length of stay was 3.5 days. Home insulin use was evident in 49% of the surveyed population. Patients' mean A1C (data available within 3 months prior to admission) was 8.1% (n = 41). Inpatient insulin regimens on day 1 included correctional insulin only (51.7% of cases). Regimens containing neutral protamine Hagedorn (NPH) or glargine also included correctional insulin in 95% of cases, and premeal insulin in 35%. Regimens including both premeal insulin and correctional insulin occurred in 25% of the patients. Diet status indicated that 83% of the population was taking an oral diet on day 1, and 13% were nil per os (nothing by mouth [NPO]).
| Characteristic | Result |
|---|---|
| |
| Mean age, years | 59 |
| Mean body mass index | 30.9 |
| Male | 58% |
| Reason for admission | |
| Diabetes‐related | 7 (6%) |
| Cardiovascular | 23 (19.8%) |
| Infection/sepsis | 12 (10.3%) |
| Transplant | 10 (8.6%) |
| Vascular surgery | 10 (8.6%) |
| Transplant complication | 8 (6.9%) |
| Other | 46 (39.6%) |
| History of diabetes | |
| DM1 | 7 (6%) |
| DM2 | 77 (67%) |
| Steroid‐induced | 8 (7%) |
| No history of diabetes | 24 (20%) |
| Most recent A1C (n = 41) (mean) | 8.1% |
| Home insulin use | 57 (49%) |
| Hospital NPH, day 1 | 14 (12.0%) |
| Hospital glargine, day 1 | 33 (28.4%) |
| Hospital correctional insulin only, day 1 | 60 (51.7%) |
| Day 1 diet | |
| Prudent diabetic | 58 (50%) |
| NPO | 15 (13%) |
| Other | 38 (32.7%) |
| Tube feeds | 3 (2.6%) |
| TPN | 2 (1.7%) |
A total of 199 administration errors occurred at a rate of 1.72 errors/patient‐period and 0.53 errors/patient day (Table 2). Missing documentation of doses (15.5% of all patients) and insulin being held without an order (25% of patients) were the most frequently occurring events. Errors classified as other were found in 13.1% of the defined events. These other errors consisted of not carrying out correctional dose insulin orders appropriately (eg, blood sugar value of 149 mg/dL should have resulted in a correctional dose of 2 units, but 3 units were documented as given instead), timing errors related to provision of mealtime insulin apart from documented provision of a meal, or not following the required documentation for insulin pumps.
| Category | No. of events (% Out of 199 Total Errors) |
|---|---|
| Transcription error | 15 (7.5) |
| Greater than 1 hr between blood sugar evaluation and insulin administration | 20 (10.1) |
| Insulin held without a physician order | 36 (18.1) |
| Missing documentation of insulin doses | 58 (29.1) |
| Premeal and correctional insulin given at separate time | 19 (9.5) |
| No documentation of physician notification of hypoglycemia | 25 (12.6) |
| Other | 26 (13.1) |
Forty‐two patients (36%) experienced no errors in insulin administration, 18 patients experienced 1 error, 21 patients had 2 errors, and 11 patients had 3 errors. The remainder of the patients (n = 23; 19.9%) had 4 or more errors during their observation period. Were similar across the units surveyed. Frequency of errors remained consistent regardless of reason for admission, history of diabetes or insulin use at home, or length of stay. Most errors occurred on days 1 and 2 of the hospital stay. Error rates and types were consistent across all units surveyed.
Discussion/Conclusion
We found that insulin administration errors were common in our inpatient snapshot of non‐critically ill patients. In our observational evaluation, 64% of patients had at least 1 error related to insulin administration. Errors related to missing documentation of scheduled doses, or doses held without a prescriber order, were the most common. Implications of missed or held doses could range from unclear approaches for dose adjustment due to missing information, incorrect titration due to incomplete information, or hypoglycemia and hyperglycemia.
This observed rate of error is much higher than the described error rate of 19.5% reported in the United Kingdom.2 This difference in error rates most likely reflects a difference in focus, as investigators in that national effort focused on prescriber error, aberrations in blood glucose values, and readmission rates. Our evaluation in assessing error rates regarding insulin administration supports the use of personnel keenly aware of the processes related to insulin administration, and provides insight into the importance of evaluating small portions of insulin provision (administration vs prescribing, etc) in assessing grounds for improvement in care. It is important to note that our findings may be exaggerated and are not entirely comparable to a study with a different scope and size.
Our snapshot tool and baseline evaluation is a simple method that could be undertaken at many institutions. As such, this methodology and error estimate serves as a gauge for future comparisons and areas for intervention. Limitations of our assessment include the small portion of patients audited during our evaluation versus using a snapshot of our entire hospital, utilizing nonstandardized criteria for determination of insulin errors, and the lack of correlation of clinical significance (aberrations in glucose values) with errors observed. Also, this single‐institution review may not be generalizable to all institutions. Additionally, we only examined errors related to administration of insulin. Other areas that would complete the picture, related to diabetic therapies and outcomes, would need to include prescribing errors or dispensing errors and relate these to glycemic outcomes. Assessment of these additional errors may have revealed more clinically important events that were not revealed in this small snapshot. Lastly, clinical endpoints such as intensive care unit (ICU) transfers, mortality, or readmissions were not assessed in this small study.
We are fortunate that many of these errors were apparently clinically silent, but in a subset of patients, the risk is real and life‐threatening. Risk occurs at both ends of the glucose spectrum, with the low end receiving the greatest attention. Severe hypoglycemia with harm and inpatient diabetic ketoacidosis have been qualified as newer events by Medicare. Hypoglycemia in the ICU population (40 mg/dL) is an independent marker of mortality.5 Hypoglycemia (50 mg/dL) has been associated with heart attacks, strokes, and death in the outpatient setting.6
The ability to safely control blood sugar in the hospital requires that medications are administered on time, and that communication occurs between the prescribing provider and the nursing staff providing care. Along with the case‐by‐case implications regarding the need for accurate administration of insulin for subsequent titration and determination of discharge prescriptions for patients with diabetes, there are many implications regarding the assessment of inpatient provision of insulin on determining institutional practices based on previous performance. If insulin administration is not accurately provided or documented, institutions will find it difficult to correctly make changes to insulin protocols for targeting future improvements. Our evaluation indicates an obvious need for quality improvement with 18.1% of the errors reflecting holding insulin without an order, and 12.6% of the errors showing no documentation for the physician being notified of hypoglycemia requiring treatment. The need to foster structured nurse‐physician communication will play a critical role in any process improvement. Communication is key for the optimal provision of insulin in the inpatient setting. Computerized order entry and bar‐code guided administration of doses of insulin may fix some types of the errors (transcription and missed documentation, respectively). That said, one of the largest impacts of this survey may reveal that these errors may not be fixed by technology, but may require more targeted and difficult interventions, such as continuing education and holding clinicians accountable. This study provides insight into the complicated issues regarding inpatient insulin administration and, due to its systematic approach, has given direction for process and system improvements.
- .Patient safety and inpatient glycemic control: translating concepts into action.Endocr Pract.2006;12:49–55.
- ,,,,.Safer administration of insulin: summary of a safety report from the National Patient Safety Agency.BMJ.341:883.
- ,,,,,.Medication administration errors in adult patients in the ICU.Intensive Care Med.2001;27(10):1592–1598.
- United States Pharmacopeia. MEDMARX 5th anniversary data report. A chartbook of 2003 findings and trends 1999–2003. Available at: http://www.usp.org/products/medMarx/index.html?USP_Print. Accessed December 1,2010.
- ,,, et al.Intensive insulin therapy in the medical ICU.N Engl J Med.2006;354:449–461.
- The ADVANCE Trial Collaborative Group.Intensive blood glucose control and vascular outcomes in patients with type 2 diabetes.N Engl J Med.2008;358:2560–2572.
- .Patient safety and inpatient glycemic control: translating concepts into action.Endocr Pract.2006;12:49–55.
- ,,,,.Safer administration of insulin: summary of a safety report from the National Patient Safety Agency.BMJ.341:883.
- ,,,,,.Medication administration errors in adult patients in the ICU.Intensive Care Med.2001;27(10):1592–1598.
- United States Pharmacopeia. MEDMARX 5th anniversary data report. A chartbook of 2003 findings and trends 1999–2003. Available at: http://www.usp.org/products/medMarx/index.html?USP_Print. Accessed December 1,2010.
- ,,, et al.Intensive insulin therapy in the medical ICU.N Engl J Med.2006;354:449–461.
- The ADVANCE Trial Collaborative Group.Intensive blood glucose control and vascular outcomes in patients with type 2 diabetes.N Engl J Med.2008;358:2560–2572.