User login
Fear Not the Switch from ICD-9 to ICD-10
Some people adopt a “Chicken Little” mentality when faced with making big changes, says Kathy DeVault, RHIS, CCS, CCS-P, manager of professional practice resources for the American Health Information Management Association (AHIMA). The change she’s referring to is the switch from the current version of the International Statistical Classification of Diseases coding system (ICD-9-CM) to the ICD-10-CM/ICD-10-PCS, which must be effective in hospitals by Oct. 1, 2013.
Hospitalist Jeffrey Farber, MD, assistant professor of geriatrics and palliative medicine and director of the Mobile ACE Service at Mount Sinai Hospital in New York City, also is director of the Clinical Documentation Improvement Department at Mount Sinai. He already is intimately involved with his hospital’s ICD-10 implementation process.
“For hospitals, this is a very big deal,” Dr. Farber says, “because it affects not just the coding department, but quality, compliance, and public reporting. On the physician side, there will be major changes in clinical documentation. Hospitalists who also do procedures, even bedside procedures, need to understand what is required.”
Why the Change?
Surprisingly, the U.S. is the last industrialized country in the world to upgrade to the ICD-10 system. The older system, in use since 1979, does not reflect three decades of change in medicine. “ICD-10 allows for a much better capture of specific types of treated diagnoses, provided services, and performed procedures,” Dr. Farber says, “and allows a lot more room to grow for the future.”
At first glance, the sheer numbers of new codes appear daunting. For example, procedures codes will increase from the current 4,000 to approximately 87,000. Hospitalists who perform procedures must include more description in their notes, including devices used and anatomical location of device placement.
Even if you’re not doing procedures, you may not relish the prospect of going from the current 14,000 ICD-9-CM diagnoses codes to nearly 70,000 ICD-10 codes. But, Dr. Farber explains, many of the increased descriptors have to do with laterality, which previously was not captured. To note a diagnosis of stroke, you will have to write not only whether it occurred in the posterior cerebral blood vessel, but also whether it was right or left posterior cerebral.
Ultimately, he believes, this type of specificity will relieve a burden on hospitalists, because providing more specific documentation should reduce queries from coders.
Common-Sense Approach
The October 2013 deadline allows plenty of time for physician training, says DeVault, who has been training coders through AHIMA’s ICD-10 Academy the past two years. Breaking the process down into manageable steps is helpful, she says.
—Jeffrey Farber, MD, assistant professor, geriatrics and palliative medicine, director, Clinical Documentation Improvement Department, Mount Sinai Hospital, New York City
“Look at your group’s most common, acute conditions, for example, and ask, ‘What is missing in the documentation?’ Especially if you can make bridges with your health information management (HIM) department, you will find that there are many opportunities to teach each other,” she says.
Hospitalists can do several things to ready their group for ICD-10, Dr. Farber says. Take a proactive stance, he advises, and select your group’s top 25 diagnoses. Then work with coding staff to map them from ICD-9 to ICD-10. On a macro level, understand what your hospital’s timeline is for the change. DeVault says that HIM departments are eager to collaborate with physician champions.
The good news: The sky isn’t really falling, according to DeVault. And the change to ICD-10 actually offers lots of opportunities for collaborations between hospitalists and health information departments.
Gretchen Henkel is a freelance writer based in California.
Watch Out for GEMs
Physicians often are encouraged to use general equivalence maps (GEMs) to acquaint themselves with the differences between coding sets. Relying solely on GEMs, however, is not a good idea for the long term, DeVault cautions. “GEMs are meant to serve as a transition tool but are not designed to code from,” she says. “It’s imperative that coders—and providers—actually learn the new system and that they not rely on GEMs for coding.”—GH
Resources for Physicians
- The AHIMA ICD-10 website offers a timeline for assessment and implementation of ICD-10 under the “Physician Office Role-Based Model” heading.
- The AMA’s resources include a physician timeline for ICD-10 implementation (PDF).
- SHM’s website offers a wealth of resources on documentation billing and coding for hospitalists.
Vaccine candidate reduces malaria risk
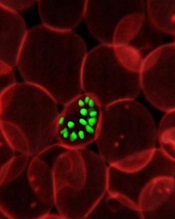
Credit: St Jude Children’s
Research Hospital
First results from a phase 3 trial of the vaccine candidate RTS,S/AS01 indicate it provides young African children with protection against clinical and severe malaria.
The researchers also said RTS,S/AS01 has an acceptable safety and tolerability profile.
These results were announced October 19 at the Malaria Forum, hosted by the Bill & Melinda Gates Foundation in Seattle, Washington.
The findings were also published online in The New England Journal of Medicine.
“The publication of the first results in children aged 5 to 17 months marks an important milestone in the development of RTS,S/AS01,” said Irving Hoffman, PA, MPH, co-principal investigator at a study site in Lilongwe, Malawi.
The trial is still ongoing, being conducted at 11 sites in 7 countries across sub-Saharan Africa. But the researchers have performed an initial analysis of results in the first 6000 children enrolled, who were aged 5 months to 17 months at the time of enrollment.
The children received 3 doses of RTS,S/AS01 and were followed for a 12-month period. RTS,S/AS01 reduced the risk of clinical malaria in these children by 56% and the risk of severe malaria by 47%.
“These results confirm findings from previous phase 2 studies and support ongoing efforts to advance the development of this malaria vaccine candidate,” Hoffman said.
Efficacy and safety results in 6- to 12-week-old infants are expected by the end of 2012, according to the investigators. However, they have performed an analysis of severe malaria episodes reported thus far in all 15,460 children enrolled in the trial, ranging from 6 weeks to 17 months of age.
The analysis showed that RTS,S/AS01 had 35% efficacy over a follow-up period ranging between 0 months and 22 months (average, 11.5 months). Further information about the longer-term effects of RTS,S/AS01—30 months after the third dose—should be available by the end of 2014, the researchers said.
The overall incidence of serious adverse events in this trial was comparable between RTS,S/AS01 recipients (18%) and those receiving a control vaccine (22%)
There were differences in the rates of certain serious adverse events between the vaccine groups. Seizures and meningitis were both more frequent in the RTS,S/AS01 group. Seizures were linked to fever, and meningitis was considered unlikely to be vaccine-related.
RTS,S/AS01 is being developed by GlaxoSmithKline and the PATH Malaria Vaccine Initiative, together with African research centers. The partners are all represented on the Clinical Trials Partnership Committee, which is responsible for the conduct of the trial.
Major funding for clinical development comes from a grant by the Bill & Melinda Gates Foundation. ![]()
Seal of Approval
A report in this month's Journal of Hospital Medicine suggests that hospitals accredited by the Joint Commission outperform those that aren't when it comes to treatment of acute myocardial infarction (AMI), heart failure (HF), and pneumonia.
The study, "Hospital Performance Trends on National Quality Measures and the Association with Joint Commission Accreditation," also found that over a five-year reporting period, accredited institutions improved more than their non-accredited counterparts. HM pioneer Robert Wachter, MD, MHM, chief of the Division of Hospital Medicine at the University of California at San Francisco, was a coauthor of the study.
Joint Commission staffers and fellow coauthors Jerod Loeb, PhD, executive vice president of the Division of Healthcare Quality Evaluation at the Joint Commission, and Stephen Schmaltz, MPH, PhD, associate director of the Department of Health Services Research, say that researchers were not able to compare hospitals based on accreditation and quality control until the commission and the Centers for Medicare & Medicaid Services (CMS) adopted identical measures in 2004.
"We had a strong suspicion that accredited facilities would perform better, which was demonstrable in a statistically significant manner," Dr. Loeb says. "Of course, we worried that one of the questions that reviewers or others who read this might ask is, 'Sure, this is what we might expect from the Joint Commission to say that.' This is why the data is publically available, from us and CMS. Anyone can do the same type of analyses we’ve done and clearly come up with the very same conclusion.”
The next step of the research, Drs. Loeb and Schmaltz say, is to try to delineate whether the "gold seal" of accreditation is what "actually promotes improved performance or is a marker for other characteristics associated with such performance."
"There is something to this broad rubric associated with accreditation that is actually making a difference in the context of measures that matter...to clinical outcomes," Dr. Loeb adds. "This isn't the end of the game for us by any stretch of the imagination. It's clear that more research is needed."
QI-Focused Microsite Aims to Educate Hospitalists
Gregory Maynard, MD, MSc, SFHM, has high hopes for SHM's new Center for Hospital Innovation and Improvement. Dr. Maynard, recently appointed senior vice president of "The Center," believes The Center's tools, resources, and initiatives in QI and patient safety will advance hospitalists' understanding of the implications of healthcare reform and how recent legislative changes will directly affect their jobs.
Through its Web portal, The Center aims to bring together a wide variety of resources, not only such SHM-branded initiatives as VTE Prevention and Project BOOST (Better Outcomes for Older Adults through Safe Transitions), but also relevant tools from other sources.
"The Center has grown because there's a bigger demand all the time for the skills, knowledge, and leadership required for quality and patient safety," Dr. Maynard says. "We recognize that frontline hospitalists are very busy with day-to-day clinical care. On the other hand, quality and safety efforts increasingly will be tied to hospital reimbursement."
Hospital administrators are paying attention to those trends, and hospitalists are well situated to lead their response, he adds.
New quality developments at the center include:
- eQUIPS, SHM’s online toolkit for hospital QI, with a data registry and tools for comparing performance with other hospitals;
- Hospitalists and In-Hospital Resuscitation, a multidisciplinary project for standardizing resuscitation practice;
- A new initiative for atrial fibrillation and transitions of care; and
- In-hospital best practices in diabetes care for hospitalist extenders.
Dr. Maynard is director of hospital medicine and chair of the Patient Safety Committee at the University of California at San Diego (UCSD). He expects to spend one week per month at SHM's Philadelphia office while retaining his leadership position at UCSD.
Frequent Hot Flashes? Check Lipid Levels
NATIONAL HARBOR, Md. – Frequent hot flashes in menopausal women were significantly associated with higher levels of low-density lipoproteins, high-density lipoproteins, and triglycerides during a 7-year follow-up study of 3,201 women enrolled in an ongoing longitudinal study.
Women who reported 1-5 days of hot flashes or 6 or more days of hot flashes during the past 2 weeks were significantly more likely to have elevated levels of LDL cholesterol.
Previous investigations using the Study of Women’s Health Across the Nation (SWAN) database have shown that women with more hot flashes have an elevated risk for subclinical cardiovascular disease, said Rebecca Thurston, Ph.D., of the University of Pittsburgh. But "there is a lot we don’t know about this association, including what could possibly explain this," she said at the annual meeting of the North American Menopause Society.
Dr. Thurston and colleagues examined hot flashes as they related to lipid profiles in women enrolled in SWAN. The subjects’ median age was 46 years, 48% were white, 46% were in early or perimenopause, and 26% reported hot flashes within the past two weeks.
Hot flashes were analyzed in relation to six lipid profiles, after controlling for age, race, menopausal status/cycle day, alcohol use, physical activity, smoking, anxiety, body mass index, cardiovascular disease status and medications, lipid lowering medications, and estradiol.
Compared to women who reported no hot flashes, women who reported 1-5 days of hot flashes or 6 or more days of hot flashes during the past 2 weeks were significantly more likely to have elevated levels of LDL cholesterol, triglycerides, apolipoprotein B, and apolipoprotein A1. For example, LDL levels among women with 6 or more days of hot flashes peaked at approximately 125 mg/dL during a 2-week period, compared with a peak of approximately 120 mg/dL among women with 1-5 days of hot flashes and a peak of approximately 118 mg/dL among women with no reported days of hot flashes.
Levels of HDL cholesterol were significantly higher in women who reported 6 or more days of hot flashes during the past 2 weeks, compared with those who reported no hot flashes, but HDL levels were not significantly different between women who reported 1-5 days of hot flashes and those who reported no hot flashes.
By contrast, levels of lipoprotein(a) were not significantly different among women who reported no hot flashes, women who reported 1 to 5 days of hot flashes, and women who reported 6 or more days of hot flashes.
The positive relationships between hot flashes and lipoprotein(a), and between hot flashes and HDL in some women, were surprising, Dr. Thurston said. "The cardioprotective nature of HDL may depend on particle size," she noted. HDL particles become smaller as women transition through menopause, she added, which might explain the differences.
Additional studies are needed to address the findings on HDL and lipoprotein(a) and to explore how vasomotor symptoms may provide additional information about women’s vascular health, Dr. Thurston said. Future studies should be designed with improved measures of vasomotor symptoms, she added.
The study was supported by a grant from the National Institutes of Health. Dr. Thurston had no financial conflicts to disclose.
FROM THE ANNUAL MEETING OF THE NORTH AMERICAN MENOPAUSE SOCIETY
Major Finding: LDL levels among women with 6 or more days of hot flashes peaked at approximately 125 mg/dL during a 2-week period, compared with a peak of approximately 120 mg/dL among women with 1-5 days of hot flashes and a peak of approximately 118 mg/dL among women with no reported days of hot flashes.
Data Source: Data from 3,201 women enrolled in the Study of Women’s Health Across the Nation (SWAN).
Disclosures: The study was supported by a grant from the National Institutes of Health. Dr. Thurston had no financial conflicts to disclose.
Reliability of CXR for Pneumonia
The chest radiograph (CXR) is the most commonly used diagnostic imaging modality in children, and is considered to be the gold standard for the diagnosis of pneumonia. As such, physicians in developed countries rely on chest radiography to establish the diagnosis of pneumonia.13 However, there are limited data investigating the reliability of this test for the diagnosis of pneumonia in children.2, 46
Prior investigations have noted poor overall agreement by emergency medicine, infectious diseases, and pulmonary medicine physicians, and even radiologists, in their interpretation of chest radiographs for the diagnosis of pneumonia.2, 5, 710 The World Health Organization (WHO) developed criteria to standardize CXR interpretation for the diagnosis of pneumonia in children for use in epidemiologic studies.11 These standardized definitions of pneumonia have been formally evaluated by the WHO6 and utilized in epidemiologic studies of vaccine efficacy,12 but the overall reliability of these radiographic criteria have not been studied outside of these forums.
We conducted this prospective case‐based study to evaluate the reliability of the radiographic diagnosis of pneumonia among children presenting to a pediatric emergency department with clinical suspicion of pneumonia. We were primarily interested in assessing the overall reliability in CXR interpretation for the diagnosis of pneumonia, and identifying which radiographic features of pneumonia were consistently identified by radiologists.
MATERIALS AND METHODS
Study Subjects
We evaluated the reliability of CXR interpretation with respect to the diagnosis of pneumonia among radiologists. Six board‐certified radiologists at 2 academic children's hospitals (Children's Hospital of Philadelphia, Philadelphia, PA [n = 3] and Children's Hospital, Boston, Boston, MA [n = 3]) interpreted the same 110 chest radiographs in a blinded fashion. The radiologists varied with respect to the number of years practicing pediatric radiology (median 8 years, range 3‐36 years). Clinical information such as age, gender, clinical indication for obtaining the radiograph, history, and physical examination findings were not provided. Aside from the study form which stated the WHO classification scheme for radiographic pneumonia, no other information or training was provided to the radiologists as part of this study.
Radiographs were selected among a population of children presenting to the emergency department at Children's Hospital, Boston, who had a radiograph obtained for concern of pneumonia. From this cohort, we selected children who had radiographs which encompassed the spectrum of respiratory disease processes encountered in a pediatric population. The radiographs selected for review included 50 radiographs with a final reading in the medical record without suspicion for pneumonia, and 50 radiographs in which the diagnosis of pneumonia could not be excluded. In the latter group, 25 radiographs had a final reading suggestive of an alveolar infiltrate, and 25 radiographs had a final reading suggestive of an interstitial infiltrate. Ten duplicate radiographs were included to permit assessment of intra‐rater reliability.
Radiograph Interpretation
Radiologists at both sites interpreted the identical 110 radiographs (both anteroposterior [AP] and lateral views for each subject). Digital Imaging and Communications in Medicine (DICOM) images were downloaded from a registry at Children's Hospital, Boston, and were copied to DVDs which were provided to each radiologist. Standardized radiographic imaging software (eFilm Lite [Mississauga, Canada]) was used by each radiologist to view and interpret the radiographs.
Each radiologist completed a study questionnaire for each radiograph interpreted (see Supporting Appendix A in the online version of this article). The questionnaire utilized radiographic descriptors of primary end‐point pneumonia described by the WHO which were procured to standardize the radiographic diagnosis of pneumonia.11, 12 The main outcome of interest was the presence or absence of an infiltrate. Among radiographs in which an infiltrate was identified, radiologists selected whether there was an alveolar infiltrate, interstitial infiltrate, or both. An alveolar infiltrate was defined as a dense or fluffy opacity that occupies a portion or whole of a lobe, or of the entire lung, that may or may not contain air bronchograms.11, 12 An interstitial infiltrate was defined by a lacy pattern involving both lungs, featuring peribronchial thickening and multiple areas of atelectasis.11, 12 It also included minor patchy infiltrates that were not of sufficient magnitude to constitute consolidation, and small areas of atelectasis that in children may be difficult to distinguish from consolidation. Among interstitial infiltrates, radiologists were asked to distinguish infiltrate from atelectasis. A radiograph classified as having either an alveolar infiltrate or interstitial infiltrate (not atelectasis) was considered to have any infiltrate. Additional findings including air bronchograms, hilar adenopathy, pleural effusion, and location of abnormalities were also recorded.
Statistical Analysis
Inter‐rater reliability was assessed using the kappa statistic to determine the overall agreement between the 6 radiologists for each binary outcome (ie, presence or absence of alveolar infiltrate). To calculate 95% confidence intervals (CI) for kappa statistics with more than 2 raters, we employed a bootstrapping method with 1000 replications of samples equal in size to the study sample, using the kapci program as implemented by STATA software (version 10.1, STATA Corp, College Station, TX). Also, intra‐rater reliability was evaluated by examining the agreement within each radiologist upon review of 10 duplicate radiographs that had been randomly inserted into the case‐mix. We used the benchmarks proposed by Landis and Koch to classify the strength of agreement measured by the kappa statistic, as follows: poor (<0.0); slight (0‐0.20); fair (0.21‐0.40); moderate (0.41‐0.60); substantial (0.61‐0.80); almost perfect (0.81‐1.0).13
The study was approved by the institutional review boards at Children's Hospital, Boston and Children's Hospital of Philadelphia.
RESULTS
Patient Sample
The sample of 110 radiographs was obtained from 100 children presenting to the emergency department at Children's Hospital, Boston, with concern of pneumonia. These patients ranged in age from 1 week to 19 years (median, 3.5 years; interquartile range [IQR], 1.6‐6.0 years). Fifty (50%) of these patients were male. As stated above, the sample comprised 50 radiographs with a final reading in the medical record without suspicion for pneumonia, and 50 radiographs in which the diagnosis of pneumonia could not be excluded. The 10 duplicate radiographs encompassed a similar spectrum of findings.
Inter‐Rater Reliability
The kappa coefficients of inter‐rater reliability between the radiologists across the 6 clinical measures of interest are displayed in Table 1. As shown, the most reliable measure was that of alveolar infiltrate (Figure 1), which attained a substantial degree of agreement between the radiologists. Two other measures, any infiltrate and pleural effusion, attained moderate reliability, while bronchograms and hilar adenopathy were each classified as having fair reliability. However, interstitial infiltrate (Figure 2) was found to have the lowest kappa estimate, with a slight degree of reliability. When examining inter‐rater reliability among the radiologists separately from each institution, the pattern of results was similar.
| All Radiologists (n = 6) | Kappa | 95% Confidence Interval |
|---|---|---|
| ||
| Any infiltrate | 0.47 | 0.39, 0.56 |
| Alveolar infiltrate | 0.69 | 0.60, 0.78 |
| Interstitial infiltrate | 0.14 | 0.05, 0.23 |
| Air bronchograms | 0.32 | 0.24, 0.42 |
| Hilar adenopathy | 0.21 | 0.08, 0.39 |
| Pleural effusion | 0.45 | 0.29, 0.61 |
At least 4 of the 6 radiologists agreed on the presence or absence of an alveolar infiltrate for 95 of the 100 unique CXRs; all 6 radiologists agreed regarding the presence or absence of an alveolar infiltrate in 72 of the 100 unique CXRs. At least 4 of the 6 radiologists agreed on the presence or absence of any infiltrate and interstitial infiltrate 96% and 90% of the time, respectively. All 6 of the radiologists agreed on the presence or absence of any infiltrate and interstitial infiltrate 35% and 27% of the time, respectively.
Intra‐Rater Reliability
Estimates of intra‐rater reliability on the primary clinical outcomes (alveolar infiltrate, interstitial infiltrate, and any infiltrate) are found in Table 2. Across the 6 raters, the kappa estimates for alveolar infiltrate were all classified as substantial or almost perfect. The kappa estimates for interstitial infiltrate varied widely, ranging from fair to almost perfect, while for any infiltrate, reliability ranged from moderate to almost perfect.
| Kappa | 95% Confidence Interval | |
|---|---|---|
| ||
| Any infiltrate | ||
| Rater 1 | 1.00 | 1.00, 1.00 |
| Rater 2 | 0.60 | 0.10, 1.00 |
| Rater 3 | 0.80 | 0.44, 1.00 |
| Rater 4 | 1.00 | 1.00, 1.00 |
| Rater 5 | n/a* | |
| Rater 6 | 1.00 | 1.00, 1.00 |
| Alveolar infiltrate | ||
| Rater 1 | 1.00 | 1.00, 1.00 |
| Rater 2 | 1.00 | 1.00, 1.00 |
| Rater 3 | 1.00 | 1.00, 1.00 |
| Rater 4 | 1.00 | 1.00, 1.00 |
| Rater 5 | 0.78 | 0.39, 1.00 |
| Rater 6 | 0.74 | 0.27, 1.00 |
| Interstitial infiltrate | ||
| Rater 1 | 1.00 | 1.00, 1.00 |
| Rater 2 | 0.21 | 0.43, 0.85 |
| Rater 3 | 0.74 | 0.27, 1.00 |
| Rater 4 | n/a | |
| Rater 5 | 0.58 | 0.07, 1.00 |
| Rater 6 | 0.62 | 0.5, 1.00 |
DISCUSSION
The chest radiograph serves as an integral component of the reference standard for the diagnosis of childhood pneumonia. Few prior studies have assessed the reliability of chest radiograph findings in children.3, 5, 12, 14, 15 We found a high degree of agreement among radiologists for radiologic findings consistent with bacterial pneumonia when standardized interpretation criteria were applied. In this study, we identified radiographic features of pneumonia, such as alveolar infiltrate and pleural effusion, that were consistently identified by different radiologists reviewing the same radiograph and by the same radiologist reviewing the same radiograph. These data support the notion that radiographic features most suggestive of bacterial pneumonia are consistently identified by radiologists.16, 17 There was less consistency in the identification of other radiographic findings, such as interstitial infiltrates, air bronchograms, and hilar lymphadenopathy.
Prior studies have found high levels of disagreement among radiologists in the interpretation of chest radiographs.2, 3, 15, 18 Many of these prior studies emphasized variation in detection of radiographic findings that would not typically alter clinical management. We observed high intra‐rater, and inter‐rater reliability among radiologists for the findings of alveolar infiltrate and pleural effusion. These are the radiographic findings most consistent with a bacterial etiologic agent for pneumonia.19 Other studies have also found that the presence of an alveolar infiltrate is a reliable radiographic finding in children18 and adults.7, 9, 10 These findings support the use of the WHO definition of primary endpoint pneumonia for use in epidemiologic studies.4, 6, 11
This study also confirms a previous report by Cherian et al. that findings of many children with asthma, reactive airways disease, bronchiolitis, and viral infections interstitial infiltrates are less reliable.6 This is not surprising considering the fact that these patients often have radiographic findings due to small airway disease and atelectasis.19, 20 The differentiation between atelectasis and interstitial infiltrate is difficult, particularly in young children. A prior study conducted among neonates observed wide variability in the interpretation of chest radiographs, and that the differentiation of pneumonia from atelectasis was difficult for this patient population.5 The decisions around antimicrobial treatment of children with radiographic findings of interstitial infiltrates should be made in the context of the clinical history and physical examination findings, and clinicians should realize that these radiographic features demonstrate poor reliability for the diagnosis of pneumonia.
Overall reliability for the presence of any infiltrate, and its converse, no infiltrate was considered moderate. This is driven by the low reliability and variability around the radiographic diagnosis of interstitial infiltrates. Our findings are similar to those observed in adults with lower respiratory tract infections.9 The low reliability in identification of interstitial infiltrates may explain why prior studies have demonstrated that the CXR results rarely change management in children who have radiographs performed for suspicion of pneumonia.1, 21 Our study highlights the importance of quantifying CXR findings to include specific comments regarding the presence or absence of alveolar infiltrates, rather than the presence or absence of any infiltrate.
The WHO has procured definitions the radiographic diagnosis of pneumonia, and this definition has been utilized to help standardize the interpretation of chest radiographs for the conduct of epidemiological studies.6, 11 Specifically, the definitions utilized not only define the presence or absence of pneumonia, but also attempt to differentiate a primarily bacterial infection (consolidation or pleural effusion), from a viral or atypical presentation (interstitial pattern). Even under the best of circumstances, the differentiation of viral versus bacterial pneumonia is not always possible, and again, is often made by the treating physician by incorporating the clinical setting within which the radiograph was obtained.
This study had several limitations. Firstly, the included radiographs did not reflect the frequency with which certain radiographic findings would be identified in children evaluated for pneumonia in a pediatric emergency department setting. Radiographs were purposefully selected to encompass a broad spectrum of radiologic findings, including less common findings such as hilar lymphadenopathy and pleural effusions. Thus, the prevalence of pneumonia and other abnormal findings in this study was artificially higher than typically observed among a cohort of children for whom pneumonia is considered, a factor that may limit the generalizability of our results. Secondly, the clinical history was not provided to the radiologists to avoid bias by indication. For this study, we notified the radiologists that all radiographs were performed for clinical suspicion of pneumonia without providing details about the subjects' signs and symptoms. The absence of clinical history, however, does not mirror the real world scenario in which the interpretation of the chest radiograph is frequently made in the context of the clinical history. The relevance of this latter issue is unclear, as Tudor et al. found a nonstatistically significant improvement in the overall accuracy in chest radiograph interpretation when radiologists were provided clinical details.10 The radiologists recruited for this study all practice in an academic children's hospital setting, and thus, the generalizability of our findings may be limited to this type of practice setting. Finally, reproducibility does not imply accuracy, and reliability in identifying specific findings does not necessarily lead to improved or different management. Thus, while the reliability of radiographic findings of alveolar infiltrate and pleural effusion is reassuringly high, the validity of these radiographic features for bacterial pneumonia is not known. Ascertainment of validity can only be assessed through the use of invasive testing such as lung biopsy, as the yield from bacterial testing such as blood cultures is low, and the results of other studies such as viral testing of nasopharyngeal washings do not prove an etiologic cause of pneumonia.
CONCLUSIONS
Radiographic findings of alveolar infiltrates and pleural effusions are highly reliable among radiologists. Radiographic interpretation of interstitial infiltrates appears to be less reliable.
- ,,, et al.Usefulness of chest radiographs in children with acute lower respiratory tract disease.J Pediatr.1987;111:187–193.
- ,,, et al.Disagreement in the interpretation of chest radiographs among specialists and clinical outcomes of patients hospitalized with suspected pneumonia.Eur J Intern Med.2006;17:43–47.
- ,,.Problems in the clinical and roentgenographic diagnosis of pneumonia in young children.Clin Pediatr (Phila).1984;23:398–399.
- WHO guidelines on detecting pneumonia in children.Lancet.1991;338:1453–1454.
- ,,, et al.Inter‐ and intra‐observer variability in the assessment of atelectasis and consolidation in neonatal chest radiographs.Pediatr Radiol.1999;29:459–462.
- ,,, et al.Standardized interpretation of paediatric chest radiographs for the diagnosis of pneumonia in epidemiological studies.Bull World Health Organ.2005;83:353–359.
- ,,, et al.Interobserver reliability of the chest radiograph in community‐acquired pneumonia. PORT Investigators.Chest.1996;110:343–350.
- ,,, et al.Chest radiographs in the emergency department: is the radiologist really necessary?Postgrad Med J.2003;79:214–217.
- ,,, et al.Inter‐observer variation in the interpretation of chest radiographs for pneumonia in community‐acquired lower respiratory tract infections.Clin Radiol.2004;59:743–752.
- ,,.An assessment of inter‐observer agreement and accuracy when reporting plain radiographs.Clin Radiol.1997;52:235–238.
- Standardization of interpretation of chest radiographs for the diagnosis of pneumonia in children. In:World Health Organization: Pneumonia Vaccine Trial Investigators' Group.Geneva:Department of Vaccine and Biologics;2001.
- ,,, et al.Effectiveness of heptavalent pneumococcal conjugate vaccine in children younger than 5 years of age for prevention of pneumonia: updated analysis using World Health Organization standardized interpretation of chest radiographs.Pediatr Infect Dis J.2006;25:779–781.
- ,.The measurement of observer agreement for categorical data.Biometrics.1977;33:159–174.
- ,.Clinical, laboratory, and radiological information in the diagnosis of pneumonia in children.Ann Emerg Med.1988;17:43–46.
- ,.Intraobserver and interobserver agreement of the interpretation of pediatric chest radiographs.Emerg Radiol.17:285–290.
- ,,, et al.Practice guidelines for the management of community‐acquired pneumonia in adults. Infectious Diseases Society of America.Clin Infect Dis.2000;31:347–382.
- ,,, et al.Guidelines for the management of adults with community‐acquired pneumonia. Diagnosis, assessment of severity, antimicrobial therapy, and prevention.Am J Respir Crit Care Med.2001;163:1730–1754.
- ,,, et al.Comparison of radiological findings and microbial aetiology of childhood pneumonia.Acta Paediatr.1993;82:360–363.
- Kuhn JP, Slovis TL, Haller JO, eds.Caffey's Pediatric Diagnostic Imaging.10th ed.Philadelphia, PA:Mosby;2004.
- ,,, et al.Clinical predictors of pneumonia among children with wheezing.Pediatrics.2009;124:e29–e36.
- ,,, et al.The clinical impact of the radiology report in wheezing and nonwheezing febrile children: a survey of clinicians.Pediatr Radiol.2009;39:348–353.
The chest radiograph (CXR) is the most commonly used diagnostic imaging modality in children, and is considered to be the gold standard for the diagnosis of pneumonia. As such, physicians in developed countries rely on chest radiography to establish the diagnosis of pneumonia.13 However, there are limited data investigating the reliability of this test for the diagnosis of pneumonia in children.2, 46
Prior investigations have noted poor overall agreement by emergency medicine, infectious diseases, and pulmonary medicine physicians, and even radiologists, in their interpretation of chest radiographs for the diagnosis of pneumonia.2, 5, 710 The World Health Organization (WHO) developed criteria to standardize CXR interpretation for the diagnosis of pneumonia in children for use in epidemiologic studies.11 These standardized definitions of pneumonia have been formally evaluated by the WHO6 and utilized in epidemiologic studies of vaccine efficacy,12 but the overall reliability of these radiographic criteria have not been studied outside of these forums.
We conducted this prospective case‐based study to evaluate the reliability of the radiographic diagnosis of pneumonia among children presenting to a pediatric emergency department with clinical suspicion of pneumonia. We were primarily interested in assessing the overall reliability in CXR interpretation for the diagnosis of pneumonia, and identifying which radiographic features of pneumonia were consistently identified by radiologists.
MATERIALS AND METHODS
Study Subjects
We evaluated the reliability of CXR interpretation with respect to the diagnosis of pneumonia among radiologists. Six board‐certified radiologists at 2 academic children's hospitals (Children's Hospital of Philadelphia, Philadelphia, PA [n = 3] and Children's Hospital, Boston, Boston, MA [n = 3]) interpreted the same 110 chest radiographs in a blinded fashion. The radiologists varied with respect to the number of years practicing pediatric radiology (median 8 years, range 3‐36 years). Clinical information such as age, gender, clinical indication for obtaining the radiograph, history, and physical examination findings were not provided. Aside from the study form which stated the WHO classification scheme for radiographic pneumonia, no other information or training was provided to the radiologists as part of this study.
Radiographs were selected among a population of children presenting to the emergency department at Children's Hospital, Boston, who had a radiograph obtained for concern of pneumonia. From this cohort, we selected children who had radiographs which encompassed the spectrum of respiratory disease processes encountered in a pediatric population. The radiographs selected for review included 50 radiographs with a final reading in the medical record without suspicion for pneumonia, and 50 radiographs in which the diagnosis of pneumonia could not be excluded. In the latter group, 25 radiographs had a final reading suggestive of an alveolar infiltrate, and 25 radiographs had a final reading suggestive of an interstitial infiltrate. Ten duplicate radiographs were included to permit assessment of intra‐rater reliability.
Radiograph Interpretation
Radiologists at both sites interpreted the identical 110 radiographs (both anteroposterior [AP] and lateral views for each subject). Digital Imaging and Communications in Medicine (DICOM) images were downloaded from a registry at Children's Hospital, Boston, and were copied to DVDs which were provided to each radiologist. Standardized radiographic imaging software (eFilm Lite [Mississauga, Canada]) was used by each radiologist to view and interpret the radiographs.
Each radiologist completed a study questionnaire for each radiograph interpreted (see Supporting Appendix A in the online version of this article). The questionnaire utilized radiographic descriptors of primary end‐point pneumonia described by the WHO which were procured to standardize the radiographic diagnosis of pneumonia.11, 12 The main outcome of interest was the presence or absence of an infiltrate. Among radiographs in which an infiltrate was identified, radiologists selected whether there was an alveolar infiltrate, interstitial infiltrate, or both. An alveolar infiltrate was defined as a dense or fluffy opacity that occupies a portion or whole of a lobe, or of the entire lung, that may or may not contain air bronchograms.11, 12 An interstitial infiltrate was defined by a lacy pattern involving both lungs, featuring peribronchial thickening and multiple areas of atelectasis.11, 12 It also included minor patchy infiltrates that were not of sufficient magnitude to constitute consolidation, and small areas of atelectasis that in children may be difficult to distinguish from consolidation. Among interstitial infiltrates, radiologists were asked to distinguish infiltrate from atelectasis. A radiograph classified as having either an alveolar infiltrate or interstitial infiltrate (not atelectasis) was considered to have any infiltrate. Additional findings including air bronchograms, hilar adenopathy, pleural effusion, and location of abnormalities were also recorded.
Statistical Analysis
Inter‐rater reliability was assessed using the kappa statistic to determine the overall agreement between the 6 radiologists for each binary outcome (ie, presence or absence of alveolar infiltrate). To calculate 95% confidence intervals (CI) for kappa statistics with more than 2 raters, we employed a bootstrapping method with 1000 replications of samples equal in size to the study sample, using the kapci program as implemented by STATA software (version 10.1, STATA Corp, College Station, TX). Also, intra‐rater reliability was evaluated by examining the agreement within each radiologist upon review of 10 duplicate radiographs that had been randomly inserted into the case‐mix. We used the benchmarks proposed by Landis and Koch to classify the strength of agreement measured by the kappa statistic, as follows: poor (<0.0); slight (0‐0.20); fair (0.21‐0.40); moderate (0.41‐0.60); substantial (0.61‐0.80); almost perfect (0.81‐1.0).13
The study was approved by the institutional review boards at Children's Hospital, Boston and Children's Hospital of Philadelphia.
RESULTS
Patient Sample
The sample of 110 radiographs was obtained from 100 children presenting to the emergency department at Children's Hospital, Boston, with concern of pneumonia. These patients ranged in age from 1 week to 19 years (median, 3.5 years; interquartile range [IQR], 1.6‐6.0 years). Fifty (50%) of these patients were male. As stated above, the sample comprised 50 radiographs with a final reading in the medical record without suspicion for pneumonia, and 50 radiographs in which the diagnosis of pneumonia could not be excluded. The 10 duplicate radiographs encompassed a similar spectrum of findings.
Inter‐Rater Reliability
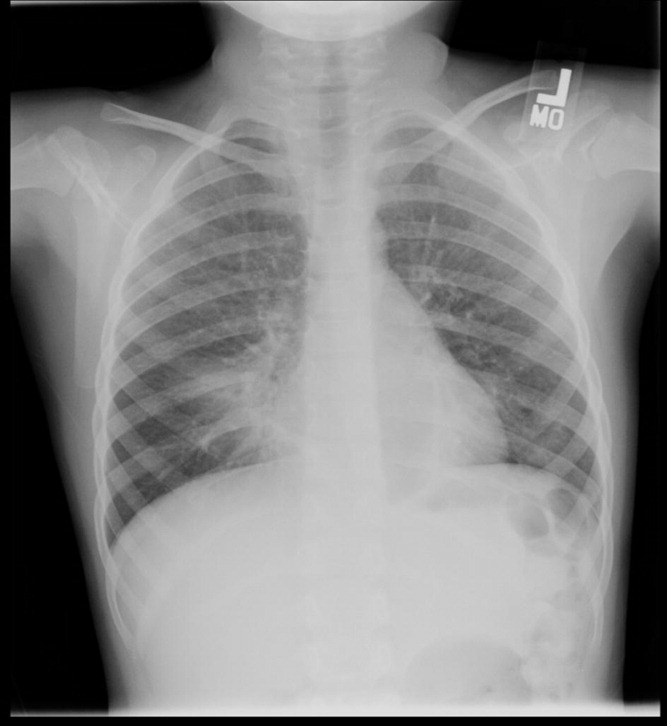
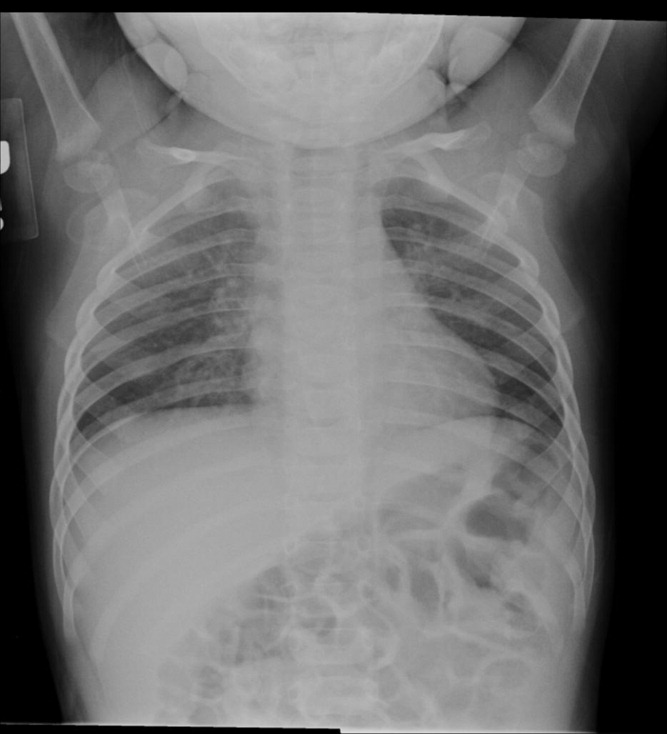
The kappa coefficients of inter‐rater reliability between the radiologists across the 6 clinical measures of interest are displayed in Table 1. As shown, the most reliable measure was that of alveolar infiltrate (Figure 1), which attained a substantial degree of agreement between the radiologists. Two other measures, any infiltrate and pleural effusion, attained moderate reliability, while bronchograms and hilar adenopathy were each classified as having fair reliability. However, interstitial infiltrate (Figure 2) was found to have the lowest kappa estimate, with a slight degree of reliability. When examining inter‐rater reliability among the radiologists separately from each institution, the pattern of results was similar.
| All Radiologists (n = 6) | Kappa | 95% Confidence Interval |
|---|---|---|
| ||
| Any infiltrate | 0.47 | 0.39, 0.56 |
| Alveolar infiltrate | 0.69 | 0.60, 0.78 |
| Interstitial infiltrate | 0.14 | 0.05, 0.23 |
| Air bronchograms | 0.32 | 0.24, 0.42 |
| Hilar adenopathy | 0.21 | 0.08, 0.39 |
| Pleural effusion | 0.45 | 0.29, 0.61 |
At least 4 of the 6 radiologists agreed on the presence or absence of an alveolar infiltrate for 95 of the 100 unique CXRs; all 6 radiologists agreed regarding the presence or absence of an alveolar infiltrate in 72 of the 100 unique CXRs. At least 4 of the 6 radiologists agreed on the presence or absence of any infiltrate and interstitial infiltrate 96% and 90% of the time, respectively. All 6 of the radiologists agreed on the presence or absence of any infiltrate and interstitial infiltrate 35% and 27% of the time, respectively.
Intra‐Rater Reliability
Estimates of intra‐rater reliability on the primary clinical outcomes (alveolar infiltrate, interstitial infiltrate, and any infiltrate) are found in Table 2. Across the 6 raters, the kappa estimates for alveolar infiltrate were all classified as substantial or almost perfect. The kappa estimates for interstitial infiltrate varied widely, ranging from fair to almost perfect, while for any infiltrate, reliability ranged from moderate to almost perfect.
| Kappa | 95% Confidence Interval | |
|---|---|---|
| ||
| Any infiltrate | ||
| Rater 1 | 1.00 | 1.00, 1.00 |
| Rater 2 | 0.60 | 0.10, 1.00 |
| Rater 3 | 0.80 | 0.44, 1.00 |
| Rater 4 | 1.00 | 1.00, 1.00 |
| Rater 5 | n/a* | |
| Rater 6 | 1.00 | 1.00, 1.00 |
| Alveolar infiltrate | ||
| Rater 1 | 1.00 | 1.00, 1.00 |
| Rater 2 | 1.00 | 1.00, 1.00 |
| Rater 3 | 1.00 | 1.00, 1.00 |
| Rater 4 | 1.00 | 1.00, 1.00 |
| Rater 5 | 0.78 | 0.39, 1.00 |
| Rater 6 | 0.74 | 0.27, 1.00 |
| Interstitial infiltrate | ||
| Rater 1 | 1.00 | 1.00, 1.00 |
| Rater 2 | 0.21 | 0.43, 0.85 |
| Rater 3 | 0.74 | 0.27, 1.00 |
| Rater 4 | n/a | |
| Rater 5 | 0.58 | 0.07, 1.00 |
| Rater 6 | 0.62 | 0.5, 1.00 |
DISCUSSION
The chest radiograph serves as an integral component of the reference standard for the diagnosis of childhood pneumonia. Few prior studies have assessed the reliability of chest radiograph findings in children.3, 5, 12, 14, 15 We found a high degree of agreement among radiologists for radiologic findings consistent with bacterial pneumonia when standardized interpretation criteria were applied. In this study, we identified radiographic features of pneumonia, such as alveolar infiltrate and pleural effusion, that were consistently identified by different radiologists reviewing the same radiograph and by the same radiologist reviewing the same radiograph. These data support the notion that radiographic features most suggestive of bacterial pneumonia are consistently identified by radiologists.16, 17 There was less consistency in the identification of other radiographic findings, such as interstitial infiltrates, air bronchograms, and hilar lymphadenopathy.
Prior studies have found high levels of disagreement among radiologists in the interpretation of chest radiographs.2, 3, 15, 18 Many of these prior studies emphasized variation in detection of radiographic findings that would not typically alter clinical management. We observed high intra‐rater, and inter‐rater reliability among radiologists for the findings of alveolar infiltrate and pleural effusion. These are the radiographic findings most consistent with a bacterial etiologic agent for pneumonia.19 Other studies have also found that the presence of an alveolar infiltrate is a reliable radiographic finding in children18 and adults.7, 9, 10 These findings support the use of the WHO definition of primary endpoint pneumonia for use in epidemiologic studies.4, 6, 11
This study also confirms a previous report by Cherian et al. that findings of many children with asthma, reactive airways disease, bronchiolitis, and viral infections interstitial infiltrates are less reliable.6 This is not surprising considering the fact that these patients often have radiographic findings due to small airway disease and atelectasis.19, 20 The differentiation between atelectasis and interstitial infiltrate is difficult, particularly in young children. A prior study conducted among neonates observed wide variability in the interpretation of chest radiographs, and that the differentiation of pneumonia from atelectasis was difficult for this patient population.5 The decisions around antimicrobial treatment of children with radiographic findings of interstitial infiltrates should be made in the context of the clinical history and physical examination findings, and clinicians should realize that these radiographic features demonstrate poor reliability for the diagnosis of pneumonia.
Overall reliability for the presence of any infiltrate, and its converse, no infiltrate was considered moderate. This is driven by the low reliability and variability around the radiographic diagnosis of interstitial infiltrates. Our findings are similar to those observed in adults with lower respiratory tract infections.9 The low reliability in identification of interstitial infiltrates may explain why prior studies have demonstrated that the CXR results rarely change management in children who have radiographs performed for suspicion of pneumonia.1, 21 Our study highlights the importance of quantifying CXR findings to include specific comments regarding the presence or absence of alveolar infiltrates, rather than the presence or absence of any infiltrate.
The WHO has procured definitions the radiographic diagnosis of pneumonia, and this definition has been utilized to help standardize the interpretation of chest radiographs for the conduct of epidemiological studies.6, 11 Specifically, the definitions utilized not only define the presence or absence of pneumonia, but also attempt to differentiate a primarily bacterial infection (consolidation or pleural effusion), from a viral or atypical presentation (interstitial pattern). Even under the best of circumstances, the differentiation of viral versus bacterial pneumonia is not always possible, and again, is often made by the treating physician by incorporating the clinical setting within which the radiograph was obtained.
This study had several limitations. Firstly, the included radiographs did not reflect the frequency with which certain radiographic findings would be identified in children evaluated for pneumonia in a pediatric emergency department setting. Radiographs were purposefully selected to encompass a broad spectrum of radiologic findings, including less common findings such as hilar lymphadenopathy and pleural effusions. Thus, the prevalence of pneumonia and other abnormal findings in this study was artificially higher than typically observed among a cohort of children for whom pneumonia is considered, a factor that may limit the generalizability of our results. Secondly, the clinical history was not provided to the radiologists to avoid bias by indication. For this study, we notified the radiologists that all radiographs were performed for clinical suspicion of pneumonia without providing details about the subjects' signs and symptoms. The absence of clinical history, however, does not mirror the real world scenario in which the interpretation of the chest radiograph is frequently made in the context of the clinical history. The relevance of this latter issue is unclear, as Tudor et al. found a nonstatistically significant improvement in the overall accuracy in chest radiograph interpretation when radiologists were provided clinical details.10 The radiologists recruited for this study all practice in an academic children's hospital setting, and thus, the generalizability of our findings may be limited to this type of practice setting. Finally, reproducibility does not imply accuracy, and reliability in identifying specific findings does not necessarily lead to improved or different management. Thus, while the reliability of radiographic findings of alveolar infiltrate and pleural effusion is reassuringly high, the validity of these radiographic features for bacterial pneumonia is not known. Ascertainment of validity can only be assessed through the use of invasive testing such as lung biopsy, as the yield from bacterial testing such as blood cultures is low, and the results of other studies such as viral testing of nasopharyngeal washings do not prove an etiologic cause of pneumonia.
CONCLUSIONS
Radiographic findings of alveolar infiltrates and pleural effusions are highly reliable among radiologists. Radiographic interpretation of interstitial infiltrates appears to be less reliable.
The chest radiograph (CXR) is the most commonly used diagnostic imaging modality in children, and is considered to be the gold standard for the diagnosis of pneumonia. As such, physicians in developed countries rely on chest radiography to establish the diagnosis of pneumonia.13 However, there are limited data investigating the reliability of this test for the diagnosis of pneumonia in children.2, 46
Prior investigations have noted poor overall agreement by emergency medicine, infectious diseases, and pulmonary medicine physicians, and even radiologists, in their interpretation of chest radiographs for the diagnosis of pneumonia.2, 5, 710 The World Health Organization (WHO) developed criteria to standardize CXR interpretation for the diagnosis of pneumonia in children for use in epidemiologic studies.11 These standardized definitions of pneumonia have been formally evaluated by the WHO6 and utilized in epidemiologic studies of vaccine efficacy,12 but the overall reliability of these radiographic criteria have not been studied outside of these forums.
We conducted this prospective case‐based study to evaluate the reliability of the radiographic diagnosis of pneumonia among children presenting to a pediatric emergency department with clinical suspicion of pneumonia. We were primarily interested in assessing the overall reliability in CXR interpretation for the diagnosis of pneumonia, and identifying which radiographic features of pneumonia were consistently identified by radiologists.
MATERIALS AND METHODS
Study Subjects
We evaluated the reliability of CXR interpretation with respect to the diagnosis of pneumonia among radiologists. Six board‐certified radiologists at 2 academic children's hospitals (Children's Hospital of Philadelphia, Philadelphia, PA [n = 3] and Children's Hospital, Boston, Boston, MA [n = 3]) interpreted the same 110 chest radiographs in a blinded fashion. The radiologists varied with respect to the number of years practicing pediatric radiology (median 8 years, range 3‐36 years). Clinical information such as age, gender, clinical indication for obtaining the radiograph, history, and physical examination findings were not provided. Aside from the study form which stated the WHO classification scheme for radiographic pneumonia, no other information or training was provided to the radiologists as part of this study.
Radiographs were selected among a population of children presenting to the emergency department at Children's Hospital, Boston, who had a radiograph obtained for concern of pneumonia. From this cohort, we selected children who had radiographs which encompassed the spectrum of respiratory disease processes encountered in a pediatric population. The radiographs selected for review included 50 radiographs with a final reading in the medical record without suspicion for pneumonia, and 50 radiographs in which the diagnosis of pneumonia could not be excluded. In the latter group, 25 radiographs had a final reading suggestive of an alveolar infiltrate, and 25 radiographs had a final reading suggestive of an interstitial infiltrate. Ten duplicate radiographs were included to permit assessment of intra‐rater reliability.
Radiograph Interpretation
Radiologists at both sites interpreted the identical 110 radiographs (both anteroposterior [AP] and lateral views for each subject). Digital Imaging and Communications in Medicine (DICOM) images were downloaded from a registry at Children's Hospital, Boston, and were copied to DVDs which were provided to each radiologist. Standardized radiographic imaging software (eFilm Lite [Mississauga, Canada]) was used by each radiologist to view and interpret the radiographs.
Each radiologist completed a study questionnaire for each radiograph interpreted (see Supporting Appendix A in the online version of this article). The questionnaire utilized radiographic descriptors of primary end‐point pneumonia described by the WHO which were procured to standardize the radiographic diagnosis of pneumonia.11, 12 The main outcome of interest was the presence or absence of an infiltrate. Among radiographs in which an infiltrate was identified, radiologists selected whether there was an alveolar infiltrate, interstitial infiltrate, or both. An alveolar infiltrate was defined as a dense or fluffy opacity that occupies a portion or whole of a lobe, or of the entire lung, that may or may not contain air bronchograms.11, 12 An interstitial infiltrate was defined by a lacy pattern involving both lungs, featuring peribronchial thickening and multiple areas of atelectasis.11, 12 It also included minor patchy infiltrates that were not of sufficient magnitude to constitute consolidation, and small areas of atelectasis that in children may be difficult to distinguish from consolidation. Among interstitial infiltrates, radiologists were asked to distinguish infiltrate from atelectasis. A radiograph classified as having either an alveolar infiltrate or interstitial infiltrate (not atelectasis) was considered to have any infiltrate. Additional findings including air bronchograms, hilar adenopathy, pleural effusion, and location of abnormalities were also recorded.
Statistical Analysis
Inter‐rater reliability was assessed using the kappa statistic to determine the overall agreement between the 6 radiologists for each binary outcome (ie, presence or absence of alveolar infiltrate). To calculate 95% confidence intervals (CI) for kappa statistics with more than 2 raters, we employed a bootstrapping method with 1000 replications of samples equal in size to the study sample, using the kapci program as implemented by STATA software (version 10.1, STATA Corp, College Station, TX). Also, intra‐rater reliability was evaluated by examining the agreement within each radiologist upon review of 10 duplicate radiographs that had been randomly inserted into the case‐mix. We used the benchmarks proposed by Landis and Koch to classify the strength of agreement measured by the kappa statistic, as follows: poor (<0.0); slight (0‐0.20); fair (0.21‐0.40); moderate (0.41‐0.60); substantial (0.61‐0.80); almost perfect (0.81‐1.0).13
The study was approved by the institutional review boards at Children's Hospital, Boston and Children's Hospital of Philadelphia.
RESULTS
Patient Sample
The sample of 110 radiographs was obtained from 100 children presenting to the emergency department at Children's Hospital, Boston, with concern of pneumonia. These patients ranged in age from 1 week to 19 years (median, 3.5 years; interquartile range [IQR], 1.6‐6.0 years). Fifty (50%) of these patients were male. As stated above, the sample comprised 50 radiographs with a final reading in the medical record without suspicion for pneumonia, and 50 radiographs in which the diagnosis of pneumonia could not be excluded. The 10 duplicate radiographs encompassed a similar spectrum of findings.
Inter‐Rater Reliability
The kappa coefficients of inter‐rater reliability between the radiologists across the 6 clinical measures of interest are displayed in Table 1. As shown, the most reliable measure was that of alveolar infiltrate (Figure 1), which attained a substantial degree of agreement between the radiologists. Two other measures, any infiltrate and pleural effusion, attained moderate reliability, while bronchograms and hilar adenopathy were each classified as having fair reliability. However, interstitial infiltrate (Figure 2) was found to have the lowest kappa estimate, with a slight degree of reliability. When examining inter‐rater reliability among the radiologists separately from each institution, the pattern of results was similar.
| All Radiologists (n = 6) | Kappa | 95% Confidence Interval |
|---|---|---|
| ||
| Any infiltrate | 0.47 | 0.39, 0.56 |
| Alveolar infiltrate | 0.69 | 0.60, 0.78 |
| Interstitial infiltrate | 0.14 | 0.05, 0.23 |
| Air bronchograms | 0.32 | 0.24, 0.42 |
| Hilar adenopathy | 0.21 | 0.08, 0.39 |
| Pleural effusion | 0.45 | 0.29, 0.61 |
At least 4 of the 6 radiologists agreed on the presence or absence of an alveolar infiltrate for 95 of the 100 unique CXRs; all 6 radiologists agreed regarding the presence or absence of an alveolar infiltrate in 72 of the 100 unique CXRs. At least 4 of the 6 radiologists agreed on the presence or absence of any infiltrate and interstitial infiltrate 96% and 90% of the time, respectively. All 6 of the radiologists agreed on the presence or absence of any infiltrate and interstitial infiltrate 35% and 27% of the time, respectively.
Intra‐Rater Reliability
Estimates of intra‐rater reliability on the primary clinical outcomes (alveolar infiltrate, interstitial infiltrate, and any infiltrate) are found in Table 2. Across the 6 raters, the kappa estimates for alveolar infiltrate were all classified as substantial or almost perfect. The kappa estimates for interstitial infiltrate varied widely, ranging from fair to almost perfect, while for any infiltrate, reliability ranged from moderate to almost perfect.
| Kappa | 95% Confidence Interval | |
|---|---|---|
| ||
| Any infiltrate | ||
| Rater 1 | 1.00 | 1.00, 1.00 |
| Rater 2 | 0.60 | 0.10, 1.00 |
| Rater 3 | 0.80 | 0.44, 1.00 |
| Rater 4 | 1.00 | 1.00, 1.00 |
| Rater 5 | n/a* | |
| Rater 6 | 1.00 | 1.00, 1.00 |
| Alveolar infiltrate | ||
| Rater 1 | 1.00 | 1.00, 1.00 |
| Rater 2 | 1.00 | 1.00, 1.00 |
| Rater 3 | 1.00 | 1.00, 1.00 |
| Rater 4 | 1.00 | 1.00, 1.00 |
| Rater 5 | 0.78 | 0.39, 1.00 |
| Rater 6 | 0.74 | 0.27, 1.00 |
| Interstitial infiltrate | ||
| Rater 1 | 1.00 | 1.00, 1.00 |
| Rater 2 | 0.21 | 0.43, 0.85 |
| Rater 3 | 0.74 | 0.27, 1.00 |
| Rater 4 | n/a | |
| Rater 5 | 0.58 | 0.07, 1.00 |
| Rater 6 | 0.62 | 0.5, 1.00 |
DISCUSSION
The chest radiograph serves as an integral component of the reference standard for the diagnosis of childhood pneumonia. Few prior studies have assessed the reliability of chest radiograph findings in children.3, 5, 12, 14, 15 We found a high degree of agreement among radiologists for radiologic findings consistent with bacterial pneumonia when standardized interpretation criteria were applied. In this study, we identified radiographic features of pneumonia, such as alveolar infiltrate and pleural effusion, that were consistently identified by different radiologists reviewing the same radiograph and by the same radiologist reviewing the same radiograph. These data support the notion that radiographic features most suggestive of bacterial pneumonia are consistently identified by radiologists.16, 17 There was less consistency in the identification of other radiographic findings, such as interstitial infiltrates, air bronchograms, and hilar lymphadenopathy.
Prior studies have found high levels of disagreement among radiologists in the interpretation of chest radiographs.2, 3, 15, 18 Many of these prior studies emphasized variation in detection of radiographic findings that would not typically alter clinical management. We observed high intra‐rater, and inter‐rater reliability among radiologists for the findings of alveolar infiltrate and pleural effusion. These are the radiographic findings most consistent with a bacterial etiologic agent for pneumonia.19 Other studies have also found that the presence of an alveolar infiltrate is a reliable radiographic finding in children18 and adults.7, 9, 10 These findings support the use of the WHO definition of primary endpoint pneumonia for use in epidemiologic studies.4, 6, 11
This study also confirms a previous report by Cherian et al. that findings of many children with asthma, reactive airways disease, bronchiolitis, and viral infections interstitial infiltrates are less reliable.6 This is not surprising considering the fact that these patients often have radiographic findings due to small airway disease and atelectasis.19, 20 The differentiation between atelectasis and interstitial infiltrate is difficult, particularly in young children. A prior study conducted among neonates observed wide variability in the interpretation of chest radiographs, and that the differentiation of pneumonia from atelectasis was difficult for this patient population.5 The decisions around antimicrobial treatment of children with radiographic findings of interstitial infiltrates should be made in the context of the clinical history and physical examination findings, and clinicians should realize that these radiographic features demonstrate poor reliability for the diagnosis of pneumonia.
Overall reliability for the presence of any infiltrate, and its converse, no infiltrate was considered moderate. This is driven by the low reliability and variability around the radiographic diagnosis of interstitial infiltrates. Our findings are similar to those observed in adults with lower respiratory tract infections.9 The low reliability in identification of interstitial infiltrates may explain why prior studies have demonstrated that the CXR results rarely change management in children who have radiographs performed for suspicion of pneumonia.1, 21 Our study highlights the importance of quantifying CXR findings to include specific comments regarding the presence or absence of alveolar infiltrates, rather than the presence or absence of any infiltrate.
The WHO has procured definitions the radiographic diagnosis of pneumonia, and this definition has been utilized to help standardize the interpretation of chest radiographs for the conduct of epidemiological studies.6, 11 Specifically, the definitions utilized not only define the presence or absence of pneumonia, but also attempt to differentiate a primarily bacterial infection (consolidation or pleural effusion), from a viral or atypical presentation (interstitial pattern). Even under the best of circumstances, the differentiation of viral versus bacterial pneumonia is not always possible, and again, is often made by the treating physician by incorporating the clinical setting within which the radiograph was obtained.
This study had several limitations. Firstly, the included radiographs did not reflect the frequency with which certain radiographic findings would be identified in children evaluated for pneumonia in a pediatric emergency department setting. Radiographs were purposefully selected to encompass a broad spectrum of radiologic findings, including less common findings such as hilar lymphadenopathy and pleural effusions. Thus, the prevalence of pneumonia and other abnormal findings in this study was artificially higher than typically observed among a cohort of children for whom pneumonia is considered, a factor that may limit the generalizability of our results. Secondly, the clinical history was not provided to the radiologists to avoid bias by indication. For this study, we notified the radiologists that all radiographs were performed for clinical suspicion of pneumonia without providing details about the subjects' signs and symptoms. The absence of clinical history, however, does not mirror the real world scenario in which the interpretation of the chest radiograph is frequently made in the context of the clinical history. The relevance of this latter issue is unclear, as Tudor et al. found a nonstatistically significant improvement in the overall accuracy in chest radiograph interpretation when radiologists were provided clinical details.10 The radiologists recruited for this study all practice in an academic children's hospital setting, and thus, the generalizability of our findings may be limited to this type of practice setting. Finally, reproducibility does not imply accuracy, and reliability in identifying specific findings does not necessarily lead to improved or different management. Thus, while the reliability of radiographic findings of alveolar infiltrate and pleural effusion is reassuringly high, the validity of these radiographic features for bacterial pneumonia is not known. Ascertainment of validity can only be assessed through the use of invasive testing such as lung biopsy, as the yield from bacterial testing such as blood cultures is low, and the results of other studies such as viral testing of nasopharyngeal washings do not prove an etiologic cause of pneumonia.
CONCLUSIONS
Radiographic findings of alveolar infiltrates and pleural effusions are highly reliable among radiologists. Radiographic interpretation of interstitial infiltrates appears to be less reliable.
- ,,, et al.Usefulness of chest radiographs in children with acute lower respiratory tract disease.J Pediatr.1987;111:187–193.
- ,,, et al.Disagreement in the interpretation of chest radiographs among specialists and clinical outcomes of patients hospitalized with suspected pneumonia.Eur J Intern Med.2006;17:43–47.
- ,,.Problems in the clinical and roentgenographic diagnosis of pneumonia in young children.Clin Pediatr (Phila).1984;23:398–399.
- WHO guidelines on detecting pneumonia in children.Lancet.1991;338:1453–1454.
- ,,, et al.Inter‐ and intra‐observer variability in the assessment of atelectasis and consolidation in neonatal chest radiographs.Pediatr Radiol.1999;29:459–462.
- ,,, et al.Standardized interpretation of paediatric chest radiographs for the diagnosis of pneumonia in epidemiological studies.Bull World Health Organ.2005;83:353–359.
- ,,, et al.Interobserver reliability of the chest radiograph in community‐acquired pneumonia. PORT Investigators.Chest.1996;110:343–350.
- ,,, et al.Chest radiographs in the emergency department: is the radiologist really necessary?Postgrad Med J.2003;79:214–217.
- ,,, et al.Inter‐observer variation in the interpretation of chest radiographs for pneumonia in community‐acquired lower respiratory tract infections.Clin Radiol.2004;59:743–752.
- ,,.An assessment of inter‐observer agreement and accuracy when reporting plain radiographs.Clin Radiol.1997;52:235–238.
- Standardization of interpretation of chest radiographs for the diagnosis of pneumonia in children. In:World Health Organization: Pneumonia Vaccine Trial Investigators' Group.Geneva:Department of Vaccine and Biologics;2001.
- ,,, et al.Effectiveness of heptavalent pneumococcal conjugate vaccine in children younger than 5 years of age for prevention of pneumonia: updated analysis using World Health Organization standardized interpretation of chest radiographs.Pediatr Infect Dis J.2006;25:779–781.
- ,.The measurement of observer agreement for categorical data.Biometrics.1977;33:159–174.
- ,.Clinical, laboratory, and radiological information in the diagnosis of pneumonia in children.Ann Emerg Med.1988;17:43–46.
- ,.Intraobserver and interobserver agreement of the interpretation of pediatric chest radiographs.Emerg Radiol.17:285–290.
- ,,, et al.Practice guidelines for the management of community‐acquired pneumonia in adults. Infectious Diseases Society of America.Clin Infect Dis.2000;31:347–382.
- ,,, et al.Guidelines for the management of adults with community‐acquired pneumonia. Diagnosis, assessment of severity, antimicrobial therapy, and prevention.Am J Respir Crit Care Med.2001;163:1730–1754.
- ,,, et al.Comparison of radiological findings and microbial aetiology of childhood pneumonia.Acta Paediatr.1993;82:360–363.
- Kuhn JP, Slovis TL, Haller JO, eds.Caffey's Pediatric Diagnostic Imaging.10th ed.Philadelphia, PA:Mosby;2004.
- ,,, et al.Clinical predictors of pneumonia among children with wheezing.Pediatrics.2009;124:e29–e36.
- ,,, et al.The clinical impact of the radiology report in wheezing and nonwheezing febrile children: a survey of clinicians.Pediatr Radiol.2009;39:348–353.
Copyright © 2011 Society of Hospital Medicine

FDA approves deferiprone to treat iron overload
thalassemia
The FDA has approved deferiprone (Ferriprox) to treat iron overload in thalassemia patients who had an inadequate response to prior chelation therapy.
Deferiprone is the first treatment for transfusional iron overload to be approved since 2005, said Richard Pazdur, MD, director of the Office of Hematology and Oncology Products in the FDA’s Center for Drug Evaluation and Research.
The drug’s approval is based on a review of data from 12 clinical studies in 236 patients. Patients participating in the studies did not respond to prior iron chelation therapy.
Deferiprone was considered a success if patients experienced at least a 20% decrease in serum ferritin. And half of the patients included in the review experienced at least a 20% decrease in ferritin levels.
The most common side effects of the drug were nausea, vomiting, abdominal and joint pain, chromaturia, neutropenia, and an increase in the level of a liver enzyme that may be indicative of tissue or liver damage at unsafe amounts. The most serious side effect, seen in about 2% of patients, was the development of agranulocytosis.
Deferiprone has been approved under the FDA’s accelerated approval program, which was designed to provide patients with earlier access to promising new drugs, followed by further studies to confirm the drug’s clinical benefit.
ApoPharma, the company that manufactures deferiprone, has agreed to several post-marketing requirements and commitments. One commitment includes further study of the use of deferiprone in patients with sickle cell disease who have transfusional iron overload. ![]()
FDA Approves Deferiprone for Transfusional Iron Overload
Deferiprone is approved as a second-line treatment for transfusional iron overload when the condition has not been resolved by chelation therapy in patients with thalassemia, the Food and Drug Administration announced Oct. 14.
The new agent will be marketed as Ferriprox by ApoPharma. The FDA said the Toronto-based company has agreed to several postmarketing requirements and commitments, including further study in patients who have transfusional iron overload after treatment for sickle cell disease.
The FDA’s Oncologic Drugs Advisory Committee recently voted 10-2 that treatment with deferiprone had a favorable benefit-risk profile for treatment of patients with transfusional iron overload when current chelation therapy is inadequate.
As the decision date approached, however, the consumer advocacy group Public Citizen announced that it had sent the FDA a letter opposing approval. Public Citizen contended that APO Pharma had failed to demonstrate the drug is safe and effective in its intended population. The group noted that the FDA had refused to approve deferiprone in 2009 without an additional prospective, randomized, controlled study, but that no such study had been conducted.
"Ferriprox represents the first new FDA-approved treatment for this disorder since 2005."
The FDA announcement said its decision on safety and effectiveness was based on 12 clinical studies in which participating patients had not responded to prior iron chelation therapy.
"Ferriprox was considered a successful treatment for patients who experienced at least a 20% decrease in serum ferritin, a protein that stores iron in the body for later use. Half of the patients in the study experienced at least a 20% decrease in ferritin levels," the agency said.
Thalassemia is a genetic blood disorder that causes anemia. It is treated with frequent blood transfusions, but these can lead to excess iron in the body, a serious, potentially fatal condition. Chelation therapy, a process in which chemical agents remove heavy metals from the body, is the standard of care for transfusional iron overload.
"Ferriprox represents the first new FDA-approved treatment for this disorder since 2005," Dr. Richard Pazdur, director of the Office of Hematology and Oncology Products in the FDA’s Center for Drug Evaluation and Research, said in the FDA announcement.
Deferoxamine (Desferal), an iron chelator administered via a subcutaneous infusion pump (usually 6 nights a week), was approved in 1968, and deferasirox (Exjade), an oral chelator, in 2005. The new agent was approved in Europe in 1999, but had not been able to secure a U.S. go-ahead until the current "accelerated approval."
Ferriprox’s most common side effects have included nausea, vomiting, abdominal and joint pain, chromaturia, neutropenia, and "an increase in the level of a liver enzyme that may be indicative of tissue or liver damage at unsafe amounts," according to the FDA.
The agency said the most serious side effect was the development of agranulocytosis in about 2% of patients treated with Ferriprox.
Reconceptualizing Family
Bob is in the kitchen, settling down his family to preparing a celebration dinner with produce from the communal garden. He is a tall, wiry man with a gray beard and kind gentle eyes. His current family includes his wife, who is a therapist in a nearby town; a tall, blonde Scandinavian man who is spending time "finding himself"; a young, eager couple who tend the garden and teach the intricacies of organic farming; and a reclusive artist who works with metals and found objects.
Bob bought the dilapidated commune buildings several years ago, after retiring from his fast-paced, stressful life as an internist in California. He has meticulously restored the adobe buildings using the expertise of traditional builders. There are different types of adobe throughout the compound, sparkling mica walls in the bedrooms, and deep, rich brown in the large circular communal living room. Bob conceptualizes this historic setting as a retreat for meditation and a place to teach organic farming to the next generation. As I observed during my visit a few months ago, Bob is the elder and wise man of this communal family who gently quiets the demons in the spider-phobic Scandinavian.
This is a "family" in the best sense: a group of people who share a spiritual belief in their connection to the land, the goodness of the human spirit, and the importance of connection between people. Like the hippies before them who established New Buffalo in Arroyo Hondo, N.M., the residents reject many Western values, at least for a few years, and try out this alternative way of living. The community’s website says it is no longer a commune but that members are "connected by a common sense of ideals and a strong sense of place."
Communes have always existed in the United States. Native Americans live communally but are not recognized as communes. The largest recognized U.S. communal living group is the Hutterite community. About 42,000 people live in rural Hutterite communities across the United States. They are derived from the Anabaptists, a Christian sect dating back to 16th century Austria, which also spawned Amish and Mennonite communities.
Whatever type of family our patients live in, be it a religious sect, a down-to-earth commune, or a traditional family, to run well, that family needs to be organized, to communicate well and to have good boundaries (Fam. Process 2003;42:1-18).
Why is this important to psychiatry? Good family functioning is associated with good outcomes for patients with all kinds of illnesses from medical to psychiatric (Families, Health, and Behavior: A Section of the Commissioned Report by the Committee on Health and Behavior, Institute of Medicine [Families, Systems & Health 2002;20:7-46]). In addition, "a growing body of research finds that healthy family processes ... matter more than family form for effective functioning...," writes Froma Walsh, Ph.D., (Normal Family Process [N.Y.: Guilford Press, 2003]). To cope well with illness, families need to be able to problem solve, communicate, and stay connected. However, good family functioning looks different in different cultures, from the highly organized rigid religious sects to the looser counterculture New Buffalo community. So how do we describe families and their functioning?
One easy approach is to look at the Global Assessment of Relational Functioning, or the GARF Scale, found in Appendix B of the DSM IV-TR (Washington: American Psychiatric Association, 2000). It has three subscales: problem solving, organization, and emotional climate. The choices for rating families range from 1-20 "Relational unit has become too dysfunctional to retain continuity of contact and attachment," to the 81-100 range in which the "relational unit is functioning satisfactorily from self-report of participants and from the perspective of observers." This scale is easy to learn and use. Also, the scale is independent of culture and can be used for any group of people who call themselves a family. So yes, after observing the New Buffalo community for a few days, I would rank it a solid 88.
Ambulatory Encounters for Hematology/Oncology Unchanged Since 2007
Hematologist/oncologists in group practice had a median of 2,719 ambulatory encounters in 2010, up just 0.3% since 2007, according to a survey by the Medical Group Management Association.
Hematologist/oncologists in hospital-owned practices averaged 2,362 ambulatory encounters in 2010, compared with 2,864 for those who were not in hospital-owned practices, the MGMA reported. Male hematologist/oncologists had a median of 2,864 ambulatory encounters, while the median for females was 2,240. Geographically speaking, those in the western United States had the highest number of ambulatory encounters, 3,027, while those in East, with 2,295 encounters, had the lowest.
The MGMA considered an ambulatory encounter to be "documented, face-to-face contact between a patient and a provider" that did not take place in an inpatient hospital and did not involve a surgical procedure.
The 2010 edition of the annual survey, conducted among MGMA members and nonmembers, includes data from 2,846 group practices representing 59,375 physician and nonphysician providers. The MGMA presents survey highlights in its In Practice blog.