User login
Rethinking Resident Supervision
Close supervision of residents potentially leads to fewer errors, lower patient mortality, and improved quality of care.19 An Institute of Medicine (IOM) report3 recommended improving supervision through more frequent consultations between residents and their supervisors. Although current Accreditation Council for Graduate Medical Education (ACGME) guidelines also recommend that attending physicians (attendings) supervise residents, detailed guidance about what constitutes adequate supervision and how it should be implemented is not well defined.10, 11 The ACGME stresses that supervision should promote resident autonomy in clinical care.10 However, when trainees act independently, it might lead to critical communication breakdowns and other patient safety concerns.5, 6, 1214 Although attendings can encourage (or discourage) residents from seeking advice,15, 16 residents also play important roles in asking for help (ie, initiating their own supervision).1719 Additional research is needed on how residents walk the fine line between exercising independence and seeking supervision.
Lack of resident supervision is especially problematic in high‐risk settings such as the medical intensive care unit (ICU), where medical errors are as frequent as 1.7 errors per patient per day,20, 21 and the adverse drug event rate is twice that of non‐ICU settings.22 Because medication errors are one of the most common errors residents make,23, 24 resident interactions with nursing and pharmacy staff may significantly influence medication safety in error‐prone ICUs.2529 Studies of traditional hierarchical supervision tend to overlook how interactions with other professionals influence resident training.12, 18, 30, 31
We define supervision as a process of providing trainees with monitoring, guidance, and feedback9(p828) as they care for patients.3 Whereas traditionally, supervisors are identified by their positions of formal authority in the medical chain of command; we conceptualize supervision as a process in which professionals engaged in supervisory activities need not have formal authority over their trainees.
To examine how residents seek supervision through both the traditional medical hierarchical chain of command (including attendings, fellows and senior residents) and interprofessional communication channels (including nursing and pharmacy staff), we conducted a qualitative study of residents working in ICUs in three tertiary care hospitals. Using semi‐structured interviews, we asked residents to describe how they experienced supervision as they provided medications to patients. Two broad research questions guided data analysis:
How do residents receive supervision from physicians in the traditional medical hierarchy?
How do residents receive supervision from other professionals (ie, nurses, staff pharmacists, and clinical pharmacists)?
METHODS
Study Design and Sample
We conducted a qualitative study using data from interviews with 17 residents working in the medical ICUs of three large tertiary care hospitals (henceforth referred to as South, West, and North hospitals). The interviews were conducted as part of a longitudinal research project that examined how hospitals learn from medication errors.32 The research project focused on hospitals where medication error prevention was salient because of a vulnerable patient population and/or extensive high‐hazard drug usage. For each ICU, the research design included interviews with 6 attendings, 6 fellows, and a purposeful random sample33 of 6 residents. The goal was to reduce bias from supervisors selecting study participants, and thus enhance the credibility of the small sample, rather than generalize from it.32 Surgical residents were excluded, because of the medication focus. The local Institutional Review Boards approved the research.
Drawing on preliminary analyses of research project data, we designed the current study to examine how residents experienced supervision.33 A qualitative research design was particularly appropriate, because this study is exploratory34 and examines the processes of how supervision is implemented.33 By gathering longitudinal data from 2001 to 2007 and from ICUs in different hospitals, we were able to search for persistent patterns (and systematic variations over time) in how residents experienced supervision that might not have been revealed by a cross‐sectional study in one hospital ICU.
Data Collection
The principal investigator ([PI] M.T.) interviewed residents to gather data about their experiences with medication safety and supervision when providing medication to ICU patients. A general interview guide33 addressed residents' personal experiences with ordering medications, receiving supervision, and their perceptions of institutional medication safety programs (see Supporting Table 1 in the online version of this article). The interviewer consistently prompted residents to provide examples of their supervision experiences. The PI conducted confidential interviews in a private location near the ICU. Using confidential open‐ended, in‐depth interviews33 enabled the participating residents to provide frank answers to potentially sensitive questions.
The current study focuses on interviews with 17 residents; 8 from South Hospital, 6 from West Hospital, and 3 from North Hospital ICUs. Residents were at different training stages (years 14), and none declined participation. Interviews were audio‐recorded, transcribed professionally, checked for accuracy of transcription, and de‐identified. On average, each interview lasted about an hour, resulted in a 30‐page transcript, and focused on how residents experienced supervision for over two‐thirds of the transcript. Interviewees frequently described specific examples in vivid detail, yielding rich information. These data are consistent with Patton's observation that the validity, meaningfulness, and insights generated from qualitative inquiry have more to do with the information richness of the cases selected than with sample size.33(p245) Field notes, document review, and observations of routine activities supplemented the interviews.
Data Analysis
We coded and analyzed interview transcripts by applying the constant comparative method, in which we systematically examined and refined variations in the concepts that emerged from the data.33 To focus on the residents' perceptions of their training experiences, we began the data analysis without preexisting codes. We refined and reconstructed the coding scheme in several iterative stages. Based on the initial review by two investigators (M.T., H.S.), the PI and the coding team (T.D.G., S.M.) developed a preliminary coding scheme by induction, considering the residents' description of their experiences in the context of organizational research.34 They applied the coding scheme to three interview transcripts, and reevaluated and revised it based on comments from other investigators (H.S., E.J.T.).
The PI and the coding team met regularly to review and refine the codes. The PI and the coding team finalized the coding scheme only after it was validated by two other investigators and reapplied to the first set of interview transcripts. Constructing a detailed coding guide, we defined specific codes and classified them under seven broad themes.
We engaged in an iterative coding process to ensure credibility33 and consistent data analysis.34 Both coding team members independently coded each interview and resolved differences through consensus. The PI reviewed each coded transcript and met with the team to resolve any remaining coding disagreements. We used ATLAS.ti 5.0 software (ATLAS.ti Scientific Software Development, Berlin, Germany) to manage data, assist in detecting patterns, and compile relevant quotations.
We observed patterns in the data; we inductively identified themes that emerged from the data as well as those related to organizational research. During the period that we conducted interviews, new rules limiting residents' working hours were implemented.10 We did not discern any pattern changes before and after the new rules. To enhance data analysis credibility,34 two investigators (H.S., E.J.T.), serving as peer debriefers,35 examined whether the themes accurately reflected the data and rigorously searched for counter‐examples that contradicted the proposed themes.
RESULTS
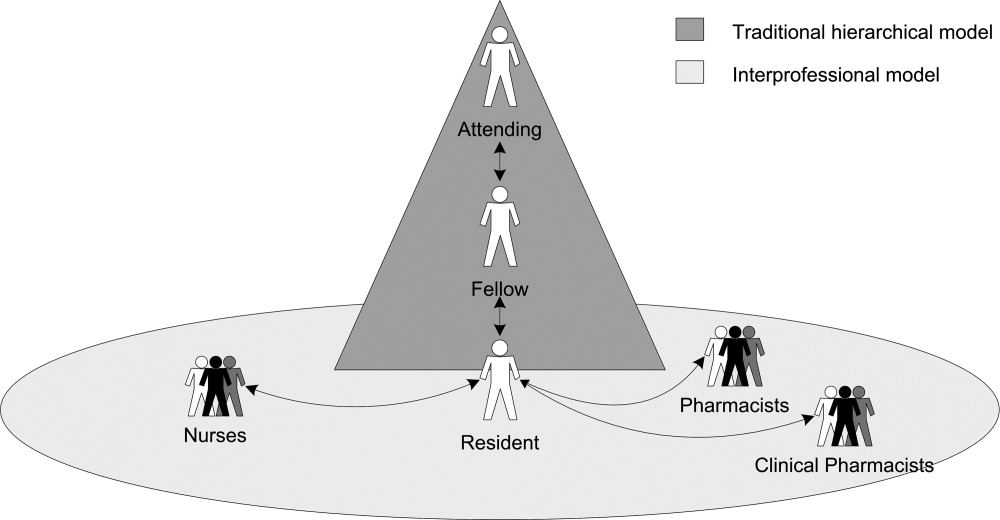
Residents described how they were supervised not only by other physicians within the traditional medical hierarchy, but also by other professionals, including nurses, staff pharmacists, and clinical pharmacists, ie, interprofessional supervision (Figure 1). After presenting these results, we examine how physicians and other professionals used communication strategies during interprofessional supervision. Here we use the term residents to include trainees at all levels, from interns to upper‐level residents, and male pronouns for de‐identification.
Initiating Supervision in the Traditional Medical Hierarchy
Residents described teaching rounds as the formal setting where the attending and other team members guided and gave feedback on their medication‐related decisions. After rounds, residents referred to the formal chain of command (from senior resident to fellow or attending) for their questions. However, residents also described enacting their own supervision by deciding when and how to ask for advice.
Residents developed different strategies for initiating supervision (Table 1). Some described a rule of thumb or personal decision‐making routine for determining when to approach a supervising physician with a question (eg, if the patient is in serious condition) (Table 1, columns 1 and 2). Others described how they decided when and how to ask an attending about their mistakes (Table 1, columns 3 and 4). As might be expected, residents' strategies usually reflected a desire for professional autonomy tempered with varying assessments of their own limitations (Table 1, columns 1 and 2, see Autonomy).
| Strategies for Asking Questions | Strategies for Seeking Feedback on Mistakes | ||
|---|---|---|---|
| When to Ask | When Not to Ask | When to Disclose a Mistake | How to Disclose a Mistake |
| Potential for adverse patient outcome: | Autonomy: | Potential for adverse patient outcome: | Direct: |
If you expect this is really bad, you try to cover yourselfand try to get the experience of somebody else, how to fix it .[And if it's less serious?] Yeah, then you can handle it. If I know it's a busy night, I let two or three admissions come in and then I call the fellow. But if the patient is really, really sick I call the fellow. | There's always a fellow to help us if we have questions. Being like almost a third year though, a lot of the things we kind of can handle on our own. Replacing the electrolytes and blood pressure medicines; we don't need hardly any oversight. | Well, I don't want to call a fellow. I think this medication, if it is wrong, is not going to kill a patient, is not going to adversely affect the outcome. | And I went straight up to the attending and I'll be like: Listen, this is what happened. Now I know. I know what happened, but how can I prevent this from happening again or what should I have done differently? |
| Medication choice: | Nights: | Medication choice and potential for adverse patient outcome: | Indirect: |
| If it's what type of medicine we give, then I usually contact my fellow. But most of the time I just make a decision on my own. | I never call Dr. [Attending] at night because you can get in touch with the fellow. The intern should talk to the attending, but the intern couldn't reach the attending. Sometimes it's like 2:00 or 3:00 in the morning. Then you can wait. If it's not an emergency, not in bad shape, you can wait. In the morning, when the attending physician is there, we'll talk about it. We can then ask. | If I know I have made a small mistake and I think it is inconsequential, I am not going to bother anybody. But if it is a different antibiotic that needed to be started, or what other medications might I have forgotten I would say [to the attending], I forgot to do this yesterday and I am sorry. | Instead of going up and saying, I made this mistake, you know, This is what I did and this is what happened, was it wrong? And I will let them tell me that this was a mistake, or not a mistake, and why. [If it's] really bad, you kind of talk with a fellow and say, This is what I've done. Is it okay? |
| Divergence from plan: | |||
If it's not something in the plan and we have to call someone, like an attending in a neurology service. Things that are discussed in advance, that may be potentially serious, I won't discuss, but basically anything that wasn't discussed in advance that I judge to be serious, then I will ask. | |||
We also identified patterns in how residents and their supervising physicians communicated when residents initiated supervision (Table 2, column 1). In general, residents considered attendings and fellows to be receptive to their questions. One resident explained: There is no one here who is unapproachableeven an attending. Nonetheless, residents reported using deferential language when initiating supervision (Table 2, column 1, row 2). Residents noted that attendings and fellows varied in their responses to questions and mistakes, as reflected in how they communicated with residents (Table 2, column 1, rows 1 and 3).
| Communication Strategies | Hierarchical Supervision: Resident Initiated Supervision | Interprofessional Supervision: Other Professional Initiated Supervision |
|---|---|---|
| ||
| Nonjudgmental language* | Fellow to resident: | Resident to nurse: |
| There's no dumb question. Ask. You can call me any time. | I'll say, It's not such a good idea for this reason. I feel they've [nurses] questioned you on it, so you deserve an appropriate answer. It's not okay to just be like, No, we're not gonna do that. | |
| Attending to resident: | ||
| Listen, [the mistake] could have happened to anybody . Now you know. Next time [you] do this, but [the patient is] gonna be okay. | ||
| Deferential language | Resident to difficult attending: | Pharmacist questions resident: |
| And when you call, you're polite and respectful: I'm sorry sir, I hate to bother you but I have a dumb question | The pharmacy called me up and said, Now listen, are you sure you want to give that dosage? | |
| Resident to fellow: | Nurse questions resident: | |
| Listen, in humbleness say, I don't know this, or am I doing this right? Can you help me out here? | [Nurses] might say like, Oh, you really? You sure you want to do this? | |
| Nurse guides resident: | ||
| Hey I know it's your decision, but this is what Dr. [Attending] would do. | ||
| Judgmental language | Attending response to a gross error: | Nurses questions resident: |
| What the hell were you thinking? We'll try to fix it, but God, what were you thinking? | At first [the nurses] were making fun of the resident who wrote [an unfamiliar medication order] . They just assume you're stupid until you prove them wrong, which is fine. But it gets annoying, too, because we did go to school for a long timewe actually know what the hell we're doing. | |
| Fellow response to resident question: | ||
| The cardiology fellow on call at 2 AM, when you call with a question will be like, Why would you even ask me that question? How could you not know that? | ||
Despite recognizing the importance of asking questions, several residents expressed conflicting beliefs; they raised concerns about the personal consequences of seeking assistance. For instance, one resident advocated: My point of view is I think it's wonderful when you ask questions. Cause that means you're conscientious enough to care about the patientsenough to do the right thing. However, we observed that when he interrupted the research interview to consult with a fellow, he prefaced his query with: Hey, I think this is a dumb question. Some residents expressed contradictory beliefs when they described their embarrassment over appearing stupid and fears of looking weak in front of supervising physicians, even those they perceived as being approachable. Indeed, for one resident, the attending's accessibility increased his anxiety: I don't want to lose respect by asking a stupid question.
Interprofessional Supervision
Residents described how other professionals used various methods of supervising their decision‐making (Table 3). Nurses and pharmacists intercepted medication orders and asked for clarifications, whereas clinical pharmacists also advised residents on ordering alternative medications (Table 3, row 1). Other professionals regularly double‐checked order implementation (Table 3, row 2). Nurses, in particular, routinely guided the future actions of residents by giving them cues and suggesting the next therapeutic tasks they should perform (Table 3, row 3). When assessing residents' clinical decisions, these professionals applied different guidelines (Table 4). Nurses compared residents' clinical decisions to their expectations for usual experience‐based practices (Table 4, column 1); pharmacists consulted and noticed deviations from national and hospital pharmacy standards (Table 4, column 2); and clinical pharmacists supplemented pharmacy standards with their professional judgment (Table 4, column 3).
| Provider Type | Example |
|---|---|
| Intercepting medication orders | |
| Nurses and pharmacists | Clarifying and correcting orders: |
The [pharmacist] said, How much do you really want to give? I was like, Okay. Let me take a look at it. And when I looked at it, I knew it wasn't calculated right. The nurse will call me and say, or the pharmacist will call me and say, Can you please change this? This is not the right dose. | |
| Clinical pharmacists | Suggesting alternative medications: |
| You know, this might be a better medication to use because the half life is | |
| Double‐checking order implementation | |
| Nurses | The nurses in [the unit] are wonderful about doing their own calculations, so if it's a rate, like if it's a drip, I've seen almost all the nurses go back over my drip and do the doses. |
| Clinical pharmacists | Cause even after rounds, he'll go back through and look at all, everything. And if he sees something that doesn't make sense or we could do different, he lets us know. |
| Guiding future actions | |
| Nurses | [The nurses] talk to you about everything. They see the labs before you. They see the labs in the morning and are like, His potassium is high, can you fix this? His blood pressure has been running up, do you want to give him something? They guide you towards making the right decision. |
| Clinical pharmacists | I wouldn't give these two [medications] together. There may be an interaction. |
| Nurses | Staff Pharmacists | Clinical Pharmacists |
|---|---|---|
| Experience on unit and with patients: | Standardized pharmacy guidelines for normal dosage ranges: | Standardized pharmacy guidelines for normal dosage ranges: |
| They're with the patients 12 hours a day. Some of them, they've been doing this for 30 years. | No, [the pharmacists] wouldn't have known on that one [error] because it was a normal it's within a normal range of dosing and it's not that it would cause any harm to the patient, but it was just that it needed to go to a higher dose. [I] did a very high dose, compared with the current dose. Then [the pharmacist] called me back and said, I think this is not the right dose. | [The clinical pharmacist is] the one who says, Oh, by the way, do you really want it IV or PO? Or It should be q 6 versus q 8. |
| Expectations for practice norms: | Patient‐specific dosage guidelines: | Clinical judgment based on specialized pharmacology expertise: |
| [The nurses] can pick up mistakes just as easily as anyone else because they are used to this environment and they are used to seeing all the orders that are written generally. | The [unit‐based] pharmacist came to me and said, This patient's almost in renal failure. Did you want to give them a smaller dose because of the renal failure? And I said, Oh, yeah. I didn't even think about that. | That's all [clinical pharmacists] know is medicine and research and studies, and so you know, there may be a paper that came out last week that none of us have even had a chance to read. But they would be up to date on it. So as far as all the drug trials and everything. |
| The usual practices in the unit: | ||
| An experienced nurse came to me and told me that in the unit, doctor, we used to do it 1 gram, not 0.5 gram. | ||
| The attending's preferences: | ||
| I know sometimes you'll want to start a certain pressor and the nurse will be like Well, Dr. [Attending] likes to use this pressor instead. | ||
| Formal standards: | ||
| A nurse would say, especially in the medications I wrote out to be canceled because of the antibiotic policy here . Doctor, the patient doesn't have any more doses of [antibiotic], what do you want me to start, or do you need to call the [antibiotic policy] team? |
Initiating Interprofessional Supervision
Residents, in turn, sought advice from other professionals. They actively engaged pharmacists in their supervision by asking questions ranging from basic clarifications to complex technical queries. You can just take [the clinical pharmacist] to the side and say, Hey listen. I forgot this medication. What am I supposed to give? It starts with an L, explained a resident. Other residents consulted clinical pharmacists for specialized expertise: The [clinical pharmacists] usually have a protocol that they like to follow that a lot of the residents and probably even a lot of the attendings aren't aware of. In one hospital, residents depended on the clinical pharmacists: They're always available and they really help out the team. In another hospital, unit‐based (on‐site) pharmacists served as an informal but extremely useful resource. Residents also relied on central pharmacy‐based staff, who provided essential backup, especially after‐hours: [The pharmacy is] always available, like if you have a questionthere's a medicine you've never given, but it's the middle of the night, nobody else around, you want to call the pharmacist. Residents uniformly noted that nurses monitored their decisions (Table 2, column 2; Table 4, column 1), and one specifically mentioned soliciting advice from nurses on organizing intravenous lines.
Communication Strategies for Managing Differences in Status and Expertise
Unlike the medical hierarchy that clearly differentiates among residents, fellows, and attendings, interdisciplinary differences were less clearly delineated. Residents were perceived as having higher status than other professionals, due in part to their medical education and responsibility for signing orders. Nurses and pharmacists, however, often had extensive experience and/or specialized training, and thus more expertise than residents. For instance, residents noticed their ambiguous status compared to nurses:
I don't know if some people might psychologically think it was better or worse, worse because it was coming from a nurse and maybe somebody would think that they wouldn't know as much or something like that. But other people would think of it as, they're a team member and they have the perfect right to know more. And maybe it's better because that way like maybe the fellow or attending wouldn't find out that you made a mistake [emphasis added].
To manage the ambiguous differences in their status, experience, and expertise, residents and other professionals used various communication strategies (Table 2, column 2). Residents consistently recounted that pharmacists and nurses used deferential language, for example, by asking questions, rather than directly stating their concerns (Table 2, column 2, row 2). One resident appreciated the unit‐nurses' indirect language: Over here they're really cool about it. They'll say, Is this right, are you sure about this? However, some residents also recalled that nurses used more direct language, such as I am not comfortable, especially when giving residents feedback on IV drug administration. In contrast, when asking pharmacists questions, residents consistently reported using nonjudgmental language, but not deferential language. However, some residents used judgmental language when they disagreed with a pharmacist's intervention.
Individual residents bitterly recalled their encounters with other professionals during previous rotations. One described nurses who were resident‐unfriendly and used judgmental language to mock a resident's choice of medications (Table 2, column 2, row 3). Another worked with clinical pharmacists who feel like they are teaching the residents and they are above the residents. These interactions illustrate how communication choices can create interprofessional tensions, especially when differences in status and expertise conflict or are unclear.
DISCUSSION
We analyzed interviews of residents working in medical ICUs to understand their supervision experiences related to medication safety. Although residents espoused beliefs in seeking assistance from supervising physicians and articulated strategies for doing so, many experienced difficulties in initiating supervision through the traditional medical hierarchy. Some residents were embarrassed by their mistaken decisions; others were concerned that their questions would reflect poorly on them.
Residents also received interprofessional supervision from nurses and pharmacists, who proactively monitored, intervened in, and guided residents' decisions. Other professionals evaluated residents' decisions by comparing them to distinctive professional guidelines and routinely used deferential language when conveying their concerns. Residents, in turn, asked other professionals for assistance.
We posit that interprofessional supervision clearly meets an accepted definition of supervision.3, 9 Residents received monitoring, guidance and feedback9(p828) from other professionals, who engaged in routine monitoring and in situation‐specific double‐checks of residents' clinical decisions, similar to those performed by supervising physicians.30 Moreover, other professionals demonstrated the ability to anticipate a doctor's strengths and weaknesses in particular clinical situations in order to maximize patient safety.9(p829)
Our study results have implications for graduate medical education (GME) reform. First, trainees experienced supervision as a two‐way interaction.36 Residents balanced the countervailing pressures to act independently or to seek a supervising physician's advice, in part, by developing strategies for deciding when to ask questions. Kennedy et al. identified similar rhetorical strategies.18 By asking questions about their clinical decisions, residents requested that supervising physicians guide their work; thus, they proactively initiated and thereby enacted their own supervision. Fostering the conditions for initiating supervision is essential, especially given the association between lack of effective supervision and adverse outcomes.5, 6, 1214
Second, residents expressed contradictory expectations about seeking advice from supervising physicians. Some residents were wary of approaching attending physicians for fear of appearing incompetent or being ridiculed.12, 16, 18, 31 However, we found that other residents remained reluctant to seek advice despite simultaneously appreciating that attendings encouraged them to ask for assistance. Whereas the perceived approachability of supervising physicians was important,18, 19 our exploratory findings suggest that it may be a necessary, but not a sufficient, condition for creating a learning environment. Creating a supportive learning environmentin which residents feel comfortable in revealing their perceived shortcomings to supervising physicians3begins with cultural changes, such as building medical teams,6 but such changes can be slow to develop.
Third, interprofessional supervision offers a strategy for improving supervision. The ubiquitous involvement of nursing and pharmacy staff in monitoring and intervening in residents' medication‐related decisions could result in overlooking their unique contributions to resident supervision. Mindful that supervising physicians evaluate them, residents selectively sought nonjudgmental advice from professionals outside the medical hierarchy. Therefore, improving supervision could entail offering residents ready access to other professionals who can advise them, especially during late night hours when supervising physicians might not be present.17, 27
The importance of interprofessional supervision has not been adequately recognized and emphasized in GME. Our study findings, if supported by future research, highlight how interpersonal communication techniques could influence both interprofessional supervision and hierarchical supervision among physicians. Medical team training programs3739 emphasize developing skills, such as mutual performance monitoring,40(p13) by training providers to raise and respond to potentially sensitive questions. Improving supervision by enhancing interpersonal communication skills may be important, not only when relative status differences are clear (ie, physician hierarchy), but also when status differences are ambiguous (ie, residents and other professionals). GME programs could consider incorporating these techniques into their formal curricula, as could programs for nursing and pharmacy staff.
Our study has several limitations. Because of the larger research project objectives, we focused on medication safety in medical ICU settings, where nurses and pharmacists may be especially vigilant and proactive in monitoring residents. Thus, our findings may be specific to medication issues and less relevant outside ICUs. We had a relatively small sample size and do not claim to generalize from it, although we believe it offers meaningful insights. We also did not continue enlarging our sample until reaching redundancy.35(p202) Nevertheless, the purposeful random sample of residents produced rich information. Indeed, some study results are consistent with previous resident education research,18 adding validity to our findings. Although the interview protocol was not designed specifically to investigate supervision, the resulting interviews yielded abundant data containing residents' detailed descriptions of how they experienced supervision. Whereas we were careful to note whether particular perceptions were unique to one resident, or shared by others, we recognize that the value of residents' observations is assessed by the quality of the insights they provide, not necessarily by the number of residents who described the same experience.
In conclusion, we found that residents experienced difficulties in initiating traditional hierarchical supervision related to medication safety in the ICU. However, they reported ubiquitous interprofessional supervision, albeit limited in scope, which they relied upon for nonjudgmental guidance in their therapeutic decision‐making, especially after‐hours. In our study, interprofessional supervision proved crucial to improving medication safety in the ICU.
- ,,.Resident supervision in the operating room: Does this impact on outcome?J Trauma.1993;35:556–560.
- ,.Supervision in the outpatient clinic: Effects on teaching and patient care.J Gen Intern Med.1993;8:378–380.
- Institute of Medicine (IOM).Resident Duty Hours: Enhancing Sleep, Supervision, and Safety.Washington, DC:National Academic Press;2008.
- Joint Committee of the Group on Resident Affairs and Organization of Resident Representatives. Patient Safety and Graduate Medical Education. Washington, DC: Association of American Medical Colleges; 2003. Available at: https://services.aamc.org/publications/showfile.cfm?file=version13.pdf145:592–598.
- ,,,.Medical errors involving trainees: A study of closed malpractice claims from 5 insurers.Arch Intern Med.2007;167:2030–2036.
- .Resident duty hour reform and mortality in hospitalized patients.JAMA.2007;298:2865–2866.
- ,,,.Progressive independence in clinical training: A tradition worth defending?Acad Med.2005;80:S106–S111.
- ,.Effective supervision in clinical practice settings: A literature review.Med Educ.2000;34:827–840.
- Accreditation Council for Graduate Medical Education. ACGME Residency Review Committee Program Requirements in Critical Care Medicine. 2007. Available at: http://www.acgme.org/acWebsite/downloads/RRC_progReq/142pr707_ims.pdf Accessed August 14, 2009.
- ,.Resident supervision.Accreditation Council for Graduate Medical Education Bulletin.2005; September:15–17. Available at: http://www.acgme.org/acWebsite/bulletin/bulletin09_05. pdf. Accessed March 14,year="2009"2009.
- ,,,,.Resident uncertainty in clinical decision making and impact on patient care: A qualitative study.Qual Saf Health Care.2008;17:122–126.
- ,,, et al.Patterns of communication breakdowns resulting in injury to surgical patients.J Am Coll Surg.2007;204:533–540.
- ,,.Communication failures: An insidious contributor to medical mishaps.Acad Med.2004;79:186–194.
- ,,, et al.Attending doctors' perspectives on how residents learn.Med Educ.2007;41:1050–1058.
- ,,.Teaching but not learning: How medical residency programs handle errors.J Organiz Behav.2006;27:869–896.
- ,,,,.On‐call supervision and resident autonomy: From micromanager to absentee attending.Am J Med.2009;122:784–788.
- ,,,.Preserving professional credibility: Grounded theory study of medical trainees' requests for clinical support.BMJ.2009;338:b128.
- ,,,,,.Who wants feedback? An investigation of the variables influencing residents' feedback‐seeking behavior in relation to night shifts.Acad Med.2009;84:910–917.
- ,,, et al.A look into the nature and causes of human errors in the intensive care unit.Crit Care Med.1995;23:294–300.
- ,,, et al.The Critical Care Safety Study: The incidence and nature of adverse events and serious medical errors in intensive care.Crit Care Med.2005;33:1694–1700.
- ,,,,,.Preventable adverse drug events in hospitalized patients: A comparative study of intensive care and general care units.Crit Care Med.1997;25:1289–1297.
- ,,,,,.Residents report on adverse events and their causes.Arch Intern Med.2005;165:2607–2613.
- ,,, et al.Effect of reducing interns' work hours on serious medical errors in intensive care units.N Engl J Med.2004;351:1838–1848.
- ,,,,.Unit‐based clinical pharmacists' prevention of serious medication errors in pediatric inpatients.Am J Health Syst Pharm.2008;65:1254–1260.
- ,,,,.Improving medication safety in the ICU: The pharmacist's role.Hospital Pharmacy.2007;42:337–344.
- ,,,,,.Collaboration between pharmacists, physicians and nurse practitioners: A qualitative investigation of working relationships in the inpatient medical setting.J Interprof Care.2009;23:169–184.
- ,,,.Role of registered nurses in error prevention, discovery and correction.Qual Saf Health Care.2008;17:117–121.
- ,,, et al.Recovery from medical errors: The critical care nursing safety net.Jt Comm J Qual Patient Saf.2006;32:63–72.
- ,,,,.Clinical oversight: Conceptualizing the relationship between supervision and safety.J Gen Intern Med.2007;22:1080–1085.
- .To call or not to call: A judgment of risk by pre‐registration house officers.Med Educ.2008;42:938–944.
- ,.Classifying and interpreting threats to patient safety in hospitals: Insights from aviation.J Organiz Behav.2006;27:919–940.
- .Qualitative Research and Evaluation Methods.3rd ed.Thousand Oaks, CA:Sage Publications;2002.
- ,.Qualitative Data Analysis.2nd. ed.Thousand Oaks, CA:Sage Publications;2006.
- ,.Naturalistic Inquiry.Beverly Hills, CA:Sage Publications;1985.
- ,,.Supervision: A 2‐way street.Arch Intern Med.2008;168:1117.
- ,,, et al.Effects of teamwork training on adverse outcomes and process of care in labor and delivery: A randomized controlled trial.Obstet Gynecol.2007;109:48–55.
- ,,,.Does crew resource management training work? An update, an extension, and some critical needs.Hum Factors.2006;48:392–412.
- ,,,,,.Team training in the neonatal resuscitation program for interns: Teamwork and quality of resuscitations.Pediatrics.2010;125:539–546.
- ,,,,.Medical Teamwork and Patient Safety: The Evidence‐Based Relation.Rockville, MD:Agency for Healthcare Research and Quality 2005. Publication No. 05–0053. Available at: http://www.ahrq.gov/qual/medteam. Accessed October 15,2010.
Close supervision of residents potentially leads to fewer errors, lower patient mortality, and improved quality of care.19 An Institute of Medicine (IOM) report3 recommended improving supervision through more frequent consultations between residents and their supervisors. Although current Accreditation Council for Graduate Medical Education (ACGME) guidelines also recommend that attending physicians (attendings) supervise residents, detailed guidance about what constitutes adequate supervision and how it should be implemented is not well defined.10, 11 The ACGME stresses that supervision should promote resident autonomy in clinical care.10 However, when trainees act independently, it might lead to critical communication breakdowns and other patient safety concerns.5, 6, 1214 Although attendings can encourage (or discourage) residents from seeking advice,15, 16 residents also play important roles in asking for help (ie, initiating their own supervision).1719 Additional research is needed on how residents walk the fine line between exercising independence and seeking supervision.
Lack of resident supervision is especially problematic in high‐risk settings such as the medical intensive care unit (ICU), where medical errors are as frequent as 1.7 errors per patient per day,20, 21 and the adverse drug event rate is twice that of non‐ICU settings.22 Because medication errors are one of the most common errors residents make,23, 24 resident interactions with nursing and pharmacy staff may significantly influence medication safety in error‐prone ICUs.2529 Studies of traditional hierarchical supervision tend to overlook how interactions with other professionals influence resident training.12, 18, 30, 31
We define supervision as a process of providing trainees with monitoring, guidance, and feedback9(p828) as they care for patients.3 Whereas traditionally, supervisors are identified by their positions of formal authority in the medical chain of command; we conceptualize supervision as a process in which professionals engaged in supervisory activities need not have formal authority over their trainees.
To examine how residents seek supervision through both the traditional medical hierarchical chain of command (including attendings, fellows and senior residents) and interprofessional communication channels (including nursing and pharmacy staff), we conducted a qualitative study of residents working in ICUs in three tertiary care hospitals. Using semi‐structured interviews, we asked residents to describe how they experienced supervision as they provided medications to patients. Two broad research questions guided data analysis:
How do residents receive supervision from physicians in the traditional medical hierarchy?
How do residents receive supervision from other professionals (ie, nurses, staff pharmacists, and clinical pharmacists)?
METHODS
Study Design and Sample
We conducted a qualitative study using data from interviews with 17 residents working in the medical ICUs of three large tertiary care hospitals (henceforth referred to as South, West, and North hospitals). The interviews were conducted as part of a longitudinal research project that examined how hospitals learn from medication errors.32 The research project focused on hospitals where medication error prevention was salient because of a vulnerable patient population and/or extensive high‐hazard drug usage. For each ICU, the research design included interviews with 6 attendings, 6 fellows, and a purposeful random sample33 of 6 residents. The goal was to reduce bias from supervisors selecting study participants, and thus enhance the credibility of the small sample, rather than generalize from it.32 Surgical residents were excluded, because of the medication focus. The local Institutional Review Boards approved the research.
Drawing on preliminary analyses of research project data, we designed the current study to examine how residents experienced supervision.33 A qualitative research design was particularly appropriate, because this study is exploratory34 and examines the processes of how supervision is implemented.33 By gathering longitudinal data from 2001 to 2007 and from ICUs in different hospitals, we were able to search for persistent patterns (and systematic variations over time) in how residents experienced supervision that might not have been revealed by a cross‐sectional study in one hospital ICU.
Data Collection
The principal investigator ([PI] M.T.) interviewed residents to gather data about their experiences with medication safety and supervision when providing medication to ICU patients. A general interview guide33 addressed residents' personal experiences with ordering medications, receiving supervision, and their perceptions of institutional medication safety programs (see Supporting Table 1 in the online version of this article). The interviewer consistently prompted residents to provide examples of their supervision experiences. The PI conducted confidential interviews in a private location near the ICU. Using confidential open‐ended, in‐depth interviews33 enabled the participating residents to provide frank answers to potentially sensitive questions.
The current study focuses on interviews with 17 residents; 8 from South Hospital, 6 from West Hospital, and 3 from North Hospital ICUs. Residents were at different training stages (years 14), and none declined participation. Interviews were audio‐recorded, transcribed professionally, checked for accuracy of transcription, and de‐identified. On average, each interview lasted about an hour, resulted in a 30‐page transcript, and focused on how residents experienced supervision for over two‐thirds of the transcript. Interviewees frequently described specific examples in vivid detail, yielding rich information. These data are consistent with Patton's observation that the validity, meaningfulness, and insights generated from qualitative inquiry have more to do with the information richness of the cases selected than with sample size.33(p245) Field notes, document review, and observations of routine activities supplemented the interviews.
Data Analysis
We coded and analyzed interview transcripts by applying the constant comparative method, in which we systematically examined and refined variations in the concepts that emerged from the data.33 To focus on the residents' perceptions of their training experiences, we began the data analysis without preexisting codes. We refined and reconstructed the coding scheme in several iterative stages. Based on the initial review by two investigators (M.T., H.S.), the PI and the coding team (T.D.G., S.M.) developed a preliminary coding scheme by induction, considering the residents' description of their experiences in the context of organizational research.34 They applied the coding scheme to three interview transcripts, and reevaluated and revised it based on comments from other investigators (H.S., E.J.T.).
The PI and the coding team met regularly to review and refine the codes. The PI and the coding team finalized the coding scheme only after it was validated by two other investigators and reapplied to the first set of interview transcripts. Constructing a detailed coding guide, we defined specific codes and classified them under seven broad themes.
We engaged in an iterative coding process to ensure credibility33 and consistent data analysis.34 Both coding team members independently coded each interview and resolved differences through consensus. The PI reviewed each coded transcript and met with the team to resolve any remaining coding disagreements. We used ATLAS.ti 5.0 software (ATLAS.ti Scientific Software Development, Berlin, Germany) to manage data, assist in detecting patterns, and compile relevant quotations.
We observed patterns in the data; we inductively identified themes that emerged from the data as well as those related to organizational research. During the period that we conducted interviews, new rules limiting residents' working hours were implemented.10 We did not discern any pattern changes before and after the new rules. To enhance data analysis credibility,34 two investigators (H.S., E.J.T.), serving as peer debriefers,35 examined whether the themes accurately reflected the data and rigorously searched for counter‐examples that contradicted the proposed themes.
RESULTS
Residents described how they were supervised not only by other physicians within the traditional medical hierarchy, but also by other professionals, including nurses, staff pharmacists, and clinical pharmacists, ie, interprofessional supervision (Figure 1). After presenting these results, we examine how physicians and other professionals used communication strategies during interprofessional supervision. Here we use the term residents to include trainees at all levels, from interns to upper‐level residents, and male pronouns for de‐identification.
Initiating Supervision in the Traditional Medical Hierarchy
Residents described teaching rounds as the formal setting where the attending and other team members guided and gave feedback on their medication‐related decisions. After rounds, residents referred to the formal chain of command (from senior resident to fellow or attending) for their questions. However, residents also described enacting their own supervision by deciding when and how to ask for advice.
Residents developed different strategies for initiating supervision (Table 1). Some described a rule of thumb or personal decision‐making routine for determining when to approach a supervising physician with a question (eg, if the patient is in serious condition) (Table 1, columns 1 and 2). Others described how they decided when and how to ask an attending about their mistakes (Table 1, columns 3 and 4). As might be expected, residents' strategies usually reflected a desire for professional autonomy tempered with varying assessments of their own limitations (Table 1, columns 1 and 2, see Autonomy).
| Strategies for Asking Questions | Strategies for Seeking Feedback on Mistakes | ||
|---|---|---|---|
| When to Ask | When Not to Ask | When to Disclose a Mistake | How to Disclose a Mistake |
| Potential for adverse patient outcome: | Autonomy: | Potential for adverse patient outcome: | Direct: |
If you expect this is really bad, you try to cover yourselfand try to get the experience of somebody else, how to fix it .[And if it's less serious?] Yeah, then you can handle it. If I know it's a busy night, I let two or three admissions come in and then I call the fellow. But if the patient is really, really sick I call the fellow. | There's always a fellow to help us if we have questions. Being like almost a third year though, a lot of the things we kind of can handle on our own. Replacing the electrolytes and blood pressure medicines; we don't need hardly any oversight. | Well, I don't want to call a fellow. I think this medication, if it is wrong, is not going to kill a patient, is not going to adversely affect the outcome. | And I went straight up to the attending and I'll be like: Listen, this is what happened. Now I know. I know what happened, but how can I prevent this from happening again or what should I have done differently? |
| Medication choice: | Nights: | Medication choice and potential for adverse patient outcome: | Indirect: |
| If it's what type of medicine we give, then I usually contact my fellow. But most of the time I just make a decision on my own. | I never call Dr. [Attending] at night because you can get in touch with the fellow. The intern should talk to the attending, but the intern couldn't reach the attending. Sometimes it's like 2:00 or 3:00 in the morning. Then you can wait. If it's not an emergency, not in bad shape, you can wait. In the morning, when the attending physician is there, we'll talk about it. We can then ask. | If I know I have made a small mistake and I think it is inconsequential, I am not going to bother anybody. But if it is a different antibiotic that needed to be started, or what other medications might I have forgotten I would say [to the attending], I forgot to do this yesterday and I am sorry. | Instead of going up and saying, I made this mistake, you know, This is what I did and this is what happened, was it wrong? And I will let them tell me that this was a mistake, or not a mistake, and why. [If it's] really bad, you kind of talk with a fellow and say, This is what I've done. Is it okay? |
| Divergence from plan: | |||
If it's not something in the plan and we have to call someone, like an attending in a neurology service. Things that are discussed in advance, that may be potentially serious, I won't discuss, but basically anything that wasn't discussed in advance that I judge to be serious, then I will ask. | |||
We also identified patterns in how residents and their supervising physicians communicated when residents initiated supervision (Table 2, column 1). In general, residents considered attendings and fellows to be receptive to their questions. One resident explained: There is no one here who is unapproachableeven an attending. Nonetheless, residents reported using deferential language when initiating supervision (Table 2, column 1, row 2). Residents noted that attendings and fellows varied in their responses to questions and mistakes, as reflected in how they communicated with residents (Table 2, column 1, rows 1 and 3).
| Communication Strategies | Hierarchical Supervision: Resident Initiated Supervision | Interprofessional Supervision: Other Professional Initiated Supervision |
|---|---|---|
| ||
| Nonjudgmental language* | Fellow to resident: | Resident to nurse: |
| There's no dumb question. Ask. You can call me any time. | I'll say, It's not such a good idea for this reason. I feel they've [nurses] questioned you on it, so you deserve an appropriate answer. It's not okay to just be like, No, we're not gonna do that. | |
| Attending to resident: | ||
| Listen, [the mistake] could have happened to anybody . Now you know. Next time [you] do this, but [the patient is] gonna be okay. | ||
| Deferential language | Resident to difficult attending: | Pharmacist questions resident: |
| And when you call, you're polite and respectful: I'm sorry sir, I hate to bother you but I have a dumb question | The pharmacy called me up and said, Now listen, are you sure you want to give that dosage? | |
| Resident to fellow: | Nurse questions resident: | |
| Listen, in humbleness say, I don't know this, or am I doing this right? Can you help me out here? | [Nurses] might say like, Oh, you really? You sure you want to do this? | |
| Nurse guides resident: | ||
| Hey I know it's your decision, but this is what Dr. [Attending] would do. | ||
| Judgmental language | Attending response to a gross error: | Nurses questions resident: |
| What the hell were you thinking? We'll try to fix it, but God, what were you thinking? | At first [the nurses] were making fun of the resident who wrote [an unfamiliar medication order] . They just assume you're stupid until you prove them wrong, which is fine. But it gets annoying, too, because we did go to school for a long timewe actually know what the hell we're doing. | |
| Fellow response to resident question: | ||
| The cardiology fellow on call at 2 AM, when you call with a question will be like, Why would you even ask me that question? How could you not know that? | ||
Despite recognizing the importance of asking questions, several residents expressed conflicting beliefs; they raised concerns about the personal consequences of seeking assistance. For instance, one resident advocated: My point of view is I think it's wonderful when you ask questions. Cause that means you're conscientious enough to care about the patientsenough to do the right thing. However, we observed that when he interrupted the research interview to consult with a fellow, he prefaced his query with: Hey, I think this is a dumb question. Some residents expressed contradictory beliefs when they described their embarrassment over appearing stupid and fears of looking weak in front of supervising physicians, even those they perceived as being approachable. Indeed, for one resident, the attending's accessibility increased his anxiety: I don't want to lose respect by asking a stupid question.
Interprofessional Supervision
Residents described how other professionals used various methods of supervising their decision‐making (Table 3). Nurses and pharmacists intercepted medication orders and asked for clarifications, whereas clinical pharmacists also advised residents on ordering alternative medications (Table 3, row 1). Other professionals regularly double‐checked order implementation (Table 3, row 2). Nurses, in particular, routinely guided the future actions of residents by giving them cues and suggesting the next therapeutic tasks they should perform (Table 3, row 3). When assessing residents' clinical decisions, these professionals applied different guidelines (Table 4). Nurses compared residents' clinical decisions to their expectations for usual experience‐based practices (Table 4, column 1); pharmacists consulted and noticed deviations from national and hospital pharmacy standards (Table 4, column 2); and clinical pharmacists supplemented pharmacy standards with their professional judgment (Table 4, column 3).
| Provider Type | Example |
|---|---|
| Intercepting medication orders | |
| Nurses and pharmacists | Clarifying and correcting orders: |
The [pharmacist] said, How much do you really want to give? I was like, Okay. Let me take a look at it. And when I looked at it, I knew it wasn't calculated right. The nurse will call me and say, or the pharmacist will call me and say, Can you please change this? This is not the right dose. | |
| Clinical pharmacists | Suggesting alternative medications: |
| You know, this might be a better medication to use because the half life is | |
| Double‐checking order implementation | |
| Nurses | The nurses in [the unit] are wonderful about doing their own calculations, so if it's a rate, like if it's a drip, I've seen almost all the nurses go back over my drip and do the doses. |
| Clinical pharmacists | Cause even after rounds, he'll go back through and look at all, everything. And if he sees something that doesn't make sense or we could do different, he lets us know. |
| Guiding future actions | |
| Nurses | [The nurses] talk to you about everything. They see the labs before you. They see the labs in the morning and are like, His potassium is high, can you fix this? His blood pressure has been running up, do you want to give him something? They guide you towards making the right decision. |
| Clinical pharmacists | I wouldn't give these two [medications] together. There may be an interaction. |
| Nurses | Staff Pharmacists | Clinical Pharmacists |
|---|---|---|
| Experience on unit and with patients: | Standardized pharmacy guidelines for normal dosage ranges: | Standardized pharmacy guidelines for normal dosage ranges: |
| They're with the patients 12 hours a day. Some of them, they've been doing this for 30 years. | No, [the pharmacists] wouldn't have known on that one [error] because it was a normal it's within a normal range of dosing and it's not that it would cause any harm to the patient, but it was just that it needed to go to a higher dose. [I] did a very high dose, compared with the current dose. Then [the pharmacist] called me back and said, I think this is not the right dose. | [The clinical pharmacist is] the one who says, Oh, by the way, do you really want it IV or PO? Or It should be q 6 versus q 8. |
| Expectations for practice norms: | Patient‐specific dosage guidelines: | Clinical judgment based on specialized pharmacology expertise: |
| [The nurses] can pick up mistakes just as easily as anyone else because they are used to this environment and they are used to seeing all the orders that are written generally. | The [unit‐based] pharmacist came to me and said, This patient's almost in renal failure. Did you want to give them a smaller dose because of the renal failure? And I said, Oh, yeah. I didn't even think about that. | That's all [clinical pharmacists] know is medicine and research and studies, and so you know, there may be a paper that came out last week that none of us have even had a chance to read. But they would be up to date on it. So as far as all the drug trials and everything. |
| The usual practices in the unit: | ||
| An experienced nurse came to me and told me that in the unit, doctor, we used to do it 1 gram, not 0.5 gram. | ||
| The attending's preferences: | ||
| I know sometimes you'll want to start a certain pressor and the nurse will be like Well, Dr. [Attending] likes to use this pressor instead. | ||
| Formal standards: | ||
| A nurse would say, especially in the medications I wrote out to be canceled because of the antibiotic policy here . Doctor, the patient doesn't have any more doses of [antibiotic], what do you want me to start, or do you need to call the [antibiotic policy] team? |
Initiating Interprofessional Supervision
Residents, in turn, sought advice from other professionals. They actively engaged pharmacists in their supervision by asking questions ranging from basic clarifications to complex technical queries. You can just take [the clinical pharmacist] to the side and say, Hey listen. I forgot this medication. What am I supposed to give? It starts with an L, explained a resident. Other residents consulted clinical pharmacists for specialized expertise: The [clinical pharmacists] usually have a protocol that they like to follow that a lot of the residents and probably even a lot of the attendings aren't aware of. In one hospital, residents depended on the clinical pharmacists: They're always available and they really help out the team. In another hospital, unit‐based (on‐site) pharmacists served as an informal but extremely useful resource. Residents also relied on central pharmacy‐based staff, who provided essential backup, especially after‐hours: [The pharmacy is] always available, like if you have a questionthere's a medicine you've never given, but it's the middle of the night, nobody else around, you want to call the pharmacist. Residents uniformly noted that nurses monitored their decisions (Table 2, column 2; Table 4, column 1), and one specifically mentioned soliciting advice from nurses on organizing intravenous lines.
Communication Strategies for Managing Differences in Status and Expertise
Unlike the medical hierarchy that clearly differentiates among residents, fellows, and attendings, interdisciplinary differences were less clearly delineated. Residents were perceived as having higher status than other professionals, due in part to their medical education and responsibility for signing orders. Nurses and pharmacists, however, often had extensive experience and/or specialized training, and thus more expertise than residents. For instance, residents noticed their ambiguous status compared to nurses:
I don't know if some people might psychologically think it was better or worse, worse because it was coming from a nurse and maybe somebody would think that they wouldn't know as much or something like that. But other people would think of it as, they're a team member and they have the perfect right to know more. And maybe it's better because that way like maybe the fellow or attending wouldn't find out that you made a mistake [emphasis added].
To manage the ambiguous differences in their status, experience, and expertise, residents and other professionals used various communication strategies (Table 2, column 2). Residents consistently recounted that pharmacists and nurses used deferential language, for example, by asking questions, rather than directly stating their concerns (Table 2, column 2, row 2). One resident appreciated the unit‐nurses' indirect language: Over here they're really cool about it. They'll say, Is this right, are you sure about this? However, some residents also recalled that nurses used more direct language, such as I am not comfortable, especially when giving residents feedback on IV drug administration. In contrast, when asking pharmacists questions, residents consistently reported using nonjudgmental language, but not deferential language. However, some residents used judgmental language when they disagreed with a pharmacist's intervention.
Individual residents bitterly recalled their encounters with other professionals during previous rotations. One described nurses who were resident‐unfriendly and used judgmental language to mock a resident's choice of medications (Table 2, column 2, row 3). Another worked with clinical pharmacists who feel like they are teaching the residents and they are above the residents. These interactions illustrate how communication choices can create interprofessional tensions, especially when differences in status and expertise conflict or are unclear.
DISCUSSION
We analyzed interviews of residents working in medical ICUs to understand their supervision experiences related to medication safety. Although residents espoused beliefs in seeking assistance from supervising physicians and articulated strategies for doing so, many experienced difficulties in initiating supervision through the traditional medical hierarchy. Some residents were embarrassed by their mistaken decisions; others were concerned that their questions would reflect poorly on them.
Residents also received interprofessional supervision from nurses and pharmacists, who proactively monitored, intervened in, and guided residents' decisions. Other professionals evaluated residents' decisions by comparing them to distinctive professional guidelines and routinely used deferential language when conveying their concerns. Residents, in turn, asked other professionals for assistance.
We posit that interprofessional supervision clearly meets an accepted definition of supervision.3, 9 Residents received monitoring, guidance and feedback9(p828) from other professionals, who engaged in routine monitoring and in situation‐specific double‐checks of residents' clinical decisions, similar to those performed by supervising physicians.30 Moreover, other professionals demonstrated the ability to anticipate a doctor's strengths and weaknesses in particular clinical situations in order to maximize patient safety.9(p829)
Our study results have implications for graduate medical education (GME) reform. First, trainees experienced supervision as a two‐way interaction.36 Residents balanced the countervailing pressures to act independently or to seek a supervising physician's advice, in part, by developing strategies for deciding when to ask questions. Kennedy et al. identified similar rhetorical strategies.18 By asking questions about their clinical decisions, residents requested that supervising physicians guide their work; thus, they proactively initiated and thereby enacted their own supervision. Fostering the conditions for initiating supervision is essential, especially given the association between lack of effective supervision and adverse outcomes.5, 6, 1214
Second, residents expressed contradictory expectations about seeking advice from supervising physicians. Some residents were wary of approaching attending physicians for fear of appearing incompetent or being ridiculed.12, 16, 18, 31 However, we found that other residents remained reluctant to seek advice despite simultaneously appreciating that attendings encouraged them to ask for assistance. Whereas the perceived approachability of supervising physicians was important,18, 19 our exploratory findings suggest that it may be a necessary, but not a sufficient, condition for creating a learning environment. Creating a supportive learning environmentin which residents feel comfortable in revealing their perceived shortcomings to supervising physicians3begins with cultural changes, such as building medical teams,6 but such changes can be slow to develop.
Third, interprofessional supervision offers a strategy for improving supervision. The ubiquitous involvement of nursing and pharmacy staff in monitoring and intervening in residents' medication‐related decisions could result in overlooking their unique contributions to resident supervision. Mindful that supervising physicians evaluate them, residents selectively sought nonjudgmental advice from professionals outside the medical hierarchy. Therefore, improving supervision could entail offering residents ready access to other professionals who can advise them, especially during late night hours when supervising physicians might not be present.17, 27
The importance of interprofessional supervision has not been adequately recognized and emphasized in GME. Our study findings, if supported by future research, highlight how interpersonal communication techniques could influence both interprofessional supervision and hierarchical supervision among physicians. Medical team training programs3739 emphasize developing skills, such as mutual performance monitoring,40(p13) by training providers to raise and respond to potentially sensitive questions. Improving supervision by enhancing interpersonal communication skills may be important, not only when relative status differences are clear (ie, physician hierarchy), but also when status differences are ambiguous (ie, residents and other professionals). GME programs could consider incorporating these techniques into their formal curricula, as could programs for nursing and pharmacy staff.
Our study has several limitations. Because of the larger research project objectives, we focused on medication safety in medical ICU settings, where nurses and pharmacists may be especially vigilant and proactive in monitoring residents. Thus, our findings may be specific to medication issues and less relevant outside ICUs. We had a relatively small sample size and do not claim to generalize from it, although we believe it offers meaningful insights. We also did not continue enlarging our sample until reaching redundancy.35(p202) Nevertheless, the purposeful random sample of residents produced rich information. Indeed, some study results are consistent with previous resident education research,18 adding validity to our findings. Although the interview protocol was not designed specifically to investigate supervision, the resulting interviews yielded abundant data containing residents' detailed descriptions of how they experienced supervision. Whereas we were careful to note whether particular perceptions were unique to one resident, or shared by others, we recognize that the value of residents' observations is assessed by the quality of the insights they provide, not necessarily by the number of residents who described the same experience.
In conclusion, we found that residents experienced difficulties in initiating traditional hierarchical supervision related to medication safety in the ICU. However, they reported ubiquitous interprofessional supervision, albeit limited in scope, which they relied upon for nonjudgmental guidance in their therapeutic decision‐making, especially after‐hours. In our study, interprofessional supervision proved crucial to improving medication safety in the ICU.
Close supervision of residents potentially leads to fewer errors, lower patient mortality, and improved quality of care.19 An Institute of Medicine (IOM) report3 recommended improving supervision through more frequent consultations between residents and their supervisors. Although current Accreditation Council for Graduate Medical Education (ACGME) guidelines also recommend that attending physicians (attendings) supervise residents, detailed guidance about what constitutes adequate supervision and how it should be implemented is not well defined.10, 11 The ACGME stresses that supervision should promote resident autonomy in clinical care.10 However, when trainees act independently, it might lead to critical communication breakdowns and other patient safety concerns.5, 6, 1214 Although attendings can encourage (or discourage) residents from seeking advice,15, 16 residents also play important roles in asking for help (ie, initiating their own supervision).1719 Additional research is needed on how residents walk the fine line between exercising independence and seeking supervision.
Lack of resident supervision is especially problematic in high‐risk settings such as the medical intensive care unit (ICU), where medical errors are as frequent as 1.7 errors per patient per day,20, 21 and the adverse drug event rate is twice that of non‐ICU settings.22 Because medication errors are one of the most common errors residents make,23, 24 resident interactions with nursing and pharmacy staff may significantly influence medication safety in error‐prone ICUs.2529 Studies of traditional hierarchical supervision tend to overlook how interactions with other professionals influence resident training.12, 18, 30, 31
We define supervision as a process of providing trainees with monitoring, guidance, and feedback9(p828) as they care for patients.3 Whereas traditionally, supervisors are identified by their positions of formal authority in the medical chain of command; we conceptualize supervision as a process in which professionals engaged in supervisory activities need not have formal authority over their trainees.
To examine how residents seek supervision through both the traditional medical hierarchical chain of command (including attendings, fellows and senior residents) and interprofessional communication channels (including nursing and pharmacy staff), we conducted a qualitative study of residents working in ICUs in three tertiary care hospitals. Using semi‐structured interviews, we asked residents to describe how they experienced supervision as they provided medications to patients. Two broad research questions guided data analysis:
How do residents receive supervision from physicians in the traditional medical hierarchy?
How do residents receive supervision from other professionals (ie, nurses, staff pharmacists, and clinical pharmacists)?
METHODS
Study Design and Sample
We conducted a qualitative study using data from interviews with 17 residents working in the medical ICUs of three large tertiary care hospitals (henceforth referred to as South, West, and North hospitals). The interviews were conducted as part of a longitudinal research project that examined how hospitals learn from medication errors.32 The research project focused on hospitals where medication error prevention was salient because of a vulnerable patient population and/or extensive high‐hazard drug usage. For each ICU, the research design included interviews with 6 attendings, 6 fellows, and a purposeful random sample33 of 6 residents. The goal was to reduce bias from supervisors selecting study participants, and thus enhance the credibility of the small sample, rather than generalize from it.32 Surgical residents were excluded, because of the medication focus. The local Institutional Review Boards approved the research.
Drawing on preliminary analyses of research project data, we designed the current study to examine how residents experienced supervision.33 A qualitative research design was particularly appropriate, because this study is exploratory34 and examines the processes of how supervision is implemented.33 By gathering longitudinal data from 2001 to 2007 and from ICUs in different hospitals, we were able to search for persistent patterns (and systematic variations over time) in how residents experienced supervision that might not have been revealed by a cross‐sectional study in one hospital ICU.
Data Collection
The principal investigator ([PI] M.T.) interviewed residents to gather data about their experiences with medication safety and supervision when providing medication to ICU patients. A general interview guide33 addressed residents' personal experiences with ordering medications, receiving supervision, and their perceptions of institutional medication safety programs (see Supporting Table 1 in the online version of this article). The interviewer consistently prompted residents to provide examples of their supervision experiences. The PI conducted confidential interviews in a private location near the ICU. Using confidential open‐ended, in‐depth interviews33 enabled the participating residents to provide frank answers to potentially sensitive questions.
The current study focuses on interviews with 17 residents; 8 from South Hospital, 6 from West Hospital, and 3 from North Hospital ICUs. Residents were at different training stages (years 14), and none declined participation. Interviews were audio‐recorded, transcribed professionally, checked for accuracy of transcription, and de‐identified. On average, each interview lasted about an hour, resulted in a 30‐page transcript, and focused on how residents experienced supervision for over two‐thirds of the transcript. Interviewees frequently described specific examples in vivid detail, yielding rich information. These data are consistent with Patton's observation that the validity, meaningfulness, and insights generated from qualitative inquiry have more to do with the information richness of the cases selected than with sample size.33(p245) Field notes, document review, and observations of routine activities supplemented the interviews.
Data Analysis
We coded and analyzed interview transcripts by applying the constant comparative method, in which we systematically examined and refined variations in the concepts that emerged from the data.33 To focus on the residents' perceptions of their training experiences, we began the data analysis without preexisting codes. We refined and reconstructed the coding scheme in several iterative stages. Based on the initial review by two investigators (M.T., H.S.), the PI and the coding team (T.D.G., S.M.) developed a preliminary coding scheme by induction, considering the residents' description of their experiences in the context of organizational research.34 They applied the coding scheme to three interview transcripts, and reevaluated and revised it based on comments from other investigators (H.S., E.J.T.).
The PI and the coding team met regularly to review and refine the codes. The PI and the coding team finalized the coding scheme only after it was validated by two other investigators and reapplied to the first set of interview transcripts. Constructing a detailed coding guide, we defined specific codes and classified them under seven broad themes.
We engaged in an iterative coding process to ensure credibility33 and consistent data analysis.34 Both coding team members independently coded each interview and resolved differences through consensus. The PI reviewed each coded transcript and met with the team to resolve any remaining coding disagreements. We used ATLAS.ti 5.0 software (ATLAS.ti Scientific Software Development, Berlin, Germany) to manage data, assist in detecting patterns, and compile relevant quotations.
We observed patterns in the data; we inductively identified themes that emerged from the data as well as those related to organizational research. During the period that we conducted interviews, new rules limiting residents' working hours were implemented.10 We did not discern any pattern changes before and after the new rules. To enhance data analysis credibility,34 two investigators (H.S., E.J.T.), serving as peer debriefers,35 examined whether the themes accurately reflected the data and rigorously searched for counter‐examples that contradicted the proposed themes.
RESULTS
Residents described how they were supervised not only by other physicians within the traditional medical hierarchy, but also by other professionals, including nurses, staff pharmacists, and clinical pharmacists, ie, interprofessional supervision (Figure 1). After presenting these results, we examine how physicians and other professionals used communication strategies during interprofessional supervision. Here we use the term residents to include trainees at all levels, from interns to upper‐level residents, and male pronouns for de‐identification.
Initiating Supervision in the Traditional Medical Hierarchy
Residents described teaching rounds as the formal setting where the attending and other team members guided and gave feedback on their medication‐related decisions. After rounds, residents referred to the formal chain of command (from senior resident to fellow or attending) for their questions. However, residents also described enacting their own supervision by deciding when and how to ask for advice.
Residents developed different strategies for initiating supervision (Table 1). Some described a rule of thumb or personal decision‐making routine for determining when to approach a supervising physician with a question (eg, if the patient is in serious condition) (Table 1, columns 1 and 2). Others described how they decided when and how to ask an attending about their mistakes (Table 1, columns 3 and 4). As might be expected, residents' strategies usually reflected a desire for professional autonomy tempered with varying assessments of their own limitations (Table 1, columns 1 and 2, see Autonomy).
| Strategies for Asking Questions | Strategies for Seeking Feedback on Mistakes | ||
|---|---|---|---|
| When to Ask | When Not to Ask | When to Disclose a Mistake | How to Disclose a Mistake |
| Potential for adverse patient outcome: | Autonomy: | Potential for adverse patient outcome: | Direct: |
If you expect this is really bad, you try to cover yourselfand try to get the experience of somebody else, how to fix it .[And if it's less serious?] Yeah, then you can handle it. If I know it's a busy night, I let two or three admissions come in and then I call the fellow. But if the patient is really, really sick I call the fellow. | There's always a fellow to help us if we have questions. Being like almost a third year though, a lot of the things we kind of can handle on our own. Replacing the electrolytes and blood pressure medicines; we don't need hardly any oversight. | Well, I don't want to call a fellow. I think this medication, if it is wrong, is not going to kill a patient, is not going to adversely affect the outcome. | And I went straight up to the attending and I'll be like: Listen, this is what happened. Now I know. I know what happened, but how can I prevent this from happening again or what should I have done differently? |
| Medication choice: | Nights: | Medication choice and potential for adverse patient outcome: | Indirect: |
| If it's what type of medicine we give, then I usually contact my fellow. But most of the time I just make a decision on my own. | I never call Dr. [Attending] at night because you can get in touch with the fellow. The intern should talk to the attending, but the intern couldn't reach the attending. Sometimes it's like 2:00 or 3:00 in the morning. Then you can wait. If it's not an emergency, not in bad shape, you can wait. In the morning, when the attending physician is there, we'll talk about it. We can then ask. | If I know I have made a small mistake and I think it is inconsequential, I am not going to bother anybody. But if it is a different antibiotic that needed to be started, or what other medications might I have forgotten I would say [to the attending], I forgot to do this yesterday and I am sorry. | Instead of going up and saying, I made this mistake, you know, This is what I did and this is what happened, was it wrong? And I will let them tell me that this was a mistake, or not a mistake, and why. [If it's] really bad, you kind of talk with a fellow and say, This is what I've done. Is it okay? |
| Divergence from plan: | |||
If it's not something in the plan and we have to call someone, like an attending in a neurology service. Things that are discussed in advance, that may be potentially serious, I won't discuss, but basically anything that wasn't discussed in advance that I judge to be serious, then I will ask. | |||
We also identified patterns in how residents and their supervising physicians communicated when residents initiated supervision (Table 2, column 1). In general, residents considered attendings and fellows to be receptive to their questions. One resident explained: There is no one here who is unapproachableeven an attending. Nonetheless, residents reported using deferential language when initiating supervision (Table 2, column 1, row 2). Residents noted that attendings and fellows varied in their responses to questions and mistakes, as reflected in how they communicated with residents (Table 2, column 1, rows 1 and 3).
| Communication Strategies | Hierarchical Supervision: Resident Initiated Supervision | Interprofessional Supervision: Other Professional Initiated Supervision |
|---|---|---|
| ||
| Nonjudgmental language* | Fellow to resident: | Resident to nurse: |
| There's no dumb question. Ask. You can call me any time. | I'll say, It's not such a good idea for this reason. I feel they've [nurses] questioned you on it, so you deserve an appropriate answer. It's not okay to just be like, No, we're not gonna do that. | |
| Attending to resident: | ||
| Listen, [the mistake] could have happened to anybody . Now you know. Next time [you] do this, but [the patient is] gonna be okay. | ||
| Deferential language | Resident to difficult attending: | Pharmacist questions resident: |
| And when you call, you're polite and respectful: I'm sorry sir, I hate to bother you but I have a dumb question | The pharmacy called me up and said, Now listen, are you sure you want to give that dosage? | |
| Resident to fellow: | Nurse questions resident: | |
| Listen, in humbleness say, I don't know this, or am I doing this right? Can you help me out here? | [Nurses] might say like, Oh, you really? You sure you want to do this? | |
| Nurse guides resident: | ||
| Hey I know it's your decision, but this is what Dr. [Attending] would do. | ||
| Judgmental language | Attending response to a gross error: | Nurses questions resident: |
| What the hell were you thinking? We'll try to fix it, but God, what were you thinking? | At first [the nurses] were making fun of the resident who wrote [an unfamiliar medication order] . They just assume you're stupid until you prove them wrong, which is fine. But it gets annoying, too, because we did go to school for a long timewe actually know what the hell we're doing. | |
| Fellow response to resident question: | ||
| The cardiology fellow on call at 2 AM, when you call with a question will be like, Why would you even ask me that question? How could you not know that? | ||
Despite recognizing the importance of asking questions, several residents expressed conflicting beliefs; they raised concerns about the personal consequences of seeking assistance. For instance, one resident advocated: My point of view is I think it's wonderful when you ask questions. Cause that means you're conscientious enough to care about the patientsenough to do the right thing. However, we observed that when he interrupted the research interview to consult with a fellow, he prefaced his query with: Hey, I think this is a dumb question. Some residents expressed contradictory beliefs when they described their embarrassment over appearing stupid and fears of looking weak in front of supervising physicians, even those they perceived as being approachable. Indeed, for one resident, the attending's accessibility increased his anxiety: I don't want to lose respect by asking a stupid question.
Interprofessional Supervision
Residents described how other professionals used various methods of supervising their decision‐making (Table 3). Nurses and pharmacists intercepted medication orders and asked for clarifications, whereas clinical pharmacists also advised residents on ordering alternative medications (Table 3, row 1). Other professionals regularly double‐checked order implementation (Table 3, row 2). Nurses, in particular, routinely guided the future actions of residents by giving them cues and suggesting the next therapeutic tasks they should perform (Table 3, row 3). When assessing residents' clinical decisions, these professionals applied different guidelines (Table 4). Nurses compared residents' clinical decisions to their expectations for usual experience‐based practices (Table 4, column 1); pharmacists consulted and noticed deviations from national and hospital pharmacy standards (Table 4, column 2); and clinical pharmacists supplemented pharmacy standards with their professional judgment (Table 4, column 3).
| Provider Type | Example |
|---|---|
| Intercepting medication orders | |
| Nurses and pharmacists | Clarifying and correcting orders: |
The [pharmacist] said, How much do you really want to give? I was like, Okay. Let me take a look at it. And when I looked at it, I knew it wasn't calculated right. The nurse will call me and say, or the pharmacist will call me and say, Can you please change this? This is not the right dose. | |
| Clinical pharmacists | Suggesting alternative medications: |
| You know, this might be a better medication to use because the half life is | |
| Double‐checking order implementation | |
| Nurses | The nurses in [the unit] are wonderful about doing their own calculations, so if it's a rate, like if it's a drip, I've seen almost all the nurses go back over my drip and do the doses. |
| Clinical pharmacists | Cause even after rounds, he'll go back through and look at all, everything. And if he sees something that doesn't make sense or we could do different, he lets us know. |
| Guiding future actions | |
| Nurses | [The nurses] talk to you about everything. They see the labs before you. They see the labs in the morning and are like, His potassium is high, can you fix this? His blood pressure has been running up, do you want to give him something? They guide you towards making the right decision. |
| Clinical pharmacists | I wouldn't give these two [medications] together. There may be an interaction. |
| Nurses | Staff Pharmacists | Clinical Pharmacists |
|---|---|---|
| Experience on unit and with patients: | Standardized pharmacy guidelines for normal dosage ranges: | Standardized pharmacy guidelines for normal dosage ranges: |
| They're with the patients 12 hours a day. Some of them, they've been doing this for 30 years. | No, [the pharmacists] wouldn't have known on that one [error] because it was a normal it's within a normal range of dosing and it's not that it would cause any harm to the patient, but it was just that it needed to go to a higher dose. [I] did a very high dose, compared with the current dose. Then [the pharmacist] called me back and said, I think this is not the right dose. | [The clinical pharmacist is] the one who says, Oh, by the way, do you really want it IV or PO? Or It should be q 6 versus q 8. |
| Expectations for practice norms: | Patient‐specific dosage guidelines: | Clinical judgment based on specialized pharmacology expertise: |
| [The nurses] can pick up mistakes just as easily as anyone else because they are used to this environment and they are used to seeing all the orders that are written generally. | The [unit‐based] pharmacist came to me and said, This patient's almost in renal failure. Did you want to give them a smaller dose because of the renal failure? And I said, Oh, yeah. I didn't even think about that. | That's all [clinical pharmacists] know is medicine and research and studies, and so you know, there may be a paper that came out last week that none of us have even had a chance to read. But they would be up to date on it. So as far as all the drug trials and everything. |
| The usual practices in the unit: | ||
| An experienced nurse came to me and told me that in the unit, doctor, we used to do it 1 gram, not 0.5 gram. | ||
| The attending's preferences: | ||
| I know sometimes you'll want to start a certain pressor and the nurse will be like Well, Dr. [Attending] likes to use this pressor instead. | ||
| Formal standards: | ||
| A nurse would say, especially in the medications I wrote out to be canceled because of the antibiotic policy here . Doctor, the patient doesn't have any more doses of [antibiotic], what do you want me to start, or do you need to call the [antibiotic policy] team? |
Initiating Interprofessional Supervision
Residents, in turn, sought advice from other professionals. They actively engaged pharmacists in their supervision by asking questions ranging from basic clarifications to complex technical queries. You can just take [the clinical pharmacist] to the side and say, Hey listen. I forgot this medication. What am I supposed to give? It starts with an L, explained a resident. Other residents consulted clinical pharmacists for specialized expertise: The [clinical pharmacists] usually have a protocol that they like to follow that a lot of the residents and probably even a lot of the attendings aren't aware of. In one hospital, residents depended on the clinical pharmacists: They're always available and they really help out the team. In another hospital, unit‐based (on‐site) pharmacists served as an informal but extremely useful resource. Residents also relied on central pharmacy‐based staff, who provided essential backup, especially after‐hours: [The pharmacy is] always available, like if you have a questionthere's a medicine you've never given, but it's the middle of the night, nobody else around, you want to call the pharmacist. Residents uniformly noted that nurses monitored their decisions (Table 2, column 2; Table 4, column 1), and one specifically mentioned soliciting advice from nurses on organizing intravenous lines.
Communication Strategies for Managing Differences in Status and Expertise
Unlike the medical hierarchy that clearly differentiates among residents, fellows, and attendings, interdisciplinary differences were less clearly delineated. Residents were perceived as having higher status than other professionals, due in part to their medical education and responsibility for signing orders. Nurses and pharmacists, however, often had extensive experience and/or specialized training, and thus more expertise than residents. For instance, residents noticed their ambiguous status compared to nurses:
I don't know if some people might psychologically think it was better or worse, worse because it was coming from a nurse and maybe somebody would think that they wouldn't know as much or something like that. But other people would think of it as, they're a team member and they have the perfect right to know more. And maybe it's better because that way like maybe the fellow or attending wouldn't find out that you made a mistake [emphasis added].
To manage the ambiguous differences in their status, experience, and expertise, residents and other professionals used various communication strategies (Table 2, column 2). Residents consistently recounted that pharmacists and nurses used deferential language, for example, by asking questions, rather than directly stating their concerns (Table 2, column 2, row 2). One resident appreciated the unit‐nurses' indirect language: Over here they're really cool about it. They'll say, Is this right, are you sure about this? However, some residents also recalled that nurses used more direct language, such as I am not comfortable, especially when giving residents feedback on IV drug administration. In contrast, when asking pharmacists questions, residents consistently reported using nonjudgmental language, but not deferential language. However, some residents used judgmental language when they disagreed with a pharmacist's intervention.
Individual residents bitterly recalled their encounters with other professionals during previous rotations. One described nurses who were resident‐unfriendly and used judgmental language to mock a resident's choice of medications (Table 2, column 2, row 3). Another worked with clinical pharmacists who feel like they are teaching the residents and they are above the residents. These interactions illustrate how communication choices can create interprofessional tensions, especially when differences in status and expertise conflict or are unclear.
DISCUSSION
We analyzed interviews of residents working in medical ICUs to understand their supervision experiences related to medication safety. Although residents espoused beliefs in seeking assistance from supervising physicians and articulated strategies for doing so, many experienced difficulties in initiating supervision through the traditional medical hierarchy. Some residents were embarrassed by their mistaken decisions; others were concerned that their questions would reflect poorly on them.
Residents also received interprofessional supervision from nurses and pharmacists, who proactively monitored, intervened in, and guided residents' decisions. Other professionals evaluated residents' decisions by comparing them to distinctive professional guidelines and routinely used deferential language when conveying their concerns. Residents, in turn, asked other professionals for assistance.
We posit that interprofessional supervision clearly meets an accepted definition of supervision.3, 9 Residents received monitoring, guidance and feedback9(p828) from other professionals, who engaged in routine monitoring and in situation‐specific double‐checks of residents' clinical decisions, similar to those performed by supervising physicians.30 Moreover, other professionals demonstrated the ability to anticipate a doctor's strengths and weaknesses in particular clinical situations in order to maximize patient safety.9(p829)
Our study results have implications for graduate medical education (GME) reform. First, trainees experienced supervision as a two‐way interaction.36 Residents balanced the countervailing pressures to act independently or to seek a supervising physician's advice, in part, by developing strategies for deciding when to ask questions. Kennedy et al. identified similar rhetorical strategies.18 By asking questions about their clinical decisions, residents requested that supervising physicians guide their work; thus, they proactively initiated and thereby enacted their own supervision. Fostering the conditions for initiating supervision is essential, especially given the association between lack of effective supervision and adverse outcomes.5, 6, 1214
Second, residents expressed contradictory expectations about seeking advice from supervising physicians. Some residents were wary of approaching attending physicians for fear of appearing incompetent or being ridiculed.12, 16, 18, 31 However, we found that other residents remained reluctant to seek advice despite simultaneously appreciating that attendings encouraged them to ask for assistance. Whereas the perceived approachability of supervising physicians was important,18, 19 our exploratory findings suggest that it may be a necessary, but not a sufficient, condition for creating a learning environment. Creating a supportive learning environmentin which residents feel comfortable in revealing their perceived shortcomings to supervising physicians3begins with cultural changes, such as building medical teams,6 but such changes can be slow to develop.
Third, interprofessional supervision offers a strategy for improving supervision. The ubiquitous involvement of nursing and pharmacy staff in monitoring and intervening in residents' medication‐related decisions could result in overlooking their unique contributions to resident supervision. Mindful that supervising physicians evaluate them, residents selectively sought nonjudgmental advice from professionals outside the medical hierarchy. Therefore, improving supervision could entail offering residents ready access to other professionals who can advise them, especially during late night hours when supervising physicians might not be present.17, 27
The importance of interprofessional supervision has not been adequately recognized and emphasized in GME. Our study findings, if supported by future research, highlight how interpersonal communication techniques could influence both interprofessional supervision and hierarchical supervision among physicians. Medical team training programs3739 emphasize developing skills, such as mutual performance monitoring,40(p13) by training providers to raise and respond to potentially sensitive questions. Improving supervision by enhancing interpersonal communication skills may be important, not only when relative status differences are clear (ie, physician hierarchy), but also when status differences are ambiguous (ie, residents and other professionals). GME programs could consider incorporating these techniques into their formal curricula, as could programs for nursing and pharmacy staff.
Our study has several limitations. Because of the larger research project objectives, we focused on medication safety in medical ICU settings, where nurses and pharmacists may be especially vigilant and proactive in monitoring residents. Thus, our findings may be specific to medication issues and less relevant outside ICUs. We had a relatively small sample size and do not claim to generalize from it, although we believe it offers meaningful insights. We also did not continue enlarging our sample until reaching redundancy.35(p202) Nevertheless, the purposeful random sample of residents produced rich information. Indeed, some study results are consistent with previous resident education research,18 adding validity to our findings. Although the interview protocol was not designed specifically to investigate supervision, the resulting interviews yielded abundant data containing residents' detailed descriptions of how they experienced supervision. Whereas we were careful to note whether particular perceptions were unique to one resident, or shared by others, we recognize that the value of residents' observations is assessed by the quality of the insights they provide, not necessarily by the number of residents who described the same experience.
In conclusion, we found that residents experienced difficulties in initiating traditional hierarchical supervision related to medication safety in the ICU. However, they reported ubiquitous interprofessional supervision, albeit limited in scope, which they relied upon for nonjudgmental guidance in their therapeutic decision‐making, especially after‐hours. In our study, interprofessional supervision proved crucial to improving medication safety in the ICU.
- ,,.Resident supervision in the operating room: Does this impact on outcome?J Trauma.1993;35:556–560.
- ,.Supervision in the outpatient clinic: Effects on teaching and patient care.J Gen Intern Med.1993;8:378–380.
- Institute of Medicine (IOM).Resident Duty Hours: Enhancing Sleep, Supervision, and Safety.Washington, DC:National Academic Press;2008.
- Joint Committee of the Group on Resident Affairs and Organization of Resident Representatives. Patient Safety and Graduate Medical Education. Washington, DC: Association of American Medical Colleges; 2003. Available at: https://services.aamc.org/publications/showfile.cfm?file=version13.pdf145:592–598.
- ,,,.Medical errors involving trainees: A study of closed malpractice claims from 5 insurers.Arch Intern Med.2007;167:2030–2036.
- .Resident duty hour reform and mortality in hospitalized patients.JAMA.2007;298:2865–2866.
- ,,,.Progressive independence in clinical training: A tradition worth defending?Acad Med.2005;80:S106–S111.
- ,.Effective supervision in clinical practice settings: A literature review.Med Educ.2000;34:827–840.
- Accreditation Council for Graduate Medical Education. ACGME Residency Review Committee Program Requirements in Critical Care Medicine. 2007. Available at: http://www.acgme.org/acWebsite/downloads/RRC_progReq/142pr707_ims.pdf Accessed August 14, 2009.
- ,.Resident supervision.Accreditation Council for Graduate Medical Education Bulletin.2005; September:15–17. Available at: http://www.acgme.org/acWebsite/bulletin/bulletin09_05. pdf. Accessed March 14,year="2009"2009.
- ,,,,.Resident uncertainty in clinical decision making and impact on patient care: A qualitative study.Qual Saf Health Care.2008;17:122–126.
- ,,, et al.Patterns of communication breakdowns resulting in injury to surgical patients.J Am Coll Surg.2007;204:533–540.
- ,,.Communication failures: An insidious contributor to medical mishaps.Acad Med.2004;79:186–194.
- ,,, et al.Attending doctors' perspectives on how residents learn.Med Educ.2007;41:1050–1058.
- ,,.Teaching but not learning: How medical residency programs handle errors.J Organiz Behav.2006;27:869–896.
- ,,,,.On‐call supervision and resident autonomy: From micromanager to absentee attending.Am J Med.2009;122:784–788.
- ,,,.Preserving professional credibility: Grounded theory study of medical trainees' requests for clinical support.BMJ.2009;338:b128.
- ,,,,,.Who wants feedback? An investigation of the variables influencing residents' feedback‐seeking behavior in relation to night shifts.Acad Med.2009;84:910–917.
- ,,, et al.A look into the nature and causes of human errors in the intensive care unit.Crit Care Med.1995;23:294–300.
- ,,, et al.The Critical Care Safety Study: The incidence and nature of adverse events and serious medical errors in intensive care.Crit Care Med.2005;33:1694–1700.
- ,,,,,.Preventable adverse drug events in hospitalized patients: A comparative study of intensive care and general care units.Crit Care Med.1997;25:1289–1297.
- ,,,,,.Residents report on adverse events and their causes.Arch Intern Med.2005;165:2607–2613.
- ,,, et al.Effect of reducing interns' work hours on serious medical errors in intensive care units.N Engl J Med.2004;351:1838–1848.
- ,,,,.Unit‐based clinical pharmacists' prevention of serious medication errors in pediatric inpatients.Am J Health Syst Pharm.2008;65:1254–1260.
- ,,,,.Improving medication safety in the ICU: The pharmacist's role.Hospital Pharmacy.2007;42:337–344.
- ,,,,,.Collaboration between pharmacists, physicians and nurse practitioners: A qualitative investigation of working relationships in the inpatient medical setting.J Interprof Care.2009;23:169–184.
- ,,,.Role of registered nurses in error prevention, discovery and correction.Qual Saf Health Care.2008;17:117–121.
- ,,, et al.Recovery from medical errors: The critical care nursing safety net.Jt Comm J Qual Patient Saf.2006;32:63–72.
- ,,,,.Clinical oversight: Conceptualizing the relationship between supervision and safety.J Gen Intern Med.2007;22:1080–1085.
- .To call or not to call: A judgment of risk by pre‐registration house officers.Med Educ.2008;42:938–944.
- ,.Classifying and interpreting threats to patient safety in hospitals: Insights from aviation.J Organiz Behav.2006;27:919–940.
- .Qualitative Research and Evaluation Methods.3rd ed.Thousand Oaks, CA:Sage Publications;2002.
- ,.Qualitative Data Analysis.2nd. ed.Thousand Oaks, CA:Sage Publications;2006.
- ,.Naturalistic Inquiry.Beverly Hills, CA:Sage Publications;1985.
- ,,.Supervision: A 2‐way street.Arch Intern Med.2008;168:1117.
- ,,, et al.Effects of teamwork training on adverse outcomes and process of care in labor and delivery: A randomized controlled trial.Obstet Gynecol.2007;109:48–55.
- ,,,.Does crew resource management training work? An update, an extension, and some critical needs.Hum Factors.2006;48:392–412.
- ,,,,,.Team training in the neonatal resuscitation program for interns: Teamwork and quality of resuscitations.Pediatrics.2010;125:539–546.
- ,,,,.Medical Teamwork and Patient Safety: The Evidence‐Based Relation.Rockville, MD:Agency for Healthcare Research and Quality 2005. Publication No. 05–0053. Available at: http://www.ahrq.gov/qual/medteam. Accessed October 15,2010.
- ,,.Resident supervision in the operating room: Does this impact on outcome?J Trauma.1993;35:556–560.
- ,.Supervision in the outpatient clinic: Effects on teaching and patient care.J Gen Intern Med.1993;8:378–380.
- Institute of Medicine (IOM).Resident Duty Hours: Enhancing Sleep, Supervision, and Safety.Washington, DC:National Academic Press;2008.
- Joint Committee of the Group on Resident Affairs and Organization of Resident Representatives. Patient Safety and Graduate Medical Education. Washington, DC: Association of American Medical Colleges; 2003. Available at: https://services.aamc.org/publications/showfile.cfm?file=version13.pdf145:592–598.
- ,,,.Medical errors involving trainees: A study of closed malpractice claims from 5 insurers.Arch Intern Med.2007;167:2030–2036.
- .Resident duty hour reform and mortality in hospitalized patients.JAMA.2007;298:2865–2866.
- ,,,.Progressive independence in clinical training: A tradition worth defending?Acad Med.2005;80:S106–S111.
- ,.Effective supervision in clinical practice settings: A literature review.Med Educ.2000;34:827–840.
- Accreditation Council for Graduate Medical Education. ACGME Residency Review Committee Program Requirements in Critical Care Medicine. 2007. Available at: http://www.acgme.org/acWebsite/downloads/RRC_progReq/142pr707_ims.pdf Accessed August 14, 2009.
- ,.Resident supervision.Accreditation Council for Graduate Medical Education Bulletin.2005; September:15–17. Available at: http://www.acgme.org/acWebsite/bulletin/bulletin09_05. pdf. Accessed March 14,year="2009"2009.
- ,,,,.Resident uncertainty in clinical decision making and impact on patient care: A qualitative study.Qual Saf Health Care.2008;17:122–126.
- ,,, et al.Patterns of communication breakdowns resulting in injury to surgical patients.J Am Coll Surg.2007;204:533–540.
- ,,.Communication failures: An insidious contributor to medical mishaps.Acad Med.2004;79:186–194.
- ,,, et al.Attending doctors' perspectives on how residents learn.Med Educ.2007;41:1050–1058.
- ,,.Teaching but not learning: How medical residency programs handle errors.J Organiz Behav.2006;27:869–896.
- ,,,,.On‐call supervision and resident autonomy: From micromanager to absentee attending.Am J Med.2009;122:784–788.
- ,,,.Preserving professional credibility: Grounded theory study of medical trainees' requests for clinical support.BMJ.2009;338:b128.
- ,,,,,.Who wants feedback? An investigation of the variables influencing residents' feedback‐seeking behavior in relation to night shifts.Acad Med.2009;84:910–917.
- ,,, et al.A look into the nature and causes of human errors in the intensive care unit.Crit Care Med.1995;23:294–300.
- ,,, et al.The Critical Care Safety Study: The incidence and nature of adverse events and serious medical errors in intensive care.Crit Care Med.2005;33:1694–1700.
- ,,,,,.Preventable adverse drug events in hospitalized patients: A comparative study of intensive care and general care units.Crit Care Med.1997;25:1289–1297.
- ,,,,,.Residents report on adverse events and their causes.Arch Intern Med.2005;165:2607–2613.
- ,,, et al.Effect of reducing interns' work hours on serious medical errors in intensive care units.N Engl J Med.2004;351:1838–1848.
- ,,,,.Unit‐based clinical pharmacists' prevention of serious medication errors in pediatric inpatients.Am J Health Syst Pharm.2008;65:1254–1260.
- ,,,,.Improving medication safety in the ICU: The pharmacist's role.Hospital Pharmacy.2007;42:337–344.
- ,,,,,.Collaboration between pharmacists, physicians and nurse practitioners: A qualitative investigation of working relationships in the inpatient medical setting.J Interprof Care.2009;23:169–184.
- ,,,.Role of registered nurses in error prevention, discovery and correction.Qual Saf Health Care.2008;17:117–121.
- ,,, et al.Recovery from medical errors: The critical care nursing safety net.Jt Comm J Qual Patient Saf.2006;32:63–72.
- ,,,,.Clinical oversight: Conceptualizing the relationship between supervision and safety.J Gen Intern Med.2007;22:1080–1085.
- .To call or not to call: A judgment of risk by pre‐registration house officers.Med Educ.2008;42:938–944.
- ,.Classifying and interpreting threats to patient safety in hospitals: Insights from aviation.J Organiz Behav.2006;27:919–940.
- .Qualitative Research and Evaluation Methods.3rd ed.Thousand Oaks, CA:Sage Publications;2002.
- ,.Qualitative Data Analysis.2nd. ed.Thousand Oaks, CA:Sage Publications;2006.
- ,.Naturalistic Inquiry.Beverly Hills, CA:Sage Publications;1985.
- ,,.Supervision: A 2‐way street.Arch Intern Med.2008;168:1117.
- ,,, et al.Effects of teamwork training on adverse outcomes and process of care in labor and delivery: A randomized controlled trial.Obstet Gynecol.2007;109:48–55.
- ,,,.Does crew resource management training work? An update, an extension, and some critical needs.Hum Factors.2006;48:392–412.
- ,,,,,.Team training in the neonatal resuscitation program for interns: Teamwork and quality of resuscitations.Pediatrics.2010;125:539–546.
- ,,,,.Medical Teamwork and Patient Safety: The Evidence‐Based Relation.Rockville, MD:Agency for Healthcare Research and Quality 2005. Publication No. 05–0053. Available at: http://www.ahrq.gov/qual/medteam. Accessed October 15,2010.
Copyright © 2011 Society of Hospital Medicine
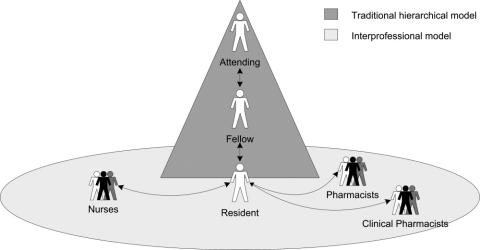
Hospital Performance Trends
The Joint Commission (TJC) currently accredits approximately 4546 acute care, critical access, and specialty hospitals,1 accounting for approximately 82% of U.S. hospitals (representing 92% of hospital beds). Hospitals seeking to earn and maintain accreditation undergo unannounced on‐site visits by a team of Joint Commission surveyors at least once every 3 years. These surveys address a variety of domains, including the environment of care, infection prevention and control, information management, adherence to a series of national patient safety goals, and leadership.1
The survey process has changed markedly in recent years. Since 2002, accredited hospitals have been required to continuously collect and submit selected performance measure data to The Joint Commission throughout the three‐year accreditation cycle. The tracer methodology, an evaluation method in which surveyors select a patient to follow through the organization in order to assess compliance with selected standards, was instituted in 2004. Soon thereafter, on‐site surveys went from announced to unannounced in 2006.
Despite the 50+ year history of hospital accreditation in the United States, there has been surprisingly little research on the link between accreditation status and measures of hospital quality (both processes and outcomes). It is only recently that a growing number of studies have attempted to examine this relationship. Empirical support for the relationship between accreditation and other quality measures is emerging. Accredited hospitals have been shown to provide better emergency response planning2 and training3 compared to non‐accredited hospitals. Accreditation has been observed to be a key predictor of patient safety system implementation4 and the primary driver of hospitals' patient‐safety initiatives.5 Accredited trauma centers have been associated with significant reductions in patient mortality,6 and accreditation has been linked to better compliance with evidence‐based methadone and substance abuse treatment.7, 8 Accredited hospitals have been shown to perform better on measures of hospital quality in acute myocardial infarction (AMI), heart failure, and pneumonia care.9, 10 Similarly, accreditation has been associated with lower risk‐adjusted in‐hospital mortality rates for congestive heart failure (CHF), stroke, and pneumonia.11, 12 The results of such research, however, have not always been consistent. Several studies have been unable to demonstrate a relationship between accreditation and quality measures. A study of financial and cost‐related outcome measures found no relationship to accreditation,13 and a study comparing medication error rates across different types of organizations found no relationship to accreditation status.14 Similarly, a comparison of accredited versus non‐accredited ambulatory surgical organizations found that patients were less likely to be hospitalized when treated at an accredited facility for colonoscopy procedures, but no such relationship was observed for the other 4 procedures studied.15
While the research to date has been generally supportive of the link between accreditation and other measures of health care quality, the studies were typically limited to only a few measures and/or involved relatively small samples of accredited and non‐accredited organizations. Over the last decade, however, changes in the performance measurement landscape have created previously unavailable opportunities to more robustly examine the relationship between accreditation and other indicators of hospital quality.
At about the same time that The Joint Commission's accreditation process was becoming more vigorous, the Centers for Medicare and Medicaid Services (CMS) began a program of publicly reporting quality data (
By using a population of hospitals and a range of standardized quality measures greater than those used in previous studies, we seek to address the following questions: Is Joint Commission accreditation status truly associated with higher quality care? And does accreditation status help identify hospitals that are more likely to improve their quality and safety over time?
METHODS
Performance Measures
Since July 2002, U.S. hospitals have been collecting data on standardized measures of quality developed by The Joint Commission and CMS. These measures have been endorsed by the National Quality Forum16 and adopted by the Hospital Quality Alliance.17 The first peer‐reviewed reports using The Joint Commission/CMS measure data confirmed that the measures could successfully monitor and track hospital improvement and identify disparities in performance,18, 19 as called for by the Institute of Medicine's (IOM) landmark 2001 report, Crossing the Quality Chasm.20
In order to promote transparency in health care, both CMSthrough the efforts of the Hospital Quality Allianceand The Joint Commission began publicly reporting measure rates in 2004 using identical measure and data element specifications. It is important to note that during the five‐year span covered by this study, both The Joint Commission and CMS emphasized the reporting of performance measure data. While performance improvement has been the clear objective of these efforts, neither organization established targets for measure rates or set benchmarks for performance improvement. Similarly, while Joint Commission‐accredited hospitals were required to submit performance measure data as a condition of accreditation, their actual performance on the measure rates did not factor into the accreditation decision. In the absence of such direct leverage, it is interesting to note that several studies have demonstrated the positive impact of public reporting on hospital performance,21 and on providing useful information to the general public and health care professionals regarding hospital quality.22
The 16 measures used in this study address hospital compliance with evidence‐based processes of care recommended by the clinical treatment guidelines of respected professional societies.23 Process of care measures are particularly well suited for quality improvement purposes, as they can identify deficiencies which can be immediately addressed by hospitals and do not require risk‐adjustment, as opposed to outcome measures, which do not necessarily directly identify obvious performance improvement opportunities.2426 The measures were also implemented in sets in order to provide hospitals with a more complete portrayal of quality than might be provided using unrelated individual measures. Research has demonstrated that greater collective performance on these process measures is associated with improved one‐year survival after heart failure hospitalization27 and inpatient mortality for those Medicare patients discharged with acute myocardial infarction, heart failure, and pneumonia,28 while other research has shown little association with short‐term outcomes.29
Using the Specifications Manual for National Hospital Inpatient Quality Measures,16 hospitals identify the initial measure populations through International Classification of Diseases (ICD‐CM‐9) codes and patient age obtained through administrative data. Trained abstractors then collect the data for measure‐specific data elements through medical record review on the identified measure population or a sample of this population. Measure algorithms then identify patients in the numerator and denominator of each measure.
Process measure rates reflect the number of times a hospital treated a patient in a manner consistent with specific evidence‐based clinical practice guidelines (numerator cases), divided by the number of patients who were eligible to receive such care (denominator cases). Because precise measure specifications permit the exclusion of patients contraindicated to receive the specific process of care for the measure, ideal performance should be characterized by measure rates that approach 100% (although rare or unpredictable situations, and the reality that no measure is perfect in its design, make consistent performance at 100% improbable). Accuracy of the measure data, as measured by data element agreement rates on reabstraction, has been reported to exceed 90%.30
In addition to the individual performance measures, hospital performance was assessed using 3 condition‐specific summary scores, one for each of the 3 clinical areas: acute myocardial infarction, heart failure, and pneumonia. The summary scores are a weighted average of the individual measure rates in the clinical area, where the weights are the sample sizes for each of the measures.31 A summary score was also calculated based on all 16 measures as a summary measure of overall compliance with recommended care.
One way of studying performance measurement in a way that relates to standards is to evaluate whether a hospital achieves a high rate of performance, where high is defined as a performance rate of 90% or more. In this context, measures were created from each of the 2004 and 2008 hospital performance rates by dichotomizing them as being either less than 90%, or greater than or equal to 90%.32
Data Sources
The data for the measures included in the study are available on the CMS Hospital Compare public databases or The Joint Commission for discharges in 2004 and 2008.33 These 16 measures, active for all 5 years of the study period, include: 7 measures related to acute myocardial infarction care; 4 measures related to heart failure care; and 5 measures related to pneumonia care. The majority of the performance data for the study were obtained from the yearly CMS Hospital Compare public download databases (
Hospital Characteristics
We then linked the CMS performance data, augmented by The Joint Commission performance data when necessary, to hospital characteristics data in the American Hospital Association (AHA) Annual Survey with respect to profit status, number of beds (<100 beds, 100299 beds, 300+ beds), rural status, geographic region, and whether or not the hospital was a critical access hospital. (Teaching status, although available in the AHA database, was not used in the analysis, as almost all teaching hospitals are Joint Commission accredited.) These characteristics were chosen since previous research has identified them as being associated with hospital quality.9, 19, 3437 Data on accreditation status were obtained from The Joint Commission's hospital accreditation database. Hospitals were grouped into 3 hospital accreditation strata based on longitudinal hospital accreditation status between 2004 and 2008: 1) hospitals not accredited in the study period; 2) hospitals accredited between one to four years; and 3) hospitals accredited for the entire study period. Analyses of this middle group (those hospitals accredited for part of the study period; n = 212, 5.4% of the whole sample) led to no significant change in our findings (their performance tended to be midway between always accredited and never‐accredited hospitals) and are thus omitted from our results. Instead, we present only hospitals who were never accredited (n = 762) and those who were accredited through the entire study period (n = 2917).
Statistical Analysis
We assessed the relationship between hospital characteristics and 2004 performance of Joint Commission‐accredited hospitals with hospitals that were not Joint Commission accredited using 2 tests for categorical variables and t tests for continuous variables. Linear regression was used to estimate the five‐year change in performance at each hospital as a function of accreditation group, controlling for hospital characteristics. Baseline hospital performance was also included in the regression models to control for ceiling effects for those hospitals with high baseline performance. To summarize the results, we used the regression models to calculate adjusted change in performance for each accreditation group, and calculated a 95% confidence interval and P value for the difference between the adjusted change scores, using bootstrap methods.38
Next we analyzed the association between accreditation and the likelihood of high 2008 hospital performance by dichotomizing the hospital rates, using a 90% cut point, and using logistic regression to estimate the probability of high performance as a function of accreditation group, controlling for hospital characteristics and baseline hospital performance. The logistic models were then used to calculate adjusted rates of high performance for each accreditation group in presenting the results.
We used two‐sided tests for significance; P < 0.05 was considered statistically significant. This study had no external funding source.
RESULTS
For the 16 individual measures used in this study, a total of 4798 hospitals participated in Hospital Compare or reported data to The Joint Commission in 2004 or 2008. Of these, 907 were excluded because the performance data were not available for either 2004 (576 hospitals) or 2008 (331 hospitals) resulting in a missing value for the change in performance score. Therefore, 3891 hospitals (81%) were included in the final analyses. The 907 excluded hospitals were more likely to be rural (50.8% vs 17.5%), be critical access hospitals (53.9% vs 13.9%), have less than 100 beds (77.4% vs 37.6%), be government owned (34.6% vs 22.1%), be for profit (61.4% vs 49.5%), or be unaccredited (79.8% vs 45.8% in 2004; 75.6% vs 12.8% in 2008), compared with the included hospitals (P < 0.001 for all comparisons).
Hospital Performance at Baseline
Joint Commission‐accredited hospitals were more likely to be large, for profit, or urban, and less likely to be government owned, from the Midwest, or critical access (Table 1). Non‐accredited hospitals performed more poorly than accredited hospitals on most of the publicly reported measures in 2004; the only exception is the timing of initial antibiotic therapy measure for pneumonia (Table 2).
| Characteristic | Non‐Accredited (n = 786) | Accredited (n = 3105) | P Value* |
|---|---|---|---|
| |||
| Profit status, No. (%) | <0.001 | ||
| For profit | 60 (7.6) | 586 (18.9) | |
| Government | 289 (36.8) | 569 (18.3) | |
| Not for profit | 437 (55.6) | 1,950 (62.8) | |
| Census region, No. (%) | <0.001 | ||
| Northeast | 72 (9.2) | 497 (16.0) | |
| Midwest | 345 (43.9) | 716 (23.1) | |
| South | 248 (31.6) | 1,291 (41.6) | |
| West | 121 (15.4) | 601 (19.4) | |
| Rural setting, No. (%) | <0.001 | ||
| Rural | 495 (63.0) | 833 (26.8) | |
| Urban | 291 (37.0) | 2,272 (73.2) | |
| Bed size | <0.001 | ||
| <100 beds | 603 (76.7) | 861 (27.7) | |
| 100299 beds | 158 (20.1) | 1,444 (46.5) | |
| 300+ beds | 25 (3.2) | 800 (25.8) | |
| Critical access hospital status, No. (%) | <0.001 | ||
| Critical access hospital | 376 (47.8) | 164 (5.3) | |
| Acute care hospital | 410 (52.2) | 2,941 (94.7) | |
| Quality Measure, Mean (SD)* | 2004 | 2008 | ||||
|---|---|---|---|---|---|---|
| Non‐Accredited | Accredited | P Value | Non‐Accredited | Accredited | P Value | |
| (n = 786) | (n = 3105) | (n = 950) | (n = 2,941) | |||
| ||||||
| AMI | ||||||
| Aspirin at admission | 87.1 (20.0) | 92.6 (9.4) | <0.001 | 88.6 (22.1) | 96.0 (8.6) | <0.001 |
| Aspirin at discharge | 81.2 (26.1) | 88.5 (14.9) | <0.001 | 87.8 (22.7) | 94.8 (10.1) | <0.001 |
| ACE inhibitor for LV dysfunction | 72.1 (33.4) | 76.7 (22.9) | 0.010 | 83.2 (30.5) | 92.1 (14.8) | <0.001 |
| Beta blocker at discharge | 78.2 (27.9) | 87.0 (16.2) | <0.001 | 87.4 (23.4) | 95.5 (9.9) | <0.001 |
| Smoking cessation advice | 59.6 (40.8) | 74.5 (29.9) | <0.001 | 87.2 (29.5) | 97.2 (11.3) | <0.001 |
| PCI received within 90 min | 60.3 (26.2) | 60.6 (23.8) | 0.946 | 70.1 (24.8) | 77.7 (19.2) | 0.006 |
| Thrombolytic agent within 30 min | 27.9 (35.5) | 32.1 (32.8) | 0.152 | 31.4 (40.7) | 43.7 (40.2) | 0.008 |
| Composite AMI score | 80.6 (20.3) | 87.7 (10.4) | <0.001 | 85.8 (20.0) | 94.6 (8.1) | <0.001 |
| Heart failure | ||||||
| Discharge instructions | 36.8 (32.3) | 49.7 (28.2) | <0.001 | 67.4 (29.6) | 82.3 (16.4) | <0.001 |
| Assessment of LV function | 63.3 (27.6) | 83.6 (14.9) | <0.001 | 79.6 (24.4) | 95.6 (8.1) | <0.001 |
| ACE inhibitor for LV dysfunction | 70.8 (27.6) | 75.7 (16.3) | <0.001 | 82.5 (22.7) | 91.5 (9.7) | <0.001 |
| Smoking cessation advice | 57.1 (36.4) | 68.6 (26.2) | <0.001 | 81.5 (29.9) | 96.1 (10.7) | <0.001 |
| Composite heart failure score | 56.3 (24.1) | 71.2 (15.6) | <0.001 | 75.4 (22.3) | 90.4 (9.4) | <0.001 |
| Pneumonia | ||||||
| Oxygenation assessment | 97.4 (7.3) | 98.4 (4.0) | <0.001 | 99.0 (3.2) | 99.7 (1.2) | <0.001 |
| Pneumococcal vaccination | 45.5 (29.0) | 48.7 (26.2) | 0.007 | 79.9 (21.3) | 87.9 (12.9) | <0.001 |
| Timing of initial antibiotic therapy | 80.6 (13.1) | 70.9 (14.0) | <0.001 | 93.4 (9.2) | 93.6 (6.1) | 0.525 |
| Smoking cessation advice | 56.6 (33.1) | 65.7 (24.8) | <0.001 | 81.6 (25.1) | 94.4 (11.4) | <0.001 |
| Initial antibiotic selection | 73.6 (19.6) | 74.1 (13.4) | 0.508 | 86.1 (13.8) | 88.6 (8.7) | <0.001 |
| Composite pneumonia score | 77.2 (10.2) | 76.6 (8.2) | 0.119 | 90.0 (9.6) | 93.6 (4.9) | <0.001 |
| Overall composite | 73.7 (10.6) | 78.0 (8.7) | <0.001 | 86.8 (11.1) | 93.3 (5.0) | <0.001 |
Five‐Year Changes in Hospital Performance
Between 2004 and 2008, Joint Commission‐accredited hospitals improved their performance more than did non‐accredited hospitals (Table 3). After adjustment for baseline characteristics previously shown to be associated with performance, the overall relative (absolute) difference in improvement was 26% (4.2%) (AMI score difference 67% [3.9%], CHF 48% [10.1%], and pneumonia 21% [3.7%]). Accredited hospitals improved their performance significantly more than non‐accredited for 13 of the 16 individual performance measures.
| Characteristic | Change in Performance* | Absolute Difference, Always vs Never (95% CI) | Relative Difference, % Always vs Never | P Value | |
|---|---|---|---|---|---|
| Never Accredited (n = 762) | Always Accredited (n = 2,917) | ||||
| |||||
| AMI | |||||
| Aspirin at admission | 1.1 | 2.0 | 3.2 (1.25.2) | 160 | 0.001 |
| Aspirin at discharge | 4.7 | 8.0 | 3.2 (1.45.1) | 40 | 0.008 |
| ACE inhibitor for LV dysfunction | 8.5 | 15.9 | 7.4 (3.711.5) | 47 | <0.001 |
| Beta blocker at discharge | 4.4 | 8.4 | 4.0 (2.06.0) | 48 | <0.001 |
| Smoking cessation advice | 18.6 | 22.4 | 3.7 (1.16.9) | 17 | 0.012 |
| PCI received within 90 min | 6.3 | 13.0 | 6.7 (0.314.2) | 52 | 0.070 |
| Thrombolytic agent within 30 min | 0.6 | 5.4 | 6.1 (9.520.4) | 113 | 0.421 |
| Composite AMI score | 2.0 | 5.8 | 3.9 (2.25.5) | 67 | <0.001 |
| Heart failure | |||||
| Discharge instructions | 24.2 | 35.6 | 11.4 (8.714.0) | 32 | <0.001 |
| Assessment of LV function | 4.6 | 12.8 | 8.3 (6.610.0) | 65 | <0.001 |
| ACE inhibitor for LV dysfunction | 10.1 | 15.2 | 5.1 (3.56.8) | 34 | <0.001 |
| Smoking cessation advice | 20.5 | 26.4 | 6.0 (3.38.7) | 23 | <0.001 |
| Composite heart failure score | 10.8 | 20.9 | 10.1 (8.312.0) | 48 | <0.001 |
| Pneumonia | |||||
| Oxygenation assessment | 0.9 | 1.4 | 0.6 (0.30.9) | 43 | <0.001 |
| Pneumococcal vaccination | 33.4 | 40.9 | 7.5 (5.69.4) | 18 | <0.001 |
| Timing of initial antibiotic therapy | 19.2 | 21.1 | 1.9 (1.12.7) | 9 | <0.001 |
| Smoking cessation advice | 21.8 | 27.9 | 6.0 (3.88.3) | 22 | <0.001 |
| Initial antibiotic selection | 13.6 | 14.3 | 0.7 (0.51.9) | 5 | 0.293 |
| Composite pneumonia score | 13.7 | 17.5 | 3.7 (2.84.6) | 21 | <0.001 |
| Overall composite | 12.0 | 16.1 | 4.2 (3.25.1) | 26 | <0.001 |
High Performing Hospitals in 2008
The likelihood that a hospital was a high performer in 2008 was significantly associated with Joint Commission accreditation status, with a higher proportion of accredited hospitals reaching the 90% threshold compared to never‐accredited hospitals (Table 4). Accredited hospitals attained the 90% threshold significantly more often for 13 of the 16 performance measures and all four summary scores, compared to non‐accredited hospitals. In 2008, 82% of Joint Commission‐accredited hospitals demonstrated greater than 90% on the overall summary score, compared to 48% of never‐accredited hospitals. Even after adjusting for differences among hospitals, including performance at baseline, Joint Commission‐accredited hospitals were more likely than never‐accredited hospitals to exceed 90% performance in 2008 (84% vs 69%).
| Characteristic | Percent of Hospitals with Performance Over 90% Adjusted (Actual) | Odds Ratio, Always vs Never (95% CI) | P Value | |
|---|---|---|---|---|
| Never Accredited (n = 762) | Always Accredited (n = 2,917) | |||
| ||||
| AMI | ||||
| Aspirin at admission | 91.8 (71.8) | 93.9 (90.7) | 1.38 (1.001.89) | 0.049 |
| Aspirin at discharge | 83.7 (69.2) | 88.2 (85.1) | 1.45 (1.081.94) | 0.013 |
| ACE inhibitor for LV dysfunction | 65.1 (65.8) | 77.2 (76.5) | 1.81 (1.322.50) | <0.001 |
| Beta blocker at discharge | 84.7 (69.4) | 90.9 (88.4) | 1.80 (1.332.44) | <0.001 |
| Smoking cessation advice | 91.1 (81.3) | 95.9 (94.1) | 2.29 (1.314.01) | 0.004 |
| PCI received within 90 min | 21.5 (16.2) | 29.9 (29.8) | 1.56 (0.713.40) | 0.265 |
| Thrombolytic agent within 30 min | 21.4 (21.3) | 22.7 (23.6) | 1.08 (0.422.74) | 0.879 |
| Composite AMI score | 80.5 (56.6) | 88.2 (85.9) | 1.82 (1.372.41) | <0.001 |
| Heart failure | ||||
| Discharge instructions | 27.0 (26.3) | 38.9 (39.3) | 1.72 (1.302.27) | <0.001 |
| Assessment of LV function | 76.2 (45.0) | 89.1 (88.8) | 2.54 (1.953.31) | <0.001 |
| ACE inhibitor for LV dysfunction | 58.0 (51.4) | 67.8 (68.5) | 1.52 (1.211.92) | <0.001 |
| Smoking cessation advice | 84.2 (62.3) | 90.3 (89.2) | 1.76 (1.282.43) | <0.001 |
| Composite heart failure score | 38.2 (27.6) | 61.5 (64.6) | 2.57 (2.033.26) | <0.001 |
| Pneumonia | ||||
| Oxygenation assessment | 100 (98.2) | 100 (99.8) | 4.38 (1.201.32) | 0.025 |
| Pneumococcal vaccination | 44.1 (40.3) | 57.3 (58.2) | 1.70 (1.362.12) | <0.001 |
| Timing of initial antibiotic therapy | 74.3 (79.1) | 84.2 (82.7) | 1.85 (1.402.46) | <0.001 |
| Smoking cessation advice | 76.2 (54.6) | 85.8 (84.2) | 1.89 (1.422.51) | <0.001 |
| Initial antibiotic selection | 51.8 (47.4) | 51.0 (51.8) | 0.97 (0.761.25) | 0.826 |
| Composite pneumonia score | 69.3 (59.4) | 85.3 (83.9) | 2.58 (2.013.31) | <0.001 |
| Overall composite | 69.0 (47.5) | 83.8 (82.0) | 2.32 (1.763.06) | <0.001 |
DISCUSSION
While accreditation has face validity and is desired by key stakeholders, it is expensive and time consuming. Stakeholders thus are justified in seeking evidence that accreditation is associated with better quality and safety. Ideally, not only would it be associated with better performance at a single point in time, it would also be associated with the pace of improvement over time.
Our study is the first, to our knowledge, to show the association of accreditation status with improvement in the trajectory of performance over a five‐year period. Taking advantage of the fact that the accreditation process changed substantially at about the same time that TJC and CMS began requiring public reporting of evidence‐based quality measures, we found that hospitals accredited by The Joint Commission had had larger improvements in hospital performance from 2004 to 2008 than non‐accredited hospitals, even though the former started with higher baseline performance levels. This accelerated improvement was broad‐based: Accredited hospitals were more likely to achieve superior performance (greater than 90% adherence to quality measures) in 2008 on 13 of 16 nationally standardized quality‐of‐care measures, three clinical area summary scores, and an overall score compared to hospitals that were not accredited. These results are consistent with other studies that have looked at both process and outcome measures and accreditation.912
It is important to note that the observed accreditation effect reflects a difference between hospitals that have elected to seek one particular self‐regulatory alternative to the more restrictive and extensive public regulatory or licensure requirements with those that have not.39 The non‐accredited hospitals that were included in this study are not considered to be sub‐standard hospitals. In fact, hospitals not accredited by The Joint Commission have also met the standards set by Medicare in the Conditions of Participation, and our study demonstrates that these hospitals achieved reasonably strong performance on publicly reported quality measures (86.8% adherence on the composite measure in 2008) and considerable improvement over the 5 years of public reporting (average improvement on composite measure from 2004 to 2008 of 11.8%). Moreover, there are many paths to improvement, and some non‐accredited hospitals achieve stellar performance on quality measures, perhaps by embracing other methods to catalyze improvement.
That said, our data demonstrate that, on average, accredited hospitals achieve superior performance on these evidence‐based quality measures, and their performance improved more strikingly over time. In interpreting these results, it is important to recognize that, while Joint Commission‐accredited hospitals must report quality data, performance on these measures is not directly factored into the accreditation decision; if this were not so, one could argue that this association is a statistical tautology. As it is, we believe that the 2 measures (accreditation and publicly reported quality measures) are two independent assessments of the quality of an organization, and, while the performance measures may not be a gold standard, a measure of their association does provide useful information about the degree to which accreditation is linked to organizational quality.
There are several potential limitations of the current study. First, while we adjusted for most of the known hospital demographic and organizational factors associated with performance, there may be unidentified factors that are associated with both accreditation and performance. This may not be relevant to a patient or payer choosing a hospital based on accreditation status (who may not care whether accreditation is simply associated with higher quality or actually helps produce such quality), but it is relevant to policy‐makers, who may weigh the value of embracing accreditation versus other maneuvers (such as pay for performance or new educational requirements) as a vehicle to promote high‐quality care.
A second limitation is that the specification of the measures can change over time due to the acquisition of new clinical knowledge, which makes longitudinal comparison and tracking of results over time difficult. There were two measures that had definitional changes that had noticeable impact on longitudinal trends: the AMI measure Primary Percutaneous Coronary Intervention (PCI) Received within 90 Minutes of Hospital Arrival (which in 2004 and 2005 used 120 minutes as the threshold), and the pneumonia measure Antibiotic Within 4 Hours of Arrival (which in 2007 changed the threshold to six hours). Other changes included adding angiotensin‐receptor blocker therapy (ARB) as an alternative to angiotensin‐converting enzyme inhibitor (ACEI) therapy in 2005 to the AMI and heart failure measures ACEI or ARB for left ventricular dysfunction. Other less significant changes have been made to the data collection methods for other measures, which could impact the interpretation of changes in performance over time. That said, these changes influenced both accredited and non‐accredited hospitals equally, and we cannot think of reasons that they would have created differential impacts.
Another limitation is that the 16 process measures provide a limited picture of hospital performance. Although the three conditions in the study account for over 15% of Medicare admissions,19 it is possible that non‐accredited hospitals performed as well as accredited hospitals on other measures of quality that were not captured by the 16 measures. As more standardized measures are added to The Joint Commission and CMS databases, it will be possible to use the same study methodology to incorporate these additional domains.
From the original cohort of 4798 hospitals reporting in 2004 or 2008, 19% were not included in the study due to missing data in either 2004 or 2008. Almost two‐thirds of the hospitals excluded from the study were missing 2004 data and, of these, 77% were critical access hospitals. The majority of these critical access hospitals (97%) were non‐accredited. This is in contrast to the hospitals missing 2008 data, of which only 13% were critical access. Since reporting of data to Hospital Compare was voluntary in 2004, it appears that critical access hospitals chose to wait later to report data to Hospital Compare, compared to acute care hospitals. Since critical access hospitals tended to have lower rates, smaller sample sizes, and be non‐accredited, the results of the study would be expected to slightly underestimate the difference between accredited and non‐accredited hospitals.
Finally, while we have argued that the publicly reported quality measures and TJC accreditation decisions provide different lenses into the quality of a given hospital, we cannot entirely exclude the possibility that there are subtle relationships between these two methods that might be partly responsible for our findings. For example, while performance measure rates do not factor directly into the accreditation decision, it is possible that Joint Commission surveyors may be influenced by their knowledge of these rates and biased in their scoring of unrelated standards during the survey process. While we cannot rule out such biases, we are aware of no research on the subject, and have no reason to believe that such biases may have confounded the analysis.
In summary, we found that Joint Commission‐accredited hospitals outperformed non‐accredited hospitals on nationally standardized quality measures of AMI, heart failure, and pneumonia. The performance gap between Joint Commission‐accredited and non‐accredited hospitals increased over the five years of the study. Future studies should incorporate more robust and varied measures of quality as outcomes, and seek to examine the nature of the observed relationship (ie, whether accreditation is simply a marker of higher quality and more rapid improvement, or the accreditation process actually helps create these salutary outcomes).
Acknowledgements
The authors thank Barbara Braun, PhD and Nicole Wineman, MPH, MBA for their literature review on the impact of accreditation, and Barbara Braun, PhD for her thoughtful review of the manuscript.
- The Joint Commission. Facts About Hospital Accreditation. Available at: http://www.jointcommission.org/assets/1/18/Hospital_Accreditation_1_31_11.pdf. Accessed on Feb 16, 2011.
- ,.Emergency Response Planning in Hospitals, United States: 2003–2004. Advance Data from Vital and Health Statistics; No. 391.Hattsville, MD:National Center for Health Statistics;2007.
- ,.Training for Terrorism‐Related Conditions in Hospitals, United States: 2003–2004. Advance Data from Vital and Health Statistics; No. 380.Hattsville, MD:National Center for Health Statistics;2006.
- ,,,.Hospital patient safety: characteristics of best‐performing hospitals.J Healthcare Manag.2007;52 (3):188–205.
- ,,.What is driving hospitals' patient‐safety efforts?Health Aff.2004;23(2):103–115.
- ,.The impact of trauma centre accreditation on patient outcome.Injury.2006;37(12):1166–1171.
- ,.Factors that influence staffing of outpatient substance abuse treatment programs.Psychiatr Serv.2005;56(8)934–939.
- ,.Changes in methadone treatment practices. Results from a national panel study, 1988–2000.JAMA.2002;288:850–856.
- ,,, et al.Quality of care for the treatment of acute medical conditions in US hospitals.Arch Intern Med.2006;166:2511–2517.
- ,,,.JCAHO accreditation and quality of care for acute myocardial infarction.Health Aff.2003;22(2):243–254.
- ,,, et al.Is JCAHO Accreditation Associated with Better Patient Outcomes in Rural Hospitals? Academy Health Annual Meeting; Boston, MA; June2005.
- .Hospital quality of care: the link between accreditation and mortality.J Clin Outcomes Manag.2003;10(9):473–480.
- , , . Structural versus outcome measures in hospitals: A comparison of Joint Commission and medicare outcome scores in hospitals. Qual Manage Health Care. 2002;10(2): 29–38.
- ,,,,.Medication errors observed in 36 health care facilities.Arch Intern Med.2002;162:1897–1903.
- ,,,,.Quality of care in accredited and non‐accredited ambulatory surgical centers.Jt Comm J Qual Patient Saf.2008;34(9):546–551.
- Joint Commission on Accreditation of Healthcare Organizations. Specification Manual for National Hospital Quality Measures 2009. Available at: http://www.jointcommission.org/PerformanceMeasurement/PerformanceMeasurement/Current+NHQM+Manual.htm. Accessed May 21,2009.
- Hospital Quality Alliance Homepage. Available at: http://www.hospitalqualityalliance.org/hospitalqualityalliance/index.html. Accessed May 6,2010
- ,,,,.Quality of care in U.S. hospitals as reflected by standardized measures, 2002–2004.N Engl J Med.2005;353(3):255–264.
- ,,,.Care in U.S. hospitals—the Hospital Quality Alliance Program.N Engl J Med.2005;353:265–274.
- Institute of Medicine, Committee on Quality Health Care in America.Crossing the Quality Chasm: A New Health System for the 21st Century.Washington, DC:The National Academy Press;2001.
- ,,.Does publicizing hospital performance stimulate quality improvement efforts?Health Aff.2003;22(2):84–94.
- ,,,.Performance of top ranked heart care hospitals on evidence‐based process measures.Circulation.2006;114:558–564.
- The Joint Commission Performance Measure Initiatives Homepage. Available at: http://www.jointcommission.org/PerformanceMeasurement/PerformanceMeasurement/default.htm. Accessed on July 27,2010.
- .Using health outcomes data to compare plans, networks and providers.Int J Qual Health Care.1998;10(6):477–483.
- .Process versus outcome indicators in the assessment of quality of health care.Int J Qual Health Care.2001;13:475–480.
- .Does paying for performance improve the quality of health care?Med Care Res Rev.2006;63(1):122S–125S.
- ,,, et al.Incremental survival benefit with adherence to standardized health failure core measures: a performance evaluation study of 2958 patients.J Card Fail.2008;14(2):95–102.
- ,,,.The inverse relationship between mortality rates and performance in the hospital quality alliance measures.Health Aff.2007;26(4):1104–1110.
- ,,, et al.Hospital quality for acute myocardial infarction: correlation among process measures and relationship with short‐term mortality.JAMA.2006:296(1):72–78.
- ,,,,.Assessing the reliability of standardized performance measures.Int J Qual Health Care.2006;18:246–255.
- Centers for Medicare and Medicaid Services (CMS). CMS HQI Demonstration Project‐Composite Quality Score Methodology Overview. Available at: http://www.cms.hhs.gov/HospitalQualityInits/downloads/HospitalCompositeQualityScoreMethodologyOverview.pdf. Accessed March 8,2010.
- ,,,.Assessing the accuracy of hospital performance measures.Med Decis Making.2007;27:9–20.
- Quality Check Data Download Website. Available at: http://www.healthcarequalitydata.org. Accessed May 21,2009.
- ,,.Hospital characteristics and mortality rates.N Engl J Med.1989;321(25):1720–1725.
- ,.United States rural hospital quality in the Hospital Compare Database—accounting for hospital characteristics.Health Policy.2008;87:112–127.
- ,,,,,.Characteristics of hospitals demonstrating superior performance in patient experience and clinical process measures of care.Med Care Res Rev.2010;67(1):38–55.
- ,,.Comparison of change in quality of care between safety‐net and non‐safety‐net hospitals.JAMA.2008;299(18):2180–2187.
- ,.Bootstrap Methods and Their Application.New York:Cambridge;1997:chap 6.
- ,,,.The role of accreditation in an era of market‐driven accountability.Am J Manag Care.2005;11(5):290–293.
The Joint Commission (TJC) currently accredits approximately 4546 acute care, critical access, and specialty hospitals,1 accounting for approximately 82% of U.S. hospitals (representing 92% of hospital beds). Hospitals seeking to earn and maintain accreditation undergo unannounced on‐site visits by a team of Joint Commission surveyors at least once every 3 years. These surveys address a variety of domains, including the environment of care, infection prevention and control, information management, adherence to a series of national patient safety goals, and leadership.1
The survey process has changed markedly in recent years. Since 2002, accredited hospitals have been required to continuously collect and submit selected performance measure data to The Joint Commission throughout the three‐year accreditation cycle. The tracer methodology, an evaluation method in which surveyors select a patient to follow through the organization in order to assess compliance with selected standards, was instituted in 2004. Soon thereafter, on‐site surveys went from announced to unannounced in 2006.
Despite the 50+ year history of hospital accreditation in the United States, there has been surprisingly little research on the link between accreditation status and measures of hospital quality (both processes and outcomes). It is only recently that a growing number of studies have attempted to examine this relationship. Empirical support for the relationship between accreditation and other quality measures is emerging. Accredited hospitals have been shown to provide better emergency response planning2 and training3 compared to non‐accredited hospitals. Accreditation has been observed to be a key predictor of patient safety system implementation4 and the primary driver of hospitals' patient‐safety initiatives.5 Accredited trauma centers have been associated with significant reductions in patient mortality,6 and accreditation has been linked to better compliance with evidence‐based methadone and substance abuse treatment.7, 8 Accredited hospitals have been shown to perform better on measures of hospital quality in acute myocardial infarction (AMI), heart failure, and pneumonia care.9, 10 Similarly, accreditation has been associated with lower risk‐adjusted in‐hospital mortality rates for congestive heart failure (CHF), stroke, and pneumonia.11, 12 The results of such research, however, have not always been consistent. Several studies have been unable to demonstrate a relationship between accreditation and quality measures. A study of financial and cost‐related outcome measures found no relationship to accreditation,13 and a study comparing medication error rates across different types of organizations found no relationship to accreditation status.14 Similarly, a comparison of accredited versus non‐accredited ambulatory surgical organizations found that patients were less likely to be hospitalized when treated at an accredited facility for colonoscopy procedures, but no such relationship was observed for the other 4 procedures studied.15
While the research to date has been generally supportive of the link between accreditation and other measures of health care quality, the studies were typically limited to only a few measures and/or involved relatively small samples of accredited and non‐accredited organizations. Over the last decade, however, changes in the performance measurement landscape have created previously unavailable opportunities to more robustly examine the relationship between accreditation and other indicators of hospital quality.
At about the same time that The Joint Commission's accreditation process was becoming more vigorous, the Centers for Medicare and Medicaid Services (CMS) began a program of publicly reporting quality data (
By using a population of hospitals and a range of standardized quality measures greater than those used in previous studies, we seek to address the following questions: Is Joint Commission accreditation status truly associated with higher quality care? And does accreditation status help identify hospitals that are more likely to improve their quality and safety over time?
METHODS
Performance Measures
Since July 2002, U.S. hospitals have been collecting data on standardized measures of quality developed by The Joint Commission and CMS. These measures have been endorsed by the National Quality Forum16 and adopted by the Hospital Quality Alliance.17 The first peer‐reviewed reports using The Joint Commission/CMS measure data confirmed that the measures could successfully monitor and track hospital improvement and identify disparities in performance,18, 19 as called for by the Institute of Medicine's (IOM) landmark 2001 report, Crossing the Quality Chasm.20
In order to promote transparency in health care, both CMSthrough the efforts of the Hospital Quality Allianceand The Joint Commission began publicly reporting measure rates in 2004 using identical measure and data element specifications. It is important to note that during the five‐year span covered by this study, both The Joint Commission and CMS emphasized the reporting of performance measure data. While performance improvement has been the clear objective of these efforts, neither organization established targets for measure rates or set benchmarks for performance improvement. Similarly, while Joint Commission‐accredited hospitals were required to submit performance measure data as a condition of accreditation, their actual performance on the measure rates did not factor into the accreditation decision. In the absence of such direct leverage, it is interesting to note that several studies have demonstrated the positive impact of public reporting on hospital performance,21 and on providing useful information to the general public and health care professionals regarding hospital quality.22
The 16 measures used in this study address hospital compliance with evidence‐based processes of care recommended by the clinical treatment guidelines of respected professional societies.23 Process of care measures are particularly well suited for quality improvement purposes, as they can identify deficiencies which can be immediately addressed by hospitals and do not require risk‐adjustment, as opposed to outcome measures, which do not necessarily directly identify obvious performance improvement opportunities.2426 The measures were also implemented in sets in order to provide hospitals with a more complete portrayal of quality than might be provided using unrelated individual measures. Research has demonstrated that greater collective performance on these process measures is associated with improved one‐year survival after heart failure hospitalization27 and inpatient mortality for those Medicare patients discharged with acute myocardial infarction, heart failure, and pneumonia,28 while other research has shown little association with short‐term outcomes.29
Using the Specifications Manual for National Hospital Inpatient Quality Measures,16 hospitals identify the initial measure populations through International Classification of Diseases (ICD‐CM‐9) codes and patient age obtained through administrative data. Trained abstractors then collect the data for measure‐specific data elements through medical record review on the identified measure population or a sample of this population. Measure algorithms then identify patients in the numerator and denominator of each measure.
Process measure rates reflect the number of times a hospital treated a patient in a manner consistent with specific evidence‐based clinical practice guidelines (numerator cases), divided by the number of patients who were eligible to receive such care (denominator cases). Because precise measure specifications permit the exclusion of patients contraindicated to receive the specific process of care for the measure, ideal performance should be characterized by measure rates that approach 100% (although rare or unpredictable situations, and the reality that no measure is perfect in its design, make consistent performance at 100% improbable). Accuracy of the measure data, as measured by data element agreement rates on reabstraction, has been reported to exceed 90%.30
In addition to the individual performance measures, hospital performance was assessed using 3 condition‐specific summary scores, one for each of the 3 clinical areas: acute myocardial infarction, heart failure, and pneumonia. The summary scores are a weighted average of the individual measure rates in the clinical area, where the weights are the sample sizes for each of the measures.31 A summary score was also calculated based on all 16 measures as a summary measure of overall compliance with recommended care.
One way of studying performance measurement in a way that relates to standards is to evaluate whether a hospital achieves a high rate of performance, where high is defined as a performance rate of 90% or more. In this context, measures were created from each of the 2004 and 2008 hospital performance rates by dichotomizing them as being either less than 90%, or greater than or equal to 90%.32
Data Sources
The data for the measures included in the study are available on the CMS Hospital Compare public databases or The Joint Commission for discharges in 2004 and 2008.33 These 16 measures, active for all 5 years of the study period, include: 7 measures related to acute myocardial infarction care; 4 measures related to heart failure care; and 5 measures related to pneumonia care. The majority of the performance data for the study were obtained from the yearly CMS Hospital Compare public download databases (
Hospital Characteristics
We then linked the CMS performance data, augmented by The Joint Commission performance data when necessary, to hospital characteristics data in the American Hospital Association (AHA) Annual Survey with respect to profit status, number of beds (<100 beds, 100299 beds, 300+ beds), rural status, geographic region, and whether or not the hospital was a critical access hospital. (Teaching status, although available in the AHA database, was not used in the analysis, as almost all teaching hospitals are Joint Commission accredited.) These characteristics were chosen since previous research has identified them as being associated with hospital quality.9, 19, 3437 Data on accreditation status were obtained from The Joint Commission's hospital accreditation database. Hospitals were grouped into 3 hospital accreditation strata based on longitudinal hospital accreditation status between 2004 and 2008: 1) hospitals not accredited in the study period; 2) hospitals accredited between one to four years; and 3) hospitals accredited for the entire study period. Analyses of this middle group (those hospitals accredited for part of the study period; n = 212, 5.4% of the whole sample) led to no significant change in our findings (their performance tended to be midway between always accredited and never‐accredited hospitals) and are thus omitted from our results. Instead, we present only hospitals who were never accredited (n = 762) and those who were accredited through the entire study period (n = 2917).
Statistical Analysis
We assessed the relationship between hospital characteristics and 2004 performance of Joint Commission‐accredited hospitals with hospitals that were not Joint Commission accredited using 2 tests for categorical variables and t tests for continuous variables. Linear regression was used to estimate the five‐year change in performance at each hospital as a function of accreditation group, controlling for hospital characteristics. Baseline hospital performance was also included in the regression models to control for ceiling effects for those hospitals with high baseline performance. To summarize the results, we used the regression models to calculate adjusted change in performance for each accreditation group, and calculated a 95% confidence interval and P value for the difference between the adjusted change scores, using bootstrap methods.38
Next we analyzed the association between accreditation and the likelihood of high 2008 hospital performance by dichotomizing the hospital rates, using a 90% cut point, and using logistic regression to estimate the probability of high performance as a function of accreditation group, controlling for hospital characteristics and baseline hospital performance. The logistic models were then used to calculate adjusted rates of high performance for each accreditation group in presenting the results.
We used two‐sided tests for significance; P < 0.05 was considered statistically significant. This study had no external funding source.
RESULTS
For the 16 individual measures used in this study, a total of 4798 hospitals participated in Hospital Compare or reported data to The Joint Commission in 2004 or 2008. Of these, 907 were excluded because the performance data were not available for either 2004 (576 hospitals) or 2008 (331 hospitals) resulting in a missing value for the change in performance score. Therefore, 3891 hospitals (81%) were included in the final analyses. The 907 excluded hospitals were more likely to be rural (50.8% vs 17.5%), be critical access hospitals (53.9% vs 13.9%), have less than 100 beds (77.4% vs 37.6%), be government owned (34.6% vs 22.1%), be for profit (61.4% vs 49.5%), or be unaccredited (79.8% vs 45.8% in 2004; 75.6% vs 12.8% in 2008), compared with the included hospitals (P < 0.001 for all comparisons).
Hospital Performance at Baseline
Joint Commission‐accredited hospitals were more likely to be large, for profit, or urban, and less likely to be government owned, from the Midwest, or critical access (Table 1). Non‐accredited hospitals performed more poorly than accredited hospitals on most of the publicly reported measures in 2004; the only exception is the timing of initial antibiotic therapy measure for pneumonia (Table 2).
| Characteristic | Non‐Accredited (n = 786) | Accredited (n = 3105) | P Value* |
|---|---|---|---|
| |||
| Profit status, No. (%) | <0.001 | ||
| For profit | 60 (7.6) | 586 (18.9) | |
| Government | 289 (36.8) | 569 (18.3) | |
| Not for profit | 437 (55.6) | 1,950 (62.8) | |
| Census region, No. (%) | <0.001 | ||
| Northeast | 72 (9.2) | 497 (16.0) | |
| Midwest | 345 (43.9) | 716 (23.1) | |
| South | 248 (31.6) | 1,291 (41.6) | |
| West | 121 (15.4) | 601 (19.4) | |
| Rural setting, No. (%) | <0.001 | ||
| Rural | 495 (63.0) | 833 (26.8) | |
| Urban | 291 (37.0) | 2,272 (73.2) | |
| Bed size | <0.001 | ||
| <100 beds | 603 (76.7) | 861 (27.7) | |
| 100299 beds | 158 (20.1) | 1,444 (46.5) | |
| 300+ beds | 25 (3.2) | 800 (25.8) | |
| Critical access hospital status, No. (%) | <0.001 | ||
| Critical access hospital | 376 (47.8) | 164 (5.3) | |
| Acute care hospital | 410 (52.2) | 2,941 (94.7) | |
| Quality Measure, Mean (SD)* | 2004 | 2008 | ||||
|---|---|---|---|---|---|---|
| Non‐Accredited | Accredited | P Value | Non‐Accredited | Accredited | P Value | |
| (n = 786) | (n = 3105) | (n = 950) | (n = 2,941) | |||
| ||||||
| AMI | ||||||
| Aspirin at admission | 87.1 (20.0) | 92.6 (9.4) | <0.001 | 88.6 (22.1) | 96.0 (8.6) | <0.001 |
| Aspirin at discharge | 81.2 (26.1) | 88.5 (14.9) | <0.001 | 87.8 (22.7) | 94.8 (10.1) | <0.001 |
| ACE inhibitor for LV dysfunction | 72.1 (33.4) | 76.7 (22.9) | 0.010 | 83.2 (30.5) | 92.1 (14.8) | <0.001 |
| Beta blocker at discharge | 78.2 (27.9) | 87.0 (16.2) | <0.001 | 87.4 (23.4) | 95.5 (9.9) | <0.001 |
| Smoking cessation advice | 59.6 (40.8) | 74.5 (29.9) | <0.001 | 87.2 (29.5) | 97.2 (11.3) | <0.001 |
| PCI received within 90 min | 60.3 (26.2) | 60.6 (23.8) | 0.946 | 70.1 (24.8) | 77.7 (19.2) | 0.006 |
| Thrombolytic agent within 30 min | 27.9 (35.5) | 32.1 (32.8) | 0.152 | 31.4 (40.7) | 43.7 (40.2) | 0.008 |
| Composite AMI score | 80.6 (20.3) | 87.7 (10.4) | <0.001 | 85.8 (20.0) | 94.6 (8.1) | <0.001 |
| Heart failure | ||||||
| Discharge instructions | 36.8 (32.3) | 49.7 (28.2) | <0.001 | 67.4 (29.6) | 82.3 (16.4) | <0.001 |
| Assessment of LV function | 63.3 (27.6) | 83.6 (14.9) | <0.001 | 79.6 (24.4) | 95.6 (8.1) | <0.001 |
| ACE inhibitor for LV dysfunction | 70.8 (27.6) | 75.7 (16.3) | <0.001 | 82.5 (22.7) | 91.5 (9.7) | <0.001 |
| Smoking cessation advice | 57.1 (36.4) | 68.6 (26.2) | <0.001 | 81.5 (29.9) | 96.1 (10.7) | <0.001 |
| Composite heart failure score | 56.3 (24.1) | 71.2 (15.6) | <0.001 | 75.4 (22.3) | 90.4 (9.4) | <0.001 |
| Pneumonia | ||||||
| Oxygenation assessment | 97.4 (7.3) | 98.4 (4.0) | <0.001 | 99.0 (3.2) | 99.7 (1.2) | <0.001 |
| Pneumococcal vaccination | 45.5 (29.0) | 48.7 (26.2) | 0.007 | 79.9 (21.3) | 87.9 (12.9) | <0.001 |
| Timing of initial antibiotic therapy | 80.6 (13.1) | 70.9 (14.0) | <0.001 | 93.4 (9.2) | 93.6 (6.1) | 0.525 |
| Smoking cessation advice | 56.6 (33.1) | 65.7 (24.8) | <0.001 | 81.6 (25.1) | 94.4 (11.4) | <0.001 |
| Initial antibiotic selection | 73.6 (19.6) | 74.1 (13.4) | 0.508 | 86.1 (13.8) | 88.6 (8.7) | <0.001 |
| Composite pneumonia score | 77.2 (10.2) | 76.6 (8.2) | 0.119 | 90.0 (9.6) | 93.6 (4.9) | <0.001 |
| Overall composite | 73.7 (10.6) | 78.0 (8.7) | <0.001 | 86.8 (11.1) | 93.3 (5.0) | <0.001 |
Five‐Year Changes in Hospital Performance
Between 2004 and 2008, Joint Commission‐accredited hospitals improved their performance more than did non‐accredited hospitals (Table 3). After adjustment for baseline characteristics previously shown to be associated with performance, the overall relative (absolute) difference in improvement was 26% (4.2%) (AMI score difference 67% [3.9%], CHF 48% [10.1%], and pneumonia 21% [3.7%]). Accredited hospitals improved their performance significantly more than non‐accredited for 13 of the 16 individual performance measures.
| Characteristic | Change in Performance* | Absolute Difference, Always vs Never (95% CI) | Relative Difference, % Always vs Never | P Value | |
|---|---|---|---|---|---|
| Never Accredited (n = 762) | Always Accredited (n = 2,917) | ||||
| |||||
| AMI | |||||
| Aspirin at admission | 1.1 | 2.0 | 3.2 (1.25.2) | 160 | 0.001 |
| Aspirin at discharge | 4.7 | 8.0 | 3.2 (1.45.1) | 40 | 0.008 |
| ACE inhibitor for LV dysfunction | 8.5 | 15.9 | 7.4 (3.711.5) | 47 | <0.001 |
| Beta blocker at discharge | 4.4 | 8.4 | 4.0 (2.06.0) | 48 | <0.001 |
| Smoking cessation advice | 18.6 | 22.4 | 3.7 (1.16.9) | 17 | 0.012 |
| PCI received within 90 min | 6.3 | 13.0 | 6.7 (0.314.2) | 52 | 0.070 |
| Thrombolytic agent within 30 min | 0.6 | 5.4 | 6.1 (9.520.4) | 113 | 0.421 |
| Composite AMI score | 2.0 | 5.8 | 3.9 (2.25.5) | 67 | <0.001 |
| Heart failure | |||||
| Discharge instructions | 24.2 | 35.6 | 11.4 (8.714.0) | 32 | <0.001 |
| Assessment of LV function | 4.6 | 12.8 | 8.3 (6.610.0) | 65 | <0.001 |
| ACE inhibitor for LV dysfunction | 10.1 | 15.2 | 5.1 (3.56.8) | 34 | <0.001 |
| Smoking cessation advice | 20.5 | 26.4 | 6.0 (3.38.7) | 23 | <0.001 |
| Composite heart failure score | 10.8 | 20.9 | 10.1 (8.312.0) | 48 | <0.001 |
| Pneumonia | |||||
| Oxygenation assessment | 0.9 | 1.4 | 0.6 (0.30.9) | 43 | <0.001 |
| Pneumococcal vaccination | 33.4 | 40.9 | 7.5 (5.69.4) | 18 | <0.001 |
| Timing of initial antibiotic therapy | 19.2 | 21.1 | 1.9 (1.12.7) | 9 | <0.001 |
| Smoking cessation advice | 21.8 | 27.9 | 6.0 (3.88.3) | 22 | <0.001 |
| Initial antibiotic selection | 13.6 | 14.3 | 0.7 (0.51.9) | 5 | 0.293 |
| Composite pneumonia score | 13.7 | 17.5 | 3.7 (2.84.6) | 21 | <0.001 |
| Overall composite | 12.0 | 16.1 | 4.2 (3.25.1) | 26 | <0.001 |
High Performing Hospitals in 2008
The likelihood that a hospital was a high performer in 2008 was significantly associated with Joint Commission accreditation status, with a higher proportion of accredited hospitals reaching the 90% threshold compared to never‐accredited hospitals (Table 4). Accredited hospitals attained the 90% threshold significantly more often for 13 of the 16 performance measures and all four summary scores, compared to non‐accredited hospitals. In 2008, 82% of Joint Commission‐accredited hospitals demonstrated greater than 90% on the overall summary score, compared to 48% of never‐accredited hospitals. Even after adjusting for differences among hospitals, including performance at baseline, Joint Commission‐accredited hospitals were more likely than never‐accredited hospitals to exceed 90% performance in 2008 (84% vs 69%).
| Characteristic | Percent of Hospitals with Performance Over 90% Adjusted (Actual) | Odds Ratio, Always vs Never (95% CI) | P Value | |
|---|---|---|---|---|
| Never Accredited (n = 762) | Always Accredited (n = 2,917) | |||
| ||||
| AMI | ||||
| Aspirin at admission | 91.8 (71.8) | 93.9 (90.7) | 1.38 (1.001.89) | 0.049 |
| Aspirin at discharge | 83.7 (69.2) | 88.2 (85.1) | 1.45 (1.081.94) | 0.013 |
| ACE inhibitor for LV dysfunction | 65.1 (65.8) | 77.2 (76.5) | 1.81 (1.322.50) | <0.001 |
| Beta blocker at discharge | 84.7 (69.4) | 90.9 (88.4) | 1.80 (1.332.44) | <0.001 |
| Smoking cessation advice | 91.1 (81.3) | 95.9 (94.1) | 2.29 (1.314.01) | 0.004 |
| PCI received within 90 min | 21.5 (16.2) | 29.9 (29.8) | 1.56 (0.713.40) | 0.265 |
| Thrombolytic agent within 30 min | 21.4 (21.3) | 22.7 (23.6) | 1.08 (0.422.74) | 0.879 |
| Composite AMI score | 80.5 (56.6) | 88.2 (85.9) | 1.82 (1.372.41) | <0.001 |
| Heart failure | ||||
| Discharge instructions | 27.0 (26.3) | 38.9 (39.3) | 1.72 (1.302.27) | <0.001 |
| Assessment of LV function | 76.2 (45.0) | 89.1 (88.8) | 2.54 (1.953.31) | <0.001 |
| ACE inhibitor for LV dysfunction | 58.0 (51.4) | 67.8 (68.5) | 1.52 (1.211.92) | <0.001 |
| Smoking cessation advice | 84.2 (62.3) | 90.3 (89.2) | 1.76 (1.282.43) | <0.001 |
| Composite heart failure score | 38.2 (27.6) | 61.5 (64.6) | 2.57 (2.033.26) | <0.001 |
| Pneumonia | ||||
| Oxygenation assessment | 100 (98.2) | 100 (99.8) | 4.38 (1.201.32) | 0.025 |
| Pneumococcal vaccination | 44.1 (40.3) | 57.3 (58.2) | 1.70 (1.362.12) | <0.001 |
| Timing of initial antibiotic therapy | 74.3 (79.1) | 84.2 (82.7) | 1.85 (1.402.46) | <0.001 |
| Smoking cessation advice | 76.2 (54.6) | 85.8 (84.2) | 1.89 (1.422.51) | <0.001 |
| Initial antibiotic selection | 51.8 (47.4) | 51.0 (51.8) | 0.97 (0.761.25) | 0.826 |
| Composite pneumonia score | 69.3 (59.4) | 85.3 (83.9) | 2.58 (2.013.31) | <0.001 |
| Overall composite | 69.0 (47.5) | 83.8 (82.0) | 2.32 (1.763.06) | <0.001 |
DISCUSSION
While accreditation has face validity and is desired by key stakeholders, it is expensive and time consuming. Stakeholders thus are justified in seeking evidence that accreditation is associated with better quality and safety. Ideally, not only would it be associated with better performance at a single point in time, it would also be associated with the pace of improvement over time.
Our study is the first, to our knowledge, to show the association of accreditation status with improvement in the trajectory of performance over a five‐year period. Taking advantage of the fact that the accreditation process changed substantially at about the same time that TJC and CMS began requiring public reporting of evidence‐based quality measures, we found that hospitals accredited by The Joint Commission had had larger improvements in hospital performance from 2004 to 2008 than non‐accredited hospitals, even though the former started with higher baseline performance levels. This accelerated improvement was broad‐based: Accredited hospitals were more likely to achieve superior performance (greater than 90% adherence to quality measures) in 2008 on 13 of 16 nationally standardized quality‐of‐care measures, three clinical area summary scores, and an overall score compared to hospitals that were not accredited. These results are consistent with other studies that have looked at both process and outcome measures and accreditation.912
It is important to note that the observed accreditation effect reflects a difference between hospitals that have elected to seek one particular self‐regulatory alternative to the more restrictive and extensive public regulatory or licensure requirements with those that have not.39 The non‐accredited hospitals that were included in this study are not considered to be sub‐standard hospitals. In fact, hospitals not accredited by The Joint Commission have also met the standards set by Medicare in the Conditions of Participation, and our study demonstrates that these hospitals achieved reasonably strong performance on publicly reported quality measures (86.8% adherence on the composite measure in 2008) and considerable improvement over the 5 years of public reporting (average improvement on composite measure from 2004 to 2008 of 11.8%). Moreover, there are many paths to improvement, and some non‐accredited hospitals achieve stellar performance on quality measures, perhaps by embracing other methods to catalyze improvement.
That said, our data demonstrate that, on average, accredited hospitals achieve superior performance on these evidence‐based quality measures, and their performance improved more strikingly over time. In interpreting these results, it is important to recognize that, while Joint Commission‐accredited hospitals must report quality data, performance on these measures is not directly factored into the accreditation decision; if this were not so, one could argue that this association is a statistical tautology. As it is, we believe that the 2 measures (accreditation and publicly reported quality measures) are two independent assessments of the quality of an organization, and, while the performance measures may not be a gold standard, a measure of their association does provide useful information about the degree to which accreditation is linked to organizational quality.
There are several potential limitations of the current study. First, while we adjusted for most of the known hospital demographic and organizational factors associated with performance, there may be unidentified factors that are associated with both accreditation and performance. This may not be relevant to a patient or payer choosing a hospital based on accreditation status (who may not care whether accreditation is simply associated with higher quality or actually helps produce such quality), but it is relevant to policy‐makers, who may weigh the value of embracing accreditation versus other maneuvers (such as pay for performance or new educational requirements) as a vehicle to promote high‐quality care.
A second limitation is that the specification of the measures can change over time due to the acquisition of new clinical knowledge, which makes longitudinal comparison and tracking of results over time difficult. There were two measures that had definitional changes that had noticeable impact on longitudinal trends: the AMI measure Primary Percutaneous Coronary Intervention (PCI) Received within 90 Minutes of Hospital Arrival (which in 2004 and 2005 used 120 minutes as the threshold), and the pneumonia measure Antibiotic Within 4 Hours of Arrival (which in 2007 changed the threshold to six hours). Other changes included adding angiotensin‐receptor blocker therapy (ARB) as an alternative to angiotensin‐converting enzyme inhibitor (ACEI) therapy in 2005 to the AMI and heart failure measures ACEI or ARB for left ventricular dysfunction. Other less significant changes have been made to the data collection methods for other measures, which could impact the interpretation of changes in performance over time. That said, these changes influenced both accredited and non‐accredited hospitals equally, and we cannot think of reasons that they would have created differential impacts.
Another limitation is that the 16 process measures provide a limited picture of hospital performance. Although the three conditions in the study account for over 15% of Medicare admissions,19 it is possible that non‐accredited hospitals performed as well as accredited hospitals on other measures of quality that were not captured by the 16 measures. As more standardized measures are added to The Joint Commission and CMS databases, it will be possible to use the same study methodology to incorporate these additional domains.
From the original cohort of 4798 hospitals reporting in 2004 or 2008, 19% were not included in the study due to missing data in either 2004 or 2008. Almost two‐thirds of the hospitals excluded from the study were missing 2004 data and, of these, 77% were critical access hospitals. The majority of these critical access hospitals (97%) were non‐accredited. This is in contrast to the hospitals missing 2008 data, of which only 13% were critical access. Since reporting of data to Hospital Compare was voluntary in 2004, it appears that critical access hospitals chose to wait later to report data to Hospital Compare, compared to acute care hospitals. Since critical access hospitals tended to have lower rates, smaller sample sizes, and be non‐accredited, the results of the study would be expected to slightly underestimate the difference between accredited and non‐accredited hospitals.
Finally, while we have argued that the publicly reported quality measures and TJC accreditation decisions provide different lenses into the quality of a given hospital, we cannot entirely exclude the possibility that there are subtle relationships between these two methods that might be partly responsible for our findings. For example, while performance measure rates do not factor directly into the accreditation decision, it is possible that Joint Commission surveyors may be influenced by their knowledge of these rates and biased in their scoring of unrelated standards during the survey process. While we cannot rule out such biases, we are aware of no research on the subject, and have no reason to believe that such biases may have confounded the analysis.
In summary, we found that Joint Commission‐accredited hospitals outperformed non‐accredited hospitals on nationally standardized quality measures of AMI, heart failure, and pneumonia. The performance gap between Joint Commission‐accredited and non‐accredited hospitals increased over the five years of the study. Future studies should incorporate more robust and varied measures of quality as outcomes, and seek to examine the nature of the observed relationship (ie, whether accreditation is simply a marker of higher quality and more rapid improvement, or the accreditation process actually helps create these salutary outcomes).
Acknowledgements
The authors thank Barbara Braun, PhD and Nicole Wineman, MPH, MBA for their literature review on the impact of accreditation, and Barbara Braun, PhD for her thoughtful review of the manuscript.
The Joint Commission (TJC) currently accredits approximately 4546 acute care, critical access, and specialty hospitals,1 accounting for approximately 82% of U.S. hospitals (representing 92% of hospital beds). Hospitals seeking to earn and maintain accreditation undergo unannounced on‐site visits by a team of Joint Commission surveyors at least once every 3 years. These surveys address a variety of domains, including the environment of care, infection prevention and control, information management, adherence to a series of national patient safety goals, and leadership.1
The survey process has changed markedly in recent years. Since 2002, accredited hospitals have been required to continuously collect and submit selected performance measure data to The Joint Commission throughout the three‐year accreditation cycle. The tracer methodology, an evaluation method in which surveyors select a patient to follow through the organization in order to assess compliance with selected standards, was instituted in 2004. Soon thereafter, on‐site surveys went from announced to unannounced in 2006.
Despite the 50+ year history of hospital accreditation in the United States, there has been surprisingly little research on the link between accreditation status and measures of hospital quality (both processes and outcomes). It is only recently that a growing number of studies have attempted to examine this relationship. Empirical support for the relationship between accreditation and other quality measures is emerging. Accredited hospitals have been shown to provide better emergency response planning2 and training3 compared to non‐accredited hospitals. Accreditation has been observed to be a key predictor of patient safety system implementation4 and the primary driver of hospitals' patient‐safety initiatives.5 Accredited trauma centers have been associated with significant reductions in patient mortality,6 and accreditation has been linked to better compliance with evidence‐based methadone and substance abuse treatment.7, 8 Accredited hospitals have been shown to perform better on measures of hospital quality in acute myocardial infarction (AMI), heart failure, and pneumonia care.9, 10 Similarly, accreditation has been associated with lower risk‐adjusted in‐hospital mortality rates for congestive heart failure (CHF), stroke, and pneumonia.11, 12 The results of such research, however, have not always been consistent. Several studies have been unable to demonstrate a relationship between accreditation and quality measures. A study of financial and cost‐related outcome measures found no relationship to accreditation,13 and a study comparing medication error rates across different types of organizations found no relationship to accreditation status.14 Similarly, a comparison of accredited versus non‐accredited ambulatory surgical organizations found that patients were less likely to be hospitalized when treated at an accredited facility for colonoscopy procedures, but no such relationship was observed for the other 4 procedures studied.15
While the research to date has been generally supportive of the link between accreditation and other measures of health care quality, the studies were typically limited to only a few measures and/or involved relatively small samples of accredited and non‐accredited organizations. Over the last decade, however, changes in the performance measurement landscape have created previously unavailable opportunities to more robustly examine the relationship between accreditation and other indicators of hospital quality.
At about the same time that The Joint Commission's accreditation process was becoming more vigorous, the Centers for Medicare and Medicaid Services (CMS) began a program of publicly reporting quality data (
By using a population of hospitals and a range of standardized quality measures greater than those used in previous studies, we seek to address the following questions: Is Joint Commission accreditation status truly associated with higher quality care? And does accreditation status help identify hospitals that are more likely to improve their quality and safety over time?
METHODS
Performance Measures
Since July 2002, U.S. hospitals have been collecting data on standardized measures of quality developed by The Joint Commission and CMS. These measures have been endorsed by the National Quality Forum16 and adopted by the Hospital Quality Alliance.17 The first peer‐reviewed reports using The Joint Commission/CMS measure data confirmed that the measures could successfully monitor and track hospital improvement and identify disparities in performance,18, 19 as called for by the Institute of Medicine's (IOM) landmark 2001 report, Crossing the Quality Chasm.20
In order to promote transparency in health care, both CMSthrough the efforts of the Hospital Quality Allianceand The Joint Commission began publicly reporting measure rates in 2004 using identical measure and data element specifications. It is important to note that during the five‐year span covered by this study, both The Joint Commission and CMS emphasized the reporting of performance measure data. While performance improvement has been the clear objective of these efforts, neither organization established targets for measure rates or set benchmarks for performance improvement. Similarly, while Joint Commission‐accredited hospitals were required to submit performance measure data as a condition of accreditation, their actual performance on the measure rates did not factor into the accreditation decision. In the absence of such direct leverage, it is interesting to note that several studies have demonstrated the positive impact of public reporting on hospital performance,21 and on providing useful information to the general public and health care professionals regarding hospital quality.22
The 16 measures used in this study address hospital compliance with evidence‐based processes of care recommended by the clinical treatment guidelines of respected professional societies.23 Process of care measures are particularly well suited for quality improvement purposes, as they can identify deficiencies which can be immediately addressed by hospitals and do not require risk‐adjustment, as opposed to outcome measures, which do not necessarily directly identify obvious performance improvement opportunities.2426 The measures were also implemented in sets in order to provide hospitals with a more complete portrayal of quality than might be provided using unrelated individual measures. Research has demonstrated that greater collective performance on these process measures is associated with improved one‐year survival after heart failure hospitalization27 and inpatient mortality for those Medicare patients discharged with acute myocardial infarction, heart failure, and pneumonia,28 while other research has shown little association with short‐term outcomes.29
Using the Specifications Manual for National Hospital Inpatient Quality Measures,16 hospitals identify the initial measure populations through International Classification of Diseases (ICD‐CM‐9) codes and patient age obtained through administrative data. Trained abstractors then collect the data for measure‐specific data elements through medical record review on the identified measure population or a sample of this population. Measure algorithms then identify patients in the numerator and denominator of each measure.
Process measure rates reflect the number of times a hospital treated a patient in a manner consistent with specific evidence‐based clinical practice guidelines (numerator cases), divided by the number of patients who were eligible to receive such care (denominator cases). Because precise measure specifications permit the exclusion of patients contraindicated to receive the specific process of care for the measure, ideal performance should be characterized by measure rates that approach 100% (although rare or unpredictable situations, and the reality that no measure is perfect in its design, make consistent performance at 100% improbable). Accuracy of the measure data, as measured by data element agreement rates on reabstraction, has been reported to exceed 90%.30
In addition to the individual performance measures, hospital performance was assessed using 3 condition‐specific summary scores, one for each of the 3 clinical areas: acute myocardial infarction, heart failure, and pneumonia. The summary scores are a weighted average of the individual measure rates in the clinical area, where the weights are the sample sizes for each of the measures.31 A summary score was also calculated based on all 16 measures as a summary measure of overall compliance with recommended care.
One way of studying performance measurement in a way that relates to standards is to evaluate whether a hospital achieves a high rate of performance, where high is defined as a performance rate of 90% or more. In this context, measures were created from each of the 2004 and 2008 hospital performance rates by dichotomizing them as being either less than 90%, or greater than or equal to 90%.32
Data Sources
The data for the measures included in the study are available on the CMS Hospital Compare public databases or The Joint Commission for discharges in 2004 and 2008.33 These 16 measures, active for all 5 years of the study period, include: 7 measures related to acute myocardial infarction care; 4 measures related to heart failure care; and 5 measures related to pneumonia care. The majority of the performance data for the study were obtained from the yearly CMS Hospital Compare public download databases (
Hospital Characteristics
We then linked the CMS performance data, augmented by The Joint Commission performance data when necessary, to hospital characteristics data in the American Hospital Association (AHA) Annual Survey with respect to profit status, number of beds (<100 beds, 100299 beds, 300+ beds), rural status, geographic region, and whether or not the hospital was a critical access hospital. (Teaching status, although available in the AHA database, was not used in the analysis, as almost all teaching hospitals are Joint Commission accredited.) These characteristics were chosen since previous research has identified them as being associated with hospital quality.9, 19, 3437 Data on accreditation status were obtained from The Joint Commission's hospital accreditation database. Hospitals were grouped into 3 hospital accreditation strata based on longitudinal hospital accreditation status between 2004 and 2008: 1) hospitals not accredited in the study period; 2) hospitals accredited between one to four years; and 3) hospitals accredited for the entire study period. Analyses of this middle group (those hospitals accredited for part of the study period; n = 212, 5.4% of the whole sample) led to no significant change in our findings (their performance tended to be midway between always accredited and never‐accredited hospitals) and are thus omitted from our results. Instead, we present only hospitals who were never accredited (n = 762) and those who were accredited through the entire study period (n = 2917).
Statistical Analysis
We assessed the relationship between hospital characteristics and 2004 performance of Joint Commission‐accredited hospitals with hospitals that were not Joint Commission accredited using 2 tests for categorical variables and t tests for continuous variables. Linear regression was used to estimate the five‐year change in performance at each hospital as a function of accreditation group, controlling for hospital characteristics. Baseline hospital performance was also included in the regression models to control for ceiling effects for those hospitals with high baseline performance. To summarize the results, we used the regression models to calculate adjusted change in performance for each accreditation group, and calculated a 95% confidence interval and P value for the difference between the adjusted change scores, using bootstrap methods.38
Next we analyzed the association between accreditation and the likelihood of high 2008 hospital performance by dichotomizing the hospital rates, using a 90% cut point, and using logistic regression to estimate the probability of high performance as a function of accreditation group, controlling for hospital characteristics and baseline hospital performance. The logistic models were then used to calculate adjusted rates of high performance for each accreditation group in presenting the results.
We used two‐sided tests for significance; P < 0.05 was considered statistically significant. This study had no external funding source.
RESULTS
For the 16 individual measures used in this study, a total of 4798 hospitals participated in Hospital Compare or reported data to The Joint Commission in 2004 or 2008. Of these, 907 were excluded because the performance data were not available for either 2004 (576 hospitals) or 2008 (331 hospitals) resulting in a missing value for the change in performance score. Therefore, 3891 hospitals (81%) were included in the final analyses. The 907 excluded hospitals were more likely to be rural (50.8% vs 17.5%), be critical access hospitals (53.9% vs 13.9%), have less than 100 beds (77.4% vs 37.6%), be government owned (34.6% vs 22.1%), be for profit (61.4% vs 49.5%), or be unaccredited (79.8% vs 45.8% in 2004; 75.6% vs 12.8% in 2008), compared with the included hospitals (P < 0.001 for all comparisons).
Hospital Performance at Baseline
Joint Commission‐accredited hospitals were more likely to be large, for profit, or urban, and less likely to be government owned, from the Midwest, or critical access (Table 1). Non‐accredited hospitals performed more poorly than accredited hospitals on most of the publicly reported measures in 2004; the only exception is the timing of initial antibiotic therapy measure for pneumonia (Table 2).
| Characteristic | Non‐Accredited (n = 786) | Accredited (n = 3105) | P Value* |
|---|---|---|---|
| |||
| Profit status, No. (%) | <0.001 | ||
| For profit | 60 (7.6) | 586 (18.9) | |
| Government | 289 (36.8) | 569 (18.3) | |
| Not for profit | 437 (55.6) | 1,950 (62.8) | |
| Census region, No. (%) | <0.001 | ||
| Northeast | 72 (9.2) | 497 (16.0) | |
| Midwest | 345 (43.9) | 716 (23.1) | |
| South | 248 (31.6) | 1,291 (41.6) | |
| West | 121 (15.4) | 601 (19.4) | |
| Rural setting, No. (%) | <0.001 | ||
| Rural | 495 (63.0) | 833 (26.8) | |
| Urban | 291 (37.0) | 2,272 (73.2) | |
| Bed size | <0.001 | ||
| <100 beds | 603 (76.7) | 861 (27.7) | |
| 100299 beds | 158 (20.1) | 1,444 (46.5) | |
| 300+ beds | 25 (3.2) | 800 (25.8) | |
| Critical access hospital status, No. (%) | <0.001 | ||
| Critical access hospital | 376 (47.8) | 164 (5.3) | |
| Acute care hospital | 410 (52.2) | 2,941 (94.7) | |
| Quality Measure, Mean (SD)* | 2004 | 2008 | ||||
|---|---|---|---|---|---|---|
| Non‐Accredited | Accredited | P Value | Non‐Accredited | Accredited | P Value | |
| (n = 786) | (n = 3105) | (n = 950) | (n = 2,941) | |||
| ||||||
| AMI | ||||||
| Aspirin at admission | 87.1 (20.0) | 92.6 (9.4) | <0.001 | 88.6 (22.1) | 96.0 (8.6) | <0.001 |
| Aspirin at discharge | 81.2 (26.1) | 88.5 (14.9) | <0.001 | 87.8 (22.7) | 94.8 (10.1) | <0.001 |
| ACE inhibitor for LV dysfunction | 72.1 (33.4) | 76.7 (22.9) | 0.010 | 83.2 (30.5) | 92.1 (14.8) | <0.001 |
| Beta blocker at discharge | 78.2 (27.9) | 87.0 (16.2) | <0.001 | 87.4 (23.4) | 95.5 (9.9) | <0.001 |
| Smoking cessation advice | 59.6 (40.8) | 74.5 (29.9) | <0.001 | 87.2 (29.5) | 97.2 (11.3) | <0.001 |
| PCI received within 90 min | 60.3 (26.2) | 60.6 (23.8) | 0.946 | 70.1 (24.8) | 77.7 (19.2) | 0.006 |
| Thrombolytic agent within 30 min | 27.9 (35.5) | 32.1 (32.8) | 0.152 | 31.4 (40.7) | 43.7 (40.2) | 0.008 |
| Composite AMI score | 80.6 (20.3) | 87.7 (10.4) | <0.001 | 85.8 (20.0) | 94.6 (8.1) | <0.001 |
| Heart failure | ||||||
| Discharge instructions | 36.8 (32.3) | 49.7 (28.2) | <0.001 | 67.4 (29.6) | 82.3 (16.4) | <0.001 |
| Assessment of LV function | 63.3 (27.6) | 83.6 (14.9) | <0.001 | 79.6 (24.4) | 95.6 (8.1) | <0.001 |
| ACE inhibitor for LV dysfunction | 70.8 (27.6) | 75.7 (16.3) | <0.001 | 82.5 (22.7) | 91.5 (9.7) | <0.001 |
| Smoking cessation advice | 57.1 (36.4) | 68.6 (26.2) | <0.001 | 81.5 (29.9) | 96.1 (10.7) | <0.001 |
| Composite heart failure score | 56.3 (24.1) | 71.2 (15.6) | <0.001 | 75.4 (22.3) | 90.4 (9.4) | <0.001 |
| Pneumonia | ||||||
| Oxygenation assessment | 97.4 (7.3) | 98.4 (4.0) | <0.001 | 99.0 (3.2) | 99.7 (1.2) | <0.001 |
| Pneumococcal vaccination | 45.5 (29.0) | 48.7 (26.2) | 0.007 | 79.9 (21.3) | 87.9 (12.9) | <0.001 |
| Timing of initial antibiotic therapy | 80.6 (13.1) | 70.9 (14.0) | <0.001 | 93.4 (9.2) | 93.6 (6.1) | 0.525 |
| Smoking cessation advice | 56.6 (33.1) | 65.7 (24.8) | <0.001 | 81.6 (25.1) | 94.4 (11.4) | <0.001 |
| Initial antibiotic selection | 73.6 (19.6) | 74.1 (13.4) | 0.508 | 86.1 (13.8) | 88.6 (8.7) | <0.001 |
| Composite pneumonia score | 77.2 (10.2) | 76.6 (8.2) | 0.119 | 90.0 (9.6) | 93.6 (4.9) | <0.001 |
| Overall composite | 73.7 (10.6) | 78.0 (8.7) | <0.001 | 86.8 (11.1) | 93.3 (5.0) | <0.001 |
Five‐Year Changes in Hospital Performance
Between 2004 and 2008, Joint Commission‐accredited hospitals improved their performance more than did non‐accredited hospitals (Table 3). After adjustment for baseline characteristics previously shown to be associated with performance, the overall relative (absolute) difference in improvement was 26% (4.2%) (AMI score difference 67% [3.9%], CHF 48% [10.1%], and pneumonia 21% [3.7%]). Accredited hospitals improved their performance significantly more than non‐accredited for 13 of the 16 individual performance measures.
| Characteristic | Change in Performance* | Absolute Difference, Always vs Never (95% CI) | Relative Difference, % Always vs Never | P Value | |
|---|---|---|---|---|---|
| Never Accredited (n = 762) | Always Accredited (n = 2,917) | ||||
| |||||
| AMI | |||||
| Aspirin at admission | 1.1 | 2.0 | 3.2 (1.25.2) | 160 | 0.001 |
| Aspirin at discharge | 4.7 | 8.0 | 3.2 (1.45.1) | 40 | 0.008 |
| ACE inhibitor for LV dysfunction | 8.5 | 15.9 | 7.4 (3.711.5) | 47 | <0.001 |
| Beta blocker at discharge | 4.4 | 8.4 | 4.0 (2.06.0) | 48 | <0.001 |
| Smoking cessation advice | 18.6 | 22.4 | 3.7 (1.16.9) | 17 | 0.012 |
| PCI received within 90 min | 6.3 | 13.0 | 6.7 (0.314.2) | 52 | 0.070 |
| Thrombolytic agent within 30 min | 0.6 | 5.4 | 6.1 (9.520.4) | 113 | 0.421 |
| Composite AMI score | 2.0 | 5.8 | 3.9 (2.25.5) | 67 | <0.001 |
| Heart failure | |||||
| Discharge instructions | 24.2 | 35.6 | 11.4 (8.714.0) | 32 | <0.001 |
| Assessment of LV function | 4.6 | 12.8 | 8.3 (6.610.0) | 65 | <0.001 |
| ACE inhibitor for LV dysfunction | 10.1 | 15.2 | 5.1 (3.56.8) | 34 | <0.001 |
| Smoking cessation advice | 20.5 | 26.4 | 6.0 (3.38.7) | 23 | <0.001 |
| Composite heart failure score | 10.8 | 20.9 | 10.1 (8.312.0) | 48 | <0.001 |
| Pneumonia | |||||
| Oxygenation assessment | 0.9 | 1.4 | 0.6 (0.30.9) | 43 | <0.001 |
| Pneumococcal vaccination | 33.4 | 40.9 | 7.5 (5.69.4) | 18 | <0.001 |
| Timing of initial antibiotic therapy | 19.2 | 21.1 | 1.9 (1.12.7) | 9 | <0.001 |
| Smoking cessation advice | 21.8 | 27.9 | 6.0 (3.88.3) | 22 | <0.001 |
| Initial antibiotic selection | 13.6 | 14.3 | 0.7 (0.51.9) | 5 | 0.293 |
| Composite pneumonia score | 13.7 | 17.5 | 3.7 (2.84.6) | 21 | <0.001 |
| Overall composite | 12.0 | 16.1 | 4.2 (3.25.1) | 26 | <0.001 |
High Performing Hospitals in 2008
The likelihood that a hospital was a high performer in 2008 was significantly associated with Joint Commission accreditation status, with a higher proportion of accredited hospitals reaching the 90% threshold compared to never‐accredited hospitals (Table 4). Accredited hospitals attained the 90% threshold significantly more often for 13 of the 16 performance measures and all four summary scores, compared to non‐accredited hospitals. In 2008, 82% of Joint Commission‐accredited hospitals demonstrated greater than 90% on the overall summary score, compared to 48% of never‐accredited hospitals. Even after adjusting for differences among hospitals, including performance at baseline, Joint Commission‐accredited hospitals were more likely than never‐accredited hospitals to exceed 90% performance in 2008 (84% vs 69%).
| Characteristic | Percent of Hospitals with Performance Over 90% Adjusted (Actual) | Odds Ratio, Always vs Never (95% CI) | P Value | |
|---|---|---|---|---|
| Never Accredited (n = 762) | Always Accredited (n = 2,917) | |||
| ||||
| AMI | ||||
| Aspirin at admission | 91.8 (71.8) | 93.9 (90.7) | 1.38 (1.001.89) | 0.049 |
| Aspirin at discharge | 83.7 (69.2) | 88.2 (85.1) | 1.45 (1.081.94) | 0.013 |
| ACE inhibitor for LV dysfunction | 65.1 (65.8) | 77.2 (76.5) | 1.81 (1.322.50) | <0.001 |
| Beta blocker at discharge | 84.7 (69.4) | 90.9 (88.4) | 1.80 (1.332.44) | <0.001 |
| Smoking cessation advice | 91.1 (81.3) | 95.9 (94.1) | 2.29 (1.314.01) | 0.004 |
| PCI received within 90 min | 21.5 (16.2) | 29.9 (29.8) | 1.56 (0.713.40) | 0.265 |
| Thrombolytic agent within 30 min | 21.4 (21.3) | 22.7 (23.6) | 1.08 (0.422.74) | 0.879 |
| Composite AMI score | 80.5 (56.6) | 88.2 (85.9) | 1.82 (1.372.41) | <0.001 |
| Heart failure | ||||
| Discharge instructions | 27.0 (26.3) | 38.9 (39.3) | 1.72 (1.302.27) | <0.001 |
| Assessment of LV function | 76.2 (45.0) | 89.1 (88.8) | 2.54 (1.953.31) | <0.001 |
| ACE inhibitor for LV dysfunction | 58.0 (51.4) | 67.8 (68.5) | 1.52 (1.211.92) | <0.001 |
| Smoking cessation advice | 84.2 (62.3) | 90.3 (89.2) | 1.76 (1.282.43) | <0.001 |
| Composite heart failure score | 38.2 (27.6) | 61.5 (64.6) | 2.57 (2.033.26) | <0.001 |
| Pneumonia | ||||
| Oxygenation assessment | 100 (98.2) | 100 (99.8) | 4.38 (1.201.32) | 0.025 |
| Pneumococcal vaccination | 44.1 (40.3) | 57.3 (58.2) | 1.70 (1.362.12) | <0.001 |
| Timing of initial antibiotic therapy | 74.3 (79.1) | 84.2 (82.7) | 1.85 (1.402.46) | <0.001 |
| Smoking cessation advice | 76.2 (54.6) | 85.8 (84.2) | 1.89 (1.422.51) | <0.001 |
| Initial antibiotic selection | 51.8 (47.4) | 51.0 (51.8) | 0.97 (0.761.25) | 0.826 |
| Composite pneumonia score | 69.3 (59.4) | 85.3 (83.9) | 2.58 (2.013.31) | <0.001 |
| Overall composite | 69.0 (47.5) | 83.8 (82.0) | 2.32 (1.763.06) | <0.001 |
DISCUSSION
While accreditation has face validity and is desired by key stakeholders, it is expensive and time consuming. Stakeholders thus are justified in seeking evidence that accreditation is associated with better quality and safety. Ideally, not only would it be associated with better performance at a single point in time, it would also be associated with the pace of improvement over time.
Our study is the first, to our knowledge, to show the association of accreditation status with improvement in the trajectory of performance over a five‐year period. Taking advantage of the fact that the accreditation process changed substantially at about the same time that TJC and CMS began requiring public reporting of evidence‐based quality measures, we found that hospitals accredited by The Joint Commission had had larger improvements in hospital performance from 2004 to 2008 than non‐accredited hospitals, even though the former started with higher baseline performance levels. This accelerated improvement was broad‐based: Accredited hospitals were more likely to achieve superior performance (greater than 90% adherence to quality measures) in 2008 on 13 of 16 nationally standardized quality‐of‐care measures, three clinical area summary scores, and an overall score compared to hospitals that were not accredited. These results are consistent with other studies that have looked at both process and outcome measures and accreditation.912
It is important to note that the observed accreditation effect reflects a difference between hospitals that have elected to seek one particular self‐regulatory alternative to the more restrictive and extensive public regulatory or licensure requirements with those that have not.39 The non‐accredited hospitals that were included in this study are not considered to be sub‐standard hospitals. In fact, hospitals not accredited by The Joint Commission have also met the standards set by Medicare in the Conditions of Participation, and our study demonstrates that these hospitals achieved reasonably strong performance on publicly reported quality measures (86.8% adherence on the composite measure in 2008) and considerable improvement over the 5 years of public reporting (average improvement on composite measure from 2004 to 2008 of 11.8%). Moreover, there are many paths to improvement, and some non‐accredited hospitals achieve stellar performance on quality measures, perhaps by embracing other methods to catalyze improvement.
That said, our data demonstrate that, on average, accredited hospitals achieve superior performance on these evidence‐based quality measures, and their performance improved more strikingly over time. In interpreting these results, it is important to recognize that, while Joint Commission‐accredited hospitals must report quality data, performance on these measures is not directly factored into the accreditation decision; if this were not so, one could argue that this association is a statistical tautology. As it is, we believe that the 2 measures (accreditation and publicly reported quality measures) are two independent assessments of the quality of an organization, and, while the performance measures may not be a gold standard, a measure of their association does provide useful information about the degree to which accreditation is linked to organizational quality.
There are several potential limitations of the current study. First, while we adjusted for most of the known hospital demographic and organizational factors associated with performance, there may be unidentified factors that are associated with both accreditation and performance. This may not be relevant to a patient or payer choosing a hospital based on accreditation status (who may not care whether accreditation is simply associated with higher quality or actually helps produce such quality), but it is relevant to policy‐makers, who may weigh the value of embracing accreditation versus other maneuvers (such as pay for performance or new educational requirements) as a vehicle to promote high‐quality care.
A second limitation is that the specification of the measures can change over time due to the acquisition of new clinical knowledge, which makes longitudinal comparison and tracking of results over time difficult. There were two measures that had definitional changes that had noticeable impact on longitudinal trends: the AMI measure Primary Percutaneous Coronary Intervention (PCI) Received within 90 Minutes of Hospital Arrival (which in 2004 and 2005 used 120 minutes as the threshold), and the pneumonia measure Antibiotic Within 4 Hours of Arrival (which in 2007 changed the threshold to six hours). Other changes included adding angiotensin‐receptor blocker therapy (ARB) as an alternative to angiotensin‐converting enzyme inhibitor (ACEI) therapy in 2005 to the AMI and heart failure measures ACEI or ARB for left ventricular dysfunction. Other less significant changes have been made to the data collection methods for other measures, which could impact the interpretation of changes in performance over time. That said, these changes influenced both accredited and non‐accredited hospitals equally, and we cannot think of reasons that they would have created differential impacts.
Another limitation is that the 16 process measures provide a limited picture of hospital performance. Although the three conditions in the study account for over 15% of Medicare admissions,19 it is possible that non‐accredited hospitals performed as well as accredited hospitals on other measures of quality that were not captured by the 16 measures. As more standardized measures are added to The Joint Commission and CMS databases, it will be possible to use the same study methodology to incorporate these additional domains.
From the original cohort of 4798 hospitals reporting in 2004 or 2008, 19% were not included in the study due to missing data in either 2004 or 2008. Almost two‐thirds of the hospitals excluded from the study were missing 2004 data and, of these, 77% were critical access hospitals. The majority of these critical access hospitals (97%) were non‐accredited. This is in contrast to the hospitals missing 2008 data, of which only 13% were critical access. Since reporting of data to Hospital Compare was voluntary in 2004, it appears that critical access hospitals chose to wait later to report data to Hospital Compare, compared to acute care hospitals. Since critical access hospitals tended to have lower rates, smaller sample sizes, and be non‐accredited, the results of the study would be expected to slightly underestimate the difference between accredited and non‐accredited hospitals.
Finally, while we have argued that the publicly reported quality measures and TJC accreditation decisions provide different lenses into the quality of a given hospital, we cannot entirely exclude the possibility that there are subtle relationships between these two methods that might be partly responsible for our findings. For example, while performance measure rates do not factor directly into the accreditation decision, it is possible that Joint Commission surveyors may be influenced by their knowledge of these rates and biased in their scoring of unrelated standards during the survey process. While we cannot rule out such biases, we are aware of no research on the subject, and have no reason to believe that such biases may have confounded the analysis.
In summary, we found that Joint Commission‐accredited hospitals outperformed non‐accredited hospitals on nationally standardized quality measures of AMI, heart failure, and pneumonia. The performance gap between Joint Commission‐accredited and non‐accredited hospitals increased over the five years of the study. Future studies should incorporate more robust and varied measures of quality as outcomes, and seek to examine the nature of the observed relationship (ie, whether accreditation is simply a marker of higher quality and more rapid improvement, or the accreditation process actually helps create these salutary outcomes).
Acknowledgements
The authors thank Barbara Braun, PhD and Nicole Wineman, MPH, MBA for their literature review on the impact of accreditation, and Barbara Braun, PhD for her thoughtful review of the manuscript.
- The Joint Commission. Facts About Hospital Accreditation. Available at: http://www.jointcommission.org/assets/1/18/Hospital_Accreditation_1_31_11.pdf. Accessed on Feb 16, 2011.
- ,.Emergency Response Planning in Hospitals, United States: 2003–2004. Advance Data from Vital and Health Statistics; No. 391.Hattsville, MD:National Center for Health Statistics;2007.
- ,.Training for Terrorism‐Related Conditions in Hospitals, United States: 2003–2004. Advance Data from Vital and Health Statistics; No. 380.Hattsville, MD:National Center for Health Statistics;2006.
- ,,,.Hospital patient safety: characteristics of best‐performing hospitals.J Healthcare Manag.2007;52 (3):188–205.
- ,,.What is driving hospitals' patient‐safety efforts?Health Aff.2004;23(2):103–115.
- ,.The impact of trauma centre accreditation on patient outcome.Injury.2006;37(12):1166–1171.
- ,.Factors that influence staffing of outpatient substance abuse treatment programs.Psychiatr Serv.2005;56(8)934–939.
- ,.Changes in methadone treatment practices. Results from a national panel study, 1988–2000.JAMA.2002;288:850–856.
- ,,, et al.Quality of care for the treatment of acute medical conditions in US hospitals.Arch Intern Med.2006;166:2511–2517.
- ,,,.JCAHO accreditation and quality of care for acute myocardial infarction.Health Aff.2003;22(2):243–254.
- ,,, et al.Is JCAHO Accreditation Associated with Better Patient Outcomes in Rural Hospitals? Academy Health Annual Meeting; Boston, MA; June2005.
- .Hospital quality of care: the link between accreditation and mortality.J Clin Outcomes Manag.2003;10(9):473–480.
- , , . Structural versus outcome measures in hospitals: A comparison of Joint Commission and medicare outcome scores in hospitals. Qual Manage Health Care. 2002;10(2): 29–38.
- ,,,,.Medication errors observed in 36 health care facilities.Arch Intern Med.2002;162:1897–1903.
- ,,,,.Quality of care in accredited and non‐accredited ambulatory surgical centers.Jt Comm J Qual Patient Saf.2008;34(9):546–551.
- Joint Commission on Accreditation of Healthcare Organizations. Specification Manual for National Hospital Quality Measures 2009. Available at: http://www.jointcommission.org/PerformanceMeasurement/PerformanceMeasurement/Current+NHQM+Manual.htm. Accessed May 21,2009.
- Hospital Quality Alliance Homepage. Available at: http://www.hospitalqualityalliance.org/hospitalqualityalliance/index.html. Accessed May 6,2010
- ,,,,.Quality of care in U.S. hospitals as reflected by standardized measures, 2002–2004.N Engl J Med.2005;353(3):255–264.
- ,,,.Care in U.S. hospitals—the Hospital Quality Alliance Program.N Engl J Med.2005;353:265–274.
- Institute of Medicine, Committee on Quality Health Care in America.Crossing the Quality Chasm: A New Health System for the 21st Century.Washington, DC:The National Academy Press;2001.
- ,,.Does publicizing hospital performance stimulate quality improvement efforts?Health Aff.2003;22(2):84–94.
- ,,,.Performance of top ranked heart care hospitals on evidence‐based process measures.Circulation.2006;114:558–564.
- The Joint Commission Performance Measure Initiatives Homepage. Available at: http://www.jointcommission.org/PerformanceMeasurement/PerformanceMeasurement/default.htm. Accessed on July 27,2010.
- .Using health outcomes data to compare plans, networks and providers.Int J Qual Health Care.1998;10(6):477–483.
- .Process versus outcome indicators in the assessment of quality of health care.Int J Qual Health Care.2001;13:475–480.
- .Does paying for performance improve the quality of health care?Med Care Res Rev.2006;63(1):122S–125S.
- ,,, et al.Incremental survival benefit with adherence to standardized health failure core measures: a performance evaluation study of 2958 patients.J Card Fail.2008;14(2):95–102.
- ,,,.The inverse relationship between mortality rates and performance in the hospital quality alliance measures.Health Aff.2007;26(4):1104–1110.
- ,,, et al.Hospital quality for acute myocardial infarction: correlation among process measures and relationship with short‐term mortality.JAMA.2006:296(1):72–78.
- ,,,,.Assessing the reliability of standardized performance measures.Int J Qual Health Care.2006;18:246–255.
- Centers for Medicare and Medicaid Services (CMS). CMS HQI Demonstration Project‐Composite Quality Score Methodology Overview. Available at: http://www.cms.hhs.gov/HospitalQualityInits/downloads/HospitalCompositeQualityScoreMethodologyOverview.pdf. Accessed March 8,2010.
- ,,,.Assessing the accuracy of hospital performance measures.Med Decis Making.2007;27:9–20.
- Quality Check Data Download Website. Available at: http://www.healthcarequalitydata.org. Accessed May 21,2009.
- ,,.Hospital characteristics and mortality rates.N Engl J Med.1989;321(25):1720–1725.
- ,.United States rural hospital quality in the Hospital Compare Database—accounting for hospital characteristics.Health Policy.2008;87:112–127.
- ,,,,,.Characteristics of hospitals demonstrating superior performance in patient experience and clinical process measures of care.Med Care Res Rev.2010;67(1):38–55.
- ,,.Comparison of change in quality of care between safety‐net and non‐safety‐net hospitals.JAMA.2008;299(18):2180–2187.
- ,.Bootstrap Methods and Their Application.New York:Cambridge;1997:chap 6.
- ,,,.The role of accreditation in an era of market‐driven accountability.Am J Manag Care.2005;11(5):290–293.
- The Joint Commission. Facts About Hospital Accreditation. Available at: http://www.jointcommission.org/assets/1/18/Hospital_Accreditation_1_31_11.pdf. Accessed on Feb 16, 2011.
- ,.Emergency Response Planning in Hospitals, United States: 2003–2004. Advance Data from Vital and Health Statistics; No. 391.Hattsville, MD:National Center for Health Statistics;2007.
- ,.Training for Terrorism‐Related Conditions in Hospitals, United States: 2003–2004. Advance Data from Vital and Health Statistics; No. 380.Hattsville, MD:National Center for Health Statistics;2006.
- ,,,.Hospital patient safety: characteristics of best‐performing hospitals.J Healthcare Manag.2007;52 (3):188–205.
- ,,.What is driving hospitals' patient‐safety efforts?Health Aff.2004;23(2):103–115.
- ,.The impact of trauma centre accreditation on patient outcome.Injury.2006;37(12):1166–1171.
- ,.Factors that influence staffing of outpatient substance abuse treatment programs.Psychiatr Serv.2005;56(8)934–939.
- ,.Changes in methadone treatment practices. Results from a national panel study, 1988–2000.JAMA.2002;288:850–856.
- ,,, et al.Quality of care for the treatment of acute medical conditions in US hospitals.Arch Intern Med.2006;166:2511–2517.
- ,,,.JCAHO accreditation and quality of care for acute myocardial infarction.Health Aff.2003;22(2):243–254.
- ,,, et al.Is JCAHO Accreditation Associated with Better Patient Outcomes in Rural Hospitals? Academy Health Annual Meeting; Boston, MA; June2005.
- .Hospital quality of care: the link between accreditation and mortality.J Clin Outcomes Manag.2003;10(9):473–480.
- , , . Structural versus outcome measures in hospitals: A comparison of Joint Commission and medicare outcome scores in hospitals. Qual Manage Health Care. 2002;10(2): 29–38.
- ,,,,.Medication errors observed in 36 health care facilities.Arch Intern Med.2002;162:1897–1903.
- ,,,,.Quality of care in accredited and non‐accredited ambulatory surgical centers.Jt Comm J Qual Patient Saf.2008;34(9):546–551.
- Joint Commission on Accreditation of Healthcare Organizations. Specification Manual for National Hospital Quality Measures 2009. Available at: http://www.jointcommission.org/PerformanceMeasurement/PerformanceMeasurement/Current+NHQM+Manual.htm. Accessed May 21,2009.
- Hospital Quality Alliance Homepage. Available at: http://www.hospitalqualityalliance.org/hospitalqualityalliance/index.html. Accessed May 6,2010
- ,,,,.Quality of care in U.S. hospitals as reflected by standardized measures, 2002–2004.N Engl J Med.2005;353(3):255–264.
- ,,,.Care in U.S. hospitals—the Hospital Quality Alliance Program.N Engl J Med.2005;353:265–274.
- Institute of Medicine, Committee on Quality Health Care in America.Crossing the Quality Chasm: A New Health System for the 21st Century.Washington, DC:The National Academy Press;2001.
- ,,.Does publicizing hospital performance stimulate quality improvement efforts?Health Aff.2003;22(2):84–94.
- ,,,.Performance of top ranked heart care hospitals on evidence‐based process measures.Circulation.2006;114:558–564.
- The Joint Commission Performance Measure Initiatives Homepage. Available at: http://www.jointcommission.org/PerformanceMeasurement/PerformanceMeasurement/default.htm. Accessed on July 27,2010.
- .Using health outcomes data to compare plans, networks and providers.Int J Qual Health Care.1998;10(6):477–483.
- .Process versus outcome indicators in the assessment of quality of health care.Int J Qual Health Care.2001;13:475–480.
- .Does paying for performance improve the quality of health care?Med Care Res Rev.2006;63(1):122S–125S.
- ,,, et al.Incremental survival benefit with adherence to standardized health failure core measures: a performance evaluation study of 2958 patients.J Card Fail.2008;14(2):95–102.
- ,,,.The inverse relationship between mortality rates and performance in the hospital quality alliance measures.Health Aff.2007;26(4):1104–1110.
- ,,, et al.Hospital quality for acute myocardial infarction: correlation among process measures and relationship with short‐term mortality.JAMA.2006:296(1):72–78.
- ,,,,.Assessing the reliability of standardized performance measures.Int J Qual Health Care.2006;18:246–255.
- Centers for Medicare and Medicaid Services (CMS). CMS HQI Demonstration Project‐Composite Quality Score Methodology Overview. Available at: http://www.cms.hhs.gov/HospitalQualityInits/downloads/HospitalCompositeQualityScoreMethodologyOverview.pdf. Accessed March 8,2010.
- ,,,.Assessing the accuracy of hospital performance measures.Med Decis Making.2007;27:9–20.
- Quality Check Data Download Website. Available at: http://www.healthcarequalitydata.org. Accessed May 21,2009.
- ,,.Hospital characteristics and mortality rates.N Engl J Med.1989;321(25):1720–1725.
- ,.United States rural hospital quality in the Hospital Compare Database—accounting for hospital characteristics.Health Policy.2008;87:112–127.
- ,,,,,.Characteristics of hospitals demonstrating superior performance in patient experience and clinical process measures of care.Med Care Res Rev.2010;67(1):38–55.
- ,,.Comparison of change in quality of care between safety‐net and non‐safety‐net hospitals.JAMA.2008;299(18):2180–2187.
- ,.Bootstrap Methods and Their Application.New York:Cambridge;1997:chap 6.
- ,,,.The role of accreditation in an era of market‐driven accountability.Am J Manag Care.2005;11(5):290–293.
Copyright © 2011 Society of Hospital Medicine
Hospitalists and Alcohol Withdrawal
With 17 million Americans reporting heavy drinking (5 or more drinks on 5 different occasions in the last month) and 1.7 million hospital discharges in 2006 containing at least 1 alcohol‐related diagnosis, it would be hard to imagine a hospitalist who does not encounter patients with alcohol abuse.1, 2 Estimates from studies looking at the number of risky drinkers among medical inpatients vary widely2% to 60%with more detailed studies suggesting 17% to 25% prevalence.36 Yet despite the large numbers and great costs to the healthcare system, the inpatient treatment of alcohol withdrawal syndrome remains the ugly stepsister to more exciting topics, such as acute myocardial infarction, pulmonary embolism and procedures.7, 8 We hospitalists typically leave the clinical studies, research, and interest on substance abuse to addiction specialists and psychiatrists, perhaps due to our discomfort with these patients, negative attitudes, or belief that there is nothing new in the treatment of alcohol withdrawal syndrome since Dr Leo Henryk Sternbach discovered benzodiazepines in 1957.7, 9 Many of us just admit the alcoholic patient, check the alcohol‐pathway in our order entry system, and stop thinking about it.
But in this day of evidence‐based medicine and practice, what is the evidence behind the treatment of alcohol withdrawal, especially in relation to inpatient medicine? Shouldn't we hospitalists be thinking about this question? Hospitalists tend to see 2 types of inpatients with alcohol withdrawal: those solely admitted for withdrawal, and those admitted with active medical issues who then experience alcohol withdrawal. Is there a difference?
The Diagnostic and Statistical Manual of Mental Disorders, Fourth Edition (DSM‐IV) defines early alcohol withdrawal as the first 48 hours where there is central nervous system (CNS) stimulation, adrenergic hyperactivity, and the risk of seizures. Late withdrawal, after 48 hours, includes delirium tremens (DTs) and Wernicke's encephalopathy.10 This is based on studies done in the 1950s, where researchers observed patients as they withdrew from alcohol and took notes.11, 12
The goal in treatment of alcohol withdrawal is to minimize symptoms and prevent seizures and DTs which, prior to benzodiazepines, had a mortality rate of 5% to 20%. Before the US Food and Drug Administration (FDA) approval of the first benzodiazepine in 1960 (chlordiazepoxide), physicians treated alcohol withdrawal with ethanol, antipsychotics, or paraldehyde.12 (That is why there is a P in the mnemonic MUDPILES for anion gap acidosis.) The first study to show a real benefit from benzodiazepine was published in 1969, when 537 men in a veterans detoxification unit were randomized to chlordiazepoxide (Librium), chlorpromazine (Thorazine), antihistamine, thiamine, or placebo.12 The primary outcome of DTs and seizures occurred in 10% to 16% of the patients, except for the chlordiazepoxide group where only 2% developed seizures and DTs (there was no P value calculated). Further studies published in the 1970s and early 1980s were too small to demonstrate a benefit. A 1997 meta‐analysis of all these studies, including the 1969 article,12 confirmed benzodiazepines statistically reduced seizures and DTs.13 Which benzodiazepine to use, however, is less clear. Long‐acting benzodiazepines with liver clearance (eg, chlordiazepoxide or diazepam) versus short‐acting with renal clearance (eg, oxazepam or lorazepam) is debated. While there are many strong opinions among clinicians, the same meta‐analysis did not find any difference between them, and a small 2009 study found no difference between a short‐acting and long‐acting benzodiazepine.13, 14
How much benzodiazepine to give and how frequently to dose it was looked at in 2 classic studies.15, 16 Both studies demonstrated that symptom‐triggered dosing of benzodiazepines, based on the Clinical Institute Withdrawal Assessment (CIWA) scale, performed equally well in terms of clinical outcomes, with less medication required as compared with fixed‐dose regimens. Based on these articles, many hospitals created alcohol pathways using solely symptom‐triggered dosing.
The CIWA scale is one of multiple rating scales in the assessment of alcohol withdrawal.17, 18 The CIWA‐Ar is a modified scale that was designed and validated for clinical use in inpatient detoxification centers, and excluded any active medical illness. It has gained popularity, though initial time for staff training and time for administration are limitations to its usefulness. Interestingly, vital signs, which many institutions use in their alcohol withdrawal pathways, were not strongly predictive in the CIWA study of severe withdrawal, seizures, or DTs.17
Finally, what about treatment when the patient does develop seizures or DTs? The evidence on how best to treat alcohol withdrawal seizures comes from a 1999 article which demonstrated a benefit of using lorazepam for recurrent seizures.19, 20 Unfortunately, the treatment for DTs is less clear. A 2004 meta‐analysis on the treatment of delirium tremens found benzodiazepines better than chlorpromazine (Thorazine), but benzodiazepines versus, or in addition to, newer antipsychotics have not been tested. The amount of benzodiazepine to give in DTs is only a Grade C (ie, expert opinion) recommendation: dose for light somnolence.21
All of these studies, however, come back to the basic question: Do they apply to the inpatients that hospitalists care for? A key factor to consider: All of the above‐mentioned studies, including the derivation and validation of the CIWA scale, were done in outpatient centers or inpatient detoxification centers. Patients with active medical illness or comorbidities were excluded. This data may be relevant for the patients admitted solely for alcohol withdrawal, but what about the 60 year old with diabetes, coronary artery disease, and chronic obstructive lung disease admitted for pneumonia who starts to withdraw; or the 72‐year‐old woman who breaks her hip and begins to withdraw on post‐op day 2?
There are 6 relatively recent studies that evaluate PRN (as needed) dosing of benzodiazepines on general medical inpatients.2227 While ideally these articles should apply to a hospitalist's patients, 2 of the studies excluded anyone with acute medical illness.24, 27 From the remaining 4, what do we learn? Weaver and colleagues did a randomized study on general medical patients and found less lorazepam was given with PRN versus fixed dosing.26 Unfortunately, the study was not blinded and there were statistically significant protocol errors. Comorbidity data was not given, leaving us to wonder to which inpatients this applies. Repper‐DeLisi et al. did a retrospective chart review, after implementing an alcohol pathway (not based on the CIWA scale), and did not find a statistical difference in dosing, length of stay, or delirium.25 Foy et al. looked at both medical and surgical patients, and dosed benzodiazepines based on an 18‐item CIWA scale which included vital signs.22 They found that the higher score did correlate with risk of developing severe alcohol withdrawal. However, the scale had limitations. Many patients with illness were at higher risk for severe alcohol withdrawal than their score indicated, and some high scores were believed, in part, due to illness. Jeager et al. did a pre‐comparison and post‐comparison of the implementation of a PRN CIWA protocol by chart review.23 They found a reduction in delirium in patients treated with PRN dosing, but no different in total benzodiazepine given. Because it was chart review, the authors acknowledge that defining delirium tremens was less reliable, and controlling for comorbidities was difficult. The difficult part of delirium in inpatients with alcohol abuse is that the delirium is not always just from DTs.
Two recent studies raised alarm about using a PRN CIWA pathway on patients.28, 29 A 2008 study found that 52% of patients were inappropriately put on a CIWA sliding scale when they either could not communicate or had not been recently drinking, or both.29 (The CIWA scale requires the person be able to answer symptom questions and is not applicable to non‐drinkers.) In 2005, during the implementation of an alcohol pathway at San Francisco General Hospital, an increase in mortality was noted with a PRN CIWA scale on inpatients.28
One of the conundrums for physicians is that whereas alcohol withdrawal has morbidity and mortality risks, benzodiazepine treatment itself has its own risks. Over sedation, respiratory depression, aspiration pneumonia, deconditioning from prolonged sedation, paradoxical agitation and disinhibition are the consequences of the dosing difficulties in alcohol withdrawal. Case reports on astronomical doses required to treat withdrawal (eg, 1600 mg of lorazepam in a day) raise questions of benzodiazepine resistance.30 Hence, multiple studies have been done to find alternatives for benzodiazepines. Our European counterparts lead the way in looking at: carbemazepine, gabapentin, gamma‐hydroxybuterate, corticotropin‐releasing hormone, baclofen, pregabalin, and phenobarbital. Again, the key issue for hospitalists: Are these benzodiazepine alternatives or additives applicable to our patients? These studies are done on outpatients with no concurrent medical illnesses. Yet, logic would suggest that it is the vulnerable hospitalized patients who might benefit the most from reducing the benzodiazepine amount using other agents.
In this issue of the Journal of Hospital Medicine, Lyon et al. provide a glimpse into possible ways to reduce the total benzodiazepine dose for general medical inpatients.31 They randomized inpatients withdrawing from alcohol to baclofen or placebo. Both groups still received PRN lorazepam based on their hospital's CIWA protocol. Prior outpatient studies have shown baclofen benefits patients undergoing alcohol withdrawal and the pathophysiology makes sense; baclofen acts on GABA b receptors. Lyon and collegaues' study results show significant reduction in the amount of benzodiazepine needed with no difference in CIWA scores.31
Is this a practice changer? Well, not yet. The numbers in the study are small and this is only 1 institution. These patients had only moderate alcohol withdrawal and the study was not powered to detect outcomes related to prevention of seizures and delirium tremens. However, the authors should be applauded for looking at alcohol withdrawal in medical inpatients.31 Trying to reduce the harm we cause with our benzodiazepine treatment regimens is a laudable goal. Inpatient alcohol withdrawal, especially for patients with medical comorbidities, is an area ripe for study and certainly deserves to have a spotlight shown on it.
Who better to do this than hospitalists? The Society of Hospital Medicine (SHM) core competency on Alcohol and Drug Withdrawal states, Hospitalists can lead their institutions in evidence based treatment protocols that improve care, reduce costs‐ and length of stay, and facilitate better overall outcomes in patients with substance related withdrawal syndromes.32 Hopefully, Lyon and collegaues' work will lead to the formation of multicenter hospitalist‐initiated studies to provide us with the best evidence for the treatment of inpatient alcohol withdrawal on our patients with comorbidities.31 Given the prevalence and potential severity of alcohol withdrawal in complex inpatients, isn't it time we really knew how to treat them?
- ,.Trends in Alcohol‐Related Morbidity Among Short‐Stay Community Hospital Discharges, United States, 1979–2006. Surveillance Report #84.Bethesda, MD:National Institute on Alcohol Abuse and Alcoholism, Division of Epidemiology and Prevention Research;2008.
- Substance Abuse and Mental Health Services Administration (SAMHSA).Results From the 2006 National Survey on Drug Use and Health: National Findings (Office of Applied Studies, NSDUH Series H‐32, DHHS Publication No SMA‐0704293).Rockville, MD:US Department of Health and Human Services;2007.
- ,.Alcohol‐related disease in hospital patients.Med J Aust.1986;144(10):515–517, 519.
- ,,,,.The effect of patient gender on the prevalence and recognition of alcoholism on a general medicine inpatient service.J Gen Intern Med.1992;7(1):38–45.
- ,,,,.The severity of unhealthy alcohol use in hospitalized medical patients. The spectrum is narrow.J Gen Intern Med.2006;21(4):381–385.
- ,,,,,.Prevalence, detection, and treatment of alcoholism in hospitalized patients.JAMA.1989;261(3):403–407.
- ,,,.Internal medicine residency training for unhealthy alcohol and other drug use: recommendations for curriculum design.BMC Med Educ.2010;10:22.
- .Clinical practice. Unhealthy alcohol use.N Engl J Med.2005;352(6):596–607.
- ,,,,.Good Chemistry: The Life and Legacy of Valium Inventor Leo Sternbach.New York, NY:McGraw Hill;2004.
- ,,,,.Alcohol withdrawal syndromes: a review of pathophysiology, clinical presentation, and treatment.J Gen Intern Med.1989;4(5):432–444.
- ,,,,.An experimental study of the etiology of rum fits and delirium tremens.Q J Stud Alcohol.1955;16(1):1–33.
- ,,.Treatment of the acute alcohol withdrawal state: a comparison of four drugs.Am J Psychiatry.1969;125(12):1640–1646.
- .Pharmacological management of alcohol withdrawal. A meta‐analysis and evidence‐based practice guideline. American Society of Addiction Medicine Working Group on Pharmacological Management of Alcohol Withdrawal.JAMA.1997;278(2):144–151.
- ,,.A randomized, double‐blind comparison of lorazepam and chlordiazepoxide in patients with uncomplicated alcohol withdrawal.J Stud Alcohol Drugs.2009;70(3):467–474.
- ,,,,,.Individualized treatment for alcohol withdrawal. A randomized double‐blind controlled trial.JAMA.1994;272(7):519–523.
- ,,, et al.Symptom‐triggered vs fixed‐schedule doses of benzodiazepine for alcohol withdrawal: a randomized treatment trial.Arch Intern Med.2002;162(10):1117–1121.
- ,,,,.Assessment of alcohol withdrawal: the revised clinical institute withdrawal assessment for alcohol scale (CIWA‐Ar).Br J Addict.1989;84(11):1353–1357.
- ,,.A comparison of rating scales for the alcohol‐withdrawal syndrome.Alcohol Alcohol.2001;36(2):104–108.
- ,,,,.Lorazepam for the prevention of recurrent seizures related to alcohol.N Engl J Med.1999;340(12):915–919.
- ,,,.Anticonvulsants for alcohol withdrawal.Cochrane Database Syst Rev.2010(3):CD005064.
- ,,, et al.Management of alcohol withdrawal delirium. An evidence‐based practice guideline.Arch Intern Med.2004;164(13):1405–1412.
- ,,.Use of an objective clinical scale in the assessment and management of alcohol withdrawal in a large general hospital.Alcohol Clin Exp Res.1988;12(3):360–364.
- ,,.Symptom‐triggered therapy for alcohol withdrawal syndrome in medical inpatients.Mayo Clin Proc.2001;76(7):695–701.
- ,.Routine hospital alcohol detoxification practice compared to symptom triggered management with an objective withdrawal scale (CIWA‐Ar).Am J Addict.2000;9(2):135–144.
- ,,, et al.Successful implementation of an alcohol‐withdrawal pathway in a general hospital.Psychosomatics.2008;49(4):292–299.
- ,,,.Alcohol withdrawal pharmacotherapy for inpatients with medical comorbidity.J Addict Dis.2006;25(2):17–24.
- ,,.Benzodiazepine requirements during alcohol withdrawal syndrome: clinical implications of using a standardized withdrawal scale.J Clin Psychopharmacol.1991;11(5):291–295.
- ,,, et al.Unintended consequences of a quality improvement program designed to improve treatment of alcohol withdrawal in hospitalized patients.Jt Comm J Qual Patient Saf.2005;31(3):148–157.
- ,,,.Inappropriate use of symptom‐triggered therapy for alcohol withdrawal in the general hospital.Mayo Clin Proc.2008;83(3):274–279.
- ,,.A case of alcohol withdrawal requiring 1,600 mg of lorazepam in 24 hours.CNS Spectr.2009;14(7):385–389.
- et al.J Hosp Med.2011;6:471–476.
- The core competencies in hospital medicine: a framework for curriculum development by the Society of Hospital Medicine.J Hosp Med.2006;1(suppl 1):2–95.
With 17 million Americans reporting heavy drinking (5 or more drinks on 5 different occasions in the last month) and 1.7 million hospital discharges in 2006 containing at least 1 alcohol‐related diagnosis, it would be hard to imagine a hospitalist who does not encounter patients with alcohol abuse.1, 2 Estimates from studies looking at the number of risky drinkers among medical inpatients vary widely2% to 60%with more detailed studies suggesting 17% to 25% prevalence.36 Yet despite the large numbers and great costs to the healthcare system, the inpatient treatment of alcohol withdrawal syndrome remains the ugly stepsister to more exciting topics, such as acute myocardial infarction, pulmonary embolism and procedures.7, 8 We hospitalists typically leave the clinical studies, research, and interest on substance abuse to addiction specialists and psychiatrists, perhaps due to our discomfort with these patients, negative attitudes, or belief that there is nothing new in the treatment of alcohol withdrawal syndrome since Dr Leo Henryk Sternbach discovered benzodiazepines in 1957.7, 9 Many of us just admit the alcoholic patient, check the alcohol‐pathway in our order entry system, and stop thinking about it.
But in this day of evidence‐based medicine and practice, what is the evidence behind the treatment of alcohol withdrawal, especially in relation to inpatient medicine? Shouldn't we hospitalists be thinking about this question? Hospitalists tend to see 2 types of inpatients with alcohol withdrawal: those solely admitted for withdrawal, and those admitted with active medical issues who then experience alcohol withdrawal. Is there a difference?
The Diagnostic and Statistical Manual of Mental Disorders, Fourth Edition (DSM‐IV) defines early alcohol withdrawal as the first 48 hours where there is central nervous system (CNS) stimulation, adrenergic hyperactivity, and the risk of seizures. Late withdrawal, after 48 hours, includes delirium tremens (DTs) and Wernicke's encephalopathy.10 This is based on studies done in the 1950s, where researchers observed patients as they withdrew from alcohol and took notes.11, 12
The goal in treatment of alcohol withdrawal is to minimize symptoms and prevent seizures and DTs which, prior to benzodiazepines, had a mortality rate of 5% to 20%. Before the US Food and Drug Administration (FDA) approval of the first benzodiazepine in 1960 (chlordiazepoxide), physicians treated alcohol withdrawal with ethanol, antipsychotics, or paraldehyde.12 (That is why there is a P in the mnemonic MUDPILES for anion gap acidosis.) The first study to show a real benefit from benzodiazepine was published in 1969, when 537 men in a veterans detoxification unit were randomized to chlordiazepoxide (Librium), chlorpromazine (Thorazine), antihistamine, thiamine, or placebo.12 The primary outcome of DTs and seizures occurred in 10% to 16% of the patients, except for the chlordiazepoxide group where only 2% developed seizures and DTs (there was no P value calculated). Further studies published in the 1970s and early 1980s were too small to demonstrate a benefit. A 1997 meta‐analysis of all these studies, including the 1969 article,12 confirmed benzodiazepines statistically reduced seizures and DTs.13 Which benzodiazepine to use, however, is less clear. Long‐acting benzodiazepines with liver clearance (eg, chlordiazepoxide or diazepam) versus short‐acting with renal clearance (eg, oxazepam or lorazepam) is debated. While there are many strong opinions among clinicians, the same meta‐analysis did not find any difference between them, and a small 2009 study found no difference between a short‐acting and long‐acting benzodiazepine.13, 14
How much benzodiazepine to give and how frequently to dose it was looked at in 2 classic studies.15, 16 Both studies demonstrated that symptom‐triggered dosing of benzodiazepines, based on the Clinical Institute Withdrawal Assessment (CIWA) scale, performed equally well in terms of clinical outcomes, with less medication required as compared with fixed‐dose regimens. Based on these articles, many hospitals created alcohol pathways using solely symptom‐triggered dosing.
The CIWA scale is one of multiple rating scales in the assessment of alcohol withdrawal.17, 18 The CIWA‐Ar is a modified scale that was designed and validated for clinical use in inpatient detoxification centers, and excluded any active medical illness. It has gained popularity, though initial time for staff training and time for administration are limitations to its usefulness. Interestingly, vital signs, which many institutions use in their alcohol withdrawal pathways, were not strongly predictive in the CIWA study of severe withdrawal, seizures, or DTs.17
Finally, what about treatment when the patient does develop seizures or DTs? The evidence on how best to treat alcohol withdrawal seizures comes from a 1999 article which demonstrated a benefit of using lorazepam for recurrent seizures.19, 20 Unfortunately, the treatment for DTs is less clear. A 2004 meta‐analysis on the treatment of delirium tremens found benzodiazepines better than chlorpromazine (Thorazine), but benzodiazepines versus, or in addition to, newer antipsychotics have not been tested. The amount of benzodiazepine to give in DTs is only a Grade C (ie, expert opinion) recommendation: dose for light somnolence.21
All of these studies, however, come back to the basic question: Do they apply to the inpatients that hospitalists care for? A key factor to consider: All of the above‐mentioned studies, including the derivation and validation of the CIWA scale, were done in outpatient centers or inpatient detoxification centers. Patients with active medical illness or comorbidities were excluded. This data may be relevant for the patients admitted solely for alcohol withdrawal, but what about the 60 year old with diabetes, coronary artery disease, and chronic obstructive lung disease admitted for pneumonia who starts to withdraw; or the 72‐year‐old woman who breaks her hip and begins to withdraw on post‐op day 2?
There are 6 relatively recent studies that evaluate PRN (as needed) dosing of benzodiazepines on general medical inpatients.2227 While ideally these articles should apply to a hospitalist's patients, 2 of the studies excluded anyone with acute medical illness.24, 27 From the remaining 4, what do we learn? Weaver and colleagues did a randomized study on general medical patients and found less lorazepam was given with PRN versus fixed dosing.26 Unfortunately, the study was not blinded and there were statistically significant protocol errors. Comorbidity data was not given, leaving us to wonder to which inpatients this applies. Repper‐DeLisi et al. did a retrospective chart review, after implementing an alcohol pathway (not based on the CIWA scale), and did not find a statistical difference in dosing, length of stay, or delirium.25 Foy et al. looked at both medical and surgical patients, and dosed benzodiazepines based on an 18‐item CIWA scale which included vital signs.22 They found that the higher score did correlate with risk of developing severe alcohol withdrawal. However, the scale had limitations. Many patients with illness were at higher risk for severe alcohol withdrawal than their score indicated, and some high scores were believed, in part, due to illness. Jeager et al. did a pre‐comparison and post‐comparison of the implementation of a PRN CIWA protocol by chart review.23 They found a reduction in delirium in patients treated with PRN dosing, but no different in total benzodiazepine given. Because it was chart review, the authors acknowledge that defining delirium tremens was less reliable, and controlling for comorbidities was difficult. The difficult part of delirium in inpatients with alcohol abuse is that the delirium is not always just from DTs.
Two recent studies raised alarm about using a PRN CIWA pathway on patients.28, 29 A 2008 study found that 52% of patients were inappropriately put on a CIWA sliding scale when they either could not communicate or had not been recently drinking, or both.29 (The CIWA scale requires the person be able to answer symptom questions and is not applicable to non‐drinkers.) In 2005, during the implementation of an alcohol pathway at San Francisco General Hospital, an increase in mortality was noted with a PRN CIWA scale on inpatients.28
One of the conundrums for physicians is that whereas alcohol withdrawal has morbidity and mortality risks, benzodiazepine treatment itself has its own risks. Over sedation, respiratory depression, aspiration pneumonia, deconditioning from prolonged sedation, paradoxical agitation and disinhibition are the consequences of the dosing difficulties in alcohol withdrawal. Case reports on astronomical doses required to treat withdrawal (eg, 1600 mg of lorazepam in a day) raise questions of benzodiazepine resistance.30 Hence, multiple studies have been done to find alternatives for benzodiazepines. Our European counterparts lead the way in looking at: carbemazepine, gabapentin, gamma‐hydroxybuterate, corticotropin‐releasing hormone, baclofen, pregabalin, and phenobarbital. Again, the key issue for hospitalists: Are these benzodiazepine alternatives or additives applicable to our patients? These studies are done on outpatients with no concurrent medical illnesses. Yet, logic would suggest that it is the vulnerable hospitalized patients who might benefit the most from reducing the benzodiazepine amount using other agents.
In this issue of the Journal of Hospital Medicine, Lyon et al. provide a glimpse into possible ways to reduce the total benzodiazepine dose for general medical inpatients.31 They randomized inpatients withdrawing from alcohol to baclofen or placebo. Both groups still received PRN lorazepam based on their hospital's CIWA protocol. Prior outpatient studies have shown baclofen benefits patients undergoing alcohol withdrawal and the pathophysiology makes sense; baclofen acts on GABA b receptors. Lyon and collegaues' study results show significant reduction in the amount of benzodiazepine needed with no difference in CIWA scores.31
Is this a practice changer? Well, not yet. The numbers in the study are small and this is only 1 institution. These patients had only moderate alcohol withdrawal and the study was not powered to detect outcomes related to prevention of seizures and delirium tremens. However, the authors should be applauded for looking at alcohol withdrawal in medical inpatients.31 Trying to reduce the harm we cause with our benzodiazepine treatment regimens is a laudable goal. Inpatient alcohol withdrawal, especially for patients with medical comorbidities, is an area ripe for study and certainly deserves to have a spotlight shown on it.
Who better to do this than hospitalists? The Society of Hospital Medicine (SHM) core competency on Alcohol and Drug Withdrawal states, Hospitalists can lead their institutions in evidence based treatment protocols that improve care, reduce costs‐ and length of stay, and facilitate better overall outcomes in patients with substance related withdrawal syndromes.32 Hopefully, Lyon and collegaues' work will lead to the formation of multicenter hospitalist‐initiated studies to provide us with the best evidence for the treatment of inpatient alcohol withdrawal on our patients with comorbidities.31 Given the prevalence and potential severity of alcohol withdrawal in complex inpatients, isn't it time we really knew how to treat them?
With 17 million Americans reporting heavy drinking (5 or more drinks on 5 different occasions in the last month) and 1.7 million hospital discharges in 2006 containing at least 1 alcohol‐related diagnosis, it would be hard to imagine a hospitalist who does not encounter patients with alcohol abuse.1, 2 Estimates from studies looking at the number of risky drinkers among medical inpatients vary widely2% to 60%with more detailed studies suggesting 17% to 25% prevalence.36 Yet despite the large numbers and great costs to the healthcare system, the inpatient treatment of alcohol withdrawal syndrome remains the ugly stepsister to more exciting topics, such as acute myocardial infarction, pulmonary embolism and procedures.7, 8 We hospitalists typically leave the clinical studies, research, and interest on substance abuse to addiction specialists and psychiatrists, perhaps due to our discomfort with these patients, negative attitudes, or belief that there is nothing new in the treatment of alcohol withdrawal syndrome since Dr Leo Henryk Sternbach discovered benzodiazepines in 1957.7, 9 Many of us just admit the alcoholic patient, check the alcohol‐pathway in our order entry system, and stop thinking about it.
But in this day of evidence‐based medicine and practice, what is the evidence behind the treatment of alcohol withdrawal, especially in relation to inpatient medicine? Shouldn't we hospitalists be thinking about this question? Hospitalists tend to see 2 types of inpatients with alcohol withdrawal: those solely admitted for withdrawal, and those admitted with active medical issues who then experience alcohol withdrawal. Is there a difference?
The Diagnostic and Statistical Manual of Mental Disorders, Fourth Edition (DSM‐IV) defines early alcohol withdrawal as the first 48 hours where there is central nervous system (CNS) stimulation, adrenergic hyperactivity, and the risk of seizures. Late withdrawal, after 48 hours, includes delirium tremens (DTs) and Wernicke's encephalopathy.10 This is based on studies done in the 1950s, where researchers observed patients as they withdrew from alcohol and took notes.11, 12
The goal in treatment of alcohol withdrawal is to minimize symptoms and prevent seizures and DTs which, prior to benzodiazepines, had a mortality rate of 5% to 20%. Before the US Food and Drug Administration (FDA) approval of the first benzodiazepine in 1960 (chlordiazepoxide), physicians treated alcohol withdrawal with ethanol, antipsychotics, or paraldehyde.12 (That is why there is a P in the mnemonic MUDPILES for anion gap acidosis.) The first study to show a real benefit from benzodiazepine was published in 1969, when 537 men in a veterans detoxification unit were randomized to chlordiazepoxide (Librium), chlorpromazine (Thorazine), antihistamine, thiamine, or placebo.12 The primary outcome of DTs and seizures occurred in 10% to 16% of the patients, except for the chlordiazepoxide group where only 2% developed seizures and DTs (there was no P value calculated). Further studies published in the 1970s and early 1980s were too small to demonstrate a benefit. A 1997 meta‐analysis of all these studies, including the 1969 article,12 confirmed benzodiazepines statistically reduced seizures and DTs.13 Which benzodiazepine to use, however, is less clear. Long‐acting benzodiazepines with liver clearance (eg, chlordiazepoxide or diazepam) versus short‐acting with renal clearance (eg, oxazepam or lorazepam) is debated. While there are many strong opinions among clinicians, the same meta‐analysis did not find any difference between them, and a small 2009 study found no difference between a short‐acting and long‐acting benzodiazepine.13, 14
How much benzodiazepine to give and how frequently to dose it was looked at in 2 classic studies.15, 16 Both studies demonstrated that symptom‐triggered dosing of benzodiazepines, based on the Clinical Institute Withdrawal Assessment (CIWA) scale, performed equally well in terms of clinical outcomes, with less medication required as compared with fixed‐dose regimens. Based on these articles, many hospitals created alcohol pathways using solely symptom‐triggered dosing.
The CIWA scale is one of multiple rating scales in the assessment of alcohol withdrawal.17, 18 The CIWA‐Ar is a modified scale that was designed and validated for clinical use in inpatient detoxification centers, and excluded any active medical illness. It has gained popularity, though initial time for staff training and time for administration are limitations to its usefulness. Interestingly, vital signs, which many institutions use in their alcohol withdrawal pathways, were not strongly predictive in the CIWA study of severe withdrawal, seizures, or DTs.17
Finally, what about treatment when the patient does develop seizures or DTs? The evidence on how best to treat alcohol withdrawal seizures comes from a 1999 article which demonstrated a benefit of using lorazepam for recurrent seizures.19, 20 Unfortunately, the treatment for DTs is less clear. A 2004 meta‐analysis on the treatment of delirium tremens found benzodiazepines better than chlorpromazine (Thorazine), but benzodiazepines versus, or in addition to, newer antipsychotics have not been tested. The amount of benzodiazepine to give in DTs is only a Grade C (ie, expert opinion) recommendation: dose for light somnolence.21
All of these studies, however, come back to the basic question: Do they apply to the inpatients that hospitalists care for? A key factor to consider: All of the above‐mentioned studies, including the derivation and validation of the CIWA scale, were done in outpatient centers or inpatient detoxification centers. Patients with active medical illness or comorbidities were excluded. This data may be relevant for the patients admitted solely for alcohol withdrawal, but what about the 60 year old with diabetes, coronary artery disease, and chronic obstructive lung disease admitted for pneumonia who starts to withdraw; or the 72‐year‐old woman who breaks her hip and begins to withdraw on post‐op day 2?
There are 6 relatively recent studies that evaluate PRN (as needed) dosing of benzodiazepines on general medical inpatients.2227 While ideally these articles should apply to a hospitalist's patients, 2 of the studies excluded anyone with acute medical illness.24, 27 From the remaining 4, what do we learn? Weaver and colleagues did a randomized study on general medical patients and found less lorazepam was given with PRN versus fixed dosing.26 Unfortunately, the study was not blinded and there were statistically significant protocol errors. Comorbidity data was not given, leaving us to wonder to which inpatients this applies. Repper‐DeLisi et al. did a retrospective chart review, after implementing an alcohol pathway (not based on the CIWA scale), and did not find a statistical difference in dosing, length of stay, or delirium.25 Foy et al. looked at both medical and surgical patients, and dosed benzodiazepines based on an 18‐item CIWA scale which included vital signs.22 They found that the higher score did correlate with risk of developing severe alcohol withdrawal. However, the scale had limitations. Many patients with illness were at higher risk for severe alcohol withdrawal than their score indicated, and some high scores were believed, in part, due to illness. Jeager et al. did a pre‐comparison and post‐comparison of the implementation of a PRN CIWA protocol by chart review.23 They found a reduction in delirium in patients treated with PRN dosing, but no different in total benzodiazepine given. Because it was chart review, the authors acknowledge that defining delirium tremens was less reliable, and controlling for comorbidities was difficult. The difficult part of delirium in inpatients with alcohol abuse is that the delirium is not always just from DTs.
Two recent studies raised alarm about using a PRN CIWA pathway on patients.28, 29 A 2008 study found that 52% of patients were inappropriately put on a CIWA sliding scale when they either could not communicate or had not been recently drinking, or both.29 (The CIWA scale requires the person be able to answer symptom questions and is not applicable to non‐drinkers.) In 2005, during the implementation of an alcohol pathway at San Francisco General Hospital, an increase in mortality was noted with a PRN CIWA scale on inpatients.28
One of the conundrums for physicians is that whereas alcohol withdrawal has morbidity and mortality risks, benzodiazepine treatment itself has its own risks. Over sedation, respiratory depression, aspiration pneumonia, deconditioning from prolonged sedation, paradoxical agitation and disinhibition are the consequences of the dosing difficulties in alcohol withdrawal. Case reports on astronomical doses required to treat withdrawal (eg, 1600 mg of lorazepam in a day) raise questions of benzodiazepine resistance.30 Hence, multiple studies have been done to find alternatives for benzodiazepines. Our European counterparts lead the way in looking at: carbemazepine, gabapentin, gamma‐hydroxybuterate, corticotropin‐releasing hormone, baclofen, pregabalin, and phenobarbital. Again, the key issue for hospitalists: Are these benzodiazepine alternatives or additives applicable to our patients? These studies are done on outpatients with no concurrent medical illnesses. Yet, logic would suggest that it is the vulnerable hospitalized patients who might benefit the most from reducing the benzodiazepine amount using other agents.
In this issue of the Journal of Hospital Medicine, Lyon et al. provide a glimpse into possible ways to reduce the total benzodiazepine dose for general medical inpatients.31 They randomized inpatients withdrawing from alcohol to baclofen or placebo. Both groups still received PRN lorazepam based on their hospital's CIWA protocol. Prior outpatient studies have shown baclofen benefits patients undergoing alcohol withdrawal and the pathophysiology makes sense; baclofen acts on GABA b receptors. Lyon and collegaues' study results show significant reduction in the amount of benzodiazepine needed with no difference in CIWA scores.31
Is this a practice changer? Well, not yet. The numbers in the study are small and this is only 1 institution. These patients had only moderate alcohol withdrawal and the study was not powered to detect outcomes related to prevention of seizures and delirium tremens. However, the authors should be applauded for looking at alcohol withdrawal in medical inpatients.31 Trying to reduce the harm we cause with our benzodiazepine treatment regimens is a laudable goal. Inpatient alcohol withdrawal, especially for patients with medical comorbidities, is an area ripe for study and certainly deserves to have a spotlight shown on it.
Who better to do this than hospitalists? The Society of Hospital Medicine (SHM) core competency on Alcohol and Drug Withdrawal states, Hospitalists can lead their institutions in evidence based treatment protocols that improve care, reduce costs‐ and length of stay, and facilitate better overall outcomes in patients with substance related withdrawal syndromes.32 Hopefully, Lyon and collegaues' work will lead to the formation of multicenter hospitalist‐initiated studies to provide us with the best evidence for the treatment of inpatient alcohol withdrawal on our patients with comorbidities.31 Given the prevalence and potential severity of alcohol withdrawal in complex inpatients, isn't it time we really knew how to treat them?
- ,.Trends in Alcohol‐Related Morbidity Among Short‐Stay Community Hospital Discharges, United States, 1979–2006. Surveillance Report #84.Bethesda, MD:National Institute on Alcohol Abuse and Alcoholism, Division of Epidemiology and Prevention Research;2008.
- Substance Abuse and Mental Health Services Administration (SAMHSA).Results From the 2006 National Survey on Drug Use and Health: National Findings (Office of Applied Studies, NSDUH Series H‐32, DHHS Publication No SMA‐0704293).Rockville, MD:US Department of Health and Human Services;2007.
- ,.Alcohol‐related disease in hospital patients.Med J Aust.1986;144(10):515–517, 519.
- ,,,,.The effect of patient gender on the prevalence and recognition of alcoholism on a general medicine inpatient service.J Gen Intern Med.1992;7(1):38–45.
- ,,,,.The severity of unhealthy alcohol use in hospitalized medical patients. The spectrum is narrow.J Gen Intern Med.2006;21(4):381–385.
- ,,,,,.Prevalence, detection, and treatment of alcoholism in hospitalized patients.JAMA.1989;261(3):403–407.
- ,,,.Internal medicine residency training for unhealthy alcohol and other drug use: recommendations for curriculum design.BMC Med Educ.2010;10:22.
- .Clinical practice. Unhealthy alcohol use.N Engl J Med.2005;352(6):596–607.
- ,,,,.Good Chemistry: The Life and Legacy of Valium Inventor Leo Sternbach.New York, NY:McGraw Hill;2004.
- ,,,,.Alcohol withdrawal syndromes: a review of pathophysiology, clinical presentation, and treatment.J Gen Intern Med.1989;4(5):432–444.
- ,,,,.An experimental study of the etiology of rum fits and delirium tremens.Q J Stud Alcohol.1955;16(1):1–33.
- ,,.Treatment of the acute alcohol withdrawal state: a comparison of four drugs.Am J Psychiatry.1969;125(12):1640–1646.
- .Pharmacological management of alcohol withdrawal. A meta‐analysis and evidence‐based practice guideline. American Society of Addiction Medicine Working Group on Pharmacological Management of Alcohol Withdrawal.JAMA.1997;278(2):144–151.
- ,,.A randomized, double‐blind comparison of lorazepam and chlordiazepoxide in patients with uncomplicated alcohol withdrawal.J Stud Alcohol Drugs.2009;70(3):467–474.
- ,,,,,.Individualized treatment for alcohol withdrawal. A randomized double‐blind controlled trial.JAMA.1994;272(7):519–523.
- ,,, et al.Symptom‐triggered vs fixed‐schedule doses of benzodiazepine for alcohol withdrawal: a randomized treatment trial.Arch Intern Med.2002;162(10):1117–1121.
- ,,,,.Assessment of alcohol withdrawal: the revised clinical institute withdrawal assessment for alcohol scale (CIWA‐Ar).Br J Addict.1989;84(11):1353–1357.
- ,,.A comparison of rating scales for the alcohol‐withdrawal syndrome.Alcohol Alcohol.2001;36(2):104–108.
- ,,,,.Lorazepam for the prevention of recurrent seizures related to alcohol.N Engl J Med.1999;340(12):915–919.
- ,,,.Anticonvulsants for alcohol withdrawal.Cochrane Database Syst Rev.2010(3):CD005064.
- ,,, et al.Management of alcohol withdrawal delirium. An evidence‐based practice guideline.Arch Intern Med.2004;164(13):1405–1412.
- ,,.Use of an objective clinical scale in the assessment and management of alcohol withdrawal in a large general hospital.Alcohol Clin Exp Res.1988;12(3):360–364.
- ,,.Symptom‐triggered therapy for alcohol withdrawal syndrome in medical inpatients.Mayo Clin Proc.2001;76(7):695–701.
- ,.Routine hospital alcohol detoxification practice compared to symptom triggered management with an objective withdrawal scale (CIWA‐Ar).Am J Addict.2000;9(2):135–144.
- ,,, et al.Successful implementation of an alcohol‐withdrawal pathway in a general hospital.Psychosomatics.2008;49(4):292–299.
- ,,,.Alcohol withdrawal pharmacotherapy for inpatients with medical comorbidity.J Addict Dis.2006;25(2):17–24.
- ,,.Benzodiazepine requirements during alcohol withdrawal syndrome: clinical implications of using a standardized withdrawal scale.J Clin Psychopharmacol.1991;11(5):291–295.
- ,,, et al.Unintended consequences of a quality improvement program designed to improve treatment of alcohol withdrawal in hospitalized patients.Jt Comm J Qual Patient Saf.2005;31(3):148–157.
- ,,,.Inappropriate use of symptom‐triggered therapy for alcohol withdrawal in the general hospital.Mayo Clin Proc.2008;83(3):274–279.
- ,,.A case of alcohol withdrawal requiring 1,600 mg of lorazepam in 24 hours.CNS Spectr.2009;14(7):385–389.
- et al.J Hosp Med.2011;6:471–476.
- The core competencies in hospital medicine: a framework for curriculum development by the Society of Hospital Medicine.J Hosp Med.2006;1(suppl 1):2–95.
- ,.Trends in Alcohol‐Related Morbidity Among Short‐Stay Community Hospital Discharges, United States, 1979–2006. Surveillance Report #84.Bethesda, MD:National Institute on Alcohol Abuse and Alcoholism, Division of Epidemiology and Prevention Research;2008.
- Substance Abuse and Mental Health Services Administration (SAMHSA).Results From the 2006 National Survey on Drug Use and Health: National Findings (Office of Applied Studies, NSDUH Series H‐32, DHHS Publication No SMA‐0704293).Rockville, MD:US Department of Health and Human Services;2007.
- ,.Alcohol‐related disease in hospital patients.Med J Aust.1986;144(10):515–517, 519.
- ,,,,.The effect of patient gender on the prevalence and recognition of alcoholism on a general medicine inpatient service.J Gen Intern Med.1992;7(1):38–45.
- ,,,,.The severity of unhealthy alcohol use in hospitalized medical patients. The spectrum is narrow.J Gen Intern Med.2006;21(4):381–385.
- ,,,,,.Prevalence, detection, and treatment of alcoholism in hospitalized patients.JAMA.1989;261(3):403–407.
- ,,,.Internal medicine residency training for unhealthy alcohol and other drug use: recommendations for curriculum design.BMC Med Educ.2010;10:22.
- .Clinical practice. Unhealthy alcohol use.N Engl J Med.2005;352(6):596–607.
- ,,,,.Good Chemistry: The Life and Legacy of Valium Inventor Leo Sternbach.New York, NY:McGraw Hill;2004.
- ,,,,.Alcohol withdrawal syndromes: a review of pathophysiology, clinical presentation, and treatment.J Gen Intern Med.1989;4(5):432–444.
- ,,,,.An experimental study of the etiology of rum fits and delirium tremens.Q J Stud Alcohol.1955;16(1):1–33.
- ,,.Treatment of the acute alcohol withdrawal state: a comparison of four drugs.Am J Psychiatry.1969;125(12):1640–1646.
- .Pharmacological management of alcohol withdrawal. A meta‐analysis and evidence‐based practice guideline. American Society of Addiction Medicine Working Group on Pharmacological Management of Alcohol Withdrawal.JAMA.1997;278(2):144–151.
- ,,.A randomized, double‐blind comparison of lorazepam and chlordiazepoxide in patients with uncomplicated alcohol withdrawal.J Stud Alcohol Drugs.2009;70(3):467–474.
- ,,,,,.Individualized treatment for alcohol withdrawal. A randomized double‐blind controlled trial.JAMA.1994;272(7):519–523.
- ,,, et al.Symptom‐triggered vs fixed‐schedule doses of benzodiazepine for alcohol withdrawal: a randomized treatment trial.Arch Intern Med.2002;162(10):1117–1121.
- ,,,,.Assessment of alcohol withdrawal: the revised clinical institute withdrawal assessment for alcohol scale (CIWA‐Ar).Br J Addict.1989;84(11):1353–1357.
- ,,.A comparison of rating scales for the alcohol‐withdrawal syndrome.Alcohol Alcohol.2001;36(2):104–108.
- ,,,,.Lorazepam for the prevention of recurrent seizures related to alcohol.N Engl J Med.1999;340(12):915–919.
- ,,,.Anticonvulsants for alcohol withdrawal.Cochrane Database Syst Rev.2010(3):CD005064.
- ,,, et al.Management of alcohol withdrawal delirium. An evidence‐based practice guideline.Arch Intern Med.2004;164(13):1405–1412.
- ,,.Use of an objective clinical scale in the assessment and management of alcohol withdrawal in a large general hospital.Alcohol Clin Exp Res.1988;12(3):360–364.
- ,,.Symptom‐triggered therapy for alcohol withdrawal syndrome in medical inpatients.Mayo Clin Proc.2001;76(7):695–701.
- ,.Routine hospital alcohol detoxification practice compared to symptom triggered management with an objective withdrawal scale (CIWA‐Ar).Am J Addict.2000;9(2):135–144.
- ,,, et al.Successful implementation of an alcohol‐withdrawal pathway in a general hospital.Psychosomatics.2008;49(4):292–299.
- ,,,.Alcohol withdrawal pharmacotherapy for inpatients with medical comorbidity.J Addict Dis.2006;25(2):17–24.
- ,,.Benzodiazepine requirements during alcohol withdrawal syndrome: clinical implications of using a standardized withdrawal scale.J Clin Psychopharmacol.1991;11(5):291–295.
- ,,, et al.Unintended consequences of a quality improvement program designed to improve treatment of alcohol withdrawal in hospitalized patients.Jt Comm J Qual Patient Saf.2005;31(3):148–157.
- ,,,.Inappropriate use of symptom‐triggered therapy for alcohol withdrawal in the general hospital.Mayo Clin Proc.2008;83(3):274–279.
- ,,.A case of alcohol withdrawal requiring 1,600 mg of lorazepam in 24 hours.CNS Spectr.2009;14(7):385–389.
- et al.J Hosp Med.2011;6:471–476.
- The core competencies in hospital medicine: a framework for curriculum development by the Society of Hospital Medicine.J Hosp Med.2006;1(suppl 1):2–95.
Trends in Inpatient Continuity of Care
Continuity of care is considered by many physicians to be of critical importance in providing high‐quality patient care. Most of the research to date has focused on continuity in outpatient primary care. Research on outpatient continuity of care has been facilitated by the fact that a number of measurement tools for outpatient continuity exist.1 Outpatient continuity of care has been linked to better quality of life scores,2 lower costs,3 and less emergency room use.4 As hospital medicine has taken on more and more of the responsibility of inpatient care, primary care doctors have voiced concerns about the impact of hospitalists on overall continuity of care5 and the quality of the doctorpatient relationship.6
Recently, continuity of care in the hospital setting has also received attention. When the Accreditation Council for Graduate Medical Education (ACGME) first proposed restrictions to resident duty hours, the importance of continuity of inpatient care began to be debated in earnest in large part because of the increase in hand‐offs which accompanies discontinuity.7, 8 A recent study of hospitalist communication documented that as many as 13% of hand‐offs at the time of service changes are judged as incomplete by the receiving physician. These incomplete hand‐offs were more likely to be associated with uncertainty regarding the plan of care, as well as perceived near misses or adverse events.9 In addition, several case reports and studies suggest that systems with less continuity may have poorer outcomes.7, 1015
Continuity in the hospital setting is likely to be important for several reasons. First, the acuity of a patient's problem during a hospitalization is likely greater than during an outpatient visit. Thus the complexity of information to be transferred between physicians during a hospital stay is correspondingly greater. Second, the diagnostic uncertainty surrounding many admissions leads to complex thought processes that may be difficult to recreate when handing off patient care to another physician. Finally, knowledge of a patient's hospital course and the likely trajectory of care is facilitated by firsthand knowledge of where the patient has been. All this information can be difficult to distill into a brief sign‐out to another physician who assumes care of the patient.
In the current study, we sought to examine the trends over time in continuity of inpatient care. We chose patients likely to be cared for by general internists: those hospitalized for chronic obstructive pulmonary disease (COPD), pneumonia, and congestive heart failure (CHF). The general internists caring for patients in the hospital could be the patient's primary care physician (PCP), a physician covering for the patient's PCP, a physician assigned at admission by the hospital, or a hospitalist. Our goals were to describe the current level of continuity of care in the hospital setting, to examine whether continuity has changed over time, and to determine factors affecting continuity of care.
Methods
We used a 5% national sample of claims data from Medicare beneficiaries for the years 19962006.16 This included Medicare enrollment files, Medicare Provider Analysis and Review (MEDPAR) files, Medicare Carrier files, and Provider of Services (POS) files.17, 18
Establishment of the Study Cohort
Hospital admissions for COPD (Diagnosis Related Group [DRG] 088), pneumonia (DRG 089, 090), and CHF (DRG 127) from 1996 to 2006 for patients older than 66 years in MEDPAR were selected (n = 781,348). We excluded admissions for patients enrolled in health maintenance organizations (HMOs) or who did not have Medicare Parts A and B for the entire year prior to admission (n = 57,558). Admissions with a length of stay >18 days (n = 10,688) were considered outliers (exceeding the 99th percentile) and were excluded. Only admissions cared for by a general internist, family physician, general practitioner, or geriatrician were included (n = 528,453).
Measures
We categorized patients by age, gender, and ethnicity using Medicare enrollment files. We used the Medicaid indicator in the Medicare file as a proxy of low socioeconomic status. We used MEDPAR files to determine the origin of the admission (via the emergency department vs other), weekend versus weekday admission, and DRG. A comorbidity score was generated using the Elixhauser comorbidity scale using inpatient and outpatient billing data.19 In analyses, we listed the total number of comorbidities identified. The specialty of each physician was determined from the codes in the Medicare Carrier files. The 2004 POS files provided hospital‐level information such as zip code, metropolitan size, state, total number of beds, type of hospital, and medical school affiliation. We divided metropolitan size and total number of hospital beds into quartiles. We categorized hospitals as nonprofit, for profit, or public; medical school affiliation was categorized as non, minor, or major.
Determination of Primary Care Physician (PCP)
We identified outpatient visits using American Medical AssociationCommon Procedure Terminology (CPT) evaluation and management codes 99201 to 99205 (new patient) and 99221 to 99215 (established patient encounters). Individual providers were differentiated by using their Unique Provider Identification Number (UPIN). We defined a PCP as a general practitioner, family physician, internist, or geriatrician. Patients had to make at least 3 visits on different days to the same PCP within a year prior to the hospitalization to be categorized as having a PCP.20
Identification of Hospitalists Versus Other Generalist Physicians
As previously described, we defined hospitalists as general internal medicine physicians who derive at least 90% of their Medicare claims for Evaluation and Management services from care provided to hospitalized patients.21 Non‐hospitalist generalist physicians were those generalists who met the criteria for generalists but did not derive at least 90% of their Medicare claims from inpatient medicine.
Definition of Inpatient Continuity of Care
We measured inpatient continuity of care by number of generalist physicians (including hospitalists) who provided care during a hospitalization, through all inpatient claims made during that hospitalization. We considered patients to have had inpatient continuity of care if all billing by generalist physicians was done by one physician during the entire hospitalization.
Statistical Analyses
We calculated the percentage of admissions that received care from 1, 2, or 3 or more generalist physicians during the hospitalization, and stratified by selected patient and hospital characteristics. These proportions were also stratified by whether the patients were cared for by their outpatient PCP or not, and whether they were cared for by hospitalists or not. Based on who cared for the patient during the hospitalization, all admissions were classified as receiving care from: 1) non‐hospitalist generalist physicians, 2) a combination of generalist physicians and hospitalists, and 3) hospitalists only. The effect of patient and hospital characteristics on whether a patient experienced inpatient continuity was evaluated using a hierarchical generalized linear model (HGLM) with a logistic link, adjusting for clustering of admissions within hospitals and all covariates. We repeated our analyses using HGLM with an ordinal logit link to explore the factors associated with number of generalists seen in the hospital. All analyses were performed with SAS version 9.1 (SAS Inc, Cary, NC). The SAS GLIMMIX procedure was used to conduct multilevel analyses.
Results
Between 1996 and 2006, 528,453 patients hospitalized for COPD, pneumonia, and CHF received care by a generalist physician during their hospital stay. Of these, 64.3% were seen by one generalist physician, 26.9% by two generalist physicians, and 8.8% by three or more generalist physicians during hospitalization.
Figure 1 shows the percentage of all patients seen by 1, 2, and 3 or more generalist physicians between 1996 and 2006. The percentage of patients receiving care from one generalist physician declined from 70.7% in 1996 to 59.4% in 2006 (P < 0.001). During the same period, the percentage of patients receiving care from 3 or more generalist physicians increased from 6.5% to 10.7% (P < 0.001). Similar trends were seen for each of the 3 conditions. There was a decrease in overall length of stay during this period, from a mean of 5.7 to 4.9 days (P < 0.001). The increase in the number of generalist physicians providing care during the hospital stay did not correspond to an increase in total number of visits during the hospitalization. The average number of daily visits from a generalist physician was 0.94 (0.30) in 1996 and 0.96 (0.35) in 2006.
Table 1 presents the percentage of patients receiving care from 1, 2, and 3 or more generalist physicians during hospitalization stratified by patient and hospital characteristics. Older adults, females, non‐Hispanic whites, those with higher socioeconomic status, and those with more comorbidities were more likely to receive care by multiple generalist physicians. There was also large variation by geographic region, metropolitan area size, and hospital characteristics. All of these differences were significant at the P < 0.0001 level.
| No. of Generalist Physicians Seen During Hospitalization | ||||
|---|---|---|---|---|
| Characteristic | N | 1 | 2 | 3 (Percentage of Patients) |
| ||||
| Age at admission | ||||
| 6674 | 152,488 | 66.4 | 25.6 | 8.0 |
| 7584 | 226,802 | 63.8 | 27.3 | 8.9 |
| 85+ | 149,163 | 63.0 | 27.7 | 9.3 |
| Gender | ||||
| Male | 216,602 | 65.3 | 26.4 | 8.3 |
| Female | 311,851 | 63.6 | 27.3 | 9.1 |
| Ethnicity | ||||
| White | 461,543 | 63.7 | 27.4 | 9.0 |
| Black | 46,960 | 68.6 | 23.8 | 7.6 |
| Other | 19,950 | 67.9 | 24.5 | 7.6 |
| Low socioeconomic status | ||||
| No | 366,392 | 63.4 | 27.5 | 9.1 |
| Yes | 162,061 | 66.3 | 25.7 | 8.0 |
| Emergency admission | ||||
| No | 188,354 | 66.8 | 25.6 | 7.6 |
| Yes | 340,099 | 62.9 | 27.7 | 9.4 |
| Weekend admission | ||||
| No | 392,150 | 65.7 | 25.8 | 8.5 |
| Yes | 136,303 | 60.1 | 30.3 | 9.6 |
| Diagnosis‐related groups | ||||
| CHF | 213,914 | 65.0 | 26.3 | 8.7 |
| Pneumonia | 195,430 | 62.5 | 28.0 | 9.5 |
| COPD | 119,109 | 66.1 | 26.2 | 7.7 |
| Had a PCP | ||||
| No | 201,016 | 66.5 | 25.4 | 8.0 |
| Yes | 327,437 | 62.9 | 27.9 | 9.2 |
| Seen hospitalist | ||||
| No | 431,784 | 67.8 | 25.1 | 7.0 |
| Yes | 96,669 | 48.5 | 34.9 | 16.6 |
| Charlson comorbidity score | ||||
| 0 | 127,385 | 64.0 | 27.2 | 8.8 |
| 1 | 131,402 | 65.1 | 26.8 | 8.1 |
| 2 | 105,831 | 64.9 | 26.6 | 8.5 |
| 3 | 163,835 | 63.4 | 27.1 | 9.5 |
| ICU use | ||||
| No | 431,462 | 65.3 | 26.5 | 8.2 |
| Yes | 96,991 | 60.1 | 28.7 | 11.2 |
| Length of stay (in days) | ||||
| Mean (SD) | 4.7 (2.9) | 5.8 (3.1) | 8.1 (3.7) | |
| Geographic region | ||||
| New England | 23,572 | 55.7 | 30.8 | 13.5 |
| Middle Atlantic | 78,181 | 60.8 | 27.8 | 11.4 |
| East North Central | 98,072 | 65.7 | 26.3 | 8.0 |
| West North Central | 44,785 | 59.6 | 30.5 | 9.9 |
| South Atlantic | 104,894 | 63.8 | 27.0 | 9.2 |
| East South Central | 51,450 | 67.8 | 24.6 | 7.6 |
| West South Central | 63,493 | 69.2 | 24.8 | 6.0 |
| Mountain | 20,310 | 61.9 | 29.4 | 8.7 |
| Pacific | 36,484 | 66.7 | 26.3 | 7.0 |
| Size of metropolitan area* | ||||
| 1,000,000 | 229,145 | 63.7 | 26.5 | 9.8 |
| 250,000999,999 | 114,448 | 61.0 | 29.2 | 9.8 |
| 100,000249,999 | 11,448 | 61.3 | 30.4 | 8.3 |
| <100,000 | 171,585 | 67.4 | 25.8 | 6.8 |
| Medical school affiliation* | ||||
| Major | 77,605 | 62.9 | 26.8 | 10.3 |
| Minor | 107,144 | 61.5 | 28.4 | 10.1 |
| Non | 341,874 | 65.5 | 26.5 | 8.0 |
| Type of hospital* | ||||
| Nonprofit | 375,888 | 62.7 | 27.8 | 9.5 |
| For profit | 63,898 | 67.5 | 25.5 | 7.0 |
| Public | 86,837 | 68.9 | 24.2 | 6.9 |
| Hospital size* | . | . | . | |
| <200 beds | 232,869 | 67.2 | 25.7 | 7.1 |
| 200349 beds | 135,954 | 62.6 | 27.9 | 9.5 |
| 350499 beds | 77,080 | 61.1 | 28.3 | 10.6 |
| 500 beds | 80,723 | 61.7 | 27.6 | 10.7 |
| Discharge location | ||||
| Home | 361,893 | 66.6 | 26.0 | 7.4 |
| SNF | 94,723 | 57.6 | 30.1 | 12.3 |
| Rehab | 3,030 | 45.7 | 34.2 | 20.1 |
| Death | 22,133 | 63.1 | 25.4 | 11.5 |
| Other | 46,674 | 61.8 | 28.1 | 10.1 |
Table 2 presents the results of a multivariable analysis of factors independently associated with experiencing continuity of care. In this analysis, continuity of care was defined as receiving inpatient care from one generalist physician (vs two or more). In the unadjusted models, the odds of experiencing continuity of care decreased by 5.5% per year from 1996 through 2006, and this decrease did not substantially change after adjusting for all other variables (4.8% yearly decrease). Younger patients, females, black patients, and those with low socioeconomic status were slightly more likely to experience continuity of care. As expected, patients admitted on weekends, emergency admissions, and those with intensive care unit (ICU) stays were less likely to experience continuity. There were marked geographic variations in continuity, with continuity approximately half as likely in New England as in the South. Continuity was greatest in smaller metropolitan areas versus rural and large metropolitan areas. Hospital size and teaching status produced only minor variation.
| Characteristic | Odds Ratio (95% CI) |
|---|---|
| |
| Admission year (increase by year) | 0.952 (0.9500.954) |
| Length of stay (increase by day) | 0.822 (0.8200.823) |
| Had a PCP | |
| No | 1.0 |
| Yes | 0.762 (0.7520.773) |
| Seen by a hospitalist | |
| No | 1.0 |
| Yes | 0.391 (0.3840.398) |
| Age | |
| 6674 | 1.0 |
| 7584 | 0.959 (0.9440.973) |
| 85+ | 0.946 (0.9300.962) |
| Gender | |
| Male | 1.0 |
| Female | 1.047 (1.0331.060) |
| Ethnicity | |
| White | 1.0 |
| Black | 1.126 (1.0971.155) |
| Other | 1.062 (1.0231.103) |
| Low socioeconomic status | |
| No | 1.0 |
| Yes | 1.036 (1.0201.051) |
| Emergency admission | |
| No | 1.0 |
| Yes | 0.864 (0.8510.878) |
| Weekend admission | |
| No | 1.0 |
| Yes | 0.778 (0.7680.789) |
| Diagnosis‐related group | |
| CHF | 1.0 |
| Pneumonia | 0.964 (0.9500.978) |
| COPD | 1.002 (0.9851.019) |
| Charlson comorbidity score | |
| 0 | 1.0 |
| 1 | 1.053 (1.0351.072) |
| 2 | 1.062 (1.0421.083) |
| 3 | 1.040 (1.0221.058) |
| ICU use | |
| No | 1.0 |
| Yes | 0.918 (0.9020.935) |
| Geographic region | |
| Middle Atlantic | 1.0 |
| New England | 0.714 (0.6210.822) |
| East North Central | 1.015 (0.9221.119) |
| West North Central | 0.791 (0.7110.879) |
| South Atlantic | 1.074 (0.9711.186) |
| East South Central | 1.250 (1.1131.403) |
| West South Central | 1.377 (1.2401.530) |
| Mountain | 0.839 (0.7400.951) |
| Pacific | 0.985 (0.8841.097) |
| Size of metropolitan area | |
| 1,000,000 | 1.0 |
| 250,000999,999 | 0.743 (0.6910.798) |
| 100,000249,999 | 0.651 (0.5380.789) |
| <100,000 | 1.062 (0.9911.138) |
| Medical school affiliation | |
| None | 1.0 |
| Minor | 0.889 (0.8270.956) |
| Major | 1.048 (0.9521.154) |
| Type of hospital | |
| Nonprofit | 1.0 |
| For profit | 1.194 (1.1061.289) |
| Public | 1.394 (1.3091.484) |
| Size of hospital | |
| <200 beds | 1.0 |
| 200349 beds | 0.918 (0.8550.986) |
| 350499 beds | 0.962 (0.8721.061) |
| 500 beds | 1.000 (0.8931.119) |
In Table 2 we also show that patients with an established PCP and those who received care from a hospitalist in the hospital were substantially less likely to experience continuity of care. There are several possible interpretations for that finding. For example, it might be that patients admitted to a hospitalist service were likely to see multiple hospitalists. Alternatively, the decreased continuity associated with hospitalists could reflect the fact that some patients cared for predominantly by non‐hospitalists may have seen a hospitalist on call for a sudden change in health status. To further explore these possible explanatory pathways, we constructed three new cohorts: 1) patients receiving all their care from non‐hospitalists, 2) patients receiving all their care from hospitalists, and 3) patients seen by both. As shown in Table 3, in patients seen by non‐hospitalists only, the mean number of generalist physicians seen during hospitalization was slightly greater than in patients cared for only by hospitalists.
| Received Care During Entire Hospitalization | No. of Admissions | Mean (SD) No. of Generalist Physicians Seen During Hospitalization |
|---|---|---|
| ||
| Non‐hospitalist physician | 431,784 | 1.41 (0.68)* |
| Hospitalist physician | 64,662 | 1.34 (0.62)* |
| Both | 32,007 | 2.55 (0.83)* |
We also tested for interactions in Table 2 between admission year and other factors. There was a significant interaction between admission year and having an identifiable PCP in the year prior to admission (Table 2). The odds of experiencing continuity of care decreased more rapidly for patients who did not have a PCP (5.5% per year; 95% CI: 5.2%5.8%) than for those who had one (4.3% per year; 95% CI: 4.1%4.6%).
Discussion
We conducted this study to better understand the degree to which hospitalized patients experience discontinuity of care within a hospital stay and to determine which patients are most likely to experience discontinuity. In our study, we specifically chose admission conditions that would likely be followed primarily by generalist physicians. We found that, over the past decade, discontinuity of care for hospitalized patients has increased substantially, as indicated by the proportion of patients taken care of by more than one generalist physician during a single hospital stay. This occurred even though overall length of stay was decreasing in this same period.
It is perhaps not surprising that inpatient continuity of care has been decreasing in the past 10 years. Outpatient practices are becoming busier, and more doctors are practicing in large group practices, which could lead to several different physicians in the same practice rounding on a hospitalized patient. We have previously demonstrated that hospitalists are caring for an increasing number of patients over this same time period,21 so another possibility is that hospitalist services are being used more often because of this heavy outpatient workload. Our analyses allowed us to test the hypothesis that having hospitalists involved in patient care increases discontinuity.
At first glance, it appears that being cared for by hospitalists may result in worse continuity of care. However, closer scrutiny of the data reveals that the discontinuity ascribed to the hospitalists in the multivariable model appears to be an artifact of defining the hospitalist variable as having been seen by any hospitalist during the hospital stay. This would include patients who saw a hospitalist in addition to their PCP or another non‐hospitalist generalist. When we compared hospitalist‐only care to other generalist care, we could not detect a difference in discontinuity. We know that generalist visits per day to patients has not substantially increased over time, so this discontinuity trend is not explained by having visits by both a hospitalist and the PCP. Therefore, this combination of findings suggests that the increased discontinuity associated with having a hospitalist involved in patient care is likely the result of system issues rather than hospitalist care per se. In fact, patients seem to experience slightly better continuity when they see only hospitalists as opposed to only non‐hospitalists.
What types of systems issues might lead to this finding? Generalists in most settings could choose to involve a hospitalist at any point in the patient's hospital stay. This could occur because of a change in patient acuity requiring the involvement of hospitalists who are present in the hospital more. It is also possible that hospitalists' schedules are created to maximize inpatient continuity of care with individual hospitalists. Even though hospitalists clearly work shifts, the 7 on, 7 off model22 likely results in patients seeing the same physician each day until the switch day. This is in contrast to outpatient primary care doctors whose concentration may be on maintaining continuity within their practice.
As the field of hospital medicine was emerging, many internal medicine physicians from various specialties were concerned about the impact of hospitalists on patient care. In one study, 73% of internal medicine physicians who were not hospitalists thought that hospitalists would worsen continuity of care.23 Primary care and subspecialist internal medicine physicians also expressed the concern that hospitalists could hurt their own relationships with patients,6 presumably because of lost continuity between the inpatient and outpatient settings. However, this fear seems to diminish once hospitalist programs are implemented and primary care doctors have experience with them.23 Our study suggests that the decrease in continuity that has occurred since these studies were published is not likely due to the emergence of hospital medicine, but rather due to other factors that influence who cares for hospitalized patients.
This study had some limitations. Length of stay is an obvious mediator of number of generalist physicians seen. Therefore, the sickest patients are likely to have both a long length of stay and low continuity. We adjusted for this in the multivariable modeling. In addition, given that this study used a large database, certain details are not discernable. For example, we chose to operationalize discontinuity as visits from multiple generalists during a single hospital stay. That is not a perfect definition, but it does represent multiple physicians directing the care of a patient. Importantly, this does not appear to represent continuity with one physician with extra visits from another, as the total number of generalist visits per day did not change over time. It is also possible that patients in the non‐hospitalist group saw physicians only from a single practice, but those details are not included in the database. Finally, we cannot tell what type of hand‐offs were occurring for individual patients during each hospital stay. Despite these disadvantages, using a large database like this one allows for detection of fairly small differences that could still be clinically important.
In summary, hospitalized patients appear to experience less continuity now than 10 years ago. However, the hospitalist model does not appear to play a role in this discontinuity. It is worth exploring in more detail why patients would see both hospitalists and other generalists. This pattern is not surprising, but may have some repercussions in terms of increasing the number of hand‐offs experienced by patients. These could lead to problems with patient safety and quality of care. Future work should explore the reasons for this discontinuity and look at the relationship between inpatient discontinuity outcomes such as quality of care and the doctorpatient relationship.
Acknowledgements
The authors thank Sarah Toombs Smith, PhD, for help in preparation of the manuscript.
- .Defining and measuring interpersonal continuity of care.Ann Fam Med.2003;1(3):134–143.
- ,,.Good continuity of care may improve quality of life in Type 2 diabetes.Diabetes Res Clin Pract.2001;51(1):21–27.
- ,,,.Provider continuity in family medicine: Does it make a difference for total health care costs?Ann Fam Med.2003;1(3):144–148.
- ,,.The effect of continuity of care on emergency department use.Arch Fam Med.2000;9(4):333–338.
- ,,,,,.Physician attitudes toward and prevalence of the hospitalist model of care: Results of a national survey.Am J Med.2000;109(8):648–653.
- ,,.Physician views on caring for hospitalized patients and the hospitalist model of inpatient care.J Gen Intern Med.2001;16(2):116–119.
- ,,,,,.Systematic review: Effects of resident work hours on patient safety.Ann Intern Med.2004;141(11):851–857.
- ,,.Balancing continuity of care with residents' limited work hours: Defining the implications.Acad Med.2005;80(1):39–43.
- ,,.Understanding communication during hospitalist sevice changes: A mixed methods study.J Hosp Med.2009;4:535–540.
- ,,,Center for Safety in Emergency C. Profiles in patient safety: Emergency care transitions.Acad Emerg Med.2003;10(4):364–367.
- .Fumbled handoffs: One dropped ball after another.Ann Intern Med.2005;142(5):352–358.
- Agency for Healthcare Research and Quality. Fumbled handoff.2004. Available at: http://www.webmm.ahrq.gov/printview.aspx?caseID=55. Accessed December 27, 2005.
- ,,.Graduate medical education and patient safety: A busy—and occasionally hazardous—intersection.Ann Intern Med.2006;145(8):592–598.
- ,,,,.Does housestaff discontinuity of care increase the risk for preventable adverse events?Ann Intern Med.1994;121(11):866–872.
- ,,,.The impact of a regulation restricting medical house staff working hours on the quality of patient care.JAMA.1993;269(3):374–378.
- Centers for Medicare and Medicaid Services. Standard analytical files. Available at: http://www.cms.hhs.gov/IdentifiableDataFiles/02_Standard AnalyticalFiles.asp. Accessed March 1,2009.
- Centers for Medicare and Medicaid Services. Nonidentifiable data files: Provider of services files. Available at: http://www.cms.hhs.gov/NonIdentifiableDataFiles/04_ProviderofSerrvicesFile.asp. Accessed March 1,2009.
- Research Data Assistance Center. Medicare data file description. Available at: http://www.resdac.umn.edu/Medicare/file_descriptions.asp. Accessed March 1,2009.
- ,,,.Effect of comorbidity adjustment on CMS criteria for kidney transplant center performance.Am J Transplant.2009;9:506–516.
- ,,,,,.Continuity of outpatient and inpatient care by primary care physicians for hospitalized older adults.JAMA.2009;301:1671–1680.
- ,,,.Growth in the care of older patients by hospitalists in the United States.N Engl J Med. 2009;360:1102–1112.
- HCPro Inc.Medical Staff Leader blog.2010. Available at: http://blogs. hcpro.com/medicalstaff/2010/01/free‐form‐example‐seven‐day‐on‐seven‐day‐off‐hospitalist‐schedule/. Accessed November 20, 2010.
- ,,,.How physicians perceive hospitalist services after implementation: Anticipation vs reality.Arch Intern Med.2003;163(19):2330–2336.
Continuity of care is considered by many physicians to be of critical importance in providing high‐quality patient care. Most of the research to date has focused on continuity in outpatient primary care. Research on outpatient continuity of care has been facilitated by the fact that a number of measurement tools for outpatient continuity exist.1 Outpatient continuity of care has been linked to better quality of life scores,2 lower costs,3 and less emergency room use.4 As hospital medicine has taken on more and more of the responsibility of inpatient care, primary care doctors have voiced concerns about the impact of hospitalists on overall continuity of care5 and the quality of the doctorpatient relationship.6
Recently, continuity of care in the hospital setting has also received attention. When the Accreditation Council for Graduate Medical Education (ACGME) first proposed restrictions to resident duty hours, the importance of continuity of inpatient care began to be debated in earnest in large part because of the increase in hand‐offs which accompanies discontinuity.7, 8 A recent study of hospitalist communication documented that as many as 13% of hand‐offs at the time of service changes are judged as incomplete by the receiving physician. These incomplete hand‐offs were more likely to be associated with uncertainty regarding the plan of care, as well as perceived near misses or adverse events.9 In addition, several case reports and studies suggest that systems with less continuity may have poorer outcomes.7, 1015
Continuity in the hospital setting is likely to be important for several reasons. First, the acuity of a patient's problem during a hospitalization is likely greater than during an outpatient visit. Thus the complexity of information to be transferred between physicians during a hospital stay is correspondingly greater. Second, the diagnostic uncertainty surrounding many admissions leads to complex thought processes that may be difficult to recreate when handing off patient care to another physician. Finally, knowledge of a patient's hospital course and the likely trajectory of care is facilitated by firsthand knowledge of where the patient has been. All this information can be difficult to distill into a brief sign‐out to another physician who assumes care of the patient.
In the current study, we sought to examine the trends over time in continuity of inpatient care. We chose patients likely to be cared for by general internists: those hospitalized for chronic obstructive pulmonary disease (COPD), pneumonia, and congestive heart failure (CHF). The general internists caring for patients in the hospital could be the patient's primary care physician (PCP), a physician covering for the patient's PCP, a physician assigned at admission by the hospital, or a hospitalist. Our goals were to describe the current level of continuity of care in the hospital setting, to examine whether continuity has changed over time, and to determine factors affecting continuity of care.
Methods
We used a 5% national sample of claims data from Medicare beneficiaries for the years 19962006.16 This included Medicare enrollment files, Medicare Provider Analysis and Review (MEDPAR) files, Medicare Carrier files, and Provider of Services (POS) files.17, 18
Establishment of the Study Cohort
Hospital admissions for COPD (Diagnosis Related Group [DRG] 088), pneumonia (DRG 089, 090), and CHF (DRG 127) from 1996 to 2006 for patients older than 66 years in MEDPAR were selected (n = 781,348). We excluded admissions for patients enrolled in health maintenance organizations (HMOs) or who did not have Medicare Parts A and B for the entire year prior to admission (n = 57,558). Admissions with a length of stay >18 days (n = 10,688) were considered outliers (exceeding the 99th percentile) and were excluded. Only admissions cared for by a general internist, family physician, general practitioner, or geriatrician were included (n = 528,453).
Measures
We categorized patients by age, gender, and ethnicity using Medicare enrollment files. We used the Medicaid indicator in the Medicare file as a proxy of low socioeconomic status. We used MEDPAR files to determine the origin of the admission (via the emergency department vs other), weekend versus weekday admission, and DRG. A comorbidity score was generated using the Elixhauser comorbidity scale using inpatient and outpatient billing data.19 In analyses, we listed the total number of comorbidities identified. The specialty of each physician was determined from the codes in the Medicare Carrier files. The 2004 POS files provided hospital‐level information such as zip code, metropolitan size, state, total number of beds, type of hospital, and medical school affiliation. We divided metropolitan size and total number of hospital beds into quartiles. We categorized hospitals as nonprofit, for profit, or public; medical school affiliation was categorized as non, minor, or major.
Determination of Primary Care Physician (PCP)
We identified outpatient visits using American Medical AssociationCommon Procedure Terminology (CPT) evaluation and management codes 99201 to 99205 (new patient) and 99221 to 99215 (established patient encounters). Individual providers were differentiated by using their Unique Provider Identification Number (UPIN). We defined a PCP as a general practitioner, family physician, internist, or geriatrician. Patients had to make at least 3 visits on different days to the same PCP within a year prior to the hospitalization to be categorized as having a PCP.20
Identification of Hospitalists Versus Other Generalist Physicians
As previously described, we defined hospitalists as general internal medicine physicians who derive at least 90% of their Medicare claims for Evaluation and Management services from care provided to hospitalized patients.21 Non‐hospitalist generalist physicians were those generalists who met the criteria for generalists but did not derive at least 90% of their Medicare claims from inpatient medicine.
Definition of Inpatient Continuity of Care
We measured inpatient continuity of care by number of generalist physicians (including hospitalists) who provided care during a hospitalization, through all inpatient claims made during that hospitalization. We considered patients to have had inpatient continuity of care if all billing by generalist physicians was done by one physician during the entire hospitalization.
Statistical Analyses
We calculated the percentage of admissions that received care from 1, 2, or 3 or more generalist physicians during the hospitalization, and stratified by selected patient and hospital characteristics. These proportions were also stratified by whether the patients were cared for by their outpatient PCP or not, and whether they were cared for by hospitalists or not. Based on who cared for the patient during the hospitalization, all admissions were classified as receiving care from: 1) non‐hospitalist generalist physicians, 2) a combination of generalist physicians and hospitalists, and 3) hospitalists only. The effect of patient and hospital characteristics on whether a patient experienced inpatient continuity was evaluated using a hierarchical generalized linear model (HGLM) with a logistic link, adjusting for clustering of admissions within hospitals and all covariates. We repeated our analyses using HGLM with an ordinal logit link to explore the factors associated with number of generalists seen in the hospital. All analyses were performed with SAS version 9.1 (SAS Inc, Cary, NC). The SAS GLIMMIX procedure was used to conduct multilevel analyses.
Results
Between 1996 and 2006, 528,453 patients hospitalized for COPD, pneumonia, and CHF received care by a generalist physician during their hospital stay. Of these, 64.3% were seen by one generalist physician, 26.9% by two generalist physicians, and 8.8% by three or more generalist physicians during hospitalization.
Figure 1 shows the percentage of all patients seen by 1, 2, and 3 or more generalist physicians between 1996 and 2006. The percentage of patients receiving care from one generalist physician declined from 70.7% in 1996 to 59.4% in 2006 (P < 0.001). During the same period, the percentage of patients receiving care from 3 or more generalist physicians increased from 6.5% to 10.7% (P < 0.001). Similar trends were seen for each of the 3 conditions. There was a decrease in overall length of stay during this period, from a mean of 5.7 to 4.9 days (P < 0.001). The increase in the number of generalist physicians providing care during the hospital stay did not correspond to an increase in total number of visits during the hospitalization. The average number of daily visits from a generalist physician was 0.94 (0.30) in 1996 and 0.96 (0.35) in 2006.
Table 1 presents the percentage of patients receiving care from 1, 2, and 3 or more generalist physicians during hospitalization stratified by patient and hospital characteristics. Older adults, females, non‐Hispanic whites, those with higher socioeconomic status, and those with more comorbidities were more likely to receive care by multiple generalist physicians. There was also large variation by geographic region, metropolitan area size, and hospital characteristics. All of these differences were significant at the P < 0.0001 level.
| No. of Generalist Physicians Seen During Hospitalization | ||||
|---|---|---|---|---|
| Characteristic | N | 1 | 2 | 3 (Percentage of Patients) |
| ||||
| Age at admission | ||||
| 6674 | 152,488 | 66.4 | 25.6 | 8.0 |
| 7584 | 226,802 | 63.8 | 27.3 | 8.9 |
| 85+ | 149,163 | 63.0 | 27.7 | 9.3 |
| Gender | ||||
| Male | 216,602 | 65.3 | 26.4 | 8.3 |
| Female | 311,851 | 63.6 | 27.3 | 9.1 |
| Ethnicity | ||||
| White | 461,543 | 63.7 | 27.4 | 9.0 |
| Black | 46,960 | 68.6 | 23.8 | 7.6 |
| Other | 19,950 | 67.9 | 24.5 | 7.6 |
| Low socioeconomic status | ||||
| No | 366,392 | 63.4 | 27.5 | 9.1 |
| Yes | 162,061 | 66.3 | 25.7 | 8.0 |
| Emergency admission | ||||
| No | 188,354 | 66.8 | 25.6 | 7.6 |
| Yes | 340,099 | 62.9 | 27.7 | 9.4 |
| Weekend admission | ||||
| No | 392,150 | 65.7 | 25.8 | 8.5 |
| Yes | 136,303 | 60.1 | 30.3 | 9.6 |
| Diagnosis‐related groups | ||||
| CHF | 213,914 | 65.0 | 26.3 | 8.7 |
| Pneumonia | 195,430 | 62.5 | 28.0 | 9.5 |
| COPD | 119,109 | 66.1 | 26.2 | 7.7 |
| Had a PCP | ||||
| No | 201,016 | 66.5 | 25.4 | 8.0 |
| Yes | 327,437 | 62.9 | 27.9 | 9.2 |
| Seen hospitalist | ||||
| No | 431,784 | 67.8 | 25.1 | 7.0 |
| Yes | 96,669 | 48.5 | 34.9 | 16.6 |
| Charlson comorbidity score | ||||
| 0 | 127,385 | 64.0 | 27.2 | 8.8 |
| 1 | 131,402 | 65.1 | 26.8 | 8.1 |
| 2 | 105,831 | 64.9 | 26.6 | 8.5 |
| 3 | 163,835 | 63.4 | 27.1 | 9.5 |
| ICU use | ||||
| No | 431,462 | 65.3 | 26.5 | 8.2 |
| Yes | 96,991 | 60.1 | 28.7 | 11.2 |
| Length of stay (in days) | ||||
| Mean (SD) | 4.7 (2.9) | 5.8 (3.1) | 8.1 (3.7) | |
| Geographic region | ||||
| New England | 23,572 | 55.7 | 30.8 | 13.5 |
| Middle Atlantic | 78,181 | 60.8 | 27.8 | 11.4 |
| East North Central | 98,072 | 65.7 | 26.3 | 8.0 |
| West North Central | 44,785 | 59.6 | 30.5 | 9.9 |
| South Atlantic | 104,894 | 63.8 | 27.0 | 9.2 |
| East South Central | 51,450 | 67.8 | 24.6 | 7.6 |
| West South Central | 63,493 | 69.2 | 24.8 | 6.0 |
| Mountain | 20,310 | 61.9 | 29.4 | 8.7 |
| Pacific | 36,484 | 66.7 | 26.3 | 7.0 |
| Size of metropolitan area* | ||||
| 1,000,000 | 229,145 | 63.7 | 26.5 | 9.8 |
| 250,000999,999 | 114,448 | 61.0 | 29.2 | 9.8 |
| 100,000249,999 | 11,448 | 61.3 | 30.4 | 8.3 |
| <100,000 | 171,585 | 67.4 | 25.8 | 6.8 |
| Medical school affiliation* | ||||
| Major | 77,605 | 62.9 | 26.8 | 10.3 |
| Minor | 107,144 | 61.5 | 28.4 | 10.1 |
| Non | 341,874 | 65.5 | 26.5 | 8.0 |
| Type of hospital* | ||||
| Nonprofit | 375,888 | 62.7 | 27.8 | 9.5 |
| For profit | 63,898 | 67.5 | 25.5 | 7.0 |
| Public | 86,837 | 68.9 | 24.2 | 6.9 |
| Hospital size* | . | . | . | |
| <200 beds | 232,869 | 67.2 | 25.7 | 7.1 |
| 200349 beds | 135,954 | 62.6 | 27.9 | 9.5 |
| 350499 beds | 77,080 | 61.1 | 28.3 | 10.6 |
| 500 beds | 80,723 | 61.7 | 27.6 | 10.7 |
| Discharge location | ||||
| Home | 361,893 | 66.6 | 26.0 | 7.4 |
| SNF | 94,723 | 57.6 | 30.1 | 12.3 |
| Rehab | 3,030 | 45.7 | 34.2 | 20.1 |
| Death | 22,133 | 63.1 | 25.4 | 11.5 |
| Other | 46,674 | 61.8 | 28.1 | 10.1 |
Table 2 presents the results of a multivariable analysis of factors independently associated with experiencing continuity of care. In this analysis, continuity of care was defined as receiving inpatient care from one generalist physician (vs two or more). In the unadjusted models, the odds of experiencing continuity of care decreased by 5.5% per year from 1996 through 2006, and this decrease did not substantially change after adjusting for all other variables (4.8% yearly decrease). Younger patients, females, black patients, and those with low socioeconomic status were slightly more likely to experience continuity of care. As expected, patients admitted on weekends, emergency admissions, and those with intensive care unit (ICU) stays were less likely to experience continuity. There were marked geographic variations in continuity, with continuity approximately half as likely in New England as in the South. Continuity was greatest in smaller metropolitan areas versus rural and large metropolitan areas. Hospital size and teaching status produced only minor variation.
| Characteristic | Odds Ratio (95% CI) |
|---|---|
| |
| Admission year (increase by year) | 0.952 (0.9500.954) |
| Length of stay (increase by day) | 0.822 (0.8200.823) |
| Had a PCP | |
| No | 1.0 |
| Yes | 0.762 (0.7520.773) |
| Seen by a hospitalist | |
| No | 1.0 |
| Yes | 0.391 (0.3840.398) |
| Age | |
| 6674 | 1.0 |
| 7584 | 0.959 (0.9440.973) |
| 85+ | 0.946 (0.9300.962) |
| Gender | |
| Male | 1.0 |
| Female | 1.047 (1.0331.060) |
| Ethnicity | |
| White | 1.0 |
| Black | 1.126 (1.0971.155) |
| Other | 1.062 (1.0231.103) |
| Low socioeconomic status | |
| No | 1.0 |
| Yes | 1.036 (1.0201.051) |
| Emergency admission | |
| No | 1.0 |
| Yes | 0.864 (0.8510.878) |
| Weekend admission | |
| No | 1.0 |
| Yes | 0.778 (0.7680.789) |
| Diagnosis‐related group | |
| CHF | 1.0 |
| Pneumonia | 0.964 (0.9500.978) |
| COPD | 1.002 (0.9851.019) |
| Charlson comorbidity score | |
| 0 | 1.0 |
| 1 | 1.053 (1.0351.072) |
| 2 | 1.062 (1.0421.083) |
| 3 | 1.040 (1.0221.058) |
| ICU use | |
| No | 1.0 |
| Yes | 0.918 (0.9020.935) |
| Geographic region | |
| Middle Atlantic | 1.0 |
| New England | 0.714 (0.6210.822) |
| East North Central | 1.015 (0.9221.119) |
| West North Central | 0.791 (0.7110.879) |
| South Atlantic | 1.074 (0.9711.186) |
| East South Central | 1.250 (1.1131.403) |
| West South Central | 1.377 (1.2401.530) |
| Mountain | 0.839 (0.7400.951) |
| Pacific | 0.985 (0.8841.097) |
| Size of metropolitan area | |
| 1,000,000 | 1.0 |
| 250,000999,999 | 0.743 (0.6910.798) |
| 100,000249,999 | 0.651 (0.5380.789) |
| <100,000 | 1.062 (0.9911.138) |
| Medical school affiliation | |
| None | 1.0 |
| Minor | 0.889 (0.8270.956) |
| Major | 1.048 (0.9521.154) |
| Type of hospital | |
| Nonprofit | 1.0 |
| For profit | 1.194 (1.1061.289) |
| Public | 1.394 (1.3091.484) |
| Size of hospital | |
| <200 beds | 1.0 |
| 200349 beds | 0.918 (0.8550.986) |
| 350499 beds | 0.962 (0.8721.061) |
| 500 beds | 1.000 (0.8931.119) |
In Table 2 we also show that patients with an established PCP and those who received care from a hospitalist in the hospital were substantially less likely to experience continuity of care. There are several possible interpretations for that finding. For example, it might be that patients admitted to a hospitalist service were likely to see multiple hospitalists. Alternatively, the decreased continuity associated with hospitalists could reflect the fact that some patients cared for predominantly by non‐hospitalists may have seen a hospitalist on call for a sudden change in health status. To further explore these possible explanatory pathways, we constructed three new cohorts: 1) patients receiving all their care from non‐hospitalists, 2) patients receiving all their care from hospitalists, and 3) patients seen by both. As shown in Table 3, in patients seen by non‐hospitalists only, the mean number of generalist physicians seen during hospitalization was slightly greater than in patients cared for only by hospitalists.
| Received Care During Entire Hospitalization | No. of Admissions | Mean (SD) No. of Generalist Physicians Seen During Hospitalization |
|---|---|---|
| ||
| Non‐hospitalist physician | 431,784 | 1.41 (0.68)* |
| Hospitalist physician | 64,662 | 1.34 (0.62)* |
| Both | 32,007 | 2.55 (0.83)* |
We also tested for interactions in Table 2 between admission year and other factors. There was a significant interaction between admission year and having an identifiable PCP in the year prior to admission (Table 2). The odds of experiencing continuity of care decreased more rapidly for patients who did not have a PCP (5.5% per year; 95% CI: 5.2%5.8%) than for those who had one (4.3% per year; 95% CI: 4.1%4.6%).
Discussion
We conducted this study to better understand the degree to which hospitalized patients experience discontinuity of care within a hospital stay and to determine which patients are most likely to experience discontinuity. In our study, we specifically chose admission conditions that would likely be followed primarily by generalist physicians. We found that, over the past decade, discontinuity of care for hospitalized patients has increased substantially, as indicated by the proportion of patients taken care of by more than one generalist physician during a single hospital stay. This occurred even though overall length of stay was decreasing in this same period.
It is perhaps not surprising that inpatient continuity of care has been decreasing in the past 10 years. Outpatient practices are becoming busier, and more doctors are practicing in large group practices, which could lead to several different physicians in the same practice rounding on a hospitalized patient. We have previously demonstrated that hospitalists are caring for an increasing number of patients over this same time period,21 so another possibility is that hospitalist services are being used more often because of this heavy outpatient workload. Our analyses allowed us to test the hypothesis that having hospitalists involved in patient care increases discontinuity.
At first glance, it appears that being cared for by hospitalists may result in worse continuity of care. However, closer scrutiny of the data reveals that the discontinuity ascribed to the hospitalists in the multivariable model appears to be an artifact of defining the hospitalist variable as having been seen by any hospitalist during the hospital stay. This would include patients who saw a hospitalist in addition to their PCP or another non‐hospitalist generalist. When we compared hospitalist‐only care to other generalist care, we could not detect a difference in discontinuity. We know that generalist visits per day to patients has not substantially increased over time, so this discontinuity trend is not explained by having visits by both a hospitalist and the PCP. Therefore, this combination of findings suggests that the increased discontinuity associated with having a hospitalist involved in patient care is likely the result of system issues rather than hospitalist care per se. In fact, patients seem to experience slightly better continuity when they see only hospitalists as opposed to only non‐hospitalists.
What types of systems issues might lead to this finding? Generalists in most settings could choose to involve a hospitalist at any point in the patient's hospital stay. This could occur because of a change in patient acuity requiring the involvement of hospitalists who are present in the hospital more. It is also possible that hospitalists' schedules are created to maximize inpatient continuity of care with individual hospitalists. Even though hospitalists clearly work shifts, the 7 on, 7 off model22 likely results in patients seeing the same physician each day until the switch day. This is in contrast to outpatient primary care doctors whose concentration may be on maintaining continuity within their practice.
As the field of hospital medicine was emerging, many internal medicine physicians from various specialties were concerned about the impact of hospitalists on patient care. In one study, 73% of internal medicine physicians who were not hospitalists thought that hospitalists would worsen continuity of care.23 Primary care and subspecialist internal medicine physicians also expressed the concern that hospitalists could hurt their own relationships with patients,6 presumably because of lost continuity between the inpatient and outpatient settings. However, this fear seems to diminish once hospitalist programs are implemented and primary care doctors have experience with them.23 Our study suggests that the decrease in continuity that has occurred since these studies were published is not likely due to the emergence of hospital medicine, but rather due to other factors that influence who cares for hospitalized patients.
This study had some limitations. Length of stay is an obvious mediator of number of generalist physicians seen. Therefore, the sickest patients are likely to have both a long length of stay and low continuity. We adjusted for this in the multivariable modeling. In addition, given that this study used a large database, certain details are not discernable. For example, we chose to operationalize discontinuity as visits from multiple generalists during a single hospital stay. That is not a perfect definition, but it does represent multiple physicians directing the care of a patient. Importantly, this does not appear to represent continuity with one physician with extra visits from another, as the total number of generalist visits per day did not change over time. It is also possible that patients in the non‐hospitalist group saw physicians only from a single practice, but those details are not included in the database. Finally, we cannot tell what type of hand‐offs were occurring for individual patients during each hospital stay. Despite these disadvantages, using a large database like this one allows for detection of fairly small differences that could still be clinically important.
In summary, hospitalized patients appear to experience less continuity now than 10 years ago. However, the hospitalist model does not appear to play a role in this discontinuity. It is worth exploring in more detail why patients would see both hospitalists and other generalists. This pattern is not surprising, but may have some repercussions in terms of increasing the number of hand‐offs experienced by patients. These could lead to problems with patient safety and quality of care. Future work should explore the reasons for this discontinuity and look at the relationship between inpatient discontinuity outcomes such as quality of care and the doctorpatient relationship.
Acknowledgements
The authors thank Sarah Toombs Smith, PhD, for help in preparation of the manuscript.
Continuity of care is considered by many physicians to be of critical importance in providing high‐quality patient care. Most of the research to date has focused on continuity in outpatient primary care. Research on outpatient continuity of care has been facilitated by the fact that a number of measurement tools for outpatient continuity exist.1 Outpatient continuity of care has been linked to better quality of life scores,2 lower costs,3 and less emergency room use.4 As hospital medicine has taken on more and more of the responsibility of inpatient care, primary care doctors have voiced concerns about the impact of hospitalists on overall continuity of care5 and the quality of the doctorpatient relationship.6
Recently, continuity of care in the hospital setting has also received attention. When the Accreditation Council for Graduate Medical Education (ACGME) first proposed restrictions to resident duty hours, the importance of continuity of inpatient care began to be debated in earnest in large part because of the increase in hand‐offs which accompanies discontinuity.7, 8 A recent study of hospitalist communication documented that as many as 13% of hand‐offs at the time of service changes are judged as incomplete by the receiving physician. These incomplete hand‐offs were more likely to be associated with uncertainty regarding the plan of care, as well as perceived near misses or adverse events.9 In addition, several case reports and studies suggest that systems with less continuity may have poorer outcomes.7, 1015
Continuity in the hospital setting is likely to be important for several reasons. First, the acuity of a patient's problem during a hospitalization is likely greater than during an outpatient visit. Thus the complexity of information to be transferred between physicians during a hospital stay is correspondingly greater. Second, the diagnostic uncertainty surrounding many admissions leads to complex thought processes that may be difficult to recreate when handing off patient care to another physician. Finally, knowledge of a patient's hospital course and the likely trajectory of care is facilitated by firsthand knowledge of where the patient has been. All this information can be difficult to distill into a brief sign‐out to another physician who assumes care of the patient.
In the current study, we sought to examine the trends over time in continuity of inpatient care. We chose patients likely to be cared for by general internists: those hospitalized for chronic obstructive pulmonary disease (COPD), pneumonia, and congestive heart failure (CHF). The general internists caring for patients in the hospital could be the patient's primary care physician (PCP), a physician covering for the patient's PCP, a physician assigned at admission by the hospital, or a hospitalist. Our goals were to describe the current level of continuity of care in the hospital setting, to examine whether continuity has changed over time, and to determine factors affecting continuity of care.
Methods
We used a 5% national sample of claims data from Medicare beneficiaries for the years 19962006.16 This included Medicare enrollment files, Medicare Provider Analysis and Review (MEDPAR) files, Medicare Carrier files, and Provider of Services (POS) files.17, 18
Establishment of the Study Cohort
Hospital admissions for COPD (Diagnosis Related Group [DRG] 088), pneumonia (DRG 089, 090), and CHF (DRG 127) from 1996 to 2006 for patients older than 66 years in MEDPAR were selected (n = 781,348). We excluded admissions for patients enrolled in health maintenance organizations (HMOs) or who did not have Medicare Parts A and B for the entire year prior to admission (n = 57,558). Admissions with a length of stay >18 days (n = 10,688) were considered outliers (exceeding the 99th percentile) and were excluded. Only admissions cared for by a general internist, family physician, general practitioner, or geriatrician were included (n = 528,453).
Measures
We categorized patients by age, gender, and ethnicity using Medicare enrollment files. We used the Medicaid indicator in the Medicare file as a proxy of low socioeconomic status. We used MEDPAR files to determine the origin of the admission (via the emergency department vs other), weekend versus weekday admission, and DRG. A comorbidity score was generated using the Elixhauser comorbidity scale using inpatient and outpatient billing data.19 In analyses, we listed the total number of comorbidities identified. The specialty of each physician was determined from the codes in the Medicare Carrier files. The 2004 POS files provided hospital‐level information such as zip code, metropolitan size, state, total number of beds, type of hospital, and medical school affiliation. We divided metropolitan size and total number of hospital beds into quartiles. We categorized hospitals as nonprofit, for profit, or public; medical school affiliation was categorized as non, minor, or major.
Determination of Primary Care Physician (PCP)
We identified outpatient visits using American Medical AssociationCommon Procedure Terminology (CPT) evaluation and management codes 99201 to 99205 (new patient) and 99221 to 99215 (established patient encounters). Individual providers were differentiated by using their Unique Provider Identification Number (UPIN). We defined a PCP as a general practitioner, family physician, internist, or geriatrician. Patients had to make at least 3 visits on different days to the same PCP within a year prior to the hospitalization to be categorized as having a PCP.20
Identification of Hospitalists Versus Other Generalist Physicians
As previously described, we defined hospitalists as general internal medicine physicians who derive at least 90% of their Medicare claims for Evaluation and Management services from care provided to hospitalized patients.21 Non‐hospitalist generalist physicians were those generalists who met the criteria for generalists but did not derive at least 90% of their Medicare claims from inpatient medicine.
Definition of Inpatient Continuity of Care
We measured inpatient continuity of care by number of generalist physicians (including hospitalists) who provided care during a hospitalization, through all inpatient claims made during that hospitalization. We considered patients to have had inpatient continuity of care if all billing by generalist physicians was done by one physician during the entire hospitalization.
Statistical Analyses
We calculated the percentage of admissions that received care from 1, 2, or 3 or more generalist physicians during the hospitalization, and stratified by selected patient and hospital characteristics. These proportions were also stratified by whether the patients were cared for by their outpatient PCP or not, and whether they were cared for by hospitalists or not. Based on who cared for the patient during the hospitalization, all admissions were classified as receiving care from: 1) non‐hospitalist generalist physicians, 2) a combination of generalist physicians and hospitalists, and 3) hospitalists only. The effect of patient and hospital characteristics on whether a patient experienced inpatient continuity was evaluated using a hierarchical generalized linear model (HGLM) with a logistic link, adjusting for clustering of admissions within hospitals and all covariates. We repeated our analyses using HGLM with an ordinal logit link to explore the factors associated with number of generalists seen in the hospital. All analyses were performed with SAS version 9.1 (SAS Inc, Cary, NC). The SAS GLIMMIX procedure was used to conduct multilevel analyses.
Results
Between 1996 and 2006, 528,453 patients hospitalized for COPD, pneumonia, and CHF received care by a generalist physician during their hospital stay. Of these, 64.3% were seen by one generalist physician, 26.9% by two generalist physicians, and 8.8% by three or more generalist physicians during hospitalization.
Figure 1 shows the percentage of all patients seen by 1, 2, and 3 or more generalist physicians between 1996 and 2006. The percentage of patients receiving care from one generalist physician declined from 70.7% in 1996 to 59.4% in 2006 (P < 0.001). During the same period, the percentage of patients receiving care from 3 or more generalist physicians increased from 6.5% to 10.7% (P < 0.001). Similar trends were seen for each of the 3 conditions. There was a decrease in overall length of stay during this period, from a mean of 5.7 to 4.9 days (P < 0.001). The increase in the number of generalist physicians providing care during the hospital stay did not correspond to an increase in total number of visits during the hospitalization. The average number of daily visits from a generalist physician was 0.94 (0.30) in 1996 and 0.96 (0.35) in 2006.
Table 1 presents the percentage of patients receiving care from 1, 2, and 3 or more generalist physicians during hospitalization stratified by patient and hospital characteristics. Older adults, females, non‐Hispanic whites, those with higher socioeconomic status, and those with more comorbidities were more likely to receive care by multiple generalist physicians. There was also large variation by geographic region, metropolitan area size, and hospital characteristics. All of these differences were significant at the P < 0.0001 level.
| No. of Generalist Physicians Seen During Hospitalization | ||||
|---|---|---|---|---|
| Characteristic | N | 1 | 2 | 3 (Percentage of Patients) |
| ||||
| Age at admission | ||||
| 6674 | 152,488 | 66.4 | 25.6 | 8.0 |
| 7584 | 226,802 | 63.8 | 27.3 | 8.9 |
| 85+ | 149,163 | 63.0 | 27.7 | 9.3 |
| Gender | ||||
| Male | 216,602 | 65.3 | 26.4 | 8.3 |
| Female | 311,851 | 63.6 | 27.3 | 9.1 |
| Ethnicity | ||||
| White | 461,543 | 63.7 | 27.4 | 9.0 |
| Black | 46,960 | 68.6 | 23.8 | 7.6 |
| Other | 19,950 | 67.9 | 24.5 | 7.6 |
| Low socioeconomic status | ||||
| No | 366,392 | 63.4 | 27.5 | 9.1 |
| Yes | 162,061 | 66.3 | 25.7 | 8.0 |
| Emergency admission | ||||
| No | 188,354 | 66.8 | 25.6 | 7.6 |
| Yes | 340,099 | 62.9 | 27.7 | 9.4 |
| Weekend admission | ||||
| No | 392,150 | 65.7 | 25.8 | 8.5 |
| Yes | 136,303 | 60.1 | 30.3 | 9.6 |
| Diagnosis‐related groups | ||||
| CHF | 213,914 | 65.0 | 26.3 | 8.7 |
| Pneumonia | 195,430 | 62.5 | 28.0 | 9.5 |
| COPD | 119,109 | 66.1 | 26.2 | 7.7 |
| Had a PCP | ||||
| No | 201,016 | 66.5 | 25.4 | 8.0 |
| Yes | 327,437 | 62.9 | 27.9 | 9.2 |
| Seen hospitalist | ||||
| No | 431,784 | 67.8 | 25.1 | 7.0 |
| Yes | 96,669 | 48.5 | 34.9 | 16.6 |
| Charlson comorbidity score | ||||
| 0 | 127,385 | 64.0 | 27.2 | 8.8 |
| 1 | 131,402 | 65.1 | 26.8 | 8.1 |
| 2 | 105,831 | 64.9 | 26.6 | 8.5 |
| 3 | 163,835 | 63.4 | 27.1 | 9.5 |
| ICU use | ||||
| No | 431,462 | 65.3 | 26.5 | 8.2 |
| Yes | 96,991 | 60.1 | 28.7 | 11.2 |
| Length of stay (in days) | ||||
| Mean (SD) | 4.7 (2.9) | 5.8 (3.1) | 8.1 (3.7) | |
| Geographic region | ||||
| New England | 23,572 | 55.7 | 30.8 | 13.5 |
| Middle Atlantic | 78,181 | 60.8 | 27.8 | 11.4 |
| East North Central | 98,072 | 65.7 | 26.3 | 8.0 |
| West North Central | 44,785 | 59.6 | 30.5 | 9.9 |
| South Atlantic | 104,894 | 63.8 | 27.0 | 9.2 |
| East South Central | 51,450 | 67.8 | 24.6 | 7.6 |
| West South Central | 63,493 | 69.2 | 24.8 | 6.0 |
| Mountain | 20,310 | 61.9 | 29.4 | 8.7 |
| Pacific | 36,484 | 66.7 | 26.3 | 7.0 |
| Size of metropolitan area* | ||||
| 1,000,000 | 229,145 | 63.7 | 26.5 | 9.8 |
| 250,000999,999 | 114,448 | 61.0 | 29.2 | 9.8 |
| 100,000249,999 | 11,448 | 61.3 | 30.4 | 8.3 |
| <100,000 | 171,585 | 67.4 | 25.8 | 6.8 |
| Medical school affiliation* | ||||
| Major | 77,605 | 62.9 | 26.8 | 10.3 |
| Minor | 107,144 | 61.5 | 28.4 | 10.1 |
| Non | 341,874 | 65.5 | 26.5 | 8.0 |
| Type of hospital* | ||||
| Nonprofit | 375,888 | 62.7 | 27.8 | 9.5 |
| For profit | 63,898 | 67.5 | 25.5 | 7.0 |
| Public | 86,837 | 68.9 | 24.2 | 6.9 |
| Hospital size* | . | . | . | |
| <200 beds | 232,869 | 67.2 | 25.7 | 7.1 |
| 200349 beds | 135,954 | 62.6 | 27.9 | 9.5 |
| 350499 beds | 77,080 | 61.1 | 28.3 | 10.6 |
| 500 beds | 80,723 | 61.7 | 27.6 | 10.7 |
| Discharge location | ||||
| Home | 361,893 | 66.6 | 26.0 | 7.4 |
| SNF | 94,723 | 57.6 | 30.1 | 12.3 |
| Rehab | 3,030 | 45.7 | 34.2 | 20.1 |
| Death | 22,133 | 63.1 | 25.4 | 11.5 |
| Other | 46,674 | 61.8 | 28.1 | 10.1 |
Table 2 presents the results of a multivariable analysis of factors independently associated with experiencing continuity of care. In this analysis, continuity of care was defined as receiving inpatient care from one generalist physician (vs two or more). In the unadjusted models, the odds of experiencing continuity of care decreased by 5.5% per year from 1996 through 2006, and this decrease did not substantially change after adjusting for all other variables (4.8% yearly decrease). Younger patients, females, black patients, and those with low socioeconomic status were slightly more likely to experience continuity of care. As expected, patients admitted on weekends, emergency admissions, and those with intensive care unit (ICU) stays were less likely to experience continuity. There were marked geographic variations in continuity, with continuity approximately half as likely in New England as in the South. Continuity was greatest in smaller metropolitan areas versus rural and large metropolitan areas. Hospital size and teaching status produced only minor variation.
| Characteristic | Odds Ratio (95% CI) |
|---|---|
| |
| Admission year (increase by year) | 0.952 (0.9500.954) |
| Length of stay (increase by day) | 0.822 (0.8200.823) |
| Had a PCP | |
| No | 1.0 |
| Yes | 0.762 (0.7520.773) |
| Seen by a hospitalist | |
| No | 1.0 |
| Yes | 0.391 (0.3840.398) |
| Age | |
| 6674 | 1.0 |
| 7584 | 0.959 (0.9440.973) |
| 85+ | 0.946 (0.9300.962) |
| Gender | |
| Male | 1.0 |
| Female | 1.047 (1.0331.060) |
| Ethnicity | |
| White | 1.0 |
| Black | 1.126 (1.0971.155) |
| Other | 1.062 (1.0231.103) |
| Low socioeconomic status | |
| No | 1.0 |
| Yes | 1.036 (1.0201.051) |
| Emergency admission | |
| No | 1.0 |
| Yes | 0.864 (0.8510.878) |
| Weekend admission | |
| No | 1.0 |
| Yes | 0.778 (0.7680.789) |
| Diagnosis‐related group | |
| CHF | 1.0 |
| Pneumonia | 0.964 (0.9500.978) |
| COPD | 1.002 (0.9851.019) |
| Charlson comorbidity score | |
| 0 | 1.0 |
| 1 | 1.053 (1.0351.072) |
| 2 | 1.062 (1.0421.083) |
| 3 | 1.040 (1.0221.058) |
| ICU use | |
| No | 1.0 |
| Yes | 0.918 (0.9020.935) |
| Geographic region | |
| Middle Atlantic | 1.0 |
| New England | 0.714 (0.6210.822) |
| East North Central | 1.015 (0.9221.119) |
| West North Central | 0.791 (0.7110.879) |
| South Atlantic | 1.074 (0.9711.186) |
| East South Central | 1.250 (1.1131.403) |
| West South Central | 1.377 (1.2401.530) |
| Mountain | 0.839 (0.7400.951) |
| Pacific | 0.985 (0.8841.097) |
| Size of metropolitan area | |
| 1,000,000 | 1.0 |
| 250,000999,999 | 0.743 (0.6910.798) |
| 100,000249,999 | 0.651 (0.5380.789) |
| <100,000 | 1.062 (0.9911.138) |
| Medical school affiliation | |
| None | 1.0 |
| Minor | 0.889 (0.8270.956) |
| Major | 1.048 (0.9521.154) |
| Type of hospital | |
| Nonprofit | 1.0 |
| For profit | 1.194 (1.1061.289) |
| Public | 1.394 (1.3091.484) |
| Size of hospital | |
| <200 beds | 1.0 |
| 200349 beds | 0.918 (0.8550.986) |
| 350499 beds | 0.962 (0.8721.061) |
| 500 beds | 1.000 (0.8931.119) |
In Table 2 we also show that patients with an established PCP and those who received care from a hospitalist in the hospital were substantially less likely to experience continuity of care. There are several possible interpretations for that finding. For example, it might be that patients admitted to a hospitalist service were likely to see multiple hospitalists. Alternatively, the decreased continuity associated with hospitalists could reflect the fact that some patients cared for predominantly by non‐hospitalists may have seen a hospitalist on call for a sudden change in health status. To further explore these possible explanatory pathways, we constructed three new cohorts: 1) patients receiving all their care from non‐hospitalists, 2) patients receiving all their care from hospitalists, and 3) patients seen by both. As shown in Table 3, in patients seen by non‐hospitalists only, the mean number of generalist physicians seen during hospitalization was slightly greater than in patients cared for only by hospitalists.
| Received Care During Entire Hospitalization | No. of Admissions | Mean (SD) No. of Generalist Physicians Seen During Hospitalization |
|---|---|---|
| ||
| Non‐hospitalist physician | 431,784 | 1.41 (0.68)* |
| Hospitalist physician | 64,662 | 1.34 (0.62)* |
| Both | 32,007 | 2.55 (0.83)* |
We also tested for interactions in Table 2 between admission year and other factors. There was a significant interaction between admission year and having an identifiable PCP in the year prior to admission (Table 2). The odds of experiencing continuity of care decreased more rapidly for patients who did not have a PCP (5.5% per year; 95% CI: 5.2%5.8%) than for those who had one (4.3% per year; 95% CI: 4.1%4.6%).
Discussion
We conducted this study to better understand the degree to which hospitalized patients experience discontinuity of care within a hospital stay and to determine which patients are most likely to experience discontinuity. In our study, we specifically chose admission conditions that would likely be followed primarily by generalist physicians. We found that, over the past decade, discontinuity of care for hospitalized patients has increased substantially, as indicated by the proportion of patients taken care of by more than one generalist physician during a single hospital stay. This occurred even though overall length of stay was decreasing in this same period.
It is perhaps not surprising that inpatient continuity of care has been decreasing in the past 10 years. Outpatient practices are becoming busier, and more doctors are practicing in large group practices, which could lead to several different physicians in the same practice rounding on a hospitalized patient. We have previously demonstrated that hospitalists are caring for an increasing number of patients over this same time period,21 so another possibility is that hospitalist services are being used more often because of this heavy outpatient workload. Our analyses allowed us to test the hypothesis that having hospitalists involved in patient care increases discontinuity.
At first glance, it appears that being cared for by hospitalists may result in worse continuity of care. However, closer scrutiny of the data reveals that the discontinuity ascribed to the hospitalists in the multivariable model appears to be an artifact of defining the hospitalist variable as having been seen by any hospitalist during the hospital stay. This would include patients who saw a hospitalist in addition to their PCP or another non‐hospitalist generalist. When we compared hospitalist‐only care to other generalist care, we could not detect a difference in discontinuity. We know that generalist visits per day to patients has not substantially increased over time, so this discontinuity trend is not explained by having visits by both a hospitalist and the PCP. Therefore, this combination of findings suggests that the increased discontinuity associated with having a hospitalist involved in patient care is likely the result of system issues rather than hospitalist care per se. In fact, patients seem to experience slightly better continuity when they see only hospitalists as opposed to only non‐hospitalists.
What types of systems issues might lead to this finding? Generalists in most settings could choose to involve a hospitalist at any point in the patient's hospital stay. This could occur because of a change in patient acuity requiring the involvement of hospitalists who are present in the hospital more. It is also possible that hospitalists' schedules are created to maximize inpatient continuity of care with individual hospitalists. Even though hospitalists clearly work shifts, the 7 on, 7 off model22 likely results in patients seeing the same physician each day until the switch day. This is in contrast to outpatient primary care doctors whose concentration may be on maintaining continuity within their practice.
As the field of hospital medicine was emerging, many internal medicine physicians from various specialties were concerned about the impact of hospitalists on patient care. In one study, 73% of internal medicine physicians who were not hospitalists thought that hospitalists would worsen continuity of care.23 Primary care and subspecialist internal medicine physicians also expressed the concern that hospitalists could hurt their own relationships with patients,6 presumably because of lost continuity between the inpatient and outpatient settings. However, this fear seems to diminish once hospitalist programs are implemented and primary care doctors have experience with them.23 Our study suggests that the decrease in continuity that has occurred since these studies were published is not likely due to the emergence of hospital medicine, but rather due to other factors that influence who cares for hospitalized patients.
This study had some limitations. Length of stay is an obvious mediator of number of generalist physicians seen. Therefore, the sickest patients are likely to have both a long length of stay and low continuity. We adjusted for this in the multivariable modeling. In addition, given that this study used a large database, certain details are not discernable. For example, we chose to operationalize discontinuity as visits from multiple generalists during a single hospital stay. That is not a perfect definition, but it does represent multiple physicians directing the care of a patient. Importantly, this does not appear to represent continuity with one physician with extra visits from another, as the total number of generalist visits per day did not change over time. It is also possible that patients in the non‐hospitalist group saw physicians only from a single practice, but those details are not included in the database. Finally, we cannot tell what type of hand‐offs were occurring for individual patients during each hospital stay. Despite these disadvantages, using a large database like this one allows for detection of fairly small differences that could still be clinically important.
In summary, hospitalized patients appear to experience less continuity now than 10 years ago. However, the hospitalist model does not appear to play a role in this discontinuity. It is worth exploring in more detail why patients would see both hospitalists and other generalists. This pattern is not surprising, but may have some repercussions in terms of increasing the number of hand‐offs experienced by patients. These could lead to problems with patient safety and quality of care. Future work should explore the reasons for this discontinuity and look at the relationship between inpatient discontinuity outcomes such as quality of care and the doctorpatient relationship.
Acknowledgements
The authors thank Sarah Toombs Smith, PhD, for help in preparation of the manuscript.
- .Defining and measuring interpersonal continuity of care.Ann Fam Med.2003;1(3):134–143.
- ,,.Good continuity of care may improve quality of life in Type 2 diabetes.Diabetes Res Clin Pract.2001;51(1):21–27.
- ,,,.Provider continuity in family medicine: Does it make a difference for total health care costs?Ann Fam Med.2003;1(3):144–148.
- ,,.The effect of continuity of care on emergency department use.Arch Fam Med.2000;9(4):333–338.
- ,,,,,.Physician attitudes toward and prevalence of the hospitalist model of care: Results of a national survey.Am J Med.2000;109(8):648–653.
- ,,.Physician views on caring for hospitalized patients and the hospitalist model of inpatient care.J Gen Intern Med.2001;16(2):116–119.
- ,,,,,.Systematic review: Effects of resident work hours on patient safety.Ann Intern Med.2004;141(11):851–857.
- ,,.Balancing continuity of care with residents' limited work hours: Defining the implications.Acad Med.2005;80(1):39–43.
- ,,.Understanding communication during hospitalist sevice changes: A mixed methods study.J Hosp Med.2009;4:535–540.
- ,,,Center for Safety in Emergency C. Profiles in patient safety: Emergency care transitions.Acad Emerg Med.2003;10(4):364–367.
- .Fumbled handoffs: One dropped ball after another.Ann Intern Med.2005;142(5):352–358.
- Agency for Healthcare Research and Quality. Fumbled handoff.2004. Available at: http://www.webmm.ahrq.gov/printview.aspx?caseID=55. Accessed December 27, 2005.
- ,,.Graduate medical education and patient safety: A busy—and occasionally hazardous—intersection.Ann Intern Med.2006;145(8):592–598.
- ,,,,.Does housestaff discontinuity of care increase the risk for preventable adverse events?Ann Intern Med.1994;121(11):866–872.
- ,,,.The impact of a regulation restricting medical house staff working hours on the quality of patient care.JAMA.1993;269(3):374–378.
- Centers for Medicare and Medicaid Services. Standard analytical files. Available at: http://www.cms.hhs.gov/IdentifiableDataFiles/02_Standard AnalyticalFiles.asp. Accessed March 1,2009.
- Centers for Medicare and Medicaid Services. Nonidentifiable data files: Provider of services files. Available at: http://www.cms.hhs.gov/NonIdentifiableDataFiles/04_ProviderofSerrvicesFile.asp. Accessed March 1,2009.
- Research Data Assistance Center. Medicare data file description. Available at: http://www.resdac.umn.edu/Medicare/file_descriptions.asp. Accessed March 1,2009.
- ,,,.Effect of comorbidity adjustment on CMS criteria for kidney transplant center performance.Am J Transplant.2009;9:506–516.
- ,,,,,.Continuity of outpatient and inpatient care by primary care physicians for hospitalized older adults.JAMA.2009;301:1671–1680.
- ,,,.Growth in the care of older patients by hospitalists in the United States.N Engl J Med. 2009;360:1102–1112.
- HCPro Inc.Medical Staff Leader blog.2010. Available at: http://blogs. hcpro.com/medicalstaff/2010/01/free‐form‐example‐seven‐day‐on‐seven‐day‐off‐hospitalist‐schedule/. Accessed November 20, 2010.
- ,,,.How physicians perceive hospitalist services after implementation: Anticipation vs reality.Arch Intern Med.2003;163(19):2330–2336.
- .Defining and measuring interpersonal continuity of care.Ann Fam Med.2003;1(3):134–143.
- ,,.Good continuity of care may improve quality of life in Type 2 diabetes.Diabetes Res Clin Pract.2001;51(1):21–27.
- ,,,.Provider continuity in family medicine: Does it make a difference for total health care costs?Ann Fam Med.2003;1(3):144–148.
- ,,.The effect of continuity of care on emergency department use.Arch Fam Med.2000;9(4):333–338.
- ,,,,,.Physician attitudes toward and prevalence of the hospitalist model of care: Results of a national survey.Am J Med.2000;109(8):648–653.
- ,,.Physician views on caring for hospitalized patients and the hospitalist model of inpatient care.J Gen Intern Med.2001;16(2):116–119.
- ,,,,,.Systematic review: Effects of resident work hours on patient safety.Ann Intern Med.2004;141(11):851–857.
- ,,.Balancing continuity of care with residents' limited work hours: Defining the implications.Acad Med.2005;80(1):39–43.
- ,,.Understanding communication during hospitalist sevice changes: A mixed methods study.J Hosp Med.2009;4:535–540.
- ,,,Center for Safety in Emergency C. Profiles in patient safety: Emergency care transitions.Acad Emerg Med.2003;10(4):364–367.
- .Fumbled handoffs: One dropped ball after another.Ann Intern Med.2005;142(5):352–358.
- Agency for Healthcare Research and Quality. Fumbled handoff.2004. Available at: http://www.webmm.ahrq.gov/printview.aspx?caseID=55. Accessed December 27, 2005.
- ,,.Graduate medical education and patient safety: A busy—and occasionally hazardous—intersection.Ann Intern Med.2006;145(8):592–598.
- ,,,,.Does housestaff discontinuity of care increase the risk for preventable adverse events?Ann Intern Med.1994;121(11):866–872.
- ,,,.The impact of a regulation restricting medical house staff working hours on the quality of patient care.JAMA.1993;269(3):374–378.
- Centers for Medicare and Medicaid Services. Standard analytical files. Available at: http://www.cms.hhs.gov/IdentifiableDataFiles/02_Standard AnalyticalFiles.asp. Accessed March 1,2009.
- Centers for Medicare and Medicaid Services. Nonidentifiable data files: Provider of services files. Available at: http://www.cms.hhs.gov/NonIdentifiableDataFiles/04_ProviderofSerrvicesFile.asp. Accessed March 1,2009.
- Research Data Assistance Center. Medicare data file description. Available at: http://www.resdac.umn.edu/Medicare/file_descriptions.asp. Accessed March 1,2009.
- ,,,.Effect of comorbidity adjustment on CMS criteria for kidney transplant center performance.Am J Transplant.2009;9:506–516.
- ,,,,,.Continuity of outpatient and inpatient care by primary care physicians for hospitalized older adults.JAMA.2009;301:1671–1680.
- ,,,.Growth in the care of older patients by hospitalists in the United States.N Engl J Med. 2009;360:1102–1112.
- HCPro Inc.Medical Staff Leader blog.2010. Available at: http://blogs. hcpro.com/medicalstaff/2010/01/free‐form‐example‐seven‐day‐on‐seven‐day‐off‐hospitalist‐schedule/. Accessed November 20, 2010.
- ,,,.How physicians perceive hospitalist services after implementation: Anticipation vs reality.Arch Intern Med.2003;163(19):2330–2336.
Copyright © 2011 Society of Hospital Medicine
Continuing Medical Education Program in
If you wish to receive credit for this activity, please refer to the website:
Accreditation and Designation Statement
Blackwell Futura Media Services designates this journal‐based CME activity for a maximum of 1 AMA PRA Category 1 Credit.. Physicians should only claim credit commensurate with the extent of their participation in the activity.
Blackwell Futura Media Services is accredited by the Accreditation Council for Continuing Medical Education to provide continuing medical education for physicians.
Educational Objectives
The objectives need to be changed. Please remove the existing ones, and include these two:
-
Identify recent changes to the Joint Commission accreditation process.
-
Interpret the association between accreditation status and hospital performance in three common clinical conditions.
This manuscript underwent peer review in line with the standards of editorial integrity and publication ethics maintained by Journal of Hospital Medicine. The peer reviewers have no relevant financial relationships. The peer review process for Journal of Hospital Medicine is single‐blinded. As such, the identities of the reviewers are not disclosed in line with the standard accepted practices of medical journal peer review.
Conflicts of interest have been identified and resolved in accordance with Blackwell Futura Media Services's Policy on Activity Disclosure and Conflict of Interest. The primary resolution method used was peer review and review by a non‐conflicted expert.
Instructions on Receiving Credit
For information on applicability and acceptance of CME credit for this activity, please consult your professional licensing board.
This activity is designed to be completed within an hour; physicians should claim only those credits that reflect the time actually spent in the activity. To successfully earn credit, participants must complete the activity during the valid credit period, which is up to two years from initial publication.
Follow these steps to earn credit:
-
Log on to
www.wileyblackwellcme.com -
Read the target audience, learning objectives, and author disclosures.
-
Read the article in print or online format.
-
Reflect on the article.
-
Access the CME Exam, and choose the best answer to each question.
-
Complete the required evaluation component of the activity.
This activity will be available for CME credit for twelve months following its publication date. At that time, it will be reviewed and potentially updated and extended for an additional twelve months.
If you wish to receive credit for this activity, please refer to the website:
Accreditation and Designation Statement
Blackwell Futura Media Services designates this journal‐based CME activity for a maximum of 1 AMA PRA Category 1 Credit.. Physicians should only claim credit commensurate with the extent of their participation in the activity.
Blackwell Futura Media Services is accredited by the Accreditation Council for Continuing Medical Education to provide continuing medical education for physicians.
Educational Objectives
The objectives need to be changed. Please remove the existing ones, and include these two:
-
Identify recent changes to the Joint Commission accreditation process.
-
Interpret the association between accreditation status and hospital performance in three common clinical conditions.
This manuscript underwent peer review in line with the standards of editorial integrity and publication ethics maintained by Journal of Hospital Medicine. The peer reviewers have no relevant financial relationships. The peer review process for Journal of Hospital Medicine is single‐blinded. As such, the identities of the reviewers are not disclosed in line with the standard accepted practices of medical journal peer review.
Conflicts of interest have been identified and resolved in accordance with Blackwell Futura Media Services's Policy on Activity Disclosure and Conflict of Interest. The primary resolution method used was peer review and review by a non‐conflicted expert.
Instructions on Receiving Credit
For information on applicability and acceptance of CME credit for this activity, please consult your professional licensing board.
This activity is designed to be completed within an hour; physicians should claim only those credits that reflect the time actually spent in the activity. To successfully earn credit, participants must complete the activity during the valid credit period, which is up to two years from initial publication.
Follow these steps to earn credit:
-
Log on to
www.wileyblackwellcme.com -
Read the target audience, learning objectives, and author disclosures.
-
Read the article in print or online format.
-
Reflect on the article.
-
Access the CME Exam, and choose the best answer to each question.
-
Complete the required evaluation component of the activity.
This activity will be available for CME credit for twelve months following its publication date. At that time, it will be reviewed and potentially updated and extended for an additional twelve months.
If you wish to receive credit for this activity, please refer to the website:
Accreditation and Designation Statement
Blackwell Futura Media Services designates this journal‐based CME activity for a maximum of 1 AMA PRA Category 1 Credit.. Physicians should only claim credit commensurate with the extent of their participation in the activity.
Blackwell Futura Media Services is accredited by the Accreditation Council for Continuing Medical Education to provide continuing medical education for physicians.
Educational Objectives
The objectives need to be changed. Please remove the existing ones, and include these two:
-
Identify recent changes to the Joint Commission accreditation process.
-
Interpret the association between accreditation status and hospital performance in three common clinical conditions.
This manuscript underwent peer review in line with the standards of editorial integrity and publication ethics maintained by Journal of Hospital Medicine. The peer reviewers have no relevant financial relationships. The peer review process for Journal of Hospital Medicine is single‐blinded. As such, the identities of the reviewers are not disclosed in line with the standard accepted practices of medical journal peer review.
Conflicts of interest have been identified and resolved in accordance with Blackwell Futura Media Services's Policy on Activity Disclosure and Conflict of Interest. The primary resolution method used was peer review and review by a non‐conflicted expert.
Instructions on Receiving Credit
For information on applicability and acceptance of CME credit for this activity, please consult your professional licensing board.
This activity is designed to be completed within an hour; physicians should claim only those credits that reflect the time actually spent in the activity. To successfully earn credit, participants must complete the activity during the valid credit period, which is up to two years from initial publication.
Follow these steps to earn credit:
-
Log on to
www.wileyblackwellcme.com -
Read the target audience, learning objectives, and author disclosures.
-
Read the article in print or online format.
-
Reflect on the article.
-
Access the CME Exam, and choose the best answer to each question.
-
Complete the required evaluation component of the activity.
This activity will be available for CME credit for twelve months following its publication date. At that time, it will be reviewed and potentially updated and extended for an additional twelve months.
Similar Survival in VLBW Infants with Delayed Surgery
PHILADELPHIA – When a very low birth weight (VLWBW) infant has congenital heart disease needing surgical repair, the two opposing strategies of immediate surgery or delaying surgery for several weeks until the newborn grows larger work equally well for survival. Survival rates after both approaches tracked nearly identically during 3 years of follow-up, in a single center review of 80 cases.
Because the review included a relatively small number of VLBW newborns, the analysis could not determine which benefited most from immediate surgery and which did better with a delayed operation. "But we were reassured that delay did not lead to excess risk," Dr. Edward J. Hickey said at the annual meeting of the American Association for Thoracic Surgery.
Results from a second, related analysis that he reported showed that birth weight surpassed gestational age as a predictor of survival in newborns with congenital heart disease. "Birth weight is a more reliable, independent risk factor for death," said Dr. Hickey, a cardiothoracic surgeon at the Hospital for Sick Children in Toronto. The analysis showed that the highest risk for survival occurred in newborns who weighed less than 2.0 kg at birth. As a result of this finding, Dr. Hickey’s comparison of immediate and delayed surgical repair focused on the 80 newborns in the series who weighed less than 2.0 kg and required prompt intervention.
Among these 80 infants, 34 had "immediate surgery," which meant they had their operation as soon as it could be scheduled and performed, generally within 3 weeks of birth. Surgery for the other 46 was an average of 8 weeks after birth. These differences reflected the way surgeons at Sick Children managed each case.
Among the delayed surgery cases, infants with truncus or coarctation had the slowest growth, with as little as 50 g gained per week. In contrast, infants with an atrial septal defect, tetralogy, or a total anomalous pulmonary venous connection had growth rates above average, often at a pace of more than 150 g/week.
"I was most struck by the infants with coarctation, who seemed to grow at very low rates. That suggests to us that these patients are the ones we should repair early," because it is less likely that a delay would lead to much weight gain and improved surgical prospects, Dr. Hickey said. Based on these findings, he and his associates now perform coarctation repairs in infants whose weight is as low as 1.4 kg, he said. But Dr. Hickey also stressed that the timing of surgical repair must be individualized for each patient.
The two analyses done by Dr. Hickey and his associates involved 1,557 children with congenital heart disease admitted to the Hospital for Sick Children at age 30 days or younger who underwent active management during a 10-year period. Overall survival in this group was 91% at 3 months after admission, 88% after 6 months, and 86% after 5 years.
They evaluated the impact of both gestational age and birth weight on survival among these children, and found that both parameters were linked to mortality. Infants born at 28 weeks’ gestational age had a roughly 40% survival rate after 1 year, those born at 32 weeks had about a 60% survival rate to 1 year, and those born at 36 weeks had about an 80% survival rate at 1 year.
When analyzed by birth weight, those born at 3.5 kg or larger had a greater than 90% 1-year survival rate, those born with a weight of 2.0 kg had about an 80% 1-year survival, and those born weighing 1.5 kg had about a 60% survival to 1 year. These data identified an inflection point where infants born weighing less than 2.0 kg had a substantially worse survival than those who weighed 2.0 kg or more. Additional analysis that compared the relative contributions of gestational age and birth weight also showed that birth weight was the much stronger factor influencing 1-year survival.
The series included 149 infants born at less than 2.0 kg, highlighting how uncommon it is for surgeons to face the question of how to manage VLBW infants with congenital heart disease. Eighty-five of these infants (57%) weighed 1.5-1.9 kg at birth, while the remainder weighed less than 1.5 kg. Thirty did not require immediate surgical intervention, 12 had other, noncardiovascular complications requiring initial intervention, and 27 received comfort care only, leaving 80 candidates that became part of the immediate – versus delayed – surgery analysis.
Among the 46 infants whose surgery was delayed for an average of 8 weeks, 18 (39%) had a total of 33 complications. Six of these 18 children died while awaiting surgery. "Despite this high complication rate, we see roughly equivalent survival" between the immediate and delayed surgery groups. That observation, coupled with the finding that many infants gained weight at an "acceptable" rate during the period of surgical delay, led to the conclusion that either strategy is reasonable and should depend on the specific features of each case, he said.
Dr. Hickey had no disclosures. ☐
PHILADELPHIA – When a very low birth weight (VLWBW) infant has congenital heart disease needing surgical repair, the two opposing strategies of immediate surgery or delaying surgery for several weeks until the newborn grows larger work equally well for survival. Survival rates after both approaches tracked nearly identically during 3 years of follow-up, in a single center review of 80 cases.
Because the review included a relatively small number of VLBW newborns, the analysis could not determine which benefited most from immediate surgery and which did better with a delayed operation. "But we were reassured that delay did not lead to excess risk," Dr. Edward J. Hickey said at the annual meeting of the American Association for Thoracic Surgery.
Results from a second, related analysis that he reported showed that birth weight surpassed gestational age as a predictor of survival in newborns with congenital heart disease. "Birth weight is a more reliable, independent risk factor for death," said Dr. Hickey, a cardiothoracic surgeon at the Hospital for Sick Children in Toronto. The analysis showed that the highest risk for survival occurred in newborns who weighed less than 2.0 kg at birth. As a result of this finding, Dr. Hickey’s comparison of immediate and delayed surgical repair focused on the 80 newborns in the series who weighed less than 2.0 kg and required prompt intervention.
Among these 80 infants, 34 had "immediate surgery," which meant they had their operation as soon as it could be scheduled and performed, generally within 3 weeks of birth. Surgery for the other 46 was an average of 8 weeks after birth. These differences reflected the way surgeons at Sick Children managed each case.
Among the delayed surgery cases, infants with truncus or coarctation had the slowest growth, with as little as 50 g gained per week. In contrast, infants with an atrial septal defect, tetralogy, or a total anomalous pulmonary venous connection had growth rates above average, often at a pace of more than 150 g/week.
"I was most struck by the infants with coarctation, who seemed to grow at very low rates. That suggests to us that these patients are the ones we should repair early," because it is less likely that a delay would lead to much weight gain and improved surgical prospects, Dr. Hickey said. Based on these findings, he and his associates now perform coarctation repairs in infants whose weight is as low as 1.4 kg, he said. But Dr. Hickey also stressed that the timing of surgical repair must be individualized for each patient.
The two analyses done by Dr. Hickey and his associates involved 1,557 children with congenital heart disease admitted to the Hospital for Sick Children at age 30 days or younger who underwent active management during a 10-year period. Overall survival in this group was 91% at 3 months after admission, 88% after 6 months, and 86% after 5 years.
They evaluated the impact of both gestational age and birth weight on survival among these children, and found that both parameters were linked to mortality. Infants born at 28 weeks’ gestational age had a roughly 40% survival rate after 1 year, those born at 32 weeks had about a 60% survival rate to 1 year, and those born at 36 weeks had about an 80% survival rate at 1 year.
When analyzed by birth weight, those born at 3.5 kg or larger had a greater than 90% 1-year survival rate, those born with a weight of 2.0 kg had about an 80% 1-year survival, and those born weighing 1.5 kg had about a 60% survival to 1 year. These data identified an inflection point where infants born weighing less than 2.0 kg had a substantially worse survival than those who weighed 2.0 kg or more. Additional analysis that compared the relative contributions of gestational age and birth weight also showed that birth weight was the much stronger factor influencing 1-year survival.
The series included 149 infants born at less than 2.0 kg, highlighting how uncommon it is for surgeons to face the question of how to manage VLBW infants with congenital heart disease. Eighty-five of these infants (57%) weighed 1.5-1.9 kg at birth, while the remainder weighed less than 1.5 kg. Thirty did not require immediate surgical intervention, 12 had other, noncardiovascular complications requiring initial intervention, and 27 received comfort care only, leaving 80 candidates that became part of the immediate – versus delayed – surgery analysis.
Among the 46 infants whose surgery was delayed for an average of 8 weeks, 18 (39%) had a total of 33 complications. Six of these 18 children died while awaiting surgery. "Despite this high complication rate, we see roughly equivalent survival" between the immediate and delayed surgery groups. That observation, coupled with the finding that many infants gained weight at an "acceptable" rate during the period of surgical delay, led to the conclusion that either strategy is reasonable and should depend on the specific features of each case, he said.
Dr. Hickey had no disclosures. ☐
PHILADELPHIA – When a very low birth weight (VLWBW) infant has congenital heart disease needing surgical repair, the two opposing strategies of immediate surgery or delaying surgery for several weeks until the newborn grows larger work equally well for survival. Survival rates after both approaches tracked nearly identically during 3 years of follow-up, in a single center review of 80 cases.
Because the review included a relatively small number of VLBW newborns, the analysis could not determine which benefited most from immediate surgery and which did better with a delayed operation. "But we were reassured that delay did not lead to excess risk," Dr. Edward J. Hickey said at the annual meeting of the American Association for Thoracic Surgery.
Results from a second, related analysis that he reported showed that birth weight surpassed gestational age as a predictor of survival in newborns with congenital heart disease. "Birth weight is a more reliable, independent risk factor for death," said Dr. Hickey, a cardiothoracic surgeon at the Hospital for Sick Children in Toronto. The analysis showed that the highest risk for survival occurred in newborns who weighed less than 2.0 kg at birth. As a result of this finding, Dr. Hickey’s comparison of immediate and delayed surgical repair focused on the 80 newborns in the series who weighed less than 2.0 kg and required prompt intervention.
Among these 80 infants, 34 had "immediate surgery," which meant they had their operation as soon as it could be scheduled and performed, generally within 3 weeks of birth. Surgery for the other 46 was an average of 8 weeks after birth. These differences reflected the way surgeons at Sick Children managed each case.
Among the delayed surgery cases, infants with truncus or coarctation had the slowest growth, with as little as 50 g gained per week. In contrast, infants with an atrial septal defect, tetralogy, or a total anomalous pulmonary venous connection had growth rates above average, often at a pace of more than 150 g/week.
"I was most struck by the infants with coarctation, who seemed to grow at very low rates. That suggests to us that these patients are the ones we should repair early," because it is less likely that a delay would lead to much weight gain and improved surgical prospects, Dr. Hickey said. Based on these findings, he and his associates now perform coarctation repairs in infants whose weight is as low as 1.4 kg, he said. But Dr. Hickey also stressed that the timing of surgical repair must be individualized for each patient.
The two analyses done by Dr. Hickey and his associates involved 1,557 children with congenital heart disease admitted to the Hospital for Sick Children at age 30 days or younger who underwent active management during a 10-year period. Overall survival in this group was 91% at 3 months after admission, 88% after 6 months, and 86% after 5 years.
They evaluated the impact of both gestational age and birth weight on survival among these children, and found that both parameters were linked to mortality. Infants born at 28 weeks’ gestational age had a roughly 40% survival rate after 1 year, those born at 32 weeks had about a 60% survival rate to 1 year, and those born at 36 weeks had about an 80% survival rate at 1 year.
When analyzed by birth weight, those born at 3.5 kg or larger had a greater than 90% 1-year survival rate, those born with a weight of 2.0 kg had about an 80% 1-year survival, and those born weighing 1.5 kg had about a 60% survival to 1 year. These data identified an inflection point where infants born weighing less than 2.0 kg had a substantially worse survival than those who weighed 2.0 kg or more. Additional analysis that compared the relative contributions of gestational age and birth weight also showed that birth weight was the much stronger factor influencing 1-year survival.
The series included 149 infants born at less than 2.0 kg, highlighting how uncommon it is for surgeons to face the question of how to manage VLBW infants with congenital heart disease. Eighty-five of these infants (57%) weighed 1.5-1.9 kg at birth, while the remainder weighed less than 1.5 kg. Thirty did not require immediate surgical intervention, 12 had other, noncardiovascular complications requiring initial intervention, and 27 received comfort care only, leaving 80 candidates that became part of the immediate – versus delayed – surgery analysis.
Among the 46 infants whose surgery was delayed for an average of 8 weeks, 18 (39%) had a total of 33 complications. Six of these 18 children died while awaiting surgery. "Despite this high complication rate, we see roughly equivalent survival" between the immediate and delayed surgery groups. That observation, coupled with the finding that many infants gained weight at an "acceptable" rate during the period of surgical delay, led to the conclusion that either strategy is reasonable and should depend on the specific features of each case, he said.
Dr. Hickey had no disclosures. ☐
Major Finding: In infants with congenital heart disease with a birth weight below 2.0 kg who required surgical intervention, immediate surgery or surgery delayed for an average of 8 weeks led to similar survival rates during the following 3 years.
Data Source: Review of 80 VLBW infants who required surgery for congenital heart disease at one center during a 10-year period.
Disclosures: Dr. Hickey said that he had no disclosures.
FDA Approves Juvisync for Diabetes, High Cholesterol
The Food and Drug Administration on Oct. 7 announced the approval of a combination pill containing fixed doses of sitagliptin and simvastatin for people in whom treatment with both drugs is indicated.
The combination product, which will be marketed as Juvisync, is the first product that combines in a single tablet a drug approved for treating type 2 diabetes with a cholesterol-lowering drug, according to an agency statement announcing the approval.
Sitagliptin is a dipeptidyl peptidase 4 (DPP-4) inhibitor approved for use in combination with diet and exercise to improve glycemic control in adults with type 2 diabetes; it is marketed as Januvia (and as Janumet in combination with metformin). Simvastatin is an HMG-CoA reductase inhibitor approved for use with diet and exercise to lower low-density lipoprotein cholesterol and is marketed as Zocor and is available in generic formulations (and in combination with niacin and with ezetimibe).
Approval of Juvisync is based on the "substantial experience" with both drugs separately, "and the ability of the single tablet to deliver similar amounts of the drugs to the bloodstream as when sitagliptin and simvastatin are taken separately," according to the statement, which describes Juvisync as a "convenience combination" that should only be prescribed "when it is appropriate for a patient to be placed on both of these drugs."
"To ensure safe and effective use of this product, tablets containing different doses of sitagliptin and simvastatin in fixed-dose combination have been developed to meet the different needs of individual patients," Dr. Mary H. Parks, director of the Division of Metabolism and Endocrinology Products in the FDA’s Center for Drug Evaluation and Research said in the statement.
The approved dosage strengths of the sitagliptin/simvastatin combination are 100 mg/10 mg, 100 mg/20 mg, and 100 mg/40 mg, all of which are taken as a single dose in the evening, according to the prescribing information.
The manufacturer has committed to developing combined tablets containing the 50 mg sitagliptin dose, with 10 mg, 20 mg and 40 mg of simvastatin, but until these are available, patients who need the 50-mg dose of sitagliptin should be prescribed the single-ingredient tablet. There are no plans to develop a combination tablet with the 25-mg sitagliptin dose, which is not used very much, or with the 80-mg dose of simvastatin, because of recent restrictions on the use of this dose because it is associated with an increased risk of muscle toxicity, the statement said.
The statement says that the agency has recently become aware of the potential for statins to increase serum glucose levels in patients with type 2 diabetes, although the risk "appears very small and is outweighed by the benefits of statins for reducing heart disease in diabetes." To assess this risk further, the FDA is requiring that the manufacturer conduct a postmarketing clinical study. The FDA’s approval letter for Juvisync says that the trial should be a randomized, double-blind, active-controlled study that compares the effect of sitagliptin and simvastatin fixed-dose combination with sitagliptin on glycemic control in type 2 diabetic patients on background metformin therapy.
Juvisync is manufactured by MSD International GmbH Clonmel Co., based in Tipperary, Ireland.
The Food and Drug Administration on Oct. 7 announced the approval of a combination pill containing fixed doses of sitagliptin and simvastatin for people in whom treatment with both drugs is indicated.
The combination product, which will be marketed as Juvisync, is the first product that combines in a single tablet a drug approved for treating type 2 diabetes with a cholesterol-lowering drug, according to an agency statement announcing the approval.
Sitagliptin is a dipeptidyl peptidase 4 (DPP-4) inhibitor approved for use in combination with diet and exercise to improve glycemic control in adults with type 2 diabetes; it is marketed as Januvia (and as Janumet in combination with metformin). Simvastatin is an HMG-CoA reductase inhibitor approved for use with diet and exercise to lower low-density lipoprotein cholesterol and is marketed as Zocor and is available in generic formulations (and in combination with niacin and with ezetimibe).
Approval of Juvisync is based on the "substantial experience" with both drugs separately, "and the ability of the single tablet to deliver similar amounts of the drugs to the bloodstream as when sitagliptin and simvastatin are taken separately," according to the statement, which describes Juvisync as a "convenience combination" that should only be prescribed "when it is appropriate for a patient to be placed on both of these drugs."
"To ensure safe and effective use of this product, tablets containing different doses of sitagliptin and simvastatin in fixed-dose combination have been developed to meet the different needs of individual patients," Dr. Mary H. Parks, director of the Division of Metabolism and Endocrinology Products in the FDA’s Center for Drug Evaluation and Research said in the statement.
The approved dosage strengths of the sitagliptin/simvastatin combination are 100 mg/10 mg, 100 mg/20 mg, and 100 mg/40 mg, all of which are taken as a single dose in the evening, according to the prescribing information.
The manufacturer has committed to developing combined tablets containing the 50 mg sitagliptin dose, with 10 mg, 20 mg and 40 mg of simvastatin, but until these are available, patients who need the 50-mg dose of sitagliptin should be prescribed the single-ingredient tablet. There are no plans to develop a combination tablet with the 25-mg sitagliptin dose, which is not used very much, or with the 80-mg dose of simvastatin, because of recent restrictions on the use of this dose because it is associated with an increased risk of muscle toxicity, the statement said.
The statement says that the agency has recently become aware of the potential for statins to increase serum glucose levels in patients with type 2 diabetes, although the risk "appears very small and is outweighed by the benefits of statins for reducing heart disease in diabetes." To assess this risk further, the FDA is requiring that the manufacturer conduct a postmarketing clinical study. The FDA’s approval letter for Juvisync says that the trial should be a randomized, double-blind, active-controlled study that compares the effect of sitagliptin and simvastatin fixed-dose combination with sitagliptin on glycemic control in type 2 diabetic patients on background metformin therapy.
Juvisync is manufactured by MSD International GmbH Clonmel Co., based in Tipperary, Ireland.
The Food and Drug Administration on Oct. 7 announced the approval of a combination pill containing fixed doses of sitagliptin and simvastatin for people in whom treatment with both drugs is indicated.
The combination product, which will be marketed as Juvisync, is the first product that combines in a single tablet a drug approved for treating type 2 diabetes with a cholesterol-lowering drug, according to an agency statement announcing the approval.
Sitagliptin is a dipeptidyl peptidase 4 (DPP-4) inhibitor approved for use in combination with diet and exercise to improve glycemic control in adults with type 2 diabetes; it is marketed as Januvia (and as Janumet in combination with metformin). Simvastatin is an HMG-CoA reductase inhibitor approved for use with diet and exercise to lower low-density lipoprotein cholesterol and is marketed as Zocor and is available in generic formulations (and in combination with niacin and with ezetimibe).
Approval of Juvisync is based on the "substantial experience" with both drugs separately, "and the ability of the single tablet to deliver similar amounts of the drugs to the bloodstream as when sitagliptin and simvastatin are taken separately," according to the statement, which describes Juvisync as a "convenience combination" that should only be prescribed "when it is appropriate for a patient to be placed on both of these drugs."
"To ensure safe and effective use of this product, tablets containing different doses of sitagliptin and simvastatin in fixed-dose combination have been developed to meet the different needs of individual patients," Dr. Mary H. Parks, director of the Division of Metabolism and Endocrinology Products in the FDA’s Center for Drug Evaluation and Research said in the statement.
The approved dosage strengths of the sitagliptin/simvastatin combination are 100 mg/10 mg, 100 mg/20 mg, and 100 mg/40 mg, all of which are taken as a single dose in the evening, according to the prescribing information.
The manufacturer has committed to developing combined tablets containing the 50 mg sitagliptin dose, with 10 mg, 20 mg and 40 mg of simvastatin, but until these are available, patients who need the 50-mg dose of sitagliptin should be prescribed the single-ingredient tablet. There are no plans to develop a combination tablet with the 25-mg sitagliptin dose, which is not used very much, or with the 80-mg dose of simvastatin, because of recent restrictions on the use of this dose because it is associated with an increased risk of muscle toxicity, the statement said.
The statement says that the agency has recently become aware of the potential for statins to increase serum glucose levels in patients with type 2 diabetes, although the risk "appears very small and is outweighed by the benefits of statins for reducing heart disease in diabetes." To assess this risk further, the FDA is requiring that the manufacturer conduct a postmarketing clinical study. The FDA’s approval letter for Juvisync says that the trial should be a randomized, double-blind, active-controlled study that compares the effect of sitagliptin and simvastatin fixed-dose combination with sitagliptin on glycemic control in type 2 diabetic patients on background metformin therapy.
Juvisync is manufactured by MSD International GmbH Clonmel Co., based in Tipperary, Ireland.
Small Changes Count in Type 2 Diabetes Patients
LISBON – Even small changes in hemoglobin A1c and blood pressure could significantly reduce the risk of heart attack, stroke, and other cardiovascular complications in people with type 2 diabetes, according to the findings of a population-based observational study.
A 0.5% decrease in HbA1c and a 10 Hg/mm decrease in systolic blood pressure could avert 10% of such events over 5 years, Dr. Edith Heintjes said at the annual meeting of the European Society for the Study of Diabetes. Greater changes could reduce cardiovascular events by as much as 21%, said Dr. Heintjes of the PHARMO Institute for Drug Research, Utrecht, the Netherlands.
While her study on population attributable risk was albeit theoretical, it still adds weight to the emerging theory that small changes can make a big difference to the health of people with type 2 diabetes.
"Even when we examined only modest incremental reductions, which could be achieved in the clinical setting, we found the possibility of significant benefit," she said. Those patients with the greatest risk factors – elevated HbA1c, high blood pressure, and higher body mass index – stand to gain the most when they improve those factors, she said.
Dr. Heintjes’ analysis included 5,841 Dutch patients with a diagnosis of type 2 diabetes for at least 2 years. The patients were all taking some form of treatment – oral medications, insulin, or both – for at least 6 months to be included in the study. After examining both baseline data and 5-year outcomes, she was able to extrapolate how improvements in the three risk factors might impact the expected number of cardiovascular events.
Patient data were drawn from the PHARMO record linkage system, which includes community pharmaceutical dispensing information, laboratory information, national hospitalization information, and statistics from the Dutch national diabetes monitoring program.
Patients were treated with the aim of achieving the country’s national targets: an HbA1c of below 7%, a systolic blood pressure of 140 mmHg or lower, and a body mass index of 25 kg/m2 or less.
"Even when we examined only modest incremental reductions, we found the possibility of significant benefit."
At baseline, the patients’ average age was 66 years. The average HbA1c was 7%; systolic blood pressure 149 mmHg, and body mass index, 29.5 kg/m2. Most (92%) were taking only oral medications; the remainder was also taking insulin.
Some cardiovascular morbidity was already present in the group, including peripheral artery disease (0.5%), renal impairment (11%), neuropathy (51%), and retinopathy (7%). About half of the group (45%) had a family history of cardiovascular disease.
Dr. Heintjes divided the group according to the number of risk factors each patient exhibited. A quarter (24%) had just one elevated risk factor; 47% had two elevated risk factors, and 26% had elevations in all three risk factors.
A multivariable analysis allowed her to extrapolate that 796 cardiovascular events (heart attack, ischemic heart disease, stroke, and chronic heart failure) would occur if all of the patients were followed for 5 years.
If every patient in this population were able to correct each one of the risk factors to the national recommendations, she said, 687 events would occur – a 14% decrease. Correcting HbA1c and blood pressure accounted for this change, she said; changing BMI did nothing to increase the benefit.
Theoretically, she said, patients with the most risk factors would reap the greatest benefit. The 24% with one elevated risk factor would experience a 5% reduction in cardiovascular events, while those with all three elevated risk factors, upon correcting them, would see a 21% reduction.
Considering the group’s baseline measurements, correcting to national Dutch standards would mean an average HbA1c reduction of 0.8%, a 26-mmHg reduction in systolic blood pressure, and a weight loss of 16 kg (equivalent to a BMI decrease of 5.7 kg/m2). However, Dr. Heintjes said, it might not be realistic to expect such changes. Her second analysis explored the improvements that could arise from smaller changes: a 0.5% reduction in HbA1c, a 10-mmHg reduction in systolic blood pressure and a 10% reduction in total body weight (2.6 kg/m2 decrease in BMI).
"With this analysis, we saw in the overall population that 6% of the risk could be averted," she said. Among those in the subpopulation with three risk factors, applying the smaller changes could cut the number of events by 10%.
It’s not exactly clear how the results can change clinical practice, Dr. Heintjes acknowledged. "But this does allow us to understand how small changes can translate into bigger benefits for people with type 2 diabetes."
Dr. Heintjes reported having no conflicts of interest. Her employer, PHARMO, however, receives funding from numerous pharmaceutical companies, including Astra Zeneca, which sponsored the current study.
LISBON – Even small changes in hemoglobin A1c and blood pressure could significantly reduce the risk of heart attack, stroke, and other cardiovascular complications in people with type 2 diabetes, according to the findings of a population-based observational study.
A 0.5% decrease in HbA1c and a 10 Hg/mm decrease in systolic blood pressure could avert 10% of such events over 5 years, Dr. Edith Heintjes said at the annual meeting of the European Society for the Study of Diabetes. Greater changes could reduce cardiovascular events by as much as 21%, said Dr. Heintjes of the PHARMO Institute for Drug Research, Utrecht, the Netherlands.
While her study on population attributable risk was albeit theoretical, it still adds weight to the emerging theory that small changes can make a big difference to the health of people with type 2 diabetes.
"Even when we examined only modest incremental reductions, which could be achieved in the clinical setting, we found the possibility of significant benefit," she said. Those patients with the greatest risk factors – elevated HbA1c, high blood pressure, and higher body mass index – stand to gain the most when they improve those factors, she said.
Dr. Heintjes’ analysis included 5,841 Dutch patients with a diagnosis of type 2 diabetes for at least 2 years. The patients were all taking some form of treatment – oral medications, insulin, or both – for at least 6 months to be included in the study. After examining both baseline data and 5-year outcomes, she was able to extrapolate how improvements in the three risk factors might impact the expected number of cardiovascular events.
Patient data were drawn from the PHARMO record linkage system, which includes community pharmaceutical dispensing information, laboratory information, national hospitalization information, and statistics from the Dutch national diabetes monitoring program.
Patients were treated with the aim of achieving the country’s national targets: an HbA1c of below 7%, a systolic blood pressure of 140 mmHg or lower, and a body mass index of 25 kg/m2 or less.
"Even when we examined only modest incremental reductions, we found the possibility of significant benefit."
At baseline, the patients’ average age was 66 years. The average HbA1c was 7%; systolic blood pressure 149 mmHg, and body mass index, 29.5 kg/m2. Most (92%) were taking only oral medications; the remainder was also taking insulin.
Some cardiovascular morbidity was already present in the group, including peripheral artery disease (0.5%), renal impairment (11%), neuropathy (51%), and retinopathy (7%). About half of the group (45%) had a family history of cardiovascular disease.
Dr. Heintjes divided the group according to the number of risk factors each patient exhibited. A quarter (24%) had just one elevated risk factor; 47% had two elevated risk factors, and 26% had elevations in all three risk factors.
A multivariable analysis allowed her to extrapolate that 796 cardiovascular events (heart attack, ischemic heart disease, stroke, and chronic heart failure) would occur if all of the patients were followed for 5 years.
If every patient in this population were able to correct each one of the risk factors to the national recommendations, she said, 687 events would occur – a 14% decrease. Correcting HbA1c and blood pressure accounted for this change, she said; changing BMI did nothing to increase the benefit.
Theoretically, she said, patients with the most risk factors would reap the greatest benefit. The 24% with one elevated risk factor would experience a 5% reduction in cardiovascular events, while those with all three elevated risk factors, upon correcting them, would see a 21% reduction.
Considering the group’s baseline measurements, correcting to national Dutch standards would mean an average HbA1c reduction of 0.8%, a 26-mmHg reduction in systolic blood pressure, and a weight loss of 16 kg (equivalent to a BMI decrease of 5.7 kg/m2). However, Dr. Heintjes said, it might not be realistic to expect such changes. Her second analysis explored the improvements that could arise from smaller changes: a 0.5% reduction in HbA1c, a 10-mmHg reduction in systolic blood pressure and a 10% reduction in total body weight (2.6 kg/m2 decrease in BMI).
"With this analysis, we saw in the overall population that 6% of the risk could be averted," she said. Among those in the subpopulation with three risk factors, applying the smaller changes could cut the number of events by 10%.
It’s not exactly clear how the results can change clinical practice, Dr. Heintjes acknowledged. "But this does allow us to understand how small changes can translate into bigger benefits for people with type 2 diabetes."
Dr. Heintjes reported having no conflicts of interest. Her employer, PHARMO, however, receives funding from numerous pharmaceutical companies, including Astra Zeneca, which sponsored the current study.
LISBON – Even small changes in hemoglobin A1c and blood pressure could significantly reduce the risk of heart attack, stroke, and other cardiovascular complications in people with type 2 diabetes, according to the findings of a population-based observational study.
A 0.5% decrease in HbA1c and a 10 Hg/mm decrease in systolic blood pressure could avert 10% of such events over 5 years, Dr. Edith Heintjes said at the annual meeting of the European Society for the Study of Diabetes. Greater changes could reduce cardiovascular events by as much as 21%, said Dr. Heintjes of the PHARMO Institute for Drug Research, Utrecht, the Netherlands.
While her study on population attributable risk was albeit theoretical, it still adds weight to the emerging theory that small changes can make a big difference to the health of people with type 2 diabetes.
"Even when we examined only modest incremental reductions, which could be achieved in the clinical setting, we found the possibility of significant benefit," she said. Those patients with the greatest risk factors – elevated HbA1c, high blood pressure, and higher body mass index – stand to gain the most when they improve those factors, she said.
Dr. Heintjes’ analysis included 5,841 Dutch patients with a diagnosis of type 2 diabetes for at least 2 years. The patients were all taking some form of treatment – oral medications, insulin, or both – for at least 6 months to be included in the study. After examining both baseline data and 5-year outcomes, she was able to extrapolate how improvements in the three risk factors might impact the expected number of cardiovascular events.
Patient data were drawn from the PHARMO record linkage system, which includes community pharmaceutical dispensing information, laboratory information, national hospitalization information, and statistics from the Dutch national diabetes monitoring program.
Patients were treated with the aim of achieving the country’s national targets: an HbA1c of below 7%, a systolic blood pressure of 140 mmHg or lower, and a body mass index of 25 kg/m2 or less.
"Even when we examined only modest incremental reductions, we found the possibility of significant benefit."
At baseline, the patients’ average age was 66 years. The average HbA1c was 7%; systolic blood pressure 149 mmHg, and body mass index, 29.5 kg/m2. Most (92%) were taking only oral medications; the remainder was also taking insulin.
Some cardiovascular morbidity was already present in the group, including peripheral artery disease (0.5%), renal impairment (11%), neuropathy (51%), and retinopathy (7%). About half of the group (45%) had a family history of cardiovascular disease.
Dr. Heintjes divided the group according to the number of risk factors each patient exhibited. A quarter (24%) had just one elevated risk factor; 47% had two elevated risk factors, and 26% had elevations in all three risk factors.
A multivariable analysis allowed her to extrapolate that 796 cardiovascular events (heart attack, ischemic heart disease, stroke, and chronic heart failure) would occur if all of the patients were followed for 5 years.
If every patient in this population were able to correct each one of the risk factors to the national recommendations, she said, 687 events would occur – a 14% decrease. Correcting HbA1c and blood pressure accounted for this change, she said; changing BMI did nothing to increase the benefit.
Theoretically, she said, patients with the most risk factors would reap the greatest benefit. The 24% with one elevated risk factor would experience a 5% reduction in cardiovascular events, while those with all three elevated risk factors, upon correcting them, would see a 21% reduction.
Considering the group’s baseline measurements, correcting to national Dutch standards would mean an average HbA1c reduction of 0.8%, a 26-mmHg reduction in systolic blood pressure, and a weight loss of 16 kg (equivalent to a BMI decrease of 5.7 kg/m2). However, Dr. Heintjes said, it might not be realistic to expect such changes. Her second analysis explored the improvements that could arise from smaller changes: a 0.5% reduction in HbA1c, a 10-mmHg reduction in systolic blood pressure and a 10% reduction in total body weight (2.6 kg/m2 decrease in BMI).
"With this analysis, we saw in the overall population that 6% of the risk could be averted," she said. Among those in the subpopulation with three risk factors, applying the smaller changes could cut the number of events by 10%.
It’s not exactly clear how the results can change clinical practice, Dr. Heintjes acknowledged. "But this does allow us to understand how small changes can translate into bigger benefits for people with type 2 diabetes."
Dr. Heintjes reported having no conflicts of interest. Her employer, PHARMO, however, receives funding from numerous pharmaceutical companies, including Astra Zeneca, which sponsored the current study.
FROM THE ANNUAL MEETING OF THE EUROPEAN ASSOCIATION FOR THE STUDY OF DIABETES
Major Finding: Reducing HbA1c, blood pressure, and weight could avert up to 21% of cardiovascular events in patients with type 2 diabetes.
Data Source: A population-based observational study comprising 5,841 patients.
Disclosures: Dr. Heintjes reported having no conflicts of interest. Her employer, PHARMO, however, receives funding from numerous pharmaceutical companies, including Astra Zeneca, which sponsored the current study.
Temporary Staffing Common in HM, Study Reports
One in 10 hospitalists has worked locum tenens in the past year, according to a study of the practice released this week.
Locum Leaders, a locum tenens staffing agency in Alpharetta, Ga., put the study together this summer to define for the first time just how prevalent the practice of temporary staffing is and what motivates physicians to do the work. The report found that of hospitalists who work as locums tenens, 82% do it in addition to their full-time jobs and 11% do it as their full-time jobs.
Robert Harrington Jr., MD, SFHM, chief medical officer for Locum Leaders and an SHM board member, says the phenomenon allows some hospitalists to learn more about an institution before signing a long-term contract. It also affords other physicians flexibility, higher earning potential, or just the chance to "try something on for size before they buy."
"On the physician side, there are opportunities out there for you to not strain yourself immensely to increase your compensation, to travel to places you may not normally get to go, and to see how different programs are structured and operate," he says. "To see a more worldly view of hospital medicine."
For hospitals, even though locum physicians can cost more in salary, they can provide an opportunity for savings, as the hospital does not have to contribute to healthcare, pensions, or other costs. To wit, locum physicians can gross 30% to 40% more per year for the same number of shifts as a typical FTE hospitalist.
"They're all independent contractors," Dr. Harrington adds. "The increase in compensation that locum tenens physicians are able to demand, for the most part, comes from the difference between having a full-time employee versus an independent contractor."
One in 10 hospitalists has worked locum tenens in the past year, according to a study of the practice released this week.
Locum Leaders, a locum tenens staffing agency in Alpharetta, Ga., put the study together this summer to define for the first time just how prevalent the practice of temporary staffing is and what motivates physicians to do the work. The report found that of hospitalists who work as locums tenens, 82% do it in addition to their full-time jobs and 11% do it as their full-time jobs.
Robert Harrington Jr., MD, SFHM, chief medical officer for Locum Leaders and an SHM board member, says the phenomenon allows some hospitalists to learn more about an institution before signing a long-term contract. It also affords other physicians flexibility, higher earning potential, or just the chance to "try something on for size before they buy."
"On the physician side, there are opportunities out there for you to not strain yourself immensely to increase your compensation, to travel to places you may not normally get to go, and to see how different programs are structured and operate," he says. "To see a more worldly view of hospital medicine."
For hospitals, even though locum physicians can cost more in salary, they can provide an opportunity for savings, as the hospital does not have to contribute to healthcare, pensions, or other costs. To wit, locum physicians can gross 30% to 40% more per year for the same number of shifts as a typical FTE hospitalist.
"They're all independent contractors," Dr. Harrington adds. "The increase in compensation that locum tenens physicians are able to demand, for the most part, comes from the difference between having a full-time employee versus an independent contractor."
One in 10 hospitalists has worked locum tenens in the past year, according to a study of the practice released this week.
Locum Leaders, a locum tenens staffing agency in Alpharetta, Ga., put the study together this summer to define for the first time just how prevalent the practice of temporary staffing is and what motivates physicians to do the work. The report found that of hospitalists who work as locums tenens, 82% do it in addition to their full-time jobs and 11% do it as their full-time jobs.
Robert Harrington Jr., MD, SFHM, chief medical officer for Locum Leaders and an SHM board member, says the phenomenon allows some hospitalists to learn more about an institution before signing a long-term contract. It also affords other physicians flexibility, higher earning potential, or just the chance to "try something on for size before they buy."
"On the physician side, there are opportunities out there for you to not strain yourself immensely to increase your compensation, to travel to places you may not normally get to go, and to see how different programs are structured and operate," he says. "To see a more worldly view of hospital medicine."
For hospitals, even though locum physicians can cost more in salary, they can provide an opportunity for savings, as the hospital does not have to contribute to healthcare, pensions, or other costs. To wit, locum physicians can gross 30% to 40% more per year for the same number of shifts as a typical FTE hospitalist.
"They're all independent contractors," Dr. Harrington adds. "The increase in compensation that locum tenens physicians are able to demand, for the most part, comes from the difference between having a full-time employee versus an independent contractor."
The Appropriate Patient Census
What's the appropriate number of patients that an FTE hospitalist should see in one day? More than half of those surveyed on the-hospitalist.org believe they should see between 11 and 15 patients. According to two members of Team Hospitalist, 10 to 20 patients per day is a reasonable guideline.
"On average, 15 to 18 patients per day is a pretty easy-to-manage number," says Rachel George, MD, MBA, FHM, CPE, chief operating officer for Cogent HMG's west and north-central regions. But daily patient census depends on several factors, such as the types of patients admitted, the length of the doctor's shift, and the level of support from other staff on duty, she explains.
Readers were given one of five choices to respond with: "10 or fewer patients," "11-15," "16-20," "21-25," and "more than 25." Of the 421 responses, 51% felt that the average full-time hospitalist should see from 11 to 15 patients per day, followed by 35% who say they'd prefer to see 16 to 20 patients. Six percent voted for "10 or fewer." Only 4% of respondents said 20 or more patients a day was optimum.
"Honestly, I try not to get fixated on numbers," says Ken Simone, DO, SFHM, founder and president of Hospitalist and Practice Solutions in Veazie, Maine. As a consultant, he says that rather than trying to expect physicians to attend to a standard census, HM groups should focus on acuity of illness and quality of care, and let patient needs dictate the staff required. Dr. Simone also recalled working with some groups who have delegated one or more staff members to handle admitting and screening, so that hospitalists can concentrate on the patients already in beds.
What's the appropriate number of patients that an FTE hospitalist should see in one day? More than half of those surveyed on the-hospitalist.org believe they should see between 11 and 15 patients. According to two members of Team Hospitalist, 10 to 20 patients per day is a reasonable guideline.
"On average, 15 to 18 patients per day is a pretty easy-to-manage number," says Rachel George, MD, MBA, FHM, CPE, chief operating officer for Cogent HMG's west and north-central regions. But daily patient census depends on several factors, such as the types of patients admitted, the length of the doctor's shift, and the level of support from other staff on duty, she explains.
Readers were given one of five choices to respond with: "10 or fewer patients," "11-15," "16-20," "21-25," and "more than 25." Of the 421 responses, 51% felt that the average full-time hospitalist should see from 11 to 15 patients per day, followed by 35% who say they'd prefer to see 16 to 20 patients. Six percent voted for "10 or fewer." Only 4% of respondents said 20 or more patients a day was optimum.
"Honestly, I try not to get fixated on numbers," says Ken Simone, DO, SFHM, founder and president of Hospitalist and Practice Solutions in Veazie, Maine. As a consultant, he says that rather than trying to expect physicians to attend to a standard census, HM groups should focus on acuity of illness and quality of care, and let patient needs dictate the staff required. Dr. Simone also recalled working with some groups who have delegated one or more staff members to handle admitting and screening, so that hospitalists can concentrate on the patients already in beds.
What's the appropriate number of patients that an FTE hospitalist should see in one day? More than half of those surveyed on the-hospitalist.org believe they should see between 11 and 15 patients. According to two members of Team Hospitalist, 10 to 20 patients per day is a reasonable guideline.
"On average, 15 to 18 patients per day is a pretty easy-to-manage number," says Rachel George, MD, MBA, FHM, CPE, chief operating officer for Cogent HMG's west and north-central regions. But daily patient census depends on several factors, such as the types of patients admitted, the length of the doctor's shift, and the level of support from other staff on duty, she explains.
Readers were given one of five choices to respond with: "10 or fewer patients," "11-15," "16-20," "21-25," and "more than 25." Of the 421 responses, 51% felt that the average full-time hospitalist should see from 11 to 15 patients per day, followed by 35% who say they'd prefer to see 16 to 20 patients. Six percent voted for "10 or fewer." Only 4% of respondents said 20 or more patients a day was optimum.
"Honestly, I try not to get fixated on numbers," says Ken Simone, DO, SFHM, founder and president of Hospitalist and Practice Solutions in Veazie, Maine. As a consultant, he says that rather than trying to expect physicians to attend to a standard census, HM groups should focus on acuity of illness and quality of care, and let patient needs dictate the staff required. Dr. Simone also recalled working with some groups who have delegated one or more staff members to handle admitting and screening, so that hospitalists can concentrate on the patients already in beds.