User login
Using the ankle-brachial index to diagnose peripheral artery disease and assess cardiovascular risk
In this article, we seek to convince you to measure the ankle-brachial index for any patient you suspect may have peripheral artery disease. This would include patients who are elderly, who smoke, or who have diabetes, regardless of whether or not they have symptoms. The ankle-brachial index is a simple test that involves taking the blood pressure in all four limbs using a hand-held Doppler device and then dividing the leg systolic pressure by the arm systolic pressure.
This simple test is both sensitive and specific for peripheral artery disease. It also gives a good assessment of cardiovascular risk. The downside: you or a member of your staff spends a few minutes doing it. Also, for patients without leg symptoms or abnormal findings on physical examination, you may not be paid for doing it.
Despite these limitations, the ankle-brachial index is a powerful clinical tool that deserves to be performed more often in primary care.
PERIPHERAL ARTERY DISEASE IS COMMON AND SERIOUS
Peripheral artery disease is important to detect, as it is common, it has serious consequences, and effective treatments are available. However, many patients with the disease do not have typical symptoms.
Peripheral artery disease affects up to 29% of people over age 70, depending on the population sampled.1,2 Its classic symptom is intermittent claudication, ie, leg pain with walking that improves with rest. However, most patients do not have intermittent claudication; they have atypical leg symptoms or no symptoms at all.2,3 While the risk factors for peripheral artery disease are similar to those for coronary artery disease, the factors most strongly associated with peripheral artery disease are older age, tobacco smoking, and diabetes mellitus.4 Blacks are twice as likely to have it compared with whites, even after adjusting for other cardiovascular risk factors.5
Untreated peripheral artery disease may have serious consequences, such as amputation, impaired functional capacity, poor quality of life, and depression.3,6,7 In addition, it is a strong marker of atherosclerotic burden and cardiovascular risk and has been recognized as a coronary risk equivalent. Patients with peripheral artery disease are at higher risk of death, myocardial infarction, stroke, and hospitalization, with event rates as high as 21% per year.8
Fortunately, simple therapies have been shown to prevent adverse cardiovascular events in peripheral artery disease, including antiplatelet drugs, statins, and angiotensin-converting enzyme inhibitors.9–11
THE ANKLE-BRACHIAL INDEX IS SENSITIVE AND SPECIFIC
The evaluation for possible peripheral artery disease should begin with the medical history, a cardiovascular review of systems, and a focused physical examination in which one should:
- Measure the blood pressure in both arms to assess for occult subclavian stenosis
- Auscultate for bruits over the carotid, abdominal, and femoral arteries
- Palpate the pulses in the lower extremities and the abdominal aorta
- Inspect the bare legs and feet for thinning of the skin, hair loss, thickening of the nails (which are nonspecific signs), and ulceration.
However, the physical examination has limited sensitivity and specificity for diagnosing peripheral artery disease. In general, the most reliable finding is the absence of a palpable posterior tibial artery pulse, which has been reported to have a specificity of 71% and a sensitivity of 91% for peripheral artery disease.12
The ankle-brachial index is the first-line test for both screening for peripheral artery disease and for diagnosing it. It is inexpensive and noninvasive to obtain and has a high sensitivity (79% to 95%) and specificity (95% to 96%) compared with angiography as the gold standard.13–18 It can be measured easily in the office, and every practitioner who cares for patients at risk of cardiovascular disease can be trained to measure it competently.
HOW TO MEASURE THE ANKLE-BRACHIAL INDEX
The ankle-brachial index is the ratio of the systolic pressure in the ankle to the systolic pressure in the arm. In healthy people, this ratio is typically greater than 1.0 or 1.1.
You can measure the ankle-brachial index in the office with a blood pressure cuff, sphygmomanometer, and handheld Doppler device. Alternatively, it can be measured in a noninvasive vascular laboratory as part of a more detailed examination that allows for assessment of blood pressures and waveforms (Doppler or pulse-volume recordings) at multiple segments along the limb. These more detailed vascular studies are generally reserved for patients with confirmed peripheral artery disease to locate the level and extent of blockage or for patients in whom lower-extremity revascularization is contemplated.
The use of a stethoscope to measure blood pressures for the ankle-brachial index has been studied in a few small series,19,20 but is thought to be less accurate than Doppler, especially in the setting of significant arterial occlusive disease. Because of this, it is recommended and assumed that a Doppler device be used to measure all blood pressures for the ankle-brachial index.
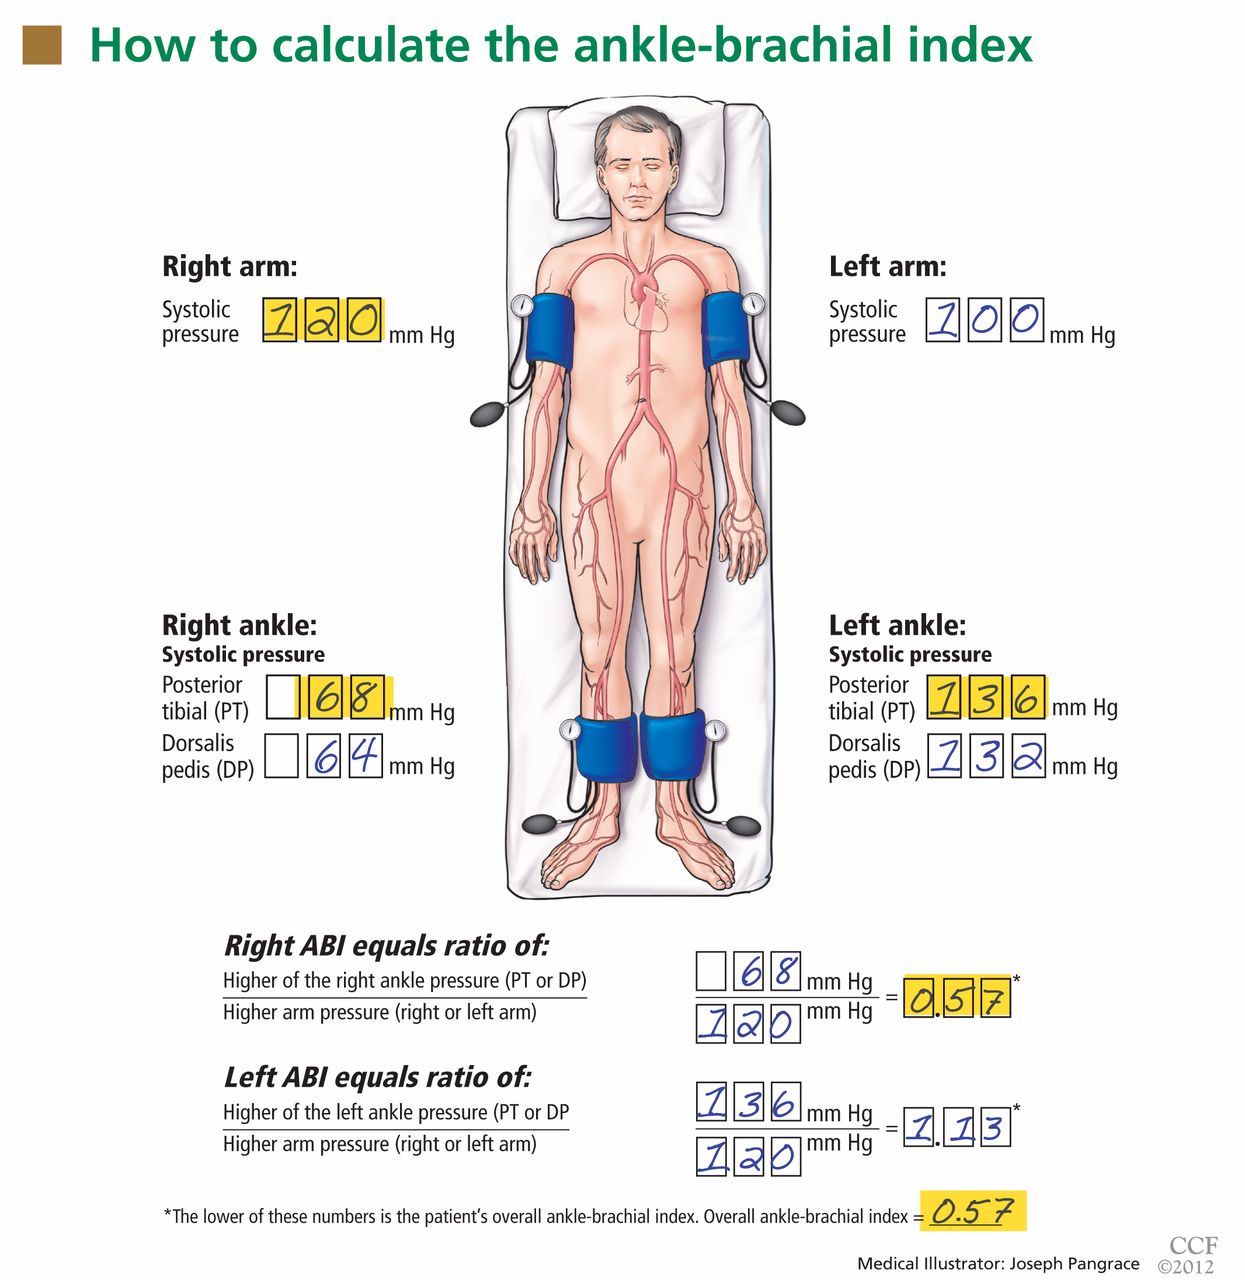
After the patient has been resting quietly for 5 to 10 minutes in the supine position, the systolic blood pressure is measured in both arms and in both ankles in the dorsalis pedis and posterior tibial arteries (Figure 1). The blood pressure cuff is placed about 1 inch above the antecubital fossa for the brachial pressure and about 2 inches above the medial malleolus for the ankle pressures. A clear arterial pulse signal should be heard using the Doppler probe before inflating the blood pressure cuff. The cuff is then inflated to at least 20 mm Hg above the point where the arterial Doppler sounds disappear and then slowly deflated until the Doppler sounds reappear. The blood pressure at which the Doppler signal of the arterial pulse reappears is the systolic pressure for that vessel.
The ankle-brachial index is calculated by dividing the higher of the two ankle systolic blood pressures in each leg by the higher of the two brachial systolic blood pressures. The higher of the two brachial pressures is used as the denominator to account for the possibility of subclavian artery stenosis, which can decrease the blood pressure in the upper extremity. The ankle-brachial index is calculated for each leg, and the lower value is the patient’s overall ankle-brachial index. An abnormal value in either leg indicates peripheral artery disease.
While other ways of calculating the ankle-brachial index have been proposed, such as averaging the two pressures at each ankle or reporting the lower of the two ankle pressures, these methods are not standard for use in clinical practice.
Similarly, the use of oscillometric blood pressure devices has been proposed, which would eliminate the need for a Doppler device and personnel trained in its use. However, results of validation studies of oscillometric measurement of the ankle-brachial index have been inconsistent, likely because the devices were designed for measuring blood pressure in nonobstructed arms, not the legs, and especially not diseased legs.21–25 In general, oscillometric devices tend to overestimate ankle pressure, giving a falsely high ankle-brachial index in patients with moderate to severe peripheral artery disease.21 Their utility in screening for peripheral artery disease has not been evaluated in broad, population-based studies. Efforts to develop and validate new oscillometric devices for diagnosing peripheral artery disease are ongoing.
INTERPRETING THE ANKLE-BRACHIAL INDEX
Diagnostic criteria for the ankle-brachial index were standardized in 2011 (Table 1).26 Most healthy adults have a value greater than 1.0. A value of less than 0.91 is consistent with significant peripheral artery disease, and a value lower than 0.40 at rest generally indicates severe disease. A value between 0.91 and 0.99 is borderline abnormal and does not rule out peripheral artery disease. A value greater than 1.40 reflects noncompressibility of the leg arteries and is not diagnostic (see below).
The ankle-brachial index after exercise. In patients strongly suspected of having peripheral artery disease but who have a normal ankle-brachial index at rest, and especially if the resting value is borderline (ie, 0.91–0.99), the measurement should be repeated after exercise, the better to detect “mild” peripheral artery disease.15 With exercise, increased flow across a fixed stenosis leads to a significant fall in ankle pressure and a lower ankle-brachial index. In one study,27 the ankle-brachial index fell below 0.9 after exercise in 31% of outpatients with symptoms who had initially tested normal.
The exercise is optimally done on a motorized treadmill set at an incline. A number of exercise protocols are in use; at our institution, we use a fixed workload protocol. The ankle-brachial index and ankle pulse-volume recordings are recorded on both sides at rest, after which the patient generally walks for 5 minutes at a 12% grade at 2.0 mph or until symptoms force the patient to stop. The advantage of treadmill testing is the ability to assess functional capacity by measuring the time to the onset of pain and the total walking time.
Alternatively, active pedal plantar flexion maneuvers (heel raises) or corridor walking to the point at which limiting symptoms occur can be done if a treadmill is not available, though this is not the favored approach and does not qualify as formal exercise testing for reimbursement purposes. The patient is asked to do heel raises as high and as fast as possible for 30 seconds or until limiting pain symptoms occur. Results with this maneuver have been shown to correlate well with those of treadmill exercise testing.28
Immediately after any exercise maneuver, arm and ankle pressures are remeasured and bilateral ankle-brachial indices are recalculated. A fall in ankle pressure or the ankle-brachial index after exercise (generally, a fall of more than 20%) supports the diagnosis of peripheral artery disease. If the patient develops leg symptoms during exercise while his or her ankle-brachial index falls significantly, this also supports the vasculogenic nature of the leg symptoms.
An ankle-brachial index greater than 1.40 means that the pedal arteries are stiff and cannot be compressed by the blood pressure cuff. This is considered abnormal, though not necessarily diagnostic of peripheral artery disease. Noncompressible leg arteries are common among patients with long-standing diabetes mellitus or end-stage renal disease, and also can be found in obese patients.
Because toe arteries are usually compressible even when the pedal arteries are not, a toe-brachial index can be obtained to confirm the diagnosis of peripheral artery disease in these cases. This is calculated by measuring the blood pressure in the great toe using a small digital blood pressure cuff and a Doppler probe or a plethysmographic flow sensor. The toe-brachial index is calculated by dividing the toe blood pressure by the higher of the two brachial artery pressures; a value of 0.7 or less generally indicates peripheral artery disease.
WHAT SHOULD BE DONE WITH AN ABNORMAL RESULT?
An abnormal ankle-brachial index establishes the diagnosis of peripheral artery disease, and in many cases no additional diagnostic testing is necessary.
Care of patients with peripheral artery disease has three elements:
- Cardiovascular risk factor assessment and reduction to prevent myocardial infarction, stroke, and death
- Assessment and treatment of leg symptoms to improve function and quality of life
- Foot care to prevent ulcers and amputation.
Risk factor reduction. Because they have a markedly greater risk of cardiovascular disease and death, all patients with peripheral artery disease should undergo aggressive cardiovascular risk factor modification,26,29 including:
- Antiplatelet therapy in the form of aspirin 75–325 mg daily or clopidogrel 75 mg daily as an alternative to aspirin
- Counseling and therapy for immediate smoking cessation if the patient smokes
- Treatment of hypertension to Seventh Joint National Committee goals30
- Treatment of lipids to Adult Treatment Panel III goals31 (generally to a goal low-density lipoprotein cholesterol of less than 100 mg/dL, and less than 70 mg/dL if possible)
- Treatment of diabetes to a goal hemoglobin A1c of less than 7% (in the absence of contraindications).32
Exercise and anticlaudication medication. Patients with an abnormal ankle-brachial index and intermittent claudication may benefit from a supervised exercise program, a trial of drug therapy for claudication, or both. All patients with peripheral artery disease, regardless of symptoms, should be advised to incorporate aerobic exercise (ideally, walking) into their daily routine.
Cilostazol (Pletal), a phosphodiesterase inhibitor, has been given a class IA recommendation in the American College of Cardiology/American Heart Association guidelines for the treatment of intermittent claudication. The dose is generally 100 mg by mouth twice daily.29
Revascularization. Patients with an abnormal ankle-brachial index and lifestyle-limiting claudication that has failed to improve with medical therapy or a course of supervised exercise training should be referred to a vascular specialist for evaluation for revascularization (endovascular therapy or surgical bypass). 29 Endovascular therapy is particularly attractive for patients with claudication and evidence of aortoiliac disease (suspected in patients with gluteal or thigh claudication, diminution of the femoral pulse, or a bruit over the femoral artery on examination and confirmed by noninvasive vascular laboratory testing).
Patients who have ischemic pain at rest, gangrene, or a nonhealing lower-extremity wound that has been present for at least 2 weeks should be referred for revascularization on an urgent basis, given the risk of impending limb loss associated with critical limb ischemia.
A detailed review of the medical, endovascular, and surgical management of peripheral artery disease can be found in a supplement to the Cleveland Clinic Journal of Medicine published in 200633 and in comprehensive multi-society guidelines.26,29
THE ANKLE-BRACHIAL INDEX AS A MARKER OF RISK
Low values: Peripheral artery disease
Peripheral artery disease, as diagnosed by a low ankle-brachial index, confers an excess risk of death from all causes in a graded fashion: ie, the more severe the disease, the lower the survival rate (Figure 2).34 Because peripheral artery disease is a sign of systemic atherosclerosis and one-third to one-half of patients with peripheral artery disease have evidence of cerebrovascular or coronary artery disease,35–37 peripheral artery disease also confers a higher risk of cardiovascular death.
The Edinburgh Artery Study,38 a prospective cohort study of 1,592 randomly selected patients age 55 to 74 years, demonstrated the relationship between a low ankle-brachial index and an increased risk of cardiovascular death. Over 5 years of follow-up, compared with patients with a normal ankle-brachial index, the relative risk of cardiovascular death in symptomatic patients with a value of 0.9 or lower was 2.67 (95% confidence interval [CI] 1.34–5.29). The relative risk in patients with asymptomatic disease was between 1.74 (95% CI 1.09–2.76) and 2.08 (95% CI 1.13–3.83), depending on the level of ankle-brachial index decrement and ankle blood pressure response to hyperemia.
(Reactive hyperemia is an alternative to exercise testing. It is performed by inflating a blood pressure cuff at the thigh above the systolic pressure for 3 to 5 minutes or until the patient can no longer tolerate the inflation. Blood pressures at the ankle are remeasured after cuff release.)
Several other epidemiologic studies have established the association between low ankle-brachial index and the risk of cardiovascular death.
Heald et al39 performed a meta-analysis of 44,590 patients in 11 epidemiologic studies and found that, after adjustment for age, sex, conventional cardiovascular risk factors, and prevalent cardiovascular disease, an ankle-brachial index lower than 0.9 conferred a higher risk of:
- All-cause mortality (pooled risk ratio [RR] 1.60, 95% CI 1.32–1.95)
- Cardiovascular mortality (pooled RR 1.96, 95% CI 1.46–2.64)
- Coronary heart disease (pooled RR 1.45, 95% CI 1.08–1.93)
- Stroke (pooled RR 1.35, 95% CI 1.10–1.65).
Fowkes et al,40 in a meta-analysis of 16 population cohort studies including 48,294 patients over 480,325 person-years of follow-up, found that a low ankle-brachial index predicted cardiovascular events and death even after adjusting for the Framingham risk score, Hazard ratios for cardiovascular death were:
- 2.92 (95% CI 2.31–3.70) in men
- 2.97 (95% CI 2.02–4.35) in women.
Hazard ratios for death from any cause were:
- 2.34 (95% CI 1.97–2.78) in men
- 2.35 (95% CI 1.76–3.13) in women.
Adding the ankle-brachial index to the Framingham risk score resulted in reclassification of risk category in approximately 19% of men and 36% of women.40
The German Epidemiological Trial on Ankle Brachial Index (getABI) screened 6,880 patients 65 years of age and found an abnormal ankle-brachial index in 20.9% of them.41 In more than 5 years of follow-up, a value of less than 0.90 was associated with a higher rate of cardiovascular events and death from any cause in patients with both symptomatic and asymptomatic peripheral artery disease (Figure 3).41
In addition, the lower the ankle-brachial index, the greater the rate of death or severe cardiovascular events. An index between 0.7 and 0.9 was associated with a statistically significant twofold increase (adjusted hazard ratio 2.03), and a value lower than 0.5 was associated with a nearly fivefold increase (hazard ratio 4.65) in the risk of events compared with the group of patients with normal values.41
Abnormal results after exercise
Exercise testing may increase the sensitivity of the ankle-brachial index to detect peripheral artery disease in patients with normal resting values and especially in patients with borderline values. As such, abnormal exercise values have also been associated with an increased risk of death due to any cause and of cardiovascular death.
In a prospective cohort study of 3,209 patients with suspected or known peripheral artery disease referred to a vascular surgery clinic in the Netherlands, patients with lower postexercise values had a higher rate of overall and cardiac death (hazard ratio per 10% lower value 1.16 [95% CI 1.13–1.18] and 1.10 [95% CI 1.09–1.13], respectively).42
Sheikh et al43 reported similar findings in patients with normal resting ankle-brachial indices at Cleveland Clinic. In this study, an abnormal postexercise ankle-brachial index (defined as < 0.85) was associated with a hazard ratio of 1.67 for all-cause mortality compared with a normal postexercise value among individuals with no history of cardiovascular events.
High values: Noncompressible vessels
While the relationship between low values and increased mortality and cardiovascular risk is well accepted, there have been conflicting reports regarding high values (> 1.4) and adverse outcomes.44,45
The Strong Heart Study44 was a population-based study in 4,393 Native Americans followed for more than 8 years for the rate of all-cause and cardiovascular mortality. Most (n = 3,773) of the cohort had a normal ankle-brachial index (≥ 0.9 and ≤ 1.4); 4.9% (n = 216) had a low value (< 0.9); and 9.2% (n = 404) had a high value (> 1.4 or noncompressible). Relative risk ratios for all-cause mortality were 1.69 (95% CI 1.34–2.14) for low values and 1.77 (95% CI 1.48–2.13) for high values compared with those with normal values. Low and high ankle-brachial indices also conferred a risk of cardiovascular death, with relative risk ratios of 2.52 (95% CI 1.74–3.64) and 2.09 (95% CI 1.49–2.94), respectively. There was a U-shaped relationship between the ankle-brachial index and the mortality rate (Figure 4).44
The Atherosclerosis Risk in Communities (ARIC) study45 had different findings. In 14,777 participants followed for a mean of 12.2 years, the cardiovascular disease event rates of patients whose ankle-brachial index-was categorized as high (> 1.3, > 1.4, or > 1.5) were similar to those of patients with a normal value (between 0.9 and 1.3).
Differences in event rates between the two studies may be due to a higher prevalence of values greater than 1.4 in the Strong Heart Study cohort as well as to a higher prevalence of concomitant risk factors (diabetes, older age, hypertension, lipid abnormality) in the high ankle-brachial index group in the Strong Heart Study compared with the ARIC study.
DIFFERING RECOMMENDATIONS
The ankle-brachial index can be used to screen for asymptomatic peripheral artery disease. It can also be used to confirm the diagnosis in patients with symptoms such as intermittent claudication, ischemic pain at rest, or lower extremity ulcers or in patients with signs such as abnormal pulses, bruits, or lower-extremity skin changes. It is also used to reassess the severity of known peripheral artery disease and as a part of a routine surveillance program to assess the patency of bypass grafts and endovascular stents after revascularization procedures.
The complication of peripheral artery disease that patients dread the most is limb loss, but of greater clinical consequence are the alarming rates of cardiovascular events and death in these patients. Epidemiologic studies have shown that fewer than 5% of patients age 55 or older with claudication or asymptomatic peripheral artery disease experience major amputation over a 5-year follow-up period, but 20% of these patients will have a stroke or myocardial infarction and 15% to 30% will die. Of those who die, 75% die of a coronary or cerebrovascular cause.36 Because of the markedly increased risk of death or cardiovascular morbidity in patients with peripheral artery disease, many have advocated screening patients at high risk using the ankle-brachial index. However, there have been conflicting recommendations from national societies and agencies.29,46–48
The United States Preventive Services Task Force (USPSTF) updated its 1996 recommendations on screening for peripheral artery disease in 2005 and recommended against routinely screening for it, giving the practice a “D” recommendation (not recommended). Specifically, it stated that it found “fair evidence that screening asymptomatic adults with the ankle brachial index could lead to some small degree of harm, including false-positive results and unnecessary work-ups,”46 and concluded that “for asymptomatic adults, harms of routine screening for [peripheral artery disease] exceed benefits.”46
This negative recommendation was intensely debated among vascular specialty groups, and a rebuttal was published in 2006.49 The major area of contention was the task force’s assumption that decreased disease-specific morbidity (especially limb loss) is the most important outcome to be prevented by screening for asymptomatic peripheral artery disease, rather than adverse cardiovascular events. The USPSTF has announced plans for an update on screening for peripheral artery disease, anticipated for 2013.50
The American College of Cardiology/American Heart Association task force in 2005 recommended that a history of walking impairment, intermittent claudication, ischemic rest pain, or nonhealing wounds be solicited as part of a standard review of systems for adults age 70 and older or adults age 50 and older who have risk factors for atherosclerosis (class IC recommendation—based only on a consensus opinion of experts, case studies, or standard of care).29 In contrast to the USPSTF recommendations, the joint guidelines further recommended that patients with asymptomatic lower-extremity peripheral artery disease be identified by physical examination, ankle-brachial index, or both, to prevent myocardial infarction, stroke, or death (class IC).29 Patients at risk for lower-extremity peripheral artery disease for whom ankle-brachial index measurement is recommended include those with exertional leg symptoms, those with nonhealing ulcers, those age 70 and older, and those age 50 and older who have a history of moking or diabetes.
The American Diabetes Association and the second Inter-Society Consensus for the Management of Peripheral Arterial Disease (TASC II) issued similar recommendations.48
In 2011, the American College of Cardiology/American Heart Association task force issued a focused update to its 2005 guidelines, broadening the recommendation for testing to include patients age 65 and older on the basis of the getABI study, as well as maintaining the recommendation for testing for those age 50 and older with a history of smoking or diabetes (class IB recommendation).26,41
The task force’s Guideline for the Assessment of Cardiovascular Risk in Asymptomatic Adults says that measuring the ankle-brachial index is reasonable for cardiovascular risk assessment in asymptomatic adults at intermediate risk (class IIA—conflicting evidence or divergence of opinion, from multiple randomized clinical trials).51 Also recommended as risk stratification tools for this patient population are measurement of carotid intima-media thickness and measurement of coronary artery calcium (both class IIA recommendations).
Unlike these tests, however, the ankle-brachial index does not require highly trained technical and medical personnel to perform and interpret. In addition, there is no risk of radiation exposure as is the case in coronary calcium measurement. It is a simpler, lower-cost, and more widely available tool for cardiovascular risk assessment.
LIMITATIONS TO ANKLE-BRACHIAL SCREENING IN PRACTICE
Although this test is relatively simple and noninvasive, it is not widely performed in primary care and cardiovascular medicine. In a study by Mohler and colleagues,52 the most common barriers to its use among primary care providers were the time required to perform it, lack of reimbursement for it, and limited staff availability. Currently, third-party payers do not generally reimburse for an ankle-brachial index examination performed to screen a patient who is asymptomatic but at risk for peripheral artery disease. Unfortunately, this has limited the widespread adoption of a program to detect peripheral artery disease in patients at risk.
Despite these limitations, the ankle-brachial index is an invaluable tool to both screen for peripheral artery disease in the appropriate at-risk patient populations and to diagnose it in patients who present with lower extremity symptoms. There are few diagnostic tests available today that provide such a high degree of diagnostic accuracy with as much prognostic information as the ankle-brachial index and with such little expense and risk to the patient.
- Selvin E, Erlinger TP. Prevalence of and risk factors for peripheral arterial disease in the United States: results from the National Health and Nutrition Examination Survey, 1999–2000. Circulation 2004; 110:738–743.
- Hirsch AT, Criqui MH, Treat-Jacobson D, et al. Peripheral arterial disease detection, awareness, and treatment in primary care. JAMA 2001; 286:1317–1324.
- McDermott MM, Greenland P, Liu K, et al. Leg symptoms in peripheral arterial disease: associated clinical characteristics and functional impairment. JAMA 2001; 286:1599–1606.
- McDermott MM. The magnitude of the problem of peripheral arterial disease: epidemiology and clinical significance. Cleve Clin J Med 2006; 73(suppl 4):S2–S7.
- Criqui MH, Vargas V, Denenberg JO, et al. Ethnicity and peripheral arterial disease: the San Diego Population Study. Circulation 2005; 112:2703–2707.
- Regensteiner JG, Hiatt WR, Coll JR, et al The impact of peripheral arterial disease on health-related quality of life in the Peripheral Arterial Disease Awareness, Risk, and Treatment: New Resources for Survival (PARTNERS) Program. Vasc Med 2008; 13:15–24.
- Arseven A, Guralnik JM, O’Brien E, Liu K, McDermott MM. Peripheral arterial disease and depressed mood in older men and women. Vasc Med 2001; 6:229–234.
- Steg PG, Bhatt DL, Wilson PW, et al; REACH Registry Investigators. One-year cardiovascular event rates in outpatients with atherothrombosis. JAMA 2007; 297:1197–1206.
- Gornik HL, Creager MA. Contemporary management of peripheral arterial disease: I. cardiovascular risk-factor modification. Cleve Clin J Med 2006; 73(suppl 4):S30–S37.
- Antithrombotic Trialists’ Collaboration. Collaborative meta-analysis of randomised trials of antiplatelet therapy for prevention of death, myocardial infarction, and stroke in high risk patients. BMJ 2002; 324:71–86.
- Heart Protection Study Collaborative Group. Randomized trial of the effects of cholesterol-lowering with simvastatin on peripheral vascular and other major vascular outcomes in 20,536 people with peripheral arterial disease and other high-risk conditions. J Vasc Surg 2007; 45:645–654.
- Criqui MH, Fronek A, Klauber MR, Barrett-Connor E, Gabriel S. The sensitivity, specificity, and predictive value of traditional clinical evaluation of peripheral arterial disease: results from noninvasive testing in a defined population. Circulation 1985; 71:516–522.
- Carter SA. Clinical measurement of systolic pressures in limbs with arterial occlusive disease. JAMA 1969; 207:1869–1874.
- Ouriel K, Zarins CK. Doppler ankle pressure: an evaluation of three methods of expression. Arch Surg 1982; 117:1297–1300.
- Yao ST, Hobbs JT, Irvine WT. Ankle systolic pressure measurements in arterial disease affecting the lower extremities. Br J Surg 1969; 56:676–679.
- Carter SA. Indirect systolic pressures and pulse waves in arterial occlusive diseases of the lower extremities. Circulation 1968; 37:624–637.
- Belch JJ, Topol EJ, Agnelli G, et al; Prevention of Atherothrombotic Disease Network. Critical issues in peripheral arterial disease detection and management: a call to action. Arch Intern Med 2003; 163:884–892.
- Lijmer JG, Hunink MG, van den Dungen JJ, Loonstra J, Smit AJ. ROC analysis of noninvasive tests for peripheral arterial disease. Ultrasound Med Biol 1996; 22:391–398.
- Carmo GA, Mandil A, Nascimento BR, et al. Can we measure the ankle-brachial index using only a stethoscope? A pilot study. Fam Pract 2009; 26:22–26.
- Chesbro SB, Asongwed ET, Brown J, John EB. Reliability of Doppler and stethoscope methods of determining systolic blood pressures: considerations for calculating an ankle-brachial index. J Natl Med Assoc 2011; 103:863–869.
- Jönsson B, Lindberg LG, Skau T, Thulesius O. Is oscillometric ankle pressure reliable in leg vascular disease? Clin Physiol 2001; 21:155–163.
- Ramanathan A, Conaghan PJ, Jenkinson AD, Bishop CR. Comparison of ankle-brachial pressure index measurements using an automated oscillometric device with the standard Doppler ultrasound technique. ANZ J Surg 2003; 73:105–108.
- Beckman JA, Higgins CO, Gerhard-Herman M. Automated oscillometric determination of the ankle-brachial index provides accuracy necessary for office practice. Hypertension 2006; 47:35–38.
- Mehlsen J, Wiinberg N, Bruce C. Oscillometric blood pressure measurement: a simple method in screening for peripheral arterial disease. Clin Physiol Funct Imaging 2008; 28:426–429.
- Aboyans V, Lacroix P, Doucet S, Preux PM, Criqui MH, Laskar M. Diagnosis of peripheral arterial disease in general practice: can the ankle-brachial index be measured either by pulse palpation or an automatic blood pressure device? Int J Clin Pract 2008; 62:1001–1007.
- 2011 Writing Group Members. 2011 ACCF/AHA Focused Update of the Guideline for the Management of patients with peripheral artery disease (updating the 2005 guideline): a report of the American College of Cardiology Foundation/American Heart Association Task Force on practice guidelines. Circulation 2011; 124:2020–2045.
- Stein R, Hriljac I, Halperin JL, Gustavson SM, Teodorescu V, Olin JW. Limitation of the resting ankle-brachial index in symptomatic patients with peripheral arterial disease. Vasc Med 2006; 11:29–33.
- Amirhamzeh MM, Chant HJ, Rees JL, Hands LJ, Powell RJ, Campbell WB. A comparative study of treadmill tests and heel raising exercise for peripheral arterial disease. Eur J Vasc Endovasc Surg 1997; 13:301–305.
- Hirsch AT, Haskal ZJ, Hertzer NR, et al; American Association for Vascular Surgery; Society for Vascular Surgery; Society for Cardiovascular Angiography and Interventions; Society for Vascular Medicine and Biology; Society of Interventional Radiology; ACC/AHA Task Force on Practice Guidelines Writing Committee to Develop Guidelines for the Management of Patients With Peripheral Arterial Disease; American Association of Cardiovascular and Pulmonary Rehabilitation; National Heart, Lung, and Blood Institute; Society for Vascular Nursing; TransAtlantic Inter-Society Consensus; Vascular Disease Foundation. ACC/AHA 2005 practice guidelines for the management of patients with peripheral arterial disease (lower extremity, renal, mesenteric, and abdominal aortic): a collaborative report from the American Association for Vascular Surgery/Society for Vascular Surgery, Society for Cardiovascular Angiography and Interventions, Society for Vascular Medicine and Biology, Society of Interventional Radiology, and the ACC/AHA Task Force on Practice Guidelines (Writing Committee to Develop Guidelines for the Management of Patients With Peripheral Arterial Disease): endorsed by the American Association of Cardiovascular and Pulmonary Rehabilitation; National Heart, Lung, and Blood Institute; Society for Vascular Nursing; TransAtlantic Inter-Society Consensus; and Vascular Disease Foundation. Circulation 2006; 113:e463–e654.
- Chobanian AV, Bakris GL, Black HR, et al; Joint National Committee on Prevention, Detection, Evaluation, and Treatment of High Blood Pressure; National Heart, Lung, and Blood Institute; National High Blood Pressure Education Program Coordinating Committee. Seventh report of the Joint National Committee on Prevention, Detection, Evaluation, and Treatment of High Blood Pressure. Hypertension 2003; 42:1206–1252.
- National Cholesterol Education Program (NCEP) Expert Panel on Detection, Evaluation, and Treatment of High Blood Cholesterol in Adults (Adult Treatment Panel III). Third Report of the National Cholesterol Education Program (NCEP) Expert Panel on Detection, Evaluation, and Treatment of High Blood Cholesterol in Adults (Adult Treatment Panel III) final report. Circulation 2002; 106:3143–3421.
- Skyler JS, Bergenstal R, Bonow RO, et al; American Diabetes Association; American College of Cardiology Foundation; American Heart Association. Intensive glycemic control and the prevention of cardiovascular events: implications of the ACCORD, ADVANCE, and VA Diabetes Trials: a position statement of the American Diabetes Association and a Scientific Statement of the American College of Cardiology Foundation and the American Heart Association. J Am Coll Cardiol 2009; 53:298–304.
- Almahameed A, Bartholomew JR, editors. Peripheral arterial disease: recognition and contemporary management. Cleve Clin J Med 2006; 73(suppl 4):S1–S51.
- McKenna M, Wolfson S, Kuller L. The ratio of ankle and arm arterial pressure as an independent predictor of mortality. Atherosclerosis 1991; 87:119–128.
- Valentine RJ, Grayburn PA, Eichhorn EJ, Myers SI, Clagett GP. Coronary artery disease is highly prevalent among patients with premature peripheral vascular disease. J Vasc Surg 1994; 19:668–674.
- Weitz JI, Byrne J, Clagett GP, et al. Diagnosis and treatment of chronic arterial insufficiency of the lower extremities: a critical review. Circulation 1996; 94:3026–3049.
- Hertzer NR, Beven EG, Young JR, et al. Coronary artery disease in peripheral vascular patients. A classification of 1000 coronary angiograms and results of surgical management. Ann Surg 1984; 199:223–233.
- Leng GC, Lee AJ, Fowkes FG, et al. Incidence, natural history and cardiovascular events in symptomatic and asymptomatic peripheral arterial disease in the general population. Int J Epidemiol 1996; 25:1172–1181.
- Heald CL, Fowkes FG, Murray GD, Price JF; Ankle Brachial Index Collaboration. Risk of mortality and cardiovascular disease associated with the ankle-brachial index: Systematic review. Atherosclerosis 2006; 189:61–69.
- Ankle Brachial Index; Fowkes FG, Murray GD, Butcher I, et al. Collaboration Ankle brachial index combined with Framingham Risk Score to predict cardiovascular events and mortality: a meta-analysis. JAMA 2008; 300:197–208.
- Diehm C, Allenberg JR, Pittrow D, et al; German Epidemiological Trial on Ankle Brachial Index Study Group. Mortality and vascular morbidity in older adults with asymptomatic versus symptomatic peripheral artery disease. Circulation 2009; 120:2053–2061.
- Feringa HH, Bax JJ, van Waning VH, et al. The long-term prognostic value of the resting and postexercise ankle-brachial index. Arch Intern Med 2006; 166:529–535.
- Sheikh MA, Bhatt DL, Li J, Lin S, Bartholomew JR. Usefulness of postexercise ankle-brachial index to predict all-cause mortality. Am J Cardiol 2011; 107:778–782.
- Resnick HE, Lindsay RS, McDermott MM, et al. Relationship of high and low ankle brachial index to all-cause and cardiovascular disease mortality: the Strong Heart Study. Circulation 2004; 109:733–739.
- Wattanakit K, Folsom AR, Duprez DA, Weatherley BD, Hirsch AT. Clinical significance of a high ankle-brachial index: insights from the Atherosclerosis Risk in Communities (ARIC) Study. Atherosclerosis 2007; 190:459–464.
- US Preventive Services Task Force. Screening for peripheral arterial disease: Recommendation statement. http://www.ahrq.gov/clinic/uspstf05/pad/padrs.pdf. Accessed July 25, 2012.
- Mayfield JA, Reiber GE, Sanders LJ, Janisse D, Pogach LM; American Diabetes Association. Preventive foot care in diabetes. Diabetes Care 2004; 27(suppl 1):S63–S64.
- Norgren L, Hiatt WR, Dormandy JA, Nehler MR, Harris KA, Fowkes FG; TASC II Working Group. Inter-Society Consensus for the Management of Peripheral Arterial Disease (TASC II). J Vasc Surg 2007; 45(suppl S):S5–S67.
- Beckman JA, Jaff MR, Creager MA. The United States preventive services task force recommendation statement on screening for peripheral arterial disease: more harm than benefit? Circulation 2006; 114:861–866.
- US Preventive Services Task Force. Screening for peripheral artery disease draft research plan. http://www.uspreventiveservicestaskforce.org/uspstf12/pad/padslides.htm. Accessed July 26, 2012.
- Greenland P, Alpert JS, Beller GA, et al; American College of Cardiology Foundation/American Heart Association Task Force on Practice Guidelines. 2010 ACCF/AHA guideline for assessment of cardiovascular risk in asymptomatic adults: a report of the American College of Cardiology Foundation/American Heart Association Task Force on Practice Guidelines. Circulation 2010; 122:e584–e636.
- Mohler ER, Treat-Jacobson D, Reilly MP, et al. Utility and barriers to performance of the ankle-brachial index in primary care practice. Vasc Med 2004; 9:253–260.
In this article, we seek to convince you to measure the ankle-brachial index for any patient you suspect may have peripheral artery disease. This would include patients who are elderly, who smoke, or who have diabetes, regardless of whether or not they have symptoms. The ankle-brachial index is a simple test that involves taking the blood pressure in all four limbs using a hand-held Doppler device and then dividing the leg systolic pressure by the arm systolic pressure.
This simple test is both sensitive and specific for peripheral artery disease. It also gives a good assessment of cardiovascular risk. The downside: you or a member of your staff spends a few minutes doing it. Also, for patients without leg symptoms or abnormal findings on physical examination, you may not be paid for doing it.
Despite these limitations, the ankle-brachial index is a powerful clinical tool that deserves to be performed more often in primary care.
PERIPHERAL ARTERY DISEASE IS COMMON AND SERIOUS
Peripheral artery disease is important to detect, as it is common, it has serious consequences, and effective treatments are available. However, many patients with the disease do not have typical symptoms.
Peripheral artery disease affects up to 29% of people over age 70, depending on the population sampled.1,2 Its classic symptom is intermittent claudication, ie, leg pain with walking that improves with rest. However, most patients do not have intermittent claudication; they have atypical leg symptoms or no symptoms at all.2,3 While the risk factors for peripheral artery disease are similar to those for coronary artery disease, the factors most strongly associated with peripheral artery disease are older age, tobacco smoking, and diabetes mellitus.4 Blacks are twice as likely to have it compared with whites, even after adjusting for other cardiovascular risk factors.5
Untreated peripheral artery disease may have serious consequences, such as amputation, impaired functional capacity, poor quality of life, and depression.3,6,7 In addition, it is a strong marker of atherosclerotic burden and cardiovascular risk and has been recognized as a coronary risk equivalent. Patients with peripheral artery disease are at higher risk of death, myocardial infarction, stroke, and hospitalization, with event rates as high as 21% per year.8
Fortunately, simple therapies have been shown to prevent adverse cardiovascular events in peripheral artery disease, including antiplatelet drugs, statins, and angiotensin-converting enzyme inhibitors.9–11
THE ANKLE-BRACHIAL INDEX IS SENSITIVE AND SPECIFIC
The evaluation for possible peripheral artery disease should begin with the medical history, a cardiovascular review of systems, and a focused physical examination in which one should:
- Measure the blood pressure in both arms to assess for occult subclavian stenosis
- Auscultate for bruits over the carotid, abdominal, and femoral arteries
- Palpate the pulses in the lower extremities and the abdominal aorta
- Inspect the bare legs and feet for thinning of the skin, hair loss, thickening of the nails (which are nonspecific signs), and ulceration.
However, the physical examination has limited sensitivity and specificity for diagnosing peripheral artery disease. In general, the most reliable finding is the absence of a palpable posterior tibial artery pulse, which has been reported to have a specificity of 71% and a sensitivity of 91% for peripheral artery disease.12
The ankle-brachial index is the first-line test for both screening for peripheral artery disease and for diagnosing it. It is inexpensive and noninvasive to obtain and has a high sensitivity (79% to 95%) and specificity (95% to 96%) compared with angiography as the gold standard.13–18 It can be measured easily in the office, and every practitioner who cares for patients at risk of cardiovascular disease can be trained to measure it competently.
HOW TO MEASURE THE ANKLE-BRACHIAL INDEX
The ankle-brachial index is the ratio of the systolic pressure in the ankle to the systolic pressure in the arm. In healthy people, this ratio is typically greater than 1.0 or 1.1.
You can measure the ankle-brachial index in the office with a blood pressure cuff, sphygmomanometer, and handheld Doppler device. Alternatively, it can be measured in a noninvasive vascular laboratory as part of a more detailed examination that allows for assessment of blood pressures and waveforms (Doppler or pulse-volume recordings) at multiple segments along the limb. These more detailed vascular studies are generally reserved for patients with confirmed peripheral artery disease to locate the level and extent of blockage or for patients in whom lower-extremity revascularization is contemplated.
The use of a stethoscope to measure blood pressures for the ankle-brachial index has been studied in a few small series,19,20 but is thought to be less accurate than Doppler, especially in the setting of significant arterial occlusive disease. Because of this, it is recommended and assumed that a Doppler device be used to measure all blood pressures for the ankle-brachial index.
After the patient has been resting quietly for 5 to 10 minutes in the supine position, the systolic blood pressure is measured in both arms and in both ankles in the dorsalis pedis and posterior tibial arteries (Figure 1). The blood pressure cuff is placed about 1 inch above the antecubital fossa for the brachial pressure and about 2 inches above the medial malleolus for the ankle pressures. A clear arterial pulse signal should be heard using the Doppler probe before inflating the blood pressure cuff. The cuff is then inflated to at least 20 mm Hg above the point where the arterial Doppler sounds disappear and then slowly deflated until the Doppler sounds reappear. The blood pressure at which the Doppler signal of the arterial pulse reappears is the systolic pressure for that vessel.
The ankle-brachial index is calculated by dividing the higher of the two ankle systolic blood pressures in each leg by the higher of the two brachial systolic blood pressures. The higher of the two brachial pressures is used as the denominator to account for the possibility of subclavian artery stenosis, which can decrease the blood pressure in the upper extremity. The ankle-brachial index is calculated for each leg, and the lower value is the patient’s overall ankle-brachial index. An abnormal value in either leg indicates peripheral artery disease.
While other ways of calculating the ankle-brachial index have been proposed, such as averaging the two pressures at each ankle or reporting the lower of the two ankle pressures, these methods are not standard for use in clinical practice.
Similarly, the use of oscillometric blood pressure devices has been proposed, which would eliminate the need for a Doppler device and personnel trained in its use. However, results of validation studies of oscillometric measurement of the ankle-brachial index have been inconsistent, likely because the devices were designed for measuring blood pressure in nonobstructed arms, not the legs, and especially not diseased legs.21–25 In general, oscillometric devices tend to overestimate ankle pressure, giving a falsely high ankle-brachial index in patients with moderate to severe peripheral artery disease.21 Their utility in screening for peripheral artery disease has not been evaluated in broad, population-based studies. Efforts to develop and validate new oscillometric devices for diagnosing peripheral artery disease are ongoing.
INTERPRETING THE ANKLE-BRACHIAL INDEX
Diagnostic criteria for the ankle-brachial index were standardized in 2011 (Table 1).26 Most healthy adults have a value greater than 1.0. A value of less than 0.91 is consistent with significant peripheral artery disease, and a value lower than 0.40 at rest generally indicates severe disease. A value between 0.91 and 0.99 is borderline abnormal and does not rule out peripheral artery disease. A value greater than 1.40 reflects noncompressibility of the leg arteries and is not diagnostic (see below).
The ankle-brachial index after exercise. In patients strongly suspected of having peripheral artery disease but who have a normal ankle-brachial index at rest, and especially if the resting value is borderline (ie, 0.91–0.99), the measurement should be repeated after exercise, the better to detect “mild” peripheral artery disease.15 With exercise, increased flow across a fixed stenosis leads to a significant fall in ankle pressure and a lower ankle-brachial index. In one study,27 the ankle-brachial index fell below 0.9 after exercise in 31% of outpatients with symptoms who had initially tested normal.
The exercise is optimally done on a motorized treadmill set at an incline. A number of exercise protocols are in use; at our institution, we use a fixed workload protocol. The ankle-brachial index and ankle pulse-volume recordings are recorded on both sides at rest, after which the patient generally walks for 5 minutes at a 12% grade at 2.0 mph or until symptoms force the patient to stop. The advantage of treadmill testing is the ability to assess functional capacity by measuring the time to the onset of pain and the total walking time.
Alternatively, active pedal plantar flexion maneuvers (heel raises) or corridor walking to the point at which limiting symptoms occur can be done if a treadmill is not available, though this is not the favored approach and does not qualify as formal exercise testing for reimbursement purposes. The patient is asked to do heel raises as high and as fast as possible for 30 seconds or until limiting pain symptoms occur. Results with this maneuver have been shown to correlate well with those of treadmill exercise testing.28
Immediately after any exercise maneuver, arm and ankle pressures are remeasured and bilateral ankle-brachial indices are recalculated. A fall in ankle pressure or the ankle-brachial index after exercise (generally, a fall of more than 20%) supports the diagnosis of peripheral artery disease. If the patient develops leg symptoms during exercise while his or her ankle-brachial index falls significantly, this also supports the vasculogenic nature of the leg symptoms.
An ankle-brachial index greater than 1.40 means that the pedal arteries are stiff and cannot be compressed by the blood pressure cuff. This is considered abnormal, though not necessarily diagnostic of peripheral artery disease. Noncompressible leg arteries are common among patients with long-standing diabetes mellitus or end-stage renal disease, and also can be found in obese patients.
Because toe arteries are usually compressible even when the pedal arteries are not, a toe-brachial index can be obtained to confirm the diagnosis of peripheral artery disease in these cases. This is calculated by measuring the blood pressure in the great toe using a small digital blood pressure cuff and a Doppler probe or a plethysmographic flow sensor. The toe-brachial index is calculated by dividing the toe blood pressure by the higher of the two brachial artery pressures; a value of 0.7 or less generally indicates peripheral artery disease.
WHAT SHOULD BE DONE WITH AN ABNORMAL RESULT?
An abnormal ankle-brachial index establishes the diagnosis of peripheral artery disease, and in many cases no additional diagnostic testing is necessary.
Care of patients with peripheral artery disease has three elements:
- Cardiovascular risk factor assessment and reduction to prevent myocardial infarction, stroke, and death
- Assessment and treatment of leg symptoms to improve function and quality of life
- Foot care to prevent ulcers and amputation.
Risk factor reduction. Because they have a markedly greater risk of cardiovascular disease and death, all patients with peripheral artery disease should undergo aggressive cardiovascular risk factor modification,26,29 including:
- Antiplatelet therapy in the form of aspirin 75–325 mg daily or clopidogrel 75 mg daily as an alternative to aspirin
- Counseling and therapy for immediate smoking cessation if the patient smokes
- Treatment of hypertension to Seventh Joint National Committee goals30
- Treatment of lipids to Adult Treatment Panel III goals31 (generally to a goal low-density lipoprotein cholesterol of less than 100 mg/dL, and less than 70 mg/dL if possible)
- Treatment of diabetes to a goal hemoglobin A1c of less than 7% (in the absence of contraindications).32
Exercise and anticlaudication medication. Patients with an abnormal ankle-brachial index and intermittent claudication may benefit from a supervised exercise program, a trial of drug therapy for claudication, or both. All patients with peripheral artery disease, regardless of symptoms, should be advised to incorporate aerobic exercise (ideally, walking) into their daily routine.
Cilostazol (Pletal), a phosphodiesterase inhibitor, has been given a class IA recommendation in the American College of Cardiology/American Heart Association guidelines for the treatment of intermittent claudication. The dose is generally 100 mg by mouth twice daily.29
Revascularization. Patients with an abnormal ankle-brachial index and lifestyle-limiting claudication that has failed to improve with medical therapy or a course of supervised exercise training should be referred to a vascular specialist for evaluation for revascularization (endovascular therapy or surgical bypass). 29 Endovascular therapy is particularly attractive for patients with claudication and evidence of aortoiliac disease (suspected in patients with gluteal or thigh claudication, diminution of the femoral pulse, or a bruit over the femoral artery on examination and confirmed by noninvasive vascular laboratory testing).
Patients who have ischemic pain at rest, gangrene, or a nonhealing lower-extremity wound that has been present for at least 2 weeks should be referred for revascularization on an urgent basis, given the risk of impending limb loss associated with critical limb ischemia.
A detailed review of the medical, endovascular, and surgical management of peripheral artery disease can be found in a supplement to the Cleveland Clinic Journal of Medicine published in 200633 and in comprehensive multi-society guidelines.26,29
THE ANKLE-BRACHIAL INDEX AS A MARKER OF RISK
Low values: Peripheral artery disease
Peripheral artery disease, as diagnosed by a low ankle-brachial index, confers an excess risk of death from all causes in a graded fashion: ie, the more severe the disease, the lower the survival rate (Figure 2).34 Because peripheral artery disease is a sign of systemic atherosclerosis and one-third to one-half of patients with peripheral artery disease have evidence of cerebrovascular or coronary artery disease,35–37 peripheral artery disease also confers a higher risk of cardiovascular death.
The Edinburgh Artery Study,38 a prospective cohort study of 1,592 randomly selected patients age 55 to 74 years, demonstrated the relationship between a low ankle-brachial index and an increased risk of cardiovascular death. Over 5 years of follow-up, compared with patients with a normal ankle-brachial index, the relative risk of cardiovascular death in symptomatic patients with a value of 0.9 or lower was 2.67 (95% confidence interval [CI] 1.34–5.29). The relative risk in patients with asymptomatic disease was between 1.74 (95% CI 1.09–2.76) and 2.08 (95% CI 1.13–3.83), depending on the level of ankle-brachial index decrement and ankle blood pressure response to hyperemia.
(Reactive hyperemia is an alternative to exercise testing. It is performed by inflating a blood pressure cuff at the thigh above the systolic pressure for 3 to 5 minutes or until the patient can no longer tolerate the inflation. Blood pressures at the ankle are remeasured after cuff release.)
Several other epidemiologic studies have established the association between low ankle-brachial index and the risk of cardiovascular death.
Heald et al39 performed a meta-analysis of 44,590 patients in 11 epidemiologic studies and found that, after adjustment for age, sex, conventional cardiovascular risk factors, and prevalent cardiovascular disease, an ankle-brachial index lower than 0.9 conferred a higher risk of:
- All-cause mortality (pooled risk ratio [RR] 1.60, 95% CI 1.32–1.95)
- Cardiovascular mortality (pooled RR 1.96, 95% CI 1.46–2.64)
- Coronary heart disease (pooled RR 1.45, 95% CI 1.08–1.93)
- Stroke (pooled RR 1.35, 95% CI 1.10–1.65).
Fowkes et al,40 in a meta-analysis of 16 population cohort studies including 48,294 patients over 480,325 person-years of follow-up, found that a low ankle-brachial index predicted cardiovascular events and death even after adjusting for the Framingham risk score, Hazard ratios for cardiovascular death were:
- 2.92 (95% CI 2.31–3.70) in men
- 2.97 (95% CI 2.02–4.35) in women.
Hazard ratios for death from any cause were:
- 2.34 (95% CI 1.97–2.78) in men
- 2.35 (95% CI 1.76–3.13) in women.
Adding the ankle-brachial index to the Framingham risk score resulted in reclassification of risk category in approximately 19% of men and 36% of women.40
The German Epidemiological Trial on Ankle Brachial Index (getABI) screened 6,880 patients 65 years of age and found an abnormal ankle-brachial index in 20.9% of them.41 In more than 5 years of follow-up, a value of less than 0.90 was associated with a higher rate of cardiovascular events and death from any cause in patients with both symptomatic and asymptomatic peripheral artery disease (Figure 3).41
In addition, the lower the ankle-brachial index, the greater the rate of death or severe cardiovascular events. An index between 0.7 and 0.9 was associated with a statistically significant twofold increase (adjusted hazard ratio 2.03), and a value lower than 0.5 was associated with a nearly fivefold increase (hazard ratio 4.65) in the risk of events compared with the group of patients with normal values.41
Abnormal results after exercise
Exercise testing may increase the sensitivity of the ankle-brachial index to detect peripheral artery disease in patients with normal resting values and especially in patients with borderline values. As such, abnormal exercise values have also been associated with an increased risk of death due to any cause and of cardiovascular death.
In a prospective cohort study of 3,209 patients with suspected or known peripheral artery disease referred to a vascular surgery clinic in the Netherlands, patients with lower postexercise values had a higher rate of overall and cardiac death (hazard ratio per 10% lower value 1.16 [95% CI 1.13–1.18] and 1.10 [95% CI 1.09–1.13], respectively).42
Sheikh et al43 reported similar findings in patients with normal resting ankle-brachial indices at Cleveland Clinic. In this study, an abnormal postexercise ankle-brachial index (defined as < 0.85) was associated with a hazard ratio of 1.67 for all-cause mortality compared with a normal postexercise value among individuals with no history of cardiovascular events.
High values: Noncompressible vessels
While the relationship between low values and increased mortality and cardiovascular risk is well accepted, there have been conflicting reports regarding high values (> 1.4) and adverse outcomes.44,45
The Strong Heart Study44 was a population-based study in 4,393 Native Americans followed for more than 8 years for the rate of all-cause and cardiovascular mortality. Most (n = 3,773) of the cohort had a normal ankle-brachial index (≥ 0.9 and ≤ 1.4); 4.9% (n = 216) had a low value (< 0.9); and 9.2% (n = 404) had a high value (> 1.4 or noncompressible). Relative risk ratios for all-cause mortality were 1.69 (95% CI 1.34–2.14) for low values and 1.77 (95% CI 1.48–2.13) for high values compared with those with normal values. Low and high ankle-brachial indices also conferred a risk of cardiovascular death, with relative risk ratios of 2.52 (95% CI 1.74–3.64) and 2.09 (95% CI 1.49–2.94), respectively. There was a U-shaped relationship between the ankle-brachial index and the mortality rate (Figure 4).44
The Atherosclerosis Risk in Communities (ARIC) study45 had different findings. In 14,777 participants followed for a mean of 12.2 years, the cardiovascular disease event rates of patients whose ankle-brachial index-was categorized as high (> 1.3, > 1.4, or > 1.5) were similar to those of patients with a normal value (between 0.9 and 1.3).
Differences in event rates between the two studies may be due to a higher prevalence of values greater than 1.4 in the Strong Heart Study cohort as well as to a higher prevalence of concomitant risk factors (diabetes, older age, hypertension, lipid abnormality) in the high ankle-brachial index group in the Strong Heart Study compared with the ARIC study.
DIFFERING RECOMMENDATIONS
The ankle-brachial index can be used to screen for asymptomatic peripheral artery disease. It can also be used to confirm the diagnosis in patients with symptoms such as intermittent claudication, ischemic pain at rest, or lower extremity ulcers or in patients with signs such as abnormal pulses, bruits, or lower-extremity skin changes. It is also used to reassess the severity of known peripheral artery disease and as a part of a routine surveillance program to assess the patency of bypass grafts and endovascular stents after revascularization procedures.
The complication of peripheral artery disease that patients dread the most is limb loss, but of greater clinical consequence are the alarming rates of cardiovascular events and death in these patients. Epidemiologic studies have shown that fewer than 5% of patients age 55 or older with claudication or asymptomatic peripheral artery disease experience major amputation over a 5-year follow-up period, but 20% of these patients will have a stroke or myocardial infarction and 15% to 30% will die. Of those who die, 75% die of a coronary or cerebrovascular cause.36 Because of the markedly increased risk of death or cardiovascular morbidity in patients with peripheral artery disease, many have advocated screening patients at high risk using the ankle-brachial index. However, there have been conflicting recommendations from national societies and agencies.29,46–48
The United States Preventive Services Task Force (USPSTF) updated its 1996 recommendations on screening for peripheral artery disease in 2005 and recommended against routinely screening for it, giving the practice a “D” recommendation (not recommended). Specifically, it stated that it found “fair evidence that screening asymptomatic adults with the ankle brachial index could lead to some small degree of harm, including false-positive results and unnecessary work-ups,”46 and concluded that “for asymptomatic adults, harms of routine screening for [peripheral artery disease] exceed benefits.”46
This negative recommendation was intensely debated among vascular specialty groups, and a rebuttal was published in 2006.49 The major area of contention was the task force’s assumption that decreased disease-specific morbidity (especially limb loss) is the most important outcome to be prevented by screening for asymptomatic peripheral artery disease, rather than adverse cardiovascular events. The USPSTF has announced plans for an update on screening for peripheral artery disease, anticipated for 2013.50
The American College of Cardiology/American Heart Association task force in 2005 recommended that a history of walking impairment, intermittent claudication, ischemic rest pain, or nonhealing wounds be solicited as part of a standard review of systems for adults age 70 and older or adults age 50 and older who have risk factors for atherosclerosis (class IC recommendation—based only on a consensus opinion of experts, case studies, or standard of care).29 In contrast to the USPSTF recommendations, the joint guidelines further recommended that patients with asymptomatic lower-extremity peripheral artery disease be identified by physical examination, ankle-brachial index, or both, to prevent myocardial infarction, stroke, or death (class IC).29 Patients at risk for lower-extremity peripheral artery disease for whom ankle-brachial index measurement is recommended include those with exertional leg symptoms, those with nonhealing ulcers, those age 70 and older, and those age 50 and older who have a history of moking or diabetes.
The American Diabetes Association and the second Inter-Society Consensus for the Management of Peripheral Arterial Disease (TASC II) issued similar recommendations.48
In 2011, the American College of Cardiology/American Heart Association task force issued a focused update to its 2005 guidelines, broadening the recommendation for testing to include patients age 65 and older on the basis of the getABI study, as well as maintaining the recommendation for testing for those age 50 and older with a history of smoking or diabetes (class IB recommendation).26,41
The task force’s Guideline for the Assessment of Cardiovascular Risk in Asymptomatic Adults says that measuring the ankle-brachial index is reasonable for cardiovascular risk assessment in asymptomatic adults at intermediate risk (class IIA—conflicting evidence or divergence of opinion, from multiple randomized clinical trials).51 Also recommended as risk stratification tools for this patient population are measurement of carotid intima-media thickness and measurement of coronary artery calcium (both class IIA recommendations).
Unlike these tests, however, the ankle-brachial index does not require highly trained technical and medical personnel to perform and interpret. In addition, there is no risk of radiation exposure as is the case in coronary calcium measurement. It is a simpler, lower-cost, and more widely available tool for cardiovascular risk assessment.
LIMITATIONS TO ANKLE-BRACHIAL SCREENING IN PRACTICE
Although this test is relatively simple and noninvasive, it is not widely performed in primary care and cardiovascular medicine. In a study by Mohler and colleagues,52 the most common barriers to its use among primary care providers were the time required to perform it, lack of reimbursement for it, and limited staff availability. Currently, third-party payers do not generally reimburse for an ankle-brachial index examination performed to screen a patient who is asymptomatic but at risk for peripheral artery disease. Unfortunately, this has limited the widespread adoption of a program to detect peripheral artery disease in patients at risk.
Despite these limitations, the ankle-brachial index is an invaluable tool to both screen for peripheral artery disease in the appropriate at-risk patient populations and to diagnose it in patients who present with lower extremity symptoms. There are few diagnostic tests available today that provide such a high degree of diagnostic accuracy with as much prognostic information as the ankle-brachial index and with such little expense and risk to the patient.
- Selvin E, Erlinger TP. Prevalence of and risk factors for peripheral arterial disease in the United States: results from the National Health and Nutrition Examination Survey, 1999–2000. Circulation 2004; 110:738–743.
- Hirsch AT, Criqui MH, Treat-Jacobson D, et al. Peripheral arterial disease detection, awareness, and treatment in primary care. JAMA 2001; 286:1317–1324.
- McDermott MM, Greenland P, Liu K, et al. Leg symptoms in peripheral arterial disease: associated clinical characteristics and functional impairment. JAMA 2001; 286:1599–1606.
- McDermott MM. The magnitude of the problem of peripheral arterial disease: epidemiology and clinical significance. Cleve Clin J Med 2006; 73(suppl 4):S2–S7.
- Criqui MH, Vargas V, Denenberg JO, et al. Ethnicity and peripheral arterial disease: the San Diego Population Study. Circulation 2005; 112:2703–2707.
- Regensteiner JG, Hiatt WR, Coll JR, et al The impact of peripheral arterial disease on health-related quality of life in the Peripheral Arterial Disease Awareness, Risk, and Treatment: New Resources for Survival (PARTNERS) Program. Vasc Med 2008; 13:15–24.
- Arseven A, Guralnik JM, O’Brien E, Liu K, McDermott MM. Peripheral arterial disease and depressed mood in older men and women. Vasc Med 2001; 6:229–234.
- Steg PG, Bhatt DL, Wilson PW, et al; REACH Registry Investigators. One-year cardiovascular event rates in outpatients with atherothrombosis. JAMA 2007; 297:1197–1206.
- Gornik HL, Creager MA. Contemporary management of peripheral arterial disease: I. cardiovascular risk-factor modification. Cleve Clin J Med 2006; 73(suppl 4):S30–S37.
- Antithrombotic Trialists’ Collaboration. Collaborative meta-analysis of randomised trials of antiplatelet therapy for prevention of death, myocardial infarction, and stroke in high risk patients. BMJ 2002; 324:71–86.
- Heart Protection Study Collaborative Group. Randomized trial of the effects of cholesterol-lowering with simvastatin on peripheral vascular and other major vascular outcomes in 20,536 people with peripheral arterial disease and other high-risk conditions. J Vasc Surg 2007; 45:645–654.
- Criqui MH, Fronek A, Klauber MR, Barrett-Connor E, Gabriel S. The sensitivity, specificity, and predictive value of traditional clinical evaluation of peripheral arterial disease: results from noninvasive testing in a defined population. Circulation 1985; 71:516–522.
- Carter SA. Clinical measurement of systolic pressures in limbs with arterial occlusive disease. JAMA 1969; 207:1869–1874.
- Ouriel K, Zarins CK. Doppler ankle pressure: an evaluation of three methods of expression. Arch Surg 1982; 117:1297–1300.
- Yao ST, Hobbs JT, Irvine WT. Ankle systolic pressure measurements in arterial disease affecting the lower extremities. Br J Surg 1969; 56:676–679.
- Carter SA. Indirect systolic pressures and pulse waves in arterial occlusive diseases of the lower extremities. Circulation 1968; 37:624–637.
- Belch JJ, Topol EJ, Agnelli G, et al; Prevention of Atherothrombotic Disease Network. Critical issues in peripheral arterial disease detection and management: a call to action. Arch Intern Med 2003; 163:884–892.
- Lijmer JG, Hunink MG, van den Dungen JJ, Loonstra J, Smit AJ. ROC analysis of noninvasive tests for peripheral arterial disease. Ultrasound Med Biol 1996; 22:391–398.
- Carmo GA, Mandil A, Nascimento BR, et al. Can we measure the ankle-brachial index using only a stethoscope? A pilot study. Fam Pract 2009; 26:22–26.
- Chesbro SB, Asongwed ET, Brown J, John EB. Reliability of Doppler and stethoscope methods of determining systolic blood pressures: considerations for calculating an ankle-brachial index. J Natl Med Assoc 2011; 103:863–869.
- Jönsson B, Lindberg LG, Skau T, Thulesius O. Is oscillometric ankle pressure reliable in leg vascular disease? Clin Physiol 2001; 21:155–163.
- Ramanathan A, Conaghan PJ, Jenkinson AD, Bishop CR. Comparison of ankle-brachial pressure index measurements using an automated oscillometric device with the standard Doppler ultrasound technique. ANZ J Surg 2003; 73:105–108.
- Beckman JA, Higgins CO, Gerhard-Herman M. Automated oscillometric determination of the ankle-brachial index provides accuracy necessary for office practice. Hypertension 2006; 47:35–38.
- Mehlsen J, Wiinberg N, Bruce C. Oscillometric blood pressure measurement: a simple method in screening for peripheral arterial disease. Clin Physiol Funct Imaging 2008; 28:426–429.
- Aboyans V, Lacroix P, Doucet S, Preux PM, Criqui MH, Laskar M. Diagnosis of peripheral arterial disease in general practice: can the ankle-brachial index be measured either by pulse palpation or an automatic blood pressure device? Int J Clin Pract 2008; 62:1001–1007.
- 2011 Writing Group Members. 2011 ACCF/AHA Focused Update of the Guideline for the Management of patients with peripheral artery disease (updating the 2005 guideline): a report of the American College of Cardiology Foundation/American Heart Association Task Force on practice guidelines. Circulation 2011; 124:2020–2045.
- Stein R, Hriljac I, Halperin JL, Gustavson SM, Teodorescu V, Olin JW. Limitation of the resting ankle-brachial index in symptomatic patients with peripheral arterial disease. Vasc Med 2006; 11:29–33.
- Amirhamzeh MM, Chant HJ, Rees JL, Hands LJ, Powell RJ, Campbell WB. A comparative study of treadmill tests and heel raising exercise for peripheral arterial disease. Eur J Vasc Endovasc Surg 1997; 13:301–305.
- Hirsch AT, Haskal ZJ, Hertzer NR, et al; American Association for Vascular Surgery; Society for Vascular Surgery; Society for Cardiovascular Angiography and Interventions; Society for Vascular Medicine and Biology; Society of Interventional Radiology; ACC/AHA Task Force on Practice Guidelines Writing Committee to Develop Guidelines for the Management of Patients With Peripheral Arterial Disease; American Association of Cardiovascular and Pulmonary Rehabilitation; National Heart, Lung, and Blood Institute; Society for Vascular Nursing; TransAtlantic Inter-Society Consensus; Vascular Disease Foundation. ACC/AHA 2005 practice guidelines for the management of patients with peripheral arterial disease (lower extremity, renal, mesenteric, and abdominal aortic): a collaborative report from the American Association for Vascular Surgery/Society for Vascular Surgery, Society for Cardiovascular Angiography and Interventions, Society for Vascular Medicine and Biology, Society of Interventional Radiology, and the ACC/AHA Task Force on Practice Guidelines (Writing Committee to Develop Guidelines for the Management of Patients With Peripheral Arterial Disease): endorsed by the American Association of Cardiovascular and Pulmonary Rehabilitation; National Heart, Lung, and Blood Institute; Society for Vascular Nursing; TransAtlantic Inter-Society Consensus; and Vascular Disease Foundation. Circulation 2006; 113:e463–e654.
- Chobanian AV, Bakris GL, Black HR, et al; Joint National Committee on Prevention, Detection, Evaluation, and Treatment of High Blood Pressure; National Heart, Lung, and Blood Institute; National High Blood Pressure Education Program Coordinating Committee. Seventh report of the Joint National Committee on Prevention, Detection, Evaluation, and Treatment of High Blood Pressure. Hypertension 2003; 42:1206–1252.
- National Cholesterol Education Program (NCEP) Expert Panel on Detection, Evaluation, and Treatment of High Blood Cholesterol in Adults (Adult Treatment Panel III). Third Report of the National Cholesterol Education Program (NCEP) Expert Panel on Detection, Evaluation, and Treatment of High Blood Cholesterol in Adults (Adult Treatment Panel III) final report. Circulation 2002; 106:3143–3421.
- Skyler JS, Bergenstal R, Bonow RO, et al; American Diabetes Association; American College of Cardiology Foundation; American Heart Association. Intensive glycemic control and the prevention of cardiovascular events: implications of the ACCORD, ADVANCE, and VA Diabetes Trials: a position statement of the American Diabetes Association and a Scientific Statement of the American College of Cardiology Foundation and the American Heart Association. J Am Coll Cardiol 2009; 53:298–304.
- Almahameed A, Bartholomew JR, editors. Peripheral arterial disease: recognition and contemporary management. Cleve Clin J Med 2006; 73(suppl 4):S1–S51.
- McKenna M, Wolfson S, Kuller L. The ratio of ankle and arm arterial pressure as an independent predictor of mortality. Atherosclerosis 1991; 87:119–128.
- Valentine RJ, Grayburn PA, Eichhorn EJ, Myers SI, Clagett GP. Coronary artery disease is highly prevalent among patients with premature peripheral vascular disease. J Vasc Surg 1994; 19:668–674.
- Weitz JI, Byrne J, Clagett GP, et al. Diagnosis and treatment of chronic arterial insufficiency of the lower extremities: a critical review. Circulation 1996; 94:3026–3049.
- Hertzer NR, Beven EG, Young JR, et al. Coronary artery disease in peripheral vascular patients. A classification of 1000 coronary angiograms and results of surgical management. Ann Surg 1984; 199:223–233.
- Leng GC, Lee AJ, Fowkes FG, et al. Incidence, natural history and cardiovascular events in symptomatic and asymptomatic peripheral arterial disease in the general population. Int J Epidemiol 1996; 25:1172–1181.
- Heald CL, Fowkes FG, Murray GD, Price JF; Ankle Brachial Index Collaboration. Risk of mortality and cardiovascular disease associated with the ankle-brachial index: Systematic review. Atherosclerosis 2006; 189:61–69.
- Ankle Brachial Index; Fowkes FG, Murray GD, Butcher I, et al. Collaboration Ankle brachial index combined with Framingham Risk Score to predict cardiovascular events and mortality: a meta-analysis. JAMA 2008; 300:197–208.
- Diehm C, Allenberg JR, Pittrow D, et al; German Epidemiological Trial on Ankle Brachial Index Study Group. Mortality and vascular morbidity in older adults with asymptomatic versus symptomatic peripheral artery disease. Circulation 2009; 120:2053–2061.
- Feringa HH, Bax JJ, van Waning VH, et al. The long-term prognostic value of the resting and postexercise ankle-brachial index. Arch Intern Med 2006; 166:529–535.
- Sheikh MA, Bhatt DL, Li J, Lin S, Bartholomew JR. Usefulness of postexercise ankle-brachial index to predict all-cause mortality. Am J Cardiol 2011; 107:778–782.
- Resnick HE, Lindsay RS, McDermott MM, et al. Relationship of high and low ankle brachial index to all-cause and cardiovascular disease mortality: the Strong Heart Study. Circulation 2004; 109:733–739.
- Wattanakit K, Folsom AR, Duprez DA, Weatherley BD, Hirsch AT. Clinical significance of a high ankle-brachial index: insights from the Atherosclerosis Risk in Communities (ARIC) Study. Atherosclerosis 2007; 190:459–464.
- US Preventive Services Task Force. Screening for peripheral arterial disease: Recommendation statement. http://www.ahrq.gov/clinic/uspstf05/pad/padrs.pdf. Accessed July 25, 2012.
- Mayfield JA, Reiber GE, Sanders LJ, Janisse D, Pogach LM; American Diabetes Association. Preventive foot care in diabetes. Diabetes Care 2004; 27(suppl 1):S63–S64.
- Norgren L, Hiatt WR, Dormandy JA, Nehler MR, Harris KA, Fowkes FG; TASC II Working Group. Inter-Society Consensus for the Management of Peripheral Arterial Disease (TASC II). J Vasc Surg 2007; 45(suppl S):S5–S67.
- Beckman JA, Jaff MR, Creager MA. The United States preventive services task force recommendation statement on screening for peripheral arterial disease: more harm than benefit? Circulation 2006; 114:861–866.
- US Preventive Services Task Force. Screening for peripheral artery disease draft research plan. http://www.uspreventiveservicestaskforce.org/uspstf12/pad/padslides.htm. Accessed July 26, 2012.
- Greenland P, Alpert JS, Beller GA, et al; American College of Cardiology Foundation/American Heart Association Task Force on Practice Guidelines. 2010 ACCF/AHA guideline for assessment of cardiovascular risk in asymptomatic adults: a report of the American College of Cardiology Foundation/American Heart Association Task Force on Practice Guidelines. Circulation 2010; 122:e584–e636.
- Mohler ER, Treat-Jacobson D, Reilly MP, et al. Utility and barriers to performance of the ankle-brachial index in primary care practice. Vasc Med 2004; 9:253–260.
KEY POINTS
- The ankle-brachial index is the systolic pressure in the ankle (either the dorsalis pedis or the posterior tibial artery, whichever has the higher pressure) divided by the systolic pressure in the arm (either the left or right, whichever is higher). The lower of the two values obtained (left and right) is the patient’s overall ankle-brachial index.
- Most healthy adults have a value greater than 1.0. A value of less than 0.91 indicates significant peripheral artery disease, and a value lower than 0.40 at rest generally indicates severe disease. Values higher than 1.4 indicate stiffened, noncompressible arteries.
- Measuring the ankle-brachial index after exercise can uncover peripheral artery disease in patients with a normal resting ankle-brachial index.
The role of aldosterone receptor antagonists in the management of heart failure: An update
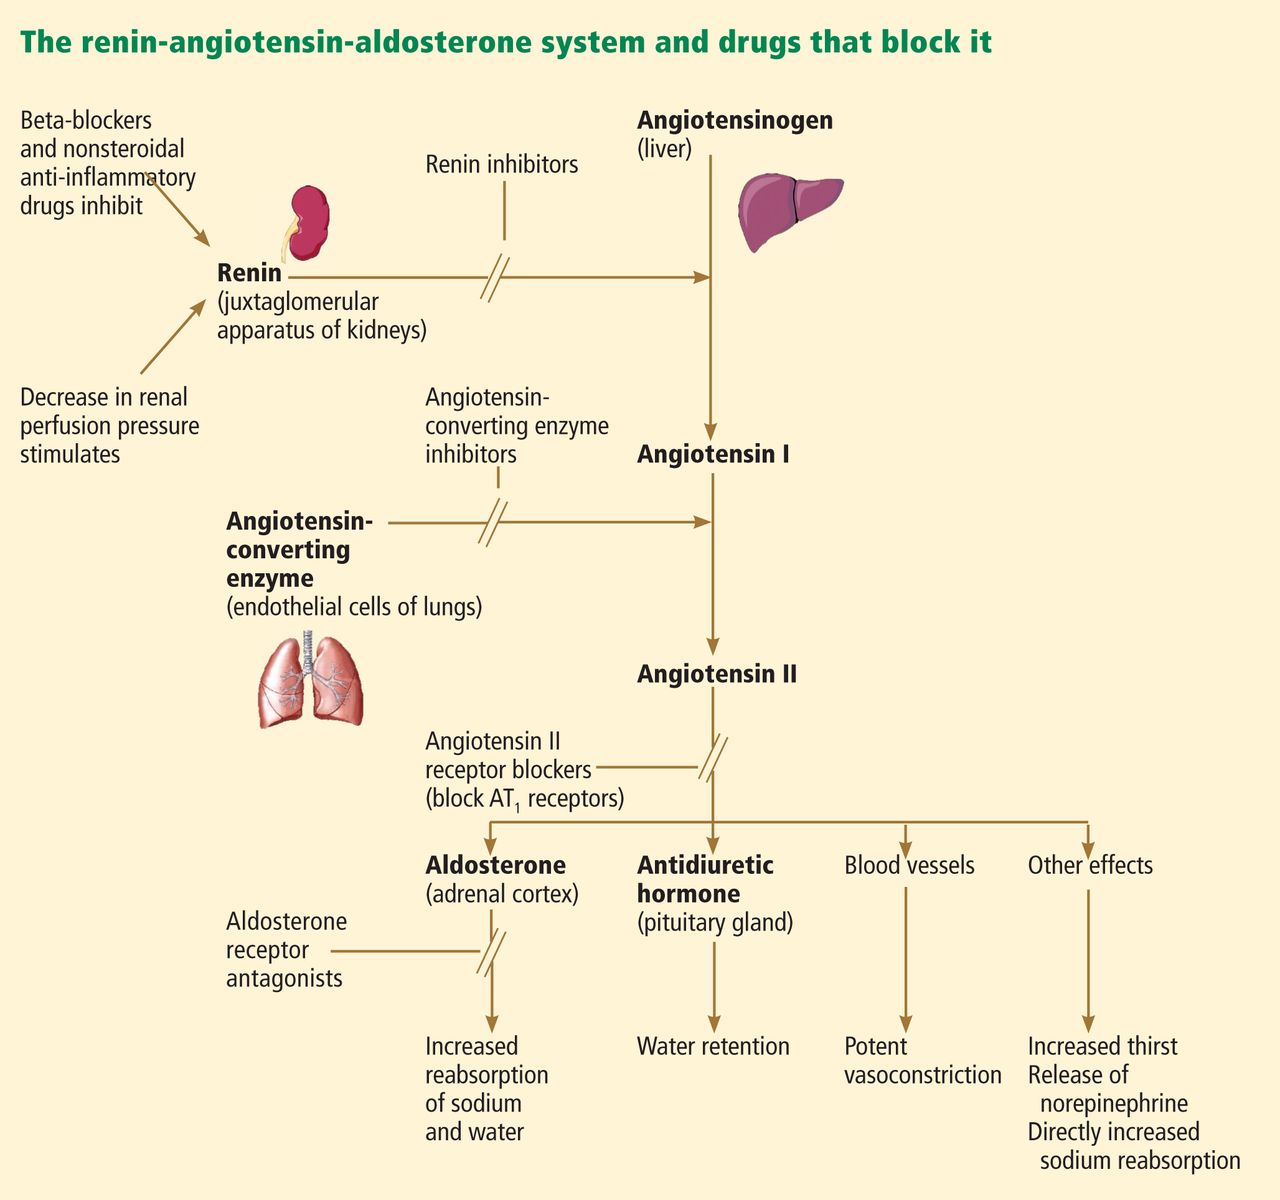
Over the past 30 years, the focus of treating heart failure has shifted from managing symptoms to prolonging lives. When the neurohormonal hypothesis (ie, the concept that neurohormonal dysregulation and not merely hemodynamic changes are responsible for the onset and progression of heart failure) was introduced, it brought a dramatic change that included new classes of drugs that interfere with the renin-angiotensin-aldosterone system, ie, angiotensin-converting enzyme (ACE) inhibitors, angiotensin II receptor blockers (ARBs), and, most recently, aldosterone receptor antagonists (ARAs) (Figure 1).
Evidence supporting the use of the ARAs spironolactone (Aldactone) and eplerenone (Inspra) in heart failure has been growing, as has evidence of their usefulness in treating diabetes and chronic renal disease. Still, these drugs must be used cautiously, as they can cause hyperkalemia.
This paper will review the clinical use of ARAs in symptomatic systolic heart failure, their side effects, the findings and implications of recent trials, and controversies in this area, notably whether there is any evidence favoring the use of one drug over another.
ALDOSTERONE IN HEART FAILURE
Aldosterone, a hormone secreted by the zona glomerulosa of the adrenal gland, was first isolated by Simpson and Tait more than half a century ago.1 Later, it was found to promote reabsorption of sodium and excretion of potassium in the kidneys and hence was categorized as a mineralocorticoid hormone.
Release of aldosterone is stimulated by decreased renal perfusion via angiotensin II, hyperkalemia, and possibly adrenocorticotropic hormone.2 Aldosterone exerts its effects by binding to mineralocorticoid receptors in renal epithelial cells.
Aldosterone has several deleterious effects on the failing heart, primarily sodium and fluid retention, but also endothelial dysfunction, left ventricular hypertrophy, and myocardial fibrosis.2,3 Plasma aldosterone levels can be markedly elevated in patients with heart failure, likely due to activation of the renin-angiotensin-aldosterone system. Elevated aldosterone and angiotensin II levels have been associated with higher mortality rates.4
ALDOSTERONE ‘ESCAPE’ BLUNTS THE EFFECT OF ACE INHIBITORS AND ARBs
ACE inhibitors and ARBs have become standards of care for patients with systolic heart failure, and for many years, it was believed that these drugs suppressed aldosterone levels sufficiently. But elevated aldosterone levels have been noted in up to 38% of patients on chronic ACE inhibitor therapy.5 In one study, patients on dual blockade, ie, on both an ACE inhibitor and an ARB, had significantly lower aldosterone levels at 17 weeks of therapy, but not at 43 weeks.6 This phenomenon is known as “aldosterone escape.”
Several mechanisms might explain this phenomenon. Angiotensin II, a potent inducer of aldosterone, is “reactivated” during long-term ACE inhibitor therapy. Interestingly, patients progress toward aldosterone escape regardless of whether the ACE inhibitor dose is low or high.7 There is evidence that some aldosterone is produced by endothelial cells and vascular smooth muscle in the heart and blood vessels,8 but ACE inhibitors and ARBs suppress only the aldosterone secreted by the adrenal glands.
Regardless of the mechanism, aldosterone escape can blunt the effects of ACE inhibitors and ARBs, reducing their favorable effects on the risk of death in heart failure patients. This is the rationale for also using ARAs.
ARAs IN HEART FAILURE
Aldosterone acts by regulating gene expression after binding to mineralocorticoid receptors. These receptors are found not only in epithelial tissue in the kidneys and glands, but also in nonepithelial tissues such as cardiomyocytes, vessel walls, and the hippocampus of the brain.9 The nonepithelial effects were first demonstrated 2 decades ago by Brilla et al,10 who noted that chronically elevated aldosterone levels in rats promoted cardiac fibroblast growth, collagen accumulation, and, hence, ventricular remodeling.
The hypertensive effect of aldosterone may also be mediated through mineralocorticoid receptors in the brain. Gomez-Sanchez et al11 found that infusing aldosterone into the cerebral ventricles caused significant hypertension. A selective mineralocorticoid antagonist inhibited this effect when infused into the cerebral ventricles but not when given systemically.
In 1959, Cella and Kagawa created spironolactone, a nonselective ARA, by combining elements of progesterone for its antimineralocorticoid effect and elements of digitoxin for its cardiotonic effect.12 Although spironolactone is very effective in treating hypertension and heart failure, its use is limited by progestational and antiandrogenic side effects. This led, in 1987, to the invention by de Gasparo et al of a newer molecule, a selective ARA now called eplerenone.13 Although eplerenone may be somewhat less potent than spironolactone in blocking mineralocorticoid receptors, no significant difference in efficacy has been noted in randomized clinical trials, and its antiandrogenic action is negligible.12
Although these drugs target aldosterone receptors, newer drugs may target different aspects of mineralocorticoid activities, and thus the term “mineralocorticoid receptor antagonist” has been proposed.
TRIALS OF ARAs IN HEART FAILURE
An online data supplement that accompanies this paper at provides a detailed comparison of the three major trials of ARAs in patients with heart failure.
The Randomized Aldactone Evaluation Study (RALES)
The first major clinical trial of an ARA was the Randomized Aldactone Evaluation Study (RALES),14 a randomized, double-blind, controlled comparison of spironolactone and placebo.
The 1,663 patients in the trial all had severe heart failure (New York Heart Association class [NYHA] III and ambulatory class IV symptoms) and a left ventricular ejection fraction of 35% or less. Most were on an ACE inhibitor, a loop diuretic, and digoxin, but only 10% of patients in both groups were on a beta-blocker. Patients with chronic renal failure (serum creatinine > 2.5 mg/dL) or hyperkalemia (potassium > 5.0 mmol/L) were excluded.
RALES was halted early when an interim analysis at a mean follow-up of 24 months showed that significantly fewer patients were dying in the spironolactone group; their all-cause mortality rate was 30% lower (relative risk [RR] 0.70, 95% confidence interval [CI] 0.60–0.82, P < .001), and their cardiac mortality rate was 31% lower (RR 0.69, 95% CI 0.58–0.82, P < .001). This was concordant with a lower risk of both sudden cardiac death and death from progressive heart failure. The risk of hospitalization for cardiac causes was also 30% lower for patients in the spironolactone group, who also experienced significant symptom improvement.
Gynecomastia and breast pain occurred in about 10% of patients in the spironolactone group, and adverse effects leading to study drug discontinuation occurred in 2%.14
The Eplerenone Post-acute Myocardial Infarction Heart Failure Efficacy and Survival Study (EPHESUS)
The next landmark trial of an ARA was the Eplerenone Post-acute Myocardial Infarction Heart Failure Efficacy and Survival Study (EPHESUS).15 A total of 6,632 patients were randomized to receive eplerenone or placebo in this multicenter, double-blind trial. To be enrolled, patients had to have acute myocardial infarction, a left ventricular ejection fraction of 40% or less, and either clinical signs of heart failure 3 to 14 days after the infarction or a history of diabetes mellitus. Patients were excluded if they had chronic kidney disease (defined as a serum creatinine > 2.5 mg/dL or an estimated glomerular filtration rate < 30 mL/min/1.73 m2) or hyperkalemia (a serum potassium > 5.0 mmol/L). All the patients received optimal medical therapy and reperfusion therapy, if warranted.
This event-driven trial was stopped when 1,012 deaths had occurred. During a mean follow-up of 16 months, there was a 15% lower rate of all-cause mortality in the eplerenone group (RR 0.85, 95% CI 0.75–0.96, P = .008) and a 13% lower rate of cardiovascular mortality (RR 0.83, 95% CI 0.72–0.94, P = .005). The reduction in the cardiovascular mortality rate was attributed to a 21% reduction in the rate of sudden cardiac deaths. The rate of heart failure hospitalization was also lower in the eplerenone group.
Serious hyperkalemia occurred significantly more frequently in the eplerenone group (5.5% vs 3.9%, P = .002), but similar rates of gynecomastia were observed. The incidence of hyperkalemia was higher in patients with a creatinine clearance less than 50 mL/min.
Further analyses revealed a 31% lower rate of all-cause mortality (95% CI 0.54–0.89, P = .004) and a 32% lower rate of cardiovascular mortality (95% CI 0.53–0.88, P = .003) at 30 days after randomization in the eplerenone group.16 Importantly, 25% of all deaths in the EPHESUS study during the 16-month follow-up period occurred in the first 30 days after randomization. The Kaplan-Meier survival curves showed separation as early as 5 days after randomization. Hence, the 30-day mortality results from EPHESUS further indicated that starting eplerenone early may be particularly beneficial.
The Eplerenone in Mild Patients Hospitalization and Survival Study in Heart Failure (EMPHASIS-HF)
After RALES and EPHESUS, a gap remained in our knowledge, ie, how to use ARAs in patients with mild heart failure, who account for most cases. This led to the EMPHASIS-HF (Eplerenone in Mild Patients Hospitalization and Survival Study in Heart Failure) trial, which expanded the indications for ARAs to patients with chronic systolic heart failure with mild symptoms.17
In this double-blind trial, 2,737 patients with NYHA class II heart failure with a left ventricular ejection fraction of 35% or less were randomized to receive oral eplerenone 25 mg or placebo once daily. All patients were already on a beta-blocker; they were also all on an ACE inhibitor, an ARB, or both at the recommended or maximal tolerated dose. Patients with a glomerular filtration rate between 30 and 49 mL/min were started on alternate-day dosing, and those with glomerular filtration rates below 30 mL/min were excluded.
To ensure that the event rate was high enough to give this trial sufficient power:
- Only patients age 55 years or older were included
- Patients with a left ventricular ejection fraction greater than 30% were enrolled only if the QRS duration was greater than 130 ms (only 3.5% of patients in both groups were enrolled based on this criterion)
- Patients either had to have been hospitalized for cardiovascular reasons in the 6 months before randomization or had to have elevated natriuretic peptides (B-type natriuretic peptide [BNP] level > 250 pg/mL or N-terminal pro-BNP > 500 pg/mL in men and > 750 pg/mL in women).
The study was stopped early at a median follow-up of 21 months after an interim analysis showed a significantly lower rate of the primary composite end point (death from a cardiovascular cause or hospitalization for heart failure) in the eplerenone group: 18.3% vs 25.9% (hazard ratio [HR] 0.63, 95% CI 0.54– 0.74, P < .001). The rates of all-cause mortality were 12.5% vs 15.5% (HR 0.76, 95% CI 0.62–0.93, P = .008), and the rates of cardiovascular mortality were 10.8% vs 13.5% (HR 0.76, 95% CI 0.61–0.94, P = .01). Kaplan-Meier curves for all-cause mortality showed significant separation only after 1 year, which was not the case in EPHESUS and RALES. But the curves for hospitalization separated within a few weeks after randomization.
The incidence of hyperkalemia (serum potassium level > 5.5 mmol/L) was significantly higher in the eplerenone group (11.8% vs 7.2%, P < .001), but there was no statistically significant difference between groups when potassium levels above 6 mmol/L were considered (2.5% vs 1.9%, P = .29). This is despite one-third of patients having an estimated glomerular filtration rate less than 60 mL/min/1.73 m2. Breast symptoms were very rare, occurring in 1% or fewer patients in both groups. The discontinuation rate of the study drug was similar in both groups.
HOW DO ARAs PREVENT DEATH?
Multiple studies show that spironolactone and eplerenone lower blood pressure in a dose-related manner.18 These drugs reduce fluid volume and pulmonary congestion, which could have been the primary mechanism for the reduction in heart failure hospitalizations in the EMPHASIS-HF trial. But other mechanisms might explain the reduction in cardiovascular mortality rates in the trials summarized above.
Transcardiac extraction of aldosterone was increased in a study of patients with heart failure. 19 The transcardiac gradient of plasma aldosterone correlated with levels of procollagen III N-terminal propeptide, a biochemical marker of myocardial fibrosis. This suggests that aldosterone could be a stimulant of myocardial fibrosis. Spironolactone inhibited the transcardiac extraction of aldosterone in the same study.19
In another study,20 spironolactone significantly suppressed elevation of procollagen III N-terminal propeptide after myocardial infarction. It was also demonstrated that spironolactone prevented left ventricular remodeling after infarction, even in patients receiving an ACE inhibitor. Similar results, ie, decreased left ventricular myocardial fibrosis and remodeling, were noted in another trial in which eplerenone was added to an ARB.21
Myocardial fibrosis is a known substrate for ventricular arrhythmias. In a randomized study in 35 patients, spironolactone decreased the incidence of ventricular arrhythmias.22 This finding correlates with the decreased incidence of sudden cardiac death in the RALES and EPHESUS trials.
ADVERSE EFFECTS OF ARAs
Hyperkalemia, hyperkalemia, hyperkalemia
Potassium excretion is physiologically regulated by the serum aldosterone concentration and by the delivery of sodium to the distal nephron. Aldosterone increases potassium excretion. As a result of decreased renal perfusion that occurs with heart failure, sodium is intensely reabsorbed in the proximal tubule, and very little sodium reaches the distal nephron. When aldosterone receptors are blocked by ARAs, the risk of hyperkalemia increases.23
Other electrolyte abnormalities associated with ARAs are hyponatremia and hyperchloremic metabolic acidosis (Table 1). There could be a reversible decline in the glomerular filtration rate as well.24 Of note, most patients with chronic systolic heart failure in the RALES and EMPHASIS-HF trials were already receiving a diuretic; thus, the adverse effect profile of ARAs in otherwise euvolemic (or even hypovolemic) patients is not well appreciated.
Failure to closely monitor electrolyte levels increases the risk of hyperkalemia and renal failure, so there is a need for regular follow-up visits for patients taking an ARA.25 This was made clear when a population-based analysis from Canada compared the rates of hyperkalemia-related hospitalization and death before and after the RALES trial was published. The prescription rate for spironolactone increased threefold, but the rate of hyperkalemia-related hospitalization increased fourfold and the rate of death increased sixfold.26
Although caution is recommended when starting a patient on an ARA, a recent trial conducted in 167 cardiology practices noted that ARAs were the most underused drugs for heart failure. In this study, an ARA was prescribed to only 35% of eligible patients. The prescription rate was not significantly higher even in dedicated heart failure clinics.27 Possible reasons suggested by the authors were drug side effects, the need for closer monitoring of laboratory values, and a lack of knowledge.
A population-based analysis from the United Kingdom found a significant increase over time in spironolactone prescriptions after the release of the RALES trial results, but there was no increase in the rate of serious hyperkalemia (serum potassium > 6 mmol/L) or hyperkalemia-related hospitalization.28 The authors suggested that careful monitoring could prevent hyperkalemia-related complications. They also observed that 75% of patients who had spironolactone-associated hyperkalemia were over 65 years old. Hence, we recommend closer monitoring when starting an elderly patient on an ARA.
Breast, gastrointestinal symptoms
The nonselective ARA spironolactone is associated with antiandrogenic side effects. In a smaller study in patients with resistant hypertension, Nishizaka et al noted that low-dose spironolactone (up to 50 mg/day) was associated with breast tenderness in about 10%.29 Breast symptoms with spironolactone are dose-related, and the incidence can be as high as 50% when the drug is used in dosages of 150 mg/day or higher.30
In one population-based case-control study, spironolactone was associated with a 2.7 times higher risk of gastrointestinal side effects (bleeding or ulcer).31
ARAs IN HEART FAILURE WITH PRESERVED EJECTION FRACTION
The concept of diastolic heart failure or “heart failure with preserved ejection fraction” has been growing. A significant proportion of patients with a diagnosis of heart failure have preserved left ventricular ejection fraction (≥ 50%) and diastolic dysfunction.
Despite multiple trials, no treatment has been shown to lower the mortality rate in heart failure with preserved ejection fraction.32,33 A recently published randomized controlled trial in 44 patients with this condition showed reduction in serum biochemical markers of collagen turnover and improvement in diastolic function with ARAs, but there was no difference in exercise capacity.34 A larger double-blind randomized control trial, Aldosterone Receptor Blockade in Diastolic Heart Failure (Aldo-DHF), is under way to evaluate the effects of ARAs on exercise capacity and diastolic function in patients with heart failure with preserved ejection fraction.35
In January 2012, the Trial of Aldosterone Antagonist Therapy in Adults With Preserved Ejection Fraction Congestive Heart Failure (TOPCAT) completed enrollment of 3,445 patients to study the effect of ARAs in reducing the composite end point of cardiovascular mortality, aborted cardiac arrest, and heart failure hospitalization. Long-term follow-up of this event-driven study is currently under way.
ARAs IN DIABETES MELLITUS AND CHRONIC KIDNEY DISEASE
Under physiologic conditions, the serum aldosterone level is regulated by volume status through the renin-angiotensin system. But in patients with chronic kidney disease, the serum aldosterone level could be elevated without renin-angiotensin system stimulation.36
High aldosterone levels were associated with proteinuria and glomerulosclerosis in rats.37 In a study in 83 patients, aldosterone receptor blockade was shown to decrease proteinuria and possibly to retard the progression of chronic kidney disease. In this trial, baseline serum aldosterone levels correlated with proteinuria.38 Animal studies suggest that adipocyte-derived factors may stimulate aldosterone, which may be relevant in patients who have both chronic kidney disease and metabolic syndrome.39
The impact of ARAs in patients with diabetes mellitus is often overlooked. In EPHESUS, diabetes mellitus was an inclusion criterion even in the absence of heart failure signs and symptoms in the postinfarction setting of impaired left ventricular ejection fraction.15
In patients with diabetic nephropathy, there is growing evidence that ARAs can decrease proteinuria, even if the serum aldosterone level is normal. For example, in a study in 20 patients with diabetic nephropathy, spironolactone reduced proteinuria by 32%. This reduction was independent of serum aldosterone levels.40
In diabetic rats, hyperglycemia was noted to cause podocyte injury through mineralocorticoid receptor-mediated production of reactive oxygen species, independently of serum aldosterone levels. Spironolactone decreased the production of reactive oxygen species, thereby potentially reducing proteinuria.41
RECOMMENDATIONS ARE BEING REVISED
The most recent joint guidelines of the American Heart Association and the American College of Cardiology for the management of heart failure42 were published in 2009, which was before the EMPHASIS-HF results. An update is expected soon. In the 2009 version, ARAs received a class I recommendation for patients with moderately severe to severe symptoms, decreased ejection fraction, normal renal function, and normal potassium levels. The guidelines also said that the risks of ARAs may outweigh their benefits if regular monitoring is not possible.
The recommended starting dosage is 12.5 mg/day of spironolactone or 25 mg/day of eplerenone; the dose can be doubled, if tolerated.
Close monitoring is recommended, ie, measuring serum potassium and renal function 3 and 7 days after starting therapy and then monthly for the first 3 months. Closer monitoring is needed if an ACE inhibitor or an ARB is added later. In elderly patients, the glomerular filtration rate is preferred over the serum creatinine level, and ARA therapy is not advisable if the glomerular filtration rate is less than 30 mL/min/1.73 m2.
Avoid concomitant use of the following:
- Potassium supplements (unless persistent hypokalemia is present)
- Nonsteroidal anti-inflammatory drugs
- An ACE inhibitor and an ARB in combination
- A high dose of an ACE inhibitor or ARB.
Conditions that can lead to dehydration (eg, diarrhea, excessive use of diuretics) or acute illness should warrant reduction (or even withholding) of ARAs. When to discontinue ARA therapy is not well described, nor is the safety of starting ARAs in the hospital. However, it is clear that many patients who are potentially eligible for ARAs are not prescribed them.43
The guidelines are currently being revised, and will likely incorporate the new data from EMPHASIS-HF to extend to a broader population. The benefits of ARAs can be met only if the risks are minimized.
WHICH ARA IS BETTER?
The pharmacologic differences between the two ARAs have been described earlier, and guidelines have advocated evidence-based use of ARAs for their respective indications. There have been no large-scale, head-to-head comparisons of spironolactone and eplerenone in the heart failure population, and in clinical practice the drugs are prescribed interchangeably in most patients.
A double-blind randomized controlled trial in 141 patients with hypertension and primary hyperaldosteronism found that spironolactone lowered diastolic blood pressure more, but it also caused antiandrogenic effects more often.44
There is some evidence to suggest that eplerenone has a better metabolic profile than spironolactone. The data came from a small randomized controlled trial in 107 stable outpatients with mild heart failure.45 Patients who were prescribed spironolactone had a higher cortisol level and hemoglobin A1c level 4 months after starting treatment. This effect was not seen in patients who were on eplerenone. However, these findings need to be confirmed in larger trials.
While the differences between the two drugs remain to be determined, the most important differences in clinical practice are selectivity for receptors (and hence their antiandrogenic side effects) and price. Even though it is available as a generic drug, eplerenone still costs at least three times more than spironolactone for the same dosage and indication.
- Simpson SA, Tait JF, Bush IE. Secretion of a salt-retaining hormone by the mammalian adrenal cortex. Lancet 1952; 2:226–228.
- Struthers AD, MacDonald TM. Review of aldosterone- and angiotensin II-induced target organ damage and prevention. Cardiovasc Res 2004; 61:663–670.
- Edelmann F, Schmidt AG, Gelbrich G, et al. Rationale and design of the “aldosterone receptor blockade in diastolic heart failure” trial: a double-blind, randomized, placebo-controlled, parallel group study to determine the effects of spironolactone on exercise capacity and diastolic function in patients with symptomatic diastolic heart failure (Aldo-DHF). Eur J Heart Fail 2010; 12:874–882.
- Swedberg K, Eneroth P, Kjekshus J, Wilhelmsen L. Hormones regulating cardiovascular function in patients with severe congestive heart failure and their relation to mortality. CONSENSUS Trial Study Group. Circulation 1990; 82:1730–1736.
- MacFadyen RJ, Lee AF, Morton JJ, Pringle SD, Struthers AD. How often are angiotensin II and aldosterone concentrations raised during chronic ACE inhibitor treatment in cardiac failure? Heart 1999; 82:57–61.
- McKelvie RS, Yusuf S, Pericak D, et al. Comparison of candesartan, enalapril, and their combination in congestive heart failure: randomized evaluation of strategies for left ventricular dysfunction (RESOLVD) pilot study. The RESOLVD Pilot Study Investigators. Circulation 1999; 100:1056–1064.
- Tang WH, Vagelos RH, Yee YG, et al. Neurohormonal and clinical responses to high- versus low-dose enalapril therapy in chronic heart failure. J Am Coll Cardiol 2002; 39:70–78.
- Weber KT. Aldosterone in congestive heart failure. N Engl J Med 2001; 345:1689–1697.
- Funder JW. The role of aldosterone and mineralocorticoid receptors in cardiovascular disease. Am J Cardiovasc Drugs 2007; 7:151–157.
- Brilla CG, Pick R, Tan LB, Janicki JS, Weber KT. Remodeling of the rat right and left ventricles in experimental hypertension. Circ Res 1990; 67:1355–1364.
- Gomez-Sanchez EP, Fort C, Thwaites D. Central mineralocorticoid receptor antagonism blocks hypertension in Dahl S/JR rats. Am J Physiol 1992; 262:E96–E99.
- Garthwaite SM, McMahon EG. The evolution of aldosterone antagonists. Mol Cell Endocrinol 2004; 217:27–31.
- de Gasparo M, Joss U, Ramjoué HP, et al. Three new epoxy-spirolactone derivatives: characterization in vivo and in vitro. J Pharmacol Exp Ther 1987; 240:650–656.
- Pitt B, Zannad F, Remme WJ, et al. The effect of spironolactone on morbidity and mortality in patients with severe heart failure. Randomized Aldactone Evaluation Study Investigators. N Engl J Med 1999; 341:709–717.
- Pitt B, Remme W, Zannad F, et al; Eplerenone Post-Acute Myocardial Infarction Heart Failure Efficacy and Survival Study Investigators. Eplerenone, a selective aldosterone blocker, in patients with left ventricular dysfunction after myocardial infarction. N Engl J Med 2003; 348:1309–1321.
- Pitt B, White H, Nicolau J, et al; EPHESUS Investigators. Eplerenone reduces mortality 30 days after randomization following acute myocardial infarction in patients with left ventricular systolic dysfunction and heart failure. J Am Coll Cardiol 2005; 46:425–431.
- Zannad F, McMurray JJ, Krum H, et al; EMPHASIS-HF Study Group. Eplerenone in patients with systolic heart failure and mild symptoms. N Engl J Med 2011; 364:11–21.
- Weinberger MH, Roniker B, Krause SL, Weiss RJ. Eplerenone, a selective aldosterone blocker, in mild-to-moderate hypertension. Am J Hypertens 2002; 15:709–716.
- Tsutamoto T, Wada A, Maeda K, et al. Spironolactone inhibits the transcardiac extraction of aldosterone in patients with congestive heart failure. J Am Coll Cardiol 2000; 36:838–844.
- Hayashi M, Tsutamoto T, Wada A, et al. Immediate administration of mineralocorticoid receptor antagonist spironolactone prevents postinfarct left ventricular remodeling associated with suppression of a marker of myocardial collagen synthesis in patients with first anterior acute myocardial infarction. Circulation 2003; 107:2559–2565.
- Fraccarollo D, Galuppo P, Schmidt I, Ertl G, Bauersachs J. Additive amelioration of left ventricular remodeling and molecular alterations by combined aldosterone and angiotensin receptor blockade after myocardial infarction. Cardiovasc Res 2005; 67:97–105.
- Ramires FJ, Mansur A, Coelho O, et al. Effect of spironolactone on ventricular arrhythmias in congestive heart failure secondary to idiopathic dilated or to ischemic cardiomyopathy. Am J Cardiol 2000; 85:1207–1211.
- Palmer BF. Managing hyperkalemia caused by inhibitors of the reninangiotensin-aldosterone system. N Engl J Med 2004; 351:585–592.
- Sica DA. The risks and benefits of therapy with aldosterone receptor antagonist therapy. Curr Drug Saf 2007; 2:71–77.
- Shah KB, Rao K, Sawyer R, Gottlieb SS. The adequacy of laboratory monitoring in patients treated with spironolactone for congestive heart failure. J Am Coll Cardiol 2005; 46:845–849.
- Juurlink DN, Mamdani MM, Lee DS, et al. Rates of hyperkalemia after publication of the Randomized Aldactone Evaluation Study. N Engl J Med 2004; 351:543–551.
- Albert NM, Fonarow GC, Yancy CW, et al. Influence of dedicated heart failure clinics on delivery of recommended therapies in outpatient cardiology practices: findings from the Registry to Improve the Use of Evidence-Based Heart Failure Therapies in the Outpatient Setting (IMPROVE HF). Am Heart J 2010; 159:238–244.
- Wei L, Struthers AD, Fahey T, Watson AD, Macdonald TM. Spironolactone use and renal toxicity: population based longitudinal analysis. BMJ 2010; 340:c1768.
- Nishizaka MK, Zaman MA, Calhoun DA. Efficacy of low-dose spironolactone in subjects with resistant hypertension. Am J Hypertens 2003; 16:925–930.
- Jeunemaitre X, Chatellier G, Kreft-Jais C, et al. Efficacy and tolerance of spironolactone in essential hypertension. Am J Cardiol 1987; 60:820–825.
- Verhamme K, Mosis G, Dieleman J, Stricker B, Sturkenboom M. Spironolactone and risk of upper gastrointestinal events: population based case-control study. BMJ 2006; 333:330.
- Massie BM, Carson PE, McMurray JJ, et al; I-PRESERVE Investigators. Irbesartan in patients with heart failure and preserved ejection fraction. N Engl J Med 2008; 359:2456–2467.
- Yusuf S, Pfeffer MA, Swedberg K, et al; CHARM Investigators and Committees. Effects of candesartan in patients with chronic heart failure and preserved left-ventricular ejection fraction: the CHARM-Preserved Trial. Lancet 2003; 362:777–781.
- Deswal A, Richardson P, Bozkurt B, Mann DL. Results of the Randomized Aldosterone Antagonism in Heart Failure With Preserved Ejection Fraction Trial (RAAM-PEF). J Card Fail 2011; 17:634–642.
- Edelmann F, Schmidt AG, Gelbrich G, et al. Rationale and design of the ‘aldosterone receptor blockade in diastolic heart failure’ trial: a double-blind, randomized, placebo-controlled, parallel group study to determine the effects of spironolactone on exercise capacity and diastolic function in patients with symptomatic diastolic heart failure (Aldo-DHF). Eur J Heart Fail 2010; 12:874–882.
- Hené RJ, Boer P, Koomans HA, Mees EJ. Plasma aldosterone concentrations in chronic renal disease. Kidney Int 1982; 21:98–101.
- Greene EL, Kren S, Hostetter TH. Role of aldosterone in the remnant kidney model in the rat. J Clin Invest 1996; 98:1063–1068.
- Bianchi S, Bigazzi R, Campese VM. Long-term effects of spironolactone on proteinuria and kidney function in patients with chronic kidney disease. Kidney Int 2006; 70:2116–2123.
- Nagase M, Yoshida S, Shibata S, et al. Enhanced aldosterone signaling in the early nephropathy of rats with metabolic syndrome: possible contribution of fat-derived factors. J Am Soc Nephrol 2006; 17:3438–3446.
- Schjoedt KJ, Rossing K, Juhl TR, et al. Beneficial impact of spironolactone on nephrotic range albuminuria in diabetic nephropathy. Kidney Int 2006; 70:536–542.
- Toyonaga J, Tsuruya K, Ikeda H, et al. Spironolactone inhibits hyperglycemia-induced podocyte injury by attenuating ROS production. Nephrol Dial Transplant 2011; 26:2475–2484.
- Hunt SA, Abraham WT, Chin MH, et al. 2009 focused update incorporated into the ACC/AHA 2005 Guidelines for the Diagnosis and Management of Heart Failure in Adults: a report of the American College of Cardiology Foundation/American Heart Association Task Force on Practice Guidelines: developed in collaboration with the International Society for Heart and Lung Transplantation. Circulation 2009; 119:e391–e479.
- Albert NM, Yancy CW, Liang L, et al. Use of aldosterone antagonists in heart failure. JAMA 2009; 302:1658–1665.
- Parthasarathy HK, Ménard J, White WB, et al. A double-blind, randomized study comparing the antihypertensive effect of eplerenone and spironolactone in patients with hypertension and evidence of primary aldosteronism. J Hypertens 2011; 29:980–990.
- Yamaji M, Tsutamoto T, Kawahara C, et al. Effect of eplerenone versus spironolactone on cortisol and hemoglobin A1(c) levels in patients with chronic heart failure. Am Heart J 2010; 160:915–921.
Over the past 30 years, the focus of treating heart failure has shifted from managing symptoms to prolonging lives. When the neurohormonal hypothesis (ie, the concept that neurohormonal dysregulation and not merely hemodynamic changes are responsible for the onset and progression of heart failure) was introduced, it brought a dramatic change that included new classes of drugs that interfere with the renin-angiotensin-aldosterone system, ie, angiotensin-converting enzyme (ACE) inhibitors, angiotensin II receptor blockers (ARBs), and, most recently, aldosterone receptor antagonists (ARAs) (Figure 1).
Evidence supporting the use of the ARAs spironolactone (Aldactone) and eplerenone (Inspra) in heart failure has been growing, as has evidence of their usefulness in treating diabetes and chronic renal disease. Still, these drugs must be used cautiously, as they can cause hyperkalemia.
This paper will review the clinical use of ARAs in symptomatic systolic heart failure, their side effects, the findings and implications of recent trials, and controversies in this area, notably whether there is any evidence favoring the use of one drug over another.
ALDOSTERONE IN HEART FAILURE
Aldosterone, a hormone secreted by the zona glomerulosa of the adrenal gland, was first isolated by Simpson and Tait more than half a century ago.1 Later, it was found to promote reabsorption of sodium and excretion of potassium in the kidneys and hence was categorized as a mineralocorticoid hormone.
Release of aldosterone is stimulated by decreased renal perfusion via angiotensin II, hyperkalemia, and possibly adrenocorticotropic hormone.2 Aldosterone exerts its effects by binding to mineralocorticoid receptors in renal epithelial cells.
Aldosterone has several deleterious effects on the failing heart, primarily sodium and fluid retention, but also endothelial dysfunction, left ventricular hypertrophy, and myocardial fibrosis.2,3 Plasma aldosterone levels can be markedly elevated in patients with heart failure, likely due to activation of the renin-angiotensin-aldosterone system. Elevated aldosterone and angiotensin II levels have been associated with higher mortality rates.4
ALDOSTERONE ‘ESCAPE’ BLUNTS THE EFFECT OF ACE INHIBITORS AND ARBs
ACE inhibitors and ARBs have become standards of care for patients with systolic heart failure, and for many years, it was believed that these drugs suppressed aldosterone levels sufficiently. But elevated aldosterone levels have been noted in up to 38% of patients on chronic ACE inhibitor therapy.5 In one study, patients on dual blockade, ie, on both an ACE inhibitor and an ARB, had significantly lower aldosterone levels at 17 weeks of therapy, but not at 43 weeks.6 This phenomenon is known as “aldosterone escape.”
Several mechanisms might explain this phenomenon. Angiotensin II, a potent inducer of aldosterone, is “reactivated” during long-term ACE inhibitor therapy. Interestingly, patients progress toward aldosterone escape regardless of whether the ACE inhibitor dose is low or high.7 There is evidence that some aldosterone is produced by endothelial cells and vascular smooth muscle in the heart and blood vessels,8 but ACE inhibitors and ARBs suppress only the aldosterone secreted by the adrenal glands.
Regardless of the mechanism, aldosterone escape can blunt the effects of ACE inhibitors and ARBs, reducing their favorable effects on the risk of death in heart failure patients. This is the rationale for also using ARAs.
ARAs IN HEART FAILURE
Aldosterone acts by regulating gene expression after binding to mineralocorticoid receptors. These receptors are found not only in epithelial tissue in the kidneys and glands, but also in nonepithelial tissues such as cardiomyocytes, vessel walls, and the hippocampus of the brain.9 The nonepithelial effects were first demonstrated 2 decades ago by Brilla et al,10 who noted that chronically elevated aldosterone levels in rats promoted cardiac fibroblast growth, collagen accumulation, and, hence, ventricular remodeling.
The hypertensive effect of aldosterone may also be mediated through mineralocorticoid receptors in the brain. Gomez-Sanchez et al11 found that infusing aldosterone into the cerebral ventricles caused significant hypertension. A selective mineralocorticoid antagonist inhibited this effect when infused into the cerebral ventricles but not when given systemically.
In 1959, Cella and Kagawa created spironolactone, a nonselective ARA, by combining elements of progesterone for its antimineralocorticoid effect and elements of digitoxin for its cardiotonic effect.12 Although spironolactone is very effective in treating hypertension and heart failure, its use is limited by progestational and antiandrogenic side effects. This led, in 1987, to the invention by de Gasparo et al of a newer molecule, a selective ARA now called eplerenone.13 Although eplerenone may be somewhat less potent than spironolactone in blocking mineralocorticoid receptors, no significant difference in efficacy has been noted in randomized clinical trials, and its antiandrogenic action is negligible.12
Although these drugs target aldosterone receptors, newer drugs may target different aspects of mineralocorticoid activities, and thus the term “mineralocorticoid receptor antagonist” has been proposed.
TRIALS OF ARAs IN HEART FAILURE
An online data supplement that accompanies this paper at provides a detailed comparison of the three major trials of ARAs in patients with heart failure.
The Randomized Aldactone Evaluation Study (RALES)
The first major clinical trial of an ARA was the Randomized Aldactone Evaluation Study (RALES),14 a randomized, double-blind, controlled comparison of spironolactone and placebo.
The 1,663 patients in the trial all had severe heart failure (New York Heart Association class [NYHA] III and ambulatory class IV symptoms) and a left ventricular ejection fraction of 35% or less. Most were on an ACE inhibitor, a loop diuretic, and digoxin, but only 10% of patients in both groups were on a beta-blocker. Patients with chronic renal failure (serum creatinine > 2.5 mg/dL) or hyperkalemia (potassium > 5.0 mmol/L) were excluded.
RALES was halted early when an interim analysis at a mean follow-up of 24 months showed that significantly fewer patients were dying in the spironolactone group; their all-cause mortality rate was 30% lower (relative risk [RR] 0.70, 95% confidence interval [CI] 0.60–0.82, P < .001), and their cardiac mortality rate was 31% lower (RR 0.69, 95% CI 0.58–0.82, P < .001). This was concordant with a lower risk of both sudden cardiac death and death from progressive heart failure. The risk of hospitalization for cardiac causes was also 30% lower for patients in the spironolactone group, who also experienced significant symptom improvement.
Gynecomastia and breast pain occurred in about 10% of patients in the spironolactone group, and adverse effects leading to study drug discontinuation occurred in 2%.14
The Eplerenone Post-acute Myocardial Infarction Heart Failure Efficacy and Survival Study (EPHESUS)
The next landmark trial of an ARA was the Eplerenone Post-acute Myocardial Infarction Heart Failure Efficacy and Survival Study (EPHESUS).15 A total of 6,632 patients were randomized to receive eplerenone or placebo in this multicenter, double-blind trial. To be enrolled, patients had to have acute myocardial infarction, a left ventricular ejection fraction of 40% or less, and either clinical signs of heart failure 3 to 14 days after the infarction or a history of diabetes mellitus. Patients were excluded if they had chronic kidney disease (defined as a serum creatinine > 2.5 mg/dL or an estimated glomerular filtration rate < 30 mL/min/1.73 m2) or hyperkalemia (a serum potassium > 5.0 mmol/L). All the patients received optimal medical therapy and reperfusion therapy, if warranted.
This event-driven trial was stopped when 1,012 deaths had occurred. During a mean follow-up of 16 months, there was a 15% lower rate of all-cause mortality in the eplerenone group (RR 0.85, 95% CI 0.75–0.96, P = .008) and a 13% lower rate of cardiovascular mortality (RR 0.83, 95% CI 0.72–0.94, P = .005). The reduction in the cardiovascular mortality rate was attributed to a 21% reduction in the rate of sudden cardiac deaths. The rate of heart failure hospitalization was also lower in the eplerenone group.
Serious hyperkalemia occurred significantly more frequently in the eplerenone group (5.5% vs 3.9%, P = .002), but similar rates of gynecomastia were observed. The incidence of hyperkalemia was higher in patients with a creatinine clearance less than 50 mL/min.
Further analyses revealed a 31% lower rate of all-cause mortality (95% CI 0.54–0.89, P = .004) and a 32% lower rate of cardiovascular mortality (95% CI 0.53–0.88, P = .003) at 30 days after randomization in the eplerenone group.16 Importantly, 25% of all deaths in the EPHESUS study during the 16-month follow-up period occurred in the first 30 days after randomization. The Kaplan-Meier survival curves showed separation as early as 5 days after randomization. Hence, the 30-day mortality results from EPHESUS further indicated that starting eplerenone early may be particularly beneficial.
The Eplerenone in Mild Patients Hospitalization and Survival Study in Heart Failure (EMPHASIS-HF)
After RALES and EPHESUS, a gap remained in our knowledge, ie, how to use ARAs in patients with mild heart failure, who account for most cases. This led to the EMPHASIS-HF (Eplerenone in Mild Patients Hospitalization and Survival Study in Heart Failure) trial, which expanded the indications for ARAs to patients with chronic systolic heart failure with mild symptoms.17
In this double-blind trial, 2,737 patients with NYHA class II heart failure with a left ventricular ejection fraction of 35% or less were randomized to receive oral eplerenone 25 mg or placebo once daily. All patients were already on a beta-blocker; they were also all on an ACE inhibitor, an ARB, or both at the recommended or maximal tolerated dose. Patients with a glomerular filtration rate between 30 and 49 mL/min were started on alternate-day dosing, and those with glomerular filtration rates below 30 mL/min were excluded.
To ensure that the event rate was high enough to give this trial sufficient power:
- Only patients age 55 years or older were included
- Patients with a left ventricular ejection fraction greater than 30% were enrolled only if the QRS duration was greater than 130 ms (only 3.5% of patients in both groups were enrolled based on this criterion)
- Patients either had to have been hospitalized for cardiovascular reasons in the 6 months before randomization or had to have elevated natriuretic peptides (B-type natriuretic peptide [BNP] level > 250 pg/mL or N-terminal pro-BNP > 500 pg/mL in men and > 750 pg/mL in women).
The study was stopped early at a median follow-up of 21 months after an interim analysis showed a significantly lower rate of the primary composite end point (death from a cardiovascular cause or hospitalization for heart failure) in the eplerenone group: 18.3% vs 25.9% (hazard ratio [HR] 0.63, 95% CI 0.54– 0.74, P < .001). The rates of all-cause mortality were 12.5% vs 15.5% (HR 0.76, 95% CI 0.62–0.93, P = .008), and the rates of cardiovascular mortality were 10.8% vs 13.5% (HR 0.76, 95% CI 0.61–0.94, P = .01). Kaplan-Meier curves for all-cause mortality showed significant separation only after 1 year, which was not the case in EPHESUS and RALES. But the curves for hospitalization separated within a few weeks after randomization.
The incidence of hyperkalemia (serum potassium level > 5.5 mmol/L) was significantly higher in the eplerenone group (11.8% vs 7.2%, P < .001), but there was no statistically significant difference between groups when potassium levels above 6 mmol/L were considered (2.5% vs 1.9%, P = .29). This is despite one-third of patients having an estimated glomerular filtration rate less than 60 mL/min/1.73 m2. Breast symptoms were very rare, occurring in 1% or fewer patients in both groups. The discontinuation rate of the study drug was similar in both groups.
HOW DO ARAs PREVENT DEATH?
Multiple studies show that spironolactone and eplerenone lower blood pressure in a dose-related manner.18 These drugs reduce fluid volume and pulmonary congestion, which could have been the primary mechanism for the reduction in heart failure hospitalizations in the EMPHASIS-HF trial. But other mechanisms might explain the reduction in cardiovascular mortality rates in the trials summarized above.
Transcardiac extraction of aldosterone was increased in a study of patients with heart failure. 19 The transcardiac gradient of plasma aldosterone correlated with levels of procollagen III N-terminal propeptide, a biochemical marker of myocardial fibrosis. This suggests that aldosterone could be a stimulant of myocardial fibrosis. Spironolactone inhibited the transcardiac extraction of aldosterone in the same study.19
In another study,20 spironolactone significantly suppressed elevation of procollagen III N-terminal propeptide after myocardial infarction. It was also demonstrated that spironolactone prevented left ventricular remodeling after infarction, even in patients receiving an ACE inhibitor. Similar results, ie, decreased left ventricular myocardial fibrosis and remodeling, were noted in another trial in which eplerenone was added to an ARB.21
Myocardial fibrosis is a known substrate for ventricular arrhythmias. In a randomized study in 35 patients, spironolactone decreased the incidence of ventricular arrhythmias.22 This finding correlates with the decreased incidence of sudden cardiac death in the RALES and EPHESUS trials.
ADVERSE EFFECTS OF ARAs
Hyperkalemia, hyperkalemia, hyperkalemia
Potassium excretion is physiologically regulated by the serum aldosterone concentration and by the delivery of sodium to the distal nephron. Aldosterone increases potassium excretion. As a result of decreased renal perfusion that occurs with heart failure, sodium is intensely reabsorbed in the proximal tubule, and very little sodium reaches the distal nephron. When aldosterone receptors are blocked by ARAs, the risk of hyperkalemia increases.23
Other electrolyte abnormalities associated with ARAs are hyponatremia and hyperchloremic metabolic acidosis (Table 1). There could be a reversible decline in the glomerular filtration rate as well.24 Of note, most patients with chronic systolic heart failure in the RALES and EMPHASIS-HF trials were already receiving a diuretic; thus, the adverse effect profile of ARAs in otherwise euvolemic (or even hypovolemic) patients is not well appreciated.
Failure to closely monitor electrolyte levels increases the risk of hyperkalemia and renal failure, so there is a need for regular follow-up visits for patients taking an ARA.25 This was made clear when a population-based analysis from Canada compared the rates of hyperkalemia-related hospitalization and death before and after the RALES trial was published. The prescription rate for spironolactone increased threefold, but the rate of hyperkalemia-related hospitalization increased fourfold and the rate of death increased sixfold.26
Although caution is recommended when starting a patient on an ARA, a recent trial conducted in 167 cardiology practices noted that ARAs were the most underused drugs for heart failure. In this study, an ARA was prescribed to only 35% of eligible patients. The prescription rate was not significantly higher even in dedicated heart failure clinics.27 Possible reasons suggested by the authors were drug side effects, the need for closer monitoring of laboratory values, and a lack of knowledge.
A population-based analysis from the United Kingdom found a significant increase over time in spironolactone prescriptions after the release of the RALES trial results, but there was no increase in the rate of serious hyperkalemia (serum potassium > 6 mmol/L) or hyperkalemia-related hospitalization.28 The authors suggested that careful monitoring could prevent hyperkalemia-related complications. They also observed that 75% of patients who had spironolactone-associated hyperkalemia were over 65 years old. Hence, we recommend closer monitoring when starting an elderly patient on an ARA.
Breast, gastrointestinal symptoms
The nonselective ARA spironolactone is associated with antiandrogenic side effects. In a smaller study in patients with resistant hypertension, Nishizaka et al noted that low-dose spironolactone (up to 50 mg/day) was associated with breast tenderness in about 10%.29 Breast symptoms with spironolactone are dose-related, and the incidence can be as high as 50% when the drug is used in dosages of 150 mg/day or higher.30
In one population-based case-control study, spironolactone was associated with a 2.7 times higher risk of gastrointestinal side effects (bleeding or ulcer).31
ARAs IN HEART FAILURE WITH PRESERVED EJECTION FRACTION
The concept of diastolic heart failure or “heart failure with preserved ejection fraction” has been growing. A significant proportion of patients with a diagnosis of heart failure have preserved left ventricular ejection fraction (≥ 50%) and diastolic dysfunction.
Despite multiple trials, no treatment has been shown to lower the mortality rate in heart failure with preserved ejection fraction.32,33 A recently published randomized controlled trial in 44 patients with this condition showed reduction in serum biochemical markers of collagen turnover and improvement in diastolic function with ARAs, but there was no difference in exercise capacity.34 A larger double-blind randomized control trial, Aldosterone Receptor Blockade in Diastolic Heart Failure (Aldo-DHF), is under way to evaluate the effects of ARAs on exercise capacity and diastolic function in patients with heart failure with preserved ejection fraction.35
In January 2012, the Trial of Aldosterone Antagonist Therapy in Adults With Preserved Ejection Fraction Congestive Heart Failure (TOPCAT) completed enrollment of 3,445 patients to study the effect of ARAs in reducing the composite end point of cardiovascular mortality, aborted cardiac arrest, and heart failure hospitalization. Long-term follow-up of this event-driven study is currently under way.
ARAs IN DIABETES MELLITUS AND CHRONIC KIDNEY DISEASE
Under physiologic conditions, the serum aldosterone level is regulated by volume status through the renin-angiotensin system. But in patients with chronic kidney disease, the serum aldosterone level could be elevated without renin-angiotensin system stimulation.36
High aldosterone levels were associated with proteinuria and glomerulosclerosis in rats.37 In a study in 83 patients, aldosterone receptor blockade was shown to decrease proteinuria and possibly to retard the progression of chronic kidney disease. In this trial, baseline serum aldosterone levels correlated with proteinuria.38 Animal studies suggest that adipocyte-derived factors may stimulate aldosterone, which may be relevant in patients who have both chronic kidney disease and metabolic syndrome.39
The impact of ARAs in patients with diabetes mellitus is often overlooked. In EPHESUS, diabetes mellitus was an inclusion criterion even in the absence of heart failure signs and symptoms in the postinfarction setting of impaired left ventricular ejection fraction.15
In patients with diabetic nephropathy, there is growing evidence that ARAs can decrease proteinuria, even if the serum aldosterone level is normal. For example, in a study in 20 patients with diabetic nephropathy, spironolactone reduced proteinuria by 32%. This reduction was independent of serum aldosterone levels.40
In diabetic rats, hyperglycemia was noted to cause podocyte injury through mineralocorticoid receptor-mediated production of reactive oxygen species, independently of serum aldosterone levels. Spironolactone decreased the production of reactive oxygen species, thereby potentially reducing proteinuria.41
RECOMMENDATIONS ARE BEING REVISED
The most recent joint guidelines of the American Heart Association and the American College of Cardiology for the management of heart failure42 were published in 2009, which was before the EMPHASIS-HF results. An update is expected soon. In the 2009 version, ARAs received a class I recommendation for patients with moderately severe to severe symptoms, decreased ejection fraction, normal renal function, and normal potassium levels. The guidelines also said that the risks of ARAs may outweigh their benefits if regular monitoring is not possible.
The recommended starting dosage is 12.5 mg/day of spironolactone or 25 mg/day of eplerenone; the dose can be doubled, if tolerated.
Close monitoring is recommended, ie, measuring serum potassium and renal function 3 and 7 days after starting therapy and then monthly for the first 3 months. Closer monitoring is needed if an ACE inhibitor or an ARB is added later. In elderly patients, the glomerular filtration rate is preferred over the serum creatinine level, and ARA therapy is not advisable if the glomerular filtration rate is less than 30 mL/min/1.73 m2.
Avoid concomitant use of the following:
- Potassium supplements (unless persistent hypokalemia is present)
- Nonsteroidal anti-inflammatory drugs
- An ACE inhibitor and an ARB in combination
- A high dose of an ACE inhibitor or ARB.
Conditions that can lead to dehydration (eg, diarrhea, excessive use of diuretics) or acute illness should warrant reduction (or even withholding) of ARAs. When to discontinue ARA therapy is not well described, nor is the safety of starting ARAs in the hospital. However, it is clear that many patients who are potentially eligible for ARAs are not prescribed them.43
The guidelines are currently being revised, and will likely incorporate the new data from EMPHASIS-HF to extend to a broader population. The benefits of ARAs can be met only if the risks are minimized.
WHICH ARA IS BETTER?
The pharmacologic differences between the two ARAs have been described earlier, and guidelines have advocated evidence-based use of ARAs for their respective indications. There have been no large-scale, head-to-head comparisons of spironolactone and eplerenone in the heart failure population, and in clinical practice the drugs are prescribed interchangeably in most patients.
A double-blind randomized controlled trial in 141 patients with hypertension and primary hyperaldosteronism found that spironolactone lowered diastolic blood pressure more, but it also caused antiandrogenic effects more often.44
There is some evidence to suggest that eplerenone has a better metabolic profile than spironolactone. The data came from a small randomized controlled trial in 107 stable outpatients with mild heart failure.45 Patients who were prescribed spironolactone had a higher cortisol level and hemoglobin A1c level 4 months after starting treatment. This effect was not seen in patients who were on eplerenone. However, these findings need to be confirmed in larger trials.
While the differences between the two drugs remain to be determined, the most important differences in clinical practice are selectivity for receptors (and hence their antiandrogenic side effects) and price. Even though it is available as a generic drug, eplerenone still costs at least three times more than spironolactone for the same dosage and indication.
- Simpson SA, Tait JF, Bush IE. Secretion of a salt-retaining hormone by the mammalian adrenal cortex. Lancet 1952; 2:226–228.
- Struthers AD, MacDonald TM. Review of aldosterone- and angiotensin II-induced target organ damage and prevention. Cardiovasc Res 2004; 61:663–670.
- Edelmann F, Schmidt AG, Gelbrich G, et al. Rationale and design of the “aldosterone receptor blockade in diastolic heart failure” trial: a double-blind, randomized, placebo-controlled, parallel group study to determine the effects of spironolactone on exercise capacity and diastolic function in patients with symptomatic diastolic heart failure (Aldo-DHF). Eur J Heart Fail 2010; 12:874–882.
- Swedberg K, Eneroth P, Kjekshus J, Wilhelmsen L. Hormones regulating cardiovascular function in patients with severe congestive heart failure and their relation to mortality. CONSENSUS Trial Study Group. Circulation 1990; 82:1730–1736.
- MacFadyen RJ, Lee AF, Morton JJ, Pringle SD, Struthers AD. How often are angiotensin II and aldosterone concentrations raised during chronic ACE inhibitor treatment in cardiac failure? Heart 1999; 82:57–61.
- McKelvie RS, Yusuf S, Pericak D, et al. Comparison of candesartan, enalapril, and their combination in congestive heart failure: randomized evaluation of strategies for left ventricular dysfunction (RESOLVD) pilot study. The RESOLVD Pilot Study Investigators. Circulation 1999; 100:1056–1064.
- Tang WH, Vagelos RH, Yee YG, et al. Neurohormonal and clinical responses to high- versus low-dose enalapril therapy in chronic heart failure. J Am Coll Cardiol 2002; 39:70–78.
- Weber KT. Aldosterone in congestive heart failure. N Engl J Med 2001; 345:1689–1697.
- Funder JW. The role of aldosterone and mineralocorticoid receptors in cardiovascular disease. Am J Cardiovasc Drugs 2007; 7:151–157.
- Brilla CG, Pick R, Tan LB, Janicki JS, Weber KT. Remodeling of the rat right and left ventricles in experimental hypertension. Circ Res 1990; 67:1355–1364.
- Gomez-Sanchez EP, Fort C, Thwaites D. Central mineralocorticoid receptor antagonism blocks hypertension in Dahl S/JR rats. Am J Physiol 1992; 262:E96–E99.
- Garthwaite SM, McMahon EG. The evolution of aldosterone antagonists. Mol Cell Endocrinol 2004; 217:27–31.
- de Gasparo M, Joss U, Ramjoué HP, et al. Three new epoxy-spirolactone derivatives: characterization in vivo and in vitro. J Pharmacol Exp Ther 1987; 240:650–656.
- Pitt B, Zannad F, Remme WJ, et al. The effect of spironolactone on morbidity and mortality in patients with severe heart failure. Randomized Aldactone Evaluation Study Investigators. N Engl J Med 1999; 341:709–717.
- Pitt B, Remme W, Zannad F, et al; Eplerenone Post-Acute Myocardial Infarction Heart Failure Efficacy and Survival Study Investigators. Eplerenone, a selective aldosterone blocker, in patients with left ventricular dysfunction after myocardial infarction. N Engl J Med 2003; 348:1309–1321.
- Pitt B, White H, Nicolau J, et al; EPHESUS Investigators. Eplerenone reduces mortality 30 days after randomization following acute myocardial infarction in patients with left ventricular systolic dysfunction and heart failure. J Am Coll Cardiol 2005; 46:425–431.
- Zannad F, McMurray JJ, Krum H, et al; EMPHASIS-HF Study Group. Eplerenone in patients with systolic heart failure and mild symptoms. N Engl J Med 2011; 364:11–21.
- Weinberger MH, Roniker B, Krause SL, Weiss RJ. Eplerenone, a selective aldosterone blocker, in mild-to-moderate hypertension. Am J Hypertens 2002; 15:709–716.
- Tsutamoto T, Wada A, Maeda K, et al. Spironolactone inhibits the transcardiac extraction of aldosterone in patients with congestive heart failure. J Am Coll Cardiol 2000; 36:838–844.
- Hayashi M, Tsutamoto T, Wada A, et al. Immediate administration of mineralocorticoid receptor antagonist spironolactone prevents postinfarct left ventricular remodeling associated with suppression of a marker of myocardial collagen synthesis in patients with first anterior acute myocardial infarction. Circulation 2003; 107:2559–2565.
- Fraccarollo D, Galuppo P, Schmidt I, Ertl G, Bauersachs J. Additive amelioration of left ventricular remodeling and molecular alterations by combined aldosterone and angiotensin receptor blockade after myocardial infarction. Cardiovasc Res 2005; 67:97–105.
- Ramires FJ, Mansur A, Coelho O, et al. Effect of spironolactone on ventricular arrhythmias in congestive heart failure secondary to idiopathic dilated or to ischemic cardiomyopathy. Am J Cardiol 2000; 85:1207–1211.
- Palmer BF. Managing hyperkalemia caused by inhibitors of the reninangiotensin-aldosterone system. N Engl J Med 2004; 351:585–592.
- Sica DA. The risks and benefits of therapy with aldosterone receptor antagonist therapy. Curr Drug Saf 2007; 2:71–77.
- Shah KB, Rao K, Sawyer R, Gottlieb SS. The adequacy of laboratory monitoring in patients treated with spironolactone for congestive heart failure. J Am Coll Cardiol 2005; 46:845–849.
- Juurlink DN, Mamdani MM, Lee DS, et al. Rates of hyperkalemia after publication of the Randomized Aldactone Evaluation Study. N Engl J Med 2004; 351:543–551.
- Albert NM, Fonarow GC, Yancy CW, et al. Influence of dedicated heart failure clinics on delivery of recommended therapies in outpatient cardiology practices: findings from the Registry to Improve the Use of Evidence-Based Heart Failure Therapies in the Outpatient Setting (IMPROVE HF). Am Heart J 2010; 159:238–244.
- Wei L, Struthers AD, Fahey T, Watson AD, Macdonald TM. Spironolactone use and renal toxicity: population based longitudinal analysis. BMJ 2010; 340:c1768.
- Nishizaka MK, Zaman MA, Calhoun DA. Efficacy of low-dose spironolactone in subjects with resistant hypertension. Am J Hypertens 2003; 16:925–930.
- Jeunemaitre X, Chatellier G, Kreft-Jais C, et al. Efficacy and tolerance of spironolactone in essential hypertension. Am J Cardiol 1987; 60:820–825.
- Verhamme K, Mosis G, Dieleman J, Stricker B, Sturkenboom M. Spironolactone and risk of upper gastrointestinal events: population based case-control study. BMJ 2006; 333:330.
- Massie BM, Carson PE, McMurray JJ, et al; I-PRESERVE Investigators. Irbesartan in patients with heart failure and preserved ejection fraction. N Engl J Med 2008; 359:2456–2467.
- Yusuf S, Pfeffer MA, Swedberg K, et al; CHARM Investigators and Committees. Effects of candesartan in patients with chronic heart failure and preserved left-ventricular ejection fraction: the CHARM-Preserved Trial. Lancet 2003; 362:777–781.
- Deswal A, Richardson P, Bozkurt B, Mann DL. Results of the Randomized Aldosterone Antagonism in Heart Failure With Preserved Ejection Fraction Trial (RAAM-PEF). J Card Fail 2011; 17:634–642.
- Edelmann F, Schmidt AG, Gelbrich G, et al. Rationale and design of the ‘aldosterone receptor blockade in diastolic heart failure’ trial: a double-blind, randomized, placebo-controlled, parallel group study to determine the effects of spironolactone on exercise capacity and diastolic function in patients with symptomatic diastolic heart failure (Aldo-DHF). Eur J Heart Fail 2010; 12:874–882.
- Hené RJ, Boer P, Koomans HA, Mees EJ. Plasma aldosterone concentrations in chronic renal disease. Kidney Int 1982; 21:98–101.
- Greene EL, Kren S, Hostetter TH. Role of aldosterone in the remnant kidney model in the rat. J Clin Invest 1996; 98:1063–1068.
- Bianchi S, Bigazzi R, Campese VM. Long-term effects of spironolactone on proteinuria and kidney function in patients with chronic kidney disease. Kidney Int 2006; 70:2116–2123.
- Nagase M, Yoshida S, Shibata S, et al. Enhanced aldosterone signaling in the early nephropathy of rats with metabolic syndrome: possible contribution of fat-derived factors. J Am Soc Nephrol 2006; 17:3438–3446.
- Schjoedt KJ, Rossing K, Juhl TR, et al. Beneficial impact of spironolactone on nephrotic range albuminuria in diabetic nephropathy. Kidney Int 2006; 70:536–542.
- Toyonaga J, Tsuruya K, Ikeda H, et al. Spironolactone inhibits hyperglycemia-induced podocyte injury by attenuating ROS production. Nephrol Dial Transplant 2011; 26:2475–2484.
- Hunt SA, Abraham WT, Chin MH, et al. 2009 focused update incorporated into the ACC/AHA 2005 Guidelines for the Diagnosis and Management of Heart Failure in Adults: a report of the American College of Cardiology Foundation/American Heart Association Task Force on Practice Guidelines: developed in collaboration with the International Society for Heart and Lung Transplantation. Circulation 2009; 119:e391–e479.
- Albert NM, Yancy CW, Liang L, et al. Use of aldosterone antagonists in heart failure. JAMA 2009; 302:1658–1665.
- Parthasarathy HK, Ménard J, White WB, et al. A double-blind, randomized study comparing the antihypertensive effect of eplerenone and spironolactone in patients with hypertension and evidence of primary aldosteronism. J Hypertens 2011; 29:980–990.
- Yamaji M, Tsutamoto T, Kawahara C, et al. Effect of eplerenone versus spironolactone on cortisol and hemoglobin A1(c) levels in patients with chronic heart failure. Am Heart J 2010; 160:915–921.
KEY POINTS
- Although caution is advised in starting ARAs, these drugs are commonly underused in heart failure.
- Aldosterone “escape” can blunt the effects of angiotensin-converting enzyme inhibitors and angiotensin receptor blockers. This is the rationale for also using ARAs.
- The major trials of ARAs in heart failure to date have been the Randomized Aldactone Evaluation Study (RALES), the Eplerenone Post-acute Myocardial Infarction Heart Failure Efficacy and Survival Study (EPHESUS), and the Eplerenone in Mild Patients Hospitalization and Survival Study in Heart Failure (EMPHASIS-HF).
- Close monitoring is essential when starting an ARA, as severe hyperkalemia and renal insufficiency can occur.
Fever, dyspnea, and hepatitis in an Iraq veteran
A healthy 42-year-old US Army reservist returned home to Oregon in early April after a 12-month deployment in Iraq. About 6 weeks later, he developed a mild nonproductive cough; then, over the next 2 weeks, his symptoms progressed to myalgia, mild headache, fever, chills, drenching night sweats, and dyspnea on exertion.
About 2 weeks after the onset of his symptoms, he saw his primary care provider. The results of laboratory tests at that time were normal except for the following:
- Platelet count 110 × 109/L (reference range 150–400)
- Alkaline phosphatase 354 IU/L (40–100)
- Alanine aminotransferase 99 IU/L (5–36)
- Aspartate aminotransferase 220 IU/L (7–33).
Chest radiography was negative. He was told he had a viral infection and was sent home with no treatment.
1. Which of the following is the most likely diagnosis in this patient?
- Influenza
- Ehrlichiosis
- Q fever
- Visceral leishmaniasis
- Malaria
Military operations in Iraq and Afghanistan have involved large numbers of US Army Reserve and National Guard personnel: by 2007, more than 500,000 Reserve and National Guard personnel had served in these combat operations.1 Although these personnel are generally healthy and receive mandatory travel screenings, prophylactic drug treatment, and vaccinations, their close, long-term exposure to local populations and environments puts them at risk of many infections.2
Often, these veterans develop symptoms after returning home, and they seek medical care from providers outside the military medical system.3,4 Civilian health care providers are thus increasingly called on to recognize clinical syndromes associated with military operations.
FEVER IN RETURNED SOLDIERS
The presentation of this 42-year-old veteran has an extensive differential diagnosis. His symptoms arose more than a month after his return from Iraq, meaning he could have acquired an infection in Iraq, on his trip home, or even after arriving home.
A number of common viral and atypical respiratory pathogens could be involved, and although circulating influenza was not common at the time of year he happened to return (spring), it remains a possibility. However, the duration of his illness, with symptoms that gradually worsened over 12 days, argues against influenza and community-acquired respiratory and other viral illnesses.
Aronson et al5 have reviewed the infectious risks in deployed military personnel.5 Infectious syndromes that have manifested in military personnel a month or more after returning from Iraq or Afghanistan include malaria, Q fever, brucellosis, typhoid fever, and leishmaniasis.5
Malaria
Malaria should be considered in all travelers from endemic areas presenting with fever, especially if they have thrombocytopenia and anemia. Plasmodium vivax is present in Iraq, but transmission is rare and isolated. Defense Medical Surveillance System data show that most of the recent malaria cases in US military personnel were acquired in Afghanistan or Korea. Many of these cases were caused by P vivax and manifested weeks to months after exposure, and diagnosis was significantly delayed because the provider did not consider malaria in the differential diagnosis.4,6,7
Testing for malaria with serial thick and thin blood smears and the BinaxNOW (Iverness Medical, Princeton, NJ) rapid test, when available, should be done in all those who have served in malaria-endemic regions and who present with unexplained fever or consistent symptoms. Testing should be done even if prophylaxis was taken or the potential exposure was weeks to months before presentation.
Brucellosis
Brucellosis, a zoonosis typically acquired by ingesting unpasteurized dairy products, has a high prevalence in Eurasia. A nonspecific, multisystem illness with fever, hepatitis, and arthritis (classically sacroiliitis) is commonly described.
Brucellosis is less likely in our patient, given that he denied consumption of local dairy products while deployed. Also, he had prominent respiratory symptoms, which would not be typical of brucellosis.
Leishmaniasis
Leishmaniasis, a parasitic disease transmitted by sand flies, manifests in one of three ways, ie, as a cutaneous, a mucosal, or a visceral disease. Most infections recently reported in US military personnel have been cutaneous and were acquired in Iraq, where Leishmania major is the primary species.8 Visceral disease mimics lymphoma (fever, hepatosplenomegaly, and cytopenia), but only a handful of cases have been reported from Iraq and Afghanistan.9 The incubation period of visceral leishmaniasis is prolonged, and civilian providers should consider it even if the patient’s period of deployment was relatively long ago.
Q fever in military personnel
Q fever is caused by the intracellular bacterium Coxiella burnetii.
Q fever has been reported in more than 150 US military personnel deployed to Iraq and Afghanistan.10–12 However, it may be more common than that. In one report, 10% of patients admitted to a combat support hospital in Iraq with International Classification of Diseases, Ninth Revision codes potentially consistent with Q fever tested positive for it.13 And in several cases that manifested after deployment, Q fever was not considered initially by the health care provider.11,14 In response, the US Centers for Disease Control and Prevention (CDC) released a health advisory in May 2010 alerting providers about Q fever in travelers returning from Iraq and the Netherlands.15
Q fever is a zoonosis associated with a wide range of animal reservoirs, primarily agricultural livestock such as cattle, goats, and sheep, but also a variety of other animals. There are multiple routes of transmission, including direct animal contact, ingestion of unpasteurized dairy products, and, most commonly, inhalation of aerosolized particles contaminated by animal droppings or secretions.16 Tick-borne and sexual transmission have been reported in rare instances.17,18 Importantly, in many cases from Iraq and from an outbreak in the Netherlands there was no obvious exposure.19
Q fever is a potential agent of bioterrorism; therefore, a large-scale, single-point outbreak should raise concern about a possible intentional release of the organism.20
Q fever has myriad presentations
About 60% of cases of Q fever infection are asymptomatic.21 In the United States, the estimated seroprevalence is 3%. Such a high seroprevalence, despite the relatively small number of reported cases, suggests that this infection is often subclinical.22
After 2 to 3 weeks of incubation, Q fever infection can produce a wide range of presentations involving almost any organ system (Table 1).16 An influenza-like illness with fever, pneumonia, and hepatitis is classic. Often, headache is severe enough to warrant lumbar puncture. Atypical and often severe presentations include gastrointestinal or neurologic manifestations.23–25 Rates of hospitalization and in-hospital death are low in acute disease: hospitalization occurs in roughly 2% of cases, and death in about 1% of those hospitalized.26,27
The presentation may mimic that of conditions caused by common community pathogens such as Legionella, Rickettsia, cytomegalovirus, Ebola virus, influenza, Mycoplasma, and human immunodeficiency virus (primary infection). Heightened suspicion is needed to prevent delays in diagnosis and treatment.
This patient’s symptoms and his recent deployment made Q fever very likely.
CASE CONTINUED
The patient continued to feel sick and reported having three to four loose bowel movements per day and mild abdominal pain. His cough and dyspnea persisted.
He had not had contact with anyone who was ill, denied being exposed to animals or insects, and had not consumed unpasteurized dairy products; he recalled having cleaned his military-issue uniforms and equipment 2 to 3 weeks before the symptoms began. He called a military physician to get advice on what else could be causing his symptoms. This physician recommended tests based on potential exposures in Iraq. Tests for brucellosis, visceral leishmaniasis, and Q fever were ordered.
Over the next several days, he began to feel better, and at 3 to 4 weeks after the onset of his symptoms, he felt that he had returned to normal. All tests were negative.
TESTING FOR ATYPICAL PATHOGENS
2. Which of the following would be the most readily available method to confirm the diagnosis?
- Culture
- Polymerase chain reaction (PCR) testing
- Histopathologic testing
- Serologic testing
Testing for atypical pathogens was reasonable in this patient. In addition to an evaluation for parasitic causes of persistent and chronic diarrhea, an evaluation for Q fever, brucellosis, and visceral leishmaniasis via serologic testing was warranted. A variety of tests exist for all of these infections, but serologic tests are the most readily available.
Leishmaniasis testing
Visceral leishmaniasis was traditionally diagnosed by visualizing organisms in splenic or bone marrow aspirates,28 but now serologic tests are available through commercial and public health laboratories such as the CDC. Immunochromatographic tests using recombinant k39 antigen are highly sensitive and specific and have been used in military cases.29,30
Brucellosis testing
Brucella can be cultured from blood or tissue samples. The laboratory must be alerted, as special media can be used to increase the yield and precautions must be taken to prevent laboratory-acquired infection. Serologic testing is the method most commonly used for diagnosis.31
Q fever testing
Q fever can be diagnosed with serologic testing during its acute and convalescent phases.
PCR testing of blood is useful for diagnosing acute disease and is positive before serologic conversion, thus allowing rapid diagnosis and treatment.32 The Joint Biological Agent Identification and Diagnostic System (JBAIDS) PCR platform was studied in a Combat Support Hospital in Iraq for making the rapid diagnosis of Q fever and has since been approved by the US Food and Drug Administration for military use.33
Culture is beyond the scope of most clinical laboratories and requires specialized cell culture or egg yolk media. In tissue, usually liver tissue obtained in an effort to evaluate hepatitis, the histologic finding of “doughnut” granulomas, or fibrin-encased granulomas, can be suggestive of C burnetii but may be nonspecific and seen with other infections.23,34
Serologic testing with an immunofluorescence assay (IFA) remains the most common method of diagnosis. It is based on the detection of immunoglobulin G (IgG) and IgM responses against phase I and phase II antigens of C burnetii. After initial infection, the organism displays phase I antigens and is highly infectious. When grown in culture, the organism undergoes phase shifting to a less infectious form with predominantly phase II antigens. Paradoxically, after initial infection in humans, antibody response against phase II antigens is seen first, whereas in chronic infection, a phase I antibody response dominates.26,35 Phase II antibodies appear around week 2, and 90% of samples from infected people are positive by week 3. A fourfold rise in titer between the acute-phase and convalescent-phase samples confirms the diagnosis.35
A number of serologic assays are available worldwide, but they have different methods and cutoff values, so questions have arisen about the equivalence of the results.14,36 Serologic cutoffs have been defined in Europe, where most cases of Q fever have been reported.37
CHRONIC Q FEVER
3. Which of the following would be the most likely chronic manifestation of Q fever?
- Pneumonia
- Hepatitis
- Endocarditis
- Chronic fatigue
- Osteomyelitis
Chronic syndromes can develop years to months after untreated or inadequately treated infection and can be serious. Chronic infection can also result after a clinically silent initial infection.26,38 Culture-negative endocarditis, which occurs in fewer than 1% of patients diagnosed with acute infection, is the most common chronic manifestation (Table 1). Patients with underlying valvular disease, malignancy, or immunosuppression are at greater risk.38–40
Challenges and controversies
The diagnosis of chronic Q fever remains challenging. Traditionally, elevated phase I IgG titers were considered highly predictive of chronic disease. A cutoff of 1:800 was set, based on retrospective data from chronic cases in Europe, but its generalizability to different assays and patient populations has been unclear. 14,36,37 Recent reviews and prospective analysis with serial serologic studies in the Dutch outbreak and other sources suggest the positive predictive value (PPV) of phase I IgG titers greater than 1:800 to be lower than previously estimated, largely due to widespread testing and resultant increased seroprevalence assessments. It has been suggested the cutoff be raised to 1:1,600, which still only carries a 59% positive predictive value.41,42
Chronic fatigue due to Q fever remains a controversial topic and has only been described in Europe, Asia, and Australia. A direct link has yet to be established.43 Additional research is needed, but small studies of prolonged antibiotic treatment have not shown benefit in these cases.44
CASE CONTINUED
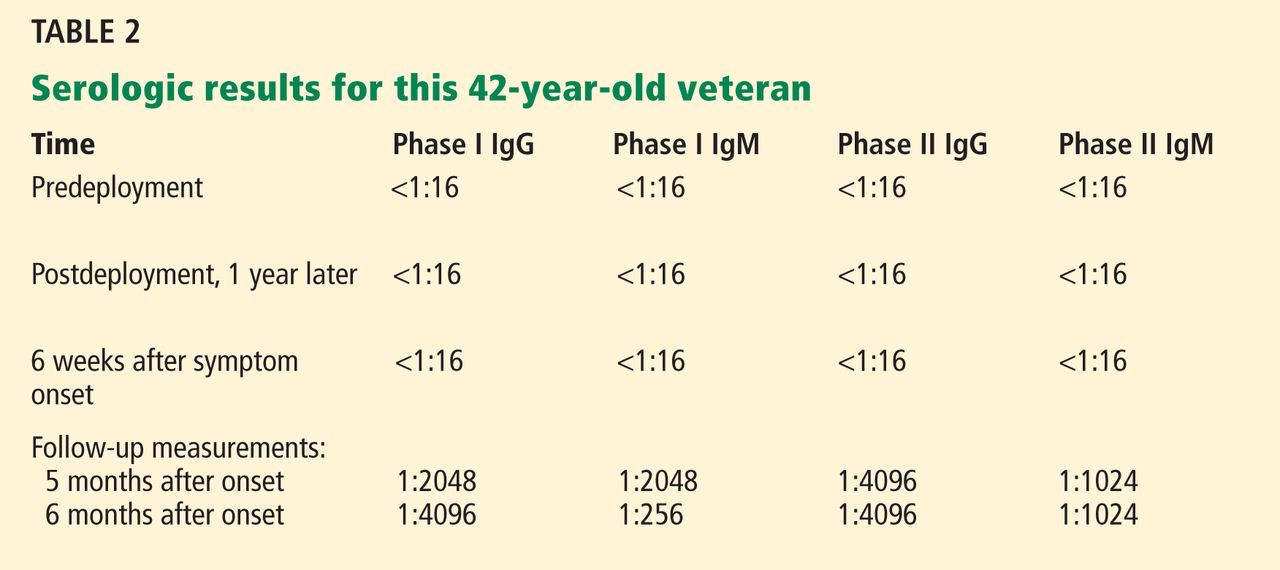
This patient did well. During a routine physical while enrolled at the Army War College in Carlisle, PA, 6 months after the original presentation, he mentioned his illness to the physician, who then repeated testing for Q fever; the test was positive (Table 2). Subsequently, serum samples from before and after his deployment were tested along with another convalescent-phase sample, and the results demonstrated Q fever seroconversion. He was well and had no physical complaints. He had no heart murmur, and a complete blood count and tests of liver enzymes and inflammatory markers were normal.
TREATMENT AND PREVENTION OF Q FEVER
4. Which of the following treatments would be appropriate, given his diagnosis of Q fever?
- Doxycycline (Vibramycin) 100 mg twice daily for 14 days
- Levofloxacin (Levaquin) 500 mg daily for 5 days
- Doxycycline 100 mg twice daily for 14 days and hydroxychloroquine (Plaquenil) 200 mg three times per day for 18 months
- No treatment
The treatment goals in Q fever are to hasten the resolution of symptoms and to prevent chronic disease. Generally, if there are no clinical findings or symptoms, treatment is not indicated. If the patient has symptoms, early treatment is preferred, but a response may be seen even when there is a delay in diagnosis.
Doxycycline 100 mg twice a day for 14 days is the treatment of choice. In addition, quinolones have in vitro activity,45 and a recent study suggests moxifloxacin (Avelox) may be the preferred antibiotic for those who cannot tolerate doxycycline.46 In pregnant women and in children, macrolides and trimethoprim-sulfamethoxazole (Bactrim) are preferred.47,48
Treatment of chronic Q fever, in particular endocarditis, warrants more intensive therapy. A retrospective review of treated cases of endocarditis suggested that monotherapy with doxycycline often failed, and combination therapy with hydroxychloroquine has been advocated based on in vivo and in vitro experience.49
PREVENTING LONG-TERM SEQUELAE OF CHRONIC Q FEVER
5. At this point, what is the next step in the management of this patient?
- No further follow-up is indicated
- Transthoracic echocardiography (TTE)
- Repeat Q fever serologic testing in 3 to 6 months
- Whole-blood PCR testing and transesophageal echocardiography (TEE)
Long-term follow-up of patients with Q fever has been advocated to monitor for the development of chronic Q fever, but recent studies question the previously devised algorithms.50
The data the algorithms were based on suggested that preexisting valvular heart disease could be associated with up to a 39% risk of endocarditis, and a two-step approach was devised to prevent and identify early chronic infection.51,52 Patients with Q fever would undergo TTE at baseline, and if the findings were abnormal (including mild regurgitation), then 12 months of prophylactic treatment with hydroxychloroquine and doxycycline was recommended. If TTE was normal, serial serologic testing every 3 months was recommended. If the anti-phase I IgG titer was greater than 1:800 at any point, TEE and a whole-blood PCR assay were recommended to evaluate for endocarditis.51
These recommendations were based on data from the French National Reference Center and had not been prospectively evaluated. The 2007–2008 Dutch outbreak provided a large cohort of Q fever cases. After initial screening with TTE and serologic follow-up, 59% of patients were noted to have mild valvular abnormalities, and many had phase I IgG levels greater than 1:800 during follow-up despite being clinically free of disease. The Dutch subsequently stopped screening with TTE as part of routine follow-up and elected to follow patients clinically.
Similar findings have been noted from case follow-up in France and Taiwan, also supporting using serologic cutoffs alone in determining the need for evaluation (with TEE) or treatment of chronic disease.53,54 The usefulness of serologic testing every 3 months has also been questioned, and some have advocated extending the interval, especially since less emphasis is being placed on the results in favor of more practical clinical follow-up.39
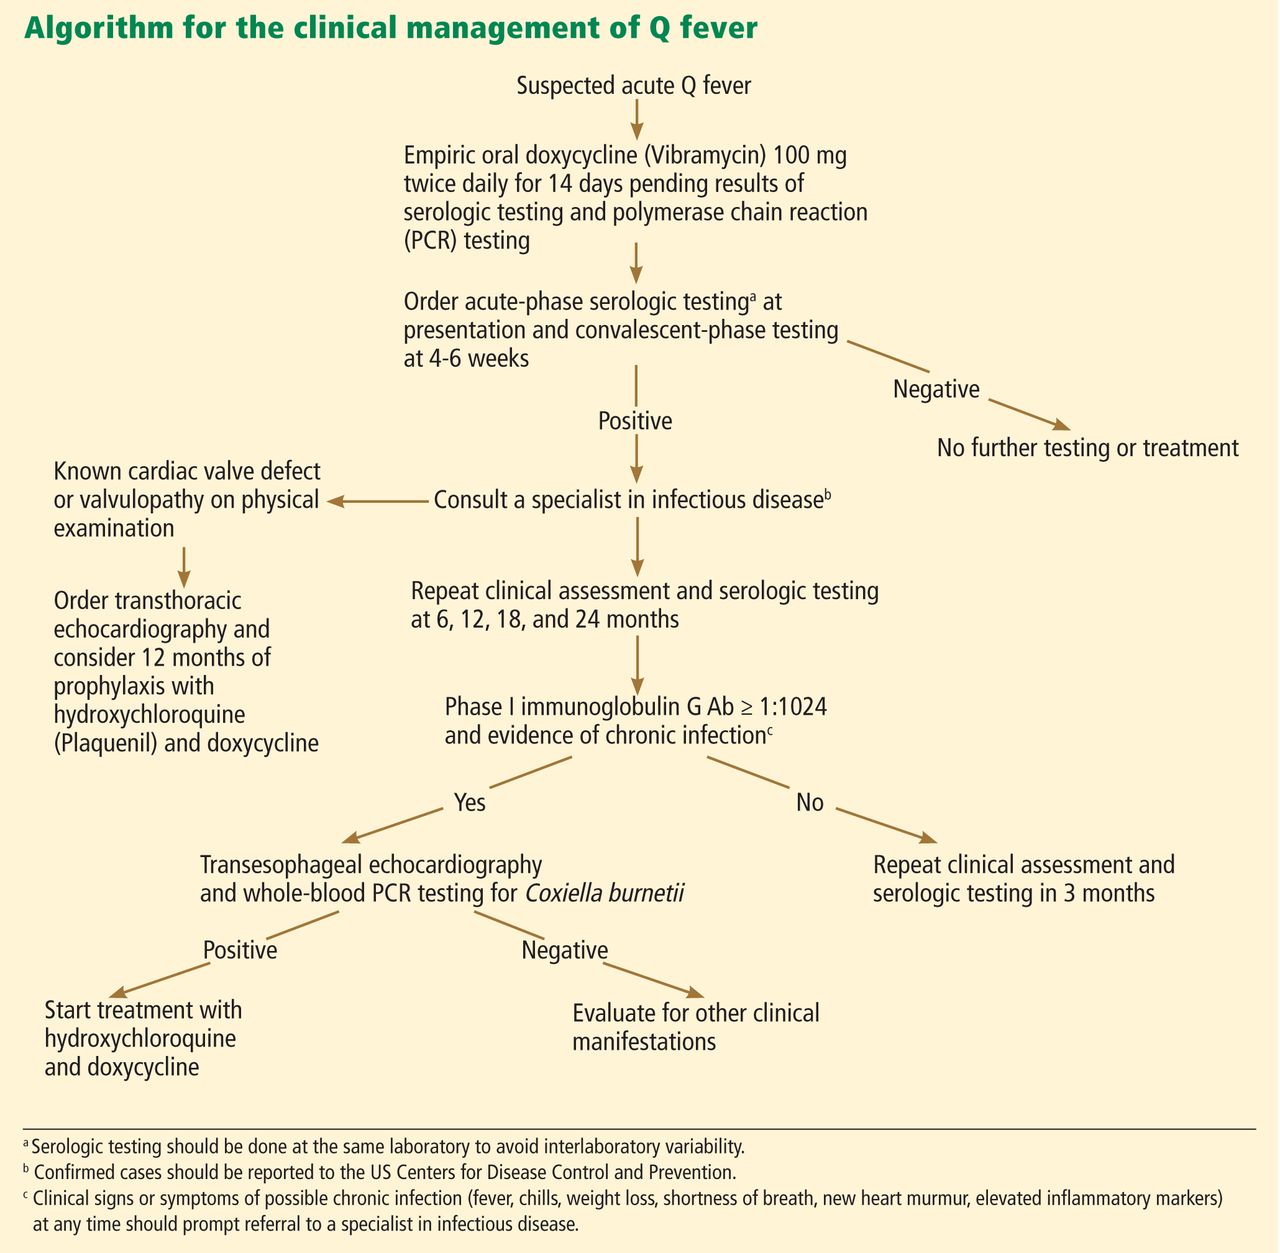
One such clinical approach at follow-up is presented in Figure 1. TTE should be reserved for patients with known valvular disease or a clear murmur. Those with underlying valvular disease and acute Q fever should be managed on an individual basis by a specialist in infectious disease, and antibiotic prophylaxis should be considered. Patients without underlying disease should have regular follow-up examinations and serologic testing every 6 months, and clinical symptoms should guide further testing (eg, with TEE and PCR testing) for chronic disease.
In this patient, phase I and II antibody titers were notably elevated (in TABLE 2, phase I titers > 1:800 and 1:1600 cutoffs). Such high titers have been common in military cases from Iraq and Afghanistan, and to date no cases of endocarditis have been diagnosed despite close follow-up. Most cases in military personnel are in relatively young patients who lack risk factors for endocarditis. Based on emerging data from large overseas outbreaks and the potential toxicity of intensive preemptive dual-antimicrobial therapy, an approach of close follow-up was taken.
PRIMARY PREVENTION OF Q FEVER
Prevention of Q fever remains a challenge, as the organism is highly persistent in the environment. An effective licensed vaccine exists in Australia under the brand name Q-Vax, but no approved vaccine is currently available in the United States.55
THE PATIENT’S COURSE
The patient returned for follow-up about 1 year after his first presentation. He noted some ongoing fatigue but attributed this to his course work, and he said he otherwise felt well. He exercises regularly, with no shortness of breath, fevers, chills, or weight loss. He continued to have elevated Q fever titers. Because he had no symptoms, no heart murmur, and normal inflammatory markers, he had no further workup and continued to be followed with serial serologic testing and examinations.
- Defense Science Board Task Force on Deployment of Members of the National Guard and Reserve in the Global War on Terrorism. Washington, DC. September 2007.
- Sanders JW, Putnam SD, Frankart C, et al. Impact of illness and non-combat injury during Operations Iraqi Freedom and Enduring Freedom (Afghanistan). Am J Trop Med Hyg 2005; 73:713–719.
- Gleeson TD, Decker CF, Johnson MD, Hartzell JD, Mascola JR. Q fever in US military returning from Iraq. Am J Med 2007; 120:e11–e12.
- Hagan JE, Marcos LA, Steinberg TH. Fever in a soldier returned from Afghanistan. J Travel Med 2010; 17:351–352.
- Aronson NE, Sanders JW, Moran KA. In harm’s way: infections in deployed American military forces. Clin Infect Dis 2006; 43:1045–1051.
- Klein TA, Pacha LA, Lee HC, et al. Plasmodium vivax malaria among U.S. forces Korea in the Republic of Korea, 1993–2007. Mil Med 2009; 174:412–418.
- Ciminera P, Brundage J. Malaria in U.S. military forces: a description of deployment exposures from 2003 through 2005. Am J Trop Med Hyg 2007; 76:275–279.
- Lesho EP, Wortmann G, Neafie R, Aronson N. Nonhealing skin lesions in a sailor and a journalist returning from Iraq. Cleve Clin J Med 2005; 72:93–96,
- Myles O, Wortmann GW, Cummings JF, et al. Visceral leishmaniasis: clinical observations in 4 US army soldiers deployed to Afghanistan or Iraq, 2002–2004. Arch Intern Med 2007; 167:1899–1901.
- Faix DJ, Harrison DJ, Riddle MS, et al. Outbreak of Q fever among US military in western Iraq, June–July 2005. Clin Infect Dis 2008; 46:e65–e68.
- Leung-Shea C, Danaher PJ. Q fever in members of the United States armed forces returning from Iraq. Clin Infect Dis 2006; 43:e77–e82.
- Anderson AD, Smoak B, Shuping E, Ockenhouse C, Petruccelli B. Q fever and the US military. Emerg Infect Dis 2005; 11:1320–1322.
- Anderson AD, Baker TR, Littrell AC, Mott RL, Niebuhr DW, Smoak BL. Seroepidemiologic survey for Coxiella burnetii among hospitalized US troops deployed to Iraq. Zoonoses Public Health 2011; 58:276–283.
- Ake JA, Massung RF, Whitman TJ, Gleeson TD. Difficulties in the diagnosis and management of a US servicemember presenting with possible chronic Q fever. J Infect 2010; 60:175–177.
- Centers for Disease Control and Prevention (CDC). Potential for Q fever infection among travelers returning from Iraq and the Netherlands http://www.bt.cdc.gov/HAN/han00313.asp. Accessed July 5, 2012.
- Parker NR, Barralet JH, Bell AM. Q fever. Lancet 2006; 367:679–688.
- Miceli MH, Veryser AK, Anderson AD, Hofinger D, Lee SA, Tancik C. A case of person-to-person transmission of Q fever from an active duty serviceman to his spouse. Vector Borne Zoonotic Dis 2010; 10:539–541.
- Milazzo A, Hall R, Storm PA, Harris RJ, Winslow W, Marmion BP. Sexually transmitted Q fever. Clin Infect Dis 2001; 33:399–402.
- Hartzell JD, Peng SW, Wood-Morris RN, et al. Atypical Q fever in US soldiers. Emerg Infect Dis 2007; 13:1247–1249.
- Bossi P, Tegnell A, Baka A, et al; Task Force on Biological and Chemical Agent Threats, Public Health Directorate, European Commission, Luxembourg. Bichat guidelines for the clinical management of Q fever and bioterrorism-related Q fever. Euro Surveill 2004; 9:E19–E20.
- Roest HI, Tilburg JJ, van der Hoek W, et al. The Q fever epidemic in The Netherlands: history, onset, response and reflection. Epidemiol Infect 2011; 139:1–12.
- Anderson AD, Kruszon-Moran D, Loftis AD, et al. Seroprevalence of Q fever in the United States, 2003–2004. Am J Trop Med Hyg 2009; 81:691–694.
- Hatchette TF, Marrie TJ. Atypical manifestations of chronic Q fever. Clin Infect Dis 2001; 33:1347–1351.
- Bernit E, Pouget J, Janbon F, et al. Neurological involvement in acute Q fever: a report of 29 cases and review of the literature. Arch Intern Med 2002; 162:693–700.
- Kofteridis DP, Mazokopakis EE, Tselentis Y, Gikas A. Neurological complications of acute Q fever infection. Eur J Epidemiol 2004; 19:1051–1054.
- Raoult D, Marrie T, Mege J. Natural history and pathophysiology of Q fever. Lancet Infect Dis 2005; 5:219–226.
- Kampschreur LM, Wegdam-Blans MC, Thijsen SF, et al. Acute Q fever related in-hospital mortality in the Netherlands. Neth J Med 2010; 68:408–413.
- Srivastava P, Dayama A, Mehrotra S, Sundar S. Diagnosis of visceral leishmaniasis. Trans R Soc Trop Med Hyg 2011; 105:1–6.
- Chappuis F, Rijal S, Soto A, Menten J, Boelaert M. A meta-analysis of the diagnostic performance of the direct agglutination test and rK39 dipstick for visceral leishmaniasis. BMJ 2006; 333:723.
- Hartzell JD, Aronson NE, Weina PJ, Howard RS, Yadava A, Wortmann GW. Positive rK39 serologic assay results in US servicemen with cutaneous leishmaniasis. Am J Trop Med Hyg 2008; 79:843–846.
- Pappas G, Akritidis N, Bosilkovski M, Tsianos E. Brucellosis. N Engl J Med 2005; 352:2325–2336.
- Schneeberger PM, Hermans MH, van Hannen EJ, Schellekens JJ, Leenders AC, Wever PC. Real-time PCR with serum samples is indispensable for early diagnosis of acute Q fever. Clin Vaccine Immunol 2010; 17:286–290.
- Hamilton LR, George DL, Scoville SL, Hospenthal DR, Griffith ME. PCR for rapid diagnosis of acute Q fever at a combat support hospital in Iraq. Mil Med 2011; 176:103–105.
- Bonilla MF, Kaul DR, Saint S, Isada CM, Brotman DJ. Clinical problem-solving. Ring around the diagnosis. N Engl J Med 2006; 354:1937–1942.
- Fournier PE, Marrie TJ, Raoult D. Diagnosis of Q fever. J Clin Microbiol 1998; 36:1823–1834.
- Healy B, van Woerden H, Raoult D, et al. Chronic Q fever: different serological results in three countries—results of a follow-up study 6 years after a point source outbreak. Clin Infect Dis 2011; 52:1013–1019.
- Dupont HT, Thirion X, Raoult D. Q fever serology: cutoff determination for microimmunofluorescence. Clin Diagn Lab Immunol 1994; 1:189–196.
- Karakousis PC, Trucksis M, Dumler JS. Chronic Q fever in the United States. J Clin Microbiol 2006; 44:2283–2287.
- van der Hoek W, Versteeg B, Meekelenkamp JC, et al. Follow-up of 686 patients with acute Q fever and detection of chronic infection. Clin Infect Dis 2011; 52:1431–1436.
- Fenollar F, Fournier PE, Carrieri MP, Habib G, Messana T, Raoult D. Risks factors and prevention of Q fever endocarditis. Clin Infect Dis 2001; 33:312–316.
- Frankel D, Richet H, Renvoisé A, Raoult D. Q fever in France, 1985–2009. Emerg Infect Dis 2011; 17:350–356.
- Baddour LM, Wilson WR, Bayer AS, et al; Committee on Rheumatic Fever, Endocarditis, and Kawasaki Disease; Council on Cardiovascular Disease in the Young; Councils on Clinical Cardiology, Stroke, and Cardiovascular Surgery and Anesthesia; American Heart Association; Infectious Diseases Society of America. Infective endocarditis: diagnosis, antimicrobial therapy, and management of complications: a statement for healthcare professionals from the Committee on Rheumatic Fever, Endocarditis, and Kawasaki Disease, Council on Cardiovascular Disease in the Young, and the Councils on Clinical Cardiology, Stroke, and Cardiovascular Surgery and Anesthesia, American Heart Association: endorsed by the Infectious Diseases Society of America. Circulation 2005; 111:e394–e434.
- Wildman MJ, Smith EG, Groves J, Beattie JM, Caul EO, Ayres JG. Chronic fatigue following infection by Coxiella burnetii (Q fever): ten-year follow-up of the 1989 UK outbreak cohort. QJM 2002; 95:527–538.
- Iwakami E, Arashima Y, Kato K, et al. Treatment of chronic fatigue syndrome with antibiotics: pilot study assessing the involvement of Coxiella burnetii infection. Intern Med 2005; 44:1258–1263.
- Rolain JM, Maurin M, Raoult D. Bacteriostatic and bactericidal activities of moxifloxacin against Coxiella burnetii. Antimicrob Agents Chemother 2001; 45:301–302.
- Dijkstra F, Riphagen-Dalhuisen J, Wijers N, et al. Antibiotic therapy for acute Q fever in The Netherlands in 2007 and 2008 and its relation to hospitalization. Epidemiol Infect 2011; 139:1332–1341.
- Raoult D. Use of macrolides for Q fever. Antimicrob Agents Chemother 2003; 47:446.
- Carcopino X, Raoult D, Bretelle F, Boubli L, Stein A. Managing Q fever during pregnancy: the benefits of long-term cotrimoxazole therapy. Clin Infect Dis 2007; 45:548–555.
- Raoult D, Houpikian P, Tissot Dupont H, Riss JM, Arditi-Djiane J, Brouqui P. Treatment of Q fever endocarditis: comparison of 2 regimens containing doxycycline and ofloxacin or hydroxychloroquine. Arch Intern Med 1999; 159:167–173.
- Healy B, Llewelyn M, Westmoreland D, Lloyd G, Brown N. The value of follow-up after acute Q fever infection. J Infect 2006; 52:e109–e112.
- Landais C, Fenollar F, Thuny F, Raoult D. From acute Q fever to endocarditis: serological follow-up strategy. Clin Infect Dis 2007; 44:1337–1340.
- Hartzell JD, Wood-Morris RN, Martinez LJ, Trotta RF. Q fever: epidemiology, diagnosis, and treatment. Mayo Clin Proc 2008; 83:574–579.
- Hung MN, Lin LJ, Hou MY, et al. Serologic assessment of the risk of developing chronic Q fever in cohorts of acutely infected individuals. J Infect 2011; 62:39–44.
- Sunder S, Gras G, Bastides F, De Gialluly C, Choutet P, Bernard L. Chronic Q fever: relevance of serology. Clin Infect Dis 2011; 53:749–750.
- Gefenaite G, Munster JM, van Houdt R, Hak E. Effectiveness of the Q fever vaccine: a meta-analysis. Vaccine 2011; 29:395–398.
A healthy 42-year-old US Army reservist returned home to Oregon in early April after a 12-month deployment in Iraq. About 6 weeks later, he developed a mild nonproductive cough; then, over the next 2 weeks, his symptoms progressed to myalgia, mild headache, fever, chills, drenching night sweats, and dyspnea on exertion.
About 2 weeks after the onset of his symptoms, he saw his primary care provider. The results of laboratory tests at that time were normal except for the following:
- Platelet count 110 × 109/L (reference range 150–400)
- Alkaline phosphatase 354 IU/L (40–100)
- Alanine aminotransferase 99 IU/L (5–36)
- Aspartate aminotransferase 220 IU/L (7–33).
Chest radiography was negative. He was told he had a viral infection and was sent home with no treatment.
1. Which of the following is the most likely diagnosis in this patient?
- Influenza
- Ehrlichiosis
- Q fever
- Visceral leishmaniasis
- Malaria
Military operations in Iraq and Afghanistan have involved large numbers of US Army Reserve and National Guard personnel: by 2007, more than 500,000 Reserve and National Guard personnel had served in these combat operations.1 Although these personnel are generally healthy and receive mandatory travel screenings, prophylactic drug treatment, and vaccinations, their close, long-term exposure to local populations and environments puts them at risk of many infections.2
Often, these veterans develop symptoms after returning home, and they seek medical care from providers outside the military medical system.3,4 Civilian health care providers are thus increasingly called on to recognize clinical syndromes associated with military operations.
FEVER IN RETURNED SOLDIERS
The presentation of this 42-year-old veteran has an extensive differential diagnosis. His symptoms arose more than a month after his return from Iraq, meaning he could have acquired an infection in Iraq, on his trip home, or even after arriving home.
A number of common viral and atypical respiratory pathogens could be involved, and although circulating influenza was not common at the time of year he happened to return (spring), it remains a possibility. However, the duration of his illness, with symptoms that gradually worsened over 12 days, argues against influenza and community-acquired respiratory and other viral illnesses.
Aronson et al5 have reviewed the infectious risks in deployed military personnel.5 Infectious syndromes that have manifested in military personnel a month or more after returning from Iraq or Afghanistan include malaria, Q fever, brucellosis, typhoid fever, and leishmaniasis.5
Malaria
Malaria should be considered in all travelers from endemic areas presenting with fever, especially if they have thrombocytopenia and anemia. Plasmodium vivax is present in Iraq, but transmission is rare and isolated. Defense Medical Surveillance System data show that most of the recent malaria cases in US military personnel were acquired in Afghanistan or Korea. Many of these cases were caused by P vivax and manifested weeks to months after exposure, and diagnosis was significantly delayed because the provider did not consider malaria in the differential diagnosis.4,6,7
Testing for malaria with serial thick and thin blood smears and the BinaxNOW (Iverness Medical, Princeton, NJ) rapid test, when available, should be done in all those who have served in malaria-endemic regions and who present with unexplained fever or consistent symptoms. Testing should be done even if prophylaxis was taken or the potential exposure was weeks to months before presentation.
Brucellosis
Brucellosis, a zoonosis typically acquired by ingesting unpasteurized dairy products, has a high prevalence in Eurasia. A nonspecific, multisystem illness with fever, hepatitis, and arthritis (classically sacroiliitis) is commonly described.
Brucellosis is less likely in our patient, given that he denied consumption of local dairy products while deployed. Also, he had prominent respiratory symptoms, which would not be typical of brucellosis.
Leishmaniasis
Leishmaniasis, a parasitic disease transmitted by sand flies, manifests in one of three ways, ie, as a cutaneous, a mucosal, or a visceral disease. Most infections recently reported in US military personnel have been cutaneous and were acquired in Iraq, where Leishmania major is the primary species.8 Visceral disease mimics lymphoma (fever, hepatosplenomegaly, and cytopenia), but only a handful of cases have been reported from Iraq and Afghanistan.9 The incubation period of visceral leishmaniasis is prolonged, and civilian providers should consider it even if the patient’s period of deployment was relatively long ago.
Q fever in military personnel
Q fever is caused by the intracellular bacterium Coxiella burnetii.
Q fever has been reported in more than 150 US military personnel deployed to Iraq and Afghanistan.10–12 However, it may be more common than that. In one report, 10% of patients admitted to a combat support hospital in Iraq with International Classification of Diseases, Ninth Revision codes potentially consistent with Q fever tested positive for it.13 And in several cases that manifested after deployment, Q fever was not considered initially by the health care provider.11,14 In response, the US Centers for Disease Control and Prevention (CDC) released a health advisory in May 2010 alerting providers about Q fever in travelers returning from Iraq and the Netherlands.15
Q fever is a zoonosis associated with a wide range of animal reservoirs, primarily agricultural livestock such as cattle, goats, and sheep, but also a variety of other animals. There are multiple routes of transmission, including direct animal contact, ingestion of unpasteurized dairy products, and, most commonly, inhalation of aerosolized particles contaminated by animal droppings or secretions.16 Tick-borne and sexual transmission have been reported in rare instances.17,18 Importantly, in many cases from Iraq and from an outbreak in the Netherlands there was no obvious exposure.19
Q fever is a potential agent of bioterrorism; therefore, a large-scale, single-point outbreak should raise concern about a possible intentional release of the organism.20
Q fever has myriad presentations
About 60% of cases of Q fever infection are asymptomatic.21 In the United States, the estimated seroprevalence is 3%. Such a high seroprevalence, despite the relatively small number of reported cases, suggests that this infection is often subclinical.22
After 2 to 3 weeks of incubation, Q fever infection can produce a wide range of presentations involving almost any organ system (Table 1).16 An influenza-like illness with fever, pneumonia, and hepatitis is classic. Often, headache is severe enough to warrant lumbar puncture. Atypical and often severe presentations include gastrointestinal or neurologic manifestations.23–25 Rates of hospitalization and in-hospital death are low in acute disease: hospitalization occurs in roughly 2% of cases, and death in about 1% of those hospitalized.26,27
The presentation may mimic that of conditions caused by common community pathogens such as Legionella, Rickettsia, cytomegalovirus, Ebola virus, influenza, Mycoplasma, and human immunodeficiency virus (primary infection). Heightened suspicion is needed to prevent delays in diagnosis and treatment.
This patient’s symptoms and his recent deployment made Q fever very likely.
CASE CONTINUED
The patient continued to feel sick and reported having three to four loose bowel movements per day and mild abdominal pain. His cough and dyspnea persisted.
He had not had contact with anyone who was ill, denied being exposed to animals or insects, and had not consumed unpasteurized dairy products; he recalled having cleaned his military-issue uniforms and equipment 2 to 3 weeks before the symptoms began. He called a military physician to get advice on what else could be causing his symptoms. This physician recommended tests based on potential exposures in Iraq. Tests for brucellosis, visceral leishmaniasis, and Q fever were ordered.
Over the next several days, he began to feel better, and at 3 to 4 weeks after the onset of his symptoms, he felt that he had returned to normal. All tests were negative.
TESTING FOR ATYPICAL PATHOGENS
2. Which of the following would be the most readily available method to confirm the diagnosis?
- Culture
- Polymerase chain reaction (PCR) testing
- Histopathologic testing
- Serologic testing
Testing for atypical pathogens was reasonable in this patient. In addition to an evaluation for parasitic causes of persistent and chronic diarrhea, an evaluation for Q fever, brucellosis, and visceral leishmaniasis via serologic testing was warranted. A variety of tests exist for all of these infections, but serologic tests are the most readily available.
Leishmaniasis testing
Visceral leishmaniasis was traditionally diagnosed by visualizing organisms in splenic or bone marrow aspirates,28 but now serologic tests are available through commercial and public health laboratories such as the CDC. Immunochromatographic tests using recombinant k39 antigen are highly sensitive and specific and have been used in military cases.29,30
Brucellosis testing
Brucella can be cultured from blood or tissue samples. The laboratory must be alerted, as special media can be used to increase the yield and precautions must be taken to prevent laboratory-acquired infection. Serologic testing is the method most commonly used for diagnosis.31
Q fever testing
Q fever can be diagnosed with serologic testing during its acute and convalescent phases.
PCR testing of blood is useful for diagnosing acute disease and is positive before serologic conversion, thus allowing rapid diagnosis and treatment.32 The Joint Biological Agent Identification and Diagnostic System (JBAIDS) PCR platform was studied in a Combat Support Hospital in Iraq for making the rapid diagnosis of Q fever and has since been approved by the US Food and Drug Administration for military use.33
Culture is beyond the scope of most clinical laboratories and requires specialized cell culture or egg yolk media. In tissue, usually liver tissue obtained in an effort to evaluate hepatitis, the histologic finding of “doughnut” granulomas, or fibrin-encased granulomas, can be suggestive of C burnetii but may be nonspecific and seen with other infections.23,34
Serologic testing with an immunofluorescence assay (IFA) remains the most common method of diagnosis. It is based on the detection of immunoglobulin G (IgG) and IgM responses against phase I and phase II antigens of C burnetii. After initial infection, the organism displays phase I antigens and is highly infectious. When grown in culture, the organism undergoes phase shifting to a less infectious form with predominantly phase II antigens. Paradoxically, after initial infection in humans, antibody response against phase II antigens is seen first, whereas in chronic infection, a phase I antibody response dominates.26,35 Phase II antibodies appear around week 2, and 90% of samples from infected people are positive by week 3. A fourfold rise in titer between the acute-phase and convalescent-phase samples confirms the diagnosis.35
A number of serologic assays are available worldwide, but they have different methods and cutoff values, so questions have arisen about the equivalence of the results.14,36 Serologic cutoffs have been defined in Europe, where most cases of Q fever have been reported.37
CHRONIC Q FEVER
3. Which of the following would be the most likely chronic manifestation of Q fever?
- Pneumonia
- Hepatitis
- Endocarditis
- Chronic fatigue
- Osteomyelitis
Chronic syndromes can develop years to months after untreated or inadequately treated infection and can be serious. Chronic infection can also result after a clinically silent initial infection.26,38 Culture-negative endocarditis, which occurs in fewer than 1% of patients diagnosed with acute infection, is the most common chronic manifestation (Table 1). Patients with underlying valvular disease, malignancy, or immunosuppression are at greater risk.38–40
Challenges and controversies
The diagnosis of chronic Q fever remains challenging. Traditionally, elevated phase I IgG titers were considered highly predictive of chronic disease. A cutoff of 1:800 was set, based on retrospective data from chronic cases in Europe, but its generalizability to different assays and patient populations has been unclear. 14,36,37 Recent reviews and prospective analysis with serial serologic studies in the Dutch outbreak and other sources suggest the positive predictive value (PPV) of phase I IgG titers greater than 1:800 to be lower than previously estimated, largely due to widespread testing and resultant increased seroprevalence assessments. It has been suggested the cutoff be raised to 1:1,600, which still only carries a 59% positive predictive value.41,42
Chronic fatigue due to Q fever remains a controversial topic and has only been described in Europe, Asia, and Australia. A direct link has yet to be established.43 Additional research is needed, but small studies of prolonged antibiotic treatment have not shown benefit in these cases.44
CASE CONTINUED
This patient did well. During a routine physical while enrolled at the Army War College in Carlisle, PA, 6 months after the original presentation, he mentioned his illness to the physician, who then repeated testing for Q fever; the test was positive (Table 2). Subsequently, serum samples from before and after his deployment were tested along with another convalescent-phase sample, and the results demonstrated Q fever seroconversion. He was well and had no physical complaints. He had no heart murmur, and a complete blood count and tests of liver enzymes and inflammatory markers were normal.
TREATMENT AND PREVENTION OF Q FEVER
4. Which of the following treatments would be appropriate, given his diagnosis of Q fever?
- Doxycycline (Vibramycin) 100 mg twice daily for 14 days
- Levofloxacin (Levaquin) 500 mg daily for 5 days
- Doxycycline 100 mg twice daily for 14 days and hydroxychloroquine (Plaquenil) 200 mg three times per day for 18 months
- No treatment
The treatment goals in Q fever are to hasten the resolution of symptoms and to prevent chronic disease. Generally, if there are no clinical findings or symptoms, treatment is not indicated. If the patient has symptoms, early treatment is preferred, but a response may be seen even when there is a delay in diagnosis.
Doxycycline 100 mg twice a day for 14 days is the treatment of choice. In addition, quinolones have in vitro activity,45 and a recent study suggests moxifloxacin (Avelox) may be the preferred antibiotic for those who cannot tolerate doxycycline.46 In pregnant women and in children, macrolides and trimethoprim-sulfamethoxazole (Bactrim) are preferred.47,48
Treatment of chronic Q fever, in particular endocarditis, warrants more intensive therapy. A retrospective review of treated cases of endocarditis suggested that monotherapy with doxycycline often failed, and combination therapy with hydroxychloroquine has been advocated based on in vivo and in vitro experience.49
PREVENTING LONG-TERM SEQUELAE OF CHRONIC Q FEVER
5. At this point, what is the next step in the management of this patient?
- No further follow-up is indicated
- Transthoracic echocardiography (TTE)
- Repeat Q fever serologic testing in 3 to 6 months
- Whole-blood PCR testing and transesophageal echocardiography (TEE)
Long-term follow-up of patients with Q fever has been advocated to monitor for the development of chronic Q fever, but recent studies question the previously devised algorithms.50
The data the algorithms were based on suggested that preexisting valvular heart disease could be associated with up to a 39% risk of endocarditis, and a two-step approach was devised to prevent and identify early chronic infection.51,52 Patients with Q fever would undergo TTE at baseline, and if the findings were abnormal (including mild regurgitation), then 12 months of prophylactic treatment with hydroxychloroquine and doxycycline was recommended. If TTE was normal, serial serologic testing every 3 months was recommended. If the anti-phase I IgG titer was greater than 1:800 at any point, TEE and a whole-blood PCR assay were recommended to evaluate for endocarditis.51
These recommendations were based on data from the French National Reference Center and had not been prospectively evaluated. The 2007–2008 Dutch outbreak provided a large cohort of Q fever cases. After initial screening with TTE and serologic follow-up, 59% of patients were noted to have mild valvular abnormalities, and many had phase I IgG levels greater than 1:800 during follow-up despite being clinically free of disease. The Dutch subsequently stopped screening with TTE as part of routine follow-up and elected to follow patients clinically.
Similar findings have been noted from case follow-up in France and Taiwan, also supporting using serologic cutoffs alone in determining the need for evaluation (with TEE) or treatment of chronic disease.53,54 The usefulness of serologic testing every 3 months has also been questioned, and some have advocated extending the interval, especially since less emphasis is being placed on the results in favor of more practical clinical follow-up.39
One such clinical approach at follow-up is presented in Figure 1. TTE should be reserved for patients with known valvular disease or a clear murmur. Those with underlying valvular disease and acute Q fever should be managed on an individual basis by a specialist in infectious disease, and antibiotic prophylaxis should be considered. Patients without underlying disease should have regular follow-up examinations and serologic testing every 6 months, and clinical symptoms should guide further testing (eg, with TEE and PCR testing) for chronic disease.
In this patient, phase I and II antibody titers were notably elevated (in TABLE 2, phase I titers > 1:800 and 1:1600 cutoffs). Such high titers have been common in military cases from Iraq and Afghanistan, and to date no cases of endocarditis have been diagnosed despite close follow-up. Most cases in military personnel are in relatively young patients who lack risk factors for endocarditis. Based on emerging data from large overseas outbreaks and the potential toxicity of intensive preemptive dual-antimicrobial therapy, an approach of close follow-up was taken.
PRIMARY PREVENTION OF Q FEVER
Prevention of Q fever remains a challenge, as the organism is highly persistent in the environment. An effective licensed vaccine exists in Australia under the brand name Q-Vax, but no approved vaccine is currently available in the United States.55
THE PATIENT’S COURSE
The patient returned for follow-up about 1 year after his first presentation. He noted some ongoing fatigue but attributed this to his course work, and he said he otherwise felt well. He exercises regularly, with no shortness of breath, fevers, chills, or weight loss. He continued to have elevated Q fever titers. Because he had no symptoms, no heart murmur, and normal inflammatory markers, he had no further workup and continued to be followed with serial serologic testing and examinations.
- Defense Science Board Task Force on Deployment of Members of the National Guard and Reserve in the Global War on Terrorism. Washington, DC. September 2007.
- Sanders JW, Putnam SD, Frankart C, et al. Impact of illness and non-combat injury during Operations Iraqi Freedom and Enduring Freedom (Afghanistan). Am J Trop Med Hyg 2005; 73:713–719.
- Gleeson TD, Decker CF, Johnson MD, Hartzell JD, Mascola JR. Q fever in US military returning from Iraq. Am J Med 2007; 120:e11–e12.
- Hagan JE, Marcos LA, Steinberg TH. Fever in a soldier returned from Afghanistan. J Travel Med 2010; 17:351–352.
- Aronson NE, Sanders JW, Moran KA. In harm’s way: infections in deployed American military forces. Clin Infect Dis 2006; 43:1045–1051.
- Klein TA, Pacha LA, Lee HC, et al. Plasmodium vivax malaria among U.S. forces Korea in the Republic of Korea, 1993–2007. Mil Med 2009; 174:412–418.
- Ciminera P, Brundage J. Malaria in U.S. military forces: a description of deployment exposures from 2003 through 2005. Am J Trop Med Hyg 2007; 76:275–279.
- Lesho EP, Wortmann G, Neafie R, Aronson N. Nonhealing skin lesions in a sailor and a journalist returning from Iraq. Cleve Clin J Med 2005; 72:93–96,
- Myles O, Wortmann GW, Cummings JF, et al. Visceral leishmaniasis: clinical observations in 4 US army soldiers deployed to Afghanistan or Iraq, 2002–2004. Arch Intern Med 2007; 167:1899–1901.
- Faix DJ, Harrison DJ, Riddle MS, et al. Outbreak of Q fever among US military in western Iraq, June–July 2005. Clin Infect Dis 2008; 46:e65–e68.
- Leung-Shea C, Danaher PJ. Q fever in members of the United States armed forces returning from Iraq. Clin Infect Dis 2006; 43:e77–e82.
- Anderson AD, Smoak B, Shuping E, Ockenhouse C, Petruccelli B. Q fever and the US military. Emerg Infect Dis 2005; 11:1320–1322.
- Anderson AD, Baker TR, Littrell AC, Mott RL, Niebuhr DW, Smoak BL. Seroepidemiologic survey for Coxiella burnetii among hospitalized US troops deployed to Iraq. Zoonoses Public Health 2011; 58:276–283.
- Ake JA, Massung RF, Whitman TJ, Gleeson TD. Difficulties in the diagnosis and management of a US servicemember presenting with possible chronic Q fever. J Infect 2010; 60:175–177.
- Centers for Disease Control and Prevention (CDC). Potential for Q fever infection among travelers returning from Iraq and the Netherlands http://www.bt.cdc.gov/HAN/han00313.asp. Accessed July 5, 2012.
- Parker NR, Barralet JH, Bell AM. Q fever. Lancet 2006; 367:679–688.
- Miceli MH, Veryser AK, Anderson AD, Hofinger D, Lee SA, Tancik C. A case of person-to-person transmission of Q fever from an active duty serviceman to his spouse. Vector Borne Zoonotic Dis 2010; 10:539–541.
- Milazzo A, Hall R, Storm PA, Harris RJ, Winslow W, Marmion BP. Sexually transmitted Q fever. Clin Infect Dis 2001; 33:399–402.
- Hartzell JD, Peng SW, Wood-Morris RN, et al. Atypical Q fever in US soldiers. Emerg Infect Dis 2007; 13:1247–1249.
- Bossi P, Tegnell A, Baka A, et al; Task Force on Biological and Chemical Agent Threats, Public Health Directorate, European Commission, Luxembourg. Bichat guidelines for the clinical management of Q fever and bioterrorism-related Q fever. Euro Surveill 2004; 9:E19–E20.
- Roest HI, Tilburg JJ, van der Hoek W, et al. The Q fever epidemic in The Netherlands: history, onset, response and reflection. Epidemiol Infect 2011; 139:1–12.
- Anderson AD, Kruszon-Moran D, Loftis AD, et al. Seroprevalence of Q fever in the United States, 2003–2004. Am J Trop Med Hyg 2009; 81:691–694.
- Hatchette TF, Marrie TJ. Atypical manifestations of chronic Q fever. Clin Infect Dis 2001; 33:1347–1351.
- Bernit E, Pouget J, Janbon F, et al. Neurological involvement in acute Q fever: a report of 29 cases and review of the literature. Arch Intern Med 2002; 162:693–700.
- Kofteridis DP, Mazokopakis EE, Tselentis Y, Gikas A. Neurological complications of acute Q fever infection. Eur J Epidemiol 2004; 19:1051–1054.
- Raoult D, Marrie T, Mege J. Natural history and pathophysiology of Q fever. Lancet Infect Dis 2005; 5:219–226.
- Kampschreur LM, Wegdam-Blans MC, Thijsen SF, et al. Acute Q fever related in-hospital mortality in the Netherlands. Neth J Med 2010; 68:408–413.
- Srivastava P, Dayama A, Mehrotra S, Sundar S. Diagnosis of visceral leishmaniasis. Trans R Soc Trop Med Hyg 2011; 105:1–6.
- Chappuis F, Rijal S, Soto A, Menten J, Boelaert M. A meta-analysis of the diagnostic performance of the direct agglutination test and rK39 dipstick for visceral leishmaniasis. BMJ 2006; 333:723.
- Hartzell JD, Aronson NE, Weina PJ, Howard RS, Yadava A, Wortmann GW. Positive rK39 serologic assay results in US servicemen with cutaneous leishmaniasis. Am J Trop Med Hyg 2008; 79:843–846.
- Pappas G, Akritidis N, Bosilkovski M, Tsianos E. Brucellosis. N Engl J Med 2005; 352:2325–2336.
- Schneeberger PM, Hermans MH, van Hannen EJ, Schellekens JJ, Leenders AC, Wever PC. Real-time PCR with serum samples is indispensable for early diagnosis of acute Q fever. Clin Vaccine Immunol 2010; 17:286–290.
- Hamilton LR, George DL, Scoville SL, Hospenthal DR, Griffith ME. PCR for rapid diagnosis of acute Q fever at a combat support hospital in Iraq. Mil Med 2011; 176:103–105.
- Bonilla MF, Kaul DR, Saint S, Isada CM, Brotman DJ. Clinical problem-solving. Ring around the diagnosis. N Engl J Med 2006; 354:1937–1942.
- Fournier PE, Marrie TJ, Raoult D. Diagnosis of Q fever. J Clin Microbiol 1998; 36:1823–1834.
- Healy B, van Woerden H, Raoult D, et al. Chronic Q fever: different serological results in three countries—results of a follow-up study 6 years after a point source outbreak. Clin Infect Dis 2011; 52:1013–1019.
- Dupont HT, Thirion X, Raoult D. Q fever serology: cutoff determination for microimmunofluorescence. Clin Diagn Lab Immunol 1994; 1:189–196.
- Karakousis PC, Trucksis M, Dumler JS. Chronic Q fever in the United States. J Clin Microbiol 2006; 44:2283–2287.
- van der Hoek W, Versteeg B, Meekelenkamp JC, et al. Follow-up of 686 patients with acute Q fever and detection of chronic infection. Clin Infect Dis 2011; 52:1431–1436.
- Fenollar F, Fournier PE, Carrieri MP, Habib G, Messana T, Raoult D. Risks factors and prevention of Q fever endocarditis. Clin Infect Dis 2001; 33:312–316.
- Frankel D, Richet H, Renvoisé A, Raoult D. Q fever in France, 1985–2009. Emerg Infect Dis 2011; 17:350–356.
- Baddour LM, Wilson WR, Bayer AS, et al; Committee on Rheumatic Fever, Endocarditis, and Kawasaki Disease; Council on Cardiovascular Disease in the Young; Councils on Clinical Cardiology, Stroke, and Cardiovascular Surgery and Anesthesia; American Heart Association; Infectious Diseases Society of America. Infective endocarditis: diagnosis, antimicrobial therapy, and management of complications: a statement for healthcare professionals from the Committee on Rheumatic Fever, Endocarditis, and Kawasaki Disease, Council on Cardiovascular Disease in the Young, and the Councils on Clinical Cardiology, Stroke, and Cardiovascular Surgery and Anesthesia, American Heart Association: endorsed by the Infectious Diseases Society of America. Circulation 2005; 111:e394–e434.
- Wildman MJ, Smith EG, Groves J, Beattie JM, Caul EO, Ayres JG. Chronic fatigue following infection by Coxiella burnetii (Q fever): ten-year follow-up of the 1989 UK outbreak cohort. QJM 2002; 95:527–538.
- Iwakami E, Arashima Y, Kato K, et al. Treatment of chronic fatigue syndrome with antibiotics: pilot study assessing the involvement of Coxiella burnetii infection. Intern Med 2005; 44:1258–1263.
- Rolain JM, Maurin M, Raoult D. Bacteriostatic and bactericidal activities of moxifloxacin against Coxiella burnetii. Antimicrob Agents Chemother 2001; 45:301–302.
- Dijkstra F, Riphagen-Dalhuisen J, Wijers N, et al. Antibiotic therapy for acute Q fever in The Netherlands in 2007 and 2008 and its relation to hospitalization. Epidemiol Infect 2011; 139:1332–1341.
- Raoult D. Use of macrolides for Q fever. Antimicrob Agents Chemother 2003; 47:446.
- Carcopino X, Raoult D, Bretelle F, Boubli L, Stein A. Managing Q fever during pregnancy: the benefits of long-term cotrimoxazole therapy. Clin Infect Dis 2007; 45:548–555.
- Raoult D, Houpikian P, Tissot Dupont H, Riss JM, Arditi-Djiane J, Brouqui P. Treatment of Q fever endocarditis: comparison of 2 regimens containing doxycycline and ofloxacin or hydroxychloroquine. Arch Intern Med 1999; 159:167–173.
- Healy B, Llewelyn M, Westmoreland D, Lloyd G, Brown N. The value of follow-up after acute Q fever infection. J Infect 2006; 52:e109–e112.
- Landais C, Fenollar F, Thuny F, Raoult D. From acute Q fever to endocarditis: serological follow-up strategy. Clin Infect Dis 2007; 44:1337–1340.
- Hartzell JD, Wood-Morris RN, Martinez LJ, Trotta RF. Q fever: epidemiology, diagnosis, and treatment. Mayo Clin Proc 2008; 83:574–579.
- Hung MN, Lin LJ, Hou MY, et al. Serologic assessment of the risk of developing chronic Q fever in cohorts of acutely infected individuals. J Infect 2011; 62:39–44.
- Sunder S, Gras G, Bastides F, De Gialluly C, Choutet P, Bernard L. Chronic Q fever: relevance of serology. Clin Infect Dis 2011; 53:749–750.
- Gefenaite G, Munster JM, van Houdt R, Hak E. Effectiveness of the Q fever vaccine: a meta-analysis. Vaccine 2011; 29:395–398.
Flashing lights, floaters, and reduced vision
A 62-year-old woman has had flashing lights and floaters in her left eye with progressive loss of vision over the past month. She has not had recent trauma. She does not smoke.
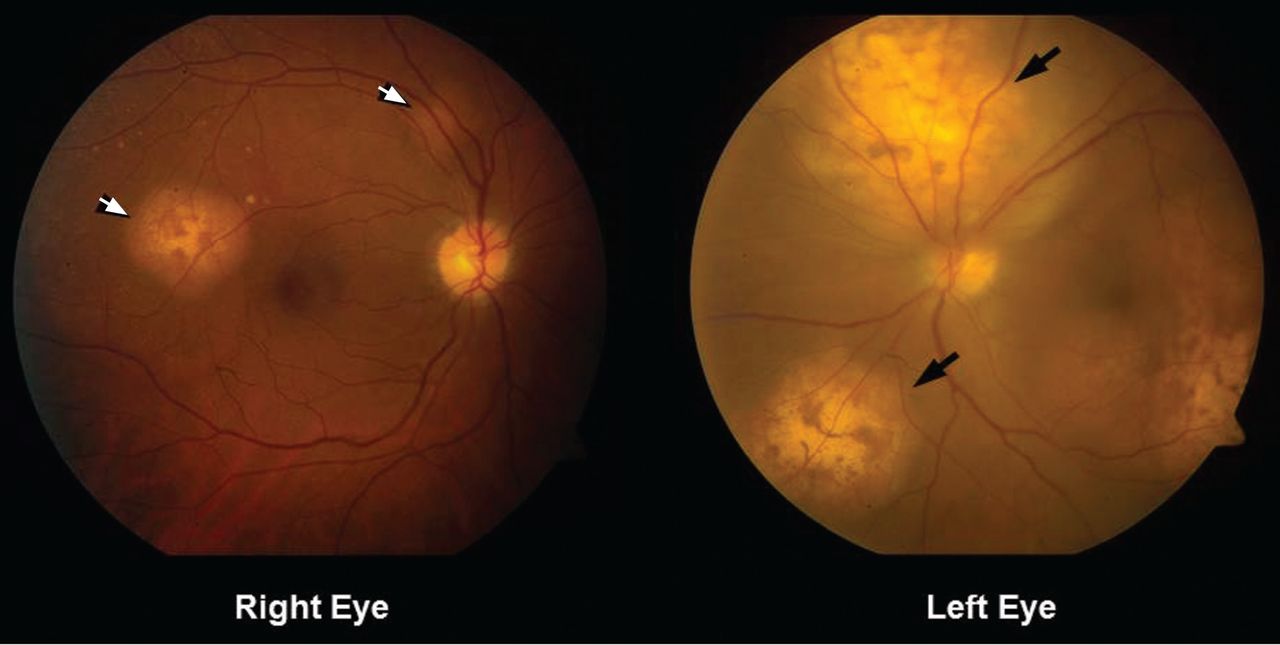
She was referred for an ophthalmologic evaluation. Her visual acuity was 20/20 in the right eye, but she could only count fingers with the left. The anterior segment appeared normal in both eyes. Funduscopic examination of the left eye revealed numerous lobulated, yellowish, choroidal lesions in the posterior pole with overlying subretinal fluid. The lesions involved the fovea, accounting for the poor visual acuity. There were two similar but smaller lesions in the right eye (Figure 1). Ultrasonography confirmed the choroidal location of the lesions (Figure 2).
Q: Which is the most likely diagnosis?
- Retinal detachment
- Choroidal melanoma
- Uveitis
- Uveal metastatic tumor
A: Uveal metastatic tumor is the correct diagnosis. Funduscopic findings of bilateral yellow choroidal lesions are consistent with metastatic cancer.
The patient was admitted to the hospital for a thorough evaluation. Computed tomography of the chest showed a 2.1-by-4.5-cm mass in the lower lobe of the left lung, highly suspicious for malignancy and associated with left hilar lymphadenopathy and right acute pulmonary embolism. Bronchoscopy showed an endobronchial tumor completely occluding the left lower lobe and the lingular orifices.
Pathologic specimens from the endobronchial tumor confirmed adenocarcinoma, consistent with a primary lung cancer.
THE OTHER DIAGNOSTIC CHOICES
Detachment or separation of the retina from the underlying pigment epithelium is one of the most commonly encountered eye emergencies.1 It requires urgent attention, since delay in treatment can cause permanent vision loss.
Retinal detachment differs from uveal metastatic tumor in that it presents and progresses rapidly. The common signs and symptoms are floaters in the center of the visual axis, a sensation of flashing lights (related to retinal traction), and, eventually, loss of vision. The detachment most often represents a break or tear (rhegmatogenous retinal detachment), but it is also a common sequela of neglected diabetic retinopathy. Exudative retinal detachment is usually secondary to uveal inflammation or a uveal tumor.
Choroidal melanoma, the most common primary intraocular malignancy, arises from melanocytes within the choroid. In most cases, it develops from preexisting melanocytic nevi.2 It may present as blurred vision, a paracentral scotoma, painless and progressive visual field loss, and floaters. Choroidal melanoma is usually pigmented (dark brown) and is invariably unilateral.
Uveitis is an inflammation of the uveal tract, which includes the iris, ciliary body, and choroid. It is classified as anterior, intermediate, or posterior uveitis or as panuveitis.3
Although flashing lights, floaters, and reduced vision can occur in uveitis, its other important presenting symptoms (ie, pain, redness, and photophobia) were absent in this patient. The absence of anterior chamber cells and corneal inflammatory deposits (keratic precipitates) also made uveitis less likely.4 However, granulomatous uveitis such as sarcoidosis can present as nodular thickening of the uvea, mimicking an intraocular tumor.5
THE MOST COMMON INTRAOCULAR MALIGNANCY
Uveal metastasis is the most common intraocular malignancy6 and is found on autopsy in up to 12% of people who die of cancer; it involves both eyes in 4.4% of cases. Multiple metastases are seen in one eye in up to 20% of cases.7
The tumors are most often in the choroid, probably because of its extensive blood supply. Breast cancer (in women) and lung cancer (in men) are the most common cancers with uveal metastasis.8 Uveal metastasis from cancers of the prostate, kidney, thyroid, and gastrointestinal tract and from lymphoma and leukemia is less common.8
Patients with choroidal metastasis can see flashing lights, floating spots, and distortion of their vision. In such patients, a careful history and physical examination can uncover signs and symptoms of the hidden cancer, especially of lung cancer.9
Once uveal metastasis is suspected, both eyes and orbits and the central nervous system should be examined, as this disease tends to present bilaterally and to involve the central nervous system.10 Uveal metastases respond to chemotherapy and radiotherapy, depending on the nature of the primary tumor. In general, treatment is based on the extent of the metastasis, prior treatments, and the patient’s overall functional status.
- Hatten B, Browne V. Retinal detachment. Emerg Med J 2011; 28:83.
- Factors predictive of growth and treatment of small choroidal melanoma: COMS Report No. 5. The Collaborative Ocular Melanoma Study Group. Arch Ophthalmol 1997; 115:1537–1544.
- Jabs DA, Nussenblatt RB, Rosenbaum JT; Standardization of Uveitis Nomenclature (SUN) Working Group. Standardization of uveitis nomenclature for reporting clinical data. Results of the First International Workshop. Am J Ophthalmol 2005; 140:509–516.
- Wertheim MS, Mathers WD, Planck SJ, et al. In vivo confocal microscopy of keratic precipitates. Arch Ophthalmol 2004; 122:1773–1781.
- Desai UR, Tawansy KA, Joondeph BC, Schiffman RM. Choroidal granulomas in systemic sarcoidosis. Retina 2001; 21:40–47.
- Singh AD, Damato BE, Pe’er J, Murphree AL, Perry JD, eds. Uveal metastatic tumors. In: Clinical Ophthalmic Oncology. Philadelphia, PA: Saunders-Elsevier; 2007:322–327.
- Eliassi-Rad B, Albert DM, Green WR. Frequency of ocular metastases in patients dying of cancer in eye bank populations. Br J Ophthalmol 1996; 80:125–128.
- Shields CL, Shields JA, Gross NE, Schwartz GP, Lally SE. Survey of 520 eyes with uveal metastases. Ophthalmology 1997; 104:1265–1276.
- Herrag M, Lahmiti S, Yazidi AA, Le Lez ML, Diot P. Choroidal metastasis revealing a lung adenocarcinoma. Ann Thorac Surg 2010; 89:1013–1014.
- Kanthan GL, Jayamohan J, Yip D, Conway RM. Management of metastatic carcinoma of the uveal tract: an evidence-based analysis. Clin Exp Ophthalmol 2007; 35:553–565.
A 62-year-old woman has had flashing lights and floaters in her left eye with progressive loss of vision over the past month. She has not had recent trauma. She does not smoke.
She was referred for an ophthalmologic evaluation. Her visual acuity was 20/20 in the right eye, but she could only count fingers with the left. The anterior segment appeared normal in both eyes. Funduscopic examination of the left eye revealed numerous lobulated, yellowish, choroidal lesions in the posterior pole with overlying subretinal fluid. The lesions involved the fovea, accounting for the poor visual acuity. There were two similar but smaller lesions in the right eye (Figure 1). Ultrasonography confirmed the choroidal location of the lesions (Figure 2).
Q: Which is the most likely diagnosis?
- Retinal detachment
- Choroidal melanoma
- Uveitis
- Uveal metastatic tumor
A: Uveal metastatic tumor is the correct diagnosis. Funduscopic findings of bilateral yellow choroidal lesions are consistent with metastatic cancer.
The patient was admitted to the hospital for a thorough evaluation. Computed tomography of the chest showed a 2.1-by-4.5-cm mass in the lower lobe of the left lung, highly suspicious for malignancy and associated with left hilar lymphadenopathy and right acute pulmonary embolism. Bronchoscopy showed an endobronchial tumor completely occluding the left lower lobe and the lingular orifices.
Pathologic specimens from the endobronchial tumor confirmed adenocarcinoma, consistent with a primary lung cancer.
THE OTHER DIAGNOSTIC CHOICES
Detachment or separation of the retina from the underlying pigment epithelium is one of the most commonly encountered eye emergencies.1 It requires urgent attention, since delay in treatment can cause permanent vision loss.
Retinal detachment differs from uveal metastatic tumor in that it presents and progresses rapidly. The common signs and symptoms are floaters in the center of the visual axis, a sensation of flashing lights (related to retinal traction), and, eventually, loss of vision. The detachment most often represents a break or tear (rhegmatogenous retinal detachment), but it is also a common sequela of neglected diabetic retinopathy. Exudative retinal detachment is usually secondary to uveal inflammation or a uveal tumor.
Choroidal melanoma, the most common primary intraocular malignancy, arises from melanocytes within the choroid. In most cases, it develops from preexisting melanocytic nevi.2 It may present as blurred vision, a paracentral scotoma, painless and progressive visual field loss, and floaters. Choroidal melanoma is usually pigmented (dark brown) and is invariably unilateral.
Uveitis is an inflammation of the uveal tract, which includes the iris, ciliary body, and choroid. It is classified as anterior, intermediate, or posterior uveitis or as panuveitis.3
Although flashing lights, floaters, and reduced vision can occur in uveitis, its other important presenting symptoms (ie, pain, redness, and photophobia) were absent in this patient. The absence of anterior chamber cells and corneal inflammatory deposits (keratic precipitates) also made uveitis less likely.4 However, granulomatous uveitis such as sarcoidosis can present as nodular thickening of the uvea, mimicking an intraocular tumor.5
THE MOST COMMON INTRAOCULAR MALIGNANCY
Uveal metastasis is the most common intraocular malignancy6 and is found on autopsy in up to 12% of people who die of cancer; it involves both eyes in 4.4% of cases. Multiple metastases are seen in one eye in up to 20% of cases.7
The tumors are most often in the choroid, probably because of its extensive blood supply. Breast cancer (in women) and lung cancer (in men) are the most common cancers with uveal metastasis.8 Uveal metastasis from cancers of the prostate, kidney, thyroid, and gastrointestinal tract and from lymphoma and leukemia is less common.8
Patients with choroidal metastasis can see flashing lights, floating spots, and distortion of their vision. In such patients, a careful history and physical examination can uncover signs and symptoms of the hidden cancer, especially of lung cancer.9
Once uveal metastasis is suspected, both eyes and orbits and the central nervous system should be examined, as this disease tends to present bilaterally and to involve the central nervous system.10 Uveal metastases respond to chemotherapy and radiotherapy, depending on the nature of the primary tumor. In general, treatment is based on the extent of the metastasis, prior treatments, and the patient’s overall functional status.
- Hatten B, Browne V. Retinal detachment. Emerg Med J 2011; 28:83.
- Factors predictive of growth and treatment of small choroidal melanoma: COMS Report No. 5. The Collaborative Ocular Melanoma Study Group. Arch Ophthalmol 1997; 115:1537–1544.
- Jabs DA, Nussenblatt RB, Rosenbaum JT; Standardization of Uveitis Nomenclature (SUN) Working Group. Standardization of uveitis nomenclature for reporting clinical data. Results of the First International Workshop. Am J Ophthalmol 2005; 140:509–516.
- Wertheim MS, Mathers WD, Planck SJ, et al. In vivo confocal microscopy of keratic precipitates. Arch Ophthalmol 2004; 122:1773–1781.
- Desai UR, Tawansy KA, Joondeph BC, Schiffman RM. Choroidal granulomas in systemic sarcoidosis. Retina 2001; 21:40–47.
- Singh AD, Damato BE, Pe’er J, Murphree AL, Perry JD, eds. Uveal metastatic tumors. In: Clinical Ophthalmic Oncology. Philadelphia, PA: Saunders-Elsevier; 2007:322–327.
- Eliassi-Rad B, Albert DM, Green WR. Frequency of ocular metastases in patients dying of cancer in eye bank populations. Br J Ophthalmol 1996; 80:125–128.
- Shields CL, Shields JA, Gross NE, Schwartz GP, Lally SE. Survey of 520 eyes with uveal metastases. Ophthalmology 1997; 104:1265–1276.
- Herrag M, Lahmiti S, Yazidi AA, Le Lez ML, Diot P. Choroidal metastasis revealing a lung adenocarcinoma. Ann Thorac Surg 2010; 89:1013–1014.
- Kanthan GL, Jayamohan J, Yip D, Conway RM. Management of metastatic carcinoma of the uveal tract: an evidence-based analysis. Clin Exp Ophthalmol 2007; 35:553–565.
The apples and oranges of cost-effectiveness: A rejoinder
Health care delivery is perennially resource-constrained, perhaps never more so than in these times of severe economic distress. Yet the introduction of new medical technologies and therapies (some of dubious benefit) continues unabated. Consequently, the search for how best to deploy limited health care resources continues to engender much interest.
In that light, the recent commentary on cost-effectiveness studies by Dr. Vinay Prasad in the June 2012 of this journal,1 which attempted to highlight some of the pitfalls of such studies, is commendable. Unfortunately, the comments, which largely focused on the methodology of cost-effectiveness studies, end up merely as a straw man debate. To the less well-informed reader, the commentary might appear as an indictment of cost-effectiveness research.
It is thus crucial to correct those potentially misleading comments and to point out that recommendations for the proper conduct of cost-effectiveness studies were published as far back as 1996 by the Panel on Cost-effectiveness in Health and Medicine.2 This panel was convened by the US Public Health Service and included members with demonstrated expertise in cost-effectiveness analysis, clinical medicine, ethics, and health outcomes measurement. The recommendations addressed all the issues raised in the commentary and more, and are well worth a read, as they enable readers to understand how to conduct these studies, how to judge the quality of these studies, and how the findings might be applied.2 Nonetheless, it is worthwhile to address the logical inaccuracies in the specific examples in the commentary.
IF A TREATMENT IS INEFFECTIVE, IT IS COST-INEFFECTIVE TOO
First, the author discusses the case of vertebroplasty for osteoporotic vertebral fractures. Vertebroplasty had previously been estimated to be cost-effective relative to 12 months of medical therapy. However, a subsequent clinical study found it was no better than a sham procedure, thus setting up the uncomfortable possibility that a sham procedure is more cost-effective than both vertebroplasty and medical therapy.
This can hardly be blamed on the earlier cost-effectiveness study. If any given therapy does not effectively achieve the desired outcomes for the condition for which it is being used, then that therapy ought not to be used at all for that condition. In that context, a cost-effectiveness study is rendered moot in the first place, as the therapy of interest is not effective. Using a more broadly related example, why would anyone conduct a cost-effectiveness study of antibiotics for the treatment of the common cold? Indeed, the vertebroplasty example merely highlights the limitations of the original clinical studies that erroneously deemed it effective for osteoporotic vertebral fractures.
The possibility that a sham procedure might be more cost-effective than vertebroplasty or medical intervention is unsettling to the extent that one has a pro-intervention bias for all diseases. Perhaps the lesson may be that none of the current therapies for this condition is useful, and that until there is a truly beneficial therapy, patients may best be served by doing nothing. To paraphrase one of the author’s rather obvious recommendations, knowing that a therapy is efficacious (toward achieving our desired end point, whatever that may be) should be a prerequisite to adopting it into clinical practice, let alone determining its cost-effectiveness.
Furthermore, cost-effectiveness studies by their nature cannot and should not be static but need to be adjusted over time. For all analyses, it is anticipated that future amendments will be required to adjust for changes in effectiveness (including the disproving of efficacy), changes in relevant strategies available, changes in cost, and changes in population parameters.
WE ALL DIE EVENTUALLY
Secondly, using the example of exemestane (Aromasin) for primary prevention of breast cancer in postmenopausal women, the author raises issues about how to determine the net benefit of preventive therapies in terms of deaths avoided or life-years gained. The particular concern relates to what extent the benefit of deaths avoided by exemestane is negated by deaths that are caused by other non-breast-cancer-related diseases. This implies that using exemestane to prevent death by breast cancer is possibly useless, as those women would go on to die of other causes eventually.
But is that not the case for every preventive or therapeutic intervention? Curing bacterial pneumonia with antibiotics surely saves patients who nonetheless will eventually die some day from another cause. Does this make the use of antibiotics for bacterial pneumonia cost-ineffective? No. The point is that life ultimately ends in death, but along the spectrum of life we utilize various interventions to prolong life and improve its quality as long as is meaningfully possible—either by preventing some diseases or by treating others.
Thus, the implicit assumption ab initio is that prevention or treatment of any particular disease is intrinsically a desirable proposition on its own merits and deserving of some expense of resources. As such, for any given disease, the cost-effectiveness of preventive or therapeutic measures must necessarily be confined to deaths avoided and life-years gained (or other such suitable measures) that are directly attributable to that disease process or to side effects of the particular therapy. Attempting to expand beyond that measure would lead to absurdities such that no intervention would ever be cost-effective because we all eventually die.
REAL-WORLD DATA TAKE YEARS
Finally, using the case of cyclooxygenase 2 inhibitors, the author raises the issue of sourcing data for cost-effectiveness studies.
There is some validity to this point regarding using only real-world experiential data versus data from randomized controlled clinical trials, as vastly different estimates of cost per unit of benefit can be found. However, strict adherence to this recommendation creates a dilemma: real-world data take years to accumulate after an intervention is approved for clinical use based on clinical trial data. But front-line clinicians and payers need to know whether the new intervention is worth adopting into daily clinical practice—particularly because new brand-name, patent-protected therapies generally cost much more early on than later, when patents expire and economies of scale induce drops in prices.
If high acquisition costs without supporting cost-effectiveness data preclude the adoption of the new therapy, then real-world experience cannot be accumulated. On the flip side, unfettered adoption would certainly consume significant resources that may turn out to have been wasted if, years later, real-world experience reveals that the effectiveness was significantly less than estimated by the clinical trial.
However, this is not a problem inherent in cost-effectiveness studies, but rather a result of the uncertainties and difficulties involved in translating findings from clinical trials to the real world, where patients are not as closely monitored to ensure proper compliance and to minimize side effects and uncontrolled interactions. Health economists are well aware of this problem of uncertainty and other limitations of randomized controlled trials.
These limitations have precipitated the development of decision analytic modeling for economic evaluation. This research method is now highly sophisticated and widely accepted as the gold standard. Decision analytic modeling allows data from a trial to be extrapolated beyond the trial period, intermediate clinical outcomes to be linked to final outcomes, clinical trial results to be generalized to other settings, head-to-head comparisons of interventions to be made where relevant clinical trial data do not exist, and economic evaluations to be performed for trials in which economic outcomes were not collected.3
Furthermore, decision analytic modeling in part exists to overcome the data issues raised by the commentary. By using probabilistic sensitivity analyses to account for uncertainties and assure robustness of the results, the reliability of the results is enhanced, regardless of the source of data. In fact, with today’s more powerful computers and software and the limited financial resources available for large randomized controlled clinical trials, the use of economic modeling continues to grow as an indispensable means of economic evaluation.
AN INDISPENSABLE TOOL
In conclusion, properly conducted cost-effectiveness studies are an increasingly important and indispensable tool as we strive to improve the efficiency and effectiveness of health care delivery, particularly in this time of health system changes, the aging of the population, and increasingly limited budgets. Economic modeling allows researchers to explore different scenarios, overcome many of the limitations of clinical trials, identify thresholds at which estimated cost-effectiveness ratios may change, and provide valuable information to health policy makers, providers, and patients to guide the efficient allocation and utilization of health care resources.
- Prasad V. The apples and oranges of cost-effectiveness. Cleve Clin J Med 2012; 79:377–379.
- Weinstien MC, Siegel JE, Gold MR, Kamlet MS, Russell LB. Recommendations of the Panel on Cost-Effectiveness in Health and Medicine. JAMA 1996; 276:1253–1258.
- Buxton MJ, Drummond MF, Van Hout BA, et al. Modelling in economic evaluation: an unavoidable fact of life. Health Econ 1997; 6:217–227.
Health care delivery is perennially resource-constrained, perhaps never more so than in these times of severe economic distress. Yet the introduction of new medical technologies and therapies (some of dubious benefit) continues unabated. Consequently, the search for how best to deploy limited health care resources continues to engender much interest.
In that light, the recent commentary on cost-effectiveness studies by Dr. Vinay Prasad in the June 2012 of this journal,1 which attempted to highlight some of the pitfalls of such studies, is commendable. Unfortunately, the comments, which largely focused on the methodology of cost-effectiveness studies, end up merely as a straw man debate. To the less well-informed reader, the commentary might appear as an indictment of cost-effectiveness research.
It is thus crucial to correct those potentially misleading comments and to point out that recommendations for the proper conduct of cost-effectiveness studies were published as far back as 1996 by the Panel on Cost-effectiveness in Health and Medicine.2 This panel was convened by the US Public Health Service and included members with demonstrated expertise in cost-effectiveness analysis, clinical medicine, ethics, and health outcomes measurement. The recommendations addressed all the issues raised in the commentary and more, and are well worth a read, as they enable readers to understand how to conduct these studies, how to judge the quality of these studies, and how the findings might be applied.2 Nonetheless, it is worthwhile to address the logical inaccuracies in the specific examples in the commentary.
IF A TREATMENT IS INEFFECTIVE, IT IS COST-INEFFECTIVE TOO
First, the author discusses the case of vertebroplasty for osteoporotic vertebral fractures. Vertebroplasty had previously been estimated to be cost-effective relative to 12 months of medical therapy. However, a subsequent clinical study found it was no better than a sham procedure, thus setting up the uncomfortable possibility that a sham procedure is more cost-effective than both vertebroplasty and medical therapy.
This can hardly be blamed on the earlier cost-effectiveness study. If any given therapy does not effectively achieve the desired outcomes for the condition for which it is being used, then that therapy ought not to be used at all for that condition. In that context, a cost-effectiveness study is rendered moot in the first place, as the therapy of interest is not effective. Using a more broadly related example, why would anyone conduct a cost-effectiveness study of antibiotics for the treatment of the common cold? Indeed, the vertebroplasty example merely highlights the limitations of the original clinical studies that erroneously deemed it effective for osteoporotic vertebral fractures.
The possibility that a sham procedure might be more cost-effective than vertebroplasty or medical intervention is unsettling to the extent that one has a pro-intervention bias for all diseases. Perhaps the lesson may be that none of the current therapies for this condition is useful, and that until there is a truly beneficial therapy, patients may best be served by doing nothing. To paraphrase one of the author’s rather obvious recommendations, knowing that a therapy is efficacious (toward achieving our desired end point, whatever that may be) should be a prerequisite to adopting it into clinical practice, let alone determining its cost-effectiveness.
Furthermore, cost-effectiveness studies by their nature cannot and should not be static but need to be adjusted over time. For all analyses, it is anticipated that future amendments will be required to adjust for changes in effectiveness (including the disproving of efficacy), changes in relevant strategies available, changes in cost, and changes in population parameters.
WE ALL DIE EVENTUALLY
Secondly, using the example of exemestane (Aromasin) for primary prevention of breast cancer in postmenopausal women, the author raises issues about how to determine the net benefit of preventive therapies in terms of deaths avoided or life-years gained. The particular concern relates to what extent the benefit of deaths avoided by exemestane is negated by deaths that are caused by other non-breast-cancer-related diseases. This implies that using exemestane to prevent death by breast cancer is possibly useless, as those women would go on to die of other causes eventually.
But is that not the case for every preventive or therapeutic intervention? Curing bacterial pneumonia with antibiotics surely saves patients who nonetheless will eventually die some day from another cause. Does this make the use of antibiotics for bacterial pneumonia cost-ineffective? No. The point is that life ultimately ends in death, but along the spectrum of life we utilize various interventions to prolong life and improve its quality as long as is meaningfully possible—either by preventing some diseases or by treating others.
Thus, the implicit assumption ab initio is that prevention or treatment of any particular disease is intrinsically a desirable proposition on its own merits and deserving of some expense of resources. As such, for any given disease, the cost-effectiveness of preventive or therapeutic measures must necessarily be confined to deaths avoided and life-years gained (or other such suitable measures) that are directly attributable to that disease process or to side effects of the particular therapy. Attempting to expand beyond that measure would lead to absurdities such that no intervention would ever be cost-effective because we all eventually die.
REAL-WORLD DATA TAKE YEARS
Finally, using the case of cyclooxygenase 2 inhibitors, the author raises the issue of sourcing data for cost-effectiveness studies.
There is some validity to this point regarding using only real-world experiential data versus data from randomized controlled clinical trials, as vastly different estimates of cost per unit of benefit can be found. However, strict adherence to this recommendation creates a dilemma: real-world data take years to accumulate after an intervention is approved for clinical use based on clinical trial data. But front-line clinicians and payers need to know whether the new intervention is worth adopting into daily clinical practice—particularly because new brand-name, patent-protected therapies generally cost much more early on than later, when patents expire and economies of scale induce drops in prices.
If high acquisition costs without supporting cost-effectiveness data preclude the adoption of the new therapy, then real-world experience cannot be accumulated. On the flip side, unfettered adoption would certainly consume significant resources that may turn out to have been wasted if, years later, real-world experience reveals that the effectiveness was significantly less than estimated by the clinical trial.
However, this is not a problem inherent in cost-effectiveness studies, but rather a result of the uncertainties and difficulties involved in translating findings from clinical trials to the real world, where patients are not as closely monitored to ensure proper compliance and to minimize side effects and uncontrolled interactions. Health economists are well aware of this problem of uncertainty and other limitations of randomized controlled trials.
These limitations have precipitated the development of decision analytic modeling for economic evaluation. This research method is now highly sophisticated and widely accepted as the gold standard. Decision analytic modeling allows data from a trial to be extrapolated beyond the trial period, intermediate clinical outcomes to be linked to final outcomes, clinical trial results to be generalized to other settings, head-to-head comparisons of interventions to be made where relevant clinical trial data do not exist, and economic evaluations to be performed for trials in which economic outcomes were not collected.3
Furthermore, decision analytic modeling in part exists to overcome the data issues raised by the commentary. By using probabilistic sensitivity analyses to account for uncertainties and assure robustness of the results, the reliability of the results is enhanced, regardless of the source of data. In fact, with today’s more powerful computers and software and the limited financial resources available for large randomized controlled clinical trials, the use of economic modeling continues to grow as an indispensable means of economic evaluation.
AN INDISPENSABLE TOOL
In conclusion, properly conducted cost-effectiveness studies are an increasingly important and indispensable tool as we strive to improve the efficiency and effectiveness of health care delivery, particularly in this time of health system changes, the aging of the population, and increasingly limited budgets. Economic modeling allows researchers to explore different scenarios, overcome many of the limitations of clinical trials, identify thresholds at which estimated cost-effectiveness ratios may change, and provide valuable information to health policy makers, providers, and patients to guide the efficient allocation and utilization of health care resources.
- Prasad V. The apples and oranges of cost-effectiveness. Cleve Clin J Med 2012; 79:377–379.
- Weinstien MC, Siegel JE, Gold MR, Kamlet MS, Russell LB. Recommendations of the Panel on Cost-Effectiveness in Health and Medicine. JAMA 1996; 276:1253–1258.
- Buxton MJ, Drummond MF, Van Hout BA, et al. Modelling in economic evaluation: an unavoidable fact of life. Health Econ 1997; 6:217–227.
The conundrum of cost-effectiveness
Drs. Udeh and Udeh attempt to highlight the “straw man” nature of my argument and the inaccuracies of my piece, but they ultimately disprove none of my claims.
Regarding vertebroplasty—a procedure that never worked better than a sham one—the authors do not fault the cost-effectiveness analysis for getting it wrong, but rather early clinical studies that provided false confidence. Yet, as a matter of fact, both were wrong. Cost-effectiveness analyses cannot be excused because they are based on faulty assumptions or poor data. This is precisely the reason they should be faulted. If incorrect cost-effectiveness analyses cannot be blamed because clinical data are flawed, can incorrect clinical research blame its shortcomings on promising preclinical data?
Cost-effectiveness analyses continue to be published regarding interventions that lack even a single randomized controlled trial showing efficacy, despite the authors’ assertion that no one would do that. Favorable cost profiles have been found for diverse, unproven interventions such as transarterial chemoembolization,1 surgical laminectomy,2 and rosiglitazone (Avandia).3 Udeh and Udeh hold an untenable position, arguing that such analyses are ridiculous and would not be performed (such as a study of antibiotics to treat the common cold), while dismissing counterexamples (vertebroplasty), contending they are moot. The fact is that flawed cost-effectiveness studies are performed. They are often in error, and they distort our discussions of funding and approval.
Regarding exemastane (Aromasin), the authors miss the distinction between disease-specific death and overall mortality. Often, therapies lower the death rate from a particular disease but do not increase the overall survival rate. Typically, in these situations, we attribute the discrepancy to a lack of power, but an alternative hypothesis is that some death rates (eg, from cancer) decrease, while others (eg, from cardiovascular disease) increase, resulting in no net benefit. My comment regarding primary prevention studies is that unless the overall mortality rate is improved, one may continue to wonder if this phenomenon—trading death—is occurring. As a result, cost-effective analyses performed on these data may reach false conclusions. The authors’ fatalistic interpretation of my comments is not what I intended and is much more like a straw man.
Lastly, some of the difficulties in reconciling costs from randomized trials and actual clinical practice would be improved if clinical trials included participants who were more like the patients who would ultimately use the therapy. Such pragmatic trials would be a boon to the validity of research science4 and the accuracy of cost-effectiveness studies. I doubt that decision analytic modeling alone can overcome the problems I highlight. Two decades ago, we learned—from cost-effectiveness studies of autologous bone marrow transplantation in breast cancer—that decision analysis could not overcome major deficits in evidence.5 Autologous bone marrow transplantation is cost-effective—well, assuming it works.
We need cost-effectiveness studies to help us prioritize among countless emerging medical practices. However, we also need those analyses to be accurate. The examples I highlighted show common ways we err. The two rules I propose in my original commentary6 are not obvious to all, and they continue to be ignored. As such, cost-effectiveness still resembles like apples and oranges.
- Whitney R, Vàlek V, Fages JF, et al. Transarterial chemoembolization and selective internal radiation for the treatment of patients with metastatic neuroendocrine tumors: a comparison of efficacy and cost. Oncologist 2011; 16:594–601.
- Burnett MG, Stein SC, Bartels RH. Cost-effectiveness of current treatment strategies for lumbar spinal stenosis: nonsurgical care, laminectomy, and X-STOP. J Neurosurg Spine 2010; 13:39–46.
- Beale S, Bagust A, Shearer AT, Martin A, Hulme L. Cost-effectiveness of rosiglitazone combination therapy for the treatment of type 2 diabetes mellitus in the UK. Pharmacoeconomics 2006; 24(suppl 1):21–34.
- Prasad V, Cifu A, Ioannidis JP. Reversals of established medical practices: evidence to abandon ship. JAMA 2012; 307:37–38.
- Hillner BE, Smith TJ, Desch CE. Efficacy and cost-effectiveness of autologous bone marrow transplantation in metastatic breast cancer. Estimates using decision analysis while awaiting clinical trial results. JAMA 1992; 267:2055–2061.
- Prasad V. The apples and oranges of cost-effectiveness. Cleve Clin J Med 2012; 79:377–379.
Drs. Udeh and Udeh attempt to highlight the “straw man” nature of my argument and the inaccuracies of my piece, but they ultimately disprove none of my claims.
Regarding vertebroplasty—a procedure that never worked better than a sham one—the authors do not fault the cost-effectiveness analysis for getting it wrong, but rather early clinical studies that provided false confidence. Yet, as a matter of fact, both were wrong. Cost-effectiveness analyses cannot be excused because they are based on faulty assumptions or poor data. This is precisely the reason they should be faulted. If incorrect cost-effectiveness analyses cannot be blamed because clinical data are flawed, can incorrect clinical research blame its shortcomings on promising preclinical data?
Cost-effectiveness analyses continue to be published regarding interventions that lack even a single randomized controlled trial showing efficacy, despite the authors’ assertion that no one would do that. Favorable cost profiles have been found for diverse, unproven interventions such as transarterial chemoembolization,1 surgical laminectomy,2 and rosiglitazone (Avandia).3 Udeh and Udeh hold an untenable position, arguing that such analyses are ridiculous and would not be performed (such as a study of antibiotics to treat the common cold), while dismissing counterexamples (vertebroplasty), contending they are moot. The fact is that flawed cost-effectiveness studies are performed. They are often in error, and they distort our discussions of funding and approval.
Regarding exemastane (Aromasin), the authors miss the distinction between disease-specific death and overall mortality. Often, therapies lower the death rate from a particular disease but do not increase the overall survival rate. Typically, in these situations, we attribute the discrepancy to a lack of power, but an alternative hypothesis is that some death rates (eg, from cancer) decrease, while others (eg, from cardiovascular disease) increase, resulting in no net benefit. My comment regarding primary prevention studies is that unless the overall mortality rate is improved, one may continue to wonder if this phenomenon—trading death—is occurring. As a result, cost-effective analyses performed on these data may reach false conclusions. The authors’ fatalistic interpretation of my comments is not what I intended and is much more like a straw man.
Lastly, some of the difficulties in reconciling costs from randomized trials and actual clinical practice would be improved if clinical trials included participants who were more like the patients who would ultimately use the therapy. Such pragmatic trials would be a boon to the validity of research science4 and the accuracy of cost-effectiveness studies. I doubt that decision analytic modeling alone can overcome the problems I highlight. Two decades ago, we learned—from cost-effectiveness studies of autologous bone marrow transplantation in breast cancer—that decision analysis could not overcome major deficits in evidence.5 Autologous bone marrow transplantation is cost-effective—well, assuming it works.
We need cost-effectiveness studies to help us prioritize among countless emerging medical practices. However, we also need those analyses to be accurate. The examples I highlighted show common ways we err. The two rules I propose in my original commentary6 are not obvious to all, and they continue to be ignored. As such, cost-effectiveness still resembles like apples and oranges.
- Whitney R, Vàlek V, Fages JF, et al. Transarterial chemoembolization and selective internal radiation for the treatment of patients with metastatic neuroendocrine tumors: a comparison of efficacy and cost. Oncologist 2011; 16:594–601.
- Burnett MG, Stein SC, Bartels RH. Cost-effectiveness of current treatment strategies for lumbar spinal stenosis: nonsurgical care, laminectomy, and X-STOP. J Neurosurg Spine 2010; 13:39–46.
- Beale S, Bagust A, Shearer AT, Martin A, Hulme L. Cost-effectiveness of rosiglitazone combination therapy for the treatment of type 2 diabetes mellitus in the UK. Pharmacoeconomics 2006; 24(suppl 1):21–34.
- Prasad V, Cifu A, Ioannidis JP. Reversals of established medical practices: evidence to abandon ship. JAMA 2012; 307:37–38.
- Hillner BE, Smith TJ, Desch CE. Efficacy and cost-effectiveness of autologous bone marrow transplantation in metastatic breast cancer. Estimates using decision analysis while awaiting clinical trial results. JAMA 1992; 267:2055–2061.
- Prasad V. The apples and oranges of cost-effectiveness. Cleve Clin J Med 2012; 79:377–379.
A woman with a swollen uvula

A 39-year-old woman on patient-controlled analgesia with morphine after cesarean delivery suddenly developed shortness of breath. On examination, the uvula was notably edematous, pale, and translucent, with no sign of erythema (Figure 1). The previous night, when the morphine was started, she had mild pruritus, which responded to treatment with oral diphenhydramine (Benadryl).
Given the extent of the uvular edema, emergency intubation was performed, and epinephrine and corticosteroids were given.
Q: Which is the most likely diagnosis at this point?
- Hereditary angioedema
- Infection causing epiglottitis masquerading as uvular swelling
- Opioid-induced uvular hydrops
- Myxedematous infiltration due to hypothyroidism
A: Opioid-induced uvular hydrops is the most likely diagnosis in this case, although it is rare. The most common side effect of opioids is constipation; others include lethargy, delirium, and sedation.
Hereditary angioedema is unlikely in this patient, as it usually presents in childhood or adolescence and there is usually a family history. Also, her cesarean delivery was done under regional anesthesia, which requires no oral or uvular manipulation and so cannot cause uvular swelling. In the absence of pain, fever, or signs and symptoms of pharyngitis, infection was unlikely. And she had no history of hypothyroidism.
UVULAR HYDROPS
This condition may be caused by opioid-induced direct degranulation of mast cells and basophils, inciting an inflammatory response.
Differential diagnoses include:
- Hereditary angioedema
- Effects of other drugs (angiotensin-converting enzyme inhibitors, cocaine, non-steroidal anti-inflammatory drugs)
- Infection (Haemophilus influenzae, Streptococcus pneumoniae)
- Trauma (intubation during surgery)
- Myxedematous infiltration due to hypothyroidism
- Granulomatous infiltration due to sarcoidosis.
When the patient’s condition has been stabilized, several outpatient tests may help narrow the differential diagnosis:
- Serum complement levels, of which the most reliable and cost-effective screening test for hereditary angioedema is a serum C4 level
- A serum thyroid-stimulating hormone level to rule out hypothyroidism
- Skin and lymph node biopsy (if skin lesions or lymphadenopathy is present), and chest radiograph to rule out sarcoidosis
- A urine drug screen and a skin-prick test for opioids (even though a negative skin test does not exclude opiate sensitivity).
OUR PATIENT’S COURSE
Our patient was discharged and underwent further outpatient evaluation. At discharge, she was advised to avoid opioids in the future.
SUGGESTED READING
Grigoriadou S, Longhurst HJ. Clinical Immunology Review Series: An approach to the patient with angio-oedema. Clin Exp Immunol 2009; 155:367–377.
Marx JA, Hockberger RS, Walls RM. Urticaria and angioedema. In:Marx JA, Hockberger RS, Walls RM, et aleditors. Rosen’s Emergency Medicine. 7th ed. Philadelphia, PA: Mosby/Elsevier, 2010.
Morgan BP. Hereditary angioedema—therapies old and new. N Engl J Med 2010; 363:581–583.
Neustein SM. Acute uvular edema after regional anesthesia. J Clin Anesth 2007; 19:365–366.
A 39-year-old woman on patient-controlled analgesia with morphine after cesarean delivery suddenly developed shortness of breath. On examination, the uvula was notably edematous, pale, and translucent, with no sign of erythema (Figure 1). The previous night, when the morphine was started, she had mild pruritus, which responded to treatment with oral diphenhydramine (Benadryl).
Given the extent of the uvular edema, emergency intubation was performed, and epinephrine and corticosteroids were given.
Q: Which is the most likely diagnosis at this point?
- Hereditary angioedema
- Infection causing epiglottitis masquerading as uvular swelling
- Opioid-induced uvular hydrops
- Myxedematous infiltration due to hypothyroidism
A: Opioid-induced uvular hydrops is the most likely diagnosis in this case, although it is rare. The most common side effect of opioids is constipation; others include lethargy, delirium, and sedation.
Hereditary angioedema is unlikely in this patient, as it usually presents in childhood or adolescence and there is usually a family history. Also, her cesarean delivery was done under regional anesthesia, which requires no oral or uvular manipulation and so cannot cause uvular swelling. In the absence of pain, fever, or signs and symptoms of pharyngitis, infection was unlikely. And she had no history of hypothyroidism.
UVULAR HYDROPS
This condition may be caused by opioid-induced direct degranulation of mast cells and basophils, inciting an inflammatory response.
Differential diagnoses include:
- Hereditary angioedema
- Effects of other drugs (angiotensin-converting enzyme inhibitors, cocaine, non-steroidal anti-inflammatory drugs)
- Infection (Haemophilus influenzae, Streptococcus pneumoniae)
- Trauma (intubation during surgery)
- Myxedematous infiltration due to hypothyroidism
- Granulomatous infiltration due to sarcoidosis.
When the patient’s condition has been stabilized, several outpatient tests may help narrow the differential diagnosis:
- Serum complement levels, of which the most reliable and cost-effective screening test for hereditary angioedema is a serum C4 level
- A serum thyroid-stimulating hormone level to rule out hypothyroidism
- Skin and lymph node biopsy (if skin lesions or lymphadenopathy is present), and chest radiograph to rule out sarcoidosis
- A urine drug screen and a skin-prick test for opioids (even though a negative skin test does not exclude opiate sensitivity).
OUR PATIENT’S COURSE
Our patient was discharged and underwent further outpatient evaluation. At discharge, she was advised to avoid opioids in the future.
SUGGESTED READING
Grigoriadou S, Longhurst HJ. Clinical Immunology Review Series: An approach to the patient with angio-oedema. Clin Exp Immunol 2009; 155:367–377.
Marx JA, Hockberger RS, Walls RM. Urticaria and angioedema. In:Marx JA, Hockberger RS, Walls RM, et aleditors. Rosen’s Emergency Medicine. 7th ed. Philadelphia, PA: Mosby/Elsevier, 2010.
Morgan BP. Hereditary angioedema—therapies old and new. N Engl J Med 2010; 363:581–583.
Neustein SM. Acute uvular edema after regional anesthesia. J Clin Anesth 2007; 19:365–366.
The ‘T’ in ITP remains

The “I” has changed its meaning, the “P” is not necessary to make the diagnosis, and the syndrome is not strikingly common in adults. But the disease formerly known as idiopathic thrombocytopenic purpura (ITP) remains important for internists to diagnose because thrombocytopenia is extremely common.
ITP has long been recognized in children (in whom it is often self-limited but severe) and in adults (in whom it is often more insidious and chronic, with a wider differential diagnosis).
The “I” used to stand for “idiopathic” but now it stands for “immune,” following a half decade of work by many investigators. The seminal experimental work of Dr. William J. Harrington and others while the former was a hematology fellow with Carl Moore at Washington University is the stuff of legend and ethical debate. Harrington had himself injected with a pint of serum from a patient with ITP and nearly died, demonstrating that the patient’s blood contained a substance or substances capable of inducing reversible profound thrombocytopenia in the recipient.1 Today, this classic experiment would probably not be performed, nor would the many more infusions that Harrington subsequently gave himself, other physicians, and support staff.2
Understanding the immunologic basis for ITP has led to treatments that are usually but not uniformly successful. Prednisone remains the main initial therapy, but its myriad side effects have led to the strategy of turning sooner to other therapies, such as intravenous immunoglobulin, splenectomy, rituximab (Rituxan), and, most recently, thrombopoietin agonists, in order to control the disease or even put it into remission.
Treatment decisions are often assigned to the hematologist or rheumatologist, but recognizing ITP and distinguishing it from other causes of thrombocytopenia remain the province of primary care providers, as discussed by Thota et al in this issue of the Journal.3 The diagnosis of ITP does not require the presence of purpura, which most adults ITP patients probably do not have, nor does it always require a bone marrow biopsy. It is important that ITP be distinguished from thrombocytopenia that is induced by drugs (particularly heparin) and myelodysplastic and other marrow processes (potential clues being other cytopenias, an unexplained elevated mean corpuscular volume, or constitutional symptoms). Undiagnosed thyroid disease and HIV infection should be tested for routinely, once drug-associated and other obvious causes are excluded.
- Harrington WJ, Minnich V, Hollingsworth JW, Moore CV. Demonstration of a thrombocytopenic factor in the blood of patients with thrombocytopenic purpura. J Lab Clin Med 1961; 38:1–10.
- Altman LK. Who Goes First? The Story Of Self-Experimentation. Berkeley, CA; University of California Press, 1987.
- Thota S, Kistangari G, Daw H, Spiro T. Immune thrombocytopenia in adults: an update. Cleve Clin J Med 2012; 79:641–650.
The “I” has changed its meaning, the “P” is not necessary to make the diagnosis, and the syndrome is not strikingly common in adults. But the disease formerly known as idiopathic thrombocytopenic purpura (ITP) remains important for internists to diagnose because thrombocytopenia is extremely common.
ITP has long been recognized in children (in whom it is often self-limited but severe) and in adults (in whom it is often more insidious and chronic, with a wider differential diagnosis).
The “I” used to stand for “idiopathic” but now it stands for “immune,” following a half decade of work by many investigators. The seminal experimental work of Dr. William J. Harrington and others while the former was a hematology fellow with Carl Moore at Washington University is the stuff of legend and ethical debate. Harrington had himself injected with a pint of serum from a patient with ITP and nearly died, demonstrating that the patient’s blood contained a substance or substances capable of inducing reversible profound thrombocytopenia in the recipient.1 Today, this classic experiment would probably not be performed, nor would the many more infusions that Harrington subsequently gave himself, other physicians, and support staff.2
Understanding the immunologic basis for ITP has led to treatments that are usually but not uniformly successful. Prednisone remains the main initial therapy, but its myriad side effects have led to the strategy of turning sooner to other therapies, such as intravenous immunoglobulin, splenectomy, rituximab (Rituxan), and, most recently, thrombopoietin agonists, in order to control the disease or even put it into remission.
Treatment decisions are often assigned to the hematologist or rheumatologist, but recognizing ITP and distinguishing it from other causes of thrombocytopenia remain the province of primary care providers, as discussed by Thota et al in this issue of the Journal.3 The diagnosis of ITP does not require the presence of purpura, which most adults ITP patients probably do not have, nor does it always require a bone marrow biopsy. It is important that ITP be distinguished from thrombocytopenia that is induced by drugs (particularly heparin) and myelodysplastic and other marrow processes (potential clues being other cytopenias, an unexplained elevated mean corpuscular volume, or constitutional symptoms). Undiagnosed thyroid disease and HIV infection should be tested for routinely, once drug-associated and other obvious causes are excluded.
- Harrington WJ, Minnich V, Hollingsworth JW, Moore CV. Demonstration of a thrombocytopenic factor in the blood of patients with thrombocytopenic purpura. J Lab Clin Med 1961; 38:1–10.
- Altman LK. Who Goes First? The Story Of Self-Experimentation. Berkeley, CA; University of California Press, 1987.
- Thota S, Kistangari G, Daw H, Spiro T. Immune thrombocytopenia in adults: an update. Cleve Clin J Med 2012; 79:641–650.
Immune thrombocytopenia in adults: An update
Immune thrombocytopenia (ITP), formerly known as idiopathic thrombocytopenic purpura, is an autoimmune disorder characterized by a low platelet count and increased risk of mucocutaneous bleeding. During the last decade its management has changed, with the advent of new medications and with increased awareness of treatment side effects. This article will focus on the pathophysiology, diagnosis, and management of ITP in adults.
A SLIGHT FEMALE PREDOMINANCE UNTIL AGE 65
The estimated age-adjusted prevalence of ITP in the United States is 9.5 to 23.6 cases per 100,000.1 In a recent study in the United Kingdom, the incidence was 4.4 per 100,000 patient-years among women and 3.4 among men.2 A slight female predominance was seen until age 65; thereafter, the incidence rates in men and women were about equal.
INCREASED PLATELET DESTRUCTION AND DECREASED PRODUCTION
ITP is a complex immune process in which cellular and humoral immunity are involved in the destruction of platelets3 as well as impaired platelet production. Several theories have emerged in the last decade to explain this autoimmune process.
Autoantibodies form against platelets
The triggering event for antibody initiation in ITP is unknown.3 Autoantibodies (mostly immunoglobulin G [IgG] but sometimes IgM and IgA) are produced against the platelet membrane glycoprotein GPIIb-IIIa. The antibody-coated platelets are rapidly cleared by the reticuloendothelial system in the spleen and liver, in a process mediated by Fc-receptor expression on macrophages and dendritic cells. Autoantibodies may also affect platelet production by inhibiting megakaryocyte maturation and inducing apoptosis.4,5
Patients with ITP also have CD4+ T cells that are autoreactive to GPIIb-IIIa and that stimulate B-cell clones to produce antiplatelet antibodies. Although autoreactive T cells are present in healthy individuals, they appear to be activated in patients with ITP by exposure to fragments of GPIIb-IIIa rather than native GPIIb-IIIa proteins.6 Activated macrophages internalize antibody-coated platelets and degrade GPIIb-IIIa and other glycoproteins to form “cryptic” epitopes that are expressed on the macrophage surface as novel peptides that induce further proliferation of CD4+ T-cell clones. Epitope spread thereby sustains a continuous loop that amplifies the production of GPIIb-IIIa antibodies.7
Defective T-regulatory cells appear to be critical to the pathogenesis of ITP by breaking self-tolerance, allowing the autoimmune process to progress.8 This, together with several other immune mechanisms such as molecular mimicry, abnormal cytokine profile, and B-cell abnormalities, may lead to enhanced platelet clearance.9
In addition to destroying platelets, antibodies may impair platelet production.10 Good evidence for platelets being underproduced in patients with ITP is that treating with thrombopoietin agonists results in increased platelet counts.
A DIAGNOSIS OF EXCLUSION
ITP is defined as isolated thrombocytopenia with no clinically apparent associated conditions or other causes of thrombocytopenia.11 No diagnostic criteria currently exist, and the diagnosis is established only after excluding other causes of thrombocytopenia.
A recent report12 from an international working group established a platelet count threshold of less than 100 × 109/L for diagnosing ITP, down from the previous threshold of 150 × 109/L. The panel also recommended using the term “immune” rather than “idiopathic” thrombocytopenia, emphasizing the role of underlying immune mechanisms. The term “purpura” was removed, because many patients have no or minimal signs of bleeding at the time of diagnosis.12
The 2011 American Society of Hematology’s evidenced-based guidelines for the treatment of ITP present the most recent authoritative diagnostic and therapeutic recommendations.13
ITP is considered to be primary if it occurs in isolation, and secondary if it is associated with an underlying disorder. It is further classified according to its duration since diagnosis: newly diagnosed (< 3 months), persistent (3−12 months), and chronic (> 12 months).
In adults, ITP tends to be chronic, presenting with a more indolent course than in childhood, and unlike childhood ITP, infrequently following a viral infection.
Clinical features associated with ITP are related to thrombocytopenia: petechiae (pinpoint microvascular hemorrhages that do not blanch with pressure), purpura (appearing like large bruises), epistaxis (nosebleeds), menorrhagia, gum bleeding, and other types of mucocutaneous bleeding. Other common clinical features include fatigue, impaired quality of life, and treatment-related side effects (eg, infection).14
A low platelet count may be the sole initial manifestation. The patient’s history, physical examination, blood counts, and findings on blood smear are essential to rule out other diagnoses. Few diagnostic tests are useful in the initial evaluation (Table 1). Abnormalities in the blood count or blood smear may be further investigated with bone marrow biopsy but is not required if the patient has typical features of ITP, regardless of age.
Because there are no specific criteria for diagnosing ITP, other causes of thrombocytopenia must be excluded. The differential diagnosis can be further classified as ITP due to other underlying disease (ie, secondary ITP) vs nonautoimmune causes that are frequently encountered in clinical practice.
SECONDARY ITP
The differential diagnosis of thrombocytopenia due to known underlying immune disease includes the following:
Drug-induced ITP
Recurrent episodes of acute thrombocytopenia not explained by other causes should trigger consideration of drug-induced thrombocytopenia. 11 Patients should be questioned about drug use, especially of sulfonamides, antiepileptics, and quinine. Thrombocytopenia usually occurs 5 to 7 days after beginning the inciting drug for the first time and more quickly when the drug is given intermittently. Heparin is the most common cause of drug-related thrombocytopenia among hospitalized patients; the mechanism is unique and involves formation of a heparin-PF4 immune complex.
Human immunodeficiency virus infection
Approximately 40% of patients with human immunodeficiency virus (HIV) infection develop thrombocytopenia at some time.15 HIV infection can initially manifest as isolated thrombocytopenia and is sometimes clinically indistinguishable from chronic ITP, making it an important consideration in a newly diagnosed case of thrombocytopenia.
The mechanism of thrombocytopenia in early HIV is similar to that in primary ITP: as the disease progresses, low platelet counts can result from ineffective hematopoiesis due to megakaryocyte infection and marrow infiltration.16
Hepatitis C virus infection
Hepatitis C virus (HCV) infection can also cause immune thrombocytopenia. A recent study demonstrated the potential of the HCV core envelope protein 1 to induce antiplatelet antibodies (to platelet surface integrin GPIIIa49-66) by molecular mimicry.17 Other causes of thrombocytopenia in HCV infection may be related to chronic liver disease, such as portal hypertension-related hypersplenism, as well as decreased thrombopoietin production.18 Antiviral treatment with pegylated interferon may also cause mild thrombocytopenia.19
Helicobacter pylori
The association between H pylori infection and ITP remains uncertain. Eradication of infection appears to completely correct ITP in some places where the prevalence of H pylori is high (eg, Italy and Japan) but not in the United States and Canada, where the prevalence is low.20 The different response may be due not only to the differences in prevalence, but to different H pylori genotypes: most H pylori strains in Japan express CagA, whereas the frequency of CagA-positive strains is much lower in western countries.20
In areas where eradication therapy may be useful, the presence of H pylori infection should be determined by either a urea breath test or stool antigen testing.
Lymphoproliferative disorders
Secondary forms of ITP can occur in association with chronic lymphocytic leukemia, non-Hodgkin lymphoma, and Hodgkin lymphoma. These diagnoses should especially be considered in patients presenting with thrombocytopenia accompanied by systemic illness. ITP occurs in at least 2% of patients with chronic lymphocytic leukemia and is usually difficult to distinguish from thrombocytopenia secondary to marrow infiltration or from fludarabine (Fludora) therapy.21
It is especially important to determine if a lymphoproliferative disorder is present because it changes the treatment of ITP. Treatment of ITP complicating chronic lymphocytic leukemia is challenging and includes corticosteroids and steroid-sparing agents such as cyclosporine (Gengraf, Neoral, Sandimmune), rituximab (Rituxan), and intravenous immunoglobulin.22
Systemic lupus erythematosus and other autoimmune diseases
Thrombocytopenia is a frequent clinical manifestation of systemic lupus erythematosus, occurring in 7% to 30% of patients,23 and is an independent risk factor for death.24 Lupus should be suspected in patients with ITP who have multiorgan involvement and other clinical and laboratory abnormalities. A small percentage of patients with ITP (about 2%−5%) develop lupus after several years.21
Thrombocytopenia can also result from other autoimmune disorders such as antiphospholipid antibody syndrome25 and autoimmune thyroid diseases as well as immunodeficient states such as IgA deficiency and common variable immunodeficiency with low IgG levels.
NONAUTOIMMUNE THROMBOCYTOPENIA
Thrombocytopenia can also be caused by a number of nonautoimmune conditions.
Pseudothrombocytopenia
Pseudothrombocytopenia can occur if ex-vivo agglutination of platelets is induced by antiplatelet antibodies to EDTA, a standard blood anticoagulant. Automated counters cannot differentiate the agglutinated platelet clumps from individual cells such as red cells. This can frequently be overcome by running the counts in a citrate or ACD reagent tube. A peripheral blood smear can demonstrate whether platelet clumps are present.
Thrombotic thrombocytopenic purpura
Thrombotic thrombocytopenic purpura presents with thrombocytopenia, purpura, and anemia. Associated clinical abnormalities (fever, neurologic symptoms, and renal failure) and the presence of fragmented red cells on blood smear help to distinguish it from ITP. Plasma exchange is the treatment of choice.
Gestational thrombocytopenia
Five percent of pregnant women develop mild thrombocytopenia (platelet counts typically > 70 × 109/L) near the end of gestation.26 It requires no treatment and resolves after delivery. The fetus’ platelet count remains unaffected.
Gestational thrombocytopenia should be differentiated from the severe thrombocytopenia of preeclampsia and HELLP syndrome (hemolysis, elevated liver enzymes, and low platelet count), which requires immediate attention.
Myelodysplastic syndrome
Myelodysplastic syndrome is common among elderly patients and should be considered in cases of unexplained cytopenia and abnormalities in the peripheral blood smear suggestive of dysplastic cytologic features. It can be diagnosed by bone marrow biopsy. Thrombocytopenia occurs in about 40% to 65% of cases of myelodysplastic syndrome.27
MANAGE ITP TO KEEP PLATELET COUNT ABOVE 30 × 109/L
ITP does not necessarily require treatment, and the initial challenge is to determine whether treatment or observation is indicated. Treatment is based on two major factors: the platelet count and degree of bleeding. The goals of management are to achieve a safe platelet count to prevent serious bleeding while minimizing treatment-related toxicity.7
Adults with platelet counts of less than 30 × 109/L are usually treated. In multiple large cohort studies, patients with platelet counts above that level have been safely observed without treatment.11,28
Table 2 outlines a comprehensive approach to therapy.
INITIAL TREATMENT: STEROIDS AND IMMUNOGLOBULINS
Oral corticosteroids are the initial agents of choice
Oral prednisone 1 mg/kg/day in tapering doses for 4 to 6 weeks is the most common initial regimen. Other regimens, such as high-dose dexamethasone (Decadron) (40 mg daily for 4 days per month) for several cycles, have been reported to be more effective29 but have not been studied in head-to-head trials with oral prednisone.
Due to their effectiveness, low cost, and convenience of use, corticosteroids have been the backbone of initial treatment in ITP. However, in most patients the platelet count decreases once the dose is tapered or stopped; remission is sustained in only 10% to 30% of cases.30 Continuation of corticosteroids is limited by long-term complications such as opportunistic infections, osteoporosis, and emotional lability.31
Intravenous immunoglobulin and anti-D immunoglobulin are alternatives
Intravenous immunoglobulin is recommended for patients who have not responded to corticosteroids and is often used in pregnancy. It is thought to act by blocking Fc receptors in the reticuloendothelial system. Intravenous immunoglobulin rapidly increases platelet counts in 65% to 80% of patients,32 but the effect is transient and the drug requires frequent administration. It is usually well tolerated, although about 5% of patients experience headache, chills, myalgias, arthralgias, and back pain. Rare, serious complications include thrombotic events, anaphylaxis (in IgA-deficient patients), and renal failure.
Anti-D immunoglobulin, a pooled IgG product, is derived from the plasma of Rh(D)-negative donors and can be given only to patients who are Rh(D)-positive. Response rates as high as 70% have been reported, with platelet effects lasting for more than 21 days.33 Studies have shown better results at a high dose (75 μg/kg) than with the approved dose of 50 μg/kg.34
Anti-D immunoglobulin can also be given intermittently whenever the platelet count falls below a specific level (ie, 30 × 109/L). This allows some patients to avoid splenectomy and may even trigger long-term remission.32
Common side effects of anti-D immunoglobulin include fever and chills; these can be prevented by premedication with acetaminophen or corticosteroids. Rare but fatal cases of intravascular hemolysis, renal failure, and disseminated intravascular coagulation have been reported, precluding its use for ITP in some countries, including those of the European Union.
Emergency treatment: Combination therapy
Evidence-based guidelines are limited for treating patients with active bleeding or who are at high risk of bleeding. For uncontrolled bleeding, a combination of first-line therapies is recommended, using prednisone and intravenous immunoglobulin.35 Other options include high-dose methylprednisolone and platelet transfusions, alone or in combination with intravenous immunoglobulin.36
SECOND-LINE TREATMENTS
Splenectomy produces complete remission in most patients
Patients who relapse and have a platelet count of less than 20 × 109/L are traditionally considered for splenectomy. More than two-thirds of patients respond with no need for further treatment.37
Although splenectomy has the highest rate of durable platelet response, the risks associated with surgery are an important concern. Even with a laparoscopic splenectomy, complications occur in 10% of patients and death in 0.2%. Long-term risks include the rare occurrence of sepsis with an estimated mortality rate of 0.73 per 1,000 patient-years, and possible increased risk of thrombosis.38,39
Adherence to recommended vaccination protocols and early administration of antibiotics for systemic febrile illness reduce the risk of sepsis.40 Patients are advised to receive immunization against encapsulated bacteria with pneumococcal, Haemophilus influenzae type b, and meningococcal vaccines. These vaccines should be given at least 2 weeks before elective splenectomy.41
Treatment of patients refractory to splenectomy is challenging and requires further immunosuppressive therapy, which is associated with an increased risk of infections and infection-related deaths.42
Rituximab in addition to or possibly instead of splenectomy
Rituximab (Rituxan) is a chimeric anti-CD20 monoclonal antibody that targets B cells. Although initially approved for treatment of lymphomas, rituximab has gained popularity in treating ITP due to its safety profile and ability to deplete CD20+ B cells responsible for antiplatelet antibody production by Fc-mediated cell lysis.
In the largest systematic review of published reports of rituximab use in ITP (19 studies, 313 patients), Arnold and colleagues43 reported an overall platelet response (defined as platelet count > 50 × 109/L) in 62.5% (95% confidence interval [CI] 52.6%−72.5%) of patients. The median duration of response was 10.5 months (range 3–20), and median follow-up was 9.5 months (range 2–25). Nearly all patients had received corticosteroid treatment and half of them had undergone splenectomy.
Rituximab has also been investigated as an alternative to splenectomy. In a prospective, single-arm, phase 2 trial, 60 patients with chronic ITP (platelet counts < 30 × 109/L) for whom one or more previous treatments had failed received rituximab infusions and were followed for up to 2 years. A good response (defined as a platelet count ≥ 50 × 109/L, with at least a doubling from baseline) was obtained in 24 (40%) of 60 patients (95% CI 28%–52%) at 1 year and 33.3% at 2 years. The authors concluded that rituximab could be used as a presplenectomy therapeutic option, particularly in patients with chronic ITP who are at increased surgical risk or who are reluctant to undergo surgery.44 Based on these results, rituximab may spare some patients from splenectomy, or at least delay it. However, it has never been tested in randomized controlled trials to establish its role as a splenectomy-sparing agent in ITP.
Side effects include infusion reactions, which are usually mild but in rare cases can be severe. Recently, progressive multifocal leukoencephalopathy has been recognized as a complication of rituximab treatment in patients with lymphoproliferative and autoimmune disorders.45 Although this complication is rare in patients with ITP, careful monitoring is required until additional long-term safety data are available.
Thrombopoietic receptor agonists require continuous treatment
In the early 1990s, recombinant thrombopoietin was tested in clinical studies. These were halted when antibodies developed to recombinant thrombopoietin that cross-reacted with endogenous thrombopoietin, resulting in severe thrombocytopenia.46
This led to the development of nonimmunogenic thrombopoietin receptor agonists that mimic the effect of thrombopoietin and stimulate the production of platelets. In 2008, the US Food and Drug Administration approved two drugs of this class for treating ITP: romiplostim (Nplate) and eltrombopag (Promacta). They are mainly used to treat patients with chronic ITP who have had an insufficient response to corticosteroids, immunoglobulins, or splenectomy.
Although well tolerated and effective in increasing platelet counts, these agents share common drawbacks. They do not modify the course of the disease, they are used only to sustain the platelet count, they require repeated administration, and they must be given for about 7 days to achieve an adequate platelet response, so they cannot be used in emergencies. Long-term adverse effects include bone marrow fibrosis and thrombosis.
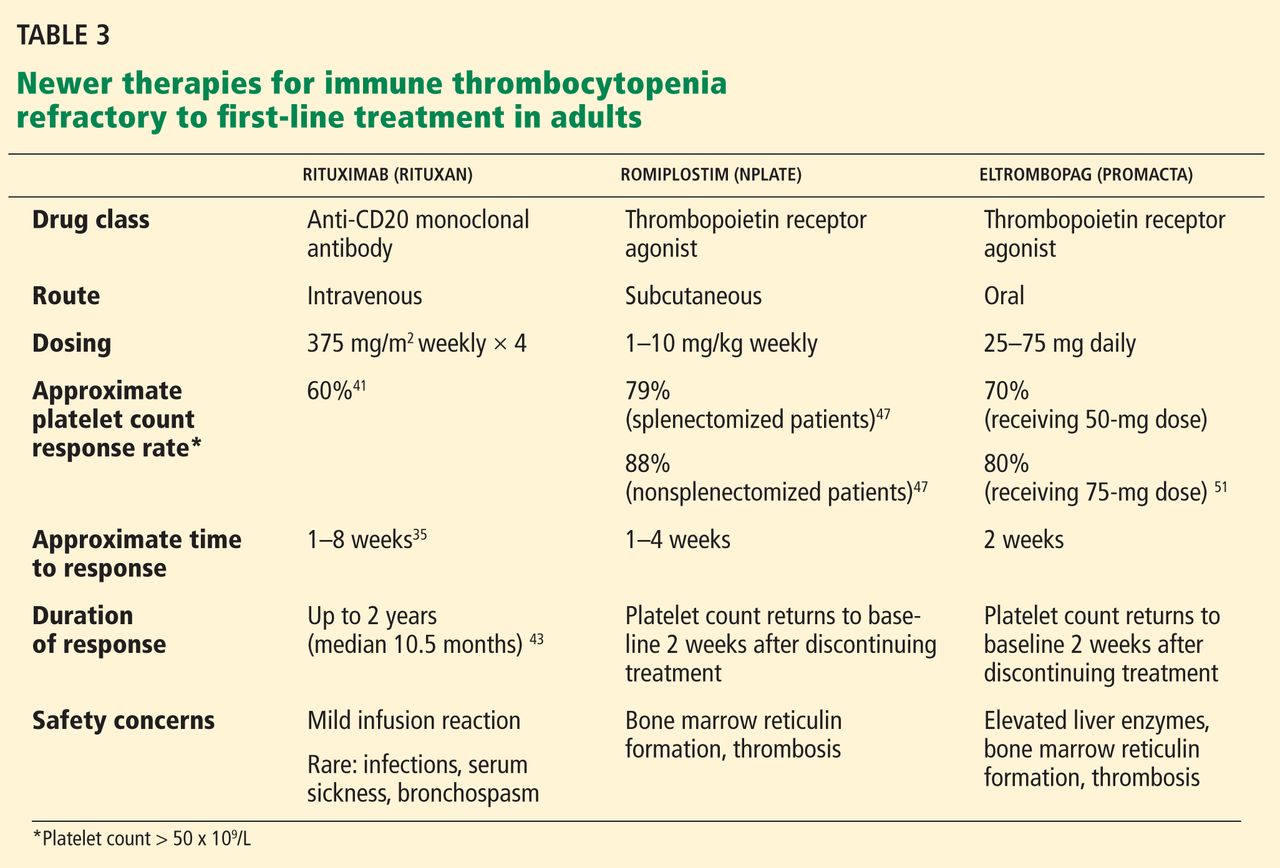
Romiplostim is a synthetic peptide capable of binding to the thrombopoietin receptor c-Mpl. It has no sequence homology with endogenous thrombopoietin,47 so does not induce cross-reacting antibodies. It has a half-life of 120 to 160 hours and is usually given subcutaneously 1 to 10 μg/kg weekly.
Phase III clinical trials have shown the effectiveness of romiplostim in attaining a durable platelet response (platelet count > 50 × 109/L) in splenectomized and nonsplenectomized populations. It is well tolerated, and only two uncommon serious adverse effects have been reported: bone marrow reticulin formation and thromboembolism.48
A long-term open-label extension study of 142 patients treated with romiplostim for up to 156 weeks showed that 124 (87%) achieved a platelet count of more than 50 × 109/L at some point, and 84% of patients were able to reduce or discontinue concurrent medications for ITP.49
Kuter et al,50 in a randomized controlled trial, confirmed the efficacy of romiplostim in attaining durable increased platelet counts. Patients treated with romiplostim at a mean weekly dose of 3.9 μg/kg ± 2.1 μg/kg demonstrated a higher rate of platelet response, lower incidence of treatment failure, and improved quality of life vs patients treated with standard care.
Eltrombopag is a nonpeptide thrombopoietin agonist that binds to the transmembrane domain of the thrombopoietin receptor and stimulates the proliferation and differentiation of megakaryocytes in bone marrow. It is given orally in doses of 25 to 75 mg daily.
Eltrombopag has been shown to be effective in increasing platelet counts in chronic ITP.51 In a phase III trial conducted by Cheng and colleagues, 197 patients were randomized to eltrombopag or placebo.52 Patients treated with eltrombopag were eight times more likely to achieve platelet counts of more than 50 × 109/L during the 6-month treatment period (odds ratio 8.2, 95% CI 4.32–15.38, P < .001) vs placebo. Patients treated with eltrombopag had fewer bleeding episodes and were more likely to reduce or discontinue the dose of concurrent ITP medications. The only significant side effect seen was a rise in aminotransferases (seen in 7% of eltrombopag recipients vs 2% with placebo).52
Additional thrombopoietin agonists under investigation include ARK-501, totrombopag, and LGD-4665. MDX-33, a monoclonal antibody against the Fc-receptor, is also being studied; it acts by preventing opsonization of autoantibody-coated platelets.53
THIRD-LINE TREATMENTS FOR REFRACTORY CASES
Patients with ITP that is resistant to standard therapies have an increased risk of death, disease, and treatment-related complications.28,42
Combination chemotherapy
Immunosuppressants such as azathioprine (Imuran), cyclosporine (Neoral, Sandimmune), cyclophosphamide (Cytoxan), and mycophenolate (CellCept) were used in the past in single-agent regimens with some efficacy, but their use was limited due to drug-related toxicity and a low safety profile.3 However, there is increasing evidence for a role of combination chemotherapy to treat chronic refractory ITP to achieve greater efficacy and fewer adverse effects.54
Arnold and colleagues55 reported that combined azathioprine, mycophenolate, and cyclosporine achieved an overall response (platelet count > 30 × 109/L and doubling of the baseline) in 14 (73.7%) of 19 patients with chronic refractory ITP, lasting a median of 24 months.
Hematopoietic stem cell transplantation
Hematopoietic stem cell transplantation has provided remission in a limited number of patients. However, it is associated with fatal toxicities such as graft-vs-host disease and septicemia, and therefore it is reserved for severe refractory ITP with bleeding complications unresponsive to other therapies.56,57
THERAPY FOR SECONDARY ITP DEPENDS ON THE CAUSE
Treatments for secondary ITP vary depending on the cause of thrombocytopenia and are often more complex than therapy for primary disease. Optimal management involves treating the underlying condition (eg, chronic lymphocytic leukemia or systemic lupus erythematosus).
Drug-induced thrombocytopenia requires prompt recognition and withdrawal of the inciting agent.
Treating ITP due to HCV infection primarily involves antiviral agents to suppress viral replication. If treating ITP is required, then intravenous immunoglobulin is preferable to glucocorticoids because of the risk of increasing viral load with the latter.58 Eltrombopag may effectively increase platelet counts, allowing patients to receive interferon therapy for HCV.59 However, a recent study was halted due to increased incidence of portal vein thrombosis, raising concerns about the safety of eltrombopag for patients with chronic liver disease.60
Secondary ITP due to HIV infection should always be treated first with antivirals targeting HIV unless thrombocytopenia-related bleeding complications warrant treatment. If treatment for ITP is necessary, it should include corticosteroids, intravenous immunoglobulin, or anti-D immunoglobulin as first-line therapy.
Eradication therapy for H pylori is recommended for patients who are positive for the organism based on urea breath testing, stool antigen testing, or endoscopic biopsies.
- Feudjo-Tepie MA, Robinson NJ, Bennett D. Prevalence of diagnosed chronic immune thrombocytopenic purpura in the US: analysis of a large US claim database: a rebuttal. J Thromb Haemost 2008; 6:711–712.
- Abrahamson PE, Hall SA, Feudjo-Tepie M, Mitrani-Gold FS, Logie J. The incidence of idiopathic thrombocytopenic purpura among adults: a population-based study and literature review. Eur J Haematol 2009; 83:83–89.
- Gernsheimer T. Chronic idiopathic thrombocytopenic purpura: mechanisms of pathogenesis. Oncologist 2009; 14:12–21.
- McMillan R, Wang L, Tomer A, Nichol J, Pistillo J. Suppression of in vitro megakaryocyte production by antiplatelet auto-antibodies from adult patients with chronic ITP. Blood 2004; 103:1364–1369.
- Houwerzijl EJ, Blom NR, van der Want JJ, et al. Ultrastructural study shows morphologic features of apoptosis and para-apoptosis in megakaryocytes from patients with idiopathic thrombocytopenic purpura. Blood 2004; 103:500–506.
- Kuwana M, Kaburaki J, Kitasato H, et al. Immunodominant epitopes on glycoprotein IIb-IIIa recognized by autoreactive T cells in patients with immune thrombocytopenic purpura. Blood 2001; 98:130–139.
- Cines DB, Blanchette VS. Immune thrombocytopenic purpura. N Engl J Med 2002; 346:995–1008.
- Littman DR, Rudensky AY. Th17 and regulatory T cells in mediating and restraining inflammation. Cell 2010; 140:845–858.
- Semple JW, Provan D, Garvey MB, Freedman J. Recent progress in understanding the pathogenesis of immune thrombocytopenia. Curr Opin Hematol 2010; 17:590–595.
- Ballem PJ, Segal GM, Stratton JR, Gernsheimer T, Adamson JW, Slichter SJ. Mechanisms of thrombocytopenia in chronic autoimmune thrombocytopenic purpura. Evidence of both impaired platelet production and increased platelet clearance. J Clin Invest 1987; 80:33–40.
- George JN. Definition, diagnosis and treatment of immune thrombocytopenic purpura. Haematologica 2009; 94:759–762.
- Rodeghiero F, Stasi R, Gernsheimer T, et al. Standardization of terminology, definitions and outcome criteria in immune thrombocytopenic purpura of adults and children: report from an international working group. Blood 2009; 113:2386–2393.
- Neunert C, Lim W, Crowther M, Cohen A, Solberg L, Crowther MA; American Society of Hematology. The American Society of Hematology 2011 evidence-based practice guideline for immune thrombocytopenia. Blood 2011; 117:4190–4207.
- Newton JL, Reese JA, Watson SI, et al. Fatigue in adult patients with primary immune thrombocytopenia. Eur J Haematol 2011; 86:420–429.
- Stasi R, Willis F, Shannon MS, Gordon-Smith EC. Infectious causes of chronic immune thrombocytopenia. Hematol Oncol Clin North Am 2009; 23:1275–1297.
- Moses A, Nelson J, Bagby GC. The influence of human immunodeficiency virus-1 on hematopoiesis. Blood 1998; 91:1479–1495.
- Zhang W, Nardi MA, Borkowsky W, Li Z, Karpatkin S. Role of molecular mimicry of hepatitis C virus protein with platelet GPIIIa in hepatitis C-related immunologic thrombocytopenia. Blood 2009; 113:4086–4093.
- Peck-Radosavljevic M. Thrombocytopenia in liver disease. Can J Gastroenterol 2000; 14(suppl D):60D–66D.
- Roomer R, Hansen BE, Janssen HL, de Knegt RJ. Thrombocytopenia and the risk of bleeding during treatment with peginterferon alfa and ribavirin for chronic hepatitis C. J Hepatol 2010; 53:455–459.
- Stasi R, Sarpatwari A, Segal JB, et al. Effects of eradication of Helicobacter pylori infection in patients with immune thrombocytopenic purpura: a systematic review. Blood 2009; 113:1231–1240.
- Cines DB, Bussel JB, Liebman HA, Luning Prak ET. The ITP syndrome: pathogenic and clinical diversity. Blood 2009; 113:6511–6521.
- Zent CS, Kay NE. Autoimmune complications in chronic lymphocytic leukaemia (CLL). Best Pract Res Clin Haematol 2010; 23:47–59.
- Hepburn AL, Narat S, Mason JC. The management of peripheral blood cytopenias in systemic lupus erythematosus. Rheumatology (Oxford) 2010; 49:2243–2254.
- Mok CC, Lee KW, Ho CT, Lau CS, Wong RW. A prospective study of survival and prognostic indicators of systemic lupus erythematosus in a southern Chinese population. Rheumatology (Oxford) 2000; 39:399–406.
- Cervera R, Piette JC, Font J, et al; Euro-Phospholipid Project Group. Antiphospholipid syndrome: clinical and immunologic manifestations and patterns of disease expression in a cohort of 1,000 patients. Arthritis Rheum 2002; 46:1019–1027.
- Burrows RF, Kelton JG. Fetal thrombocytopenia and its relation to maternal thrombocytopenia. N Engl J Med 1993; 329:1463–1466.
- Kantarjian H, Giles F, List A, et al. The incidence and impact of thrombocytopenia in myelodysplastic syndromes. Cancer 2007; 109:1705–1714.
- Portielje JE, Westendorp RG, Kluin-Nelemans HC, Brand A. Morbidity and mortality in adults with idiopathic thrombocytopenic purpura. Blood 2001; 97:2549–2554.
- Cheng Y, Wong RS, Soo YO, et al. Initial treatment of immune thrombocytopenic purpura with high-dose dexamethasone. N Engl J Med 2003; 349:831–836.
- Bromberg ME. Immune thrombocytopenic purpura—the changing therapeutic landscape. N Engl J Med 2006; 355:1643–1645.
- Guidry JA, George JN, Vesely SK, Kennison SM, Terrell DR. Corticosteroid side-effects and risk for bleeding in immune thrombocytopenic purpura: patient and hematologist perspectives. Eur J Haematol 2009; 83:175–182.
- Cooper N. Intravenous immunoglobulin and anti-RhD therapy in the management of immune thrombocytopenia. Hematol Oncol Clin North Am 2009; 23:1317–1327.
- Scaradavou A, Woo B, Woloski BM, et al. Intravenous anti-D treatment of immune thrombocytopenic purpura: experience in 272 patients. Blood 1997; 89:2689–2700.
- Newman GC, Novoa MV, Fodero EM, Lesser ML, Woloski BM, Bussel JB. A dose of 75 microg/kg/d of i.v. anti-D increases the platelet count more rapidly and for a longer period of time than 50 microg/kg/d in adults with immune thrombocytopenic purpura. Br J Haematol 2001; 112:1076–1078.
- Provan D, Stasi R, Newland AC, et al. International consensus report on the investigation and management of primary immune thrombocytopenia. Blood 2010; 115:168–186.
- Spahr JE, Rodgers GM. Treatment of immune-mediated thrombocytopenia purpura with concurrent intravenous immunoglobulin and platelet transfusion: a retrospective review of 40 patients. Am J Hematol 2008; 83:122–125.
- Kojouri K, Vesely SK, Terrell DR, George JN. Splenectomy for adult patients with idiopathic thrombocytopenic purpura: a systematic review to assess long-term platelet count responses, prediction of response, and surgical complications. Blood 2004; 104:2623–2634.
- Schilling RF. Estimating the risk for sepsis after splenectomy in hereditary spherocytosis. Ann Intern Med 1995; 122:187–188.
- Crary SE, Buchanan GR. Vascular complications after splenectomy for hematologic disorders. Blood 2009; 114:2861–2868.
- Davies JM, Barnes R, Milligan D; British Committee for Standards in Haematology. Update of guidelines for the prevention and treatment of infection in patients with an absent or dysfunctional spleen. Clin Med 2002; 2:440–443.
- Centers for Disease Control and Prevention (CDC). Recommended adult immunization schedule—United States, 2011. MMWR Morb Mortal Wkly Rep 2011; 60:1–4.
- McMillan R, Durette C. Long-term outcomes in adults with chronic ITP after splenectomy failure. Blood 2004; 104:956–960.
- Arnold DM, Dentali F, Crowther MA, et al. Systematic review: efficacy and safety of rituximab for adults with idiopathic thrombocytopenic purpura. Ann Intern Med 2007; 146:25–33.
- Godeau B, Porcher R, Fain O, et al. Rituximab efficacy and safety in adult splenectomy candidates with chronic immune thrombocytopenic purpura: results of a prospective multicenter phase 2 study. Blood 2008; 112:999–1004.
- Carson KR, Evens AM, Richey EA, et al. Progressive multifocal leukoencephalopathy after rituximab therapy in HIV-negative patients: a report of 57 cases from the Research on Adverse Drug Events and Reports project. Blood 2009; 113:4834–4840.
- Li J, Yang C, Xia Y, et al. Thrombocytopenia caused by the development of antibodies to thrombopoietin. Blood 2001; 98:3241–3248.
- Kuter DJ. New thrombopoietic growth factors. Blood 2007; 109:4607–4616.
- Kuter DJ, Bussel JB, Lyons RM, et al. Efficacy of romiplostim in patients with chronic immune thrombocytopenic purpura: a double-blind randomised controlled trial. Lancet 2008; 371:395–403.
- Bussel JB, Kuter DJ, Pullarkat V, Lyons RM, Guo M, Nichol JL. Safety and efficacy of long-term treatment with romiplostim in thrombocytopenic patients with chronic ITP. Blood 2009; 113:2161–2171.
- Kuter DJ, Rummel M, Boccia R, et al. Romiplostim or standard of care in patients with immune thrombocytopenia. N Engl J Med 2010; 363:1889–1899.
- Bussel JB, Provan D, Shamsi T, et al. Effect of eltrombopag on platelet counts and bleeding during treatment of chronic idiopathic thrombocytopenic purpura: a randomised, double-blind, placebo-controlled trial. Lancet 2009; 373:641–648.
- Cheng G, Saleh MN, Marcher C, et al. Eltrombopag for management of chronic immune thrombocytopenia (RAISE): a 6-month, randomised, phase 3 study. Lancet 2011; 377:393–402.
- Arnold DM, Nazi I, Kelton JG. New treatments for idiopathic thrombocytopenic purpura: rethinking old hypotheses. Expert Opin Investig Drugs 2009; 18:805–819.
- Boruchov DM, Gururangan S, Driscoll MC, Bussel JB. Multiagent induction and maintenance therapy for patients with refractory immune thrombocytopenic purpura (ITP). Blood 2007; 110:3526–3531.
- Arnold DM, Nazi I, Santos A, et al. Combination immunosuppressant therapy for patients with chronic refractory immune thrombocytopenic purpura. Blood 2010; 115:29–31.
- Passweg JR, Rabusin M. Hematopoetic stem cell transplantation for immune thrombocytopenia and other refractory autoimmune cytopenias. Autoimmunity 2008; 41:660–665.
- Huhn RD, Fogarty PF, Nakamura R, et al. High-dose cyclophosphamide with autologous lymphocyte-depleted peripheral blood stem cell (PBSC) support for treatment of refractory chronic autoimmune thrombocytopenia. Blood 2003; 101:71–77.
- Magrin S, Craxi A, Fabiano C, et al. Hepatitis C viremia in chronic liver disease: relationship to interferon-alpha or corticosteroid treatment. Hepatology 1994; 19:273–279.
- McHutchison JG, Dusheiko G, Shiffman ML, et al; TPL102357 Study Group. Eltrombopag for thrombocytopenia in patients with cirrhosis associated with hepatitis C. N Engl J Med 2007; 357:2227–2236.
- US Department of Health & Human Services. Promacta (eltrombopag): Portal Venous System Thromboses in Study of Patients With Chronic Liver Disease http://www.fda.gov/Safety/MedWatch/SafetyInformation/SafetyAlertsforHumanMedicalProducts/ucm211796.htm. Accessed June 27, 2012.
Immune thrombocytopenia (ITP), formerly known as idiopathic thrombocytopenic purpura, is an autoimmune disorder characterized by a low platelet count and increased risk of mucocutaneous bleeding. During the last decade its management has changed, with the advent of new medications and with increased awareness of treatment side effects. This article will focus on the pathophysiology, diagnosis, and management of ITP in adults.
A SLIGHT FEMALE PREDOMINANCE UNTIL AGE 65
The estimated age-adjusted prevalence of ITP in the United States is 9.5 to 23.6 cases per 100,000.1 In a recent study in the United Kingdom, the incidence was 4.4 per 100,000 patient-years among women and 3.4 among men.2 A slight female predominance was seen until age 65; thereafter, the incidence rates in men and women were about equal.
INCREASED PLATELET DESTRUCTION AND DECREASED PRODUCTION
ITP is a complex immune process in which cellular and humoral immunity are involved in the destruction of platelets3 as well as impaired platelet production. Several theories have emerged in the last decade to explain this autoimmune process.
Autoantibodies form against platelets
The triggering event for antibody initiation in ITP is unknown.3 Autoantibodies (mostly immunoglobulin G [IgG] but sometimes IgM and IgA) are produced against the platelet membrane glycoprotein GPIIb-IIIa. The antibody-coated platelets are rapidly cleared by the reticuloendothelial system in the spleen and liver, in a process mediated by Fc-receptor expression on macrophages and dendritic cells. Autoantibodies may also affect platelet production by inhibiting megakaryocyte maturation and inducing apoptosis.4,5
Patients with ITP also have CD4+ T cells that are autoreactive to GPIIb-IIIa and that stimulate B-cell clones to produce antiplatelet antibodies. Although autoreactive T cells are present in healthy individuals, they appear to be activated in patients with ITP by exposure to fragments of GPIIb-IIIa rather than native GPIIb-IIIa proteins.6 Activated macrophages internalize antibody-coated platelets and degrade GPIIb-IIIa and other glycoproteins to form “cryptic” epitopes that are expressed on the macrophage surface as novel peptides that induce further proliferation of CD4+ T-cell clones. Epitope spread thereby sustains a continuous loop that amplifies the production of GPIIb-IIIa antibodies.7
Defective T-regulatory cells appear to be critical to the pathogenesis of ITP by breaking self-tolerance, allowing the autoimmune process to progress.8 This, together with several other immune mechanisms such as molecular mimicry, abnormal cytokine profile, and B-cell abnormalities, may lead to enhanced platelet clearance.9
In addition to destroying platelets, antibodies may impair platelet production.10 Good evidence for platelets being underproduced in patients with ITP is that treating with thrombopoietin agonists results in increased platelet counts.
A DIAGNOSIS OF EXCLUSION
ITP is defined as isolated thrombocytopenia with no clinically apparent associated conditions or other causes of thrombocytopenia.11 No diagnostic criteria currently exist, and the diagnosis is established only after excluding other causes of thrombocytopenia.
A recent report12 from an international working group established a platelet count threshold of less than 100 × 109/L for diagnosing ITP, down from the previous threshold of 150 × 109/L. The panel also recommended using the term “immune” rather than “idiopathic” thrombocytopenia, emphasizing the role of underlying immune mechanisms. The term “purpura” was removed, because many patients have no or minimal signs of bleeding at the time of diagnosis.12
The 2011 American Society of Hematology’s evidenced-based guidelines for the treatment of ITP present the most recent authoritative diagnostic and therapeutic recommendations.13
ITP is considered to be primary if it occurs in isolation, and secondary if it is associated with an underlying disorder. It is further classified according to its duration since diagnosis: newly diagnosed (< 3 months), persistent (3−12 months), and chronic (> 12 months).
In adults, ITP tends to be chronic, presenting with a more indolent course than in childhood, and unlike childhood ITP, infrequently following a viral infection.
Clinical features associated with ITP are related to thrombocytopenia: petechiae (pinpoint microvascular hemorrhages that do not blanch with pressure), purpura (appearing like large bruises), epistaxis (nosebleeds), menorrhagia, gum bleeding, and other types of mucocutaneous bleeding. Other common clinical features include fatigue, impaired quality of life, and treatment-related side effects (eg, infection).14
A low platelet count may be the sole initial manifestation. The patient’s history, physical examination, blood counts, and findings on blood smear are essential to rule out other diagnoses. Few diagnostic tests are useful in the initial evaluation (Table 1). Abnormalities in the blood count or blood smear may be further investigated with bone marrow biopsy but is not required if the patient has typical features of ITP, regardless of age.
Because there are no specific criteria for diagnosing ITP, other causes of thrombocytopenia must be excluded. The differential diagnosis can be further classified as ITP due to other underlying disease (ie, secondary ITP) vs nonautoimmune causes that are frequently encountered in clinical practice.
SECONDARY ITP
The differential diagnosis of thrombocytopenia due to known underlying immune disease includes the following:
Drug-induced ITP
Recurrent episodes of acute thrombocytopenia not explained by other causes should trigger consideration of drug-induced thrombocytopenia. 11 Patients should be questioned about drug use, especially of sulfonamides, antiepileptics, and quinine. Thrombocytopenia usually occurs 5 to 7 days after beginning the inciting drug for the first time and more quickly when the drug is given intermittently. Heparin is the most common cause of drug-related thrombocytopenia among hospitalized patients; the mechanism is unique and involves formation of a heparin-PF4 immune complex.
Human immunodeficiency virus infection
Approximately 40% of patients with human immunodeficiency virus (HIV) infection develop thrombocytopenia at some time.15 HIV infection can initially manifest as isolated thrombocytopenia and is sometimes clinically indistinguishable from chronic ITP, making it an important consideration in a newly diagnosed case of thrombocytopenia.
The mechanism of thrombocytopenia in early HIV is similar to that in primary ITP: as the disease progresses, low platelet counts can result from ineffective hematopoiesis due to megakaryocyte infection and marrow infiltration.16
Hepatitis C virus infection
Hepatitis C virus (HCV) infection can also cause immune thrombocytopenia. A recent study demonstrated the potential of the HCV core envelope protein 1 to induce antiplatelet antibodies (to platelet surface integrin GPIIIa49-66) by molecular mimicry.17 Other causes of thrombocytopenia in HCV infection may be related to chronic liver disease, such as portal hypertension-related hypersplenism, as well as decreased thrombopoietin production.18 Antiviral treatment with pegylated interferon may also cause mild thrombocytopenia.19
Helicobacter pylori
The association between H pylori infection and ITP remains uncertain. Eradication of infection appears to completely correct ITP in some places where the prevalence of H pylori is high (eg, Italy and Japan) but not in the United States and Canada, where the prevalence is low.20 The different response may be due not only to the differences in prevalence, but to different H pylori genotypes: most H pylori strains in Japan express CagA, whereas the frequency of CagA-positive strains is much lower in western countries.20
In areas where eradication therapy may be useful, the presence of H pylori infection should be determined by either a urea breath test or stool antigen testing.
Lymphoproliferative disorders
Secondary forms of ITP can occur in association with chronic lymphocytic leukemia, non-Hodgkin lymphoma, and Hodgkin lymphoma. These diagnoses should especially be considered in patients presenting with thrombocytopenia accompanied by systemic illness. ITP occurs in at least 2% of patients with chronic lymphocytic leukemia and is usually difficult to distinguish from thrombocytopenia secondary to marrow infiltration or from fludarabine (Fludora) therapy.21
It is especially important to determine if a lymphoproliferative disorder is present because it changes the treatment of ITP. Treatment of ITP complicating chronic lymphocytic leukemia is challenging and includes corticosteroids and steroid-sparing agents such as cyclosporine (Gengraf, Neoral, Sandimmune), rituximab (Rituxan), and intravenous immunoglobulin.22
Systemic lupus erythematosus and other autoimmune diseases
Thrombocytopenia is a frequent clinical manifestation of systemic lupus erythematosus, occurring in 7% to 30% of patients,23 and is an independent risk factor for death.24 Lupus should be suspected in patients with ITP who have multiorgan involvement and other clinical and laboratory abnormalities. A small percentage of patients with ITP (about 2%−5%) develop lupus after several years.21
Thrombocytopenia can also result from other autoimmune disorders such as antiphospholipid antibody syndrome25 and autoimmune thyroid diseases as well as immunodeficient states such as IgA deficiency and common variable immunodeficiency with low IgG levels.
NONAUTOIMMUNE THROMBOCYTOPENIA
Thrombocytopenia can also be caused by a number of nonautoimmune conditions.
Pseudothrombocytopenia
Pseudothrombocytopenia can occur if ex-vivo agglutination of platelets is induced by antiplatelet antibodies to EDTA, a standard blood anticoagulant. Automated counters cannot differentiate the agglutinated platelet clumps from individual cells such as red cells. This can frequently be overcome by running the counts in a citrate or ACD reagent tube. A peripheral blood smear can demonstrate whether platelet clumps are present.
Thrombotic thrombocytopenic purpura
Thrombotic thrombocytopenic purpura presents with thrombocytopenia, purpura, and anemia. Associated clinical abnormalities (fever, neurologic symptoms, and renal failure) and the presence of fragmented red cells on blood smear help to distinguish it from ITP. Plasma exchange is the treatment of choice.
Gestational thrombocytopenia
Five percent of pregnant women develop mild thrombocytopenia (platelet counts typically > 70 × 109/L) near the end of gestation.26 It requires no treatment and resolves after delivery. The fetus’ platelet count remains unaffected.
Gestational thrombocytopenia should be differentiated from the severe thrombocytopenia of preeclampsia and HELLP syndrome (hemolysis, elevated liver enzymes, and low platelet count), which requires immediate attention.
Myelodysplastic syndrome
Myelodysplastic syndrome is common among elderly patients and should be considered in cases of unexplained cytopenia and abnormalities in the peripheral blood smear suggestive of dysplastic cytologic features. It can be diagnosed by bone marrow biopsy. Thrombocytopenia occurs in about 40% to 65% of cases of myelodysplastic syndrome.27
MANAGE ITP TO KEEP PLATELET COUNT ABOVE 30 × 109/L
ITP does not necessarily require treatment, and the initial challenge is to determine whether treatment or observation is indicated. Treatment is based on two major factors: the platelet count and degree of bleeding. The goals of management are to achieve a safe platelet count to prevent serious bleeding while minimizing treatment-related toxicity.7
Adults with platelet counts of less than 30 × 109/L are usually treated. In multiple large cohort studies, patients with platelet counts above that level have been safely observed without treatment.11,28
Table 2 outlines a comprehensive approach to therapy.
INITIAL TREATMENT: STEROIDS AND IMMUNOGLOBULINS
Oral corticosteroids are the initial agents of choice
Oral prednisone 1 mg/kg/day in tapering doses for 4 to 6 weeks is the most common initial regimen. Other regimens, such as high-dose dexamethasone (Decadron) (40 mg daily for 4 days per month) for several cycles, have been reported to be more effective29 but have not been studied in head-to-head trials with oral prednisone.
Due to their effectiveness, low cost, and convenience of use, corticosteroids have been the backbone of initial treatment in ITP. However, in most patients the platelet count decreases once the dose is tapered or stopped; remission is sustained in only 10% to 30% of cases.30 Continuation of corticosteroids is limited by long-term complications such as opportunistic infections, osteoporosis, and emotional lability.31
Intravenous immunoglobulin and anti-D immunoglobulin are alternatives
Intravenous immunoglobulin is recommended for patients who have not responded to corticosteroids and is often used in pregnancy. It is thought to act by blocking Fc receptors in the reticuloendothelial system. Intravenous immunoglobulin rapidly increases platelet counts in 65% to 80% of patients,32 but the effect is transient and the drug requires frequent administration. It is usually well tolerated, although about 5% of patients experience headache, chills, myalgias, arthralgias, and back pain. Rare, serious complications include thrombotic events, anaphylaxis (in IgA-deficient patients), and renal failure.
Anti-D immunoglobulin, a pooled IgG product, is derived from the plasma of Rh(D)-negative donors and can be given only to patients who are Rh(D)-positive. Response rates as high as 70% have been reported, with platelet effects lasting for more than 21 days.33 Studies have shown better results at a high dose (75 μg/kg) than with the approved dose of 50 μg/kg.34
Anti-D immunoglobulin can also be given intermittently whenever the platelet count falls below a specific level (ie, 30 × 109/L). This allows some patients to avoid splenectomy and may even trigger long-term remission.32
Common side effects of anti-D immunoglobulin include fever and chills; these can be prevented by premedication with acetaminophen or corticosteroids. Rare but fatal cases of intravascular hemolysis, renal failure, and disseminated intravascular coagulation have been reported, precluding its use for ITP in some countries, including those of the European Union.
Emergency treatment: Combination therapy
Evidence-based guidelines are limited for treating patients with active bleeding or who are at high risk of bleeding. For uncontrolled bleeding, a combination of first-line therapies is recommended, using prednisone and intravenous immunoglobulin.35 Other options include high-dose methylprednisolone and platelet transfusions, alone or in combination with intravenous immunoglobulin.36
SECOND-LINE TREATMENTS
Splenectomy produces complete remission in most patients
Patients who relapse and have a platelet count of less than 20 × 109/L are traditionally considered for splenectomy. More than two-thirds of patients respond with no need for further treatment.37
Although splenectomy has the highest rate of durable platelet response, the risks associated with surgery are an important concern. Even with a laparoscopic splenectomy, complications occur in 10% of patients and death in 0.2%. Long-term risks include the rare occurrence of sepsis with an estimated mortality rate of 0.73 per 1,000 patient-years, and possible increased risk of thrombosis.38,39
Adherence to recommended vaccination protocols and early administration of antibiotics for systemic febrile illness reduce the risk of sepsis.40 Patients are advised to receive immunization against encapsulated bacteria with pneumococcal, Haemophilus influenzae type b, and meningococcal vaccines. These vaccines should be given at least 2 weeks before elective splenectomy.41
Treatment of patients refractory to splenectomy is challenging and requires further immunosuppressive therapy, which is associated with an increased risk of infections and infection-related deaths.42
Rituximab in addition to or possibly instead of splenectomy
Rituximab (Rituxan) is a chimeric anti-CD20 monoclonal antibody that targets B cells. Although initially approved for treatment of lymphomas, rituximab has gained popularity in treating ITP due to its safety profile and ability to deplete CD20+ B cells responsible for antiplatelet antibody production by Fc-mediated cell lysis.
In the largest systematic review of published reports of rituximab use in ITP (19 studies, 313 patients), Arnold and colleagues43 reported an overall platelet response (defined as platelet count > 50 × 109/L) in 62.5% (95% confidence interval [CI] 52.6%−72.5%) of patients. The median duration of response was 10.5 months (range 3–20), and median follow-up was 9.5 months (range 2–25). Nearly all patients had received corticosteroid treatment and half of them had undergone splenectomy.
Rituximab has also been investigated as an alternative to splenectomy. In a prospective, single-arm, phase 2 trial, 60 patients with chronic ITP (platelet counts < 30 × 109/L) for whom one or more previous treatments had failed received rituximab infusions and were followed for up to 2 years. A good response (defined as a platelet count ≥ 50 × 109/L, with at least a doubling from baseline) was obtained in 24 (40%) of 60 patients (95% CI 28%–52%) at 1 year and 33.3% at 2 years. The authors concluded that rituximab could be used as a presplenectomy therapeutic option, particularly in patients with chronic ITP who are at increased surgical risk or who are reluctant to undergo surgery.44 Based on these results, rituximab may spare some patients from splenectomy, or at least delay it. However, it has never been tested in randomized controlled trials to establish its role as a splenectomy-sparing agent in ITP.
Side effects include infusion reactions, which are usually mild but in rare cases can be severe. Recently, progressive multifocal leukoencephalopathy has been recognized as a complication of rituximab treatment in patients with lymphoproliferative and autoimmune disorders.45 Although this complication is rare in patients with ITP, careful monitoring is required until additional long-term safety data are available.
Thrombopoietic receptor agonists require continuous treatment
In the early 1990s, recombinant thrombopoietin was tested in clinical studies. These were halted when antibodies developed to recombinant thrombopoietin that cross-reacted with endogenous thrombopoietin, resulting in severe thrombocytopenia.46
This led to the development of nonimmunogenic thrombopoietin receptor agonists that mimic the effect of thrombopoietin and stimulate the production of platelets. In 2008, the US Food and Drug Administration approved two drugs of this class for treating ITP: romiplostim (Nplate) and eltrombopag (Promacta). They are mainly used to treat patients with chronic ITP who have had an insufficient response to corticosteroids, immunoglobulins, or splenectomy.
Although well tolerated and effective in increasing platelet counts, these agents share common drawbacks. They do not modify the course of the disease, they are used only to sustain the platelet count, they require repeated administration, and they must be given for about 7 days to achieve an adequate platelet response, so they cannot be used in emergencies. Long-term adverse effects include bone marrow fibrosis and thrombosis.
Romiplostim is a synthetic peptide capable of binding to the thrombopoietin receptor c-Mpl. It has no sequence homology with endogenous thrombopoietin,47 so does not induce cross-reacting antibodies. It has a half-life of 120 to 160 hours and is usually given subcutaneously 1 to 10 μg/kg weekly.
Phase III clinical trials have shown the effectiveness of romiplostim in attaining a durable platelet response (platelet count > 50 × 109/L) in splenectomized and nonsplenectomized populations. It is well tolerated, and only two uncommon serious adverse effects have been reported: bone marrow reticulin formation and thromboembolism.48
A long-term open-label extension study of 142 patients treated with romiplostim for up to 156 weeks showed that 124 (87%) achieved a platelet count of more than 50 × 109/L at some point, and 84% of patients were able to reduce or discontinue concurrent medications for ITP.49
Kuter et al,50 in a randomized controlled trial, confirmed the efficacy of romiplostim in attaining durable increased platelet counts. Patients treated with romiplostim at a mean weekly dose of 3.9 μg/kg ± 2.1 μg/kg demonstrated a higher rate of platelet response, lower incidence of treatment failure, and improved quality of life vs patients treated with standard care.
Eltrombopag is a nonpeptide thrombopoietin agonist that binds to the transmembrane domain of the thrombopoietin receptor and stimulates the proliferation and differentiation of megakaryocytes in bone marrow. It is given orally in doses of 25 to 75 mg daily.
Eltrombopag has been shown to be effective in increasing platelet counts in chronic ITP.51 In a phase III trial conducted by Cheng and colleagues, 197 patients were randomized to eltrombopag or placebo.52 Patients treated with eltrombopag were eight times more likely to achieve platelet counts of more than 50 × 109/L during the 6-month treatment period (odds ratio 8.2, 95% CI 4.32–15.38, P < .001) vs placebo. Patients treated with eltrombopag had fewer bleeding episodes and were more likely to reduce or discontinue the dose of concurrent ITP medications. The only significant side effect seen was a rise in aminotransferases (seen in 7% of eltrombopag recipients vs 2% with placebo).52
Additional thrombopoietin agonists under investigation include ARK-501, totrombopag, and LGD-4665. MDX-33, a monoclonal antibody against the Fc-receptor, is also being studied; it acts by preventing opsonization of autoantibody-coated platelets.53
THIRD-LINE TREATMENTS FOR REFRACTORY CASES
Patients with ITP that is resistant to standard therapies have an increased risk of death, disease, and treatment-related complications.28,42
Combination chemotherapy
Immunosuppressants such as azathioprine (Imuran), cyclosporine (Neoral, Sandimmune), cyclophosphamide (Cytoxan), and mycophenolate (CellCept) were used in the past in single-agent regimens with some efficacy, but their use was limited due to drug-related toxicity and a low safety profile.3 However, there is increasing evidence for a role of combination chemotherapy to treat chronic refractory ITP to achieve greater efficacy and fewer adverse effects.54
Arnold and colleagues55 reported that combined azathioprine, mycophenolate, and cyclosporine achieved an overall response (platelet count > 30 × 109/L and doubling of the baseline) in 14 (73.7%) of 19 patients with chronic refractory ITP, lasting a median of 24 months.
Hematopoietic stem cell transplantation
Hematopoietic stem cell transplantation has provided remission in a limited number of patients. However, it is associated with fatal toxicities such as graft-vs-host disease and septicemia, and therefore it is reserved for severe refractory ITP with bleeding complications unresponsive to other therapies.56,57
THERAPY FOR SECONDARY ITP DEPENDS ON THE CAUSE
Treatments for secondary ITP vary depending on the cause of thrombocytopenia and are often more complex than therapy for primary disease. Optimal management involves treating the underlying condition (eg, chronic lymphocytic leukemia or systemic lupus erythematosus).
Drug-induced thrombocytopenia requires prompt recognition and withdrawal of the inciting agent.
Treating ITP due to HCV infection primarily involves antiviral agents to suppress viral replication. If treating ITP is required, then intravenous immunoglobulin is preferable to glucocorticoids because of the risk of increasing viral load with the latter.58 Eltrombopag may effectively increase platelet counts, allowing patients to receive interferon therapy for HCV.59 However, a recent study was halted due to increased incidence of portal vein thrombosis, raising concerns about the safety of eltrombopag for patients with chronic liver disease.60
Secondary ITP due to HIV infection should always be treated first with antivirals targeting HIV unless thrombocytopenia-related bleeding complications warrant treatment. If treatment for ITP is necessary, it should include corticosteroids, intravenous immunoglobulin, or anti-D immunoglobulin as first-line therapy.
Eradication therapy for H pylori is recommended for patients who are positive for the organism based on urea breath testing, stool antigen testing, or endoscopic biopsies.
- Feudjo-Tepie MA, Robinson NJ, Bennett D. Prevalence of diagnosed chronic immune thrombocytopenic purpura in the US: analysis of a large US claim database: a rebuttal. J Thromb Haemost 2008; 6:711–712.
- Abrahamson PE, Hall SA, Feudjo-Tepie M, Mitrani-Gold FS, Logie J. The incidence of idiopathic thrombocytopenic purpura among adults: a population-based study and literature review. Eur J Haematol 2009; 83:83–89.
- Gernsheimer T. Chronic idiopathic thrombocytopenic purpura: mechanisms of pathogenesis. Oncologist 2009; 14:12–21.
- McMillan R, Wang L, Tomer A, Nichol J, Pistillo J. Suppression of in vitro megakaryocyte production by antiplatelet auto-antibodies from adult patients with chronic ITP. Blood 2004; 103:1364–1369.
- Houwerzijl EJ, Blom NR, van der Want JJ, et al. Ultrastructural study shows morphologic features of apoptosis and para-apoptosis in megakaryocytes from patients with idiopathic thrombocytopenic purpura. Blood 2004; 103:500–506.
- Kuwana M, Kaburaki J, Kitasato H, et al. Immunodominant epitopes on glycoprotein IIb-IIIa recognized by autoreactive T cells in patients with immune thrombocytopenic purpura. Blood 2001; 98:130–139.
- Cines DB, Blanchette VS. Immune thrombocytopenic purpura. N Engl J Med 2002; 346:995–1008.
- Littman DR, Rudensky AY. Th17 and regulatory T cells in mediating and restraining inflammation. Cell 2010; 140:845–858.
- Semple JW, Provan D, Garvey MB, Freedman J. Recent progress in understanding the pathogenesis of immune thrombocytopenia. Curr Opin Hematol 2010; 17:590–595.
- Ballem PJ, Segal GM, Stratton JR, Gernsheimer T, Adamson JW, Slichter SJ. Mechanisms of thrombocytopenia in chronic autoimmune thrombocytopenic purpura. Evidence of both impaired platelet production and increased platelet clearance. J Clin Invest 1987; 80:33–40.
- George JN. Definition, diagnosis and treatment of immune thrombocytopenic purpura. Haematologica 2009; 94:759–762.
- Rodeghiero F, Stasi R, Gernsheimer T, et al. Standardization of terminology, definitions and outcome criteria in immune thrombocytopenic purpura of adults and children: report from an international working group. Blood 2009; 113:2386–2393.
- Neunert C, Lim W, Crowther M, Cohen A, Solberg L, Crowther MA; American Society of Hematology. The American Society of Hematology 2011 evidence-based practice guideline for immune thrombocytopenia. Blood 2011; 117:4190–4207.
- Newton JL, Reese JA, Watson SI, et al. Fatigue in adult patients with primary immune thrombocytopenia. Eur J Haematol 2011; 86:420–429.
- Stasi R, Willis F, Shannon MS, Gordon-Smith EC. Infectious causes of chronic immune thrombocytopenia. Hematol Oncol Clin North Am 2009; 23:1275–1297.
- Moses A, Nelson J, Bagby GC. The influence of human immunodeficiency virus-1 on hematopoiesis. Blood 1998; 91:1479–1495.
- Zhang W, Nardi MA, Borkowsky W, Li Z, Karpatkin S. Role of molecular mimicry of hepatitis C virus protein with platelet GPIIIa in hepatitis C-related immunologic thrombocytopenia. Blood 2009; 113:4086–4093.
- Peck-Radosavljevic M. Thrombocytopenia in liver disease. Can J Gastroenterol 2000; 14(suppl D):60D–66D.
- Roomer R, Hansen BE, Janssen HL, de Knegt RJ. Thrombocytopenia and the risk of bleeding during treatment with peginterferon alfa and ribavirin for chronic hepatitis C. J Hepatol 2010; 53:455–459.
- Stasi R, Sarpatwari A, Segal JB, et al. Effects of eradication of Helicobacter pylori infection in patients with immune thrombocytopenic purpura: a systematic review. Blood 2009; 113:1231–1240.
- Cines DB, Bussel JB, Liebman HA, Luning Prak ET. The ITP syndrome: pathogenic and clinical diversity. Blood 2009; 113:6511–6521.
- Zent CS, Kay NE. Autoimmune complications in chronic lymphocytic leukaemia (CLL). Best Pract Res Clin Haematol 2010; 23:47–59.
- Hepburn AL, Narat S, Mason JC. The management of peripheral blood cytopenias in systemic lupus erythematosus. Rheumatology (Oxford) 2010; 49:2243–2254.
- Mok CC, Lee KW, Ho CT, Lau CS, Wong RW. A prospective study of survival and prognostic indicators of systemic lupus erythematosus in a southern Chinese population. Rheumatology (Oxford) 2000; 39:399–406.
- Cervera R, Piette JC, Font J, et al; Euro-Phospholipid Project Group. Antiphospholipid syndrome: clinical and immunologic manifestations and patterns of disease expression in a cohort of 1,000 patients. Arthritis Rheum 2002; 46:1019–1027.
- Burrows RF, Kelton JG. Fetal thrombocytopenia and its relation to maternal thrombocytopenia. N Engl J Med 1993; 329:1463–1466.
- Kantarjian H, Giles F, List A, et al. The incidence and impact of thrombocytopenia in myelodysplastic syndromes. Cancer 2007; 109:1705–1714.
- Portielje JE, Westendorp RG, Kluin-Nelemans HC, Brand A. Morbidity and mortality in adults with idiopathic thrombocytopenic purpura. Blood 2001; 97:2549–2554.
- Cheng Y, Wong RS, Soo YO, et al. Initial treatment of immune thrombocytopenic purpura with high-dose dexamethasone. N Engl J Med 2003; 349:831–836.
- Bromberg ME. Immune thrombocytopenic purpura—the changing therapeutic landscape. N Engl J Med 2006; 355:1643–1645.
- Guidry JA, George JN, Vesely SK, Kennison SM, Terrell DR. Corticosteroid side-effects and risk for bleeding in immune thrombocytopenic purpura: patient and hematologist perspectives. Eur J Haematol 2009; 83:175–182.
- Cooper N. Intravenous immunoglobulin and anti-RhD therapy in the management of immune thrombocytopenia. Hematol Oncol Clin North Am 2009; 23:1317–1327.
- Scaradavou A, Woo B, Woloski BM, et al. Intravenous anti-D treatment of immune thrombocytopenic purpura: experience in 272 patients. Blood 1997; 89:2689–2700.
- Newman GC, Novoa MV, Fodero EM, Lesser ML, Woloski BM, Bussel JB. A dose of 75 microg/kg/d of i.v. anti-D increases the platelet count more rapidly and for a longer period of time than 50 microg/kg/d in adults with immune thrombocytopenic purpura. Br J Haematol 2001; 112:1076–1078.
- Provan D, Stasi R, Newland AC, et al. International consensus report on the investigation and management of primary immune thrombocytopenia. Blood 2010; 115:168–186.
- Spahr JE, Rodgers GM. Treatment of immune-mediated thrombocytopenia purpura with concurrent intravenous immunoglobulin and platelet transfusion: a retrospective review of 40 patients. Am J Hematol 2008; 83:122–125.
- Kojouri K, Vesely SK, Terrell DR, George JN. Splenectomy for adult patients with idiopathic thrombocytopenic purpura: a systematic review to assess long-term platelet count responses, prediction of response, and surgical complications. Blood 2004; 104:2623–2634.
- Schilling RF. Estimating the risk for sepsis after splenectomy in hereditary spherocytosis. Ann Intern Med 1995; 122:187–188.
- Crary SE, Buchanan GR. Vascular complications after splenectomy for hematologic disorders. Blood 2009; 114:2861–2868.
- Davies JM, Barnes R, Milligan D; British Committee for Standards in Haematology. Update of guidelines for the prevention and treatment of infection in patients with an absent or dysfunctional spleen. Clin Med 2002; 2:440–443.
- Centers for Disease Control and Prevention (CDC). Recommended adult immunization schedule—United States, 2011. MMWR Morb Mortal Wkly Rep 2011; 60:1–4.
- McMillan R, Durette C. Long-term outcomes in adults with chronic ITP after splenectomy failure. Blood 2004; 104:956–960.
- Arnold DM, Dentali F, Crowther MA, et al. Systematic review: efficacy and safety of rituximab for adults with idiopathic thrombocytopenic purpura. Ann Intern Med 2007; 146:25–33.
- Godeau B, Porcher R, Fain O, et al. Rituximab efficacy and safety in adult splenectomy candidates with chronic immune thrombocytopenic purpura: results of a prospective multicenter phase 2 study. Blood 2008; 112:999–1004.
- Carson KR, Evens AM, Richey EA, et al. Progressive multifocal leukoencephalopathy after rituximab therapy in HIV-negative patients: a report of 57 cases from the Research on Adverse Drug Events and Reports project. Blood 2009; 113:4834–4840.
- Li J, Yang C, Xia Y, et al. Thrombocytopenia caused by the development of antibodies to thrombopoietin. Blood 2001; 98:3241–3248.
- Kuter DJ. New thrombopoietic growth factors. Blood 2007; 109:4607–4616.
- Kuter DJ, Bussel JB, Lyons RM, et al. Efficacy of romiplostim in patients with chronic immune thrombocytopenic purpura: a double-blind randomised controlled trial. Lancet 2008; 371:395–403.
- Bussel JB, Kuter DJ, Pullarkat V, Lyons RM, Guo M, Nichol JL. Safety and efficacy of long-term treatment with romiplostim in thrombocytopenic patients with chronic ITP. Blood 2009; 113:2161–2171.
- Kuter DJ, Rummel M, Boccia R, et al. Romiplostim or standard of care in patients with immune thrombocytopenia. N Engl J Med 2010; 363:1889–1899.
- Bussel JB, Provan D, Shamsi T, et al. Effect of eltrombopag on platelet counts and bleeding during treatment of chronic idiopathic thrombocytopenic purpura: a randomised, double-blind, placebo-controlled trial. Lancet 2009; 373:641–648.
- Cheng G, Saleh MN, Marcher C, et al. Eltrombopag for management of chronic immune thrombocytopenia (RAISE): a 6-month, randomised, phase 3 study. Lancet 2011; 377:393–402.
- Arnold DM, Nazi I, Kelton JG. New treatments for idiopathic thrombocytopenic purpura: rethinking old hypotheses. Expert Opin Investig Drugs 2009; 18:805–819.
- Boruchov DM, Gururangan S, Driscoll MC, Bussel JB. Multiagent induction and maintenance therapy for patients with refractory immune thrombocytopenic purpura (ITP). Blood 2007; 110:3526–3531.
- Arnold DM, Nazi I, Santos A, et al. Combination immunosuppressant therapy for patients with chronic refractory immune thrombocytopenic purpura. Blood 2010; 115:29–31.
- Passweg JR, Rabusin M. Hematopoetic stem cell transplantation for immune thrombocytopenia and other refractory autoimmune cytopenias. Autoimmunity 2008; 41:660–665.
- Huhn RD, Fogarty PF, Nakamura R, et al. High-dose cyclophosphamide with autologous lymphocyte-depleted peripheral blood stem cell (PBSC) support for treatment of refractory chronic autoimmune thrombocytopenia. Blood 2003; 101:71–77.
- Magrin S, Craxi A, Fabiano C, et al. Hepatitis C viremia in chronic liver disease: relationship to interferon-alpha or corticosteroid treatment. Hepatology 1994; 19:273–279.
- McHutchison JG, Dusheiko G, Shiffman ML, et al; TPL102357 Study Group. Eltrombopag for thrombocytopenia in patients with cirrhosis associated with hepatitis C. N Engl J Med 2007; 357:2227–2236.
- US Department of Health & Human Services. Promacta (eltrombopag): Portal Venous System Thromboses in Study of Patients With Chronic Liver Disease http://www.fda.gov/Safety/MedWatch/SafetyInformation/SafetyAlertsforHumanMedicalProducts/ucm211796.htm. Accessed June 27, 2012.
KEY POINTS
- Secondary ITP can be drug-induced or be a manifestation of human immunodeficiency virus (HIV), hepatitis C virus (HCV), a lymphoproliferative disorder, or systemic lupus erythematosus.
- Nonautoimmune conditions should also be considered, including pseudothrombocytopenia (a laboratory artifact induced by EDTA), thrombotic thrombocytopenic purpura, thrombocytopenia in pregnancy, and myelodysplastic syndrome (common in the elderly).
- Treatment is indicated to keep the platelet count above 30 × 109/L or to control bleeding.
- Initial treatment usually begins with glucocorticoids, with the duration limited by side effects.
- Patients for whom glucocorticoids fail generally require splenectomy, rituximab, or thrombopoietin receptor agonists.
New and Noteworthy Information—September
Persons who are obese and who also have metabolic abnormalities are likely to have faster cognitive decline, according to a study published in the August 21 Neurology. Researchers gathered data on BMI and metabolic status at the start of the study and then administered four cognitive tests throughout the next decade. Of the 6,401 adults (ages 39 to 63) who provided data on BMI, 31% had metabolic abnormalities, which were defined as having two or more of several risk factors, including high blood pressure. In the metabolically normal group, the 10-year decline in the global cognitive score was similar among the normal weight, overweight, and obese persons. The investigators observed the fastest cognitive decline in those who were both obese and metabolically abnormal.
Patients with atrial fibrillation and chronic kidney disease have an increased risk of stroke or systemic thromboembolism and bleeding, researchers reported in the August 16 New England Journal of Medicine. The study included 132,372 patients who were discharged from the hospital with a diagnosis of nonvalvular atrial fibrillation. Among this group, 3,587 had non–end stage chronic kidney disease and 901 required
renal-replacement therapy at time of inclusion. Compared with patients who did not have renal disease, those with non–end stage chronic kidney disease and those who required renal-replacement therapy had an increased risk of stroke or systemic thromboembolism. Patients in both renal disease groups who took warfarin but not aspirin significantly decreased this risk. However, warfarin and aspirin were associated with an increased risk of bleeding, the researchers noted.
Patients with Alzheimer’s disease who are hospitalized are more likely to experience delirium, which is associated with an increased risk of cognitive decline for up to five years, researchers reported in the online August 20 Archives of Internal Medicine. The investigators prospectively collected data from 263 patients with Alzheimer’s disease between 1991 and 2006 and found that 56% of patients with Alzheimer’s disease developed delirium during hospitalization. Before hospitalization, patients showed no difference in rates of cognitive decline, but patients who developed delirium had greater cognitive deterioration in the year after hospitalization than those who did not. In addition, this increased rate of deterioration was observed throughout the five-year period following hospitalization. “Strategies to prevent delirium may represent a promising avenue to explore for ameliorating cognitive deterioration in Alzheimer’s disease,” the researchers concluded.
Chronic cerebrospinal venous insufficiency (CCSVI) does not have an impact on the neurologic function or disability progression of patients with multiple sclerosis (MS), though it does play a role in cerebral hemodynamic changes, according to a study published in the online August 21 Radiology. Using MRI, researchers assessed cerebral blood volume and flow in 39 patients with MS (25 with CCSVI), and 26 healthy controls (14 with CCSVI). Results showed that persons with CCSVI in both the MS and control groups displayed cerebral hemodynamic anomalies, but no significant relationship was observed between MS and CCSVI for any of the hemodynamic parameters. Furthermore, no correlations were found between cerebral blood flow and volume values in normal-appearing white matter or for severity of disability in patients with MS. “The data support a role of CCSVI in cerebral hemodynamic changes … regardless of the presence of MS,” the researchers concluded.
Relatives of persons who are cognitively intact during late old age and who have high levels of C-reactive protein are more likely to avoid dementia, according to a study published in the August 15 online Neurology. Researchers identified a primary sample of 1,329 patients and siblings of 277 male veteran probands who were cognitively intact and at least 75 years old. The study also included a replication sample of 202 relatives of 51 cognitively intact, community-ascertained probands who were at least 85 years old. Results from both the primary and replication samples showed that relatives with higher levels of C-reactive protein were less likely to develop dementia (hazard ratio, 0.55). “High C-reactive protein in successful cognitive aging individuals may constitute a phenotype for familial—and thus possibly genetic—successful cognitive aging,” the study authors concluded.
More cases of West Nile virus have been documented in the United States thus far in 2012 than in any year since 1999, when the disease was first detected in the US, according to the CDC. As of August 14, 700 cases of West Nile virus had been reported, and 26 people had died from the disease. The increase in cases may be a result of last year’s mild winter and this year’s wet spring, researchers theorize. Among people bitten by an infected mosquito, 20% have symptoms that last from a few days to several weeks, and approximately one in 150 of those infected with West Nile have a severe and potentially fatal illness. Severe symptoms include high fever, headache, neck stiffness, stupor, disorientation, coma, tremors, convulsions, muscle weakness, vision loss, numbness, and paralysis. The neurologic effects from these severe symptoms may be permanent.
Speech therapy reorganizes the brains of patients with persistent developmental stuttering, according to a study published in the August 14 Neurology. Researchers examined resting-state functional connectivity (RSFC) and cortical thickness before and after therapy in 15 patients with stuttering who received the intervention, 13 patients with stuttering who did not receive the intervention, and 13 fluent controls. Before the therapeutic intervention, both groups of patients who stuttered had significant reductions in RSFC in the left pars opercularis as well as RSFC increases in the cerebellum. After the intervention, patients who stuttered showed decreases in stuttering and displayed RSFC levels in the cerebellum that matched those of fluent controls, though there was no change in the RSFC levels or cortical thickness of the left pars opercularis. This research suggests that the left pars opercularis and the cerebellum may play a role in stuttering, the study authors said.
Daily caffeine use provides only borderline improvement in excessive sleepiness in patients with Parkinson’s disease, but it does show benefits for motor function, researchers reported in the August 14 Neurology. In this six-week, randomized controlled clinical trial, 31 patients received placebo and 61 patients received 100 mg of caffeine supplements twice a day for three weeks, followed by 200 mg of caffeine supplements twice a day for three weeks. Analysis showed that caffeine led to a nonsignificant reduction in Epworth Sleepiness Scale score on the primary intention-to-treat analysis and a significant reduction in the Epworth Sleepiness Scale score on per-protocol analysis. In addition, use of caffeine reduced the total Unified Parkinson’s Disease Rating Scale score as well as the objective motor component. “These potential benefits suggest that a larger, long-term trial of caffeine is warranted,” the researchers concluded.
Black survivors of intracerebral hemorrhage are more likely than whites to have high blood pressure a year after stroke, which puts them at higher risk of another stroke, researchers reported in the August 16 online Stroke. The study included 162 patients (mean age, 59) with spontaneous intracerebral hemorrhage—77% of patients were black and 53% were male. At presentation, the mean arterial blood pressure in blacks was 9.6 mm Hg higher than in whites, even after adjusting for confounders. Furthermore, blacks were more likely than whites to have stage I/II hypertension one year following stroke, though there was no difference between blacks and whites at 30 days. Fewer than 20% of the overall patient group had normal blood pressure at 30 days or one year, leading researchers to conclude that “long-term blood pressure control is inadequate in patients after intracerebral hemorrhage, particularly in blacks.”
—Lauren LeBano