User login
What the SGR Repeal Means for Hospitalists
The long awaited permanent repeal of the poorly designed Sustainable Growth Rate (SGR) came just in time to avert the 21.2% Medicare physician payment cut that would have taken effect on April 1st, 2015. The SGR formula was first enacted in the Balanced Budget Act of 1997 with the intent to control Medicare spending on physician services. The federal budget sequester in the Budget Control Act of 2011 led to heightened speculation of doom and gloom about the U.S. debt and, ultimately, the necessity of a massive reduction in Medicare payments. Over the past decade, lawmakers have managed to pass 17 various delays and adjustments to keep spending in line with the target SGR. In its place, Congress finally passed H.R. 2, the Medicare Access and CHIP Reauthorization Act (MACRA), which was signed into law by President Obama on April 16, 2015.
What physicians should expect:
(1) The bill includes a 0.5% physician pay increase per year for the next five years beginning July 1, 2015.
(2) It incentivizes physicians to use alternate payment models that focus on care coordination and preventive care.
(3) It consolidates the three existing Medicare quality reporting programs known as the Physician Quality Reporting System (PQRS), Meaningful Use of Electronic Health Records, and the Physician Value-Based Payment Modifier, as well as their associated penalties into a single value-based performance program called the Merit-based Incentive Payment System (MIPS) which starts in 2019.
Is this good for hospitalists? While hospitalists are now protected from the 21% pay cut, we are still faced with increasing burden of legislative mandates on quality metrics. This has created unique challenges for acute inpatient care. The current individual incentive programs will remain in effect until MIPS in 2019, mandating the reporting of PQRS and VBPMs in order to avoid penalties. As such, we will need to continue to focus our efforts on meeting these challenges by aligning our performance measures with that of our institutions. This includes helping to develop alternative payment mechanisms (APMs), such as accountable care organizations (ACOs), patient-centered medical homes, bundled-payment arrangements, and other models. Of note, physicians involved in APMs will not be subject to MIPS assessment and will receive an annual 5% increase from 2019-2024.
The legislation creates other concerns such as the planned enforcement of Medicare's “2-midnight” rule, the requirement of EHR to be interoperable by the end of 2018, and the uncertainty of fairness of CMS in assessing quality and incentive payments. And the question remains, will Congress shift its attention to lowering payments for hospitals and non-physician providers to offset the once expected Medicare cuts? Hospitalists are distinctively qualified to potentially make headway given our already very active involvement in hospital process improvements. It will be in our best interest to stay vocal at the hospital, local, and national level.
Decreased RBC clearance predicts ill health

New research suggests that increased red blood cell distribution width (RDW) is caused by reduced clearance of aging red blood cells (RBCs) from the bloodstream.
And previous studies showed that elevations in RDW predict the development, progression, and risk of death from many conditions.
“It appears that the human body slightly slows down the production and destruction of red blood cells in just about every major disease,” said John Higgins, MD, of Massachusetts General Hospital in Boston.
“If we can accurately measure the production or destruction rates, we might be able to identify many of these diseases in their earlier stages when they are most treatable. Existing measures of the production rate are far too imprecise to detect these subtle changes, but this paper shows how the destruction rate can be estimated using existing blood count data and a mathematical model.”
The paper has been published in the American Journal of Hematology.
Healthy adults generate RBCs at a rate of more than 2 million per second, and the cells circulate in the bloodstream for 100 to 120 days, during which their size decreases by around 30%. Aged RBCs are then cleared at about the same rate of 2 million per second.
Prior to the reports linking elevated RDW with an increased risk for many diseases, that measure had only been used to help distinguish between different forms of anemia.
To understand the correlation between RDW and disease prognosis, Dr Higgins and his colleagues analyzed raw data from more than 60,000 randomly selected blood samples. They used a mathematical model to replicate how RBC populations behave differently in health and in disease.
The researchers measured the extent to which RBCs in different phases of their life cycle contribute to increased RDW and found that the variance in size was strongly determined by mild increases in the numbers of the smallest and oldest cells.
Since the most important mechanism controlling the number of the oldest cells is the rate at which they are cleared from the bloodstream, the team made several predictions, which were validated by applying their model to clinical data from the blood samples and to data from several published studies.
The researchers found that increased RDW was associated with delayed RBC clearance, and increased RDW was associated with increased average age of RBCs.
Delayed RBC clearance was as strongly associated with overall risk of death, as was increased RDW, and delayed RBC clearance was associated with the presence of early signs of hidden diseases associated with increased RDW.
Patients with delayed RBC clearance had a greater risk of developing signs of those diseases in the future than patients with a typical clearance rate. In healthy patients, the rate of RBC clearance varied less than any other traditional blood-count characteristic.
Dr Higgins said there are many potential clinical applications of these findings, which need to be validated by future studies.
“Finding a reduced clearance rate in an apparently healthy person would likely mean that an underlying disease process was developing—such as the early stages of iron deficiency, kidney disease, colon cancer, or congestive heart failure—and would warrant further diagnostic evaluation,” Dr Higgins said.
“Based on this analysis of routine blood tests, a primary care physician could immediately consider appropriate follow-up diagnostic testing, instead of waiting for other signs and symptoms to appear as the condition progresses. In a patient with established disease, a reduced clearance rate could mean progression of disease or treatment failure, and imminent complications could be avoided or reduced by adjusting treatment right away or at least by more frequent monitoring.”
“In addition to confirming our findings in prospective studies that would follow a group of patients over time, we hope to identify the diseases for which an early warning provided by delayed clearance would lead to the most significant improvements in patient outcomes. We’d also like to understand more about the processes controlling red blood cell clearance and are actively developing similar models for populations of white blood cells and platelets.” ![]()
Gene therapy appears effective against WAS
![]()
Photo by Chad McNeeley
Results of a small study suggest gene therapy can lead to clinical improvements in children and teens with Wiskott-Aldrich syndrome (WAS).
The gene therapy—autologous, gene-corrected hematopoietic stem cells (HSCs) given along with chemotherapy—improved infectious complications, severe eczema, and symptoms of autoimmunity in 6 of the 7 patients studied.
The therapy also reduced patients’ use of blood products and the amount of time they spent in the hospital.
Marina Cavazzana, MD, PhD, of Necker Children’s Hospital in Paris, France, and colleagues reported these results in JAMA. The study was sponsored by Genethon.
The researchers noted that WAS is caused by loss-of-function mutations in the WAS gene. The condition is characterized by thrombocytopenia, eczema, and recurring infections. In the absence of definitive treatment, patients with classic WAS generally do not survive beyond their second or third decade of life.
Partially HLA-matched, allogeneic HSC transplant is often curative, but it is associated with a high incidence of complications. Dr Cavazzana and colleagues speculated that transplanting autologous, gene-corrected HSCs may be an effective and potentially safer alternative.
So the team assessed the outcomes and safety of autologous HSC gene therapy in 7 patients (age range, 0.8-15.5 years) with severe WAS who lacked HLA antigen-matched related or unrelated HSC donors.
Patients were enrolled in France and England and treated between December 2010 and January 2014. Follow-up ranged from 9 months to 42 months.
The treatment involved collecting mutated HSCs from patients and correcting the cells in the lab by introducing a healthy WAS gene using a lentiviral vector developed and produced by Genethon. The corrected cells were reinjected into patients who, in parallel, received chemotherapy to suppress their defective stem cells and autoimmune cells to make room for new, corrected cells.
Six of the 7 patients saw clinical improvements after this treatment. One patient died of pre-existing, treatment-refractory infectious disease.
In the 6 surviving patients, infectious complications resolved after gene therapy, and prophylactic antibiotic therapy was successfully discontinued in 3 cases. Severe eczema resolved in all affected patients, as did signs and symptoms of autoimmunity.
There were no severe bleeding episodes after treatment. And, at last follow-up, none of the 6 surviving patients required blood product support.
The median number of hospitalization days decreased from 25 during the 2 years before treatment to 0 during the 2 years after treatment.
“[T]he patients showed a significant clinical improvement due to the re-expression of the protein WASp in the cells of the immune system,” Dr
Cavazzana said.
However, the researchers also noted that the interpretation of these results is constrained by the small number of patients studied. So the team said they could not draw conclusions on long-term outcomes and safety without further follow-up and additional trials. ![]()
Interventions reduce bloodstream infections

A bundled intervention can considerably reduce central line-associated bloodstream infections (CLABSIs), according to research published in Infection Control & Hospital Epidemiology.
The intervention focused on evidence-based infection prevention practices, safety culture and teamwork, and scheduled measurement of infection rates.
By implementing these measures, intensive care units (ICUs) in Abu Dhabi achieved an overall 38% reduction in CLABSIs.
“These hospitals were able to show significant improvements in infection rates and have been able to sustain the improvements a year after we finished the project,” said study author Asad Latif, MBBS, MD, of the Johns Hopkins University School of Medicine in Baltimore, Maryland.
“Our results suggest that ICUs in disparate settings around the world could use this program and achieve similar results, significantly reducing the global morbidity, mortality, and excess costs associated with CLABSIs. In addition, this collaborative could serve as a model for future efforts to reduce other types of preventable medical harms in the Middle East and around the world.”
This study was a collaborative effort by the Armstrong Institute, Johns Hopkins Medicine International, and the Abu Dhabi Health Services Company (SEHA), which operates the government healthcare system in Abu Dhabi.
For the study, ICUs were instructed to assemble a comprehensive unit-based safety program (CUSP) team comprising local physician and nursing leaders, a senior executive, frontline healthcare providers, an infection control provider, and hospital quality and safety leaders.
The ICUs included 10 adult, 5 neonatal, and 3 pediatric ICUs, accounting for 77% of the adult, 74% of the neonatal, and 100% of the pediatric ICU beds in Abu Dhabi.
Starting in May 2012, the SEHA corporate quality team and ICU CUSP teams attended 14 weekly live webinars on CLABSI prevention conducted by Armstrong Institute faculty, followed by content and coaching webinars every 2 weeks for 24 months. The webinars were recorded by SEHA and posted on a local, shared computer drive, along with educational and training materials.
Armstrong faculty also conducted 4 site visits in Abu Dhabi at the beginning of the study, visiting each ICU to meet the CUSP team and tour the units. A year later, they conducted a 3-day patient safety workshop for participating hospitals.
CUSP teams implemented 3 interventions as part of the program: an effort to prevent CLABSIs that targeted clinicians’ use of evidence-based infection prevention recommendations from the Centers for Disease Control and Prevention, a CUSP process to improve safety culture and teamwork, and measurement of monthly CLABSI data and feedback to safety teams, senior leaders, and ICU staff.
The overall mean crude CLABSI rate for participating ICUs decreased from 2.56 infections per 1000 catheter days to 1.79 per 1,000 catheter days by the end of the study, corresponding to a 30% reduction.
By unit type, CLABSI rates decreased by 16% among adult ICUs, 48% among pediatric ICUs, and 47% in neonatal ICUs. The percentage of ICUs that achieved a quarterly CLABSI rate of less than 1 infection per 1000 catheter days increased from 44% to 61% after the interventions.
“Despite growing awareness, many hospitals around the world continue to struggle in their efforts to meaningfully reduce their CLABSI rates in a sustained manner,” said Sean M. Berenholtz, MD, of the Johns Hopkins University School of Medicine.
“In addition, hospitals and healthcare systems in the Middle East have unique barriers to implementing quality improvement programs, such as challenges with staff recruitment and retention, and personnel fearful of punitive repercussions from speaking up regarding patient safety concerns. In our study, bringing all stakeholders to the same table allowed everyone to share their concerns and ensure their voices were heard.” ![]()
Discovery could aid treatment of leukemia, lymphoma

Photo courtesy of IRCM
Researchers say they have uncovered a mechanism that could aid the development of therapies for lymphomas and leukemias.
The group’s research shed new light on a mechanism affecting activation-induced deaminase (AID), an enzyme that has proven crucial for immune response.
Javier Di Noia, PhD, of Institut de Recherches Cliniques de Montreal (IRCM) in Quebec, Canada, and his colleagues described this mechanism in The Journal of Experimental Medicine.
Dr Di Noia noted that, although AID is crucial for an efficient antibody response, high levels of the enzyme can have harmful effects and lead to cancer-causing mutations.
“The objective is to find the perfect level of AID activity to maximize the protection it provides to the body while reducing the risk of damage it can cause to cells,” he said.
Dr Di Noia and his colleagues previously found that heat-shock protein 90 (Hsp90) maintains the levels of AID by stabilizing it while it is still immature. In fact, they discovered that inhibiting Hsp90 significantly reduces the levels of AID in the cell.
“Through this new study, we identified another mechanism, controlled by the protein eEF1a [elongation factor eukaryotic elongation factor 1 α], that has the opposite effect,” said Stephen P. Methot, a PhD student in Dr Di Noia’s lab.
“The protein eEF1a retains AID in the cell’s cytoplasm, away from the genome. However, unlike Hsp90, it maintains AID in a ready-to-act state. We discovered that blocking the interaction between AID and eEF1a helps AID access the cell nucleus and thereby boosts AID activity. As a result, this could increase immune response and help fight infections, for instance.”
“We found the eEF1a mechanism is necessary to restrict AID activity in the cell. It acts as a buffer by allowing the cell to accumulate enough AID to be efficient but limits its activity to prevent the oncogenic or toxic effects that could result if too much AID is in continuous contact with the genome.”
The researchers also identified 2 existing drugs that can act on the eEF1a mechanism to release AID into the cell. The team said these drugs could potentially be used to boost AID activity and, thus, immune responses.
“With this discovery, we now understand mechanisms that can both reduce and increase the activity of AID by targeting different proteins,” Dr Di Noia said.
“This knowledge could eventually lead to new treatments to boost the immune system and help our aging population fight influenza, for example, as AID activity in our cells decreases with age. On the other hand, therapies could also be developed to lower toxic levels of AID in certain cancers such as B-cell lymphoma and leukemia.” ![]()
Glioblastoma, bone sarcoma, and liver cancer: tough battles rage on for some tumors
osteosarcoma, chondrosarcoma, CS, Ewing sarcoma, ES, hepatocellular carcinoma, HCC
osteosarcoma, chondrosarcoma, CS, Ewing sarcoma, ES, hepatocellular carcinoma, HCC
osteosarcoma, chondrosarcoma, CS, Ewing sarcoma, ES, hepatocellular carcinoma, HCC
Most Hospitalist Groups Don’t Offer Paid Time Off
More than two-thirds of HM groups do not offer paid time off (PTO) to their hospitalists, but lack of vacation time isn’t a career deal breaker for aspiring hospitalists, say some HM leaders.
“Lack of separate PTO in general has not affected young hospitalists from choosing hospital medicine as their career, as hospital medicine offers many other positives,” says Bhavin Patel, MD, assistant professor in the department of internal medicine at the University of Minnesota Medical School in Duluth and a member of SHM’s Practice Analysis Committee. “Given there has not be any major push to either build PTO hours into scheduling or to offer it separately for many [hospital medicine groups], it may not be a major factor for many or most hospitalists.”
SHM surveyed HM groups about their PTO benefits and included the results in its 2014 State of Hospital Medicine Report. The survey examined HM groups that serve adults only and categorized the groups by geographic region, ownership/employment model, academic status, primary hospital graduate medical education program status, and practice size.
Results showed that larger groups were more likely to offer PTO benefits and more PTO hours than smaller groups. Only 21.1% of groups with four or fewer full-time equivalent hospitalists (FTE) offered PTO, with a median of 120 hours, and 45.9% of groups with 30 or more FTE offered PTO, with a median of 194 hours, according to the survey. The median amount of PTO among all groups was 160 hours per year.
Carolyn Sites, DO, FHM, senior medical director of hospitalist programs at Providence Health & Services in Oregon and also a member of SHM’s Practice Analysis Committee, says the difference in PTO between large and small groups is not surprising.
“Larger practice size offers more flexibility because you have enough staff to cover the hospital,” says Dr. Sites. “Hospital health systems may have a higher percentage of PTO offered due to their size and the need to offer similar benefits to all their employees. A small group is more challenged in being able to provide adequate coverage when a provider is absent. It usually means somebody has to work a lot more shifts to cover for the person who is absent.”
The survey also found that HM groups in the eastern U.S. and those employed by a hospital health system and/or academic groups were more likely to offer PTO and more hours. In the East, 50% of groups offered PTO, with a median amount of 200 hours annually. Similarly, 54.9% of groups with academic status as well as 47.4% of groups at university-based teaching hospitals offered PTO, with medians of 208 hours and 200 hours annually, respectively.
According to Dr. Sites, the overall 160-hour median amount of PTO is appropriate. “Assuming average shift lengths are 10 to 12 hours in length, this would convert to between 13 to 16 shifts off per year,” she notes. “This provides for two weeks break per year or several slightly shorter breaks per year.”
In terms of what research needs to be conducted to better analyze PTO patterns, Dr. Sites expresses that more “in-depth knowledge of the operational differences between groups that offer PTO and those that don’t” is necessary.
Visit our website for more information on PTO for hospitalists.
Outpatient Status Determinations for Medicare Patients Costly, Time-Consuming
The process of determining outpatient and inpatient status for hospitalized Medicare beneficiaries needs reform, according to a recent article in the Journal of Hospital Medicine.
These status determinations, made by Recovery Audit Contractors (RACs), are a growing concern for hospitals as increasing numbers of Medicare patients are hospitalized as outpatients under observation status and are not covered by Medicare Part A hospital insurance and subject to uncapped out-of-pocket charges under Medicare Part B.
The paper’s lead author, Ann M. Sheehy, MD, MS, FHM, a hospitalist at the University of Wisconsin School of Medicine and Public Health in Madison and member of SHM’s Public Policy Committee, has testified before Congress on the issues of patient observation status and Medicare’s RAC program.
“The increase in RAC audits has prompted the growth, or at least been one of the factors in the growth, of observation care across the country,” Dr. Sheehy says.
The recent study by Dr. Sheehy and colleagues focused on Medicare Part A complex reviews at three academic hospitals between 2010 and 2013. All 8,110 RAC audits that occurred during the time period, from the more than 100,000 Medicare encounters at those institutions, all challenged billing status, never the care delivered. To manage these audits, each institution needed 5.1 full-time employees. “It’s very costly for hospitals and the government to manage this process,” Dr. Sheehy says.
The report also found that the mean duration for appeals of RAC decisions was 555 days. “It’s pretty easy to say that’s a failure of due process,” Dr. Sheehy says. “It’s hard for a hospital to have payments tied up for two or three years and still have enough money to take care of patients.”
Likewise, the RAC reporting was not transparent, Dr. Sheehy notes. Most successful hospital appeals were won during the discussion period, but because that is not part of the formal appeal period, the RACs didn’t report those numbers, meaning that most favorable decisions for hospitals did not appear in federal appeals reports. “We feel that any report of RAC accuracy is meaningless without reporting what happens in discussion, where most overturns are occurring,” Dr. Sheehy says.
“It is a process that’s flawed at this point,” Dr. Sheehy adds. “We hope this paper will contribute in some way to RAC reform, and that will help providers.”
Visit our website for more information on avoiding Medicare audits.
Unrecognized diabetes common in acute MI
Ten percent of patients who presented with acute MI to 24 U.S. hospitals during a 3-year study had unrecognized diabetes, and only one-third of these cases were identified during the MI hospitalization, according to a report published online April 21 in Circulation: Cardiovascular Quality and Outcomes.
To determine the prevalence of underlying but undiagnosed diabetes among patients hospitalized with acute MI, investigators reviewed the records of 2,854 patients enrolled in an MI registry. They identified 287 patients (10.1%) whose records showed HbA1c levels of 6.5% or higher on routine laboratory testing and/or elevated fasting glucose levels at admission or during the typically 48- to 72-hour hospitalization.

Treating physicians recognized only 101 of these cases of diabetes (35%), as evidenced by their provision of diabetes education, prescription of glucose-lowering medication at discharge, or diagnosis code documentation in the patients’ charts, said Dr. Suzanne V. Arnold of Saint Luke’s Mid America Heart Institute, Kansas City, Mo., and her associates.
The routine use of HbA1c testing varied dramatically from one medical center to another, with some hospitals screening fewer than 10% of acute MI patients and others screening up to 82%. Incorporating universal HbA1c screening into standardized acute MI care would likely improve these rates, the investigators said (Circ. Cardiovasc. Qual. Outcomes 2015 April 21 [doi:10.1161/circoutcomes.114.001452]).
Fully 20% of the patients with unrecognized diabetes had very high HbA1c values, ranging as high as 12.3%. Few of them received glucose-lowering medications during the 6 months after hospital discharge. “These data highlight a continued need to screen acute MI patients with HbA1c, to improve the rate of diabetes recognition during the hospitalization; this would not only guide initiation of glucose management interventions but also inform several key aspects of post-MI cardiovascular care,” such as the timing and type of revascularization procedures and the selection of ACE inhibitors, beta-blockers, aldosterone inhibitors, and antiplatelet agents, they added.
Ten percent of patients who presented with acute MI to 24 U.S. hospitals during a 3-year study had unrecognized diabetes, and only one-third of these cases were identified during the MI hospitalization, according to a report published online April 21 in Circulation: Cardiovascular Quality and Outcomes.
To determine the prevalence of underlying but undiagnosed diabetes among patients hospitalized with acute MI, investigators reviewed the records of 2,854 patients enrolled in an MI registry. They identified 287 patients (10.1%) whose records showed HbA1c levels of 6.5% or higher on routine laboratory testing and/or elevated fasting glucose levels at admission or during the typically 48- to 72-hour hospitalization.
Treating physicians recognized only 101 of these cases of diabetes (35%), as evidenced by their provision of diabetes education, prescription of glucose-lowering medication at discharge, or diagnosis code documentation in the patients’ charts, said Dr. Suzanne V. Arnold of Saint Luke’s Mid America Heart Institute, Kansas City, Mo., and her associates.
The routine use of HbA1c testing varied dramatically from one medical center to another, with some hospitals screening fewer than 10% of acute MI patients and others screening up to 82%. Incorporating universal HbA1c screening into standardized acute MI care would likely improve these rates, the investigators said (Circ. Cardiovasc. Qual. Outcomes 2015 April 21 [doi:10.1161/circoutcomes.114.001452]).
Fully 20% of the patients with unrecognized diabetes had very high HbA1c values, ranging as high as 12.3%. Few of them received glucose-lowering medications during the 6 months after hospital discharge. “These data highlight a continued need to screen acute MI patients with HbA1c, to improve the rate of diabetes recognition during the hospitalization; this would not only guide initiation of glucose management interventions but also inform several key aspects of post-MI cardiovascular care,” such as the timing and type of revascularization procedures and the selection of ACE inhibitors, beta-blockers, aldosterone inhibitors, and antiplatelet agents, they added.
FROM CIRCULATION: CARDIOVASCULAR QUALITY AND OUTCOMES
Key clinical point: Many patients presenting with acute MI had unrecognized diabetes and, in most cases, that DM remained undiagnosed, untreated, and unrecorded.
Major finding: Of 2,854 (10%) patients enrolled in an MI registry, 287 had HbA1c levels of 6.5% or higher on routine laboratory testing during hospitalization for acute MI, but treating physicians recognized only 101 of these cases of diabetes (35%).
Data source: A retrospective cohort study involving 2,854 adults presenting with acute MI to 24 U.S. medical centers during a 3.5-year period.
Disclosures: This study was sponsored by the National Heart, Lung, and Blood Institute and supported by a research grant from Genentech. Dr. Arnold reported receiving honoraria from Novartis; her associates reported ties to numerous industry sources.

21st-Century Patient Collections: Implement a Point-of-Service Collections Program Now
An 8-surgeon group in the Southeast had a history of high patient receivables, the result of a long-held culture of “We’ll submit to your insurance and bill you after insurance pays.”
The billing and collections staff worked in the basement—far away and out of sight of the patients who showed up for their postoperative visits owing big bucks.
In a flash of wisdom, the administrator agreed to move the patient-balance collector into a converted closet near the check-out area, and provided the information, tools, and training that enabled her to speak with patients about their balances when they came in for an appointment. In her first month in this role and location, this employee collected more than her annual salary from patients.
It Takes a Program
This is one of our favorite client success stories, and it illustrates a key point: point-of-service (POS) collections do not have to be complicated. But the process does have to be deliberate and coordinated. Practices cannot simply update the financial policy and hope the staff members magically begin collecting. If this is your strategy, we promise that it will fail.
Successful POS collecting requires a program approach. And this approach starts at the front-end of the billing cycle, not “after insurance pays.”
POS collections have never been more important. Health insurance exchanges and payers are increasing deductibles and coinsurances. Physicians are opting out of network. Given these realities, POS collections are vital to your cash flow and effective receivables management.
If you are starting practice, you have a perfect opportunity to open with POS collecting in place. A solo surgeon whom we set up in practice did so, and has collected up-front for office services, scans, and surgeries from his first day in practice. Today, the practice’s only outstanding patient receivables are those of patients on payment plans—and these are less than 1% of total accounts receivable.
We also converted the “after insurance pays” philosophy of a surgeon in the South, implementing both POS collections and surgical deposits. In the first month, his patient payments increased by 40%. Another solo orthopedist reported an increased take-home salary of $90,000 in the first year after we helped his staff collect surgery deposits.
Six POS Program Elements
In 30 years of implementing or training staff to implement POS collections, we have come to recognize the following 6 key elements to include in your program approach: Policies + Procedures + Technology + Training + Monitoring + Coaching.
At a high level, here are the actions your practice will need to take:
1. Update the financial policy with 1 written standard for all physicians.
2. Develop granular procedures driven by the policy; these are the “how-tos” that enable the staff to collect successfully.
3. Implement new technologies, such as cost estimators, recurring payments, and online bill pay.
4. Schedule formal training to ensure that staff members know how to ask for money. (Do not assume they are, can, or will without training.)
5. Measure and monitor the outcome of patient collections and staff performance.
6. Provide ongoing coaching and oversight to maintain motivation and skills.
A blueprint for addressing each one of these actions follows.
1. Update the financial policy
The policy is the set of expectations on which to build all procedures and training. Dust off this document, and review it as a group with the practice administrator. First, strike old language that says the patient will be balance-billed, or will only be asked in the office for his visit copay. Next, strive for clarity. “You will be asked to pay your financial responsibility at the time of service,” really says nothing. Instead, the policy should be direct:
If you are recommended for surgery, our staff will calculate your coinsurance and unmet deductible amounts: 50% of this amount will be collected as a surgery deposit, and the remaining 50% is due on or before the day of surgery. Payment plans are available.
For office visits and services, break down the policy by coverage type. We find that a table such as the one shown makes expectations clear.
![]()
Finally, strive for 1 standard policy for all providers. If every provider is allowed to create his or her own set of collection policies, the practice is setting staff up for complexity overload, and collections will suffer.
2. Develop granular procedures
Few practices take the time to translate the financial policy into written procedures that can be followed by staff. The policy establishes the rules, but the procedures tell staff what to do to implement those rules. For instance:
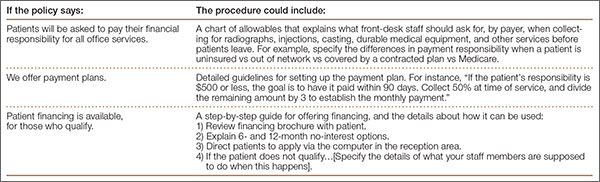
Create a “POS Playbook” that contains information such as procedures, cost-quotation worksheets, US Poverty guidelines1, and financing brochures. As old-school as it sounds, a 3-ring binder is great for this information, and makes information access and updates easy.
3. Implement collection technologies
Modern practices use inexpensive (and often free) tools that increase patient convenience and staff efficiency. Implement at least 2 of these useful technologies and watch your POS collections increase:
Reports from your practice management system (PMS). Use the technology you already have. There are 2 standard reports in your PMS or clearinghouse that give front-desk staff the data to ask patients for money. Eligibility status and past-due balance reports indicate amounts owed, unmet deductibles, and the ineligible patients they can collect from when they come in for their appointment.
Online cost estimators. These free, online tools are offered by payers and provide staff with real-time data about a patient’s unmet deductible and coinsurance. When staff members enter Current Procedural Terminology (CPT) codes and the patient’s benefit information into the online cost estimator, they can access valuable information. Many insurance plans offer cost estimators on their web sites. Others deliver the data through statewide or regional portals, such as Availity (www.availity.com). The accuracy of cost-estimator data can vary by region and depends on the data links with payers. Ask your team to evaluate which estimators are best for you based on your payer mix.
Online bill pay. Everyone appreciates the convenience of paying bills online. Most patient portals offer this feature. If yours does not or you do not have a portal, you can offer PayPal (www.paypal.com) on your practice website, or use a system such as Intuit Health (www.intuithealth.com).
Recurring billing. Recurring billing is how you pay for services, such as Netflix, Pandora, or your gym membership: it is automatically billed to a credit card each month. Offer this option to patients as a payment plan method, and staff will no longer need to send costly statements, post monthly check payments, or follow up when a patient is delinquent. Plus, it guarantees payment every month; patients can no longer say, “I forgot.”
TransFirst (www.transfirstassociation.com) and a-claim (www.a-claim.com) offer recurring billing through a “virtual terminal” that staff logs in to at checkout, or during the preprocedure patient counseling process. Both vendors also offer the option of automatically charging a patient’s credit card after their insurance pays, speeding patient account pay-off and negating the need for statements.
Real-time collections scripts based on payer rules. Patient Access, offered by Availity, combines real-time payer data with financial policies that are entered during set-up to create instant, patient-specific scripts that staff members read to the patient in front of them.
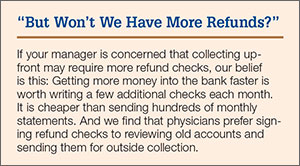
4. Schedule formal training
Just because someone can collect a copay does not mean he or she is comfortable with or capable of asking patients for past-due balances, surgical deposits, or large coinsurances. It is the rare staff person who is a “natural” at asking patients for money in a polished and professional manner.
That’s why training staff how to ask patients for money is vital. A front-office supervisor or manager should conduct several training sessions to cover policies and procedures. Training materials should include talking points and scenarios for collecting for office services and past-due balances, and calculating what patients owe, using technology tools. Use role-playing to ensure staff can explain payment plan options and how to apply for patient financing or financial assistance.
Few practices can skip this part of the POS program and still be successful. If your manager or supervisor is not capable of training, it is worth the investment to hire an outside expert. Without thorough training, staff efforts will be suboptimal or, at worst, fail because the staff members will not know how or what to collect.
5. Measure and monitor the outcome
The Hawthorne effect is a psychological phenomenon that says people perform better and make more positive changes as a result of increased attention.2 In other words, staff members will perform better, and collect more, if they know someone is paying attention. Trust us on this one.
Employees respect what management inspects. So even if the implementation of POS collections has been a big success, do not take your eyes off the ball.
Stop by the front desk or surgery coordinator’s office a few times a month and ask how much has been collected. Randomly review daily over-the-counter collections logs. And always put POS collections performance on the monthly partner meeting agenda; review a graph that shows monthly collections at checkout and surgery deposits. Keeping tabs on performance enables the practice to take action quickly when collections drop, and before that decline becomes acute.
6. Provide ongoing coaching and oversight
Most practices train once, then wonder why staff motivation (and collections too) fall off after a while. Like that new couch you bought: it was all you could talk about the week after it was delivered. Now, it is only a comfy place to sit. It is the same with collections efforts. When the newness wears off, staff motivation does too, and training principles can be forgotten. That’s human nature. Conduct role-playing in staff meetings each quarter and discuss best practices for handling patient objections. Encourage peer-to-peer observation and coaching to address knowledge gaps and missed collection opportunities. Ongoing training and coaching will tease out training needs and boost your team’s collection confidence and success.
1. 2015 Poverty Guidelines. US Department of Health and Human Services website. http://aspe.hhs.gov/poverty/15poverty.cfm. Accessed March 25, 2015.
2. The Hawthorne effect. The Economist website. http://www.economist.com/node/12510632. Published November 3, 2008. Accessed March 25, 2015.
An 8-surgeon group in the Southeast had a history of high patient receivables, the result of a long-held culture of “We’ll submit to your insurance and bill you after insurance pays.”
The billing and collections staff worked in the basement—far away and out of sight of the patients who showed up for their postoperative visits owing big bucks.
In a flash of wisdom, the administrator agreed to move the patient-balance collector into a converted closet near the check-out area, and provided the information, tools, and training that enabled her to speak with patients about their balances when they came in for an appointment. In her first month in this role and location, this employee collected more than her annual salary from patients.
It Takes a Program
This is one of our favorite client success stories, and it illustrates a key point: point-of-service (POS) collections do not have to be complicated. But the process does have to be deliberate and coordinated. Practices cannot simply update the financial policy and hope the staff members magically begin collecting. If this is your strategy, we promise that it will fail.
Successful POS collecting requires a program approach. And this approach starts at the front-end of the billing cycle, not “after insurance pays.”
POS collections have never been more important. Health insurance exchanges and payers are increasing deductibles and coinsurances. Physicians are opting out of network. Given these realities, POS collections are vital to your cash flow and effective receivables management.
If you are starting practice, you have a perfect opportunity to open with POS collecting in place. A solo surgeon whom we set up in practice did so, and has collected up-front for office services, scans, and surgeries from his first day in practice. Today, the practice’s only outstanding patient receivables are those of patients on payment plans—and these are less than 1% of total accounts receivable.
We also converted the “after insurance pays” philosophy of a surgeon in the South, implementing both POS collections and surgical deposits. In the first month, his patient payments increased by 40%. Another solo orthopedist reported an increased take-home salary of $90,000 in the first year after we helped his staff collect surgery deposits.
Six POS Program Elements
In 30 years of implementing or training staff to implement POS collections, we have come to recognize the following 6 key elements to include in your program approach: Policies + Procedures + Technology + Training + Monitoring + Coaching.
At a high level, here are the actions your practice will need to take:
1. Update the financial policy with 1 written standard for all physicians.
2. Develop granular procedures driven by the policy; these are the “how-tos” that enable the staff to collect successfully.
3. Implement new technologies, such as cost estimators, recurring payments, and online bill pay.
4. Schedule formal training to ensure that staff members know how to ask for money. (Do not assume they are, can, or will without training.)
5. Measure and monitor the outcome of patient collections and staff performance.
6. Provide ongoing coaching and oversight to maintain motivation and skills.
A blueprint for addressing each one of these actions follows.
1. Update the financial policy
The policy is the set of expectations on which to build all procedures and training. Dust off this document, and review it as a group with the practice administrator. First, strike old language that says the patient will be balance-billed, or will only be asked in the office for his visit copay. Next, strive for clarity. “You will be asked to pay your financial responsibility at the time of service,” really says nothing. Instead, the policy should be direct:
If you are recommended for surgery, our staff will calculate your coinsurance and unmet deductible amounts: 50% of this amount will be collected as a surgery deposit, and the remaining 50% is due on or before the day of surgery. Payment plans are available.
For office visits and services, break down the policy by coverage type. We find that a table such as the one shown makes expectations clear.
![]()
Finally, strive for 1 standard policy for all providers. If every provider is allowed to create his or her own set of collection policies, the practice is setting staff up for complexity overload, and collections will suffer.
2. Develop granular procedures
Few practices take the time to translate the financial policy into written procedures that can be followed by staff. The policy establishes the rules, but the procedures tell staff what to do to implement those rules. For instance:
Create a “POS Playbook” that contains information such as procedures, cost-quotation worksheets, US Poverty guidelines1, and financing brochures. As old-school as it sounds, a 3-ring binder is great for this information, and makes information access and updates easy.
3. Implement collection technologies
Modern practices use inexpensive (and often free) tools that increase patient convenience and staff efficiency. Implement at least 2 of these useful technologies and watch your POS collections increase:
Reports from your practice management system (PMS). Use the technology you already have. There are 2 standard reports in your PMS or clearinghouse that give front-desk staff the data to ask patients for money. Eligibility status and past-due balance reports indicate amounts owed, unmet deductibles, and the ineligible patients they can collect from when they come in for their appointment.
Online cost estimators. These free, online tools are offered by payers and provide staff with real-time data about a patient’s unmet deductible and coinsurance. When staff members enter Current Procedural Terminology (CPT) codes and the patient’s benefit information into the online cost estimator, they can access valuable information. Many insurance plans offer cost estimators on their web sites. Others deliver the data through statewide or regional portals, such as Availity (www.availity.com). The accuracy of cost-estimator data can vary by region and depends on the data links with payers. Ask your team to evaluate which estimators are best for you based on your payer mix.
Online bill pay. Everyone appreciates the convenience of paying bills online. Most patient portals offer this feature. If yours does not or you do not have a portal, you can offer PayPal (www.paypal.com) on your practice website, or use a system such as Intuit Health (www.intuithealth.com).
Recurring billing. Recurring billing is how you pay for services, such as Netflix, Pandora, or your gym membership: it is automatically billed to a credit card each month. Offer this option to patients as a payment plan method, and staff will no longer need to send costly statements, post monthly check payments, or follow up when a patient is delinquent. Plus, it guarantees payment every month; patients can no longer say, “I forgot.”
TransFirst (www.transfirstassociation.com) and a-claim (www.a-claim.com) offer recurring billing through a “virtual terminal” that staff logs in to at checkout, or during the preprocedure patient counseling process. Both vendors also offer the option of automatically charging a patient’s credit card after their insurance pays, speeding patient account pay-off and negating the need for statements.
Real-time collections scripts based on payer rules. Patient Access, offered by Availity, combines real-time payer data with financial policies that are entered during set-up to create instant, patient-specific scripts that staff members read to the patient in front of them.
4. Schedule formal training
Just because someone can collect a copay does not mean he or she is comfortable with or capable of asking patients for past-due balances, surgical deposits, or large coinsurances. It is the rare staff person who is a “natural” at asking patients for money in a polished and professional manner.
That’s why training staff how to ask patients for money is vital. A front-office supervisor or manager should conduct several training sessions to cover policies and procedures. Training materials should include talking points and scenarios for collecting for office services and past-due balances, and calculating what patients owe, using technology tools. Use role-playing to ensure staff can explain payment plan options and how to apply for patient financing or financial assistance.
Few practices can skip this part of the POS program and still be successful. If your manager or supervisor is not capable of training, it is worth the investment to hire an outside expert. Without thorough training, staff efforts will be suboptimal or, at worst, fail because the staff members will not know how or what to collect.
5. Measure and monitor the outcome
The Hawthorne effect is a psychological phenomenon that says people perform better and make more positive changes as a result of increased attention.2 In other words, staff members will perform better, and collect more, if they know someone is paying attention. Trust us on this one.
Employees respect what management inspects. So even if the implementation of POS collections has been a big success, do not take your eyes off the ball.
Stop by the front desk or surgery coordinator’s office a few times a month and ask how much has been collected. Randomly review daily over-the-counter collections logs. And always put POS collections performance on the monthly partner meeting agenda; review a graph that shows monthly collections at checkout and surgery deposits. Keeping tabs on performance enables the practice to take action quickly when collections drop, and before that decline becomes acute.
6. Provide ongoing coaching and oversight
Most practices train once, then wonder why staff motivation (and collections too) fall off after a while. Like that new couch you bought: it was all you could talk about the week after it was delivered. Now, it is only a comfy place to sit. It is the same with collections efforts. When the newness wears off, staff motivation does too, and training principles can be forgotten. That’s human nature. Conduct role-playing in staff meetings each quarter and discuss best practices for handling patient objections. Encourage peer-to-peer observation and coaching to address knowledge gaps and missed collection opportunities. Ongoing training and coaching will tease out training needs and boost your team’s collection confidence and success.
1. 2015 Poverty Guidelines. US Department of Health and Human Services website. http://aspe.hhs.gov/poverty/15poverty.cfm. Accessed March 25, 2015.
2. The Hawthorne effect. The Economist website. http://www.economist.com/node/12510632. Published November 3, 2008. Accessed March 25, 2015.
1. 2015 Poverty Guidelines. US Department of Health and Human Services website. http://aspe.hhs.gov/poverty/15poverty.cfm. Accessed March 25, 2015.
2. The Hawthorne effect. The Economist website. http://www.economist.com/node/12510632. Published November 3, 2008. Accessed March 25, 2015.