User login
Total Hip Arthroplasty After Contralateral Hip Disarticulation: A Challenging “Simple Primary”
Patients with lower limb amputation have a high incidence of hip and knee osteoarthritis (OA) in the residual limb as well as the contralateral limb. A radical surgery, hip disarticulation is generally performed in younger patients after malignancy or trauma. Compliance is poor with existing prostheses, resulting in increased dependency on and use of the remaining sound limb.
In this case report, a crutch-walking 51-year-old woman presented with severe left hip arthritis 25 years after a right hip disarticulation. She underwent total hip arthroplasty (THA), a challenging procedure in a person without a contralateral hip joint. The many complex technical considerations associated with her THA included precise perioperative planning, the selection of appropriate prostheses and bearing surfaces, and the preoperative and intraoperative assessment of limb length and offset. The patient provided written informed consent for print and electronic publication of this case report.
Case Report
A 51-year-old woman presented to our service with a 3-year history of debilitating left hip pain. Twenty-five years earlier, she had been diagnosed with synovial sarcoma of the right knee and underwent limb-sparing surgery, followed by a true hip disarticulation performed for local recurrence. After her surgery, she declined the use of a prosthesis and mobilized with the use of 2 crutches. She has remained otherwise healthy and active, and runs her own business, which involves some lifting and carrying of objects. During the 3 years prior to presentation, she developed progressively debilitating left hip and groin pain, which radiated to the medial aspect of her left knee. Her mobilization distance had reduced to a few hundred meters, and she experienced significant night pain, and start-up pain. Activity modification, weight loss, and nonsteroidal anti-inflammatory medication afforded no relief. She denied any back pain or radicular symptoms.
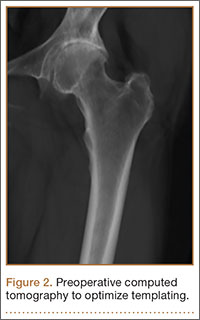
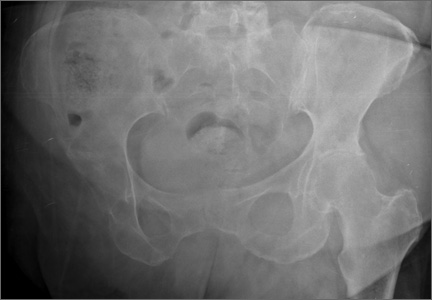
Clinical examination showed a well-healed scar and pristine stump under her right hemipelvis. Passive range of movement of her left hip was painful for all movements, reduced at flexion (90º) and internal (10º) and external rotation (5º). Examination of her left knee was normal, with a full range of movement and no joint-line tenderness. A high body mass index (>30) was noted. Radiographic imaging confirmed significant OA of the hip joint (Figure 1). Informed consent was obtained for THA. The implants were selected—an uncemented collared Corail Stem (DePuy, Warsaw, Indiana) with a stainless steel dual mobility (DM) Novae SunFit acetabular cup (Serf, Decines, France), with bearing components of ceramic on polyethylene. A preoperative computed tomography (CT) scan of the left hip was performed (Figure 2) to aid templating, which was accomplished using plain films and CT images, with reference to the proximal femur for deciding level of neck cut, planning stem size, and optimizing length and offset, while determining cup size, depth, inclination, and height for the acetabular component.

Prior to surgery, the patient was positioned in the lateral decubitus position, using folded pillows under the medial aspect of her left proximal and distal thigh in lieu of her amputated limb. Pillows were secured to the table with elastic bandage tape. Standard pubic symphysis, lumbosacral, and midthoracic padded bolsters stabilized the pelvis in the normal fashion, with additional elastic bandage tape to further secure the pelvis brim to the table and reduce intraoperative motion. A posterior approach was used. A capsulotomy was performed with the hip in extension and slight abduction, with meticulous preservation of the capsule as the guide for the patient’s native length and offset. Reaming of the acetabulum was line to line, with insertion of an uncemented DM metal-back press-fit hydroxyapatite-coated shell placed in a standard fashion parallel with the transverse acetabular ligament, as described by Archbold and colleagues.1 The femur was sequentially reamed with broaches until press fit was achieved, and a calcar reamer was used to optimize interface with the collared implant. The surgeon’s standard 4 clinical tests were performed with trial implants after reduction to gauge hip tension, length, and offset. These tests are positive shuck test with hip and knee extension, lack of shuck in hip extension with knee flexion, lack of kick sign in hip extension and knee flexion, and palpation of gluteus medius belly to determine tension. Finally, with the hip returned to the extended and slightly abducted position, the capsule was tested for length and tension. The definitive stem implant was inserted, final testing with trial heads was repeated prior to definitive neck length and head selection, and final reduction was performed. A layered closure was performed, after generous washout. Pillows were taped together and positioned from the bed railing across the midline of the bed to prevent abduction, in the fashion of an abduction pillow.
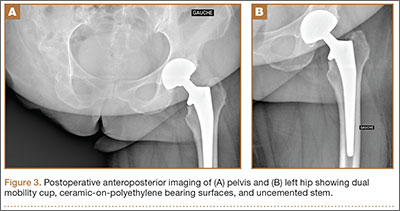
The patient was mobilized the day after surgery and permitted full weight-bearing. Recovery was uneventful, and the patient returned to work within 6 weeks of surgery after her scheduled appointment and radiographic examination (Figure 3). Ongoing regular clinical and radiologic surveillance are planned.
Discussion
Hip and knee OA in the residual limb is more common for amputees than for the general population.2,3 THA for OA in amputees has been reported after below-knee amputation in both the ipsilateral and the contralateral hip.4 A true hip disarticulation is a rarely performed radical surgical procedure, involving the removal of the entire femur, and is most often related to surgical oncologic treatment or combat-related injuries, both being more common in younger people. Like many patients who have had a hip disarticulation,5 our patient declined a prosthesis, finding the design cosmetically unappealing and uncomfortable, in favor of crutch-walking. This accelerated wear of the remaining hip, and is a sobering reminder of the high demand on the bearing surfaces of the implants after her procedure.
The implants chosen for this procedure are critical. We use implants which are proven and reliable. Our institution uses the Corail Stem, an uncemented collared stem with an Orthopaedic Data Evaluation Panel (ODEP) 10A rating,6 widely used for THA.7 For the acetabulum, we chose the Novae SunFit, a modern version based on Bousquet’s 1976 DM design. The DM cup is a tripolar cup with a fixed porous-coated or cemented metal cup, which articulates with a large mobile polyethylene liner. A standard head in either metal or ceramic is inserted into this liner. The articulation between the head and the liner is constrained, while the articulation between the liner and the metal cup is unconstrained. This interposition of a mobile insert increases the effective head diameter, and the favorable head-neck ratio allows increased range of motion while avoiding early femoral neck impingement with a fixed liner or metal cup. A growing body of evidence indicates that DM cups reduce dislocation rates in primary and revision total knee arthroplasty and, when used with prudence, in selected tumor cases.8 A study of 1905 hips, using second-generation DM cups, reported cumulative survival rate of 98.6% at 12.2 years,9 with favorable outcomes compared with standard prostheses in the medium term for younger patients,10 and in the longer term,11 without increasing polyethylene wear.12
We use DM cups for 2 patient cohorts: first, for all patients older than 75 years because, in this age group, the risk of dislocation is higher than the risk of revision for wear-induced lysis; and second, in younger patients with any neuromuscular, cognitive, or mechanical risk factors that would excessively increase the risk of dislocation. This reflects the balance of risks in arthroplasty, with the ever-present trade-off between polyethylene-induced osteolysis and stability. Dislocation of the remaining sound limb for this young, active, agile patient would be a catastrophic complication. Given our patient’s risk factors for dislocation—female, an amputee with a high risk of falling, high body mass index, and lack of a contralateral limb to restrict adduction—the balance of risks favored hip stability over wear. We chose, therefore, a DM cup, using a ceramic-head-on-polyethylene-insert surface-bearing combination.
CT scanning is routinely performed in our institution to optimize preoperative templating. The preoperative CT images enable accurate planning, notably for the extramedullary reconstruction,13 and are used in addition to acetates and standard radiographs. This encourages preservation of acetabular bone stock by selecting the smallest suitable cup, reduces the risk of femoral fracture by giving an accurate prediction of the stem size, and ensures accuracy of restoring the patient’s offset and length. Although limb-length discrepancy was not an issue for this patient with a single sound limb, the sequalae of excessively increasing offset or length (eg, gluteus medius tendinopathy and trochanteric bursitis) would arguably be more debilitating than for someone who could offload weight to the “good hip.” For these reasons, marrying the preoperative templating with on-table testing with trial prostheses and restoring the native capsular tension is vital.
The importance of on-table positioning for proximal amputees undergoing hip arthroplasty has been highlighted.14 Lacking the normal bony constraints increases the risk of intraoperative on-table movement, which, in turn, risks reducing the accuracy of implant positioning. Crude limb-length checking using the contralateral knee is not possible. In addition, the lack of a contralateral hip joint causes a degree of compensatory pelvic tilt, which raises the option of increasing the coverage to compensate for obligate adduction during single-leg, crutch-walking gait. Lacking established guidelines to accommodate these variables, we inserted the cup in a standard fashion, at 45º, referencing acetabular version using the transverse acetabular ligament,1 and used the smallest stable cup after line-to-line reaming.
This case of THA in a young, crutch-walking patient with a contralateral true hip disarticulation highlights the importance of meticulous preoperative planning, implant selection appropriate for the patient in question, perioperative positioning, and the technical and operative challenges of restoring the patient’s normal hip architecture.
1. Archbold HA, Mockford B, Molloy D, McConway J, Ogonda L, Beverland D. The transverse acetabular ligament: an aid to orientation of the acetabular component during primary total hip replacement: a preliminary study of 1000 cases investigating postoperative stability. J Bone Joint Surg Br. 2006;88(7):883-886.
2. Kulkarni J, Adams J, Thomas E, Silman A. Association between amputation, arthritis and osteopenia in British male war veterans with major lower limb amputations. Clin Rehabil. 1998;12(4):348-353.
3. Struyf PA, van Heugten CM, Hitters MW, Smeets RJ. The prevalence of osteoarthritis of the intact hip and knee among traumatic leg amputees. Arch Phys Med Rehabil. 2009;90(3):440-446.
4. Nejat EJ, Meyer A, Sánchez PM, Schaefer SH, Westrich GH. Total hip arthroplasty and rehabilitation in ambulatory lower extremity amputees--a case series. Iowa Orthop J. 2005;25:38-41.
5. Zaffer SM, Braddom RL, Conti A, Goff J, Bokma D. Total hip disarticulation prosthesis with suction socket: report of two cases. Am J Phys Med Rehabil. 1999;78(2):160-162.
6. Lewis P. ODEP [Orthopaedic Data Evaluation Panel]. NHS Supply Chain website. http://www.supplychain.nhs.uk/odep. Accessed April 2, 2015.
7. National Joint Registry for England and Wales. 8th Annual Report, 2011. National Joint Registry website. www.njrcentre.org.uk/NjrCentre/Portals/0/Documents/NJR%208th%20Annual%20Report%202011.pdf. Accessed April 2, 2015.
8. Grazioli A, Ek ET, Rüdiger HA. Biomechanical concept and clinical outcome of dual mobility cups. Int Orthop. 2012;36(12):2411-2418.
9. Massin P, Orain V, Philippot R, Farizon F, Fessy MH. Fixation failures of dual mobility cups: a mid-term study of 2601 hip replacements. Clin Orthop. 2012;470(7):1932-1940.
10. Epinette JA, Béracassat R, Tracol P, Pagazani G, Vandenbussche E. Are modern dual mobility cups a valuable option in reducing instability after primary hip arthroplasty, even in younger patients? J Arthroplasty. 2014;29(6):1323-1328.
11. Philippot R, Meucci JF, Boyer B, Farizon F. Modern dual-mobility cup implanted with an uncemented stem: about 100 cases with 12-year follow-up. Surg Technol Int. 2013;23:208-212.
12. Prudhon JL, Ferreira A, Verdier R. Dual mobility cup: dislocation rate and survivorship at ten years of follow-up. Int Orthop. 2013;37(12):2345-2350.
13. Sariali E, Mouttet A, Pasquier G, Durante E, Catone Y. Accuracy of reconstruction of the hip using computerised three-dimensional pre-operative planning and a cementless modular neck. J Bone Joint Surg Br. 2009;91(13):333-340.
14. Bong MR, Kaplan KM, Jaffe WL. Total hip arthroplasty in a patient with contralateral hemipelvectomy. J Arthroplasty. 2006;21(5):762-764.
Patients with lower limb amputation have a high incidence of hip and knee osteoarthritis (OA) in the residual limb as well as the contralateral limb. A radical surgery, hip disarticulation is generally performed in younger patients after malignancy or trauma. Compliance is poor with existing prostheses, resulting in increased dependency on and use of the remaining sound limb.
In this case report, a crutch-walking 51-year-old woman presented with severe left hip arthritis 25 years after a right hip disarticulation. She underwent total hip arthroplasty (THA), a challenging procedure in a person without a contralateral hip joint. The many complex technical considerations associated with her THA included precise perioperative planning, the selection of appropriate prostheses and bearing surfaces, and the preoperative and intraoperative assessment of limb length and offset. The patient provided written informed consent for print and electronic publication of this case report.
Case Report
A 51-year-old woman presented to our service with a 3-year history of debilitating left hip pain. Twenty-five years earlier, she had been diagnosed with synovial sarcoma of the right knee and underwent limb-sparing surgery, followed by a true hip disarticulation performed for local recurrence. After her surgery, she declined the use of a prosthesis and mobilized with the use of 2 crutches. She has remained otherwise healthy and active, and runs her own business, which involves some lifting and carrying of objects. During the 3 years prior to presentation, she developed progressively debilitating left hip and groin pain, which radiated to the medial aspect of her left knee. Her mobilization distance had reduced to a few hundred meters, and she experienced significant night pain, and start-up pain. Activity modification, weight loss, and nonsteroidal anti-inflammatory medication afforded no relief. She denied any back pain or radicular symptoms.
Clinical examination showed a well-healed scar and pristine stump under her right hemipelvis. Passive range of movement of her left hip was painful for all movements, reduced at flexion (90º) and internal (10º) and external rotation (5º). Examination of her left knee was normal, with a full range of movement and no joint-line tenderness. A high body mass index (>30) was noted. Radiographic imaging confirmed significant OA of the hip joint (Figure 1). Informed consent was obtained for THA. The implants were selected—an uncemented collared Corail Stem (DePuy, Warsaw, Indiana) with a stainless steel dual mobility (DM) Novae SunFit acetabular cup (Serf, Decines, France), with bearing components of ceramic on polyethylene. A preoperative computed tomography (CT) scan of the left hip was performed (Figure 2) to aid templating, which was accomplished using plain films and CT images, with reference to the proximal femur for deciding level of neck cut, planning stem size, and optimizing length and offset, while determining cup size, depth, inclination, and height for the acetabular component.
Prior to surgery, the patient was positioned in the lateral decubitus position, using folded pillows under the medial aspect of her left proximal and distal thigh in lieu of her amputated limb. Pillows were secured to the table with elastic bandage tape. Standard pubic symphysis, lumbosacral, and midthoracic padded bolsters stabilized the pelvis in the normal fashion, with additional elastic bandage tape to further secure the pelvis brim to the table and reduce intraoperative motion. A posterior approach was used. A capsulotomy was performed with the hip in extension and slight abduction, with meticulous preservation of the capsule as the guide for the patient’s native length and offset. Reaming of the acetabulum was line to line, with insertion of an uncemented DM metal-back press-fit hydroxyapatite-coated shell placed in a standard fashion parallel with the transverse acetabular ligament, as described by Archbold and colleagues.1 The femur was sequentially reamed with broaches until press fit was achieved, and a calcar reamer was used to optimize interface with the collared implant. The surgeon’s standard 4 clinical tests were performed with trial implants after reduction to gauge hip tension, length, and offset. These tests are positive shuck test with hip and knee extension, lack of shuck in hip extension with knee flexion, lack of kick sign in hip extension and knee flexion, and palpation of gluteus medius belly to determine tension. Finally, with the hip returned to the extended and slightly abducted position, the capsule was tested for length and tension. The definitive stem implant was inserted, final testing with trial heads was repeated prior to definitive neck length and head selection, and final reduction was performed. A layered closure was performed, after generous washout. Pillows were taped together and positioned from the bed railing across the midline of the bed to prevent abduction, in the fashion of an abduction pillow.
The patient was mobilized the day after surgery and permitted full weight-bearing. Recovery was uneventful, and the patient returned to work within 6 weeks of surgery after her scheduled appointment and radiographic examination (Figure 3). Ongoing regular clinical and radiologic surveillance are planned.
Discussion
Hip and knee OA in the residual limb is more common for amputees than for the general population.2,3 THA for OA in amputees has been reported after below-knee amputation in both the ipsilateral and the contralateral hip.4 A true hip disarticulation is a rarely performed radical surgical procedure, involving the removal of the entire femur, and is most often related to surgical oncologic treatment or combat-related injuries, both being more common in younger people. Like many patients who have had a hip disarticulation,5 our patient declined a prosthesis, finding the design cosmetically unappealing and uncomfortable, in favor of crutch-walking. This accelerated wear of the remaining hip, and is a sobering reminder of the high demand on the bearing surfaces of the implants after her procedure.
The implants chosen for this procedure are critical. We use implants which are proven and reliable. Our institution uses the Corail Stem, an uncemented collared stem with an Orthopaedic Data Evaluation Panel (ODEP) 10A rating,6 widely used for THA.7 For the acetabulum, we chose the Novae SunFit, a modern version based on Bousquet’s 1976 DM design. The DM cup is a tripolar cup with a fixed porous-coated or cemented metal cup, which articulates with a large mobile polyethylene liner. A standard head in either metal or ceramic is inserted into this liner. The articulation between the head and the liner is constrained, while the articulation between the liner and the metal cup is unconstrained. This interposition of a mobile insert increases the effective head diameter, and the favorable head-neck ratio allows increased range of motion while avoiding early femoral neck impingement with a fixed liner or metal cup. A growing body of evidence indicates that DM cups reduce dislocation rates in primary and revision total knee arthroplasty and, when used with prudence, in selected tumor cases.8 A study of 1905 hips, using second-generation DM cups, reported cumulative survival rate of 98.6% at 12.2 years,9 with favorable outcomes compared with standard prostheses in the medium term for younger patients,10 and in the longer term,11 without increasing polyethylene wear.12
We use DM cups for 2 patient cohorts: first, for all patients older than 75 years because, in this age group, the risk of dislocation is higher than the risk of revision for wear-induced lysis; and second, in younger patients with any neuromuscular, cognitive, or mechanical risk factors that would excessively increase the risk of dislocation. This reflects the balance of risks in arthroplasty, with the ever-present trade-off between polyethylene-induced osteolysis and stability. Dislocation of the remaining sound limb for this young, active, agile patient would be a catastrophic complication. Given our patient’s risk factors for dislocation—female, an amputee with a high risk of falling, high body mass index, and lack of a contralateral limb to restrict adduction—the balance of risks favored hip stability over wear. We chose, therefore, a DM cup, using a ceramic-head-on-polyethylene-insert surface-bearing combination.
CT scanning is routinely performed in our institution to optimize preoperative templating. The preoperative CT images enable accurate planning, notably for the extramedullary reconstruction,13 and are used in addition to acetates and standard radiographs. This encourages preservation of acetabular bone stock by selecting the smallest suitable cup, reduces the risk of femoral fracture by giving an accurate prediction of the stem size, and ensures accuracy of restoring the patient’s offset and length. Although limb-length discrepancy was not an issue for this patient with a single sound limb, the sequalae of excessively increasing offset or length (eg, gluteus medius tendinopathy and trochanteric bursitis) would arguably be more debilitating than for someone who could offload weight to the “good hip.” For these reasons, marrying the preoperative templating with on-table testing with trial prostheses and restoring the native capsular tension is vital.
The importance of on-table positioning for proximal amputees undergoing hip arthroplasty has been highlighted.14 Lacking the normal bony constraints increases the risk of intraoperative on-table movement, which, in turn, risks reducing the accuracy of implant positioning. Crude limb-length checking using the contralateral knee is not possible. In addition, the lack of a contralateral hip joint causes a degree of compensatory pelvic tilt, which raises the option of increasing the coverage to compensate for obligate adduction during single-leg, crutch-walking gait. Lacking established guidelines to accommodate these variables, we inserted the cup in a standard fashion, at 45º, referencing acetabular version using the transverse acetabular ligament,1 and used the smallest stable cup after line-to-line reaming.
This case of THA in a young, crutch-walking patient with a contralateral true hip disarticulation highlights the importance of meticulous preoperative planning, implant selection appropriate for the patient in question, perioperative positioning, and the technical and operative challenges of restoring the patient’s normal hip architecture.
1. Archbold HA, Mockford B, Molloy D, McConway J, Ogonda L, Beverland D. The transverse acetabular ligament: an aid to orientation of the acetabular component during primary total hip replacement: a preliminary study of 1000 cases investigating postoperative stability. J Bone Joint Surg Br. 2006;88(7):883-886.
2. Kulkarni J, Adams J, Thomas E, Silman A. Association between amputation, arthritis and osteopenia in British male war veterans with major lower limb amputations. Clin Rehabil. 1998;12(4):348-353.
3. Struyf PA, van Heugten CM, Hitters MW, Smeets RJ. The prevalence of osteoarthritis of the intact hip and knee among traumatic leg amputees. Arch Phys Med Rehabil. 2009;90(3):440-446.
4. Nejat EJ, Meyer A, Sánchez PM, Schaefer SH, Westrich GH. Total hip arthroplasty and rehabilitation in ambulatory lower extremity amputees--a case series. Iowa Orthop J. 2005;25:38-41.
5. Zaffer SM, Braddom RL, Conti A, Goff J, Bokma D. Total hip disarticulation prosthesis with suction socket: report of two cases. Am J Phys Med Rehabil. 1999;78(2):160-162.
6. Lewis P. ODEP [Orthopaedic Data Evaluation Panel]. NHS Supply Chain website. http://www.supplychain.nhs.uk/odep. Accessed April 2, 2015.
7. National Joint Registry for England and Wales. 8th Annual Report, 2011. National Joint Registry website. www.njrcentre.org.uk/NjrCentre/Portals/0/Documents/NJR%208th%20Annual%20Report%202011.pdf. Accessed April 2, 2015.
8. Grazioli A, Ek ET, Rüdiger HA. Biomechanical concept and clinical outcome of dual mobility cups. Int Orthop. 2012;36(12):2411-2418.
9. Massin P, Orain V, Philippot R, Farizon F, Fessy MH. Fixation failures of dual mobility cups: a mid-term study of 2601 hip replacements. Clin Orthop. 2012;470(7):1932-1940.
10. Epinette JA, Béracassat R, Tracol P, Pagazani G, Vandenbussche E. Are modern dual mobility cups a valuable option in reducing instability after primary hip arthroplasty, even in younger patients? J Arthroplasty. 2014;29(6):1323-1328.
11. Philippot R, Meucci JF, Boyer B, Farizon F. Modern dual-mobility cup implanted with an uncemented stem: about 100 cases with 12-year follow-up. Surg Technol Int. 2013;23:208-212.
12. Prudhon JL, Ferreira A, Verdier R. Dual mobility cup: dislocation rate and survivorship at ten years of follow-up. Int Orthop. 2013;37(12):2345-2350.
13. Sariali E, Mouttet A, Pasquier G, Durante E, Catone Y. Accuracy of reconstruction of the hip using computerised three-dimensional pre-operative planning and a cementless modular neck. J Bone Joint Surg Br. 2009;91(13):333-340.
14. Bong MR, Kaplan KM, Jaffe WL. Total hip arthroplasty in a patient with contralateral hemipelvectomy. J Arthroplasty. 2006;21(5):762-764.
Operative Intervention for Geriatric Hip Fracture: Does Type of Surgery Affect Hospital Length of Stay?
Hip fractures, the most severe and costly fall-related fractures, account for 350,000 hospital admissions per year.1 The majority of hip fractures result from low-impact falls, typically in patients over age 60 years. In fact, the increase in hip fracture with age is nearly exponential.2,3 With the predicted aging of our population, hip fractures will continue to increase in volume. Between 2000 and 2050, the elderly US population will increase by 135%,4 proportionately increasing the number of projected hip fractures. Considering that hip fractures account for 72% of total costs in terms of orthopedic fracture care in the elderly, the dramatic rise in hip fractures is of great concern for future costs of health care delivery in this field.5-7
In an effort to move toward a value-based system in which costs are reduced while quality of care is maintained, Medicare recently unveiled a new bundled payment system of reimbursement. Through this system, hospitals will be reimbursed for treatment provided to Medicare beneficiaries based on the expected costs of care, instead of through the traditional fee-for-service model. Given this development, orthopedic surgeons will need to develop interventions that reduce costs while maintaining quality of care after hip fracture surgery.
One of the most significant ramifications of a value-based system is that reimbursement for hip fractures may be standardized based on a single diagnosis regardless of the actual costs associated with treatment.8 In hip fracture cases, however, a wide range of factors, including degree of communition of the bone, presence of medical comorbidities,9 and amount of soft-tissue injury, can dramatically increase recovery time. In fact, one of the most important determinants of treatment costs related to hospital length of stay (LOS) is whether the fracture is a femoral neck or intertrochanteric fracture.10,11 Type of fracture is a significant determinant of surgical options, and these can dramatically change patient outcomes and costs of surgical care.12-16 In addition, hospital recovery time or LOS can vary widely based on type of surgery. As hospitalization costs account for 44% of the direct medical costs for hip fractures,17 differences in LOS can have major financial implications in a value-based system of reimbursement in which all forms of hip fracture are reimbursed a standard amount.
We conducted a study to analyze differences in hospital LOS for different forms of hip fracture repair to determine the potential financial repercussions of a bundled payment model of reimbursement. By performing a retrospective chart review at a large, level I trauma center, we were able to compare LOS and associated costs for total hip arthroplasty (THA), hemiarthroplasty (HA), cephalomedullary nailing (CMN), open reduction and internal fixation (ORIF), and closed reduction and percutaneous pinning (CRPP).
Materials and Methods
After receiving institutional review board approval for this study, we retrospectively reviewed all hip fracture cases treated at a level I trauma center between January 2000 and December 2009. Current Procedural Terminology (CPT) codes were searched for cases of low-energy falls that caused hip fractures that were resolved with THA, HA, CMN, ORIF, or CRPP. Patients who underwent HA or THA were grouped for analysis. Patients who were over age 60 years and had acetabular, proximal femoral, trochanteric, or femoral neck fractures were included in our search. Patients who had incomplete medical records or did not meet the age criterion were excluded from analysis.
We reviewed patient charts in our institutional electronic medical records database to collect these data: date of birth, age, sex, date of admission, date of discharge, American Society of Anesthesiologists (ASA) Physical Status score, complications, height, weight, start and stop times of procedure, whether or not the procedure was an emergent procedure, days from admission to surgery, 90-day readmissions, days from surgery to discharge, and general category of operation. We also recorded individual comorbidities, including prior myocardial infarction, dysrhythmia, atrial fibrillation, congestive heart failure, heart block, cerebrovascular disease, chronic obstructive pulmonary disease, emphysema, current smoking status, smoking history, renal disease, dialysis, cancer, and diabetes. Duration of surgery was calculated from recorded start and stop times. Body mass index was calculated using height and weight recorded during initial stay. LOS was recorded as the difference between the admission and discharge dates.
Mean total cost to the hospital ($4530/d patient was hospitalized) was obtained from the institution’s financial services. All fractional LOS values were rounded to the nearest whole number and multiplied by the per diem cost. Student t test was used to compare mean LOS and costs of HA/THA with those of all the other procedures. Additional tests were run to analyze differences in LOS and type of surgeries performed throughout the 9-year period. A multivariate regression model controlling for ASA score, body mass index, age, sex, and comorbidities was developed to analyze differences in LOS and costs for patients who underwent HA/THA versus CMN, ORIF, and CRPP. Significance was set at P = .05.
Results
Our search identified 720 patients who were over age 60 years and underwent operative fixation for hip fracture at our level I trauma center between 2000 and 2009. Of these 720 patients, 105 who had incomplete charts or did not meet the age criteria were excluded, leaving 615 patients (with complete records of isolated low-energy hip fractures) for analysis.
Table 1 lists the demographics of our patient population. The majority of patients had undergone ORIF (30.24%) or HA/THA (45.69%). CRPP was the least common procedure (9.92%) after CMN (14.15%). Mean age was 78.4 years; the majority of patients were between 75 and 89 years of age. Mean hospital LOS was 6.91 days. The majority of patients (n = 414; 67.32%) were female. ASA scores had a narrow distribution, with most patients assigned a score of 3. The readmission rate was significantly higher for HA/THA (39.1%) than for ORIF (28.5%; P = .02) and CRPP (24.6%; P = .04).
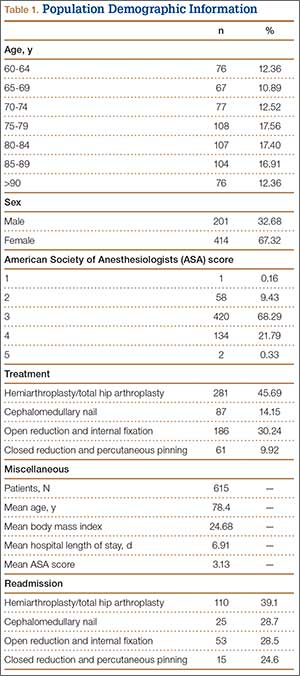
Table 2 lists mean LOS and associated costs for each procedure compared with HA/THA. Mean LOS for all patients was 6.91 days, with associated hospitalization costs of $30,011.25. Patients who underwent HA/THA had the longest mean LOS (7.43 days) and highest mean hospitalization costs ($33,657.90). In comparison, patients who underwent ORIF had a mean LOS of 6.59 days with $29,852.70 in costs (P = .04). CRPP also had a significantly (P < .003) shorter LOS (5.59 days) and lower costs ($25,322.70). Although CMN had a mean LOS of 6.89 days and $31,211.70 in costs, the difference in LOS was not significantly different from that of HA/THA. The proportion of surgeries that were HA/THA, CMN, ORIF, and CRPP did not change significantly through the 9-year period (P = .19). Similarly, mean LOS did not change significantly for any of the types of surgery through this period (Table 3).
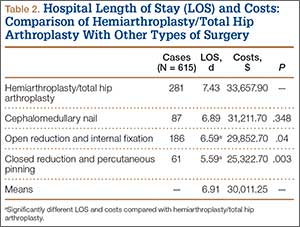
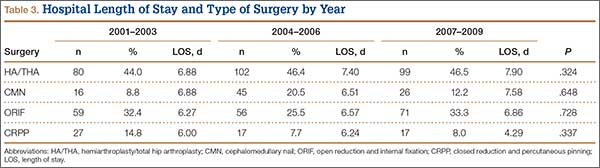
Figure 1 provides the distribution of LOS for all 4 procedures. The interquartile range (IQR) for patients who underwent HA/THA was 4 to 9 days (median, 6 days). Patients who underwent CMN also had a median LOS of 6 days and an IQR of 4 to 8 days. Both ORIF (IQR, 4-8 days) and CRPP (IQR, 3-6 days) were associated with a median LOS of 5 days.
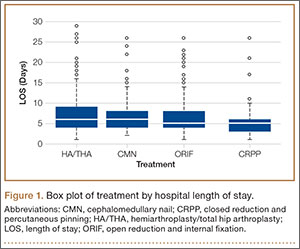
Figure 2 shows mean hospitalization costs based on type of procedure. HA/THA had the highest mean cost, $33,657.90, or $8335.20 more than CRPP ($25,322.70). Patients who underwent CMN had a mean cost of $31,211.70, versus $29,852.70 for patients who underwent ORIF.
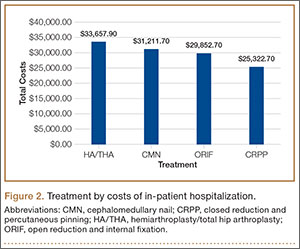
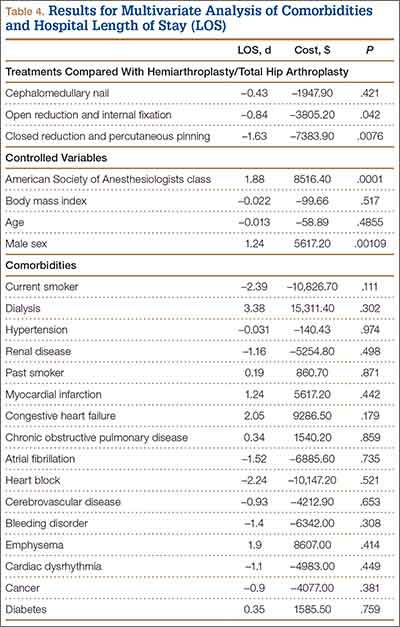
Table 4 summarizes the multivariate analysis results. After ASA score, sex, age, and comorbidities were controlled for, there was an overall significant relationship involving surgical treatment, LOS, and associated hospitalization costs for HA/THA, ORIF, and CRPP. Compared with HA/THA, ORIF had $3805.20 less in costs (P = .042) and 0.84 fewer hospital days. Patients who underwent CRPP were hospitalized for significantly fewer days (1.63) and associated costs ($7383.90) (P = .0076). There was no significant difference in LOS and costs between HA/THA and CMN. Of the controlled variables, only ASA score (P < .001) and male sex (P = .001) were significantly associated with changes in LOS and costs. There was no significant association with comorbidities, LOS, or costs.
Discussion
In this study of surgical intervention in patients with hip fractures, we determined that HA/THA was associated with significantly increased hospital LOS and costs than ORIF and CRPP. Although arthroplasty had an increased mean LOS compared with CMN, the difference was not statistically significant. In addition to type of procedure, both male sex (P = .001) and preoperative ASA score (P < .001) were significant predictors of LOS and costs. These findings are supported by other studies in which preoperative functioning was found to be a strong predictor of increased LOS and costs among hip fracture patients,18 most likely because of increased risk for complications.19
Although our study was the first to directly compare LOS and costs for HA/THA and CMN, other investigators have analyzed the effect of surgical complications on LOS for patients treated with THA, HA, and CMN. In a study on the effects of surgical complications on LOS after hip fracture surgery, Foss and colleagues17 reported that the proportion of CMN patients (31%) with complications was larger than that of HA patients (19%) and THA patients (0%). They also reported that surgical complications were associated with significantly increased LOS during primary admission. Similarly, Edwards and colleagues20 found that the infection risk was higher with CMN (3.1%) than with THA (0%) and HA (0%-2.3%) and that infections were associated with increased LOS (P > .001). However, further statistical analysis revealed that the odds of developing an infection were not significantly higher with CMN than with other studies.20 Similarly, other studies have reported low rates of complications, including nonunion, with CMN.21,22 In our study, we found no significant difference in LOS and costs for CMN and HA/THA after controlling for ASA score, which is known to be associated with a higher risk for complications.18,19
The largest difference in LOS and costs after controlling for potential confounding variables was between HA/THA and CRPP ($7383.90). To our knowledge, only one study has performed a comparative analysis of LOS for CRPP and other surgical treatments for hip fractures. For femoral neck fractures treated between 1990 and 1994, Fekete and colleagues23 found that LOS was 14.9 days for ORIF cases and 12.1 days for CRPP cases—a difference of 2.8 days. In comparison, we found a 1-day difference in mean LOS between ORIF cases (6.59 days) and CRPP cases (5.59 days).
Other studies of LOS and associated costs over a 2-year period have found that ORIF is overall more costly than HA/THA. For example, Keating and colleagues13 compared total costs of care, including LOS, for healthy older patients with displaced intracapsular hip fractures treated with ORIF, bipolar HA, or THA. Although ORIF was initially less costly than HA/THA, overall ORIF costs over 2 years were significantly higher because of readmissions, which increased overall LOS. Similarly, in cases of displaced femoral fractures, Iorio and colleagues15 found that LOS was 6.4 days for ORIF, 4.9 days for unipolar HA, 6.2 days for bipolar HA, and 5.5 days for cemented and hybrid THA. However, when overall projected costs were estimated, including the costs of rehabilitation and of (probable) revision arthroplasty, ORIF was estimated to cost more over a 2-year period because of the need for additional care and in-patient stays. In contrast, we found that hospitalization costs were $3805.20 lower for ORIF than for HA/THA, even after adjusting for comorbidities, and that ORIF had a lower overall readmission rate. Early discharge of patients who are at risk for subsequent complications may have played a significant role in increasing readmission rates for arthroplasty patients. These findings indicate the complexities involved in a bundled payment system of reimbursement, in which a single payment for both initial stay and related readmissions will force orthopedists to consider long-term hospitalization costs when deciding on length of postoperative care and the most cost-effective surgical treatment.
One of the limitations of this study is its retrospective design. Although selection of our sample from a single level I trauma center reduced differences in cost and patient care protocols between institutions, it also reduced the generalizability of our actual costs. In addition, for some patients, LOS may have increased because of delays in surgery or discharge, lack of operating room availability, or need for further medical clearance for additional procedures. Day of admission could also have significantly affected LOS. However, the effects of these confounding factors were reduced because of the large sample analyzed. As stated earlier, overall LOS depends on both initial in-patient stays and readmissions. Therefore, long-term prospective studies that compare LOS and associated costs for patients with hip fractures treated with ORIF, CRPP, HA/THA, and CMN are needed.
Conclusion
It has been recently suggested that hip fracture repair be included in the National Pilot Program on Payment Bundling, which will potentially reimburse orthopedic surgeons a standardized amount for hip fracture surgery regardless of actual treatment costs.8 In this model, it will be essential to understand how type of fracture and surgical procedure can influence LOS and therefore hip fracture treatment costs. We found that, based on these factors, mean LOS ranged from 5.59 to 7.43 days, which translates to a cost range of $25,322.70 to $33,657.90. Before a standardized bundled payment system is implemented, further studies are needed to identify other factors that can significantly affect the cost of hip fracture repair.
1. American Academy of Orthopaedic Surgeons. Burden of Musculoskeletal Diseases in the United States: Prevalence, Societal and Economic Cost. Rosemont, IL: American Academy of Orthopaedic Surgeons; 2008.
2. Samelson EJ, Zhang Y, Kiel DP, Hannan MT, Felson DT. Effect of birth cohort on risk of hip fracture: age-specific incidence rates in the Framingham study. Am J Public Health. 2002;92(5):858-862.
3. Scott JC. Osteoporosis and hip fractures. Rheum Dis Clin North Am. 1990;16(3):717-740.
4. Wiener JM, Tilly J. Population ageing in the United States of America: implications for public programmes. Int J Epidemiol. 2002;31(4):776-781.
5. Burge R, Dawson-Hughes B, Solomon DH, Wong JB, King A, Tosteson A. Incidence and economic burden of osteoporosis-related fractures in the United States, 2005–2025. J Bone Miner Res. 2007;22(3):465-475.
6. Burge RT, King AB, Balda E, Worley D. Methodology for estimating current and future burden of osteoporosis in state populations: application to Florida in 2000 through 2025. Value Health. 2003;6(5):574-583.
7. Tosteson AN, Burge RT, Marshall DA, Lindsay R. Therapies for treatment of osteoporosis in US women: cost-effectiveness and budget impact considerations. Am J Manag Care. 2008;14(9):605-615.
8. Sood N, Huckfeldt PJ, Escarce JJ, Grabowski DC, Newhouse JP. Medicare’s bundled payment pilot for acute and postacute care: analysis and recommendations on where to begin. Health Aff. 2011;30(9):1708-1717.
9. Shah A, Eissler J, Radomisli T. Algorithms for the treatment of femoral neck fractures. Clin Orthop. 2002;(399):28-34.
10. Sund R, Riihimäki J, Mäkelä M, et al. Modeling the length of the care episode after hip fracture: does the type of fracture matter? Scand J Surg. 2009;98(3):169-174.
11. Fox KM, Magaziner J, Hebel JR, Kenzora JE, Kashner TM. Intertrochanteric versus femoral neck hip fractures: differential characteristics, treatment, and sequelae. J Gerontol A Biol Sci Med Sci. 1999;54(12):M635-M640.
12. Carroll C, Stevenson M, Scope A, Evans P, Buckley S. Hemiarthroplasty and total hip arthroplasty for treating primary intracapsular fracture of the hip: a systematic review and cost-effectiveness analysis. Health Technol Assess. 2011;15(36):1-74.
13. Keating JF, Grant A, Masson M, Scott NW, Forbes JF. Randomized comparison of reduction and fixation, bipolar hemiarthroplasty, and total hip arthroplasty. Treatment of displaced intracapsular hip fractures in healthy older patients. J Bone Joint Surg Am. 2006;88(2):249-260.
14. Rogmark C, Carlsson A, Johnell O, Sembo I. Costs of internal fixation and arthroplasty for displaced femoral neck fractures: a randomized study of 68 patients. Acta Orthop Scand. 2003;74(3):293-298.
15. Iorio R, Healy WL, Lemos DW, Appleby D, Lucchesi CA, Saleh KJ. Displaced femoral neck fractures in the elderly: outcomes and cost effectiveness. Clin Orthop. 2001;(383):229-242.
16. Slover J, Hoffman MV, Malchau H, Tosteson AN, Koval KJ. A cost-effectiveness analysis of the arthroplasty options for displaced femoral neck fractures in the active, healthy, elderly population. J Arthroplasty. 2009;24(6):854-860.
17. Foss NB, Palm H, Krasheninnikoff M, Kehlet H, Gebuhr P. Impact of surgical complications on length of stay after hip fracture surgery. Injury. 2007;38(7):780-784.
18. Garcia AE, Bonnaig JV, Yoneda ZT. Patient variables which may predict length of stay and hospital costs in elderly patients with hip fracture. J Orthop Trauma. 2012;26(11):620-623.
19. Donegan DJ, Gay AN, Baldwin K, Morales EE, Esterhai JL Jr, Mehta S. Use of medical comorbidities to predict complications after hip fracture surgery in the elderly. J Bone Joint Surg Am. 2010;92(4):807-813.
20. Edwards C, Counsell A, Boulton C, Moran CG. Early infection after hip fracture surgery: risk factors, costs and outcome. J Bone Joint Surg Br. 2008;90(6):770-777.
21. Jain P, Maini L, Mishra P, Upadhyay A, Agarwal A. Cephalomedullary interlocked nail for ipsilateral hip and femoral shaft fractures. Injury. 2004;35(10):1031-1038.
22. Matre K, Havelin LI, Gjertsen JE, Espehaug B, Fevang JM. Intramedullary nails result in more reoperations than sliding hip screws in two-part intertrochanteric fractures. Clin Orthop. 2013;471(4):1379-1386.
23. Fekete K, Manninger J, Kazár G, Cserháti P, Bosch U. Percutaneous internal fixation of femoral neck fractures with cannulated screws and a small tension band plate. Orthop Traumatol. 2000;8(4):250-263.
Hip fractures, the most severe and costly fall-related fractures, account for 350,000 hospital admissions per year.1 The majority of hip fractures result from low-impact falls, typically in patients over age 60 years. In fact, the increase in hip fracture with age is nearly exponential.2,3 With the predicted aging of our population, hip fractures will continue to increase in volume. Between 2000 and 2050, the elderly US population will increase by 135%,4 proportionately increasing the number of projected hip fractures. Considering that hip fractures account for 72% of total costs in terms of orthopedic fracture care in the elderly, the dramatic rise in hip fractures is of great concern for future costs of health care delivery in this field.5-7
In an effort to move toward a value-based system in which costs are reduced while quality of care is maintained, Medicare recently unveiled a new bundled payment system of reimbursement. Through this system, hospitals will be reimbursed for treatment provided to Medicare beneficiaries based on the expected costs of care, instead of through the traditional fee-for-service model. Given this development, orthopedic surgeons will need to develop interventions that reduce costs while maintaining quality of care after hip fracture surgery.
One of the most significant ramifications of a value-based system is that reimbursement for hip fractures may be standardized based on a single diagnosis regardless of the actual costs associated with treatment.8 In hip fracture cases, however, a wide range of factors, including degree of communition of the bone, presence of medical comorbidities,9 and amount of soft-tissue injury, can dramatically increase recovery time. In fact, one of the most important determinants of treatment costs related to hospital length of stay (LOS) is whether the fracture is a femoral neck or intertrochanteric fracture.10,11 Type of fracture is a significant determinant of surgical options, and these can dramatically change patient outcomes and costs of surgical care.12-16 In addition, hospital recovery time or LOS can vary widely based on type of surgery. As hospitalization costs account for 44% of the direct medical costs for hip fractures,17 differences in LOS can have major financial implications in a value-based system of reimbursement in which all forms of hip fracture are reimbursed a standard amount.
We conducted a study to analyze differences in hospital LOS for different forms of hip fracture repair to determine the potential financial repercussions of a bundled payment model of reimbursement. By performing a retrospective chart review at a large, level I trauma center, we were able to compare LOS and associated costs for total hip arthroplasty (THA), hemiarthroplasty (HA), cephalomedullary nailing (CMN), open reduction and internal fixation (ORIF), and closed reduction and percutaneous pinning (CRPP).
Materials and Methods
After receiving institutional review board approval for this study, we retrospectively reviewed all hip fracture cases treated at a level I trauma center between January 2000 and December 2009. Current Procedural Terminology (CPT) codes were searched for cases of low-energy falls that caused hip fractures that were resolved with THA, HA, CMN, ORIF, or CRPP. Patients who underwent HA or THA were grouped for analysis. Patients who were over age 60 years and had acetabular, proximal femoral, trochanteric, or femoral neck fractures were included in our search. Patients who had incomplete medical records or did not meet the age criterion were excluded from analysis.
We reviewed patient charts in our institutional electronic medical records database to collect these data: date of birth, age, sex, date of admission, date of discharge, American Society of Anesthesiologists (ASA) Physical Status score, complications, height, weight, start and stop times of procedure, whether or not the procedure was an emergent procedure, days from admission to surgery, 90-day readmissions, days from surgery to discharge, and general category of operation. We also recorded individual comorbidities, including prior myocardial infarction, dysrhythmia, atrial fibrillation, congestive heart failure, heart block, cerebrovascular disease, chronic obstructive pulmonary disease, emphysema, current smoking status, smoking history, renal disease, dialysis, cancer, and diabetes. Duration of surgery was calculated from recorded start and stop times. Body mass index was calculated using height and weight recorded during initial stay. LOS was recorded as the difference between the admission and discharge dates.
Mean total cost to the hospital ($4530/d patient was hospitalized) was obtained from the institution’s financial services. All fractional LOS values were rounded to the nearest whole number and multiplied by the per diem cost. Student t test was used to compare mean LOS and costs of HA/THA with those of all the other procedures. Additional tests were run to analyze differences in LOS and type of surgeries performed throughout the 9-year period. A multivariate regression model controlling for ASA score, body mass index, age, sex, and comorbidities was developed to analyze differences in LOS and costs for patients who underwent HA/THA versus CMN, ORIF, and CRPP. Significance was set at P = .05.
Results
Our search identified 720 patients who were over age 60 years and underwent operative fixation for hip fracture at our level I trauma center between 2000 and 2009. Of these 720 patients, 105 who had incomplete charts or did not meet the age criteria were excluded, leaving 615 patients (with complete records of isolated low-energy hip fractures) for analysis.
Table 1 lists the demographics of our patient population. The majority of patients had undergone ORIF (30.24%) or HA/THA (45.69%). CRPP was the least common procedure (9.92%) after CMN (14.15%). Mean age was 78.4 years; the majority of patients were between 75 and 89 years of age. Mean hospital LOS was 6.91 days. The majority of patients (n = 414; 67.32%) were female. ASA scores had a narrow distribution, with most patients assigned a score of 3. The readmission rate was significantly higher for HA/THA (39.1%) than for ORIF (28.5%; P = .02) and CRPP (24.6%; P = .04).
Table 2 lists mean LOS and associated costs for each procedure compared with HA/THA. Mean LOS for all patients was 6.91 days, with associated hospitalization costs of $30,011.25. Patients who underwent HA/THA had the longest mean LOS (7.43 days) and highest mean hospitalization costs ($33,657.90). In comparison, patients who underwent ORIF had a mean LOS of 6.59 days with $29,852.70 in costs (P = .04). CRPP also had a significantly (P < .003) shorter LOS (5.59 days) and lower costs ($25,322.70). Although CMN had a mean LOS of 6.89 days and $31,211.70 in costs, the difference in LOS was not significantly different from that of HA/THA. The proportion of surgeries that were HA/THA, CMN, ORIF, and CRPP did not change significantly through the 9-year period (P = .19). Similarly, mean LOS did not change significantly for any of the types of surgery through this period (Table 3).
Figure 1 provides the distribution of LOS for all 4 procedures. The interquartile range (IQR) for patients who underwent HA/THA was 4 to 9 days (median, 6 days). Patients who underwent CMN also had a median LOS of 6 days and an IQR of 4 to 8 days. Both ORIF (IQR, 4-8 days) and CRPP (IQR, 3-6 days) were associated with a median LOS of 5 days.
Figure 2 shows mean hospitalization costs based on type of procedure. HA/THA had the highest mean cost, $33,657.90, or $8335.20 more than CRPP ($25,322.70). Patients who underwent CMN had a mean cost of $31,211.70, versus $29,852.70 for patients who underwent ORIF.
Table 4 summarizes the multivariate analysis results. After ASA score, sex, age, and comorbidities were controlled for, there was an overall significant relationship involving surgical treatment, LOS, and associated hospitalization costs for HA/THA, ORIF, and CRPP. Compared with HA/THA, ORIF had $3805.20 less in costs (P = .042) and 0.84 fewer hospital days. Patients who underwent CRPP were hospitalized for significantly fewer days (1.63) and associated costs ($7383.90) (P = .0076). There was no significant difference in LOS and costs between HA/THA and CMN. Of the controlled variables, only ASA score (P < .001) and male sex (P = .001) were significantly associated with changes in LOS and costs. There was no significant association with comorbidities, LOS, or costs.
Discussion
In this study of surgical intervention in patients with hip fractures, we determined that HA/THA was associated with significantly increased hospital LOS and costs than ORIF and CRPP. Although arthroplasty had an increased mean LOS compared with CMN, the difference was not statistically significant. In addition to type of procedure, both male sex (P = .001) and preoperative ASA score (P < .001) were significant predictors of LOS and costs. These findings are supported by other studies in which preoperative functioning was found to be a strong predictor of increased LOS and costs among hip fracture patients,18 most likely because of increased risk for complications.19
Although our study was the first to directly compare LOS and costs for HA/THA and CMN, other investigators have analyzed the effect of surgical complications on LOS for patients treated with THA, HA, and CMN. In a study on the effects of surgical complications on LOS after hip fracture surgery, Foss and colleagues17 reported that the proportion of CMN patients (31%) with complications was larger than that of HA patients (19%) and THA patients (0%). They also reported that surgical complications were associated with significantly increased LOS during primary admission. Similarly, Edwards and colleagues20 found that the infection risk was higher with CMN (3.1%) than with THA (0%) and HA (0%-2.3%) and that infections were associated with increased LOS (P > .001). However, further statistical analysis revealed that the odds of developing an infection were not significantly higher with CMN than with other studies.20 Similarly, other studies have reported low rates of complications, including nonunion, with CMN.21,22 In our study, we found no significant difference in LOS and costs for CMN and HA/THA after controlling for ASA score, which is known to be associated with a higher risk for complications.18,19
The largest difference in LOS and costs after controlling for potential confounding variables was between HA/THA and CRPP ($7383.90). To our knowledge, only one study has performed a comparative analysis of LOS for CRPP and other surgical treatments for hip fractures. For femoral neck fractures treated between 1990 and 1994, Fekete and colleagues23 found that LOS was 14.9 days for ORIF cases and 12.1 days for CRPP cases—a difference of 2.8 days. In comparison, we found a 1-day difference in mean LOS between ORIF cases (6.59 days) and CRPP cases (5.59 days).
Other studies of LOS and associated costs over a 2-year period have found that ORIF is overall more costly than HA/THA. For example, Keating and colleagues13 compared total costs of care, including LOS, for healthy older patients with displaced intracapsular hip fractures treated with ORIF, bipolar HA, or THA. Although ORIF was initially less costly than HA/THA, overall ORIF costs over 2 years were significantly higher because of readmissions, which increased overall LOS. Similarly, in cases of displaced femoral fractures, Iorio and colleagues15 found that LOS was 6.4 days for ORIF, 4.9 days for unipolar HA, 6.2 days for bipolar HA, and 5.5 days for cemented and hybrid THA. However, when overall projected costs were estimated, including the costs of rehabilitation and of (probable) revision arthroplasty, ORIF was estimated to cost more over a 2-year period because of the need for additional care and in-patient stays. In contrast, we found that hospitalization costs were $3805.20 lower for ORIF than for HA/THA, even after adjusting for comorbidities, and that ORIF had a lower overall readmission rate. Early discharge of patients who are at risk for subsequent complications may have played a significant role in increasing readmission rates for arthroplasty patients. These findings indicate the complexities involved in a bundled payment system of reimbursement, in which a single payment for both initial stay and related readmissions will force orthopedists to consider long-term hospitalization costs when deciding on length of postoperative care and the most cost-effective surgical treatment.
One of the limitations of this study is its retrospective design. Although selection of our sample from a single level I trauma center reduced differences in cost and patient care protocols between institutions, it also reduced the generalizability of our actual costs. In addition, for some patients, LOS may have increased because of delays in surgery or discharge, lack of operating room availability, or need for further medical clearance for additional procedures. Day of admission could also have significantly affected LOS. However, the effects of these confounding factors were reduced because of the large sample analyzed. As stated earlier, overall LOS depends on both initial in-patient stays and readmissions. Therefore, long-term prospective studies that compare LOS and associated costs for patients with hip fractures treated with ORIF, CRPP, HA/THA, and CMN are needed.
Conclusion
It has been recently suggested that hip fracture repair be included in the National Pilot Program on Payment Bundling, which will potentially reimburse orthopedic surgeons a standardized amount for hip fracture surgery regardless of actual treatment costs.8 In this model, it will be essential to understand how type of fracture and surgical procedure can influence LOS and therefore hip fracture treatment costs. We found that, based on these factors, mean LOS ranged from 5.59 to 7.43 days, which translates to a cost range of $25,322.70 to $33,657.90. Before a standardized bundled payment system is implemented, further studies are needed to identify other factors that can significantly affect the cost of hip fracture repair.
1. American Academy of Orthopaedic Surgeons. Burden of Musculoskeletal Diseases in the United States: Prevalence, Societal and Economic Cost. Rosemont, IL: American Academy of Orthopaedic Surgeons; 2008.
2. Samelson EJ, Zhang Y, Kiel DP, Hannan MT, Felson DT. Effect of birth cohort on risk of hip fracture: age-specific incidence rates in the Framingham study. Am J Public Health. 2002;92(5):858-862.
3. Scott JC. Osteoporosis and hip fractures. Rheum Dis Clin North Am. 1990;16(3):717-740.
4. Wiener JM, Tilly J. Population ageing in the United States of America: implications for public programmes. Int J Epidemiol. 2002;31(4):776-781.
5. Burge R, Dawson-Hughes B, Solomon DH, Wong JB, King A, Tosteson A. Incidence and economic burden of osteoporosis-related fractures in the United States, 2005–2025. J Bone Miner Res. 2007;22(3):465-475.
6. Burge RT, King AB, Balda E, Worley D. Methodology for estimating current and future burden of osteoporosis in state populations: application to Florida in 2000 through 2025. Value Health. 2003;6(5):574-583.
7. Tosteson AN, Burge RT, Marshall DA, Lindsay R. Therapies for treatment of osteoporosis in US women: cost-effectiveness and budget impact considerations. Am J Manag Care. 2008;14(9):605-615.
8. Sood N, Huckfeldt PJ, Escarce JJ, Grabowski DC, Newhouse JP. Medicare’s bundled payment pilot for acute and postacute care: analysis and recommendations on where to begin. Health Aff. 2011;30(9):1708-1717.
9. Shah A, Eissler J, Radomisli T. Algorithms for the treatment of femoral neck fractures. Clin Orthop. 2002;(399):28-34.
10. Sund R, Riihimäki J, Mäkelä M, et al. Modeling the length of the care episode after hip fracture: does the type of fracture matter? Scand J Surg. 2009;98(3):169-174.
11. Fox KM, Magaziner J, Hebel JR, Kenzora JE, Kashner TM. Intertrochanteric versus femoral neck hip fractures: differential characteristics, treatment, and sequelae. J Gerontol A Biol Sci Med Sci. 1999;54(12):M635-M640.
12. Carroll C, Stevenson M, Scope A, Evans P, Buckley S. Hemiarthroplasty and total hip arthroplasty for treating primary intracapsular fracture of the hip: a systematic review and cost-effectiveness analysis. Health Technol Assess. 2011;15(36):1-74.
13. Keating JF, Grant A, Masson M, Scott NW, Forbes JF. Randomized comparison of reduction and fixation, bipolar hemiarthroplasty, and total hip arthroplasty. Treatment of displaced intracapsular hip fractures in healthy older patients. J Bone Joint Surg Am. 2006;88(2):249-260.
14. Rogmark C, Carlsson A, Johnell O, Sembo I. Costs of internal fixation and arthroplasty for displaced femoral neck fractures: a randomized study of 68 patients. Acta Orthop Scand. 2003;74(3):293-298.
15. Iorio R, Healy WL, Lemos DW, Appleby D, Lucchesi CA, Saleh KJ. Displaced femoral neck fractures in the elderly: outcomes and cost effectiveness. Clin Orthop. 2001;(383):229-242.
16. Slover J, Hoffman MV, Malchau H, Tosteson AN, Koval KJ. A cost-effectiveness analysis of the arthroplasty options for displaced femoral neck fractures in the active, healthy, elderly population. J Arthroplasty. 2009;24(6):854-860.
17. Foss NB, Palm H, Krasheninnikoff M, Kehlet H, Gebuhr P. Impact of surgical complications on length of stay after hip fracture surgery. Injury. 2007;38(7):780-784.
18. Garcia AE, Bonnaig JV, Yoneda ZT. Patient variables which may predict length of stay and hospital costs in elderly patients with hip fracture. J Orthop Trauma. 2012;26(11):620-623.
19. Donegan DJ, Gay AN, Baldwin K, Morales EE, Esterhai JL Jr, Mehta S. Use of medical comorbidities to predict complications after hip fracture surgery in the elderly. J Bone Joint Surg Am. 2010;92(4):807-813.
20. Edwards C, Counsell A, Boulton C, Moran CG. Early infection after hip fracture surgery: risk factors, costs and outcome. J Bone Joint Surg Br. 2008;90(6):770-777.
21. Jain P, Maini L, Mishra P, Upadhyay A, Agarwal A. Cephalomedullary interlocked nail for ipsilateral hip and femoral shaft fractures. Injury. 2004;35(10):1031-1038.
22. Matre K, Havelin LI, Gjertsen JE, Espehaug B, Fevang JM. Intramedullary nails result in more reoperations than sliding hip screws in two-part intertrochanteric fractures. Clin Orthop. 2013;471(4):1379-1386.
23. Fekete K, Manninger J, Kazár G, Cserháti P, Bosch U. Percutaneous internal fixation of femoral neck fractures with cannulated screws and a small tension band plate. Orthop Traumatol. 2000;8(4):250-263.
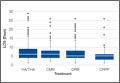
Arthroscopic Posterior-Inferior Capsular Release in the Treatment of Overhead Athletes
Glenohumeral internal rotation deficit (GIRD) can be observed in overhead athletes and is thought to play a role in generating pain and rotator cuff weakness in the dominant shoulder with sport. It is unclear what is an acceptable value of GIRD in a population of overhead athletes and whether it should be based solely on internal rotation deficit or should include total range of motion (ROM) deficit.1,2 Acquired GIRD in the athlete’s throwing shoulder has been thoroughly documented in the literature as a loss of internal rotation relative to the nonthrowing shoulder, with etiologies including bony adaptations (increased humeral retroversion), muscular tightness, and posterior capsular tightness.1,3-11 In particular, the repetitive torsional stresses acting on the throwing shoulder of baseball players is thought to produce, over the long term, structural adaptations such as increased humeral retroversion.5,12-14 Further, for shoulders with posterior-inferior capsular tightness, cadaveric studies have shown increased contact pressure at the coracoacromial arch during simulated follow-through.15 Athletes of other overhead and throwing sports, such as football, softball, tennis, and volleyball, may show similar adaptations in overhead motion.9,16,17
GIRD has been associated with a variety of pathologic conditions, including scapular dyskinesis, internal and secondary impingement, partial articular-sided rotator cuff tears, damage to the biceps–labral complex, and ulnar collateral ligament insufficiency.10,12,18-22
Restriction from engaging in exacerbating activities (eg, throwing) and compliance with a specific stretching program reduces or eliminates GIRD in the majority of cases.1,23-28 In the few cases in which conservative management fails, operative intervention may be indicated.1,23,29,30 Few investigators have detailed an operative technique for selective arthroscopic capsular release of the posterior-inferior capsule or evaluated the ability of athletes to return to sport after such surgery.
In this article, we present our technique for arthroscopic posterior-inferior capsular release and report the results of applying this technique in a population of athletes with symptomatic GIRD that was unresponsive to nonoperative treatment and was preventing them from returning to sport.
We hypothesized that selective arthroscopic surgical release of the posterior-inferior capsule would improve symptomatic GIRD and result in a return to sport in the majority of cases unresponsive to nonoperative treatment.
Materials and Methods
Patients
After obtaining institutional review board approval, we retrospectively reviewed patient charts and collected data. Study inclusion criteria were arthroscopic selective posterior-inferior capsular release between 2004 and 2008; failure to resume sport after minimum 3 months of physical therapy, including use of sleeper stretch, active joint mobilization by licensed physical therapist, and sport-specific restriction from exacerbating activities (eg, throwing for baseball players); and active participation in overhead sport.1,27 Exclusion criteria were generalized adhesive capsulitis, labral pathology producing glenohumeral joint instability (Bankart or reverse Bankart lesion), high-grade or full-thickness tearing of rotator cuff, and clinically significant partial-thickness tearing or instability of long head of biceps tendon.
Assessment
One of 3 authors (Dr. Buss, Dr. Codding, or Dr. Dahm) used a bubble goniometer to measure passive internal rotation. Patients were positioned supine with 90° of thoracohumeral abduction and 90° of elbow flexion. The examiner’s hand stabilized the scapula against the examination table, in accordance with published techniques.1,26 Active internal rotation was measured at 0° of thoracohumeral abduction by noting the most superior spinal segment reached. Before and after surgery, passive internal rotation measurements were taken on both arms. GIRD was determined by the difference between dominant and nondominant arm measurements; segmental differences were obtained by subtracting segments achieved between the dominant and nondominant arms.
Before surgery and at minimum 2-year follow-up after surgery, patients completed a subjective questionnaire, which included the American Shoulder and Elbow Surgeons (ASES) Standardized Shoulder Assessment Form, for assessment of both arms. ASES scores are reliable, valid, and responsive in evaluating shoulder pain and function.15,31 Patients also answered questions about their ability to return to play, their level of play after surgery, and whether they would undergo the procedure again.
Surgical Technique
After induction of general anesthesia and standard preparation and draping, the patient is placed in a standard beach-chair position and examined. Diagnostic arthroscopy is then performed. In all patients, intra-articular evaluation revealed a thickened, contracted posterior band of the inferior glenohumeral ligament. This finding is consistent with other studies of patients with significant GIRD.1,14,22,30
On completion of the diagnostic portion of the arthroscopy, attention is turned to the selective posterior-inferior capsular release. Key to proper execution of the release is establishing a posterior-inferior accessory portal. This is accomplished while viewing from a standard posterior (“soft spot”) portal and determining the appropriate location and angle of entry by spinal needle localization. Typically, an entry point is selected about 4 cm distal and 1 cm lateral to the standard posterior portal. An 18-gauge spinal needle introduced at this location is angled about 15° superiorly and about 20° medially. Once the appropriate vector is determined, a skin incision is made, and a Wissinger rod is introduced, over which a small-diameter cannula is passed. A hooked-tip electrocautery device is used to divide the posterior capsule from the glenoid labrum between the 8- and 6-o’clock positions in the right shoulder (Figure). Care is taken to perform the release immediately adjacent to the glenoid labrum and using short bursts of cautery in order to minimize risk of injury to the teres minor branch of the axillary nerve. Adequate release is confirmed by reassessing passive internal rotation under anesthesia. Additional procedures are performed, if necessary, after completion of the capsular release.

Postoperative rehabilitation consists initially of pendulum exercises and scapular retraction starting on postoperative day 1. Once the swelling from the surgical procedure subsides, typically within 1 week, passive and active-assisted ROM and gentle posterior capsular mobilization are initiated under the direction of a licensed physical therapist. Active ROM is allowed once the patient regains normal scapulothoracic rhythm. Strengthening consists initially of isometrics followed by light resistance strengthening for the rotator cuff and scapular stabilizers once active ROM and scapulothoracic rhythm return to normal. Passive internal rotation stretching, including use of the sleeper stretch, is implemented as soon as tolerated and continues throughout the rehabilitation process.32
Statistical Analysis
Statistical analysis was performed with Stata Release 11 (StataCorp, College Station, Texas). Paired t tests were used to assess preoperative and postoperative mean differences in ASES scores, in passive glenohumeral internal rotation, and in active glenohumeral internal rotation; independent-samples t tests were used to assess side-to-side differences. Significance was set at P < .05.
Results
Fifteen overhead athletes met the study inclusion criteria. Two were lost to follow-up. Of the remaining 13 patients, 6 underwent isolated arthroscopic posterior-inferior capsular release, and 7 had concomitant procedures (6 subacromial decompressions, 1 superior labrum anterior-posterior [SLAP] repair). There were 11 male athletes and 2 female athletes. Twelve of the 13 patients were right-hand–dominant. Mean age at time of surgery was 21 years (range, 16-33 years). There were 10 baseball players (6 pitchers, 4 position players); the other 3 patients played softball (1), volleyball (1), or tennis (1). Six patients played at high school level, 5 at college level, 1 at professional level, and 1 at amateur level. All 13 patients underwent a minimum of 3 months of comprehensive rehabilitation, which included use of the sleeper stretch, active joint mobilization by a licensed physical therapist, and sport-specific restriction from exacerbating activities. Mean duration of symptoms before surgery was 18 months (range, 4-48 months). Mean postoperative follow-up was 31 months (range, 24-59 months). Mean ASES score was 71.5 (range, 33-95) before surgery and 86.9 (range, 60-100) after surgery (P < .001). Mean GIRD improved from 43.1° (range, 30°-60°) before surgery to 9.7° (range, –7° to 40°) after surgery (P < .001). Mean active internal rotation difference improved from 3.8 vertebral segments before surgery to 2.6 vertebral segments after surgery; this difference was not statistically significant (P = .459). Ten (77%) of the 13 patients returned to their preoperative level of play or a higher level; the other 3 (23%) did not return to their preoperative level of play but continued to compete in a different position (Table). Eleven patients (85%) stated they would repeat the procedure. One of the 2 patients who would not repeat the procedure was in the isolated posterior-inferior capsular release group; the other was in the concomitant-procedure group (subacromial decompression). Total glenohumeral ROM of dominant arm was 122° before surgery and 136° after surgery (P = .04). There was no significant difference in total ROM between dominant and nondominant arms after surgery (136° and 141°; P = .12), but the preoperative difference was significant (122° vs 141°; P = .022).

Discussion
GIRD has been associated with various pathologic conditions of the upper extremity. In 1991, Verna28 found that a majority of 39 professional baseball pitchers with significant GIRD had shoulder problems that affected playing time. More recently, GIRD has been associated with a progression of injuries, including scapular dyskinesia, internal and secondary impingement, articular-sided partial rotator cuff tears, rotator cuff weakness, damage to the biceps–labral complex, and ulnar collateral ligament insufficiency.12,18-22 In a cadaveric study of humeral head translation, Harryman and colleagues33 noted an anterosuperior migration of the humeral head during flexion and concluded it resulted from a loose anterior and tight posterior glenohumeral capsule, leading to loss of glenohumeral internal rotation. More recently, posterosuperior migration of the humeral head has been postulated, with GIRD secondary to an essential posterior capsular contracture.1 Tyler and colleagues34 clinically linked posterior capsular tightness with GIRD, and both cadaveric and magnetic resonance imaging studies have supported the finding that posterior capsular contracture leads to posterosuperior humeral head migration in association with GIRD.14,20 Such a disruption in normal glenohumeral joint mechanics could produce phenomena of internal or secondary acromiohumeral impingement and pain.
More recently, in a large cohort of professional baseball pitchers, a significant correlation was found between the incidence of rotator cuff strength deficits and GIRD.35 More than 40% of the pitchers with GIRD of at least 35° had a measureable rotator cuff strength deficit in the throwing shoulder.
Burkhart and colleagues23 concluded that the shoulder most at risk for developing “dead arm” has GIRD and an advanced form of scapular dyskinesia known as SICK scapula (the phenomenon involves Scapula malposition, Inferior medial border prominence, Coracoid pain and malposition, and dysKinesis of scapular movement).
Most athletes with symptoms attributed to GIRD respond to conservative management. A posterior-inferior capsular stretching program focused on regaining internal rotation in the throwing arm has been shown to return about 90% of athletes to play.1 Numerous studies have indicated that enrollment in a compliant stretching program reduces GIRD.1,23-27 However, nonoperative treatment fails in a reported 10% of patients with GIRD; these patients may respond to operative treatment.1
More specifically, for patients who do not respond to conservative treatment, a posterior-inferior capsular release may be indicated.1,29 Ticker and colleagues22 identified 9 patients who had lost internal rotation and had a posterior capsular contracture at arthroscopy. That study, however, was not performed on overhead or throwing athletes. Yoneda and colleagues30 followed 16 overhead throwing athletes after arthroscopic posterior-inferior capsular release and found favorable preliminary clinical results. Eleven of the 16 patients returned to their preinjury level of performance; the other 5 returned to a lower level. In addition, all 4 patients who underwent isolated arthroscopic capsular release had throwing power restored to between 90% and 100%.
In the present study, 10 of 13 patients who underwent arthroscopic posterior-inferior capsular release returned to their preoperative level of play or a higher level. Mean passive GIRD improved significantly from before surgery to after surgery. ASES scores likewise were significantly improved from before surgery to after surgery. The active internal rotation difference as measured by vertebral segment level was not significantly changed after surgery. This lack of improvement may stem from the more complex musculoligamentous interactions governing active internal rotation versus isolated, passive internal rotation. Another possible explanation for lack of improvement is that the interobserver and intraobserver reliability of this method is lower.36
At 2-year follow-up, the patient who had undergone concomitant SLAP repair demonstrated a 23% improvement in ASES score and more internal rotation on the dominant arm relative to the nondominant arm. This patient returned to a level of play at least as good as his preoperative level. Although we could not determine its statistical significance, this patient’s improvement suggests that the SLAP repair did not reduce the efficacy of the posterior-inferior capsular release.
Limitations of this study include its relatively small cohort (precluded statistical comparisons between groups), the proportion of patients (7/13) who had concomitant surgeries, and the limited options for patient outcome scores. Although the ASES score is a validated outcome score, the Kerlan-Jobe Orthopaedic Clinic Shoulder and Elbow (KJOC) score or the Disabilities of the Arm, Shoulder, and Hand (DASH) score may be more appropriate in an athletic population. In addition, although all study patients had GIRD that was unresponsive to a concerted trial of nonoperative management, we did not have a control group (nonoperatively treated patients) for comparison. Finally, we did not obtain computed tomography scans or account for the potential contribution of humeral retroversion to GIRD in this group of patients.
Conclusion
Selective arthroscopic posterior-inferior capsular release can be recommended as a reasonable operative solution for overhead athletes with symptomatic GIRD that has not responded to conservative management. In the present study, ASES scores improved significantly, and 77% of our athlete-patients returned to sport at their preoperative level of play or a higher level.
1. Burkhart SS, Morgan CD, Kibler WB. The disabled throwing shoulder: spectrum of pathology part I: pathoanatomy and biomechanics. Arthroscopy. 2003;19(4):404-420.
2. Wilk KE, Macrina LC, Fleisig GS, et al. Correlation of glenohumeral internal rotation deficit and total rotational motion to shoulder injuries in professional baseball pitchers. Am J Sports Med. 2011;39(2):329-335.
3. Bigliani LU, Codd TP, Connor PM, Levine WN, Littlefield MA, Hershon SJ. Shoulder motion and laxity in the professional baseball player. Am J Sports Med. 1997;25(5):609-613.
4. Brown LP, Niehues SL, Harrah A, Yavorsky P, Hirshman HP. Upper extremity range of motion and isokinetic strength of the internal and external shoulder rotators in Major League baseball players. Am J Sports Med. 1988;16(6):577-585.
5. Crockett HC, Gross LB, Wilk KE, et al. Osseous adaptation and range of motion at the glenohumeral joint in professional baseball pitchers. Am J Sports Med. 2002;30(1):20-26.
6. Kibler WB, Chandler TJ, Livingston BP, Roetert EP. Shoulder range of motion in elite tennis players. Effect of age and years of tournament play. Am J Sports Med. 1996;24(3):279-285.
7. Meister K. Injuries to the shoulder in the throwing athlete. Part one: biomechanics/pathophysiology/classification of injury. Am J Sports Med. 2000;28(2):265-275.
8. Osbahr DC, Cannon DL, Speer KP. Retroversion of the humerus in the throwing shoulder of college baseball pitchers. Am J Sports Med. 2002;30(3):347-353.
9. Torres RR, Gomes JL. Measurement of glenohumeral internal rotation in asymptomatic tennis players and swimmers. Am J Sports Med. 2009;37(5):1017-1023.
10. Tyler TF, Nicholas SJ, Lee SJ, Mullaney M, McHugh MP. Correction of posterior shoulder tightness is associated with symptom resolution in patients with internal impingement. Am J Sports Med. 2010;28(1):114-119.
11. Wilk KE, Meister K, Andrews JR. Current concepts in the rehabilitation of the overhead throwing athlete. Am J Sports Med. 2002;30(1):136-151.
12. Braun S, Kokmeyer D, Millett PJ. Shoulder injuries in the throwing athlete. J Bone Joint Surg Am. 2009;91(4):966-978.
13. Reagan KM, Meister K, Horodyski MB, Werner DW, Carruthers C, Wilk K. Humeral retroversion and its relationship to glenohumeral rotation in the shoulder of college baseball players. Am J Sports Med. 2002;30(3):354-360.
14. Tehranzadeh AD, Fronek J, Resnick D. Posterior capsular fibrosis in professional baseball pitchers: case series of MR arthrographic findings in six patients with glenohumeral internal rotational deficit. Clin Imaging. 2007;31(5):343-348.
15. Michener LA, McClure PW, Sennett BJ. American Shoulder and Elbow Surgeons Standardized Shoulder Assessment Form, patient self-report section: reliability, validity, and responsiveness. J Shoulder Elbow Surg. 2002;11(6):587-594.
16. Curtis AS, Deshmukh R. Throwing injuries: diagnosis and treatment. Arthroscopy. 2003;19(suppl 1):80-85.
17. Lajtai G, Pfirrmann CW, Aitzetmuller G, Pirkl C, Gerber C, Jost B. The shoulders of fully competitive professional beach volleyball players: high prevalence of infraspinatus atrophy. Am J Sports Med. 2009;37(7):1375-1383.
18. Burkhart SS, Morgan CD. The peel-back mechanism: its role in producing and extending posterior type II SLAP lesions and its effect on SLAP repair rehabilitation. Arthroscopy. 1998;14(6):637-640.
19. Dines JS, Frank JB, Akerman M, Yocum LA. Glenohumeral internal rotation deficits in baseball players with ulnar collateral ligament insufficiency. Am J Sports Med. 2009;37(3):566-570.
20. Grossman MG, Tibone JE, McGarry MH, Schneider DJ, Veneziani S, Lee TQ. A cadaveric model of the throwing shoulder: a possible etiology of superior labrum anterior-to-posterior lesions. J Bone Joint Surg Am. 2005;87(4):824-831.
21. Myers JB, Laudner KG, Pasquale MR, Bradley JP, Lephart SM. Glenohumeral range of motion deficits and posterior shoulder tightness in throwers with pathologic internal impingement. Am J Sports Med. 2006;34(3):385-391.
22. Ticker JB, Beim GM, Warner JJ. Recognition and treatment of refractory posterior capsular contracture of the shoulder. Arthroscopy. 2000;16(1):27-34.
23. Burkhart SS, Morgan CD, Kibler WB. The disabled throwing shoulder: spectrum of pathology part III: the SICK scapula, scapular dyskinesis, the kinetic chain, and rehabilitation. Arthroscopy. 2003;19(6):641-661.
24. Kibler WB, McMullen J. Scapular dyskinesis and its relation to shoulder pain. J Am Acad Orthop Surg. 2003;11(2):142-151.
25. Kibler WB. The relationship of glenohumeral internal rotation deficit to shoulder and elbow injuries in tennis players: a prospective evaluation of posterior capsular stretching. Presented at: American Shoulder and Elbow Surgeons 15th Annual Closed Meeting; November 6, 1998; New York, NY.
26. Lintner D, Mayol M, Uzodinma O, Jones R, Labossiere D. Glenohumeral internal rotation deficits in professional pitchers enrolled in an internal rotation stretching program. Am J Sports Med. 2007;35(4):617-621.
27. McClure P, Balaicuis J, Heiland D, Broersma ME, Thorndike CK, Wood A. A randomized controlled comparison of stretching procedures for posterior shoulder tightness. J Orthop Sports Phys Ther. 2007;37(3):108-114.
28. Verna C. Shoulder flexibility to reduce impingement. Presented at: 3rd Annual Professional Baseball Athletic Trainer Society Meeting; March 1991; Mesa, AZ.
29. Bach HG, Goldberg BA. Posterior capsular contracture of the shoulder. J Am Acad Orthop Surg. 2006;14(5):265-277.
30. Yoneda M, Nakagawa S, Mizuno N, et al. Arthroscopic capsular release for painful throwing shoulder with posterior capsular tightness. Arthroscopy. 2006;22(7):801e1-801e5.
31. Kocher MS, Horan MP, Briggs KK, Richardson TR, O’Holleran J, Hawkins RJ. Reliability, validity, and responsiveness of the American Shoulder and Elbow Surgeons subjective shoulder scale in patients with shoulder instability, rotator cuff disease, and glenohumeral arthritis. J Bone Joint Surg Am. 2005;87(9):2006-2011.
32. Johansen RL, Callis M, Potts J, Shall LM. A modified internal rotation stretching technique for overhand and throwing athletes. J Orthop Sports Phys Ther. 1995;21(4):216-219.
33. Harryman DT 2nd, Sidles JA, Clark JM, McQuade KJ, Gibb TD, Matsen FA 3rd. Translation of the humeral head on the glenoid with passive glenohumeral motion. J Bone Joint Surg Am. 1990;72(9):1334-1343.
34. Tyler TF, Nicholas SJ, Roy T, Gleim GW. Quantification of posterior capsule tightness and motion loss in patients with shoulder impingement. Am J Sports Med. 2000;28(5):668-673.
35. McCarty LP, Buss DD, Giveans MR. Correlation between throwing arm strength deficit and glenohumeral internal rotation deficit in professional baseball pitchers, and differences between Latino and non-Latino pitchers. Presented at: American Academy of Orthopaedic Surgeons Annual Meeting; February 2012; San Francisco, CA.
36. Edwards TB, Bostick RD, Greene CC, Baratta RV, Drez D. Interobserver and intraobserver reliability of the measurement of shoulder internal rotation by vertebral level. J Shoulder Elbow Surg. 2002;11(1):40-42.
Glenohumeral internal rotation deficit (GIRD) can be observed in overhead athletes and is thought to play a role in generating pain and rotator cuff weakness in the dominant shoulder with sport. It is unclear what is an acceptable value of GIRD in a population of overhead athletes and whether it should be based solely on internal rotation deficit or should include total range of motion (ROM) deficit.1,2 Acquired GIRD in the athlete’s throwing shoulder has been thoroughly documented in the literature as a loss of internal rotation relative to the nonthrowing shoulder, with etiologies including bony adaptations (increased humeral retroversion), muscular tightness, and posterior capsular tightness.1,3-11 In particular, the repetitive torsional stresses acting on the throwing shoulder of baseball players is thought to produce, over the long term, structural adaptations such as increased humeral retroversion.5,12-14 Further, for shoulders with posterior-inferior capsular tightness, cadaveric studies have shown increased contact pressure at the coracoacromial arch during simulated follow-through.15 Athletes of other overhead and throwing sports, such as football, softball, tennis, and volleyball, may show similar adaptations in overhead motion.9,16,17
GIRD has been associated with a variety of pathologic conditions, including scapular dyskinesis, internal and secondary impingement, partial articular-sided rotator cuff tears, damage to the biceps–labral complex, and ulnar collateral ligament insufficiency.10,12,18-22
Restriction from engaging in exacerbating activities (eg, throwing) and compliance with a specific stretching program reduces or eliminates GIRD in the majority of cases.1,23-28 In the few cases in which conservative management fails, operative intervention may be indicated.1,23,29,30 Few investigators have detailed an operative technique for selective arthroscopic capsular release of the posterior-inferior capsule or evaluated the ability of athletes to return to sport after such surgery.
In this article, we present our technique for arthroscopic posterior-inferior capsular release and report the results of applying this technique in a population of athletes with symptomatic GIRD that was unresponsive to nonoperative treatment and was preventing them from returning to sport.
We hypothesized that selective arthroscopic surgical release of the posterior-inferior capsule would improve symptomatic GIRD and result in a return to sport in the majority of cases unresponsive to nonoperative treatment.
Materials and Methods
Patients
After obtaining institutional review board approval, we retrospectively reviewed patient charts and collected data. Study inclusion criteria were arthroscopic selective posterior-inferior capsular release between 2004 and 2008; failure to resume sport after minimum 3 months of physical therapy, including use of sleeper stretch, active joint mobilization by licensed physical therapist, and sport-specific restriction from exacerbating activities (eg, throwing for baseball players); and active participation in overhead sport.1,27 Exclusion criteria were generalized adhesive capsulitis, labral pathology producing glenohumeral joint instability (Bankart or reverse Bankart lesion), high-grade or full-thickness tearing of rotator cuff, and clinically significant partial-thickness tearing or instability of long head of biceps tendon.
Assessment
One of 3 authors (Dr. Buss, Dr. Codding, or Dr. Dahm) used a bubble goniometer to measure passive internal rotation. Patients were positioned supine with 90° of thoracohumeral abduction and 90° of elbow flexion. The examiner’s hand stabilized the scapula against the examination table, in accordance with published techniques.1,26 Active internal rotation was measured at 0° of thoracohumeral abduction by noting the most superior spinal segment reached. Before and after surgery, passive internal rotation measurements were taken on both arms. GIRD was determined by the difference between dominant and nondominant arm measurements; segmental differences were obtained by subtracting segments achieved between the dominant and nondominant arms.
Before surgery and at minimum 2-year follow-up after surgery, patients completed a subjective questionnaire, which included the American Shoulder and Elbow Surgeons (ASES) Standardized Shoulder Assessment Form, for assessment of both arms. ASES scores are reliable, valid, and responsive in evaluating shoulder pain and function.15,31 Patients also answered questions about their ability to return to play, their level of play after surgery, and whether they would undergo the procedure again.
Surgical Technique
After induction of general anesthesia and standard preparation and draping, the patient is placed in a standard beach-chair position and examined. Diagnostic arthroscopy is then performed. In all patients, intra-articular evaluation revealed a thickened, contracted posterior band of the inferior glenohumeral ligament. This finding is consistent with other studies of patients with significant GIRD.1,14,22,30
On completion of the diagnostic portion of the arthroscopy, attention is turned to the selective posterior-inferior capsular release. Key to proper execution of the release is establishing a posterior-inferior accessory portal. This is accomplished while viewing from a standard posterior (“soft spot”) portal and determining the appropriate location and angle of entry by spinal needle localization. Typically, an entry point is selected about 4 cm distal and 1 cm lateral to the standard posterior portal. An 18-gauge spinal needle introduced at this location is angled about 15° superiorly and about 20° medially. Once the appropriate vector is determined, a skin incision is made, and a Wissinger rod is introduced, over which a small-diameter cannula is passed. A hooked-tip electrocautery device is used to divide the posterior capsule from the glenoid labrum between the 8- and 6-o’clock positions in the right shoulder (Figure). Care is taken to perform the release immediately adjacent to the glenoid labrum and using short bursts of cautery in order to minimize risk of injury to the teres minor branch of the axillary nerve. Adequate release is confirmed by reassessing passive internal rotation under anesthesia. Additional procedures are performed, if necessary, after completion of the capsular release.
Postoperative rehabilitation consists initially of pendulum exercises and scapular retraction starting on postoperative day 1. Once the swelling from the surgical procedure subsides, typically within 1 week, passive and active-assisted ROM and gentle posterior capsular mobilization are initiated under the direction of a licensed physical therapist. Active ROM is allowed once the patient regains normal scapulothoracic rhythm. Strengthening consists initially of isometrics followed by light resistance strengthening for the rotator cuff and scapular stabilizers once active ROM and scapulothoracic rhythm return to normal. Passive internal rotation stretching, including use of the sleeper stretch, is implemented as soon as tolerated and continues throughout the rehabilitation process.32
Statistical Analysis
Statistical analysis was performed with Stata Release 11 (StataCorp, College Station, Texas). Paired t tests were used to assess preoperative and postoperative mean differences in ASES scores, in passive glenohumeral internal rotation, and in active glenohumeral internal rotation; independent-samples t tests were used to assess side-to-side differences. Significance was set at P < .05.
Results
Fifteen overhead athletes met the study inclusion criteria. Two were lost to follow-up. Of the remaining 13 patients, 6 underwent isolated arthroscopic posterior-inferior capsular release, and 7 had concomitant procedures (6 subacromial decompressions, 1 superior labrum anterior-posterior [SLAP] repair). There were 11 male athletes and 2 female athletes. Twelve of the 13 patients were right-hand–dominant. Mean age at time of surgery was 21 years (range, 16-33 years). There were 10 baseball players (6 pitchers, 4 position players); the other 3 patients played softball (1), volleyball (1), or tennis (1). Six patients played at high school level, 5 at college level, 1 at professional level, and 1 at amateur level. All 13 patients underwent a minimum of 3 months of comprehensive rehabilitation, which included use of the sleeper stretch, active joint mobilization by a licensed physical therapist, and sport-specific restriction from exacerbating activities. Mean duration of symptoms before surgery was 18 months (range, 4-48 months). Mean postoperative follow-up was 31 months (range, 24-59 months). Mean ASES score was 71.5 (range, 33-95) before surgery and 86.9 (range, 60-100) after surgery (P < .001). Mean GIRD improved from 43.1° (range, 30°-60°) before surgery to 9.7° (range, –7° to 40°) after surgery (P < .001). Mean active internal rotation difference improved from 3.8 vertebral segments before surgery to 2.6 vertebral segments after surgery; this difference was not statistically significant (P = .459). Ten (77%) of the 13 patients returned to their preoperative level of play or a higher level; the other 3 (23%) did not return to their preoperative level of play but continued to compete in a different position (Table). Eleven patients (85%) stated they would repeat the procedure. One of the 2 patients who would not repeat the procedure was in the isolated posterior-inferior capsular release group; the other was in the concomitant-procedure group (subacromial decompression). Total glenohumeral ROM of dominant arm was 122° before surgery and 136° after surgery (P = .04). There was no significant difference in total ROM between dominant and nondominant arms after surgery (136° and 141°; P = .12), but the preoperative difference was significant (122° vs 141°; P = .022).
Discussion
GIRD has been associated with various pathologic conditions of the upper extremity. In 1991, Verna28 found that a majority of 39 professional baseball pitchers with significant GIRD had shoulder problems that affected playing time. More recently, GIRD has been associated with a progression of injuries, including scapular dyskinesia, internal and secondary impingement, articular-sided partial rotator cuff tears, rotator cuff weakness, damage to the biceps–labral complex, and ulnar collateral ligament insufficiency.12,18-22 In a cadaveric study of humeral head translation, Harryman and colleagues33 noted an anterosuperior migration of the humeral head during flexion and concluded it resulted from a loose anterior and tight posterior glenohumeral capsule, leading to loss of glenohumeral internal rotation. More recently, posterosuperior migration of the humeral head has been postulated, with GIRD secondary to an essential posterior capsular contracture.1 Tyler and colleagues34 clinically linked posterior capsular tightness with GIRD, and both cadaveric and magnetic resonance imaging studies have supported the finding that posterior capsular contracture leads to posterosuperior humeral head migration in association with GIRD.14,20 Such a disruption in normal glenohumeral joint mechanics could produce phenomena of internal or secondary acromiohumeral impingement and pain.
More recently, in a large cohort of professional baseball pitchers, a significant correlation was found between the incidence of rotator cuff strength deficits and GIRD.35 More than 40% of the pitchers with GIRD of at least 35° had a measureable rotator cuff strength deficit in the throwing shoulder.
Burkhart and colleagues23 concluded that the shoulder most at risk for developing “dead arm” has GIRD and an advanced form of scapular dyskinesia known as SICK scapula (the phenomenon involves Scapula malposition, Inferior medial border prominence, Coracoid pain and malposition, and dysKinesis of scapular movement).
Most athletes with symptoms attributed to GIRD respond to conservative management. A posterior-inferior capsular stretching program focused on regaining internal rotation in the throwing arm has been shown to return about 90% of athletes to play.1 Numerous studies have indicated that enrollment in a compliant stretching program reduces GIRD.1,23-27 However, nonoperative treatment fails in a reported 10% of patients with GIRD; these patients may respond to operative treatment.1
More specifically, for patients who do not respond to conservative treatment, a posterior-inferior capsular release may be indicated.1,29 Ticker and colleagues22 identified 9 patients who had lost internal rotation and had a posterior capsular contracture at arthroscopy. That study, however, was not performed on overhead or throwing athletes. Yoneda and colleagues30 followed 16 overhead throwing athletes after arthroscopic posterior-inferior capsular release and found favorable preliminary clinical results. Eleven of the 16 patients returned to their preinjury level of performance; the other 5 returned to a lower level. In addition, all 4 patients who underwent isolated arthroscopic capsular release had throwing power restored to between 90% and 100%.
In the present study, 10 of 13 patients who underwent arthroscopic posterior-inferior capsular release returned to their preoperative level of play or a higher level. Mean passive GIRD improved significantly from before surgery to after surgery. ASES scores likewise were significantly improved from before surgery to after surgery. The active internal rotation difference as measured by vertebral segment level was not significantly changed after surgery. This lack of improvement may stem from the more complex musculoligamentous interactions governing active internal rotation versus isolated, passive internal rotation. Another possible explanation for lack of improvement is that the interobserver and intraobserver reliability of this method is lower.36
At 2-year follow-up, the patient who had undergone concomitant SLAP repair demonstrated a 23% improvement in ASES score and more internal rotation on the dominant arm relative to the nondominant arm. This patient returned to a level of play at least as good as his preoperative level. Although we could not determine its statistical significance, this patient’s improvement suggests that the SLAP repair did not reduce the efficacy of the posterior-inferior capsular release.
Limitations of this study include its relatively small cohort (precluded statistical comparisons between groups), the proportion of patients (7/13) who had concomitant surgeries, and the limited options for patient outcome scores. Although the ASES score is a validated outcome score, the Kerlan-Jobe Orthopaedic Clinic Shoulder and Elbow (KJOC) score or the Disabilities of the Arm, Shoulder, and Hand (DASH) score may be more appropriate in an athletic population. In addition, although all study patients had GIRD that was unresponsive to a concerted trial of nonoperative management, we did not have a control group (nonoperatively treated patients) for comparison. Finally, we did not obtain computed tomography scans or account for the potential contribution of humeral retroversion to GIRD in this group of patients.
Conclusion
Selective arthroscopic posterior-inferior capsular release can be recommended as a reasonable operative solution for overhead athletes with symptomatic GIRD that has not responded to conservative management. In the present study, ASES scores improved significantly, and 77% of our athlete-patients returned to sport at their preoperative level of play or a higher level.
1. Burkhart SS, Morgan CD, Kibler WB. The disabled throwing shoulder: spectrum of pathology part I: pathoanatomy and biomechanics. Arthroscopy. 2003;19(4):404-420.
2. Wilk KE, Macrina LC, Fleisig GS, et al. Correlation of glenohumeral internal rotation deficit and total rotational motion to shoulder injuries in professional baseball pitchers. Am J Sports Med. 2011;39(2):329-335.
3. Bigliani LU, Codd TP, Connor PM, Levine WN, Littlefield MA, Hershon SJ. Shoulder motion and laxity in the professional baseball player. Am J Sports Med. 1997;25(5):609-613.
4. Brown LP, Niehues SL, Harrah A, Yavorsky P, Hirshman HP. Upper extremity range of motion and isokinetic strength of the internal and external shoulder rotators in Major League baseball players. Am J Sports Med. 1988;16(6):577-585.
5. Crockett HC, Gross LB, Wilk KE, et al. Osseous adaptation and range of motion at the glenohumeral joint in professional baseball pitchers. Am J Sports Med. 2002;30(1):20-26.
6. Kibler WB, Chandler TJ, Livingston BP, Roetert EP. Shoulder range of motion in elite tennis players. Effect of age and years of tournament play. Am J Sports Med. 1996;24(3):279-285.
7. Meister K. Injuries to the shoulder in the throwing athlete. Part one: biomechanics/pathophysiology/classification of injury. Am J Sports Med. 2000;28(2):265-275.
8. Osbahr DC, Cannon DL, Speer KP. Retroversion of the humerus in the throwing shoulder of college baseball pitchers. Am J Sports Med. 2002;30(3):347-353.
9. Torres RR, Gomes JL. Measurement of glenohumeral internal rotation in asymptomatic tennis players and swimmers. Am J Sports Med. 2009;37(5):1017-1023.
10. Tyler TF, Nicholas SJ, Lee SJ, Mullaney M, McHugh MP. Correction of posterior shoulder tightness is associated with symptom resolution in patients with internal impingement. Am J Sports Med. 2010;28(1):114-119.
11. Wilk KE, Meister K, Andrews JR. Current concepts in the rehabilitation of the overhead throwing athlete. Am J Sports Med. 2002;30(1):136-151.
12. Braun S, Kokmeyer D, Millett PJ. Shoulder injuries in the throwing athlete. J Bone Joint Surg Am. 2009;91(4):966-978.
13. Reagan KM, Meister K, Horodyski MB, Werner DW, Carruthers C, Wilk K. Humeral retroversion and its relationship to glenohumeral rotation in the shoulder of college baseball players. Am J Sports Med. 2002;30(3):354-360.
14. Tehranzadeh AD, Fronek J, Resnick D. Posterior capsular fibrosis in professional baseball pitchers: case series of MR arthrographic findings in six patients with glenohumeral internal rotational deficit. Clin Imaging. 2007;31(5):343-348.
15. Michener LA, McClure PW, Sennett BJ. American Shoulder and Elbow Surgeons Standardized Shoulder Assessment Form, patient self-report section: reliability, validity, and responsiveness. J Shoulder Elbow Surg. 2002;11(6):587-594.
16. Curtis AS, Deshmukh R. Throwing injuries: diagnosis and treatment. Arthroscopy. 2003;19(suppl 1):80-85.
17. Lajtai G, Pfirrmann CW, Aitzetmuller G, Pirkl C, Gerber C, Jost B. The shoulders of fully competitive professional beach volleyball players: high prevalence of infraspinatus atrophy. Am J Sports Med. 2009;37(7):1375-1383.
18. Burkhart SS, Morgan CD. The peel-back mechanism: its role in producing and extending posterior type II SLAP lesions and its effect on SLAP repair rehabilitation. Arthroscopy. 1998;14(6):637-640.
19. Dines JS, Frank JB, Akerman M, Yocum LA. Glenohumeral internal rotation deficits in baseball players with ulnar collateral ligament insufficiency. Am J Sports Med. 2009;37(3):566-570.
20. Grossman MG, Tibone JE, McGarry MH, Schneider DJ, Veneziani S, Lee TQ. A cadaveric model of the throwing shoulder: a possible etiology of superior labrum anterior-to-posterior lesions. J Bone Joint Surg Am. 2005;87(4):824-831.
21. Myers JB, Laudner KG, Pasquale MR, Bradley JP, Lephart SM. Glenohumeral range of motion deficits and posterior shoulder tightness in throwers with pathologic internal impingement. Am J Sports Med. 2006;34(3):385-391.
22. Ticker JB, Beim GM, Warner JJ. Recognition and treatment of refractory posterior capsular contracture of the shoulder. Arthroscopy. 2000;16(1):27-34.
23. Burkhart SS, Morgan CD, Kibler WB. The disabled throwing shoulder: spectrum of pathology part III: the SICK scapula, scapular dyskinesis, the kinetic chain, and rehabilitation. Arthroscopy. 2003;19(6):641-661.
24. Kibler WB, McMullen J. Scapular dyskinesis and its relation to shoulder pain. J Am Acad Orthop Surg. 2003;11(2):142-151.
25. Kibler WB. The relationship of glenohumeral internal rotation deficit to shoulder and elbow injuries in tennis players: a prospective evaluation of posterior capsular stretching. Presented at: American Shoulder and Elbow Surgeons 15th Annual Closed Meeting; November 6, 1998; New York, NY.
26. Lintner D, Mayol M, Uzodinma O, Jones R, Labossiere D. Glenohumeral internal rotation deficits in professional pitchers enrolled in an internal rotation stretching program. Am J Sports Med. 2007;35(4):617-621.
27. McClure P, Balaicuis J, Heiland D, Broersma ME, Thorndike CK, Wood A. A randomized controlled comparison of stretching procedures for posterior shoulder tightness. J Orthop Sports Phys Ther. 2007;37(3):108-114.
28. Verna C. Shoulder flexibility to reduce impingement. Presented at: 3rd Annual Professional Baseball Athletic Trainer Society Meeting; March 1991; Mesa, AZ.
29. Bach HG, Goldberg BA. Posterior capsular contracture of the shoulder. J Am Acad Orthop Surg. 2006;14(5):265-277.
30. Yoneda M, Nakagawa S, Mizuno N, et al. Arthroscopic capsular release for painful throwing shoulder with posterior capsular tightness. Arthroscopy. 2006;22(7):801e1-801e5.
31. Kocher MS, Horan MP, Briggs KK, Richardson TR, O’Holleran J, Hawkins RJ. Reliability, validity, and responsiveness of the American Shoulder and Elbow Surgeons subjective shoulder scale in patients with shoulder instability, rotator cuff disease, and glenohumeral arthritis. J Bone Joint Surg Am. 2005;87(9):2006-2011.
32. Johansen RL, Callis M, Potts J, Shall LM. A modified internal rotation stretching technique for overhand and throwing athletes. J Orthop Sports Phys Ther. 1995;21(4):216-219.
33. Harryman DT 2nd, Sidles JA, Clark JM, McQuade KJ, Gibb TD, Matsen FA 3rd. Translation of the humeral head on the glenoid with passive glenohumeral motion. J Bone Joint Surg Am. 1990;72(9):1334-1343.
34. Tyler TF, Nicholas SJ, Roy T, Gleim GW. Quantification of posterior capsule tightness and motion loss in patients with shoulder impingement. Am J Sports Med. 2000;28(5):668-673.
35. McCarty LP, Buss DD, Giveans MR. Correlation between throwing arm strength deficit and glenohumeral internal rotation deficit in professional baseball pitchers, and differences between Latino and non-Latino pitchers. Presented at: American Academy of Orthopaedic Surgeons Annual Meeting; February 2012; San Francisco, CA.
36. Edwards TB, Bostick RD, Greene CC, Baratta RV, Drez D. Interobserver and intraobserver reliability of the measurement of shoulder internal rotation by vertebral level. J Shoulder Elbow Surg. 2002;11(1):40-42.
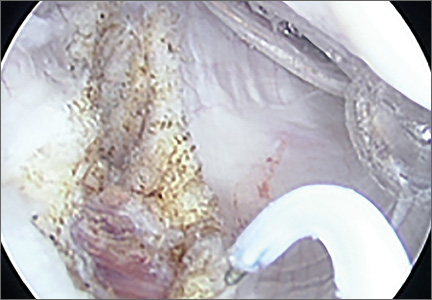
Paging Dr. Google
The 8-year-old child presented to the emergency department with bilateral ankle pain that had progressively worsened over the past 24 hours. This morning he would not walk. He also had a rash on his legs. The astute ED doctor recognized the diagnosis as Henoch-Schönlein purpura (HSP) and arranged admission to the ward. Things were flowing smoothly that day, and the child was soon on the ward and being examined by me and the resident team during morning rounds. In that 45-minute gap, the father had been on his smartphone. At that point he knew more about HSP than my senior resident. Truth be told, I was glad I had treated two cases in the previous 3 months (after going more than 2 years without any cases) so I didn’t feel foolish myself.
Technology is making progressively larger amounts of medical information available to the lay public. That information is being organized in ways that can actually impart knowledge. The Wikipedia entry on HSP has far more information, and has it arranged in a much more useful fashion, than my textbook on pediatrics. Making that comparison was the first time in 5 years that the textbook has even been taken off the shelf. If you have Googled tonsillitis, sprained ankle, or measles in the past 2 months, instead of just a list of websites, you also would have seen half the page filled with images and vetted information about those illnesses. There are apps that help you create a differential diagnosis and even estimate the probabilities of each one.

The victory of Watson, IBM's supercomputer, on Jeopardy showed how information can be organized and retrieved by a computer. It is a good facsimile for knowledge. But what about the wisdom of clinical judgment? Can a computer replace that? Keith Rabois, a member of the PayPal mafia, recently predicted that it will.
Further progress toward replacing doctors has come through changes in legislation to permit all lab tests to be offered directly to consumers. Arizona’s governor signed a law in April 2015 that will change that policy for his state. This isn’t major news, because already more than half the states allow this direct to consumer approach. But what was special about this particular signing ceremony was the involvement of billionaire Elizabeth Holmes, CEO of Theranos, a start-up company prepared to provide the lab testing service.
If done without a doctor’s order, which documents medical necessity, under current practice rules an insurance company won’t pay for these direct to consumer tests. The consumer must pay out of pocket. Of course, those rules may change. If patients want a throat swab to test for strep, maybe it is cheaper to have them go directly to the neighborhood lab than to see a doctor, especially if, when the test is positive, they then expect to phone their doctor for free and get a prescription.
Most medical tests have significant false-positive and false-negative results. Simple rapid strep throat tests and rapid influenza nasal swabs have a sensitivity of only 90%-95%. Many doctors, even those who use the results on a daily basis, cannot convert that information into a positive and negative predictive value. So if a company offers the test directly to the consumer, and reports it out with a “Just the facts, Ma’am” positive or negative result, is the consumer responsible for any misinterpretation, or has the laboratory company deceptively marketed a defective, imperfect product?
The bigger financial impact will be all the follow-up labs and imaging tests generated by the initial false-positive screening labs. Insurance probably will pay for those. Using a similar business model, a few hospitals nationwide now offer free (or close to it) low-dose chest CT scans to smokers and ex-smokers. This is done as a loss leader that generates profits for the hospital from all the follow-up tests, imaging, and biopsies. Compare this model with the old-time practice in which pediatricians in the 1950s to 1980s (and in many places, against guidelines, in the 1990s) had parents bring in a sample of the child’s urine for each well-child visit. That practice was abandoned on cost-benefit-harm arguments because of all the unnecessary subsequent testing, especially kidney ultrasounds, generated by the false positives. Now parents will be able to order the test themselves.
I’m skeptical about how soon a computer will completely replace a physician. Peter Thiel said, “We were promised flying cars and instead what we got was 140 characters.” But Google has finally created the self-driving car. And Elizabeth Holmes has averaged making more money in a week than I will in a career. So who are you going to believe?
Dr. Powell is a pediatric hospitalist and clinical ethics consultant living in St. Louis. E-mail him at [email protected].
The 8-year-old child presented to the emergency department with bilateral ankle pain that had progressively worsened over the past 24 hours. This morning he would not walk. He also had a rash on his legs. The astute ED doctor recognized the diagnosis as Henoch-Schönlein purpura (HSP) and arranged admission to the ward. Things were flowing smoothly that day, and the child was soon on the ward and being examined by me and the resident team during morning rounds. In that 45-minute gap, the father had been on his smartphone. At that point he knew more about HSP than my senior resident. Truth be told, I was glad I had treated two cases in the previous 3 months (after going more than 2 years without any cases) so I didn’t feel foolish myself.
Technology is making progressively larger amounts of medical information available to the lay public. That information is being organized in ways that can actually impart knowledge. The Wikipedia entry on HSP has far more information, and has it arranged in a much more useful fashion, than my textbook on pediatrics. Making that comparison was the first time in 5 years that the textbook has even been taken off the shelf. If you have Googled tonsillitis, sprained ankle, or measles in the past 2 months, instead of just a list of websites, you also would have seen half the page filled with images and vetted information about those illnesses. There are apps that help you create a differential diagnosis and even estimate the probabilities of each one.
The victory of Watson, IBM's supercomputer, on Jeopardy showed how information can be organized and retrieved by a computer. It is a good facsimile for knowledge. But what about the wisdom of clinical judgment? Can a computer replace that? Keith Rabois, a member of the PayPal mafia, recently predicted that it will.
Further progress toward replacing doctors has come through changes in legislation to permit all lab tests to be offered directly to consumers. Arizona’s governor signed a law in April 2015 that will change that policy for his state. This isn’t major news, because already more than half the states allow this direct to consumer approach. But what was special about this particular signing ceremony was the involvement of billionaire Elizabeth Holmes, CEO of Theranos, a start-up company prepared to provide the lab testing service.
If done without a doctor’s order, which documents medical necessity, under current practice rules an insurance company won’t pay for these direct to consumer tests. The consumer must pay out of pocket. Of course, those rules may change. If patients want a throat swab to test for strep, maybe it is cheaper to have them go directly to the neighborhood lab than to see a doctor, especially if, when the test is positive, they then expect to phone their doctor for free and get a prescription.
Most medical tests have significant false-positive and false-negative results. Simple rapid strep throat tests and rapid influenza nasal swabs have a sensitivity of only 90%-95%. Many doctors, even those who use the results on a daily basis, cannot convert that information into a positive and negative predictive value. So if a company offers the test directly to the consumer, and reports it out with a “Just the facts, Ma’am” positive or negative result, is the consumer responsible for any misinterpretation, or has the laboratory company deceptively marketed a defective, imperfect product?
The bigger financial impact will be all the follow-up labs and imaging tests generated by the initial false-positive screening labs. Insurance probably will pay for those. Using a similar business model, a few hospitals nationwide now offer free (or close to it) low-dose chest CT scans to smokers and ex-smokers. This is done as a loss leader that generates profits for the hospital from all the follow-up tests, imaging, and biopsies. Compare this model with the old-time practice in which pediatricians in the 1950s to 1980s (and in many places, against guidelines, in the 1990s) had parents bring in a sample of the child’s urine for each well-child visit. That practice was abandoned on cost-benefit-harm arguments because of all the unnecessary subsequent testing, especially kidney ultrasounds, generated by the false positives. Now parents will be able to order the test themselves.
I’m skeptical about how soon a computer will completely replace a physician. Peter Thiel said, “We were promised flying cars and instead what we got was 140 characters.” But Google has finally created the self-driving car. And Elizabeth Holmes has averaged making more money in a week than I will in a career. So who are you going to believe?
Dr. Powell is a pediatric hospitalist and clinical ethics consultant living in St. Louis. E-mail him at [email protected].
Long-Term Outcomes of Allograft Reconstruction of the Anterior Cruciate Ligament
Injuries of the anterior cruciate ligament (ACL) are common. Good to excellent long-term results are generally expected in more than 90% of ACL reconstructions.1,2 Although our knowledge of the biomechanics, kinematics, and long-term outcomes of ACL reconstruction is extensive, the ideal graft choice for ACL reconstruction is still up for debate.
Historically, both quadruple-stranded hamstring tendon and bone–patellar tendon–bone (BPTB) autografts have been the most popular graft options for operative reconstruction of the ACL.3 Recently, allograft tissues have become increasingly popular as a graft source. Proponents of allograft ACL reconstruction have cited several advantages over autograft reconstruction, including decreased donor-site morbidity, shorter operative times, and quicker postoperative recovery.4-7 Nevertheless, some authors have recently reported higher rates of both reoperation and graft failure after allograft ACL reconstruction.4,8-11 The 2 senior surgeons in the Sports Medicine Section of the Department of Orthopedic Surgery at the University of Arizona College of Medicine had not recognized such high failure and revision rates in their own clinical practices.
To evaluate the long-term outcomes of allograft ACL reconstruction, we retrospectively reviewed the cases of all patients who underwent allograft or autograft ACL reconstruction by 2 senior surgeons at a single institution over an 8-year period. We hypothesized that the reoperation and revision surgery rates for allograft ACL reconstruction would not be higher than those reported for autograft reconstruction. We also hypothesized that allograft ACL reconstruction failure rates would not be higher for patients younger than 25 years than for patients who are older and less active.
Materials and Methods
This study was approved by the Institutional Review Board at the University of Arizona College of Medicine. We retrospectively reviewed the cases of all patients who underwent primary endoscopic ACL reconstruction at the University of Arizona College of Medicine over an 8-year period (2000–2008). All ACL reconstructions were performed by 2 senior, fellowship-trained sports medicine specialists, including Dr. William A. Grana. Patients were identified from the Current Procedural Terminology (CPT) code for ACL reconstruction. Both autograft and allograft reconstructions were included in the study. Patients undergoing revision ACL reconstruction and patients with multi-ligamentous knee injuries were excluded. All available medical records were reviewed for patient demographics and any concomitant knee pathology. We included patients of all activity levels, patients with acute ACL tears, and patients with chronically ACL-deficient knees. We identified a separate cohort of Division I varsity athletes from the University of Arizona for evaluation. These patients were identified from the injury surveillance system in the athletic training facility of the University of Arizona.
ACL reconstructions at our institution during this 8-year period were performed with both allograft and autograft soft tissue. Allograft tendons were most commonly used. Tibialis anterior allograft was used in the majority of those knees. Tibialis posterior and semitendinosus allografts were used in a small subset of patients. Autograft reconstruction was performed with quadruple-stranded semitendinosus and gracilis tendons. We reviewed operative reports to determine type of graft used for reconstruction.
Patients were assessed clinically by telephone interview and/or mailed survey. They were specifically asked whether there had been any postoperative complications. We reviewed all operative and postoperative follow-up notes for postoperative complications. Objective clinical assessment involved use of the International Knee Documentation Committee (IKDC) Subjective Knee Evaluation Form, the Tegner-Lysholm Knee Scoring Scale, and the Tegner Activity Scale.
Operative Technique
A standard, transtibial arthroscopically assisted ACL reconstruction was performed in all patients. For autograft reconstruction patients, both the semitendinosus and gracilis tendons were harvested through a small anteromedial incision and prepared to form a quadruple-stranded graft. All allograft tendons were obtained from the Musculoskeletal Transplant Foundation (MTF). Tibialis anterior and tibialis posterior allografts were folded in half to form a double-stranded graft. Alternatively, 2 semitendinosus allografts were prepared in the same fashion as that described for autograft hamstring tendons. The tibial tunnel was placed into the center of the ACL tibial footprint. With use of a transtibial approach, an endoscopic offset guide was used to place the femoral tunnel at the 10- and 2-o’clock positions in the right and left knees, respectively. In almost all cases, the graft was secured on the femoral side with a cortical fixation button. Tibial fixation was obtained with a bioabsorbable interference screw.
After ACL reconstruction, each patient participated in the standard accelerated rehabilitation outlined by Shelbourne and Gray.12 Guided rehabilitation was instituted within 1 week after surgery under the guidance of a physical therapist. Range-of-motion exercises and closed-chain strengthening exercises were begun at this time. The protocol emphasized early return of full terminal extension and normalization of gait patterns. Patients were allowed to return to play only after meeting specific criteria, about 6 months after surgery. Many athletes in our Division I university population are allowed to return to play 5 to 6 months after surgery, after meeting return-to-play criteria.
Statistical Analysis
We used Minitab 14 (Minitab, State College, Pennsylvania) to perform all statistical analyses, unpaired Student t tests to compare IKDC and Tegner-Lysholm results between allograft and autograft groups, and χ2 tests to compare revision and reoperation rates between groups. Significance was set at P = .05.
Results
We identified 362 patients who underwent ACL reconstructions at our institution between 2000 and 2008. Of these patients, 302 met the study inclusion criteria. One-hundred twenty-three (40.7%) of the 302 were available for follow-up by telephone interview and/or mailed questionnaire. This follow-up group consisted of 67 males and 56 females. Mean age at surgery was 29 years (range, 17-53 years). Mean follow-up was 50.3 months (range, 11-111 months). Of the 123 patients, 99 underwent allograft ACL reconstruction, and 24 underwent autograft ACL reconstruction. Seventeen (17%) of the 99 allograft cases required additional surgery (Table 1). The reoperation rate for patients under age 25 years (30.8%) was higher than the rate for patients older than 25 years (Table 2). Regarding patients who underwent additional surgeries, mean scores were lower with allograft (Tegner-Lysholm, 59; IKDC, 54) than with autograft (Tegner-Lysholm, 83; IKDC, 79) (Ps = .0025 and .006, respectively).
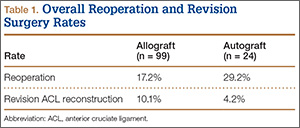
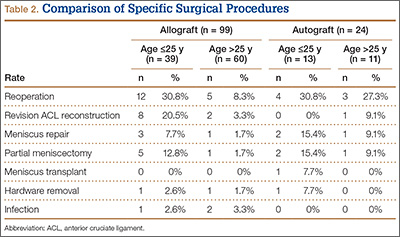
Revision rates were 10.1% (allograft group) and 4.2% (autograft group) (Table 1). This difference was not statistically significant (P = .18). In the allograft group, the revision rate was higher for patients younger than 25 years (20.5%) than for patients older than 25 years (3.3%) (Table 2). In comparison, in the autograft group, the revision rate was only 4% for patients younger than 25 years. For younger patients, the higher rate of revision with allograft (vs autograft) was statistically significant (P = .038). For older patients, allograft and autograft revision rates did not differ significantly (P = .19). No patient younger than 25 years required revision reconstruction after autograft ACL reconstruction.
IKDC and Tegner-Lysholm outcome scores for allograft and autograft groups are shown in Table 3. In patients 25 years or younger, IKDC scores were 75.18 after allograft reconstruction and 85.34 after autograft reconstruction—a significant difference (P = .045). In addition, Tegner-Lysholm scores were significantly higher after autograft reconstruction (91.58) than allograft reconstruction (78.19) in these younger patients (P = .003) (Table 3). IKDC and Tegner-Lysholm scores were not significantly different for older patients (Ps = .241 and .211, respectively).
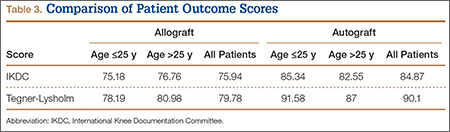
The study also included a subset of 19 primary ACL reconstructions (13 allograft, 6 autograft) performed on Division I athletes from the University of Arizona. (Nineteen [91%] of the 21 athletes in our Division I cohort were available for follow-up.) All these patients were younger than 25 years. All autograft reconstructions were performed with quadruple-stranded gracilis and semitendinosus tendons. ACL graft failure occurred in 8 (62%) of the 13 allograft cases; there were no failures in the autograft group (Table 4). One of the 5 allograft cases that did not fail required multiple surgical débridement procedures for infection, but the graft was ultimately retained. There were no infections among the 6 autograft cases.
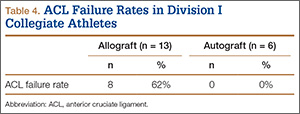
Discussion
The ideal graft for ACL reconstruction is still a matter of intense debate. There are many graft options for ACL reconstruction. Both BPTB and hamstring autografts are associated with various graft-specific comorbidities. Anterior knee pain, knee extensor weakness, extension loss, patella fracture, patellofemoral crepitance, and infrapatellar nerve injury have been described with BPTB autografts.13-17 In a meta-analysis of 11 studies comparing BPTB autografts with hamstring autograft, Goldblatt and colleagues17 found more extension loss, kneeling pain, and patellofemoral crepitance in the BPTP group.
Knee flexion weakness, knee flexion loss, increased knee laxity, and saphenous nerve injury have all been described with use of hamstring autografts.16-19 Goldblatt and colleagues17 demonstrated a significant flexion loss in the hamstring group in their meta-analysis as well as increased laxity with both the Lachman test and the pivot shift test. They also found that the hamstring autograft group exhibited side-to-side differences of more than 3 mm on KT-1000 testing when compared with the BPTB autograft group.
Proposed advantages of allograft reconstruction include elimination of donor-site morbidity and/or pain from a less invasive procedure, faster initial recovery, more sizing options, and shorter operative times.4-7 In a 5-year follow-up of patients who had ACL reconstruction with either Achilles allograft or BPTB autograft, Poehling and colleagues7 demonstrated overall similar long-term outcomes between the groups. However, the allograft patients reported less pain 1 and 6 weeks after surgery; better function 1 week, 3 months, and 1 year after surgery; and fewer activity limitations throughout the follow-up period. Lamblin and colleagues20 also found no difference between nonirradiated allograft and autograft tissue in ACL reconstruction in a 2013 meta-analysis of ACL studies published over a 32-year period.
Despite the proposed advantages of allograft ACL reconstruction, several recent studies have demonstrated poorer outcomes in both younger patients and more active patients after allograft reconstruction.8-11,21 In a 2007 meta-analysis, Prodromos and colleagues11 compared a series of allograft reconstructions with previously published data sets of both BPTB and hamstring autografts. They found that allograft reconstructions had significantly lower stability rates than autograft reconstructions. In a case–control study by Borchers and colleagues,10 21 patients with ACL graft failure were identified over a 2-year period, and surgical outcomes were compared with those of 42 age- and sex-matched controls. The authors found higher activity level and allograft use to be risk factors for subsequent graft failure after ACL reconstruction. More important, they showed a multiplicative interaction between higher activity level after ACL reconstruction and allograft use—an interaction that greatly increased the odds for ACL graft failure. Last, in a retrospective review, Singhal and colleagues8 evaluated the outcomes of ACL reconstruction using tibialis anterior tendon allograft and reported a 23.1% revision rate. In addition, 37.7% of patients required repeat surgery. The failure/reoperation rate was 55% for patients 25 years or younger and 24% for patients older than 25 years. The authors recommended not using tibialis anterior allografts in patients 25 years or younger and in patients who frequently engage in level I ACL-dependent sports.
The poor outcomes reported by Singhal and colleagues8 may be related to use of irradiated soft-tissue allografts. In a comparison of nonirradiated BPTB allograft and BPTB autograft in patients 25 years or younger, Barber and colleagues22 found equivalent outcomes at 2-year follow-up. They actually found a higher rate of failure for autograft reconstruction (9.4%) than allograft reconstruction (7.1%). A potential critique of their study is the significant difference between the patient groups’ mean ages: 18.6 years (autograft) versus 20.1 years (allograft). Despite this selection bias, Barber and colleagues22 argued that nonirradiated BPTB allograft is equivalent to BPTB autograft for ACL reconstruction.
Our study is one of the largest allograft studies with a comparison group. The principal findings of this study demonstrate that overall reoperation and revision rates after irradiated soft-tissue allograft ACL reconstruction are higher than those historically quoted for autograft ACL reconstruction. Specifically, allograft patients younger than 25 years had a reoperation rate of 30.8% and a revision rate of 20.5%. (Allograft patients older than 25 years had lower rates of reoperation, 8.3%, and revision, 3.3%.) After revision surgery, autograft patients’ subjective outcomes (IKDC and Tegner-Lysholm scores) were significantly improved compared with those of allograft patients (Ps = .0017 and .0031, respectively). Most compelling, however, is the unexpected and quite concerning 62% failure rate in our high-level Division I intercollegiate athletes.
There are multiple hypotheses regarding the higher failure rates of allograft tissues versus autograft tissues in ACL reconstruction. Processing methods, exposure to ionizing radiation, and the incorporation/ligamentization process have all been cited as possible reasons for allograft failure. All the allograft tendons used in the present study were obtained from MTF, which uses a proprietary “aseptic” processing system that includes washing in buffered saline impregnated with antibiotics (imipenem/cilastatin, amphotericin B, gentamicin) followed by final rinsing in phosphate-buffered saline. The majority of grafts are subjected to low-level irradiation (<2 Mrad/20 kGy) based on the outcomes of MTF’s stringent donor-selection process. Although the washing process has not been shown to alter the structural integrity of donor grafts, multiple studies have outlined the detrimental effects of higher levels of gamma radiation on allograft tissues. Although lower levels are effective against potential bacterial contaminants, a radiation level of 4 Mrad is necessary to kill the human immunodeficiency virus (HIV). Thus, a dose of 4 Mrad or higher is needed to truly “sterilize” a graft. This higher dose is an issue, as it has been known for some time that higher levels of ionizing radiation can have adverse effects on the biomechanical strength of soft-tissue allografts. In fact, ionizing radiation has dose-dependent effects.23-26 Schwartz and colleagues27 showed in a caprine model that radiation exposure at 4 Mrad significantly decreased the biomechanical strength of ACL allografts at 6 months. Balsly and colleagues28 found in a biomechanical study that radiation doses of 18 to 22 Mrad did not significantly affect the mechanical integrity of soft-tissue allografts. Conversely, in an in vivo study, Rappe and colleagues29 showed that Achilles allografts irradiated at a dose of 2.0 to 2.5 Mrad had a failure rate (33%) much higher than that of nonirradiated allografts (2.4%). The radiation dose used by MTF is less than 2 Mrad. Although more than needed to kill bacterial contaminants, this dose is considered by MTF to be below the threshold for biomechanical alterations. Only a minority of grafts is treated without irradiation.
It is possible that any level of radiation affects ligamentization of allograft tissues. Multiple studies have outlined the ligamentization process of autograft tendons in vivo. Patellar tendon autografts undergo central degeneration 2 to 6 weeks after reconstruction, but, by 6 to 12 months, these tendons have structural properties similar to those of the native ACL.30-34 Findings are similar for hamstring autografts.35,36 Goradia and colleagues36 found that, by 52 weeks, semitendinosus autografts transform into a histologic structure similar to that of the normal ACL. Remodeling of allograft tendons has been described as occurring at a much slower rate.27,37-40 Bhatia and colleagues37 demonstrated faster remodeling in autograft tissues versus allograft tissues at early time points in an in vivo rabbit model. Ultimately, differences in graft incorporation and ligamentization may be a primary factor in the higher failure rates of allograft ACL reconstruction. Current rehabilitation protocols may not take into account the longer ligamentization process for allograft tissues. These protocols are largely based on our current understanding of the ligamentization process after autograft reconstruction. It is possible that the rehabilitation program and return-to-play schedule for allograft reconstruction need to be altered to help avoid higher failure rates. The return-to-play protocol at the authors’ institution scheduled most varsity athletes to return to play 6 months after surgery. In some cases, the timetable was shortened, and some athletes were returned to play 5 months after surgery, after meeting all return-to-play criteria. Based on the findings of the present study, this return-to-play schedule may be much too aggressive for high-level athletes after allograft reconstruction. It is possible these allografts have not reached “maturity,” as their autograft counterparts have, and thus are not ready for unrestricted return to play.
Our study had multiple strengths. All reconstructions were performed by 2 senior surgeons with extensive clinical experience. The autograft and allograft reconstructions used the same techniques and rehabilitation protocols. This is one of the largest studies of outcomes of allograft ACL reconstruction and one of the largest studies that used a comparison group of autograft reconstructions. Having a comparison group effectively allowed us to contrast the differences between allograft and autograft tissues. Last, this study evaluated a subgroup of high-level NCAA Division I athletes. Follow-up in the overall study was 40.7%, but follow-up in this subgroup was 91%. The very high follow-up rate in the university population helped us validate the overall results of the study. Study results reinforced the fact that irradiated soft-tissue allograft may not be indicated for ACL reconstruction in a younger, more active patient population and led to a change in approach to ACL reconstruction for Division I intercollegiate athletes at the University of Arizona. Allograft ACL reconstruction is no longer recommended for the intercollegiate athletes at the University of Arizona.
Our study had its limitations. First, it had the inherent biases of a retrospective study. Second, many patients were lost to follow-up. We contacted and surveyed 40.7% of the patients who met the inclusion criteria. We tried reaching them in multiple ways—through US mail, all listed phone numbers, family members, and so forth. Tucson, Arizona is a college town and has a larger transient population, which may have added to the difficulty in contacting patients.
Conclusion
Given the high rates of reoperation and revision surgery with allograft reconstruction in younger patients in this study, we recommend against routine use of irradiated soft-tissue allograft tissue for ACL reconstruction in patients 25 years or younger. In our clinical practices, we prefer using autograft tissue for ACL reconstruction in younger, more active individuals. Irradiated soft-tissue allograft ACL reconstruction is a viable option in the older, less active patient population. Although the overall reoperation rate in this cohort study is acceptable, the revision rate for patients younger than 25 years is concerning and should be taken into account when considering use of irradiated soft-tissue allograft for ACL reconstruction in these younger patients.
1. Schepsis AA, Busconi BD. Sports Medicine. Philadelphia, PA: Lippincott Williams & Wilkins; 2006.
2. Campbell WC, Canale ST, Beaty JH. Campbell’s Operative Orthopaedics. 11th ed. Philadelphia, PA: Mosby/Elsevier; 2008.
3. Sherman OH, Banffy MB. Anterior cruciate ligament reconstruction: which graft is best? Arthroscopy. 2004;20(9):974-980.
4. Lee JH, Bae DK, Song SJ, Cho SM, Yoon KH. Comparison of clinical results and second-look arthroscopy findings after arthroscopic anterior cruciate ligament reconstruction using 3 different types of grafts. Arthroscopy. 2010;26(1):41-49.
5. Sun K, Tian SQ, Zhang JH, Xia CS, Zhang CL, Yu TB. Anterior cruciate ligament reconstruction with bone-patellar tendon-bone autograft versus allograft. Arthroscopy. 2009;25(7):750-759.
6. Kuhn MA, Ross G. Allografts in the treatment of anterior cruciate ligament injuries. Sports Med Arthrosc Rev. 2007;15(3):133-138.
7. Poehling GG, Curl WW, Lee CA, et al. Analysis of outcomes of anterior cruciate ligament repair with 5-year follow-up: allograft versus autograft. Arthroscopy. 2005;21(7):774-785.
8. Singhal MC, Gardiner JR, Johnson DL. Failure of primary anterior cruciate ligament surgery using anterior tibialis allograft. Arthroscopy. 2007;23(5):469-475.
9. Barrett GR, Luber K, Replogle WH, Manley JL. Allograft anterior cruciate ligament reconstruction in the young, active patient: Tegner activity level and failure rate. Arthroscopy. 2010;26(12):1593-1601.
10. Borchers JR, Pedroza A, Kaeding C. Activity level and graft type as risk factors for anterior cruciate ligament graft failure: a case–control study. Am J Sports Med. 2009;37(12):2362-2367.
11. Prodromos C, Joyce B, Shi K. A meta-analysis of stability of autografts compared to allografts after anterior cruciate ligament reconstruction. Knee Surg Sports Traumatol Arthrosc. 2007;15(7):851-856.
12. Shelbourne KD, Gray T. Anterior cruciate ligament reconstruction with autogenous patellar tendon graft followed by accelerated rehabilitation. A two- to nine-year followup. Am J Sports Med. 1997;25(6):786-795.
13. Rosenberg TD, Franklin JL, Baldwin GN, Nelson KA. Extensor mechanism function after patellar tendon graft harvest for anterior cruciate ligament reconstruction. Am J Sports Med. 1992;20(5):519-525.
14. Piva SR, Childs JD, Klucinec BM, Irrgang JJ, Almeida GJ, Fitzgerald GK. Patella fracture during rehabilitation after bone–patellar tendon–bone anterior cruciate ligament reconstruction: 2 case reports. J Orthop Sports Phys Ther. 2009;39(4):278-286.
15. Lee GH, McCulloch P, Cole BJ, Bush-Joseph CA, Bach BR Jr. The incidence of acute patellar tendon harvest complications for anterior cruciate ligament reconstruction. Arthroscopy. 2008;24(2):162-166.
16. Kartus J, Movin T, Karlsson J. Donor-site morbidity and anterior knee problems after anterior cruciate ligament reconstruction using autografts. Arthroscopy. 2001;17(9):971-980.
17. Goldblatt JP, Fitzsimmons SE, Balk E, Richmond JC. Reconstruction of the anterior cruciate ligament: meta-analysis of patellar tendon versus hamstring tendon autograft. Arthroscopy. 2005;21(7):791-803.
18. Freedman KB, D’Amato MJ, Nedeff DD, Kaz A, Bach BR Jr. Arthroscopic anterior cruciate ligament reconstruction: a metaanalysis comparing patellar tendon and hamstring tendon autografts. Am J Sports Med. 2003;31(1):2-11.
19. Yunes M, Richmond JC, Engels EA, Pinczewski LA. Patellar versus hamstring tendons in anterior cruciate ligament reconstruction: a meta-analysis. Arthroscopy. 2001;17(3):248-257.
20. Lamblin CJ, Waterman BR, Lubowitz JH. Anterior cruciate ligament reconstruction with autografts compared with non-irradiated, non-chemically treated allografts. Arthroscopy. 2013;29(6):1113-1122.
21. Pallis M, Svoboda SJ, Cameron KL, Owens BD. Survival comparison of allograft and autograft anterior cruciate ligament reconstruction at the United States Military Academy. Am J Sports Med. 2012;40(6):1242-1246.
22. Barber FA, Cowden CH 3rd, Sanders EJ. Revision rates after anterior cruciate ligament reconstruction using bone–patellar tendon–bone allograft or autograft in a population 25 years old and younger. Arthroscopy. 2014;30(4):483-491.
23. Salehpour A, Butler DL, Proch FS, et al. Dose-dependent response of gamma irradiation on mechanical properties and related biochemical composition of goat bone–patellar tendon–bone allografts. J Orthop Res. 1995;13(6):898-906.
24. Gibbons MJ, Butler DL, Grood ES, Bylski-Austrow DI, Levy MS, Noyes FR. Effects of gamma irradiation on the initial mechanical and material properties of goat bone–patellar tendon–bone allografts. J Orthop Res. 1991;9(2):209-218.
25. Fideler BM, Vangsness CT Jr, Lu B, Orlando C, Moore T. Gamma irradiation: effects on biomechanical properties of human bone–patellar tendon–bone allografts. Am J Sports Med. 1995;23(5):643-646.
26. De Deyne P, Haut RC. Some effects of gamma irradiation on patellar tendon allografts. Connect Tissue Res. 1991;27(1):51-62.
27. Schwartz HE, Matava MJ, Proch FS, et al. The effect of gamma irradiation on anterior cruciate ligament allograft biomechanical and biochemical properties in the caprine model at time zero and at 6 months after surgery. Am J Sports Med. 2006;34(11):1747-1755.
28. Balsly CR, Cotter AT, Williams LA, Gaskins BD, Moore MA, Wolfinbarger L Jr. Effect of low dose and moderate dose gamma irradiation on the mechanical properties of bone and soft tissue allografts. Cell Tissue Bank. 2008;9(4):289-298.
29. Rappe M, Horodyski M, Meister K, Indelicato PA. Nonirradiated versus irradiated Achilles allograft: in vivo failure comparison. Am J Sports Med. 2007;35(10):1653-1658.
30. Amiel D, Kleiner JB, Akeson WH. The natural history of the anterior cruciate ligament autograft of patellar tendon origin. Am J Sports Med. 1986;14(6):449-462.
31. Amiel D, Kleiner JB, Roux RD, Harwood FL, Akeson WH. The phenomenon of “ligamentization”: anterior cruciate ligament reconstruction with autogenous patellar tendon. J Orthop Res. 1986;4(2):162-172.
32. Arnoczky SP, Tarvin GB, Marshall JL. Anterior cruciate ligament replacement using patellar tendon. An evaluation of graft revascularization in the dog. J Bone Joint Surg Am. 1982;64(2):217-224.
33. Ballock RT, Woo SL, Lyon RM, Hollis JM, Akeson WH. Use of patellar tendon autograft for anterior cruciate ligament reconstruction in the rabbit: a long-term histologic and biomechanical study. J Orthop Res. 1989;7(4):474-485.
34. Clancy WG Jr, Narechania RG, Rosenberg TD, Gmeiner JG, Wisnefske DD, Lange TA. Anterior and posterior cruciate ligament reconstruction in rhesus monkeys. J Bone Joint Surg Am. 1981;63(8):1270-1284.
35. Blickenstaff KR, Grana WA, Egle D. Analysis of a semitendinosus autograft in a rabbit model. Am J Sports Med. 1997;25(4):554-559.
36. Goradia VK, Rochat MC, Kida M, Grana WA. Natural history of a hamstring tendon autograft used for anterior cruciate ligament reconstruction in a sheep model. Am J Sports Med. 2000;28(1):40-46.
37. Bhatia S, Bell R, Frank RM, et al. Bony incorporation of soft tissue anterior cruciate ligament grafts in an animal model: autograft versus allograft with low-dose gamma irradiation. Am J Sports Med. 2012;40(8):1789-1798.
38. Jackson DW, Grood ES, Goldstein JD, et al. A comparison of patellar tendon autograft and allograft used for anterior cruciate ligament reconstruction in the goat model. Am J Sports Med. 1993;21(2):176-185.
39. Goertzen MJ, Clahsen H, Schulitz KP. Anterior cruciate ligament reconstruction using cryopreserved irradiated bone-ACL-bone-allograft transplants. Knee Surg Sports Traumatol Arthrosc. 1994;2(3):150-157.
40. Mae T, Shino K, Maeda A, Toritsuka Y, Horibe S, Ochi T. Effect of gamma irradiation on remodeling process of tendon allograft. Clin Orthop. 2003;(414):305-314.
Injuries of the anterior cruciate ligament (ACL) are common. Good to excellent long-term results are generally expected in more than 90% of ACL reconstructions.1,2 Although our knowledge of the biomechanics, kinematics, and long-term outcomes of ACL reconstruction is extensive, the ideal graft choice for ACL reconstruction is still up for debate.
Historically, both quadruple-stranded hamstring tendon and bone–patellar tendon–bone (BPTB) autografts have been the most popular graft options for operative reconstruction of the ACL.3 Recently, allograft tissues have become increasingly popular as a graft source. Proponents of allograft ACL reconstruction have cited several advantages over autograft reconstruction, including decreased donor-site morbidity, shorter operative times, and quicker postoperative recovery.4-7 Nevertheless, some authors have recently reported higher rates of both reoperation and graft failure after allograft ACL reconstruction.4,8-11 The 2 senior surgeons in the Sports Medicine Section of the Department of Orthopedic Surgery at the University of Arizona College of Medicine had not recognized such high failure and revision rates in their own clinical practices.
To evaluate the long-term outcomes of allograft ACL reconstruction, we retrospectively reviewed the cases of all patients who underwent allograft or autograft ACL reconstruction by 2 senior surgeons at a single institution over an 8-year period. We hypothesized that the reoperation and revision surgery rates for allograft ACL reconstruction would not be higher than those reported for autograft reconstruction. We also hypothesized that allograft ACL reconstruction failure rates would not be higher for patients younger than 25 years than for patients who are older and less active.
Materials and Methods
This study was approved by the Institutional Review Board at the University of Arizona College of Medicine. We retrospectively reviewed the cases of all patients who underwent primary endoscopic ACL reconstruction at the University of Arizona College of Medicine over an 8-year period (2000–2008). All ACL reconstructions were performed by 2 senior, fellowship-trained sports medicine specialists, including Dr. William A. Grana. Patients were identified from the Current Procedural Terminology (CPT) code for ACL reconstruction. Both autograft and allograft reconstructions were included in the study. Patients undergoing revision ACL reconstruction and patients with multi-ligamentous knee injuries were excluded. All available medical records were reviewed for patient demographics and any concomitant knee pathology. We included patients of all activity levels, patients with acute ACL tears, and patients with chronically ACL-deficient knees. We identified a separate cohort of Division I varsity athletes from the University of Arizona for evaluation. These patients were identified from the injury surveillance system in the athletic training facility of the University of Arizona.
ACL reconstructions at our institution during this 8-year period were performed with both allograft and autograft soft tissue. Allograft tendons were most commonly used. Tibialis anterior allograft was used in the majority of those knees. Tibialis posterior and semitendinosus allografts were used in a small subset of patients. Autograft reconstruction was performed with quadruple-stranded semitendinosus and gracilis tendons. We reviewed operative reports to determine type of graft used for reconstruction.
Patients were assessed clinically by telephone interview and/or mailed survey. They were specifically asked whether there had been any postoperative complications. We reviewed all operative and postoperative follow-up notes for postoperative complications. Objective clinical assessment involved use of the International Knee Documentation Committee (IKDC) Subjective Knee Evaluation Form, the Tegner-Lysholm Knee Scoring Scale, and the Tegner Activity Scale.
Operative Technique
A standard, transtibial arthroscopically assisted ACL reconstruction was performed in all patients. For autograft reconstruction patients, both the semitendinosus and gracilis tendons were harvested through a small anteromedial incision and prepared to form a quadruple-stranded graft. All allograft tendons were obtained from the Musculoskeletal Transplant Foundation (MTF). Tibialis anterior and tibialis posterior allografts were folded in half to form a double-stranded graft. Alternatively, 2 semitendinosus allografts were prepared in the same fashion as that described for autograft hamstring tendons. The tibial tunnel was placed into the center of the ACL tibial footprint. With use of a transtibial approach, an endoscopic offset guide was used to place the femoral tunnel at the 10- and 2-o’clock positions in the right and left knees, respectively. In almost all cases, the graft was secured on the femoral side with a cortical fixation button. Tibial fixation was obtained with a bioabsorbable interference screw.
After ACL reconstruction, each patient participated in the standard accelerated rehabilitation outlined by Shelbourne and Gray.12 Guided rehabilitation was instituted within 1 week after surgery under the guidance of a physical therapist. Range-of-motion exercises and closed-chain strengthening exercises were begun at this time. The protocol emphasized early return of full terminal extension and normalization of gait patterns. Patients were allowed to return to play only after meeting specific criteria, about 6 months after surgery. Many athletes in our Division I university population are allowed to return to play 5 to 6 months after surgery, after meeting return-to-play criteria.
Statistical Analysis
We used Minitab 14 (Minitab, State College, Pennsylvania) to perform all statistical analyses, unpaired Student t tests to compare IKDC and Tegner-Lysholm results between allograft and autograft groups, and χ2 tests to compare revision and reoperation rates between groups. Significance was set at P = .05.
Results
We identified 362 patients who underwent ACL reconstructions at our institution between 2000 and 2008. Of these patients, 302 met the study inclusion criteria. One-hundred twenty-three (40.7%) of the 302 were available for follow-up by telephone interview and/or mailed questionnaire. This follow-up group consisted of 67 males and 56 females. Mean age at surgery was 29 years (range, 17-53 years). Mean follow-up was 50.3 months (range, 11-111 months). Of the 123 patients, 99 underwent allograft ACL reconstruction, and 24 underwent autograft ACL reconstruction. Seventeen (17%) of the 99 allograft cases required additional surgery (Table 1). The reoperation rate for patients under age 25 years (30.8%) was higher than the rate for patients older than 25 years (Table 2). Regarding patients who underwent additional surgeries, mean scores were lower with allograft (Tegner-Lysholm, 59; IKDC, 54) than with autograft (Tegner-Lysholm, 83; IKDC, 79) (Ps = .0025 and .006, respectively).
Revision rates were 10.1% (allograft group) and 4.2% (autograft group) (Table 1). This difference was not statistically significant (P = .18). In the allograft group, the revision rate was higher for patients younger than 25 years (20.5%) than for patients older than 25 years (3.3%) (Table 2). In comparison, in the autograft group, the revision rate was only 4% for patients younger than 25 years. For younger patients, the higher rate of revision with allograft (vs autograft) was statistically significant (P = .038). For older patients, allograft and autograft revision rates did not differ significantly (P = .19). No patient younger than 25 years required revision reconstruction after autograft ACL reconstruction.
IKDC and Tegner-Lysholm outcome scores for allograft and autograft groups are shown in Table 3. In patients 25 years or younger, IKDC scores were 75.18 after allograft reconstruction and 85.34 after autograft reconstruction—a significant difference (P = .045). In addition, Tegner-Lysholm scores were significantly higher after autograft reconstruction (91.58) than allograft reconstruction (78.19) in these younger patients (P = .003) (Table 3). IKDC and Tegner-Lysholm scores were not significantly different for older patients (Ps = .241 and .211, respectively).
The study also included a subset of 19 primary ACL reconstructions (13 allograft, 6 autograft) performed on Division I athletes from the University of Arizona. (Nineteen [91%] of the 21 athletes in our Division I cohort were available for follow-up.) All these patients were younger than 25 years. All autograft reconstructions were performed with quadruple-stranded gracilis and semitendinosus tendons. ACL graft failure occurred in 8 (62%) of the 13 allograft cases; there were no failures in the autograft group (Table 4). One of the 5 allograft cases that did not fail required multiple surgical débridement procedures for infection, but the graft was ultimately retained. There were no infections among the 6 autograft cases.
Discussion
The ideal graft for ACL reconstruction is still a matter of intense debate. There are many graft options for ACL reconstruction. Both BPTB and hamstring autografts are associated with various graft-specific comorbidities. Anterior knee pain, knee extensor weakness, extension loss, patella fracture, patellofemoral crepitance, and infrapatellar nerve injury have been described with BPTB autografts.13-17 In a meta-analysis of 11 studies comparing BPTB autografts with hamstring autograft, Goldblatt and colleagues17 found more extension loss, kneeling pain, and patellofemoral crepitance in the BPTP group.
Knee flexion weakness, knee flexion loss, increased knee laxity, and saphenous nerve injury have all been described with use of hamstring autografts.16-19 Goldblatt and colleagues17 demonstrated a significant flexion loss in the hamstring group in their meta-analysis as well as increased laxity with both the Lachman test and the pivot shift test. They also found that the hamstring autograft group exhibited side-to-side differences of more than 3 mm on KT-1000 testing when compared with the BPTB autograft group.
Proposed advantages of allograft reconstruction include elimination of donor-site morbidity and/or pain from a less invasive procedure, faster initial recovery, more sizing options, and shorter operative times.4-7 In a 5-year follow-up of patients who had ACL reconstruction with either Achilles allograft or BPTB autograft, Poehling and colleagues7 demonstrated overall similar long-term outcomes between the groups. However, the allograft patients reported less pain 1 and 6 weeks after surgery; better function 1 week, 3 months, and 1 year after surgery; and fewer activity limitations throughout the follow-up period. Lamblin and colleagues20 also found no difference between nonirradiated allograft and autograft tissue in ACL reconstruction in a 2013 meta-analysis of ACL studies published over a 32-year period.
Despite the proposed advantages of allograft ACL reconstruction, several recent studies have demonstrated poorer outcomes in both younger patients and more active patients after allograft reconstruction.8-11,21 In a 2007 meta-analysis, Prodromos and colleagues11 compared a series of allograft reconstructions with previously published data sets of both BPTB and hamstring autografts. They found that allograft reconstructions had significantly lower stability rates than autograft reconstructions. In a case–control study by Borchers and colleagues,10 21 patients with ACL graft failure were identified over a 2-year period, and surgical outcomes were compared with those of 42 age- and sex-matched controls. The authors found higher activity level and allograft use to be risk factors for subsequent graft failure after ACL reconstruction. More important, they showed a multiplicative interaction between higher activity level after ACL reconstruction and allograft use—an interaction that greatly increased the odds for ACL graft failure. Last, in a retrospective review, Singhal and colleagues8 evaluated the outcomes of ACL reconstruction using tibialis anterior tendon allograft and reported a 23.1% revision rate. In addition, 37.7% of patients required repeat surgery. The failure/reoperation rate was 55% for patients 25 years or younger and 24% for patients older than 25 years. The authors recommended not using tibialis anterior allografts in patients 25 years or younger and in patients who frequently engage in level I ACL-dependent sports.
The poor outcomes reported by Singhal and colleagues8 may be related to use of irradiated soft-tissue allografts. In a comparison of nonirradiated BPTB allograft and BPTB autograft in patients 25 years or younger, Barber and colleagues22 found equivalent outcomes at 2-year follow-up. They actually found a higher rate of failure for autograft reconstruction (9.4%) than allograft reconstruction (7.1%). A potential critique of their study is the significant difference between the patient groups’ mean ages: 18.6 years (autograft) versus 20.1 years (allograft). Despite this selection bias, Barber and colleagues22 argued that nonirradiated BPTB allograft is equivalent to BPTB autograft for ACL reconstruction.
Our study is one of the largest allograft studies with a comparison group. The principal findings of this study demonstrate that overall reoperation and revision rates after irradiated soft-tissue allograft ACL reconstruction are higher than those historically quoted for autograft ACL reconstruction. Specifically, allograft patients younger than 25 years had a reoperation rate of 30.8% and a revision rate of 20.5%. (Allograft patients older than 25 years had lower rates of reoperation, 8.3%, and revision, 3.3%.) After revision surgery, autograft patients’ subjective outcomes (IKDC and Tegner-Lysholm scores) were significantly improved compared with those of allograft patients (Ps = .0017 and .0031, respectively). Most compelling, however, is the unexpected and quite concerning 62% failure rate in our high-level Division I intercollegiate athletes.
There are multiple hypotheses regarding the higher failure rates of allograft tissues versus autograft tissues in ACL reconstruction. Processing methods, exposure to ionizing radiation, and the incorporation/ligamentization process have all been cited as possible reasons for allograft failure. All the allograft tendons used in the present study were obtained from MTF, which uses a proprietary “aseptic” processing system that includes washing in buffered saline impregnated with antibiotics (imipenem/cilastatin, amphotericin B, gentamicin) followed by final rinsing in phosphate-buffered saline. The majority of grafts are subjected to low-level irradiation (<2 Mrad/20 kGy) based on the outcomes of MTF’s stringent donor-selection process. Although the washing process has not been shown to alter the structural integrity of donor grafts, multiple studies have outlined the detrimental effects of higher levels of gamma radiation on allograft tissues. Although lower levels are effective against potential bacterial contaminants, a radiation level of 4 Mrad is necessary to kill the human immunodeficiency virus (HIV). Thus, a dose of 4 Mrad or higher is needed to truly “sterilize” a graft. This higher dose is an issue, as it has been known for some time that higher levels of ionizing radiation can have adverse effects on the biomechanical strength of soft-tissue allografts. In fact, ionizing radiation has dose-dependent effects.23-26 Schwartz and colleagues27 showed in a caprine model that radiation exposure at 4 Mrad significantly decreased the biomechanical strength of ACL allografts at 6 months. Balsly and colleagues28 found in a biomechanical study that radiation doses of 18 to 22 Mrad did not significantly affect the mechanical integrity of soft-tissue allografts. Conversely, in an in vivo study, Rappe and colleagues29 showed that Achilles allografts irradiated at a dose of 2.0 to 2.5 Mrad had a failure rate (33%) much higher than that of nonirradiated allografts (2.4%). The radiation dose used by MTF is less than 2 Mrad. Although more than needed to kill bacterial contaminants, this dose is considered by MTF to be below the threshold for biomechanical alterations. Only a minority of grafts is treated without irradiation.
It is possible that any level of radiation affects ligamentization of allograft tissues. Multiple studies have outlined the ligamentization process of autograft tendons in vivo. Patellar tendon autografts undergo central degeneration 2 to 6 weeks after reconstruction, but, by 6 to 12 months, these tendons have structural properties similar to those of the native ACL.30-34 Findings are similar for hamstring autografts.35,36 Goradia and colleagues36 found that, by 52 weeks, semitendinosus autografts transform into a histologic structure similar to that of the normal ACL. Remodeling of allograft tendons has been described as occurring at a much slower rate.27,37-40 Bhatia and colleagues37 demonstrated faster remodeling in autograft tissues versus allograft tissues at early time points in an in vivo rabbit model. Ultimately, differences in graft incorporation and ligamentization may be a primary factor in the higher failure rates of allograft ACL reconstruction. Current rehabilitation protocols may not take into account the longer ligamentization process for allograft tissues. These protocols are largely based on our current understanding of the ligamentization process after autograft reconstruction. It is possible that the rehabilitation program and return-to-play schedule for allograft reconstruction need to be altered to help avoid higher failure rates. The return-to-play protocol at the authors’ institution scheduled most varsity athletes to return to play 6 months after surgery. In some cases, the timetable was shortened, and some athletes were returned to play 5 months after surgery, after meeting all return-to-play criteria. Based on the findings of the present study, this return-to-play schedule may be much too aggressive for high-level athletes after allograft reconstruction. It is possible these allografts have not reached “maturity,” as their autograft counterparts have, and thus are not ready for unrestricted return to play.
Our study had multiple strengths. All reconstructions were performed by 2 senior surgeons with extensive clinical experience. The autograft and allograft reconstructions used the same techniques and rehabilitation protocols. This is one of the largest studies of outcomes of allograft ACL reconstruction and one of the largest studies that used a comparison group of autograft reconstructions. Having a comparison group effectively allowed us to contrast the differences between allograft and autograft tissues. Last, this study evaluated a subgroup of high-level NCAA Division I athletes. Follow-up in the overall study was 40.7%, but follow-up in this subgroup was 91%. The very high follow-up rate in the university population helped us validate the overall results of the study. Study results reinforced the fact that irradiated soft-tissue allograft may not be indicated for ACL reconstruction in a younger, more active patient population and led to a change in approach to ACL reconstruction for Division I intercollegiate athletes at the University of Arizona. Allograft ACL reconstruction is no longer recommended for the intercollegiate athletes at the University of Arizona.
Our study had its limitations. First, it had the inherent biases of a retrospective study. Second, many patients were lost to follow-up. We contacted and surveyed 40.7% of the patients who met the inclusion criteria. We tried reaching them in multiple ways—through US mail, all listed phone numbers, family members, and so forth. Tucson, Arizona is a college town and has a larger transient population, which may have added to the difficulty in contacting patients.
Conclusion
Given the high rates of reoperation and revision surgery with allograft reconstruction in younger patients in this study, we recommend against routine use of irradiated soft-tissue allograft tissue for ACL reconstruction in patients 25 years or younger. In our clinical practices, we prefer using autograft tissue for ACL reconstruction in younger, more active individuals. Irradiated soft-tissue allograft ACL reconstruction is a viable option in the older, less active patient population. Although the overall reoperation rate in this cohort study is acceptable, the revision rate for patients younger than 25 years is concerning and should be taken into account when considering use of irradiated soft-tissue allograft for ACL reconstruction in these younger patients.
1. Schepsis AA, Busconi BD. Sports Medicine. Philadelphia, PA: Lippincott Williams & Wilkins; 2006.
2. Campbell WC, Canale ST, Beaty JH. Campbell’s Operative Orthopaedics. 11th ed. Philadelphia, PA: Mosby/Elsevier; 2008.
3. Sherman OH, Banffy MB. Anterior cruciate ligament reconstruction: which graft is best? Arthroscopy. 2004;20(9):974-980.
4. Lee JH, Bae DK, Song SJ, Cho SM, Yoon KH. Comparison of clinical results and second-look arthroscopy findings after arthroscopic anterior cruciate ligament reconstruction using 3 different types of grafts. Arthroscopy. 2010;26(1):41-49.
5. Sun K, Tian SQ, Zhang JH, Xia CS, Zhang CL, Yu TB. Anterior cruciate ligament reconstruction with bone-patellar tendon-bone autograft versus allograft. Arthroscopy. 2009;25(7):750-759.
6. Kuhn MA, Ross G. Allografts in the treatment of anterior cruciate ligament injuries. Sports Med Arthrosc Rev. 2007;15(3):133-138.
7. Poehling GG, Curl WW, Lee CA, et al. Analysis of outcomes of anterior cruciate ligament repair with 5-year follow-up: allograft versus autograft. Arthroscopy. 2005;21(7):774-785.
8. Singhal MC, Gardiner JR, Johnson DL. Failure of primary anterior cruciate ligament surgery using anterior tibialis allograft. Arthroscopy. 2007;23(5):469-475.
9. Barrett GR, Luber K, Replogle WH, Manley JL. Allograft anterior cruciate ligament reconstruction in the young, active patient: Tegner activity level and failure rate. Arthroscopy. 2010;26(12):1593-1601.
10. Borchers JR, Pedroza A, Kaeding C. Activity level and graft type as risk factors for anterior cruciate ligament graft failure: a case–control study. Am J Sports Med. 2009;37(12):2362-2367.
11. Prodromos C, Joyce B, Shi K. A meta-analysis of stability of autografts compared to allografts after anterior cruciate ligament reconstruction. Knee Surg Sports Traumatol Arthrosc. 2007;15(7):851-856.
12. Shelbourne KD, Gray T. Anterior cruciate ligament reconstruction with autogenous patellar tendon graft followed by accelerated rehabilitation. A two- to nine-year followup. Am J Sports Med. 1997;25(6):786-795.
13. Rosenberg TD, Franklin JL, Baldwin GN, Nelson KA. Extensor mechanism function after patellar tendon graft harvest for anterior cruciate ligament reconstruction. Am J Sports Med. 1992;20(5):519-525.
14. Piva SR, Childs JD, Klucinec BM, Irrgang JJ, Almeida GJ, Fitzgerald GK. Patella fracture during rehabilitation after bone–patellar tendon–bone anterior cruciate ligament reconstruction: 2 case reports. J Orthop Sports Phys Ther. 2009;39(4):278-286.
15. Lee GH, McCulloch P, Cole BJ, Bush-Joseph CA, Bach BR Jr. The incidence of acute patellar tendon harvest complications for anterior cruciate ligament reconstruction. Arthroscopy. 2008;24(2):162-166.
16. Kartus J, Movin T, Karlsson J. Donor-site morbidity and anterior knee problems after anterior cruciate ligament reconstruction using autografts. Arthroscopy. 2001;17(9):971-980.
17. Goldblatt JP, Fitzsimmons SE, Balk E, Richmond JC. Reconstruction of the anterior cruciate ligament: meta-analysis of patellar tendon versus hamstring tendon autograft. Arthroscopy. 2005;21(7):791-803.
18. Freedman KB, D’Amato MJ, Nedeff DD, Kaz A, Bach BR Jr. Arthroscopic anterior cruciate ligament reconstruction: a metaanalysis comparing patellar tendon and hamstring tendon autografts. Am J Sports Med. 2003;31(1):2-11.
19. Yunes M, Richmond JC, Engels EA, Pinczewski LA. Patellar versus hamstring tendons in anterior cruciate ligament reconstruction: a meta-analysis. Arthroscopy. 2001;17(3):248-257.
20. Lamblin CJ, Waterman BR, Lubowitz JH. Anterior cruciate ligament reconstruction with autografts compared with non-irradiated, non-chemically treated allografts. Arthroscopy. 2013;29(6):1113-1122.
21. Pallis M, Svoboda SJ, Cameron KL, Owens BD. Survival comparison of allograft and autograft anterior cruciate ligament reconstruction at the United States Military Academy. Am J Sports Med. 2012;40(6):1242-1246.
22. Barber FA, Cowden CH 3rd, Sanders EJ. Revision rates after anterior cruciate ligament reconstruction using bone–patellar tendon–bone allograft or autograft in a population 25 years old and younger. Arthroscopy. 2014;30(4):483-491.
23. Salehpour A, Butler DL, Proch FS, et al. Dose-dependent response of gamma irradiation on mechanical properties and related biochemical composition of goat bone–patellar tendon–bone allografts. J Orthop Res. 1995;13(6):898-906.
24. Gibbons MJ, Butler DL, Grood ES, Bylski-Austrow DI, Levy MS, Noyes FR. Effects of gamma irradiation on the initial mechanical and material properties of goat bone–patellar tendon–bone allografts. J Orthop Res. 1991;9(2):209-218.
25. Fideler BM, Vangsness CT Jr, Lu B, Orlando C, Moore T. Gamma irradiation: effects on biomechanical properties of human bone–patellar tendon–bone allografts. Am J Sports Med. 1995;23(5):643-646.
26. De Deyne P, Haut RC. Some effects of gamma irradiation on patellar tendon allografts. Connect Tissue Res. 1991;27(1):51-62.
27. Schwartz HE, Matava MJ, Proch FS, et al. The effect of gamma irradiation on anterior cruciate ligament allograft biomechanical and biochemical properties in the caprine model at time zero and at 6 months after surgery. Am J Sports Med. 2006;34(11):1747-1755.
28. Balsly CR, Cotter AT, Williams LA, Gaskins BD, Moore MA, Wolfinbarger L Jr. Effect of low dose and moderate dose gamma irradiation on the mechanical properties of bone and soft tissue allografts. Cell Tissue Bank. 2008;9(4):289-298.
29. Rappe M, Horodyski M, Meister K, Indelicato PA. Nonirradiated versus irradiated Achilles allograft: in vivo failure comparison. Am J Sports Med. 2007;35(10):1653-1658.
30. Amiel D, Kleiner JB, Akeson WH. The natural history of the anterior cruciate ligament autograft of patellar tendon origin. Am J Sports Med. 1986;14(6):449-462.
31. Amiel D, Kleiner JB, Roux RD, Harwood FL, Akeson WH. The phenomenon of “ligamentization”: anterior cruciate ligament reconstruction with autogenous patellar tendon. J Orthop Res. 1986;4(2):162-172.
32. Arnoczky SP, Tarvin GB, Marshall JL. Anterior cruciate ligament replacement using patellar tendon. An evaluation of graft revascularization in the dog. J Bone Joint Surg Am. 1982;64(2):217-224.
33. Ballock RT, Woo SL, Lyon RM, Hollis JM, Akeson WH. Use of patellar tendon autograft for anterior cruciate ligament reconstruction in the rabbit: a long-term histologic and biomechanical study. J Orthop Res. 1989;7(4):474-485.
34. Clancy WG Jr, Narechania RG, Rosenberg TD, Gmeiner JG, Wisnefske DD, Lange TA. Anterior and posterior cruciate ligament reconstruction in rhesus monkeys. J Bone Joint Surg Am. 1981;63(8):1270-1284.
35. Blickenstaff KR, Grana WA, Egle D. Analysis of a semitendinosus autograft in a rabbit model. Am J Sports Med. 1997;25(4):554-559.
36. Goradia VK, Rochat MC, Kida M, Grana WA. Natural history of a hamstring tendon autograft used for anterior cruciate ligament reconstruction in a sheep model. Am J Sports Med. 2000;28(1):40-46.
37. Bhatia S, Bell R, Frank RM, et al. Bony incorporation of soft tissue anterior cruciate ligament grafts in an animal model: autograft versus allograft with low-dose gamma irradiation. Am J Sports Med. 2012;40(8):1789-1798.
38. Jackson DW, Grood ES, Goldstein JD, et al. A comparison of patellar tendon autograft and allograft used for anterior cruciate ligament reconstruction in the goat model. Am J Sports Med. 1993;21(2):176-185.
39. Goertzen MJ, Clahsen H, Schulitz KP. Anterior cruciate ligament reconstruction using cryopreserved irradiated bone-ACL-bone-allograft transplants. Knee Surg Sports Traumatol Arthrosc. 1994;2(3):150-157.
40. Mae T, Shino K, Maeda A, Toritsuka Y, Horibe S, Ochi T. Effect of gamma irradiation on remodeling process of tendon allograft. Clin Orthop. 2003;(414):305-314.
Enhancement of Acute Tendon Repair Using Chitosan Matrix
Rotator cuff tears (RCTs) are common tendon injuries that can cause chronic pain and severe functional disability. Massive RCTs do not heal spontaneously and, in many cases, result in poor clinical outcomes. Specifically, muscle atrophy and fatty infiltration correlate with poor outcomes after surgical repair.1 Fatty infiltration of the rotator cuff is a common phenomenon that can lead to permanent structural alterations within the tendon. It has been suggested that changes in muscle fiber orientation (the pennation angle) can cause mesenchymal stem cells to migrate to the interface between muscle fibers and the region of fatty infiltration of the muscle.2 Understanding the factors involved in muscle degeneration and atrophy, and in fatty infiltration, may lead to treatments that improve outcomes for patients with massive RCTs. One proposed treatment involves placing continuous mechanical traction on the ends of the torn tendon.2 Findings from this research have indicated that acute tears that become chronic tears are typified by inelasticity and poor function of the muscle–tendon unit. It is therefore important to develop a method that speeds tendon healing without causing the muscle fiber atrophy and pennation angle changes that lead to fatty atrophy, which appears to be an irreversible structural change.
On the basis of the theory that adding mesenchymal cells may improve tendon healing, investigators have studied use of transcription factors (eg, scleraxis) specific to tendogenesis in the embryonal stage.3,4 Nevertheless, certain transcription factors are associated with formation of fibrocartilage in higher concentrations.4 Moreover, decalcified bone matrix increases cartilage formation when added to the tendon repair site.5 Cartilage formation, however, is associated with poorer functional results.6 Thus, there is a need for a method that facilitates faster tendon healing with higher quality tissue formation and less muscle atrophy.
Chitosan, a linear polysaccharide, is associated with scarless healing of soft tissues and prevention of adhesion formation both intraperitoneally and during tendon healing after surgery.7,8 Chitosan tends to precipitate in physiologic pH, thereby mitigating its potency. Fortunately, a chitosan solution that does not precipitate in physiologic conditions was recently developed.9 The solution’s lack of precipitation, coupled with its in situ gelling, allows it to adhere to the repair site long enough to take effect. These characteristics could allow for intimate contact between gel and tendon, facilitating guided-tissue regeneration and preventing adhesion of the rotator cuff to surrounding tissue. By contrast, other biological agents (eg, platelet-rich plasma) are administered as fluid rather than gel and are therefore more susceptible to diffusing from the repair site, mitigating their effects. Thus, chitosan gel is fairly unique among agents.
In the study reported here, we histologically investigated whether a chitosan gel would help improve healing of rotator cuff tendon (acute supraspinatus) tears in a rat model.
Materials and Methods
Supraspinatus Surgical Model
Forty Wistar rats, each weighing between 300 and 400 g, were used in this study. All procedures were approved by the Institutional Animal Care and Use Committee at Rabin Medical Center in Petah Tikva, Israel. The rats were anesthetized with ketamine 90 mg/kg and xylazine 10 mg/kg, both administered intramuscularly, and anesthesia was prolonged as needed with 2% isoflurane, administered by nose cone. The skin was incised 5 cm along the upper back following the midline of the spine. The resulting skin flaps were retracted and the scapula exposed. Careful blunt dissection allowed visualization of the rotator cuff and the trans-scapular arch. A full-thickness incision of the supraspinatus tendon was then made 2 mm distal to the arch. This procedure was performed on both shoulders. For the right supraspinatus tendon, a bioabsorbable chitosan–hydrochloric acid solution (>70% de-acetylated chitosan, molecular weight of 600 kDa; Heppe Medical Chitosan GmbH, Halle, Germany) was sterilely applied to the ends of the tendon (total volume, 0.5 mL) and automatically gelled in situ by heating to about 37°C (rat’s internal body temperature). The tendon ends were subsequently approximated with a single 4-0 Prolene suture (Ethicon, Somerville, New Jersey). The left shoulder (tendon repaired with suture only) served as a control.
The rats were housed for a maximum of 12 weeks after surgery. They were sacrificed (in groups of 5 each) 2 hours, 3 days, 1 week, 2 weeks, 4 weeks, 6 weeks, 8 weeks, and 12 weeks after surgery. After each rat was sacrificed, both shoulder girdles were harvested, and the sutures were removed from the supraspinatus tendons.
Histologic Analysis
After routine fixation with 4% formalin for 48 hours and decalcification with 10% ethylenediaminetetraacetic acid (EDTA) for 3 weeks, the specimens were sectioned with a microtome blade. Care was taken to ensure the plane of the microtome blade was parallel with the longitudinal plane of the supraspinatus muscle and tendon to allow for evaluation of pennation angle. Hematoxylin-eosin staining and Masson trichrome staining were subsequently performed.
A variety of histologic measurements were obtained with use of ImageJ software (US National Institutes of Health). Percentage of fibrous tissue was determined by examining the slides at low magnification fields (×25) at the tendon healing site. Three such fields were evaluated per specimen. The fibrous tissue was circled manually, and percentage of tissue area was assessed and compared with total region of interest. Cellularity was carefully outlined and measured as percentage of total tendon area occupied by cells. Fatty atrophy was defined as either present or absent. Muscle fiber diameter was defined as average diameter of 10 muscle fibers measured within 2 mm of the tendon laceration site. Inflammatory cell collections were defined as either large (>100 µm in diameter) or small (<100 µm in diameter) and were dichotomized to either present or absent. Pennation angle was defined as average angle between muscle fibers and longitudinal axis of supraspinatus muscle and tendon unit. Ten fibers proximal to and within 2 mm of the laceration site were randomly selected, measured, and averaged.
Statistical Analysis
Statistical analysis was performed with Analyse-it 2.20 for Microsoft Excel 2010 (Analyse-it Software, Leeds, United Kingdom). Data were initially analyzed with the Kolmogorov-Smirnov test to assess for normality of distribution. The t test was used to compare continuous variables when the data were normally distributed and the Mann-Whitney test when the data were not normally distributed.
Results
All tendons (both groups) healed within 12 weeks. Generally, the tissue formed at the repair site exhibited a mixture of tenocyte-like cells (fibrotic tissue) and granulation tissue without clear orientation. As noted in Figure 1, the tendons treated with chitosan had more fibrotic tissue (overall mean, 21.5%) relative to the control group (mean, 12.3%), and the difference was significant (P = .003). The most notable differences were found at time points later than 1 week after surgery. In addition, amount of cellularity (Figure 2) was higher in chitosan-treated tendon and control tendon than in the normal, uninjured adjacent tendon at all time points (P < .001). Chitosan-treated tendons had significantly higher cellularity than untreated control tendons from 1 to 2 weeks (P < .001), and control tendons were significantly hypercellular compared with chitosan-treated tendons from 4 to 8 weeks (P < .001), but both groups exhibited similar cellularity by 12 weeks (P > .05). Fatty atrophy was found at significantly higher rates in control rats than in chitosan-treated rats (P = .001; Table). Furthermore, as noted in Figure 3, muscle fiber diameter decreased in both groups after injury (P < .001).
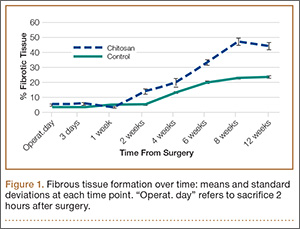
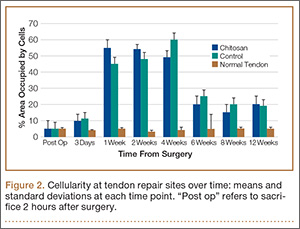
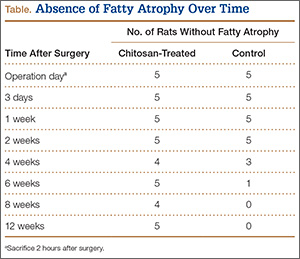
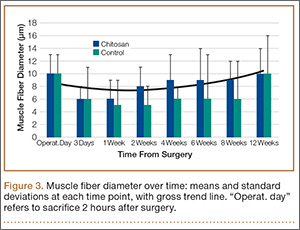
Figure 4 shows that the amount of inflammatory collections was significantly smaller in the chitosan-treated group than in the control group over the course of the study (P = .01). In addition, pennation angle steadily decreased in the control group throughout the study period, whereas it transiently decreased in the chitosan-treated group (until 2 weeks) before returning to its immediate postoperative level by 12 weeks (Figure 5). Overall, the chitosan-treated group maintained a higher pennation angle than the control group did (P < .001).
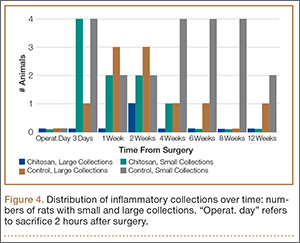
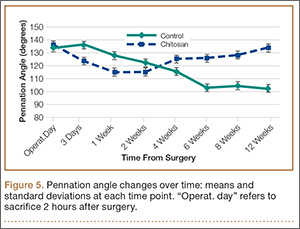
Discussion
RCTs affect more than 40% of patients over age 60 years and are a common cause of debilitating pain, reduced shoulder function, and weakness.10 Thirty thousand to 75,000 rotator cuff repairs are performed annually in the United States.11 Although the best treatment for this disorder remains a topic of debate, arthroscopic and (when necessary) open surgical repair is the accepted gold standard for the treatment of tears that do not improve with conservative management. Despite advances in the surgical treatment of these tears, the surgical failure rates are high (range, 20%-90%), with failures attributed to factors beyond patient age, tear size and chronicity, muscle atrophy and degeneration, tendon quality, repair technique, and postoperative rehabilitation.12,13 Repair strategies that biologically enhance the patient’s intrinsic healing potential are needed.
In tendon repair, choice of repair material (eg, graft) is crucial in determining the success of tissue engineering approaches. The ideal scaffold is biocompatible and does not elicit a host inflammatory response. The selected scaffold in its composition and fabricated form must be capable of holding and supporting cells. In addition, the scaffold should be biodegradable, serving as a temporary support for such cells and mechanically augmenting the repaired tendon while allowing for eventual replacement by matrix components. Moreover, the scaffold should have high porosity and a large surface area. Furthermore, the material should mimic the native tendon extracellular matrix (ECM) architecture to allow cells to be distributed throughout the scaffold and to facilitate diffusion of nutrients and factors that promote cellular proliferation and ECM production.
Given the importance of glycosaminoglycans (GAGs) in supporting the reticular structure of the matrix, use of GAGs or GAG-analogues as components of a tendon tissue scaffold for enhancing repair is well documented.14 One such candidate is chitosan, a partially de-acetylated derivative of chitin found in arthropod exoskeletons. Structurally, chitosan shares some characteristics with various GAGs and hyaluronic acid.15 More specifically, chitosan is a linear polysaccharide composed of glucosamine and N-acetyl glucosamine units linked by β-glycosidic bonds. Investigators have studied the properties of chitosan, including its biocompatibility, biodegradability, antibacterial activity, mucoadhesivity, and wound healing.16,17
One of the most promising features of chitosan is that it can be processed into porous structures for use in cell transplantation and tissue regeneration.18,19 Porous chitosan structures can be formed by freezing and lyophilizing chitosan-acetic acid solutions; chondrogenic cell adhesion and proliferation onto these structures have been reported.20,21 This chitosan scaffolding method has also been used to test different composites with collagens, gelatins, GAGs, and hyaluronic acid, all of which have also been proposed as useful 3-dimensional materials for tissue repair.22
In the present study, we used chitosan matrix in RCT repair. We hypothesized that chitosan matrix could enhance rotator cuff repair the same way it enhances repair in epidermal tissues.16 Histologic findings demonstrated that the percentage of fibrous tissue was significantly higher in the chitosan-treated group than in the control group. This improved fibroblastic response may be attributed to the ability of chitosan to enhance cell migration and serve as a scaffold for repair. Other studies have indicated that chitin, of which chitosan is the primary derivative, accelerated the healing of skin and subcutaneous tissues by increased cell migration.23 Moreover, Okamoto and colleagues24 reported that chitin implants stimulated abundant angiogenesis through the same mechanism.
Inadequate initial strength of a repair may lead to a recurrent cuff tear or a disability of rotator cuff function in the early healing stages. In our study, the chitosan matrix tended to be absorbed by 6 weeks after surgery. Its adherence to and ultimate absorption at the repair site may be challenged by the flow of irrigation fluid through the subacromial space in the setting of arthroscopic surgery. However, because the chitosan remains in a more robust gel form, it is better able to resist being washed from the repair site. For augmentation, it may be possible to apply a biocompatible patch over the gel to further protect it from being dislodged. In addition, histologic findings showed that the fibrous repair tissue gradually increased until reaching a peak 8 weeks after surgery—an indication that the absorption rate of the chitosan scaffold lags behind full recovery of the repair tissue. Given this relationship, further studies are needed to determine the mechanical strength of the repair between 6 and 8 weeks, which is important for avoiding recurrent tears.
This study had a few limitations. First, as with any animal model, the anatomy and function of the rat shoulder differ from those of the human shoulder. The acromial arch differs in quadruped animals, with less coverage of the supraspinatus and more of the subscapularis.25 These anatomical differences could yield altered stress mechanics that could affect tendon repair. Furthermore, rats and humans differ in their RCT healing rates. Thus, the pathophysiology of muscle atrophy and fat infiltration in rats may slightly differ from that in humans. In addition, no mechanical testing was performed to compare chitosan-treated and untreated rotator cuff repairs, and such testing is needed to clarify the biomechanical importance of augmentation. Furthermore, no immunohistochemical analysis was performed for collagen. In the repair of rotator cuff tendons, surgeons must consider not only the number of cells but also the production of ECM. Although not directly confirmed in this study, chitosan induced fibrous tissue proliferation that mirrored production of a large amount of collagen fibers. Last, we used an open RTC model. As an arthroscopic model was not used, no definitive conclusions can be drawn regarding use of chitosan in arthroscopy.
Conclusion
Use of chitosan as an acellular matrix improved formation of healing fibrous tissue, increased the number of cells, and prevented fatty atrophy and inflammatory aggregates inside repair sites while facilitating recovery of the natural pennation angle of the tissue. These results demonstrate that chitosan can enhance tendon healing in the setting of acute RCT. Further research, including biomechanical testing of repaired tendons, is needed to further delineate the utility of chitosan in regenerating irreparable RCTs.
1. Shen PH, Lien SB, Shen HC, Lee CH, Wu SS, Lin LC. Long-term functional outcomes after repair of rotator cuff tears correlated with atrophy of the supraspinatus muscles on magnetic resonance images. J Shoulder Elbow Surg. 2008;17(1 suppl):1S-7S.
2. Meyer DC, Hoppeler H, von Rechenberg B, Gerber C. A pathomechanical concept explains muscle loss and fatty muscular changes following surgical tendon release. J Orthop Res. 2004;22(5):1004-1007.
3. Gulotta LV, Kovacevic D, Packer JD, Deng XH, Rodeo SA. Bone marrow–derived mesenchymal stem cells transduced with scleraxis improve rotator cuff healing in a rat model. Am J Sports Med. 2011;39(6):1282-1289.
4. Gulotta LV, Rodeo SA. Emerging ideas: evaluation of stem cells genetically modified with scleraxis to improve rotator cuff healing. Clin Orthop. 2011;469(10):2977-2980.
5. Sundar S, Pendegrass CJ, Blunn GW. Tendon bone healing can be enhanced by demineralized bone matrix: a functional and histological study. J Biomed Mater Res B Appl Biomater. 2009;88(1):115-122.
6. Kumagai J, Sarkar K, Uhthoff HK. The collagen types in the attachment zone of rotator cuff tendons in the elderly: an immunohistochemical study. J Rheumatol. 1994;21(11):2096-2100.
7. Wang D, Mo J, Pan S, Chen H, Zhen H. Prevention of postoperative peritoneal adhesions by O-carboxymethyl chitosan in a rat cecal abrasion model. Clin Invest Med. 2010;33(4):E254-E260.
8. Zhang H, Sheng ZJ, Hou CL. Effect of chitosan membrane on tendon adhesion and healing [in Chinese]. Zhongguo Xiu Fu Chong Jian Wai Ke Za Zhi. 1999;13(6):382-385.
9. Cho MH, Kim KS, Ahn HH, et al. Chitosan gel as an in situ–forming scaffold for rat bone marrow mesenchymal stem cells in vivo. Tissue Eng Part A. 2008;14(6):1099-1108.
10. Yamaguchi K, Tetro AM, Blam O, Evanoff BA, Teefey SA, Middleton WD. Natural history of asymptomatic rotator cuff tears: a longitudinal analysis of asymptomatic tears detected sonographically. J Shoulder Elbow Surg. 2001;10(3):199-203.
11. Vitale MA, Vitale MG, Zivin JG, Braman JP, Bigliani LU, Flatow EL. Rotator cuff repair: an analysis of utility scores and cost-effectiveness. J Shoulder Elbow Surg. 2007;16(2):181-187.
12. Accousti KJ, Flatow EL. Technical pearls on how to maximize healing of the rotator cuff. Instr Course Lect. 2007;56:3-12.
13. Bishop J, Klepps S, Lo IK, Bird J, Gladstone JN, Flatow EL. Cuff integrity after arthroscopic versus open rotator cuff repair: a prospective study. J Shoulder Elbow Surg. 2006;15(3):290-299.
14. Hunziker E, Spector M, Libera J, et al. Translation from research to applications. Tissue Eng. 2006;12(12):3341-3364.
15. Suh JK, Matthew HW. Application of chitosan-based polysaccharide biomaterials in cartilage tissue engineering: a review. Biomaterials. 2000;21(24):2589-2598.
16. Kumar MN, Muzzarelli RA, Muzzarelli C, Sashiwa H, Domb AJ. Chitosan chemistry and pharmaceutical perspectives. Chem Rev. 2004;104(12):6017-6084.
17. Shi C, Zhu Y, Ran X, Wang M, Su Y, Cheng T. Therapeutic potential of chitosan and its derivatives in regenerative medicine. J Surg Res. 2006;133(2):185-192.
18. Hsieh WC, Chang CP, Lin SM. Morphology and characterization of 3D micro-porous structured chitosan scaffolds for tissue engineering. Colloids Surf B Biointerfaces. 2007;57(2):250-255.
19. Madihally SV, Matthew HW. Porous chitosan scaffolds for tissue engineering. Biomaterials. 1999;20(12):1133-1142.
20. Nettles DL, Elder SH, Gilbert JA. Potential use of chitosan as a cell scaffold material for cartilage tissue engineering. Tissue Eng. 2002;8(6):1009-1016.
21. Griffon DJ, Sedighi MR, Schaeffer DV, Eurell JA, Johnson AL. Chitosan scaffolds: interconnective pore size and cartilage engineering. Acta Biomater. 2006;2(3):313-320.
22. Manjubala I, Scheler S, Bossert J, Jandt KD. Mineralisation of chitosan scaffolds with nano-apatite formation by double diffusion technique. Acta Biomater. 2006;2(1):75-84.
23. Su CH, Sun CS, Juan SW, Ho HO, Hu CH, Sheu MT. Development of fungal mycelia as skin substitutes: effects on wound healing and fibroblast. Biomaterials. 1999;20(1):61-68.
24. Okamoto Y, Southwood L, Stashak TS. Effect of chitin on nonwoven fabric implant in tendon healing. Carbohydr Polym. 1997;33:33-38.
25. Gupta R, Lee TQ. Contributions of the different rabbit models to our understanding of rotator cuff pathology. J Shoulder Elbow Surg. 2007;16(5 suppl):S149-S157.
Rotator cuff tears (RCTs) are common tendon injuries that can cause chronic pain and severe functional disability. Massive RCTs do not heal spontaneously and, in many cases, result in poor clinical outcomes. Specifically, muscle atrophy and fatty infiltration correlate with poor outcomes after surgical repair.1 Fatty infiltration of the rotator cuff is a common phenomenon that can lead to permanent structural alterations within the tendon. It has been suggested that changes in muscle fiber orientation (the pennation angle) can cause mesenchymal stem cells to migrate to the interface between muscle fibers and the region of fatty infiltration of the muscle.2 Understanding the factors involved in muscle degeneration and atrophy, and in fatty infiltration, may lead to treatments that improve outcomes for patients with massive RCTs. One proposed treatment involves placing continuous mechanical traction on the ends of the torn tendon.2 Findings from this research have indicated that acute tears that become chronic tears are typified by inelasticity and poor function of the muscle–tendon unit. It is therefore important to develop a method that speeds tendon healing without causing the muscle fiber atrophy and pennation angle changes that lead to fatty atrophy, which appears to be an irreversible structural change.
On the basis of the theory that adding mesenchymal cells may improve tendon healing, investigators have studied use of transcription factors (eg, scleraxis) specific to tendogenesis in the embryonal stage.3,4 Nevertheless, certain transcription factors are associated with formation of fibrocartilage in higher concentrations.4 Moreover, decalcified bone matrix increases cartilage formation when added to the tendon repair site.5 Cartilage formation, however, is associated with poorer functional results.6 Thus, there is a need for a method that facilitates faster tendon healing with higher quality tissue formation and less muscle atrophy.
Chitosan, a linear polysaccharide, is associated with scarless healing of soft tissues and prevention of adhesion formation both intraperitoneally and during tendon healing after surgery.7,8 Chitosan tends to precipitate in physiologic pH, thereby mitigating its potency. Fortunately, a chitosan solution that does not precipitate in physiologic conditions was recently developed.9 The solution’s lack of precipitation, coupled with its in situ gelling, allows it to adhere to the repair site long enough to take effect. These characteristics could allow for intimate contact between gel and tendon, facilitating guided-tissue regeneration and preventing adhesion of the rotator cuff to surrounding tissue. By contrast, other biological agents (eg, platelet-rich plasma) are administered as fluid rather than gel and are therefore more susceptible to diffusing from the repair site, mitigating their effects. Thus, chitosan gel is fairly unique among agents.
In the study reported here, we histologically investigated whether a chitosan gel would help improve healing of rotator cuff tendon (acute supraspinatus) tears in a rat model.
Materials and Methods
Supraspinatus Surgical Model
Forty Wistar rats, each weighing between 300 and 400 g, were used in this study. All procedures were approved by the Institutional Animal Care and Use Committee at Rabin Medical Center in Petah Tikva, Israel. The rats were anesthetized with ketamine 90 mg/kg and xylazine 10 mg/kg, both administered intramuscularly, and anesthesia was prolonged as needed with 2% isoflurane, administered by nose cone. The skin was incised 5 cm along the upper back following the midline of the spine. The resulting skin flaps were retracted and the scapula exposed. Careful blunt dissection allowed visualization of the rotator cuff and the trans-scapular arch. A full-thickness incision of the supraspinatus tendon was then made 2 mm distal to the arch. This procedure was performed on both shoulders. For the right supraspinatus tendon, a bioabsorbable chitosan–hydrochloric acid solution (>70% de-acetylated chitosan, molecular weight of 600 kDa; Heppe Medical Chitosan GmbH, Halle, Germany) was sterilely applied to the ends of the tendon (total volume, 0.5 mL) and automatically gelled in situ by heating to about 37°C (rat’s internal body temperature). The tendon ends were subsequently approximated with a single 4-0 Prolene suture (Ethicon, Somerville, New Jersey). The left shoulder (tendon repaired with suture only) served as a control.
The rats were housed for a maximum of 12 weeks after surgery. They were sacrificed (in groups of 5 each) 2 hours, 3 days, 1 week, 2 weeks, 4 weeks, 6 weeks, 8 weeks, and 12 weeks after surgery. After each rat was sacrificed, both shoulder girdles were harvested, and the sutures were removed from the supraspinatus tendons.
Histologic Analysis
After routine fixation with 4% formalin for 48 hours and decalcification with 10% ethylenediaminetetraacetic acid (EDTA) for 3 weeks, the specimens were sectioned with a microtome blade. Care was taken to ensure the plane of the microtome blade was parallel with the longitudinal plane of the supraspinatus muscle and tendon to allow for evaluation of pennation angle. Hematoxylin-eosin staining and Masson trichrome staining were subsequently performed.
A variety of histologic measurements were obtained with use of ImageJ software (US National Institutes of Health). Percentage of fibrous tissue was determined by examining the slides at low magnification fields (×25) at the tendon healing site. Three such fields were evaluated per specimen. The fibrous tissue was circled manually, and percentage of tissue area was assessed and compared with total region of interest. Cellularity was carefully outlined and measured as percentage of total tendon area occupied by cells. Fatty atrophy was defined as either present or absent. Muscle fiber diameter was defined as average diameter of 10 muscle fibers measured within 2 mm of the tendon laceration site. Inflammatory cell collections were defined as either large (>100 µm in diameter) or small (<100 µm in diameter) and were dichotomized to either present or absent. Pennation angle was defined as average angle between muscle fibers and longitudinal axis of supraspinatus muscle and tendon unit. Ten fibers proximal to and within 2 mm of the laceration site were randomly selected, measured, and averaged.
Statistical Analysis
Statistical analysis was performed with Analyse-it 2.20 for Microsoft Excel 2010 (Analyse-it Software, Leeds, United Kingdom). Data were initially analyzed with the Kolmogorov-Smirnov test to assess for normality of distribution. The t test was used to compare continuous variables when the data were normally distributed and the Mann-Whitney test when the data were not normally distributed.
Results
All tendons (both groups) healed within 12 weeks. Generally, the tissue formed at the repair site exhibited a mixture of tenocyte-like cells (fibrotic tissue) and granulation tissue without clear orientation. As noted in Figure 1, the tendons treated with chitosan had more fibrotic tissue (overall mean, 21.5%) relative to the control group (mean, 12.3%), and the difference was significant (P = .003). The most notable differences were found at time points later than 1 week after surgery. In addition, amount of cellularity (Figure 2) was higher in chitosan-treated tendon and control tendon than in the normal, uninjured adjacent tendon at all time points (P < .001). Chitosan-treated tendons had significantly higher cellularity than untreated control tendons from 1 to 2 weeks (P < .001), and control tendons were significantly hypercellular compared with chitosan-treated tendons from 4 to 8 weeks (P < .001), but both groups exhibited similar cellularity by 12 weeks (P > .05). Fatty atrophy was found at significantly higher rates in control rats than in chitosan-treated rats (P = .001; Table). Furthermore, as noted in Figure 3, muscle fiber diameter decreased in both groups after injury (P < .001).
Figure 4 shows that the amount of inflammatory collections was significantly smaller in the chitosan-treated group than in the control group over the course of the study (P = .01). In addition, pennation angle steadily decreased in the control group throughout the study period, whereas it transiently decreased in the chitosan-treated group (until 2 weeks) before returning to its immediate postoperative level by 12 weeks (Figure 5). Overall, the chitosan-treated group maintained a higher pennation angle than the control group did (P < .001).
Discussion
RCTs affect more than 40% of patients over age 60 years and are a common cause of debilitating pain, reduced shoulder function, and weakness.10 Thirty thousand to 75,000 rotator cuff repairs are performed annually in the United States.11 Although the best treatment for this disorder remains a topic of debate, arthroscopic and (when necessary) open surgical repair is the accepted gold standard for the treatment of tears that do not improve with conservative management. Despite advances in the surgical treatment of these tears, the surgical failure rates are high (range, 20%-90%), with failures attributed to factors beyond patient age, tear size and chronicity, muscle atrophy and degeneration, tendon quality, repair technique, and postoperative rehabilitation.12,13 Repair strategies that biologically enhance the patient’s intrinsic healing potential are needed.
In tendon repair, choice of repair material (eg, graft) is crucial in determining the success of tissue engineering approaches. The ideal scaffold is biocompatible and does not elicit a host inflammatory response. The selected scaffold in its composition and fabricated form must be capable of holding and supporting cells. In addition, the scaffold should be biodegradable, serving as a temporary support for such cells and mechanically augmenting the repaired tendon while allowing for eventual replacement by matrix components. Moreover, the scaffold should have high porosity and a large surface area. Furthermore, the material should mimic the native tendon extracellular matrix (ECM) architecture to allow cells to be distributed throughout the scaffold and to facilitate diffusion of nutrients and factors that promote cellular proliferation and ECM production.
Given the importance of glycosaminoglycans (GAGs) in supporting the reticular structure of the matrix, use of GAGs or GAG-analogues as components of a tendon tissue scaffold for enhancing repair is well documented.14 One such candidate is chitosan, a partially de-acetylated derivative of chitin found in arthropod exoskeletons. Structurally, chitosan shares some characteristics with various GAGs and hyaluronic acid.15 More specifically, chitosan is a linear polysaccharide composed of glucosamine and N-acetyl glucosamine units linked by β-glycosidic bonds. Investigators have studied the properties of chitosan, including its biocompatibility, biodegradability, antibacterial activity, mucoadhesivity, and wound healing.16,17
One of the most promising features of chitosan is that it can be processed into porous structures for use in cell transplantation and tissue regeneration.18,19 Porous chitosan structures can be formed by freezing and lyophilizing chitosan-acetic acid solutions; chondrogenic cell adhesion and proliferation onto these structures have been reported.20,21 This chitosan scaffolding method has also been used to test different composites with collagens, gelatins, GAGs, and hyaluronic acid, all of which have also been proposed as useful 3-dimensional materials for tissue repair.22
In the present study, we used chitosan matrix in RCT repair. We hypothesized that chitosan matrix could enhance rotator cuff repair the same way it enhances repair in epidermal tissues.16 Histologic findings demonstrated that the percentage of fibrous tissue was significantly higher in the chitosan-treated group than in the control group. This improved fibroblastic response may be attributed to the ability of chitosan to enhance cell migration and serve as a scaffold for repair. Other studies have indicated that chitin, of which chitosan is the primary derivative, accelerated the healing of skin and subcutaneous tissues by increased cell migration.23 Moreover, Okamoto and colleagues24 reported that chitin implants stimulated abundant angiogenesis through the same mechanism.
Inadequate initial strength of a repair may lead to a recurrent cuff tear or a disability of rotator cuff function in the early healing stages. In our study, the chitosan matrix tended to be absorbed by 6 weeks after surgery. Its adherence to and ultimate absorption at the repair site may be challenged by the flow of irrigation fluid through the subacromial space in the setting of arthroscopic surgery. However, because the chitosan remains in a more robust gel form, it is better able to resist being washed from the repair site. For augmentation, it may be possible to apply a biocompatible patch over the gel to further protect it from being dislodged. In addition, histologic findings showed that the fibrous repair tissue gradually increased until reaching a peak 8 weeks after surgery—an indication that the absorption rate of the chitosan scaffold lags behind full recovery of the repair tissue. Given this relationship, further studies are needed to determine the mechanical strength of the repair between 6 and 8 weeks, which is important for avoiding recurrent tears.
This study had a few limitations. First, as with any animal model, the anatomy and function of the rat shoulder differ from those of the human shoulder. The acromial arch differs in quadruped animals, with less coverage of the supraspinatus and more of the subscapularis.25 These anatomical differences could yield altered stress mechanics that could affect tendon repair. Furthermore, rats and humans differ in their RCT healing rates. Thus, the pathophysiology of muscle atrophy and fat infiltration in rats may slightly differ from that in humans. In addition, no mechanical testing was performed to compare chitosan-treated and untreated rotator cuff repairs, and such testing is needed to clarify the biomechanical importance of augmentation. Furthermore, no immunohistochemical analysis was performed for collagen. In the repair of rotator cuff tendons, surgeons must consider not only the number of cells but also the production of ECM. Although not directly confirmed in this study, chitosan induced fibrous tissue proliferation that mirrored production of a large amount of collagen fibers. Last, we used an open RTC model. As an arthroscopic model was not used, no definitive conclusions can be drawn regarding use of chitosan in arthroscopy.
Conclusion
Use of chitosan as an acellular matrix improved formation of healing fibrous tissue, increased the number of cells, and prevented fatty atrophy and inflammatory aggregates inside repair sites while facilitating recovery of the natural pennation angle of the tissue. These results demonstrate that chitosan can enhance tendon healing in the setting of acute RCT. Further research, including biomechanical testing of repaired tendons, is needed to further delineate the utility of chitosan in regenerating irreparable RCTs.
1. Shen PH, Lien SB, Shen HC, Lee CH, Wu SS, Lin LC. Long-term functional outcomes after repair of rotator cuff tears correlated with atrophy of the supraspinatus muscles on magnetic resonance images. J Shoulder Elbow Surg. 2008;17(1 suppl):1S-7S.
2. Meyer DC, Hoppeler H, von Rechenberg B, Gerber C. A pathomechanical concept explains muscle loss and fatty muscular changes following surgical tendon release. J Orthop Res. 2004;22(5):1004-1007.
3. Gulotta LV, Kovacevic D, Packer JD, Deng XH, Rodeo SA. Bone marrow–derived mesenchymal stem cells transduced with scleraxis improve rotator cuff healing in a rat model. Am J Sports Med. 2011;39(6):1282-1289.
4. Gulotta LV, Rodeo SA. Emerging ideas: evaluation of stem cells genetically modified with scleraxis to improve rotator cuff healing. Clin Orthop. 2011;469(10):2977-2980.
5. Sundar S, Pendegrass CJ, Blunn GW. Tendon bone healing can be enhanced by demineralized bone matrix: a functional and histological study. J Biomed Mater Res B Appl Biomater. 2009;88(1):115-122.
6. Kumagai J, Sarkar K, Uhthoff HK. The collagen types in the attachment zone of rotator cuff tendons in the elderly: an immunohistochemical study. J Rheumatol. 1994;21(11):2096-2100.
7. Wang D, Mo J, Pan S, Chen H, Zhen H. Prevention of postoperative peritoneal adhesions by O-carboxymethyl chitosan in a rat cecal abrasion model. Clin Invest Med. 2010;33(4):E254-E260.
8. Zhang H, Sheng ZJ, Hou CL. Effect of chitosan membrane on tendon adhesion and healing [in Chinese]. Zhongguo Xiu Fu Chong Jian Wai Ke Za Zhi. 1999;13(6):382-385.
9. Cho MH, Kim KS, Ahn HH, et al. Chitosan gel as an in situ–forming scaffold for rat bone marrow mesenchymal stem cells in vivo. Tissue Eng Part A. 2008;14(6):1099-1108.
10. Yamaguchi K, Tetro AM, Blam O, Evanoff BA, Teefey SA, Middleton WD. Natural history of asymptomatic rotator cuff tears: a longitudinal analysis of asymptomatic tears detected sonographically. J Shoulder Elbow Surg. 2001;10(3):199-203.
11. Vitale MA, Vitale MG, Zivin JG, Braman JP, Bigliani LU, Flatow EL. Rotator cuff repair: an analysis of utility scores and cost-effectiveness. J Shoulder Elbow Surg. 2007;16(2):181-187.
12. Accousti KJ, Flatow EL. Technical pearls on how to maximize healing of the rotator cuff. Instr Course Lect. 2007;56:3-12.
13. Bishop J, Klepps S, Lo IK, Bird J, Gladstone JN, Flatow EL. Cuff integrity after arthroscopic versus open rotator cuff repair: a prospective study. J Shoulder Elbow Surg. 2006;15(3):290-299.
14. Hunziker E, Spector M, Libera J, et al. Translation from research to applications. Tissue Eng. 2006;12(12):3341-3364.
15. Suh JK, Matthew HW. Application of chitosan-based polysaccharide biomaterials in cartilage tissue engineering: a review. Biomaterials. 2000;21(24):2589-2598.
16. Kumar MN, Muzzarelli RA, Muzzarelli C, Sashiwa H, Domb AJ. Chitosan chemistry and pharmaceutical perspectives. Chem Rev. 2004;104(12):6017-6084.
17. Shi C, Zhu Y, Ran X, Wang M, Su Y, Cheng T. Therapeutic potential of chitosan and its derivatives in regenerative medicine. J Surg Res. 2006;133(2):185-192.
18. Hsieh WC, Chang CP, Lin SM. Morphology and characterization of 3D micro-porous structured chitosan scaffolds for tissue engineering. Colloids Surf B Biointerfaces. 2007;57(2):250-255.
19. Madihally SV, Matthew HW. Porous chitosan scaffolds for tissue engineering. Biomaterials. 1999;20(12):1133-1142.
20. Nettles DL, Elder SH, Gilbert JA. Potential use of chitosan as a cell scaffold material for cartilage tissue engineering. Tissue Eng. 2002;8(6):1009-1016.
21. Griffon DJ, Sedighi MR, Schaeffer DV, Eurell JA, Johnson AL. Chitosan scaffolds: interconnective pore size and cartilage engineering. Acta Biomater. 2006;2(3):313-320.
22. Manjubala I, Scheler S, Bossert J, Jandt KD. Mineralisation of chitosan scaffolds with nano-apatite formation by double diffusion technique. Acta Biomater. 2006;2(1):75-84.
23. Su CH, Sun CS, Juan SW, Ho HO, Hu CH, Sheu MT. Development of fungal mycelia as skin substitutes: effects on wound healing and fibroblast. Biomaterials. 1999;20(1):61-68.
24. Okamoto Y, Southwood L, Stashak TS. Effect of chitin on nonwoven fabric implant in tendon healing. Carbohydr Polym. 1997;33:33-38.
25. Gupta R, Lee TQ. Contributions of the different rabbit models to our understanding of rotator cuff pathology. J Shoulder Elbow Surg. 2007;16(5 suppl):S149-S157.
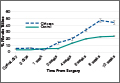
Retrograde Reamer/Irrigator/Aspirator Technique for Autologous Bone Graft Harvesting With the Patient in the Prone Position
The Reamer/Irrigator/Aspirator (RIA) system (Synthes, West Chester, Pennsylvania) has become a powerful tool for harvesting autologous bone graft from the intramedullary canal of the long bones of the lower extremity for the treatment of osseous defects, nonunions, and joint fusions.1,2 The RIA system provides satisfactory quality and quantity of bone graft (range, 40-90 mL)3-5 with osteogenic properties that rival those harvested from the iliac crest.6,7 Minimal donor-site morbidity and mortality have been reported in association with the RIA technique compared with iliac crest bone graft harvest.8
The RIA technique for the femur—with the antegrade approach and the supine position,8 with the antegrade approach and the prone position,9 and with the retrograde approach and the supine position4—has been described in the literature. To our knowledge, however, the RIA technique for the femur with the retrograde approach and the prone position has not been described. Antegrade harvesting uses the trochanteric entry point, and retrograde harvesting uses an entry at the intercondylar notch just anterior to the posterior cruciate ligament. In this article, we detail the technique for RIA harvesting of the femur with the patient in the prone position. Patient positioning is based on the diagnosis and the proposed procedure.
Advantages of a retrograde starting point include a more concentric trajectory (vs that of an antegrade starting point) and more efficient canal pressure reduction, which might decrease the risk of intraoperative fat embolization.10 This technique offers a more efficient solution to any procedure that requires the prone position, and it avoids the need to reposition, reprepare, or redrape the extremity. It is also very useful in treating obese patients.
After obtaining institutional review board (IRB) approval, we retrospectively reviewed patient files. Because the study was retrospective, the IRB waived the requirement for informed consent. The patients described here provided written informed consent for print and electronic publication of these case reports.
Surgical Technique
The patient is placed in a prone position on a radiolucent table with a bump under the thigh to allow access to the knee joint with full extension of the hip (Figures 1, 2A, 2B). The knee is then flexed to gain access to the intercondylar notch.
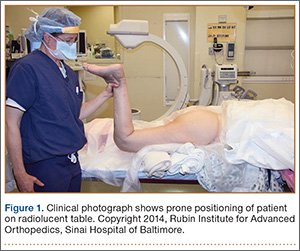
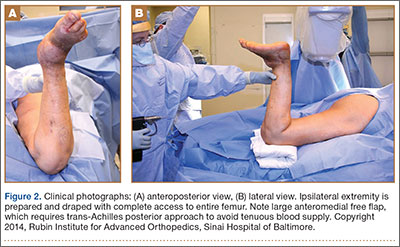
The anatomical axis of the femur is identified in the coronal and sagittal planes with the help of an image intensifier. Frequent intraoperative fluoroscopic imaging is required to prevent eccentric reaming and guide-wire movement from causing iatrogenic fractures and perforations, respectively.8 A 2-mm Steinmann pin is used to identify the point of entry into the femoral canal, which is located just above the posterior cruciate ligament insertion in the intercondylar notch, and care is taken not to ream this structure. A minimally invasive incision of about 15 mm is centered on this pin using a patellar tendon–splitting approach.
An 8-mm cannulated anterior cruciate ligament reamer is passed over the pin to enlarge the opening at the entry point, and a 2.5-mm ball-tipped guide wire is positioned in the femur. The image intensifier is used to confirm positioning of the guide in the trochanteric region and centered in the intramedullary canal. A radiolucent diving board facilitates fluoroscopic imaging.
The diameter (12.5 or 16.5 mm) of the reaming head is selected after the intramedullary guide is placed in the femoral canal. The isthmus of the femur is then identified radiographically, and a radiopaque ruler with increments in millimeters is used to measure the canal diameter (Figures 3A, 3B). Because the femoral canal is an ellipsoid, the canal diameter usually is much larger anteroposteriorly than laterally.8 We prefer to use a reaming head that overlaps the inner cortical diameter by 1 mm on each side. An alternative method includes measuring the outer diameter of the narrowest portion of the bone and using a reamer head no more than 45% of the outer diameter at the isthmus.8
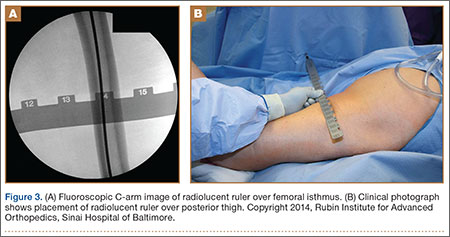
The RIA system is prepared on the back table by attaching the reaming head to the irrigation and suction systems. As the reamer head enters the intramedullary canal, an approach–withdraw–pause technique is used to slowly advance the reamer through the femur. It is crucial to use the image intensifier to guide reaming in order to avoid overdrilling the anterior cortex and prevent eccentric reaming of the canal, which more commonly occurs in patients with large anterior femoral bows.11 When the collection filter becomes full, reaming is stopped. The bone graft in the filter is emptied into a specimen cup for measurement and storage until subsequent use (Figure 4). Suctioning is suspended when reaming is stopped because substantial blood loss can occur with prolonged suction and aspiration.12 When repeat reaming is required, care is taken not to overream the cortices, thereby avoiding the risk of iatrogenic fracture.10,12
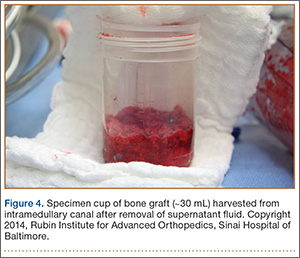
The knee joint is irrigated to remove any intramedullary debris. Typically there is no debris, as it is captured by the RIA. The wound is closed in 2 layers. Dressing with Ace bandage (3M, St. Paul, Minnesota) is placed around the knee for comfort. Weight-bearing status is determined by the index procedure.
Case Reports
Case 1
A 68-year-old female smoker presented to our facility with right ankle pain after recent ankle arthrodesis for pilon fracture nonunion. Almost 3 years earlier, the patient sustained a Gustilo-Anderson type II open pilon fracture in a motorcycle accident. She underwent antibiotic therapy, irrigation and débridement of the fracture site, and external fixation before definitive treatment with repeat irrigation and débridement and open reduction and internal fixation of the tibial plafond. About 6 months after surgery, she presented to her surgeon with a draining abscess over the anteromedial surgical incision. Multiple débridement procedures were performed, the implant was removed, the ankle was stabilized with a bridging external fixator, and culture-specific antibiotic therapy was administered. Intraoperative cultures confirmed methicillin-resistant Staphylococcus aureus. Vancomycin was administered intravenously for 6 weeks. Once C-reactive protein level and erythrocyte sedimentation rate returned to normal, repeat débridement with a rectus abdominis free flap and ankle fusion were performed.
When the patient presented to our clinic, we saw atrophic nonunion of the ankle fusion on radiographs. Smoking cessation was encouraged but not required before surgery. The patient returned to the operating suite for tibiotalocalcaneal fusion with a retrograde intramedullary nail. With the patient in the prone position, retrograde femoral RIA reaming was performed to harvest 30 mL of autologous bone. After resection of the nonunion site using a trans-Achilles approach and insertion of the intramedullary nail, the autologous bone graft was mixed with recombinant human bone morphogenetic protein 2 (BMP-2), and the mixture was introduced into the fusion site. At final follow-up, 18 months after surgery, the patient was clinically asymptomatic and radiographically healed—without further intervention and despite continued smoking. She did not report any knee pain from the harvest site.
Case 2
A 59-year-old noncompliant woman with diabetes and Charcot neuropathy sustained a trimalleolar ankle fracture-dislocation that was initially treated with ankle and hindfoot arthrodesis. The postoperative course was uneventful, and she was discharged home. Less than a week later, she presented to the emergency department with a midshaft tibial fracture just proximal to the ankle and hindfoot fusion nail. She subsequently had the device removed and a long arthrodesis rod inserted to span the fracture site up to the proximal tibial metadiaphysis. About 9 months later, she returned to our office complaining of ankle pain. No signs of infection were clinically evident. Radiographs showed nonunion of the ankle and subtalar joint. Findings of the initial bone biopsy and pathologic examination were negative for infection. The patient returned to the operating room 4 weeks later for revision ankle fusion. With the patient in the prone position, autologous bone (~30 mL) was harvested using retrograde femoral RIA reaming. The nonunion site was resected, and a mixture of autologous bone graft and BMP-2 was applied. Through a posterior approach, an anterior ankle arthrodesis locking plate was applied to the posterior aspect of the calcaneus and tibia. The patient was kept non-weight-bearing for 3 months and progressed in weight-bearing for another 4 to 6 weeks. Ambulatory status was restored about 4 months after surgery. No harvest-site knee pain was reported.
Discussion
Given its osteogenic, osteoconductive, and osteoinductive properties, autologous cancellous bone graft is the gold standard for reconstruction and fusion procedures in foot and ankle surgery.13 Bone graft can be obtained from many potential donor sites, but the most common is the iliac crest.2 However, many comorbidities, such as residual donor-site pain, neurovascular injuries, infection, and increased surgical time, have been reported in the literature.14,15 The RIA system was initially developed for simultaneous reaming and aspiration to reduce intramedullary pressure, heat generation, operating time, and the systemic effects of reaming, such as the embolic phenomenon.16-22 The single-pass reamer has provided a minimally invasive strategy for procuring voluminous amounts of autologous cancellous bone from the intramedullary canal of lower extremity long bones. Schmidmaier and colleagues3 recently quantified the measurements of several growth factors, such as insulinlike growth factor 1, transforming growth factor β 1, and BMP-2—proving that RIA-derived aspirates have amounts comparable to if not larger than those of iliac crest autologous bone graft. Pratt and colleagues23 provided insight into the possibility of induction of mesenchymal stem cells using the previously unwanted supernatant reamings after filtration. Recently, the RIA technique of autologous tibial and hindfoot bone graft harvest was described for use in ankle or tibiotalocalcaneal arthrodesis.2 Although this technique is a useful surgical option, tibia size remains a limiting factor. Kovar and Wozasek24 reported harvesting significantly more bone graft in the femur than in the tibia. A tibia that cannot accommodate the 12-mm (smallest) reamer head in the RIA system would be a contraindication. In addition, concerns about the association between tibial stress fractures and reaming of the entire tibial canal and concerns about the overall donor-site morbidity of the tibial shaft remain.
Conclusion
With its retrograde approach and prone positioning, this RIA technique is an effective and efficient solution for harvesting autologous femoral bone graft. Although we have described its use in ankle and hindfoot arthrodesis, this technique can be applied to any prone-position surgical procedure, including spine surgery.
1. Kobbe P, Tarkin IS, Frink M, Pape HC. Voluminous bone graft harvesting of the femoral marrow cavity for autologous transplantation. An indication for the “reamer-irrigator-aspirator-” (RIA-)technique [in German]. Unfallchirurg. 2008;111(6):469-472.
2. Herscovici D Jr, Scaduto JM. Use of the reamer-irrigator-aspirator technique to obtain autograft for ankle and hindfoot arthrodesis. J Bone Joint Surg Br. 2012;94(1):75-79.
3. Schmidmaier G, Herrmann S, Green J, et al. Quantitative assessment of growth factors in reaming aspirate, iliac crest, and platelet preparation. Bone. 2006;39(5):1156-1163.
4. Qvick LM, Ritter CA, Mutty CE, Rohrbacher BJ, Buyea CM, Anders MJ. Donor site morbidity with reamer-irrigator-aspirator (RIA) use for autogenous bone graft harvesting in a single centre 204 case series. Injury. 2013;44(10):1263-1269.
5. Lehman AA, Irgit KS, Cush GJ. Harvest of autogenous bone graft using reamer-irrigator-aspirator in tibiotalocalcaneal arthrodesis: surgical technique and case series. Foot Ankle Int. 2012;33(12):1133-1138.
6. Wildemann B, Kadow-Romacker A, Haas NP, Schmidmaier G. Quantification of various growth factors in different demineralized bone matrix preparations. J Biomed Mater Res A. 2007;81(2):437-442.
7. Sagi HC, Young ML, Gerstenfeld L, Einhorn TA, Tornetta P. Qualitative and quantitative differences between bone graft obtained from the medullary canal (with a reamer/irrigator/aspirator) and the iliac crest of the same patient. J Bone Joint Surg Am. 2012;94(23):2128-2135.
8. Belthur MV, Conway JD, Jindal G, Ranade A, Herzenberg JE. Bone graft harvest using a new intramedullary system. Clin Orthop. 2008;466(12):2973-2980.
9. Nichols TA, Sagi HC, Weber TG, Guiot BH. An alternative source of autograft bone for spinal fusion: the femur: technical case report. Neurosurgery. 2008;62(3 suppl 1):E179.
10. Van Gorp CC, Falk JV, Kmiec SJ Jr, Siston RA. The reamer/irrigator/aspirator reduces femoral canal pressure in simulated TKA. Clin Orthop. 2009;467(3):805-809.
11. Quintero AJ, Tarkin IS, Pape HC. Technical tricks when using the reamer irrigator aspirator technique for autologous bone graft harvesting. J Orthop Trauma. 2010;24(1):42-45.
12. Stafford PR, Norris B. Reamer-irrigator-aspirator as a bone graft harvester. Tech Foot Ankle Surg. 2007;6(2):100-107.
13. Whitehouse MR, Lankester BJ, Winson IG, Hepple S. Bone graft harvest from the proximal tibia in foot and ankle arthrodesis surgery. Foot Ankle Int. 2006;27(11):913-916.
14. Scharfenberger A, Weber T. RIA for bone graft harvest: applications for grafting large segmental defects in the tibia and femur. Presented at: 21st Annual Meeting of the Orthopaedic Trauma Association; 2005; Ottawa, Canada.
15. Arrington ED, Smith WJ, Chambers HG, Bucknell AL, Davino NA. Complications of iliac crest bone graft harvesting. Clin Orthop. 1996;(329):300-309.
16. Bedi A, Karunakar MA. Physiologic effects of intramedullary reaming. Instr Course Lect. 2006;55:359-366.
17. Higgins TF, Casey V, Bachus K. Cortical heat generation using an irrigating/aspirating single-pass reaming vs conventional stepwise reaming. J Orthop Trauma. 2007;21(3):192-197.
18. Husebye EE, Lyberg T, Madsen JE, Eriksen M, Røise O. The influence of a one-step reamer-irrigator-aspirator technique on the intramedullary pressure in the pig femur. Injury. 2006;37(10):935-940.
19. Müller CA, Green J, Südkamp NP. Physical and technical aspects of intramedullary reaming. Injury. 2006;37(suppl 4):S39-S49.
20. Pape HC, Dwenger A, Grotz M, et al. Does the reamer type influence the degree of lung dysfunction after femoral nailing following severe trauma? An animal study. J Orthop Trauma. 1994;8(4):300-309.
21. Pape HC, Zelle BA, Hildebrand F, Giannoudis PV, Krettek C, van Griensven M. Reamed femoral nailing in sheep: does irrigation and aspiration of intramedullary contents alter the systemic response? J Bone Joint Surg Am. 2005;87(11):2515-2522.
22. Schult M, Küchle R, Hofmann A, et al. Pathophysiological advantages of rinsing-suction-reaming (RSR) in a pig model for intramedullary nailing. J Orthop Res. 2006;24(6):1186-1192.
23. Pratt DJ, Papagiannopoulos G, Rees PH, Quinnell R. The effects of medullary reaming on the torsional strength of the femur. Injury. 1987;18(3):177-179.
24. Kovar FM, Wozasek GE. Bone graft harvesting using the RIA (reamer irrigation aspirator) system—a quantitative assessment. Wien Klin Wochenschr. 2011;123(9-10):285-290.
The Reamer/Irrigator/Aspirator (RIA) system (Synthes, West Chester, Pennsylvania) has become a powerful tool for harvesting autologous bone graft from the intramedullary canal of the long bones of the lower extremity for the treatment of osseous defects, nonunions, and joint fusions.1,2 The RIA system provides satisfactory quality and quantity of bone graft (range, 40-90 mL)3-5 with osteogenic properties that rival those harvested from the iliac crest.6,7 Minimal donor-site morbidity and mortality have been reported in association with the RIA technique compared with iliac crest bone graft harvest.8
The RIA technique for the femur—with the antegrade approach and the supine position,8 with the antegrade approach and the prone position,9 and with the retrograde approach and the supine position4—has been described in the literature. To our knowledge, however, the RIA technique for the femur with the retrograde approach and the prone position has not been described. Antegrade harvesting uses the trochanteric entry point, and retrograde harvesting uses an entry at the intercondylar notch just anterior to the posterior cruciate ligament. In this article, we detail the technique for RIA harvesting of the femur with the patient in the prone position. Patient positioning is based on the diagnosis and the proposed procedure.
Advantages of a retrograde starting point include a more concentric trajectory (vs that of an antegrade starting point) and more efficient canal pressure reduction, which might decrease the risk of intraoperative fat embolization.10 This technique offers a more efficient solution to any procedure that requires the prone position, and it avoids the need to reposition, reprepare, or redrape the extremity. It is also very useful in treating obese patients.
After obtaining institutional review board (IRB) approval, we retrospectively reviewed patient files. Because the study was retrospective, the IRB waived the requirement for informed consent. The patients described here provided written informed consent for print and electronic publication of these case reports.
Surgical Technique
The patient is placed in a prone position on a radiolucent table with a bump under the thigh to allow access to the knee joint with full extension of the hip (Figures 1, 2A, 2B). The knee is then flexed to gain access to the intercondylar notch.
The anatomical axis of the femur is identified in the coronal and sagittal planes with the help of an image intensifier. Frequent intraoperative fluoroscopic imaging is required to prevent eccentric reaming and guide-wire movement from causing iatrogenic fractures and perforations, respectively.8 A 2-mm Steinmann pin is used to identify the point of entry into the femoral canal, which is located just above the posterior cruciate ligament insertion in the intercondylar notch, and care is taken not to ream this structure. A minimally invasive incision of about 15 mm is centered on this pin using a patellar tendon–splitting approach.
An 8-mm cannulated anterior cruciate ligament reamer is passed over the pin to enlarge the opening at the entry point, and a 2.5-mm ball-tipped guide wire is positioned in the femur. The image intensifier is used to confirm positioning of the guide in the trochanteric region and centered in the intramedullary canal. A radiolucent diving board facilitates fluoroscopic imaging.
The diameter (12.5 or 16.5 mm) of the reaming head is selected after the intramedullary guide is placed in the femoral canal. The isthmus of the femur is then identified radiographically, and a radiopaque ruler with increments in millimeters is used to measure the canal diameter (Figures 3A, 3B). Because the femoral canal is an ellipsoid, the canal diameter usually is much larger anteroposteriorly than laterally.8 We prefer to use a reaming head that overlaps the inner cortical diameter by 1 mm on each side. An alternative method includes measuring the outer diameter of the narrowest portion of the bone and using a reamer head no more than 45% of the outer diameter at the isthmus.8
The RIA system is prepared on the back table by attaching the reaming head to the irrigation and suction systems. As the reamer head enters the intramedullary canal, an approach–withdraw–pause technique is used to slowly advance the reamer through the femur. It is crucial to use the image intensifier to guide reaming in order to avoid overdrilling the anterior cortex and prevent eccentric reaming of the canal, which more commonly occurs in patients with large anterior femoral bows.11 When the collection filter becomes full, reaming is stopped. The bone graft in the filter is emptied into a specimen cup for measurement and storage until subsequent use (Figure 4). Suctioning is suspended when reaming is stopped because substantial blood loss can occur with prolonged suction and aspiration.12 When repeat reaming is required, care is taken not to overream the cortices, thereby avoiding the risk of iatrogenic fracture.10,12
The knee joint is irrigated to remove any intramedullary debris. Typically there is no debris, as it is captured by the RIA. The wound is closed in 2 layers. Dressing with Ace bandage (3M, St. Paul, Minnesota) is placed around the knee for comfort. Weight-bearing status is determined by the index procedure.
Case Reports
Case 1
A 68-year-old female smoker presented to our facility with right ankle pain after recent ankle arthrodesis for pilon fracture nonunion. Almost 3 years earlier, the patient sustained a Gustilo-Anderson type II open pilon fracture in a motorcycle accident. She underwent antibiotic therapy, irrigation and débridement of the fracture site, and external fixation before definitive treatment with repeat irrigation and débridement and open reduction and internal fixation of the tibial plafond. About 6 months after surgery, she presented to her surgeon with a draining abscess over the anteromedial surgical incision. Multiple débridement procedures were performed, the implant was removed, the ankle was stabilized with a bridging external fixator, and culture-specific antibiotic therapy was administered. Intraoperative cultures confirmed methicillin-resistant Staphylococcus aureus. Vancomycin was administered intravenously for 6 weeks. Once C-reactive protein level and erythrocyte sedimentation rate returned to normal, repeat débridement with a rectus abdominis free flap and ankle fusion were performed.
When the patient presented to our clinic, we saw atrophic nonunion of the ankle fusion on radiographs. Smoking cessation was encouraged but not required before surgery. The patient returned to the operating suite for tibiotalocalcaneal fusion with a retrograde intramedullary nail. With the patient in the prone position, retrograde femoral RIA reaming was performed to harvest 30 mL of autologous bone. After resection of the nonunion site using a trans-Achilles approach and insertion of the intramedullary nail, the autologous bone graft was mixed with recombinant human bone morphogenetic protein 2 (BMP-2), and the mixture was introduced into the fusion site. At final follow-up, 18 months after surgery, the patient was clinically asymptomatic and radiographically healed—without further intervention and despite continued smoking. She did not report any knee pain from the harvest site.
Case 2
A 59-year-old noncompliant woman with diabetes and Charcot neuropathy sustained a trimalleolar ankle fracture-dislocation that was initially treated with ankle and hindfoot arthrodesis. The postoperative course was uneventful, and she was discharged home. Less than a week later, she presented to the emergency department with a midshaft tibial fracture just proximal to the ankle and hindfoot fusion nail. She subsequently had the device removed and a long arthrodesis rod inserted to span the fracture site up to the proximal tibial metadiaphysis. About 9 months later, she returned to our office complaining of ankle pain. No signs of infection were clinically evident. Radiographs showed nonunion of the ankle and subtalar joint. Findings of the initial bone biopsy and pathologic examination were negative for infection. The patient returned to the operating room 4 weeks later for revision ankle fusion. With the patient in the prone position, autologous bone (~30 mL) was harvested using retrograde femoral RIA reaming. The nonunion site was resected, and a mixture of autologous bone graft and BMP-2 was applied. Through a posterior approach, an anterior ankle arthrodesis locking plate was applied to the posterior aspect of the calcaneus and tibia. The patient was kept non-weight-bearing for 3 months and progressed in weight-bearing for another 4 to 6 weeks. Ambulatory status was restored about 4 months after surgery. No harvest-site knee pain was reported.
Discussion
Given its osteogenic, osteoconductive, and osteoinductive properties, autologous cancellous bone graft is the gold standard for reconstruction and fusion procedures in foot and ankle surgery.13 Bone graft can be obtained from many potential donor sites, but the most common is the iliac crest.2 However, many comorbidities, such as residual donor-site pain, neurovascular injuries, infection, and increased surgical time, have been reported in the literature.14,15 The RIA system was initially developed for simultaneous reaming and aspiration to reduce intramedullary pressure, heat generation, operating time, and the systemic effects of reaming, such as the embolic phenomenon.16-22 The single-pass reamer has provided a minimally invasive strategy for procuring voluminous amounts of autologous cancellous bone from the intramedullary canal of lower extremity long bones. Schmidmaier and colleagues3 recently quantified the measurements of several growth factors, such as insulinlike growth factor 1, transforming growth factor β 1, and BMP-2—proving that RIA-derived aspirates have amounts comparable to if not larger than those of iliac crest autologous bone graft. Pratt and colleagues23 provided insight into the possibility of induction of mesenchymal stem cells using the previously unwanted supernatant reamings after filtration. Recently, the RIA technique of autologous tibial and hindfoot bone graft harvest was described for use in ankle or tibiotalocalcaneal arthrodesis.2 Although this technique is a useful surgical option, tibia size remains a limiting factor. Kovar and Wozasek24 reported harvesting significantly more bone graft in the femur than in the tibia. A tibia that cannot accommodate the 12-mm (smallest) reamer head in the RIA system would be a contraindication. In addition, concerns about the association between tibial stress fractures and reaming of the entire tibial canal and concerns about the overall donor-site morbidity of the tibial shaft remain.
Conclusion
With its retrograde approach and prone positioning, this RIA technique is an effective and efficient solution for harvesting autologous femoral bone graft. Although we have described its use in ankle and hindfoot arthrodesis, this technique can be applied to any prone-position surgical procedure, including spine surgery.
1. Kobbe P, Tarkin IS, Frink M, Pape HC. Voluminous bone graft harvesting of the femoral marrow cavity for autologous transplantation. An indication for the “reamer-irrigator-aspirator-” (RIA-)technique [in German]. Unfallchirurg. 2008;111(6):469-472.
2. Herscovici D Jr, Scaduto JM. Use of the reamer-irrigator-aspirator technique to obtain autograft for ankle and hindfoot arthrodesis. J Bone Joint Surg Br. 2012;94(1):75-79.
3. Schmidmaier G, Herrmann S, Green J, et al. Quantitative assessment of growth factors in reaming aspirate, iliac crest, and platelet preparation. Bone. 2006;39(5):1156-1163.
4. Qvick LM, Ritter CA, Mutty CE, Rohrbacher BJ, Buyea CM, Anders MJ. Donor site morbidity with reamer-irrigator-aspirator (RIA) use for autogenous bone graft harvesting in a single centre 204 case series. Injury. 2013;44(10):1263-1269.
5. Lehman AA, Irgit KS, Cush GJ. Harvest of autogenous bone graft using reamer-irrigator-aspirator in tibiotalocalcaneal arthrodesis: surgical technique and case series. Foot Ankle Int. 2012;33(12):1133-1138.
6. Wildemann B, Kadow-Romacker A, Haas NP, Schmidmaier G. Quantification of various growth factors in different demineralized bone matrix preparations. J Biomed Mater Res A. 2007;81(2):437-442.
7. Sagi HC, Young ML, Gerstenfeld L, Einhorn TA, Tornetta P. Qualitative and quantitative differences between bone graft obtained from the medullary canal (with a reamer/irrigator/aspirator) and the iliac crest of the same patient. J Bone Joint Surg Am. 2012;94(23):2128-2135.
8. Belthur MV, Conway JD, Jindal G, Ranade A, Herzenberg JE. Bone graft harvest using a new intramedullary system. Clin Orthop. 2008;466(12):2973-2980.
9. Nichols TA, Sagi HC, Weber TG, Guiot BH. An alternative source of autograft bone for spinal fusion: the femur: technical case report. Neurosurgery. 2008;62(3 suppl 1):E179.
10. Van Gorp CC, Falk JV, Kmiec SJ Jr, Siston RA. The reamer/irrigator/aspirator reduces femoral canal pressure in simulated TKA. Clin Orthop. 2009;467(3):805-809.
11. Quintero AJ, Tarkin IS, Pape HC. Technical tricks when using the reamer irrigator aspirator technique for autologous bone graft harvesting. J Orthop Trauma. 2010;24(1):42-45.
12. Stafford PR, Norris B. Reamer-irrigator-aspirator as a bone graft harvester. Tech Foot Ankle Surg. 2007;6(2):100-107.
13. Whitehouse MR, Lankester BJ, Winson IG, Hepple S. Bone graft harvest from the proximal tibia in foot and ankle arthrodesis surgery. Foot Ankle Int. 2006;27(11):913-916.
14. Scharfenberger A, Weber T. RIA for bone graft harvest: applications for grafting large segmental defects in the tibia and femur. Presented at: 21st Annual Meeting of the Orthopaedic Trauma Association; 2005; Ottawa, Canada.
15. Arrington ED, Smith WJ, Chambers HG, Bucknell AL, Davino NA. Complications of iliac crest bone graft harvesting. Clin Orthop. 1996;(329):300-309.
16. Bedi A, Karunakar MA. Physiologic effects of intramedullary reaming. Instr Course Lect. 2006;55:359-366.
17. Higgins TF, Casey V, Bachus K. Cortical heat generation using an irrigating/aspirating single-pass reaming vs conventional stepwise reaming. J Orthop Trauma. 2007;21(3):192-197.
18. Husebye EE, Lyberg T, Madsen JE, Eriksen M, Røise O. The influence of a one-step reamer-irrigator-aspirator technique on the intramedullary pressure in the pig femur. Injury. 2006;37(10):935-940.
19. Müller CA, Green J, Südkamp NP. Physical and technical aspects of intramedullary reaming. Injury. 2006;37(suppl 4):S39-S49.
20. Pape HC, Dwenger A, Grotz M, et al. Does the reamer type influence the degree of lung dysfunction after femoral nailing following severe trauma? An animal study. J Orthop Trauma. 1994;8(4):300-309.
21. Pape HC, Zelle BA, Hildebrand F, Giannoudis PV, Krettek C, van Griensven M. Reamed femoral nailing in sheep: does irrigation and aspiration of intramedullary contents alter the systemic response? J Bone Joint Surg Am. 2005;87(11):2515-2522.
22. Schult M, Küchle R, Hofmann A, et al. Pathophysiological advantages of rinsing-suction-reaming (RSR) in a pig model for intramedullary nailing. J Orthop Res. 2006;24(6):1186-1192.
23. Pratt DJ, Papagiannopoulos G, Rees PH, Quinnell R. The effects of medullary reaming on the torsional strength of the femur. Injury. 1987;18(3):177-179.
24. Kovar FM, Wozasek GE. Bone graft harvesting using the RIA (reamer irrigation aspirator) system—a quantitative assessment. Wien Klin Wochenschr. 2011;123(9-10):285-290.
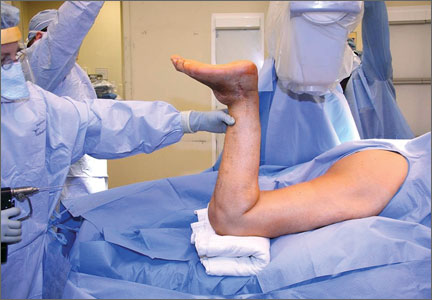
Emerging Biologics in Orthopedics
The discipline of orthopedic medicine and surgery has dramatically advanced over the last several decades. Improved understanding of biomechanics, tissue healing, and the pathogenesis of musculoskeletal diseases has allowed us to make significant progress in the diagnosis, treatment, and rehabilitation of our patients. Despite these advancements, there is still much to be learned, especially in the field of orthobiologics and regenerative medicine. As our understanding of existing technologies, such as bone marrow aspirate, platelet-rich plasma, and adult stem cells, continues to evolve, even newer biologic treatment options are being developed. This issue of The American Journal of Orthopedics focuses on emerging biologics across the spectrum of orthopedic care.
In this issue, on pages 202-205, Mansour and Conway describe a new prone retrograde technique for obtaining bone graft using the Reamer/Irrigator/Aspirator (RIA) system (Synthes, West Chester, Pennsylvania). While iliac crest bone graft has been the gold standard for many years, use of the RIA system to obtain bone graft has been studied and has been shown to have decreased morbidity when compared with iliac crest harvest.1 Additionally, intramedullary bone graft from the femur appears to be just as concentrated with biologically active bone marrow as iliac crest harvest.2 This new technique allows increased efficiency, especially for surgeries that are done in the prone position.
Melamed and colleagues examine a new biologic to augment repair of rotator cuff tears (see pages 212-216). Chitosan, a linear polysaccharide, has been shown to help with soft-tissue healing. Although in the past its use has been limited secondary to problems with the compound precipitating at physiologic pH, new formulations mitigate that problem. In the authors’ animal model of acute supraspinatus repair, the use of chitosan gel increased the number of fibroblasts and the amount of repair tissue when compared with untreated controls. Additionally, the experimental group showed a decreased inflammatory response when compared with the control group. This is very exciting research as the biologic enhancement of rotator cuff tendon healing could potentially help decrease the rate of rotator cuff repair failure.
Lenehan and colleagues analyze the long-term outcomes of anterior cruciate ligament reconstruction in a cohort of patients studied over an 8-year period (see pages 217-222). During this period, 99 patients were reconstructed with allograft tissue and 24 with autograft. Their analysis, like other recently published work, shows that the rates of revision were much higher for patients under 25 years of age who were reconstructed using allograft tissue. The rate of revision for NCAA (National Collegiate Athletic Association) Division I athletes reconstructed with allograft tissue was found to be 62%, while the revision rate for all patients under the age of 25 years who received an allograft was found to be 20.5%. Clearly, there is still a great deal to learn about the biology of graft incorporation and healing, especially as it relates to allograft tissue.
These 3 articles exemplify the breadth of orthopedic biologics and their potential role in orthopedic surgery. Through efforts of investigators highlighted in this journal and in others, biologics will become better understood and more widely used when appropriate, leading to improved patient outcomes.
1. Calori GM, Colombo M, Mazza EL, Mazzola S, Malagoli E, Mineo GV. Incidence of donor site morbidity following harvesting from iliac crest or RIA graft. Injury. 2014;45 Suppl 6:S116-S120.
2. van der Bel R, Blokhuis TJ. Increased osteogenic capacity of Reamer/Irrigator/Aspirator derived mesenchymal stem cells. Injury. 2014;45(12):2060-2064.
The discipline of orthopedic medicine and surgery has dramatically advanced over the last several decades. Improved understanding of biomechanics, tissue healing, and the pathogenesis of musculoskeletal diseases has allowed us to make significant progress in the diagnosis, treatment, and rehabilitation of our patients. Despite these advancements, there is still much to be learned, especially in the field of orthobiologics and regenerative medicine. As our understanding of existing technologies, such as bone marrow aspirate, platelet-rich plasma, and adult stem cells, continues to evolve, even newer biologic treatment options are being developed. This issue of The American Journal of Orthopedics focuses on emerging biologics across the spectrum of orthopedic care.
In this issue, on pages 202-205, Mansour and Conway describe a new prone retrograde technique for obtaining bone graft using the Reamer/Irrigator/Aspirator (RIA) system (Synthes, West Chester, Pennsylvania). While iliac crest bone graft has been the gold standard for many years, use of the RIA system to obtain bone graft has been studied and has been shown to have decreased morbidity when compared with iliac crest harvest.1 Additionally, intramedullary bone graft from the femur appears to be just as concentrated with biologically active bone marrow as iliac crest harvest.2 This new technique allows increased efficiency, especially for surgeries that are done in the prone position.
Melamed and colleagues examine a new biologic to augment repair of rotator cuff tears (see pages 212-216). Chitosan, a linear polysaccharide, has been shown to help with soft-tissue healing. Although in the past its use has been limited secondary to problems with the compound precipitating at physiologic pH, new formulations mitigate that problem. In the authors’ animal model of acute supraspinatus repair, the use of chitosan gel increased the number of fibroblasts and the amount of repair tissue when compared with untreated controls. Additionally, the experimental group showed a decreased inflammatory response when compared with the control group. This is very exciting research as the biologic enhancement of rotator cuff tendon healing could potentially help decrease the rate of rotator cuff repair failure.
Lenehan and colleagues analyze the long-term outcomes of anterior cruciate ligament reconstruction in a cohort of patients studied over an 8-year period (see pages 217-222). During this period, 99 patients were reconstructed with allograft tissue and 24 with autograft. Their analysis, like other recently published work, shows that the rates of revision were much higher for patients under 25 years of age who were reconstructed using allograft tissue. The rate of revision for NCAA (National Collegiate Athletic Association) Division I athletes reconstructed with allograft tissue was found to be 62%, while the revision rate for all patients under the age of 25 years who received an allograft was found to be 20.5%. Clearly, there is still a great deal to learn about the biology of graft incorporation and healing, especially as it relates to allograft tissue.
These 3 articles exemplify the breadth of orthopedic biologics and their potential role in orthopedic surgery. Through efforts of investigators highlighted in this journal and in others, biologics will become better understood and more widely used when appropriate, leading to improved patient outcomes.
1. Calori GM, Colombo M, Mazza EL, Mazzola S, Malagoli E, Mineo GV. Incidence of donor site morbidity following harvesting from iliac crest or RIA graft. Injury. 2014;45 Suppl 6:S116-S120.
2. van der Bel R, Blokhuis TJ. Increased osteogenic capacity of Reamer/Irrigator/Aspirator derived mesenchymal stem cells. Injury. 2014;45(12):2060-2064.

Epigenomic findings may help predict relapse in DLBCL

Photo by Rhoda Baer
Epigenomic heterogeneity at diagnosis may predict relapse in diffuse large B-cell lymphoma (DLBCL), according to research published in Nature Communications.
Investigators made this connection by reviewing biopsies taken from DLBCL patients before and after treatment.
The epigenome in these patients’ cancer cells changed greatly after treatment, and the global epigenome of pretreatment biopsies was substantially different in patients who relapsed and those who did not. There was more cell-to-cell heterogeneity in patients who relapsed.
“This is the first study I know of in cancer that looks at changes in the epigenome before and after treatment, and what we found could ultimately make traditional treatments much more effective,” said study author Olivier Elemento, PhD, of Weill Cornell Medical College in New York, New York.
To uncover the role of epigenetic involvement in DLBCL, Dr Elemento and his colleagues analyzed banked biopsies from patients. In each sample set, the investigators looked at sites in the epigenome where a methyl group was added or removed after DLBCL recurred.
They found a change in methylation that occurred between 39,808 and 1,035,960 specific methylation sites, depending on the sample. In addition, they identified between 78 and 13,162 differently methylated regions in the epigenome in relapsed disease.
“These are massive changes, given that the epigenome has 20 million methylation sites,” Dr Elemento said. “Our study shows that, in some cases, up to one-twentieth of the entire epigenome is changed after treatment. There are many more epigenetic changes than there are altered genes in DLBCL.”
“Once you have changes in methylation, the end result is an imbalanced expression of proteins,” added Giorgio Inghirami, MD, also of Weill Cornell.
“The tumor after chemotherapy is not the same as the tumor before treatment. This why it is so critical to have biopsies before any treatment of [primary or relapsed] lesions.”
The investigators hope this work will ultimately allow clinicians and researchers to predict treatment resistance in individual patients. ![]()
Measures improve use of VTE prophylaxis

Photo courtesy of CDC
Programs that give physicians real-time feedback and financial incentives may lead to improvements in hospital safety, according to a study published in the Journal of Hospital Medicine.
The study showed that hospitalists significantly improved their compliance with practice guidelines for preventing venous thromboembolism (VTE)
when they could get feedback on their compliance rates and a direct financial incentive for improving their performance.
“Our study confirms there is a real return on investment in such programs, not only for patient safety but also for hospitals,” said study author Henry Michtalik, MD, of Johns Hopkins Hospital in Baltimore, Maryland.
“Metrics such as the use of preventive drugs for [VTE] are already being monitored but only really improve a hospital’s quality of care when programs get data back to the people who are treating patients to directly improve care.”
Dr Michtalik and his team found that, by providing such information to physicians through web-based, real-time displays, monthly VTE prophylaxis compliance rates improved from 86% to 90% in 6 months.
Adding pay-for-performance to the real-time feedback for the following 18 months boosted compliance rates to 94%.
Dr Michtalik pointed out that “no one got wealthy off of the pay-for-performance program. Instead, we believe the money served more as a method to engage the providers.”
Payments ranged from $53 to $1244, with all but 2 of the incentive payments totaling under $1000. And it was during the 6-month feedback-only period that compliance rose the fastest.
The study involved 38 part-time and full-time academic hospitalists and the analysis of 3144 inpatients with a median stay of 3 days. The most common diagnoses were heart failure, acute kidney failure, temporary loss of consciousness (syncope), pneumonia, and chest pain.
Following the evidence-based guidelines of the American College of Chest Physicians for VTE prevention, physicians in the study were required to complete a VTE-risk assessment for each patient by using the hospital’s computerized provider order entry system.
“It sort of walks you through the thinking process” for making the VTE-risk assessment, Dr Michtalik said.
The system then prompted physicians with a risk-appropriate recommendation, but it was up to physicians to order the treatment itself. That allowed for physician discretion among types of prevention, as well as for patient and physician preference.
Before implementing the feedback system, the researchers established a 2-year baseline and found that physicians in the study prescribed inappropriate prophylaxis 7.9% of the time and did not prescribe prophylaxis when indicated 6.1% of the time.
Overall, the choice of inappropriate preventive treatment dropped to 6.2% with real-time feedback and to 2.6% with the addition of pay-for-performance. Lack of prophylaxis when indicated fell to 3.2% with feedback and to 3.1% with pay-for-performance.
Dr Michtalik noted that continuous improvements depend not only on the right kind of feedback but also on efforts to avoid “information overload,” especially now that an increasing amount of health and medical records are electronic.
“So you specifically target a few things that need to be improved,” he said, “and really incorporate them into the hospital’s culture.” ![]()