User login
PET tracer allows for whole-body thrombus detection
Image by Andre E.X. Brown
BALTIMORE—Scientists say they have synthesized an imaging agent that allows them to detect blood clots throughout the body and estimate the fibrin content of those clots.
In murine experiments, the fibrin-specific PET probe FBP8 detected arterial and venous thrombi with high accuracy.
The tracer also proved sensitive to changes in the fibrin content of clots, which correlated with their age.
Francesco Blasi, PhD, of Massachusetts General Hospital in Charlestown, presented these findings at the 2015 SNMMI Annual Meeting (abstract 78).
Dr Blasi and his colleagues synthesized FBP8 by conjugating a short cyclic peptide with high affinity for fibrin to a macrocyclic chelator (NODAGA) and labeling it with 64Cu.
The researchers then performed FBP8-PET 1, 3, or 7 days after inducing thrombosis in 30 Sprague-Dawley rats (by applying ferric chloride on the carotid artery and femoral vein). The team also performed FBP8-PET in an animal model of deep vein thrombosis and pulmonary embolism.
FBP8-PET was more than 97% accurate for pinpointing arterial and venous thrombi in the rats. It also detected lung and venous thrombi in the model of deep vein thrombosis and pulmonary embolism. And probe uptake was significantly greater in fresh blood clots than in older ones (P<0.01).
“If approved, fibrin-specific PET could facilitate diagnosis, guide therapeutic choices, and help physicians monitor their patients’ treatment,” said study investigator Peter Caravan, PhD, of Massachusetts General Hospital.
“This technique also offers full-body detection of thrombi with a single injection of probe, instead of the current imaging standards, which are limited to specific parts of the body. A one-time, whole-body scan could prevent unnecessary procedures and uncover hidden thrombi before they generate a deadly embolism.”
Contingent on approval by the US Food and Drug Administration, the researchers expect to conduct a first-in-human study of FBP8-PET as soon as this fall. ![]()
Mylan recalls gemcitabine, methotrexate

Photo by Bill Branson
Mylan N.V. is conducting a US-wide recall of injectable products due to the presence of visible foreign particulate matter observed in retention samples.
This voluntary recall includes select lots of gemcitabine and a single lot of methotrexate.
Although administration of a sterile injectable containing foreign particulates can cause severe health consequences, Mylan has not received any reports of adverse events related to this recall.
The recall includes the following products:
Gemcitabine for Injection, USP 200 mg; Package size: 10 mL; NDC number: 0069-3857-10; Lot number: 7801084; Expiration date: 07/2015
Gemcitabine for Injection, USP 200 mg; Package size: 10 mL; NDC number: 0069-3857-10; Lot number: 7801110; Expiration date: 08/2015
Gemcitabine for Injection, USP 2 g; Package size: 100 mL; NDC number: 67457-463-02; Lot number: 7801221; Expiration date: 03/2016
Gemcitabine for Injection, USP 200 mg; Package size: 10 mL; NDC number: 67457-464-20; Lot number: 7801398; Expiration date: 08/2016
Gemcitabine for Injection, USP 200 mg; Package size: 10 mL; NDC number: 67457-464-20; Lot number: 7801406; Expiration date: 08/2016
Gemcitabine for Injection, USP 200 mg; Package size: 10 mL; NDC number: 67457-464-20; Lot number: 7801427; Expiration date: 09/2016
Gemcitabine for Injection, USP 1 g; Package size: 50 mL; NDC number: 67457-462-01; Lot number: 7801284; Expiration date: 05/2016
Methotrexate Injection, USP 50 mg/2 mL (25 mg/mL); Package size: 5 x 2 mL; NDC number: 67457-467-99; Lot number: 7801421; Expiration date: 09/2016
Gemcitabine for Injection, USP is an intravenously administered product indicated for the treatment of ovarian cancer, breast cancer, non-small cell lung cancer, and pancreatic cancer. These lots were distributed in the US between January 8, 2014, and February 10, 2015. They were manufactured and packaged by Agila Onco Therapies Limited, a Mylan company. Lot 7801084 and 7801110 are packaged with a Pfizer Injectable label.
Methotrexate Injection, USP 25 mg/mL can be administered intramuscularly, intravenously, intra-arterially, or intrathecally and is indicated for certain neoplastic diseases, severe psoriasis, and adult rheumatoid arthritis. The lot was distributed in the US between December 8, 2014, and December 19, 2014, and was packaged by Agila Onco Therapies Limited, a Mylan company.
Mylan is notifying its distributors and customers by letter and is arranging for the return of all recalled products. Distributors, retailers, hospitals, clinics, and physicians with products included in this recall should stop use and return the products to the place of purchase.
Consumers with questions regarding this recall can contact Mylan Customer Relations at 800-796-9526 or [email protected], Monday through Friday from 8 am to 5 pm EST. Consumers should contact their physician or healthcare provider if they have experienced any problems that may be related to using these products.
Adverse reactions or quality problems experienced with the use of this product may be reported to the US Food and Drug Administration’s MedWatch Adverse Event Reporting Program. ![]()
Black Salve and Bloodroot Extract in Dermatologic Conditions
Black salve is composed of various ingredients, many of which are inert; however, some black salves contain escharotics, the 2 most common are zinc chloride and bloodroot (Sanguinaria canadensis) extract. In high doses, such as those contained in most black salve products, these corrosive agents can indiscriminately damage both healthy and diseased tissue.1 Nevertheless, many black salve products currently are advertised as safe and natural methods for curing skin cancer2-4 or treating a variety of other skin conditions (eg, moles, warts, skin tags, boils, abscesses, bee stings, other minor wounds)1,5 and even nondermatologic conditions such as a sore throat.6 Despite the information and testimonials that are widely available on the Internet, black salve use has not been validated by rigorous studies. Black salve is not regulated by the US Food and Drug Administration, resulting in poor quality control and inconsistent user instructions. We report the case of application of black salve to a biopsy site of a compound nevus with moderate atypia that resulted in the formation of a dermatitis plaque with subsequent scarring and basal layer pigmentation.
Case Report
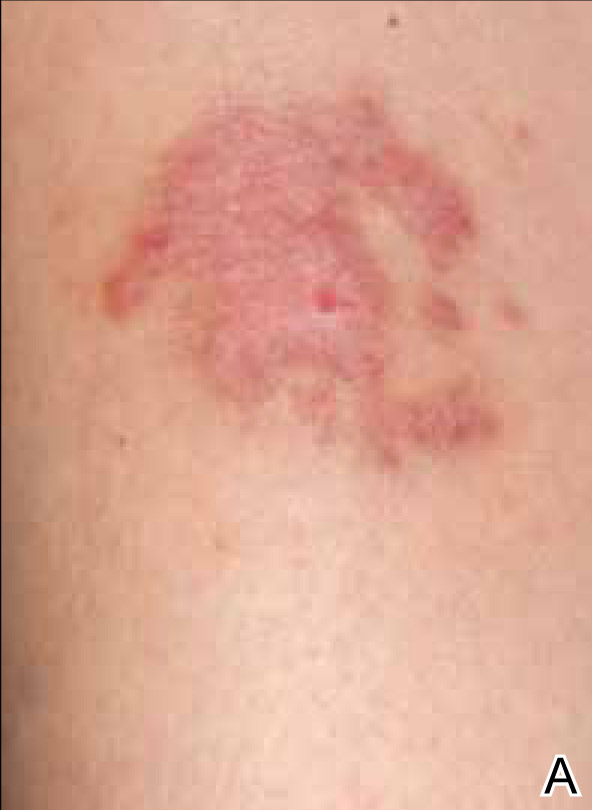
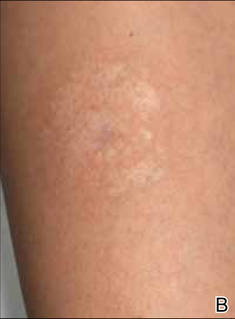
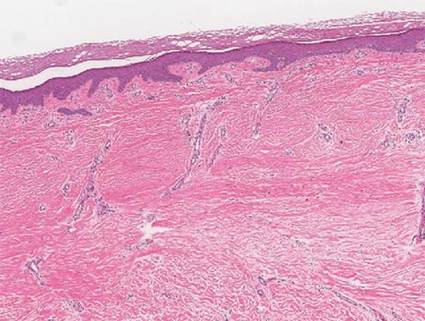
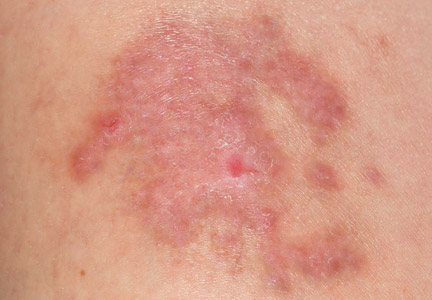
A 35-year-old woman with a family history of melanoma presented for follow-up of a compound nevus with moderate atypia on the right anterior thigh that had been biopsied 6 months prior. Complete excision of the lesion was recommended at the initial presentation but was not performed due to scheduling conflicts. The patient reported applying black salve to the biopsy site and also to the left thigh 3 months later. There was no reaction on the left thigh after one 24-hour application of black salve, but an area around the biopsy site on the right thigh became thickened and irritated with superficial erosion of the skin following 2 applications of black salve, each of 24 hours’ duration. Physical examination revealed a granulomatous plaque at the biopsy site that was approximately 5 cm in diameter (Figure 1A). One year later the lesion had completely healed (Figure 1B) and a biopsy revealed scarring with basal layer pigmentation (Figure 2).
| 
| 
| |||
| Figure 1. A 5-cm granulomatous reaction surrounding a biopsy site on the right anterior thigh 3 months after application of black salve (A). One year later, the lesion had completely healed (B). | Figure 2. A biopsy one year following application of black salve demonstrated scarring with basal layer pigmentation (H&E, original magnification ×4). | ||||
Comment
A Web search using the term black salve yields a large number of products labeled as skin cancer salves, many showing glowing reviews and some being sold by major US retailers. The ingredients in black salves often vary in the innocuous substances they contain, but most products include the escharotics zinc chloride and bloodroot extract, which is derived from the plant S canadensis.1,3 For example, the ingredients of one popular black salve product include zinc chloride, chaparral (active ingredient is nordihydroguaiaretic acid), graviola leaf extract, oleander leaf extract, bloodroot extract, and glycerine,7 while another product includes bloodroot extract, zinc chloride, chaparral, cayenne pepper, red clover, birch bark, dimethyl sulfoxide, and burdock root.4
Bloodroot extract’s antimicrobial, anti-inflammatory, antioxidant, and immunomodulatory effects derive from its benzylisoquinoline alkaloids including sanguinarine, allocryptopine, berberine, coptisine, protopine, and stylopine.3,8 Bloodroot extract possesses some degree of tumoricidal potency, with one study finding that it selectively targets cancer cells.9 However, this differential response is seen only at low doses and not at the high concentrations contained in most black salve products.1 According to fluorometric assays, sanguinarine is not selective for tumor cells and therefore damages healthy tissue in addition to the unwanted lesions.6,10,11 The US Food and Drug Administration includes black salve products on its list of fake cancer cures that consumers should avoid.12 Reports of extensive damage from black salve use include skin ulceration2,10 and complete loss of a naris1 and nasal ala.5 Our case suggests the possible association between black salve use and an irritant reaction and erosion of the skin.
Furthermore, reliance on black salve alone in the treatment of skin cancer poses the threat of recurrence or metastasis of cancer because there is no way to know if the salve completely removed the cancer without a biopsy. Self-treatment can delay more effective therapy and may require further treatments.
Black salve should be subject to standarddrug regulations and its use discouraged by dermatologists due to the associated harmful effects and the availability of safer treatments. To better treat and inform their patients, dermatologists should be aware that patients may be attracted to alternative treatments such as black salves.
1. Eastman KL, McFarland LV, Raugi GJ. A review of topical corrosive black salve. J Altern Complement Med. 2014;20:284-289.
2. Eastman KL, McFarland LV, Raugi GJ. Buyer beware: a black salve caution. J Am Acad Dermatol. 2011;65:e154-e155.
3. Sivyer GW, Rosendahl C. Application of black salve to a thin melanoma that subsequently progressed to metastatic melanoma: a case study. Dermatol Pract Concept. 2014;4:77-80.
4. McDaniel S, Goldman GD. Consequences of using escharotic agents as primary treatment for nonmelanoma skin cancer. Arch Dermatol. 2002;138:1593-1596.
5. Payne CE. ‘Black Salve’ and melanomas [published online ahead of print August 11, 2010]. J Plast Reconstr Aesthet Surg. 2011;64:422.
6. Cienki JJ, Zaret L. An Internet misadventure: bloodroot salve toxicity. J Altern Complement Med. 2010;16:1125-1127.
7. Cansema and escharotics. Alpha Omega Labs Web site. http://www.altcancer.com/faqcan.htm. Accessed May 6, 2015.
8. Vlachojannis C, Magora F, Chrubasik S. Rise and fall of oral health products with Canadian bloodroot extract. Phytother Res. 2012;26:1423-1426.
9. Ahmad N, Gupta S, Husain MM, et al. Differential antiproliferative and apoptotic response of sanguinarine for cancer cells versus normal cells. Clin Cancer Res. 2000;6:1524-1528.
10. Saltzberg F, Barron G, Fenske N. Deforming self-treatment with herbal “black salve.” Dermatol Surg. 2009;35:1152-1154.
11. Debiton E, Madelmont JC, Legault J, et al. Sanguinarine-induced apoptosis is associated with an early and severe cellular glutathione depletion. Cancer Chemother Pharmacol. 2003;51:474-482.
12. 187 fake cancer “cures” consumers should avoid. US Food and Drug Administration Web site. http://www.fda.gov/Drugs/GuidanceCompliance RegulatoryInformation/EnforcementActivitiesbyFDA/ucm171057.htm. Updated July 9, 2009. Accessed May 6, 2015.
Black salve is composed of various ingredients, many of which are inert; however, some black salves contain escharotics, the 2 most common are zinc chloride and bloodroot (Sanguinaria canadensis) extract. In high doses, such as those contained in most black salve products, these corrosive agents can indiscriminately damage both healthy and diseased tissue.1 Nevertheless, many black salve products currently are advertised as safe and natural methods for curing skin cancer2-4 or treating a variety of other skin conditions (eg, moles, warts, skin tags, boils, abscesses, bee stings, other minor wounds)1,5 and even nondermatologic conditions such as a sore throat.6 Despite the information and testimonials that are widely available on the Internet, black salve use has not been validated by rigorous studies. Black salve is not regulated by the US Food and Drug Administration, resulting in poor quality control and inconsistent user instructions. We report the case of application of black salve to a biopsy site of a compound nevus with moderate atypia that resulted in the formation of a dermatitis plaque with subsequent scarring and basal layer pigmentation.
Case Report
A 35-year-old woman with a family history of melanoma presented for follow-up of a compound nevus with moderate atypia on the right anterior thigh that had been biopsied 6 months prior. Complete excision of the lesion was recommended at the initial presentation but was not performed due to scheduling conflicts. The patient reported applying black salve to the biopsy site and also to the left thigh 3 months later. There was no reaction on the left thigh after one 24-hour application of black salve, but an area around the biopsy site on the right thigh became thickened and irritated with superficial erosion of the skin following 2 applications of black salve, each of 24 hours’ duration. Physical examination revealed a granulomatous plaque at the biopsy site that was approximately 5 cm in diameter (Figure 1A). One year later the lesion had completely healed (Figure 1B) and a biopsy revealed scarring with basal layer pigmentation (Figure 2).
|
|
|
| |||
| Figure 1. A 5-cm granulomatous reaction surrounding a biopsy site on the right anterior thigh 3 months after application of black salve (A). One year later, the lesion had completely healed (B). | Figure 2. A biopsy one year following application of black salve demonstrated scarring with basal layer pigmentation (H&E, original magnification ×4). | ||||
Comment
A Web search using the term black salve yields a large number of products labeled as skin cancer salves, many showing glowing reviews and some being sold by major US retailers. The ingredients in black salves often vary in the innocuous substances they contain, but most products include the escharotics zinc chloride and bloodroot extract, which is derived from the plant S canadensis.1,3 For example, the ingredients of one popular black salve product include zinc chloride, chaparral (active ingredient is nordihydroguaiaretic acid), graviola leaf extract, oleander leaf extract, bloodroot extract, and glycerine,7 while another product includes bloodroot extract, zinc chloride, chaparral, cayenne pepper, red clover, birch bark, dimethyl sulfoxide, and burdock root.4
Bloodroot extract’s antimicrobial, anti-inflammatory, antioxidant, and immunomodulatory effects derive from its benzylisoquinoline alkaloids including sanguinarine, allocryptopine, berberine, coptisine, protopine, and stylopine.3,8 Bloodroot extract possesses some degree of tumoricidal potency, with one study finding that it selectively targets cancer cells.9 However, this differential response is seen only at low doses and not at the high concentrations contained in most black salve products.1 According to fluorometric assays, sanguinarine is not selective for tumor cells and therefore damages healthy tissue in addition to the unwanted lesions.6,10,11 The US Food and Drug Administration includes black salve products on its list of fake cancer cures that consumers should avoid.12 Reports of extensive damage from black salve use include skin ulceration2,10 and complete loss of a naris1 and nasal ala.5 Our case suggests the possible association between black salve use and an irritant reaction and erosion of the skin.
Furthermore, reliance on black salve alone in the treatment of skin cancer poses the threat of recurrence or metastasis of cancer because there is no way to know if the salve completely removed the cancer without a biopsy. Self-treatment can delay more effective therapy and may require further treatments.
Black salve should be subject to standarddrug regulations and its use discouraged by dermatologists due to the associated harmful effects and the availability of safer treatments. To better treat and inform their patients, dermatologists should be aware that patients may be attracted to alternative treatments such as black salves.
1. Eastman KL, McFarland LV, Raugi GJ. A review of topical corrosive black salve. J Altern Complement Med. 2014;20:284-289.
2. Eastman KL, McFarland LV, Raugi GJ. Buyer beware: a black salve caution. J Am Acad Dermatol. 2011;65:e154-e155.
3. Sivyer GW, Rosendahl C. Application of black salve to a thin melanoma that subsequently progressed to metastatic melanoma: a case study. Dermatol Pract Concept. 2014;4:77-80.
4. McDaniel S, Goldman GD. Consequences of using escharotic agents as primary treatment for nonmelanoma skin cancer. Arch Dermatol. 2002;138:1593-1596.
5. Payne CE. ‘Black Salve’ and melanomas [published online ahead of print August 11, 2010]. J Plast Reconstr Aesthet Surg. 2011;64:422.
6. Cienki JJ, Zaret L. An Internet misadventure: bloodroot salve toxicity. J Altern Complement Med. 2010;16:1125-1127.
7. Cansema and escharotics. Alpha Omega Labs Web site. http://www.altcancer.com/faqcan.htm. Accessed May 6, 2015.
8. Vlachojannis C, Magora F, Chrubasik S. Rise and fall of oral health products with Canadian bloodroot extract. Phytother Res. 2012;26:1423-1426.
9. Ahmad N, Gupta S, Husain MM, et al. Differential antiproliferative and apoptotic response of sanguinarine for cancer cells versus normal cells. Clin Cancer Res. 2000;6:1524-1528.
10. Saltzberg F, Barron G, Fenske N. Deforming self-treatment with herbal “black salve.” Dermatol Surg. 2009;35:1152-1154.
11. Debiton E, Madelmont JC, Legault J, et al. Sanguinarine-induced apoptosis is associated with an early and severe cellular glutathione depletion. Cancer Chemother Pharmacol. 2003;51:474-482.
12. 187 fake cancer “cures” consumers should avoid. US Food and Drug Administration Web site. http://www.fda.gov/Drugs/GuidanceCompliance RegulatoryInformation/EnforcementActivitiesbyFDA/ucm171057.htm. Updated July 9, 2009. Accessed May 6, 2015.
Practice Points
- Clinicians should be aware that black salve containing bloodroot extract is a popular alternative treatment used to cure a variety of skin ailments.
- Black salve containing bloodroot extract is not selective for tumor cells. Various case reports have shown that black salve can result in extensive tissue damage and recurrence or metastasis of skin cancer.
- Damage to healthy tissue can occur with as few as 2 applications of black salve.
CD8 cell dose predicts outcomes in allogeneic stem cell transplantation with reduced-intensity conditioning
Peripheral blood stem cell (PBSC) grafts with high doses of CD8 cells were associated with significantly lower relapse risk and improved survival in patients who were treated for hematologic malignancies with reduced-intensity conditioning (RIC) hematopoietic allogeneic stem cell transplantation (allo-HSCT), according to a report online in the Journal of Clinical Oncology.
A multivariate analysis showed that CD8 cell dose was an independent predictor of relapse (adjusted hazard ratio [aHR], 0.43; P = .009), relapse-free survival (aHR, 0.50; P = .006), and overall survival (aHR, 0.57; P = .04). The data showed a linear association between CD8 cell dose and outcomes, and further analysis identified an optimum cutoff of CD8 cell dose (0.72 x 10⁸ CD8 cells per kg) to segregate survival outcomes. Patients who received grafts with CD8 cell doses above the cutoff had significantly improved regression-free and overall survival (P = .005 and P = .007, respectively).
“These findings indicate that improved survival after RIC transplantations could be achieved by optimizing donor selection and PBSC collection to increase the likelihood of mobilizing grafts containing high CD8 cell doses,” wrote Dr. Ran Reshef of the department of medicine at the Hospital of the University of Pennsylvania, Philadelphia, and colleagues (Journ. Clin. Onc. 2015 June 8 [doi:10.1200/JCO.2014.60.1203]).
Younger donors were more likely to have CD8 cell doses above the cutoff (CD8hi), however, only 53% of donors younger than 30 years had CD8hi grafts. To find methods to predict graft composition during donor screening, the investigators studied 21 randomly selected allo-HSCT donors. They found no correlations between CD8 graft content and clinical variables such as weight, sex, viral serologies, or apheresis parameters. Donors with a higher proportion of CD8 cells donated grafts with higher CD8 cell dose, but the presence of higher CD4 counts negated this. Screening for the relative proportions of CD8 and CD4 cells identifies donors most likely to mobilize CD8hi grafts.
“This is also a practical consideration because the assay is rapid, is routinely performed in clinical laboratories, and can easily be done at the time of confirmatory HLA [human leukocyte antigen] typing,” the authors noted. Since the relationship between CD8 dose and survival is linear, the higher the dose the better, even if it is below the cutoff.
Previous studies showed conflicting results regarding the outcome of RIC transplantation with younger unrelated donors versus older sibling donors. Donor age inversely correlates with CD8 cell dose, and the results of this study showed that overall survival was significantly better with younger unrelated donors with a CD8hi graft, compared with older sibling donors (P = .03). No such benefit was observed with younger unrelated donors with CD8lo grafts (P = .28), indicating the benefit may rely on CD8 cell dose.
The study evaluated 200 patients with hematologic malignancy who underwent allo-HSCT with fludarabine plus busulfan conditioning from 2007 to 2014 at the Abramson Cancer Center, University of Pennsylvania in Philadelphia. The cumulative relapse incidence was 42% at 1 year and 47% at 5 years. The most common diseases in the cohort were acute myeloid leukemia, myelodysplastic syndrome, and non-Hodgkin lymphoma.
High CD8 dose was associated with an increased, but nonsignificant risk of chronic graft-versus-host disease (GVHD); the risk for nonrelapse mortality was not associated with cell doses.
FROM THE JOURNAL OF CLINICAL ONCOLOGY
Key clinical point: High CD8 cell dose in peripheral blood stem cell grafts was associated with reduced risk of relapse and increased survival in allogeneic stem cell transplantation with reduced-intensity conditioning.
Major finding: With a cumulative relapse incidence of 42% at 1 year, CD8 cell dose was an independent predictor of relapse (aHR, 0.43; P = .009), relapse-free survival (0.50; P = .006), and overall survival (0.57; P = .04).
Data source: The retrospective, single-institution study evaluated 200 patients who underwent peripheral blood alloHSCT with fludarabine plus busulfan conditioning from 2007 to 2014. Analysis of graft T-cell content used 21 randomly selected donors.
Disclosures: Dr. Reshef reported having consulting or advisory roles with Celgene, Spectrum Pharmaceuticals, Tobira Therapeutics, and Teva Pharmaceutical Industries. Many of his coauthors reported having financial relationships with industry.
HRS: A fib plus hemodialysis equals no benefit from warfarin
BOSTON – Patients with atrial fibrillation who also require hemodialysis receive no added antistroke benefit from warfarin treatment and may be more likely to have a major bleeding episode while on warfarin, based on a retrospective study of 302 patients at a single U.S. center.
“The safety and effectiveness of warfarin in patients with atrial fibrillation and chronic hemodialysis is questionable,” Dr. Lohit Garg said at the annual scientific sessions of the Heart Rhythm Society.
Dr. Garg noted that about 90% of patients in the review received aspirin, and they would also receive heparin three times a week as part of their hemodialysis protocol. ”It’s a good hypothesis” that aspirin plus heparin during hemodialysis might provide enough anticoagulation, but without warfarin the rate of stroke or transient ischemic attack was “pretty high,” 11%, “higher than [in] the general population, so aspirin and heparin may not be enough,” he said. The thromboembolic event rate with warfarin was 8%, not a statistically significant difference.
Dr. Garg and his associates reviewed patient charts at Beaumont Health System in Royal Oak, Mich., from 2009 to 2012 to find patients on chronic hemodialysis just diagnosed with new-onset atrial fibrillation (AF), and patients with chronic AF newly started on hemodialysis. They identified 724 such patients, and narrowed this down to 302 when they excluded those with valve disease or prosthesis, venous thromboembolic disease, coagulation or bleeding disorder, cancer, renal transplant, and a few other exclusions.
The study group included 119 patients (39%) who received warfarin and 183 (61%) who did not, at the discretion of their treating physicians. Patients averaged 77 years of age, and those who received warfarin and those who didn’t showed roughly similar rates of comorbidities, with no statistically significant differences between the two subgroups.
During an average follow-up of 2 years, the rates of thromboembolic events showed no statistically significant difference between the patients on warfarin and those not receiving the drug. Major bleeds occurred in 22% of the warfarin patients and 14% of those not on warfarin, a relative 53% increased risk with warfarin use that approached but did not reach statistical significance, reported Dr. Garg of the Heart Rhythm Center of Beaumont Hospital in Royal Oak, Mich.
Further, the major bleed subcategory of intracranial bleeds occurred in 10% of patients on warfarin and 4% of those off warfarin, a greater than doubled rate with warfarin, again a difference that approached but did achieve statistical significance. All the intracranial bleeds were fatal.
Dr. Garg also highlighted that these were high-risk patients, with 1.8-year average survival, and a median survival of about 2 years for both patients on warfarin and those off. During follow-up that extended as long as 5 years, 80% of patients died with similar mortality rates in the two treatment subgroups, 82% for those on warfarin and 79% for those who did not receive warfarin.
“We as cardiologists tend to prescribe warfarin” to patients like these, “but obviously we have to rethink this because it seems to harm patients without adding benefit,” commented Dr. Philipp Sommer, an electrophysiologist at the University of Leipzig (Germany).
Dr. Garg had no relevant financial disclosures.
On Twitter @mitchelzoler
AT HEART RHYTHM 2015
Key clinical point: Patients with atrial fibrillation and on hemodialysis received no thromboembolic protection from warfarin treatment.
Major finding: The thromboembolic event rate was 11% without warfarin and 8% with warfarin therapy, a nonsignificant difference.
Data source: A review of 302 patients at one U.S. center.
Disclosures: Dr. Garg had no relevant financial disclosures.
Listen Now: Highlights of the June 2015 Issue of The Hospitalist
In this issue of The Hospitalist, ECRI Institute's Vladmir Cadet discusses alarm fatigue, Dr. Christopher Moriates talks about reducing waste by eliminating overtreatment, and Dr. Robert Fogerty stresses the need to build awareness of the financial impact of treatment from the start of a doctor’s medical training.
In this issue of The Hospitalist, ECRI Institute's Vladmir Cadet discusses alarm fatigue, Dr. Christopher Moriates talks about reducing waste by eliminating overtreatment, and Dr. Robert Fogerty stresses the need to build awareness of the financial impact of treatment from the start of a doctor’s medical training.
In this issue of The Hospitalist, ECRI Institute's Vladmir Cadet discusses alarm fatigue, Dr. Christopher Moriates talks about reducing waste by eliminating overtreatment, and Dr. Robert Fogerty stresses the need to build awareness of the financial impact of treatment from the start of a doctor’s medical training.
The Hospital Leader Blogger Recalls Advocating on Capitol Hill
Editor’s note: Hospitalists of all kinds are sharing their perspectives and experiences at SHM’s official blog, The Hospital Leader, including a medical student sharing her new enthusiasm for public advocacy. For more blog posts, visit www.shmblog.org.

I sat in the office of a staffer to a Manhattan congressman and waited for the right moment to tell my story about my mother’s experience with advanced directives. Celine Goetz, MD, a hospitalist from Mount Sinai, and I had practiced our talk in a large atrium a floor below. Our morning meeting, led by SHM, had prepped us on three points:
- Address Medicare’s onerous three-day rule;
- Push for doctor funding and reimbursement in preparing advanced directives; and
- Discuss the Medicare Sustainable Growth Rate (SGR).
Dr. Goetz had taken me under her wing when she learned I was from New York. She had decided that this day was going to be as memorable for me as her first day advocating on the Hill when she was in medical school. Worried that I would fumble, I told her that I was not going to speak, but she would not let that happen.
It was my turn.
Dr. Goetz had just finished explaining the details of advanced directives. I then told my story about being grateful my mother’s primary care doctor had prioritized writing an advanced directive during an outpatient appointment. When I finished the story, I said, “It truly is preventative medicine at its finest.” I knew this was a policy buzzword. The staffer lit up and responded, “You should have started with that. That will make people listen.”
I was no longer nervous or worried to go into our next three lobby meetings. Even though I never have treated my own patients, I have something to contribute. Everyone has something to contribute to healthcare policy, because everyone has touched the healthcare system and dealt with it.
By the end of our day, at our last meeting with a Senator’s staffer, I even brought up an issue I care most passionately about after we had discussed our three points given by SHM: Save graduate medical education. In fact, I had been to advocacy workshops at other conferences on how to make this issue a legislative priority, but I had never had the courage to make it happen. (To be honest, I almost didn’t get on the bus for Hospitalists on the Hill.)
As I sat on the Amtrak train headed back to New York that night, I tweeted, “Had one of the most formative experiences of my life today. Can’t wait to advocate again. #HospitalistsOnTheHill#HospMed15@SHMLive.” Although I had been a finalist in the RIV poster competition and learned the ins and outs of Twitter, being involved with Hospitalists on the Hill provided me with something larger: that I am, and will continue to be, an active participant in the policy of my profession.
The point is that the first step is getting on the bus.
P.S.: Since writing this blog post, SGR has been repealed by the Senate in an overwhelming majority. Although my day on the Hill had little to do with this result, I am happy to count myself a participant in the larger discussion.
DePietro is a second-year medical student at SUNY Stony Brook School of Medicine. She is interested in combining her interests in quality of care, business management, and the patient experience.
Editor’s note: Hospitalists of all kinds are sharing their perspectives and experiences at SHM’s official blog, The Hospital Leader, including a medical student sharing her new enthusiasm for public advocacy. For more blog posts, visit www.shmblog.org.
I sat in the office of a staffer to a Manhattan congressman and waited for the right moment to tell my story about my mother’s experience with advanced directives. Celine Goetz, MD, a hospitalist from Mount Sinai, and I had practiced our talk in a large atrium a floor below. Our morning meeting, led by SHM, had prepped us on three points:
- Address Medicare’s onerous three-day rule;
- Push for doctor funding and reimbursement in preparing advanced directives; and
- Discuss the Medicare Sustainable Growth Rate (SGR).
Dr. Goetz had taken me under her wing when she learned I was from New York. She had decided that this day was going to be as memorable for me as her first day advocating on the Hill when she was in medical school. Worried that I would fumble, I told her that I was not going to speak, but she would not let that happen.
It was my turn.
Dr. Goetz had just finished explaining the details of advanced directives. I then told my story about being grateful my mother’s primary care doctor had prioritized writing an advanced directive during an outpatient appointment. When I finished the story, I said, “It truly is preventative medicine at its finest.” I knew this was a policy buzzword. The staffer lit up and responded, “You should have started with that. That will make people listen.”
I was no longer nervous or worried to go into our next three lobby meetings. Even though I never have treated my own patients, I have something to contribute. Everyone has something to contribute to healthcare policy, because everyone has touched the healthcare system and dealt with it.
By the end of our day, at our last meeting with a Senator’s staffer, I even brought up an issue I care most passionately about after we had discussed our three points given by SHM: Save graduate medical education. In fact, I had been to advocacy workshops at other conferences on how to make this issue a legislative priority, but I had never had the courage to make it happen. (To be honest, I almost didn’t get on the bus for Hospitalists on the Hill.)
As I sat on the Amtrak train headed back to New York that night, I tweeted, “Had one of the most formative experiences of my life today. Can’t wait to advocate again. #HospitalistsOnTheHill#HospMed15@SHMLive.” Although I had been a finalist in the RIV poster competition and learned the ins and outs of Twitter, being involved with Hospitalists on the Hill provided me with something larger: that I am, and will continue to be, an active participant in the policy of my profession.
The point is that the first step is getting on the bus.
P.S.: Since writing this blog post, SGR has been repealed by the Senate in an overwhelming majority. Although my day on the Hill had little to do with this result, I am happy to count myself a participant in the larger discussion.
DePietro is a second-year medical student at SUNY Stony Brook School of Medicine. She is interested in combining her interests in quality of care, business management, and the patient experience.
SIRS Criteria Could Identify More Patients with Severe Sepsis
Clinical question: Does inclusion of two or more SIRS criteria in the definition of severe sepsis accurately identify patients with higher mortality risk, as compared with patients with infection and organ failure but with fewer than two SIRS criteria?
Background: SIRS describes dysregulation of the inflammatory response to illness. The current definition of severe sepsis includes evidence of infection, organ failure, and two or more SIRS criteria. This study sought to test the validity of inclusion of two or more SIRS criteria in the definition of severe sepsis to differentiate patients at higher mortality risk.
Study design: 14-year, retrospective study.
Setting: One hundred seventy-two ICUs in Australia and New Zealand.
Synopsis: Investigators evaluated 109,663 patients; 87.9% had SIRS-positive severe sepsis, and 12.1% had SIRS-negative severe sepsis. Patients with SIRS-positive sepsis were younger, more ill with higher mortality, and more likely to have community-acquired infections. Both groups had decreased mortality over the 14-year study period; SIRS-positive patients decreased to 18.3% from 36.1%; SIRS-negative patients decreased to 8.5% from 27.7%.
Being SIRS-positive independently increased the risk of death by 26%; however, modeling showed a linear relationship between mortality and presence of SIRS criteria with each additional criteria, from zero to four, increasing mortality by 13%. There was no transitional increase in risk of mortality using two criteria as a cut-off.
Limiting the severe sepsis definition to two or more SIRS criteria missed one of eight patients admitted to ICU with organ failure and infection alone. SIRS-negative severe sepsis patients had significant mortality but showed similarities to SIRS-positive severe sepsis patients, suggesting they are separate phenotypes of the same condition.
Bottom line: This study challenges the sensitivity, face validity, and construct validity of the two-criteria SIRS cutoff. Redefining severe sepsis to include a lower number of SIRS criteria may diagnose more patients with organ failure and infection.
Citation: Kaukonen KM, Bailey M, Pilcher D, Cooper DJ, Bellomo R. Systemic inflammatory response syndrome criteria in defining severe sepsis. N Engl J Med. 2015;372:1629-1638.
Trimethoprim-Sulfamethoxazole Use in Older Patients Taking Spironolactone
Clinical question: Does trimethoprim-sulfamethoxazole (TMP-SMX) increase the risk of sudden death in older patients taking spironolactone?
Background: TMP-SMX increases the risk of hyperkalemia when used with spironolactone; however, previous studies have not examined whether the drug interaction is associated with an increased risk of sudden cardiac death, a predictable consequence of hyperkalemia.
Study design: Population-based, nested, case-control study.
Setting: Ontario, Canada.
Synopsis: Investigators identified 11,968 patients aged 66 years or older who suffered sudden death between 1994 and 2011 while receiving spironolactone; for 328 of these patients, death occurred within 14 days of antibiotic exposure. The rate of sudden death in patients receiving TMP-SMX was compared to the rate of sudden death in patients who instead received other study antibiotics.
Compared with amoxicillin, TMP-SMX was associated with a more than twofold increase in the risk of sudden death (OR 2.46, 95%; CI 1.55-3.90). The absolute rate of death of patients taking spironolactone who were prescribed TMP-SMX was 0.74%, compared to 0.35% in patients prescribed amoxicillin.
Because TMP-SMX and spironolactone are common medications, the likelihood of co-prescription leading to drug interaction is high. Although the study does not establish causality, it suggests that alternate antibiotics should be used in elderly patients on spironolactone when possible.
Bottom line: TMP-SMX increases the risk of sudden death in older patients taking spironolactone.
Citation: Antoniou T, Hollands S, Macdonald EM, Gomes T, Mamdani MM, Juurlink DN. Trimethoprim-sulfamethoxazole and risk of sudden death among patients taking spironolactone. CMAJ. 2015;187(4):E138-E143
Medicare Nonpayment for Hospital-Acquired Conditions May Have Reduced Infection Rates
Clinical question: What was the effect of the Centers for Medicare and Medicaid Services’ (CMS) nonpayment for hospital-acquired conditions?
Background: In 2008, CMS implemented the Hospital-Acquired Conditions (HAC) initiative, denying incremental payment to hospitals for complications of hospital care, including central-line associated bloodstream infections (CLABSIs), catheter-associated urinary tract infections (CAUTIs), hospital-acquired pressure ulcers, and injurious patient falls.
Study design: Quasi-experimental data review, pre-post comparison of outcomes.
Setting: Nearly 1,400 U.S. hospitals contributing data to the National Database of Nursing Quality Indicators (NDNQI).
Synopsis: Using time points before and after implementation of the CMS initiative, the authors found that the rates of CLABSIs and CAUTIs dropped significantly after implementation (11% reduction of CLABSIs, 10% reduction of CAUTIs). The rates of pressure ulcers and falls did not change significantly.
Findings differ from an earlier study, which found the HAC initiative did not lead to a reduction in the rates of CLABSIs or CAUTIs. The authors point out that the databases used were different, as was the time frame of data collection.
The authors hypothesize that the reason CLABSI and CAUTI rates decreased while fall and pressure ulcer rates were unchanged was better evidence supporting infection prevention practices for the former. An accompanying editorial argues that the differential outcomes may have been due to increased challenges in implementing practices for the latter measures rather than differential evidence.
Limitations of the study include characteristics of hospitals reporting to the NDNQI and accuracy of data capture by individual reporting hospitals. Changes over time may also be attributed to factors other than the HAC initiative.
Bottom line: Nonpayment for HACs may have led to decreases in rates of CLABSIs and CAUTIs, but rates of pressure ulcers and falls remained unchanged.
Citation: Waters TM, Daniels MJ, Bazzoli GJ, et al. Effect of Medicare’s nonpayment for hospital-acquired conditions. JAMA Intern Med. 2015;175(3):347-354.