User login
Best lipid levels in pregnancy still unclear
As ob.gyns., we often focus on optimizing our patients’ reproductive health. Research has shown, however, that the condition of a woman’s health prior to conception can be just as – if not more – important to her pregnancy and her lifelong well-being. For example, we have established that women who take the daily recommended dose of folic acid (400 mcg), even outside of pregnancy, have a reduced risk for neural tube defects in their infants.
Last year, we devoted a series of Master Class columns to the crucial need to properly manage maternal weight gain and blood sugar levels before, during, and after gestation to improve pregnancy outcomes. We also have seen that intensive glycemic and weight control in women can reduce their risk of fetal and maternal complications.

However, the leading causes of morbidity and mortality remain cardiovascular diseases, both in the developing and developed world. One of the key contributors to poor heart and vascular health is high cholesterol. Although the body needs cholesterol, just as it needs sugar, excess lipids in the blood can lead to infarction and stroke.
According to the U.S. Centers for Disease Control and Prevention, the desirable total cholesterol levels, including low- and high-density lipids and triglycerides, for men and nonpregnant women fall below 200 mg/dL. What remain less clear are the desired lipid levels for pregnant women.
We have known for decades that cholesterol concentrations increase during pregnancy, possibly by as much as 50%. We do not, however, have a firm understanding of what may constitute normally higher lipid concentrations and what may signal risk to the health of the baby or mother. Additionally, while we may run a lipid panel when we order a blood test, ob.gyns. do not routinely monitor a women’s cholesterol.
Since excess lipids, obesity, and heart disease often occur in the same patient and have become increasingly prevalent in our society, it may be time to reexamine any correlations between maternal lipid levels and adverse pregnancy outcomes.
To comment on this reemerging area, we invited Dr. Arnon Wiznitzer, professor and chairman of the department of obstetrics and gynecology at Helen Schneider Hospital for Women and deputy director of the Rabin Medical Center, Sackler Faculty of Medicine, Tel Aviv University. Dr. Wiznitzer’s extensive experience working with women who have diabetes in pregnancy led him to examine other comorbidities, including lipids, which might confound good pregnancy outcomes.
Dr. Reece, who specializes in maternal-fetal medicine, is vice president for medical affairs at the University of Maryland, Baltimore, as well as the John Z. and Akiko K. Bowers Distinguished Professor and dean of the school of medicine. Dr. Reece said he had no relevant financial disclosures. He is the medical editor of this column. Contact him at [email protected].
As ob.gyns., we often focus on optimizing our patients’ reproductive health. Research has shown, however, that the condition of a woman’s health prior to conception can be just as – if not more – important to her pregnancy and her lifelong well-being. For example, we have established that women who take the daily recommended dose of folic acid (400 mcg), even outside of pregnancy, have a reduced risk for neural tube defects in their infants.
Last year, we devoted a series of Master Class columns to the crucial need to properly manage maternal weight gain and blood sugar levels before, during, and after gestation to improve pregnancy outcomes. We also have seen that intensive glycemic and weight control in women can reduce their risk of fetal and maternal complications.
However, the leading causes of morbidity and mortality remain cardiovascular diseases, both in the developing and developed world. One of the key contributors to poor heart and vascular health is high cholesterol. Although the body needs cholesterol, just as it needs sugar, excess lipids in the blood can lead to infarction and stroke.
According to the U.S. Centers for Disease Control and Prevention, the desirable total cholesterol levels, including low- and high-density lipids and triglycerides, for men and nonpregnant women fall below 200 mg/dL. What remain less clear are the desired lipid levels for pregnant women.
We have known for decades that cholesterol concentrations increase during pregnancy, possibly by as much as 50%. We do not, however, have a firm understanding of what may constitute normally higher lipid concentrations and what may signal risk to the health of the baby or mother. Additionally, while we may run a lipid panel when we order a blood test, ob.gyns. do not routinely monitor a women’s cholesterol.
Since excess lipids, obesity, and heart disease often occur in the same patient and have become increasingly prevalent in our society, it may be time to reexamine any correlations between maternal lipid levels and adverse pregnancy outcomes.
To comment on this reemerging area, we invited Dr. Arnon Wiznitzer, professor and chairman of the department of obstetrics and gynecology at Helen Schneider Hospital for Women and deputy director of the Rabin Medical Center, Sackler Faculty of Medicine, Tel Aviv University. Dr. Wiznitzer’s extensive experience working with women who have diabetes in pregnancy led him to examine other comorbidities, including lipids, which might confound good pregnancy outcomes.
Dr. Reece, who specializes in maternal-fetal medicine, is vice president for medical affairs at the University of Maryland, Baltimore, as well as the John Z. and Akiko K. Bowers Distinguished Professor and dean of the school of medicine. Dr. Reece said he had no relevant financial disclosures. He is the medical editor of this column. Contact him at [email protected].

Jury still out on combo for elderly AML

Photo courtesy of NIH
VIENNA—A 2-drug combination can produce complete responses (CRs) in elderly patients with newly diagnosed acute myeloid leukemia (AML), but whether the treatment confers a survival benefit remains to be seen.
The combination consists of the HDAC inhibitor pracinostat and the antineoplastic agent azacitidine.
In a phase 2 study, the treatment produced CRs in nearly a third of AML patients, and follow-up has shown that responses improve over time.
However, the median overall survival has not been reached.
“The combination of pracinostat and azacitidine continues to demonstrate compelling clinical activity in these elderly patients with newly diagnosed AML,” said Daniel P. Gold, PhD, President and Chief Executive Officer of MEI Pharma, the company developing pracinostat.
“While the overall survival trend in this study is encouraging, we believe that longer follow-up is needed to gain an accurate survival estimate. Ultimately, this survival estimate will be critical in determining the development path forward for this combination. We look forward to providing an update when these data mature, which we expect to occur later this year.”
The current data were presented at the 20th Congress of the European Hematology Association (abstract P568*). The trial was sponsored by MEI Pharma.
The study included 50 patients who had a median age of 75 (range, 66-84). Sixty-six percent of patients had de novo AML, and 34% had secondary AML. Fifty-four percent of patients had intermediate-risk cytogenetics, 42% had high-risk, and 4% were not evaluable.
The patients received pracinostat at 60 mg orally on days 1, 3, and 5 of each week for 21 days of each 28-day cycle. They received azacitidine subcutaneously or intravenously on days 1-7 or days 1-5 and 8-9 (per site preference) of each 28-day cycle.
To date, half of patients have discontinued treatment, 8% due to death, 36% because of progressive disease, 32% due to adverse events, and 24% for other reasons.
Response and survival
Thus far, 54% of patients (n=27) have achieved the primary endpoint of CR plus CR with incomplete count recovery (CRi) plus morphologic leukemia-free state (MLFS).
Thirty-two percent of patients had a CR, 14% had a CRi, 8% achieved MLFS, and 6% had a partial response (PR) or PR with incomplete count recovery (PRi).
Among the 27 patients with intermediate-risk cytogenetics, 63% achieved a CR/CRi/MLFS, and 7% had a PR/PRi. Among the 21 patients with high-risk cytogenetics, 48% achieved a CR/CRi/MLFS, and none had a PR/PRi.
The researchers said these response rates compare favorably with previous studies of azacitidine alone in this patient population. In this trial, most responses occurred within the first 2 cycles of therapy and continued to improve with ongoing therapy.
The median overall survival has not yet been reached. Sixty-four percent of patients (n=32) are still being followed (range, 6-15 months).
The survival rate of patients with intermediate-risk cytogenetics appears greater than that for patients with high-risk cytogenetics, though neither subset of patients has reached median survival.
The 60-day mortality rate was 10% (n=5).
Safety and tolerability
The most common treatment-emergent adverse events (AEs) were nausea (66%), constipation (58%), fatigue (48%), febrile neutropenia (40%), thrombocytopenia (32%), diarrhea (30%), vomiting (28%), decreased appetite (28%), anemia (26%), hypokalemia (26%), neutropenia (24%), pyrexia (24%), dizziness (24%), dyspnea (24%), and rash (20%).
Treatment-emergent AEs led to discontinuation in 8 patients. Two of these patients developed sepsis that proved fatal.
The other events included grade 3 peripheral motor neuropathy (which was resolved), grade 3 parainfluenza (resolved with sequelae), grade 3 prolonged QTc/atrial fibrillation (resolved), grade 2 failure to thrive (not resolved), grade 3 mucositis (not resolved), and grade 2 fatigue (not resolved).
AEs resulting in dose reductions were frequently due to disease, according to the researchers.
The team also noted that nearly half of the patients in this study (n=22) have received pracinostat and azacitidine beyond 6 months, and 5 patients have received it for more than a year, which reflects long-term tolerability. ![]()
*Information in the abstract differs from that presented at the meeting.
Letter to the Editor
I thank Locke et al. for their article published in the Journal of Hospital Medicine.[1] It summarized well the challenges created by the Recovery Audit Contractor (RAC) program. It is encouraging that the Centers for Medicare & Medicaid Services (CMS) have proposed a different payment method to address the contingency‐fee payment controversy. The new method would require the RACs to be paid after a provider's challenge has passed a second level of a 5‐level appeals process.[2] This, however, has been protested by 1 of the RACs, and a federal appeals court has agreed with the protest.[3] Furthermore, the Office of Medicare Hearings and Appeals (OMHA) is receiving more requests for hearings than the administrative law judges can adjudicate in a timely manner. OMHA is currently projecting a 20‐ to 24‐week delay in entering new requests into their case processing system. The average processing time for appeals decided in fiscal year 2015 was 547.1 days.[4] Financial impacts of the status issue have thus far only affected hospitals and patients, whereas physician reimbursement has been sheltered. This may change if the RACs request to utilize the CMS manual changes announced in Transmittal 541,[5] which allows certain auditors to deny or recoup payment for procedures performed as inpatients that were not medically necessary. Hospitals have increased the cohorts of observation patients on a single unit or implemented different discharge planning processes for inpatients versus observation. However, patient quality outcomes are not available yet on these approaches.
I thank Locke et al. for their article published in the Journal of Hospital Medicine.[1] It summarized well the challenges created by the Recovery Audit Contractor (RAC) program. It is encouraging that the Centers for Medicare & Medicaid Services (CMS) have proposed a different payment method to address the contingency‐fee payment controversy. The new method would require the RACs to be paid after a provider's challenge has passed a second level of a 5‐level appeals process.[2] This, however, has been protested by 1 of the RACs, and a federal appeals court has agreed with the protest.[3] Furthermore, the Office of Medicare Hearings and Appeals (OMHA) is receiving more requests for hearings than the administrative law judges can adjudicate in a timely manner. OMHA is currently projecting a 20‐ to 24‐week delay in entering new requests into their case processing system. The average processing time for appeals decided in fiscal year 2015 was 547.1 days.[4] Financial impacts of the status issue have thus far only affected hospitals and patients, whereas physician reimbursement has been sheltered. This may change if the RACs request to utilize the CMS manual changes announced in Transmittal 541,[5] which allows certain auditors to deny or recoup payment for procedures performed as inpatients that were not medically necessary. Hospitals have increased the cohorts of observation patients on a single unit or implemented different discharge planning processes for inpatients versus observation. However, patient quality outcomes are not available yet on these approaches.
I thank Locke et al. for their article published in the Journal of Hospital Medicine.[1] It summarized well the challenges created by the Recovery Audit Contractor (RAC) program. It is encouraging that the Centers for Medicare & Medicaid Services (CMS) have proposed a different payment method to address the contingency‐fee payment controversy. The new method would require the RACs to be paid after a provider's challenge has passed a second level of a 5‐level appeals process.[2] This, however, has been protested by 1 of the RACs, and a federal appeals court has agreed with the protest.[3] Furthermore, the Office of Medicare Hearings and Appeals (OMHA) is receiving more requests for hearings than the administrative law judges can adjudicate in a timely manner. OMHA is currently projecting a 20‐ to 24‐week delay in entering new requests into their case processing system. The average processing time for appeals decided in fiscal year 2015 was 547.1 days.[4] Financial impacts of the status issue have thus far only affected hospitals and patients, whereas physician reimbursement has been sheltered. This may change if the RACs request to utilize the CMS manual changes announced in Transmittal 541,[5] which allows certain auditors to deny or recoup payment for procedures performed as inpatients that were not medically necessary. Hospitals have increased the cohorts of observation patients on a single unit or implemented different discharge planning processes for inpatients versus observation. However, patient quality outcomes are not available yet on these approaches.
Is there such a thing as good TV?
I was 7 years old when my family got its first television. I can’t recall the year, but I know that we were one of the last houses in our neighborhood to have a color TV. As parents, my wife and I kept our children on a moderate viewing diet, mostly “Captain Kangaroo” and “Sesame Street” when they were young. Until they were teenagers, they believed that only televisions in motel rooms received cartoons. Now, as parents, they are more restrictive with their children than we were with them. One family doesn’t even own a television.
A few years ago, my wife and I cut back our cable service to “basic” and, other than a few sporting events and a rare show on PBS, our TV sits unused in our living room. Five months out of the year, we have no television at all – when we’re in our cottage by the ocean.
Our trajectory from being enthusiastic viewers to television abstainers seems to be not that unusual among our peers. At dinner parties, I often hear, “There is nothing worth watching on television. It’s all junk and commercials.” Could the same condemnation be voiced about television for young children? Could there be some benefit for preschoolers in watching an “educational” show such as “Sesame Street”? Or is it all garbage, even for the very young?
A recently and much ballyhooed study by two economists suggests that, at least as “Sesame Street” is concerned, television can have a positive effect on young children. You may have read the headline: “Study: Kids can learn as much from ‘Sesame Street’ as from preschool” (Washington Post, June 7, 2015).
The researchers exploited a quirk of the precable landscape when some markets could not tune into some shows, including “Sesame Street,” because they were receiving only a UHF signal. Analyzing the data over several years, the economists found that, in communities where children had the opportunity to watch “Sesame Street,” those children had a “14% drop in the likelihood of being behind in school.” That association appeared to fade by the time the children reached high school. To claim that “Sesame Street” is at least as good as preschool based on these numbers seems to me to be a bit of a stretch. It may be that UHF-watching kids watched more professional wrestling, and this encouraged them to be more disruptive in school.
We must remember that these researchers are economists, and we should take anything they conclude with a grain of salt. But let’s say that there may be something to their conclusion that there is an association between “Sesame Street” viewing and school readiness. Does this mean that we should be developing more shows on the “Sesame Street” model, and that young children should be watching educational television several hours a day? Is there a dose effect? Or does this apparent association simply suggest that we should be improving preschools?
For decades, pediatricians and the American Academy of Pediatrics were focused on content and giving too little attention to the amount of screen time. This has improved slightly in the last few years, but the fact remains that television is a passive and sedentary activity that is threatening the health of our nation. It is robbing millions of Americans of precious hours of restorative sleep. It is giving even more millions an easy and addictive way to avoid doing something else. Instead, the addicts spend hours each day watching other people doing something. I always have suspected that the introduction of color to television is the culprit. Black-and-white TV was interesting to a point, but I don’t recall it being addictive. Most of us will watch for hours anything that is colorful and moves.
“Sesame Street” is and has been a wonderful show, and I suspect it has helped millions of children learn things they may not have been exposed to at home. But in one sense, educational programming could be considered a gateway drug. Once the set goes on, many parents don’t have the fortitude to shut it off. We should think twice before claiming that it is on a par with preschool.
Dr. Wilkoff practiced primary care pediatrics in Brunswick, Maine, for nearly 40 years. He has authored several books on behavioral pediatrics, including “Coping with a Picky Eater.”

ICD-10 Race to the Finish: 8 High Priorities in the 11th Hour
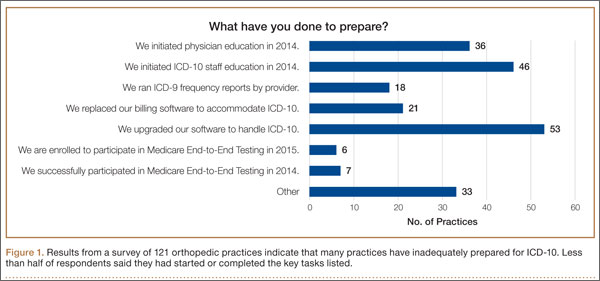
As late as mid-April 2015, a survey of 121 orthopedic practices indicated that 30% had done nothing to start preparing for ICD-10 (International Classification of Diseases, Tenth Revision).1 That’s scary. And even the practices that had begun to prepare had not completed a number of key tasks (Figure 1).
Certainly, the will-they-or-won’t-they possibility of another congressional delay had many practices sitting on their hands this year. But now that the October 1, 2015, implementation is set in stone, this lack of inertia has many practices woefully behind. If your practice is one of many that hasn’t mapped your common ICD-9 (International Classification of Diseases, Ninth Revision) codes to ICD-10 codes, completed payer testing, or attended training, it’s time for a “full-court press.”
Being unprepared for ICD-10 will cause more than just an increase in claim denials. If your surgery schedule is booked a few months out, your staff will need to pre-authorize cases using ICD-10 as early as August 1—and they won’t be able to do that if you haven’t dictated the clinical terms required to choose an ICD-10 code. Without an understanding of ICD-10, severity of illness coding will suffer, and that will affect your bundled and value-based payments. And, if you don’t provide an adequate diagnosis when sending patients off-site for physical therapy, you’ll soon be getting phone calls from their billing staff demanding more specifics.
The clock is ticking and time is short. Here’s a prioritized list of what needs to get done.
1. Generate an ICD-9 frequency report
Identifying which diagnosis codes are the most frequently used, and therefore drive a significant portion of practice revenue, is an absolute must. The data will help prioritize training and code-mapping activities.
Most practices generate Current Procedural Terminology (CPT) code-frequency reports regularly, but few have ever run an ICD-9 code-frequency report. Call your vendor and ask for assistance, as there are multiple ways to run this report and they vary by practice management system. Sort the data elements and generate the ICD-9 frequency report by:
- Primary diagnosis.
- Unique patient.
- Revenue. (If your practice management system can’t give you diagnosis data by revenue, which enables you to focus on the codes that generate the most revenue, generate it by charges.)
The result should be a report that identifies the 20 to 25 diagnosis codes (or charges, depending on the reports generated) that drive the most revenue for the practice. Use the data to focus and prioritize your training and code-mapping activities.
2. Schedule training
Forget about “general” ICD-10 training courses. You need orthopedic-specific guidance. That’s because ICD-10 for orthopedics is more complex than for other specialties. Dictating fractures under ICD-10 is not so simple. Selecting an injury code requires confidence in correctly using the seventh character.
“Everyone who uses diagnosis codes must have baseline knowledge: surgeons, billing staff, surgical coordinators, and clinical team,” according to Sarah Wiskerchen, MBA, CPC, consultant and ICD-10 educator with KarenZupko & Associates (KZA). Training must include the practical details of ICD-10, such as assigning laterality, understanding the system architecture, and limiting the use of unspecified codes.
The American Academy of Orthopaedic Surgeons (AAOS) offers a self-paced, online training series that provides details for the top 3 diagnosis codes for each subspecialty. The 10-program course, ICD-10-CM: By the Numbers, is available at www.aaos.org ($299 for members, $399 for nonmembers). If you prefer live instruction, there is one more AAOS-sponsored, regional ICD-10 workshop left before the October 1 deadline, and more may be added. (Details at www.karenzupko.com)
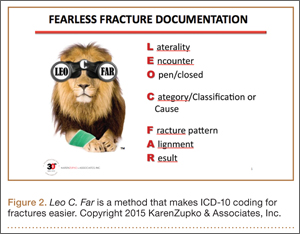
These courses provide highly specific and granular ICD-10 knowledge and incorporate the use of Code-X, an AAOS-developed software tool. They also feature tools for handling the complexities of fractures and injury codes, such as Leo C. Far, an acronym developed by KZA consultant and coding educator Margie Maley, BSN, MS, to make ICD-10 diagnosis coding for fractures easier (Figure 2).
Some subspecialty societies also offer ICD-10 training. The American Society for Surgery of the Hand (www.assh.org), for example, offers a series of webinars and member-developed ICD-9-to-ICD-10 code maps.
3. Crosswalk your common codes from ICD-9 to ICD-10
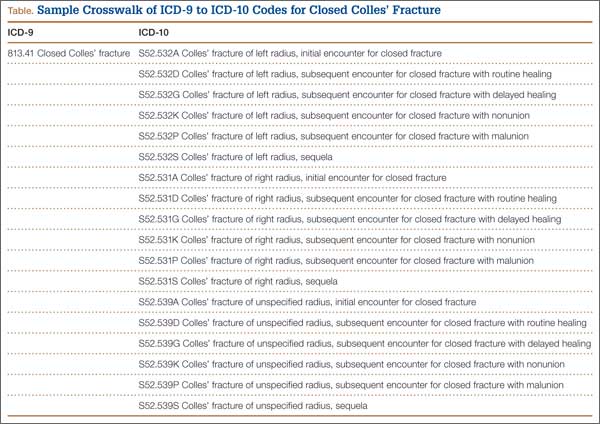
Crosswalking is the process of mapping your most commonly used ICD-9 codes to their equivalent ICD-10 codes. This exercise familiarizes your team with ICD-10 language and terms, and gives a sense of which ICD-9 codes expand to just 1 or 2 ICD-10 codes and which codes expand into 10 or more codes—as some injury codes do (Table).
“Attempting to map the codes before completing ICD-10 training is like trying to write a letter in Greek when you only speak English,” Wiskerchen warns. “So start this process after at least some of your team have grasped the fundamentals of ICD-10.” This is where the data from your ICD-9 frequency report comes in. Use it to prioritize which codes to map first with a goal of mapping your top 25 ICD-9 codes to their ICD-10 equivalents by August 31.
Invest in good tools to support your mapping efforts. Avoid general mapping equivalent (GEM) coding tools, which are free for a good reason—they are incomplete and don’t always lead you to the correct ICD-10 code. Instead, purchase resources from credible sources, such as the American Medical Association (AMA; www.ama-assn.org). The AMA publishes ICD-10-CM 2016: The Complete Official Codebook as well as ICD-10-CM Mappings 2016, which links ICD-9 codes to all valid ICD-10 alternatives. The AMA also offers electronic ICD-10-CM Express Reference Mapping Cards for multiple specialties.
Practice makes perfect and crosswalking from ICD-9 to ICD-10 is one of the best ways for your team to become aware of the nuances in the new coding system. Like learning a new language, “speaking” ICD-10 does not become automatic just because you’ve attended training or completed the coding maps. Training teaches the architecture of the new coding system. Mapping provides a structured way to become familiar with the codes the practice will use most often. Once these 2 primary pieces are understood and assimilated, most physicians find that dictating the necessary new terms becomes quite easy.
4. Conduct a gap analysis to identify the ICD-10 terms missing from each provider’s current documentation
Conduct the gap analysis after your team has completed training, and once you’ve at least begun the process of mapping codes from ICD-9 to ICD-10. Here’s how:
- Generate a CPT frequency report.
- Select the top 5 procedures for each physician.
- Pull 2 patients’ notes for each of the top procedures.
- Review the notes and try to select ICD-10 code(s).
If key ICD-10 terms are not included in current documentation, physicians should modify the templates or macros they rely on for dictation.
“This simple exercise makes it obvious which clinical information physicians must add for ICD-10,” Wiskerchen says. For example, if the patient had an arthroscopy, but the note doesn’t specify on which leg, that’s a clear indication that the physician must dictate laterality. “The gap analysis is a great way to coach physicians about the clinical details to document, so staff can bill under ICD-10,” Wiskerchen says.
5. Contact technology vendors
Given the number of new ICD-10 codes in orthopedics, paper cheat sheets will be obsolete. Instead, you’ll need to rely on pull-down menus and/or search fields in the electronic health record (EHR) and practice management systems.
“Get clarity about how the new features and workflow processes will work in your systems,” suggests Wiskerchen. “Ask questions such as: Which features will be added or changed to accommodate the new codes? Will there be new screens or pick lists for ICD-10, or search fields? How will new screens and features change our current workflow? And schedule any necessary training as soon as possible.”
In addition to software upgrades and training, vendors and clearinghouses offer an array of services to help practices make the transition. Some vendors even provide help coordinating your internal plan with their new product features and training. Contact vendors to find out what they offer.
6. Use completed code maps to build diagnosis code databases, EHR templates, charge tickets, pick lists, prompters, and other coding tools
“Provide the code crosswalks and results of your documentation gap analysis to the IT [information technology] team so they can get started,” Wiskerchen advises. “And assign a physician or midlevel provider to work with IT so that the tools are clinically accurate.”
7. Schedule testing with clearinghouses and payers
“Successful testing indicates that your hard work has paid off, and that claims will be processed with few, if any, ICD-10–related hiccups,” Wiskerchen says. Essentially, the testing confirms that your ICD-10 code database, pick lists, vendor features, and other coding fields are working properly. “Testing with a clearinghouse is good. Testing directly with the payer is even better, if you are a direct submitter and it is allowed,” Wiskerchen suggests. Contact your clearinghouse and/or payers for testing opportunities prior to October 1.
8. Develop a plan for a potential cash flow crunch
So what happens if your best efforts in the 11th hour still aren’t enough to get your practice to the ICD-10 finish line? Prepare for the possibility of increased claim denials and temporary cash flow stalls, and put a plan in place to deal with them.
Start now by cleaning up as much of the accounts receivable as possible, and moving patient collections up front. Ask the billing team for a weekly status update of the largest unpaid balances in the 60-day aging column, and what has been done to appeal or otherwise address them. Analyze denial patterns and trends and fix their causes at the source—some may be ICD-10–related, others may simply be a gap in the reimbursement process that needs improvement.
Use payer cost estimators to calculate patient out-of-pocket cost and to collect unmet deductibles, coinsurance, and noncovered services prior to surgery. The surgeon-developed iPhone app Health Insurance Arithmetic2 ($1.99 in the iTunes Store) can help staff do this math on one, simple screen.
Finally, secure a line of credit to guard against a claim denial pile up this fall. A line of credit mitigates financial risk by making cash available quickly, should you need it to cover temporary revenue shortfalls, meet payroll, or pay operational expenses. It’s not too late to meet with your banker and apply for this protection, and the peace of mind may even help you sleep better.
1. KarenZupko & Associates, Inc. Pre-course survey of Q1 2015 coding and reimbursement workshop attendees. [Workshops are cosponsored by the American Academy of Orthopaedic Surgeons.] Unpublished data, April 2015.
2. Health Insurance Arithmetic. iTunes Store website. https://itunes.apple.com/us/app/healthinsurancearithmetic/id953262818. Accessed May 12, 2015.
As late as mid-April 2015, a survey of 121 orthopedic practices indicated that 30% had done nothing to start preparing for ICD-10 (International Classification of Diseases, Tenth Revision).1 That’s scary. And even the practices that had begun to prepare had not completed a number of key tasks (Figure 1).
Certainly, the will-they-or-won’t-they possibility of another congressional delay had many practices sitting on their hands this year. But now that the October 1, 2015, implementation is set in stone, this lack of inertia has many practices woefully behind. If your practice is one of many that hasn’t mapped your common ICD-9 (International Classification of Diseases, Ninth Revision) codes to ICD-10 codes, completed payer testing, or attended training, it’s time for a “full-court press.”
Being unprepared for ICD-10 will cause more than just an increase in claim denials. If your surgery schedule is booked a few months out, your staff will need to pre-authorize cases using ICD-10 as early as August 1—and they won’t be able to do that if you haven’t dictated the clinical terms required to choose an ICD-10 code. Without an understanding of ICD-10, severity of illness coding will suffer, and that will affect your bundled and value-based payments. And, if you don’t provide an adequate diagnosis when sending patients off-site for physical therapy, you’ll soon be getting phone calls from their billing staff demanding more specifics.
The clock is ticking and time is short. Here’s a prioritized list of what needs to get done.
1. Generate an ICD-9 frequency report
Identifying which diagnosis codes are the most frequently used, and therefore drive a significant portion of practice revenue, is an absolute must. The data will help prioritize training and code-mapping activities.
Most practices generate Current Procedural Terminology (CPT) code-frequency reports regularly, but few have ever run an ICD-9 code-frequency report. Call your vendor and ask for assistance, as there are multiple ways to run this report and they vary by practice management system. Sort the data elements and generate the ICD-9 frequency report by:
- Primary diagnosis.
- Unique patient.
- Revenue. (If your practice management system can’t give you diagnosis data by revenue, which enables you to focus on the codes that generate the most revenue, generate it by charges.)
The result should be a report that identifies the 20 to 25 diagnosis codes (or charges, depending on the reports generated) that drive the most revenue for the practice. Use the data to focus and prioritize your training and code-mapping activities.
2. Schedule training
Forget about “general” ICD-10 training courses. You need orthopedic-specific guidance. That’s because ICD-10 for orthopedics is more complex than for other specialties. Dictating fractures under ICD-10 is not so simple. Selecting an injury code requires confidence in correctly using the seventh character.
“Everyone who uses diagnosis codes must have baseline knowledge: surgeons, billing staff, surgical coordinators, and clinical team,” according to Sarah Wiskerchen, MBA, CPC, consultant and ICD-10 educator with KarenZupko & Associates (KZA). Training must include the practical details of ICD-10, such as assigning laterality, understanding the system architecture, and limiting the use of unspecified codes.
The American Academy of Orthopaedic Surgeons (AAOS) offers a self-paced, online training series that provides details for the top 3 diagnosis codes for each subspecialty. The 10-program course, ICD-10-CM: By the Numbers, is available at www.aaos.org ($299 for members, $399 for nonmembers). If you prefer live instruction, there is one more AAOS-sponsored, regional ICD-10 workshop left before the October 1 deadline, and more may be added. (Details at www.karenzupko.com)
These courses provide highly specific and granular ICD-10 knowledge and incorporate the use of Code-X, an AAOS-developed software tool. They also feature tools for handling the complexities of fractures and injury codes, such as Leo C. Far, an acronym developed by KZA consultant and coding educator Margie Maley, BSN, MS, to make ICD-10 diagnosis coding for fractures easier (Figure 2).
Some subspecialty societies also offer ICD-10 training. The American Society for Surgery of the Hand (www.assh.org), for example, offers a series of webinars and member-developed ICD-9-to-ICD-10 code maps.
3. Crosswalk your common codes from ICD-9 to ICD-10
Crosswalking is the process of mapping your most commonly used ICD-9 codes to their equivalent ICD-10 codes. This exercise familiarizes your team with ICD-10 language and terms, and gives a sense of which ICD-9 codes expand to just 1 or 2 ICD-10 codes and which codes expand into 10 or more codes—as some injury codes do (Table).
“Attempting to map the codes before completing ICD-10 training is like trying to write a letter in Greek when you only speak English,” Wiskerchen warns. “So start this process after at least some of your team have grasped the fundamentals of ICD-10.” This is where the data from your ICD-9 frequency report comes in. Use it to prioritize which codes to map first with a goal of mapping your top 25 ICD-9 codes to their ICD-10 equivalents by August 31.
Invest in good tools to support your mapping efforts. Avoid general mapping equivalent (GEM) coding tools, which are free for a good reason—they are incomplete and don’t always lead you to the correct ICD-10 code. Instead, purchase resources from credible sources, such as the American Medical Association (AMA; www.ama-assn.org). The AMA publishes ICD-10-CM 2016: The Complete Official Codebook as well as ICD-10-CM Mappings 2016, which links ICD-9 codes to all valid ICD-10 alternatives. The AMA also offers electronic ICD-10-CM Express Reference Mapping Cards for multiple specialties.
Practice makes perfect and crosswalking from ICD-9 to ICD-10 is one of the best ways for your team to become aware of the nuances in the new coding system. Like learning a new language, “speaking” ICD-10 does not become automatic just because you’ve attended training or completed the coding maps. Training teaches the architecture of the new coding system. Mapping provides a structured way to become familiar with the codes the practice will use most often. Once these 2 primary pieces are understood and assimilated, most physicians find that dictating the necessary new terms becomes quite easy.
4. Conduct a gap analysis to identify the ICD-10 terms missing from each provider’s current documentation
Conduct the gap analysis after your team has completed training, and once you’ve at least begun the process of mapping codes from ICD-9 to ICD-10. Here’s how:
- Generate a CPT frequency report.
- Select the top 5 procedures for each physician.
- Pull 2 patients’ notes for each of the top procedures.
- Review the notes and try to select ICD-10 code(s).
If key ICD-10 terms are not included in current documentation, physicians should modify the templates or macros they rely on for dictation.
“This simple exercise makes it obvious which clinical information physicians must add for ICD-10,” Wiskerchen says. For example, if the patient had an arthroscopy, but the note doesn’t specify on which leg, that’s a clear indication that the physician must dictate laterality. “The gap analysis is a great way to coach physicians about the clinical details to document, so staff can bill under ICD-10,” Wiskerchen says.
5. Contact technology vendors
Given the number of new ICD-10 codes in orthopedics, paper cheat sheets will be obsolete. Instead, you’ll need to rely on pull-down menus and/or search fields in the electronic health record (EHR) and practice management systems.
“Get clarity about how the new features and workflow processes will work in your systems,” suggests Wiskerchen. “Ask questions such as: Which features will be added or changed to accommodate the new codes? Will there be new screens or pick lists for ICD-10, or search fields? How will new screens and features change our current workflow? And schedule any necessary training as soon as possible.”
In addition to software upgrades and training, vendors and clearinghouses offer an array of services to help practices make the transition. Some vendors even provide help coordinating your internal plan with their new product features and training. Contact vendors to find out what they offer.
6. Use completed code maps to build diagnosis code databases, EHR templates, charge tickets, pick lists, prompters, and other coding tools
“Provide the code crosswalks and results of your documentation gap analysis to the IT [information technology] team so they can get started,” Wiskerchen advises. “And assign a physician or midlevel provider to work with IT so that the tools are clinically accurate.”
7. Schedule testing with clearinghouses and payers
“Successful testing indicates that your hard work has paid off, and that claims will be processed with few, if any, ICD-10–related hiccups,” Wiskerchen says. Essentially, the testing confirms that your ICD-10 code database, pick lists, vendor features, and other coding fields are working properly. “Testing with a clearinghouse is good. Testing directly with the payer is even better, if you are a direct submitter and it is allowed,” Wiskerchen suggests. Contact your clearinghouse and/or payers for testing opportunities prior to October 1.
8. Develop a plan for a potential cash flow crunch
So what happens if your best efforts in the 11th hour still aren’t enough to get your practice to the ICD-10 finish line? Prepare for the possibility of increased claim denials and temporary cash flow stalls, and put a plan in place to deal with them.
Start now by cleaning up as much of the accounts receivable as possible, and moving patient collections up front. Ask the billing team for a weekly status update of the largest unpaid balances in the 60-day aging column, and what has been done to appeal or otherwise address them. Analyze denial patterns and trends and fix their causes at the source—some may be ICD-10–related, others may simply be a gap in the reimbursement process that needs improvement.
Use payer cost estimators to calculate patient out-of-pocket cost and to collect unmet deductibles, coinsurance, and noncovered services prior to surgery. The surgeon-developed iPhone app Health Insurance Arithmetic2 ($1.99 in the iTunes Store) can help staff do this math on one, simple screen.
Finally, secure a line of credit to guard against a claim denial pile up this fall. A line of credit mitigates financial risk by making cash available quickly, should you need it to cover temporary revenue shortfalls, meet payroll, or pay operational expenses. It’s not too late to meet with your banker and apply for this protection, and the peace of mind may even help you sleep better.
1. KarenZupko & Associates, Inc. Pre-course survey of Q1 2015 coding and reimbursement workshop attendees. [Workshops are cosponsored by the American Academy of Orthopaedic Surgeons.] Unpublished data, April 2015.
2. Health Insurance Arithmetic. iTunes Store website. https://itunes.apple.com/us/app/healthinsurancearithmetic/id953262818. Accessed May 12, 2015.
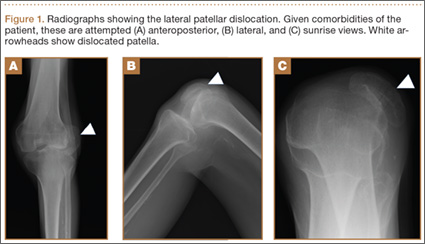
Closed Reduction of Subacute Patellar Dislocation Using Saline Joint Insufflation: A Technical Trick
As the largest sesamoid bone in the human body, the patella acts as a fulcrum to enhance the biomechanical advantage of the quadriceps in extension.1 It is subject to a variety of forces while improving distribution of forces along the extensor mechanism.2 With sufficient force, the patella can be dislocated. Acute patellar dislocations are the most common knee injury, encompassing 2% to 3% of all knee injuries3 and occurring in 5.8 per 100,000 individuals.4-5 These injuries are associated with acute trauma, frequently from sports and physical activities, occurring while in terminal extension with an axial-valgus stress on the knee during rotation.6
With acute patellar dislocations, patients are usually in significant discomfort. Often, the patella may spontaneously reduce; if not, closed reduction is usually successful with pressure applied anteromedially on the lateral patellar margin, while simultaneously attempting gentle extension of the leg.7 Closed reduction is almost universally successful, and there have only been case reports of irreducible, mainly fixed vertical axis patellar dislocations.8-11 No reports in the literature have described subacute patellar dislocations because of their rarity. Patients present immediately after dislocation, spontaneously reduce, or have a painless, chronically dislocated patella.
We present a case of an elderly man with dementia and a subacute fixed irreducible patellar dislocation, which was reduced using a technique not described in the literature. The patient and the patient’s guardian provided written informed consent for print and electronic publication of this case report.
Case Report
A 68-year-old nonambulatory man with a history of dementia and stroke presented to the emergency department with complaints of left knee pain and his knee locked in flexion. The patient’s knee had been in that fixed hyperflexed position for at least 10 days after he sustained a twisting injury to his knee while attempting to get out of bed. At baseline, the patient was mostly bedbound and could walk minimally with maximum support, but, given his dementia, he would often attempt to ambulate by himself. After the injury, the patient did not complain of much pain at rest, but attempts at his group home to straighten his leg had caused severe pain. As a result, the patient was brought to the emergency department to be evaluated for fractures.
Physical examination in the emergency department revealed atrophy of the lower extremity musculature and a left knee fixed at 120º in flexion. The skin was intact, and there was minimal effusion of the knee joint. The patella was noted to be laterally subluxated and tender to palpation over the lateral and medial facets. He was neurovascularly intact distally and had painless range of motion of his hips. His contralateral right knee had full range of motion with good patellar tracking.
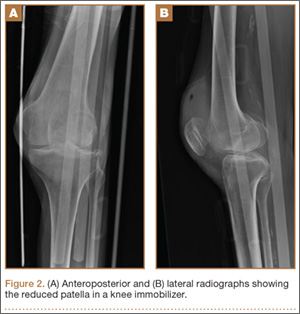
Radiographs of the patient’s knee confirmed a lateral dislocation of the patella (Figures 1A-1C). After oral and intravenous administration of pain medication, a reduction was attempted without success. Next, an intra-articular knee injection of 10 mL of 1% lidocaine was given. After waiting 15 minutes, another reduction was tried. While the pain control was sufficient, the reduction was again unsuccessful. The knee was insufflated with 120 mL of sterile saline and reduction attempted again. By extending the knee and applying a medially directed force to the patella, reduction was successful. The patient was placed into a knee immobilizer and postreduction radiographs were taken (Figures 2A, 2B). Saline was extracted from the knee. The patient was admitted to the hospital where repeat examination of his knees during the next week revealed markedly less pain. The patient was lost to follow-up.
Discussion
Our patient presumably had a low-energy mechanism of injury, resulting in an undiagnosed patellar dislocation with delayed treatment. This subacute patellar dislocation was irreducible using the standard techniques. Alternatively, insufflation of the joint with saline provided the necessary impetus to allow for successful patellar reduction. The history of the patient reveals clues about the mechanism of injury. It is likely that the patient’s nonambulatory status resulted in a weak vastus medialis muscle that placed the patella at risk for dislocation. While the exact mechanism of dislocation is unknown, the patella was unable to be reduced spontaneously because our patient’s knee was maintained in a state of flexion secondary to pain and muscle contraction. The combination of weak quadriceps musculature, increased Q angle, and forced hyperflexion of the knee prevented closed reduction of the patella.
Fixed, irreducible patellar dislocations are rare and discussed infrequently in the literature.9,11-12 Reported mechanisms are mostly high energy, including blows during athletics and impacts from motor vehicle collisions.9,13 Vertical axis rotation, as first described by Cooper,14 is commonly implicated in irreducible patellar dislocations. This occurs when the patella internally rotates 180º on its vertical axis, associated with a large tear of the medial retinaculum but intact quadriceps tendon. The patella is fixed over the lateral femoral condyle with the articular surface pointing anterolaterally. Despite adequate sedation and analgesia, these are notoriously difficult to close-reduce and may necessitate open reduction.3 Our patient, while having a fixed dislocation, did not have a vertical axis component and, therefore, was amenable to our closed reduction attempt.
Our first reduction attempts were unsuccessful, likely because the patient continued to be tense, firing his quadriceps. Even after injecting the knee with lidocaine and eliminating the pain component, the patella was still impinging on the lateral femoral condyle (Figure 3A). By insufflating the knee with saline, we were able to increase the distance from the patella to the trochlea (Figure 3B). This is comparable to a knee arthroscopy, in which joint fluid pressure allows passage of arthroscopic instruments into the patellofemoral joint. We postulate that the farther the patella is anterior to the trochlea, the higher the likelihood that the patella can be reduced to its anatomic position.
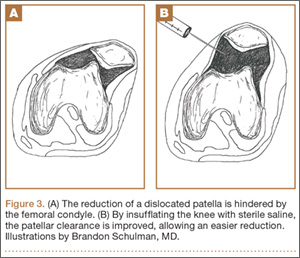
Insufflation of the knee with sterile saline is a novel technique that involves minimal risk compared with the alternatives. Sometimes, for closed reduction to be successful, individuals need to be consciously sedated to relax their muscles and eliminate pain. While conscious sedation is generally considered low risk, complications have been noted, including hypotension, apnea, and retrograde amnesia.15 Manual closed reduction may also cause additional chondral damage when the medial patellar facet contacts the lateral femoral trochlea. When closed reduction of the patella fails, open reduction is required; this inherently includes all the risks of surgery, such as bleeding, infection, neurovascular injury, and wound complications.
Our insufflation technique does not require sedation and is minimally invasive. The saline creates space and provides lubrication to allow for easier manipulation of the patella. This theoretically protects the cartilage as the patella passes over the lateral trochlea. In addition to the intended effect of providing more space and lubrication for the reduction of the patella, insufflation of the joint may also relax the vastus musculature.16 In their study, Torry and colleagues16 injected 13 knees with 20 mL sterile saline and noted reduction in electromyography readings in the vastus medialis and lateralis muscles. This inhibition of vastus musculature may provide enough relaxation to aid in the successful reduction of the patella.
Our study is limited by our sample size of 1. Because acute patellar dislocations are often easily reduced, our technical trick is not frequently used. Additionally, while we were able to monitor his progress during his inpatient stay, our patient was lost to follow-up after his discharge from the hospital.
If successful, the insufflation technique eliminates the need for urgent open reduction in the operating room. As a result, we recommend attempting closed reduction using insufflation of the knee with sterile saline for irreducible patellar dislocations before proceeding with open reduction.
Conclusion
Saline insufflation of the knee can be safely and easily performed to aid in the reduction of subacute, difficult patellar dislocations.
1. Fu FH, Seel M, Berger RA. Patellofemoral biomechanics. In: Fox J, del Pizzo W, eds. The Patellofemoral Joint. New York, NY: McGraw-Hill; 1993:49.
2. Dye SF. Patellofemoral anatomy. In: Fox J, del Pizzo W, eds. The Patellofemoral Joint. New York, NY: McGraw-Hill; 1993:2-3.
3. Li X, Nielsen NM, Zhou H, Stein BS, Shelton YA, Busconi BD. Surgical treatment of a chronically fixed lateral patella dislocation in an adolescent patient. Orthop Rev (Pavia). 2013;5(2):45-47.
4. Fithian DC, Paxton EW, Stone ML, et al. Epidemiology and natural history of acute patellar dislocation. Am J Sports Med. 2004;32(5):1114-1121.
5. Colvin AC, West RV. Patellar instability. J Bone Joint Surg Am. 2008;90(12):2751-2762.
6. Panni AS, Vasso M, Cerciello S. Acute patellar dislocation. What to do? Knee Surg Sports Traumatol Arthrosc. 2013;21(2):275-278.
7. Lu DW, Wang EE, Self WH, Kharasch M. Patellar dislocation reduction. Acad Emerg Med. 2010;17(2):226.
8. Michels F, Pouliart N, Oosterlinck D. Locked patellar dislocation: a case report. J Med Case Rep. 2008;2:371.
9. ElMaraghy AW, Berry GK, Kreder HJ. Irreducible lateral patellar dislocation with vertical axis rotation: case report and review of the literature. J Trauma. 2002;53(1):131-132.
10. Wajid MA, Cheema MQ, Siddique MS. Vertical axis patellar dislocation with ipsilateral femoral fracture: use of a closed percutaneous technique for reduction of the dislocation. J Orthop Trauma. 2006;20(2):143-146.
11. Shetty S, Ramesh B, Gul A, Madhusudan TR, Altayeb T. Vertical dislocation of the patella: report of 2 cases. Orthopedics. 2009;32(10). doi: 10.3928/01477447-20090818-25.
12. Hackl W, Benedetto KP, Fink C, Sailer R, Rieger M. Locked lateral patellar dislocation: a rare case of irreducible patellar dislocation requiring open reduction. Knee Surg Sports Traumatol Arthrosc. 1999;7(6):352-355.
13. Gidden DJ, Bell KM. An unusual case of irreducible intra-articular patellar dislocation with vertical axis rotation. Injury. 1995;26(9):643-644.
14. Cooper A. Dislocation of the patella. In: Cooper A, ed. A Treatise on the Dislocations and Fractures of the Joints. Philadelphia, PA: Lea & Febiger; 1844:195.
15. Swanson ER, Seaberg DC, Mathias S. The use of propofol for sedation in the emergency department. Acad Emerg Med. 2008;3(3):234-238.
16. Torry MR, Decker MJ, Millett PJ, Steadman JR, Sterett WI. The effects of knee joint effusion on quadriceps electromyography during jogging. J Sports Sci Med. 2005;4(1):1-8.
As the largest sesamoid bone in the human body, the patella acts as a fulcrum to enhance the biomechanical advantage of the quadriceps in extension.1 It is subject to a variety of forces while improving distribution of forces along the extensor mechanism.2 With sufficient force, the patella can be dislocated. Acute patellar dislocations are the most common knee injury, encompassing 2% to 3% of all knee injuries3 and occurring in 5.8 per 100,000 individuals.4-5 These injuries are associated with acute trauma, frequently from sports and physical activities, occurring while in terminal extension with an axial-valgus stress on the knee during rotation.6
With acute patellar dislocations, patients are usually in significant discomfort. Often, the patella may spontaneously reduce; if not, closed reduction is usually successful with pressure applied anteromedially on the lateral patellar margin, while simultaneously attempting gentle extension of the leg.7 Closed reduction is almost universally successful, and there have only been case reports of irreducible, mainly fixed vertical axis patellar dislocations.8-11 No reports in the literature have described subacute patellar dislocations because of their rarity. Patients present immediately after dislocation, spontaneously reduce, or have a painless, chronically dislocated patella.
We present a case of an elderly man with dementia and a subacute fixed irreducible patellar dislocation, which was reduced using a technique not described in the literature. The patient and the patient’s guardian provided written informed consent for print and electronic publication of this case report.
Case Report
A 68-year-old nonambulatory man with a history of dementia and stroke presented to the emergency department with complaints of left knee pain and his knee locked in flexion. The patient’s knee had been in that fixed hyperflexed position for at least 10 days after he sustained a twisting injury to his knee while attempting to get out of bed. At baseline, the patient was mostly bedbound and could walk minimally with maximum support, but, given his dementia, he would often attempt to ambulate by himself. After the injury, the patient did not complain of much pain at rest, but attempts at his group home to straighten his leg had caused severe pain. As a result, the patient was brought to the emergency department to be evaluated for fractures.
Physical examination in the emergency department revealed atrophy of the lower extremity musculature and a left knee fixed at 120º in flexion. The skin was intact, and there was minimal effusion of the knee joint. The patella was noted to be laterally subluxated and tender to palpation over the lateral and medial facets. He was neurovascularly intact distally and had painless range of motion of his hips. His contralateral right knee had full range of motion with good patellar tracking.
Radiographs of the patient’s knee confirmed a lateral dislocation of the patella (Figures 1A-1C). After oral and intravenous administration of pain medication, a reduction was attempted without success. Next, an intra-articular knee injection of 10 mL of 1% lidocaine was given. After waiting 15 minutes, another reduction was tried. While the pain control was sufficient, the reduction was again unsuccessful. The knee was insufflated with 120 mL of sterile saline and reduction attempted again. By extending the knee and applying a medially directed force to the patella, reduction was successful. The patient was placed into a knee immobilizer and postreduction radiographs were taken (Figures 2A, 2B). Saline was extracted from the knee. The patient was admitted to the hospital where repeat examination of his knees during the next week revealed markedly less pain. The patient was lost to follow-up.
Discussion
Our patient presumably had a low-energy mechanism of injury, resulting in an undiagnosed patellar dislocation with delayed treatment. This subacute patellar dislocation was irreducible using the standard techniques. Alternatively, insufflation of the joint with saline provided the necessary impetus to allow for successful patellar reduction. The history of the patient reveals clues about the mechanism of injury. It is likely that the patient’s nonambulatory status resulted in a weak vastus medialis muscle that placed the patella at risk for dislocation. While the exact mechanism of dislocation is unknown, the patella was unable to be reduced spontaneously because our patient’s knee was maintained in a state of flexion secondary to pain and muscle contraction. The combination of weak quadriceps musculature, increased Q angle, and forced hyperflexion of the knee prevented closed reduction of the patella.
Fixed, irreducible patellar dislocations are rare and discussed infrequently in the literature.9,11-12 Reported mechanisms are mostly high energy, including blows during athletics and impacts from motor vehicle collisions.9,13 Vertical axis rotation, as first described by Cooper,14 is commonly implicated in irreducible patellar dislocations. This occurs when the patella internally rotates 180º on its vertical axis, associated with a large tear of the medial retinaculum but intact quadriceps tendon. The patella is fixed over the lateral femoral condyle with the articular surface pointing anterolaterally. Despite adequate sedation and analgesia, these are notoriously difficult to close-reduce and may necessitate open reduction.3 Our patient, while having a fixed dislocation, did not have a vertical axis component and, therefore, was amenable to our closed reduction attempt.
Our first reduction attempts were unsuccessful, likely because the patient continued to be tense, firing his quadriceps. Even after injecting the knee with lidocaine and eliminating the pain component, the patella was still impinging on the lateral femoral condyle (Figure 3A). By insufflating the knee with saline, we were able to increase the distance from the patella to the trochlea (Figure 3B). This is comparable to a knee arthroscopy, in which joint fluid pressure allows passage of arthroscopic instruments into the patellofemoral joint. We postulate that the farther the patella is anterior to the trochlea, the higher the likelihood that the patella can be reduced to its anatomic position.
Insufflation of the knee with sterile saline is a novel technique that involves minimal risk compared with the alternatives. Sometimes, for closed reduction to be successful, individuals need to be consciously sedated to relax their muscles and eliminate pain. While conscious sedation is generally considered low risk, complications have been noted, including hypotension, apnea, and retrograde amnesia.15 Manual closed reduction may also cause additional chondral damage when the medial patellar facet contacts the lateral femoral trochlea. When closed reduction of the patella fails, open reduction is required; this inherently includes all the risks of surgery, such as bleeding, infection, neurovascular injury, and wound complications.
Our insufflation technique does not require sedation and is minimally invasive. The saline creates space and provides lubrication to allow for easier manipulation of the patella. This theoretically protects the cartilage as the patella passes over the lateral trochlea. In addition to the intended effect of providing more space and lubrication for the reduction of the patella, insufflation of the joint may also relax the vastus musculature.16 In their study, Torry and colleagues16 injected 13 knees with 20 mL sterile saline and noted reduction in electromyography readings in the vastus medialis and lateralis muscles. This inhibition of vastus musculature may provide enough relaxation to aid in the successful reduction of the patella.
Our study is limited by our sample size of 1. Because acute patellar dislocations are often easily reduced, our technical trick is not frequently used. Additionally, while we were able to monitor his progress during his inpatient stay, our patient was lost to follow-up after his discharge from the hospital.
If successful, the insufflation technique eliminates the need for urgent open reduction in the operating room. As a result, we recommend attempting closed reduction using insufflation of the knee with sterile saline for irreducible patellar dislocations before proceeding with open reduction.
Conclusion
Saline insufflation of the knee can be safely and easily performed to aid in the reduction of subacute, difficult patellar dislocations.
1. Fu FH, Seel M, Berger RA. Patellofemoral biomechanics. In: Fox J, del Pizzo W, eds. The Patellofemoral Joint. New York, NY: McGraw-Hill; 1993:49.
2. Dye SF. Patellofemoral anatomy. In: Fox J, del Pizzo W, eds. The Patellofemoral Joint. New York, NY: McGraw-Hill; 1993:2-3.
3. Li X, Nielsen NM, Zhou H, Stein BS, Shelton YA, Busconi BD. Surgical treatment of a chronically fixed lateral patella dislocation in an adolescent patient. Orthop Rev (Pavia). 2013;5(2):45-47.
4. Fithian DC, Paxton EW, Stone ML, et al. Epidemiology and natural history of acute patellar dislocation. Am J Sports Med. 2004;32(5):1114-1121.
5. Colvin AC, West RV. Patellar instability. J Bone Joint Surg Am. 2008;90(12):2751-2762.
6. Panni AS, Vasso M, Cerciello S. Acute patellar dislocation. What to do? Knee Surg Sports Traumatol Arthrosc. 2013;21(2):275-278.
7. Lu DW, Wang EE, Self WH, Kharasch M. Patellar dislocation reduction. Acad Emerg Med. 2010;17(2):226.
8. Michels F, Pouliart N, Oosterlinck D. Locked patellar dislocation: a case report. J Med Case Rep. 2008;2:371.
9. ElMaraghy AW, Berry GK, Kreder HJ. Irreducible lateral patellar dislocation with vertical axis rotation: case report and review of the literature. J Trauma. 2002;53(1):131-132.
10. Wajid MA, Cheema MQ, Siddique MS. Vertical axis patellar dislocation with ipsilateral femoral fracture: use of a closed percutaneous technique for reduction of the dislocation. J Orthop Trauma. 2006;20(2):143-146.
11. Shetty S, Ramesh B, Gul A, Madhusudan TR, Altayeb T. Vertical dislocation of the patella: report of 2 cases. Orthopedics. 2009;32(10). doi: 10.3928/01477447-20090818-25.
12. Hackl W, Benedetto KP, Fink C, Sailer R, Rieger M. Locked lateral patellar dislocation: a rare case of irreducible patellar dislocation requiring open reduction. Knee Surg Sports Traumatol Arthrosc. 1999;7(6):352-355.
13. Gidden DJ, Bell KM. An unusual case of irreducible intra-articular patellar dislocation with vertical axis rotation. Injury. 1995;26(9):643-644.
14. Cooper A. Dislocation of the patella. In: Cooper A, ed. A Treatise on the Dislocations and Fractures of the Joints. Philadelphia, PA: Lea & Febiger; 1844:195.
15. Swanson ER, Seaberg DC, Mathias S. The use of propofol for sedation in the emergency department. Acad Emerg Med. 2008;3(3):234-238.
16. Torry MR, Decker MJ, Millett PJ, Steadman JR, Sterett WI. The effects of knee joint effusion on quadriceps electromyography during jogging. J Sports Sci Med. 2005;4(1):1-8.
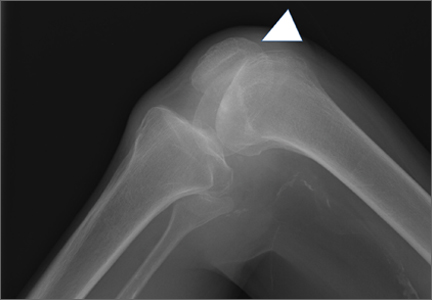
Total Hip Arthroplasty for Posttraumatic Osteoarthritis of the Hip Fares Worse Than THA for Primary Osteoarthritis
The incidence of hip fractures decreased between 1995 and 2005, but these injuries continue to occur in large numbers. Between 1986 and 2005, the mean annual number of hip fractures was 957.3/100,000, and the majority of these occurred in patients 75 to 84 years old.1 Investigators have described total hip arthroplasty (THA) performed after initial surgical treatment in patients who developed osteoarthritis (OA) of the hip secondary to a fracture.2-7 Only 1 of these studies compared these patients with a control group of patients who had THA for primary hip OA.2 No study included both previous proximal femur and acetabular fractures.
Postfracture OA may occur when there is residual articular incongruity after fracture or osteonecrosis of the femoral head. THA is commonly used to treat OA when more conservative treatments have failed.6 Other indications for conversion to THA include femoral neck nonunion, significant leg-length discrepancy, and femoral head damage caused by previous internal fixation.4
Given these conditions and previous study findings, THA performed in patients with previous hip fracture fixation is potentially more complicated than THA for primary OA. We therefore conducted a study to evaluate differences in sociodemographic factors, surgical details, and outcomes between patients who had THA for posttraumatic OA and patients who had THA for primary OA.
Materials and Methods
After obtaining institutional review board approval and patient consent, we used a prospective database to follow 3844 patients who had THA performed for OA by 1 of 17 different surgeons at a single center over an 8-year period. Patients who had THA for secondary causes of hip OA, developmental hip dysplasia, or inflammatory processes were excluded. Of the remaining 1199 patients, 62 (5.2%) had THA for posttraumatic OA after previous acetabular or proximal femur fracture fixation (Figures 1, 2) (no THA was performed at time of initial fracture treatment), and 1137 had THA for primary OA and served as the control group.
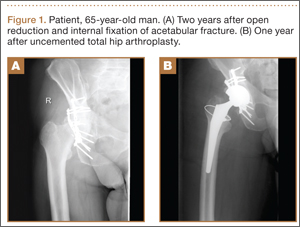
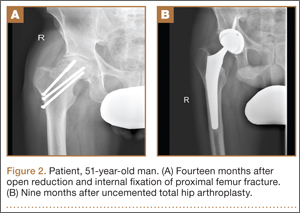
We collected data on age, sex, fracture location, reason for THA, time between open reduction and internal fixation (ORIF) and THA, type of components, cement use, leg-length discrepancy, intraoperative complications, blood loss, operating room time, and postoperative complications. All patients were aseptic at time of THA. All posttraumatic OA patients had previous hardware removed; the extent of hardware removal was dictated by the exposure required for prosthesis implantation. These patients were contacted, and clinical follow-up was assessed with modified Harris Hip Score (HHS).8 HHS was determined by Dr. Khurana. Statistical analysis was performed with Student t test and Pearson χ2 test using PASW Statistics 18 (SPSS, Chicago, Illinois).
The 62 posttraumatic OA patients had 63 fractures, 41 of the proximal femur (femoral neck and intertrochanteric; 65%) and 22 acetabular (35%). This group consisted of 33 females and 29 males. Their mean age at time of THA surgery was 58 years (range, 31-90 years). Mean age of the control patients was 59.4 years (range, 18-95 years). There were 35 right hips and 27 left hips in the posttrauma group. Mean body mass index (BMI) was 28.4 for the posttrauma group and 28.9 for the control group. There were no differences in age (P = .451), sex (P = .674), or BMI (P = .592) between the 2 groups (Table 1).
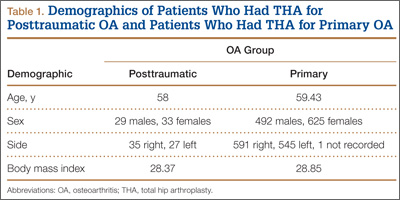
All 62 posttraumatic OA patients had complete hospital data, and 32 (52%) of the 62 underwent long-term follow-up (mean, 4.3 years; range, 4 months–10.5 years). At time of attempted contact (mean, 6.79 years after THA), 7 patients were deceased; cause of death was an unrelated medical condition (1) or unknown (6). The rest of the patients did not respond to multiple telephone and mail summons. Primary reasons for conversion to THA included OA (34 patients, 54%), development of osteonecrosis (12 patients, 19%), and nonunion (12 patients, 19%). The rest of the patients had fixation failure. The mechanisms of injury were motor vehicle accidents (30 patients), falls (20), and other causes (15).
Results
Thirty-two (52%) of the posttraumatic OA patients had a preoperative leg-length discrepancy. For these patients, mean time between initial fracture fixation and conversion to THA was 74 months (range, 1-480 months). Four patients required grafting with cancellous autogenous bone graft or allograft chips to fill a bony defect. Mean acetabular component diameter was 54 mm. Nineteen patients had acetabular fixation supplemented with screws. (Screw supplementation data were not recorded for control patients.) Three patients (4.7%) with an acetabular fracture had heterotopic bone removed at time of THA. Two patients underwent neurolysis of the sciatic nerve at time of surgery for preexisting nerve palsy.
Mean postoperative hemoglobin was 109 g/L in the posttraumatic OA group and 121 g/L in the control group (P <. 001). Mean postoperative hematocrit was 0.327 and 0.367, respectively (P < .001). Mean amount of Cell Saver (Haemonetics) used by patients was 176.2 and 72.9 mL, respectively (P < .001). Posttrauma patients lost a mean of 360 mL of blood more than control patients did (P < .001) and were transfused a mean of 1.59 units of blood, compared with 0.85 unit in the controls (P < .001). Patients with acetabular fractures required a mean of only 0.65 unit of transfused blood. Mean operating room time was 240.5 minutes for posttrauma patients and 135.6 minutes for control patients (P < .001). In the posttrauma group, mean size of the head of the femoral component was 29 mm (head size was not recorded for the control group). Posttrauma patients had 18 (29%) hybrid cemented hip replacements (femoral component only) and 44 uncemented hip replacements. Data on femoral stem size and type were not reported for either group.
Twenty-four posttrauma patients (39%) had a total of 63 perioperative complications, and 131 control patients (11.5%) had a total of 160 complications (P < .001). Complications in posttrauma patients with proximal femur fractures included excess bleeding (5 patients), in-hospital dislocations (2), and postoperative infections (4: 2 superficial wound infections, 1 implant infection requiring explant, 1 Clostridium difficile infection); in patients with acetabular fractures, there was only 1 dislocation (no infections). The posttraumatic OA group did not develop any symptomatic venous thromboembolic complications. One patient developed a sciatic nerve palsy after surgery. Of the 3 patients who sustained dislocations, 2 were treated with closed reduction and maintenance of implants, and 1 with revision THA. Complications in the control group included 3 infections, 4 dislocations, and 12 cases of extensive blood loss (Table 2).
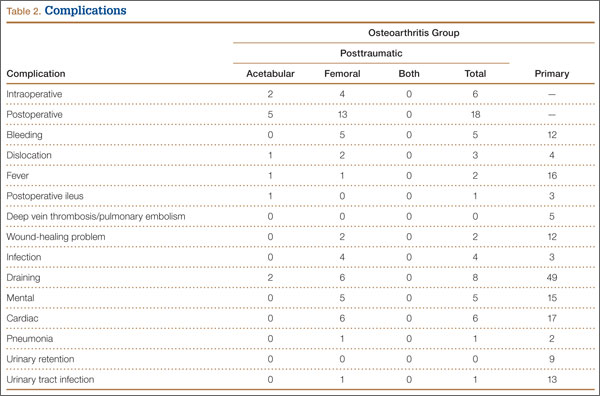
In patients with long-term follow-up, mean postoperative modified HHS was 81.33 (range, 34.1-100.1). Twelve patients had an excellent score (>90), 10 a good score (80-89), 4 a fair score (70-79), and 6 a poor score (<70). Mean HHS was 84.2 for the 16 patients with a femoral head or neck fracture, 77.7 for the 6 patients with an intertrochanteric fracture, and 84.3 for the 9 patients with an acetabular fracture. Nine patients reported using a cane, 3 required walkers, 2 required wheelchairs, and 18 did not require any walking support. Four (12.5%) of the 32 patients required THA revision a mean of 3.5 years (range, 2 months–8 years) after initial arthroplasty. Reasons for revision were infections (2 patients), multiple dislocations (1), and dissociation of acetabular lining (1) (Table 3). Two of the patients who underwent THA revision had a cemented femoral stem, and 2 did not have any cemented implants. Additional details of the femoral stem components were not available for either group.
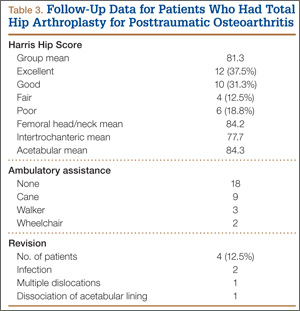
Discussion
Patients who develop posttraumatic OA of the hip have limited options. THA has emerged as an excellent option in cases of failed repair of fractures about the hip joint. The results of the present study are consistent with earlier findings of the effectiveness of THA in salvaging posttraumatic hips.2-7 THA for patients with posttraumatic arthritis of the hip after acetabular or proximal femur fracture is longer and more complicated than THA for primary OA, and there is significantly more blood loss. In addition, the rate of early failure appears to be higher.9
In this study, mean amount of blood transfused for patients with previous acetabular fracture was 0.65 unit, much less than the mean of 3.5 units noted by Weber and colleagues.6 In their study, complications associated with THA were increased in patients with posttraumatic OA from acetabular fractures. The authors attributed these complications to scarring from previous surgery, retained hardware, heterotopic bone, and residual osseous deformity and deficiency. Our results support their conclusion. Operating times were longer, as well as blood loss and the need for blood transfusions and other blood products were increased in the patients with posttraumatic OA, as compared with patients with primary OA. Fifteen percent of patients with an acetabular fracture had undergone removal of heterotopic bone at time of surgery—similar to the rate of 18% noted in the Weber study.6
Our results showed that the rate of revision THA was also higher than in patients with primary THA within the general population—reported to be about 4%.9 The higher rate may be the result of the additional surgeries performed on patients with fractures, or hardware retention increasing the infection risk over the years. Our revision rate of 12.5% was similar to the 19% found by Ranawat and colleagues7 in their study.
A majority of the patients in our study had favorable long-term HHS. Mean overall HHS was 83, slightly better than the 79 reported by Srivastav and colleagues.4 We found that patients with intertrochanteric fractures ultimately had worse outcome scores than patients with acetabular or femoral neck fractures. These results are consistent with findings reported by Mehlhoff and colleagues5 in a study comparing patients with femoral neck and intertrochanteric fractures. Mean HHS for the intertrochanteric fracture patients in our study was 77.7, comparable to the mean of 78 reported by Mehlhoff and colleagues.5 Mean HHS for the femoral neck or head fractures in our study was 84.2, similar to the mean of 81 they noted. Patients with a previous acetabular fracture in our study had a mean HHS of 84.3, consistent with the 84 reported by Ranawat and colleagues7 for patients who had initially undergone ORIF for acetabular fracture. Mean HHS in our study (83) was slightly less than the 88.5 reported by Shi and colleagues10 in their study of primary THAs.
Few studies have been conducted exclusively on one type of hip fracture (acetabular) or another (proximal femur), and all except 1 did not perform a comparison. Tabsh and colleagues2 compared similar cohorts but focused solely on patients with previous proximal femur fractures. The present study included a control group and both acetabular and proximal femur fractures, which allowed us to compare patients with and without previous fracture fixation and to consider the 2 different fracture types and see if they affected outcomes.
The strengths of this study include the large control group and the relatively short data-collection period. The shorter period decreased the influence of improvements in implants on patient outcomes. In addition, the control group was our own population, as we did not compare our cohort of patients with previous internal fixation and patients who had primary THAs in other studies, aside from comparisons for revision rates and HHS.
Although the ultimate long-term follow-up rate for patients with previous internal fixation was 50%, our sample size was still larger than that in most reported studies. Another weakness of our study was the large number of surgeons (17), representing an array of techniques, approaches, and surgical experience. All these factors could have influenced patient outcomes and operative data. In addition, data on revision rates and HHS were not available for our control group, so we could not directly compare these outcomes with those of the posttraumatic group. However, we used previously reported data on revision rates and HHS in primary THAs for comparison with the posttraumatic group.9,10
Conclusion
In this study, THA was a viable option for patients with posttraumatic arthritis from a previous acetabular or proximal femur fracture. The outcomes, however, were less reliable than the outcomes of primary THA for degenerative arthritis, and the complication rates were higher. Surgeons should counsel patients about the complexity of the procedure as well as its ultimately favorable outcomes. Surgeons should expect additional technical difficulties in the operating room when treating this patient population.
1. Brauer CA, Coca-Perraillon M, Cutler DM, Rosen AB. Incidence and mortality of hip fractures in the United States. JAMA. 2009;302(14):1573-1579.
2. Tabsh I, Waddell JP, Morton J. Total hip arthroplasty for complications of proximal femoral fractures. J Orthop Trauma. 1997;11(3):166-169.
3. Haidukewych GJ, Berry DJ. Hip arthroplasty for salvage of failed treatment of intertrochanteric hip fractures. J Bone Joint Surg Am. 2003;85(5):899-904.
4. Srivastav S, Mittal V, Agarwal S. Total hip arthroplasty following failed fixation of proximal hip fractures. Indian J Orthop. 2008;42(3):279-286.
5. Mehlhoff T, Landon GC, Tullos HS. Total hip arthroplasty following failed internal fixation of hip fractures. Clin Orthop Relat Res. 1991;(269):32-37.
6. Weber M, Berry DJ, Harmsen WS. Total hip arthroplasty after operative treatment of an acetabular fracture. J Bone Joint Surg Am. 1998;80(9):1295-1305.
7. Ranawat A, Zelken J, Helfet D, Buly R. Total hip arthroplasty for posttraumatic arthritis after acetabular fracture. J Arthroplasty. 2009;24(5):759-767.
8. Harris WH. Traumatic arthritis of the hip after dislocation and acetabular fractures: treatment by mold arthroplasty. An end-result study using a new method of result evaluation. J Bone Joint Surg Am. 1969;51(4):737-755.
9. Mahomed NN, Barrett JA, Katz JN, et al. Rates and outcomes of primary and revision total hip replacement in the United States Medicare population. J Bone Joint Surg Am. 2003;85(1):27-32.
10. Shi HY, Mau LW, Chang JK, Wang JW, Chiu HC. Responsiveness of the Harris Hip Score and the SF-36: five years after total hip arthroplasty. Qual Life Res. 2009;18(8):1053-1060.
The incidence of hip fractures decreased between 1995 and 2005, but these injuries continue to occur in large numbers. Between 1986 and 2005, the mean annual number of hip fractures was 957.3/100,000, and the majority of these occurred in patients 75 to 84 years old.1 Investigators have described total hip arthroplasty (THA) performed after initial surgical treatment in patients who developed osteoarthritis (OA) of the hip secondary to a fracture.2-7 Only 1 of these studies compared these patients with a control group of patients who had THA for primary hip OA.2 No study included both previous proximal femur and acetabular fractures.
Postfracture OA may occur when there is residual articular incongruity after fracture or osteonecrosis of the femoral head. THA is commonly used to treat OA when more conservative treatments have failed.6 Other indications for conversion to THA include femoral neck nonunion, significant leg-length discrepancy, and femoral head damage caused by previous internal fixation.4
Given these conditions and previous study findings, THA performed in patients with previous hip fracture fixation is potentially more complicated than THA for primary OA. We therefore conducted a study to evaluate differences in sociodemographic factors, surgical details, and outcomes between patients who had THA for posttraumatic OA and patients who had THA for primary OA.
Materials and Methods
After obtaining institutional review board approval and patient consent, we used a prospective database to follow 3844 patients who had THA performed for OA by 1 of 17 different surgeons at a single center over an 8-year period. Patients who had THA for secondary causes of hip OA, developmental hip dysplasia, or inflammatory processes were excluded. Of the remaining 1199 patients, 62 (5.2%) had THA for posttraumatic OA after previous acetabular or proximal femur fracture fixation (Figures 1, 2) (no THA was performed at time of initial fracture treatment), and 1137 had THA for primary OA and served as the control group.
We collected data on age, sex, fracture location, reason for THA, time between open reduction and internal fixation (ORIF) and THA, type of components, cement use, leg-length discrepancy, intraoperative complications, blood loss, operating room time, and postoperative complications. All patients were aseptic at time of THA. All posttraumatic OA patients had previous hardware removed; the extent of hardware removal was dictated by the exposure required for prosthesis implantation. These patients were contacted, and clinical follow-up was assessed with modified Harris Hip Score (HHS).8 HHS was determined by Dr. Khurana. Statistical analysis was performed with Student t test and Pearson χ2 test using PASW Statistics 18 (SPSS, Chicago, Illinois).
The 62 posttraumatic OA patients had 63 fractures, 41 of the proximal femur (femoral neck and intertrochanteric; 65%) and 22 acetabular (35%). This group consisted of 33 females and 29 males. Their mean age at time of THA surgery was 58 years (range, 31-90 years). Mean age of the control patients was 59.4 years (range, 18-95 years). There were 35 right hips and 27 left hips in the posttrauma group. Mean body mass index (BMI) was 28.4 for the posttrauma group and 28.9 for the control group. There were no differences in age (P = .451), sex (P = .674), or BMI (P = .592) between the 2 groups (Table 1).
All 62 posttraumatic OA patients had complete hospital data, and 32 (52%) of the 62 underwent long-term follow-up (mean, 4.3 years; range, 4 months–10.5 years). At time of attempted contact (mean, 6.79 years after THA), 7 patients were deceased; cause of death was an unrelated medical condition (1) or unknown (6). The rest of the patients did not respond to multiple telephone and mail summons. Primary reasons for conversion to THA included OA (34 patients, 54%), development of osteonecrosis (12 patients, 19%), and nonunion (12 patients, 19%). The rest of the patients had fixation failure. The mechanisms of injury were motor vehicle accidents (30 patients), falls (20), and other causes (15).
Results
Thirty-two (52%) of the posttraumatic OA patients had a preoperative leg-length discrepancy. For these patients, mean time between initial fracture fixation and conversion to THA was 74 months (range, 1-480 months). Four patients required grafting with cancellous autogenous bone graft or allograft chips to fill a bony defect. Mean acetabular component diameter was 54 mm. Nineteen patients had acetabular fixation supplemented with screws. (Screw supplementation data were not recorded for control patients.) Three patients (4.7%) with an acetabular fracture had heterotopic bone removed at time of THA. Two patients underwent neurolysis of the sciatic nerve at time of surgery for preexisting nerve palsy.
Mean postoperative hemoglobin was 109 g/L in the posttraumatic OA group and 121 g/L in the control group (P <. 001). Mean postoperative hematocrit was 0.327 and 0.367, respectively (P < .001). Mean amount of Cell Saver (Haemonetics) used by patients was 176.2 and 72.9 mL, respectively (P < .001). Posttrauma patients lost a mean of 360 mL of blood more than control patients did (P < .001) and were transfused a mean of 1.59 units of blood, compared with 0.85 unit in the controls (P < .001). Patients with acetabular fractures required a mean of only 0.65 unit of transfused blood. Mean operating room time was 240.5 minutes for posttrauma patients and 135.6 minutes for control patients (P < .001). In the posttrauma group, mean size of the head of the femoral component was 29 mm (head size was not recorded for the control group). Posttrauma patients had 18 (29%) hybrid cemented hip replacements (femoral component only) and 44 uncemented hip replacements. Data on femoral stem size and type were not reported for either group.
Twenty-four posttrauma patients (39%) had a total of 63 perioperative complications, and 131 control patients (11.5%) had a total of 160 complications (P < .001). Complications in posttrauma patients with proximal femur fractures included excess bleeding (5 patients), in-hospital dislocations (2), and postoperative infections (4: 2 superficial wound infections, 1 implant infection requiring explant, 1 Clostridium difficile infection); in patients with acetabular fractures, there was only 1 dislocation (no infections). The posttraumatic OA group did not develop any symptomatic venous thromboembolic complications. One patient developed a sciatic nerve palsy after surgery. Of the 3 patients who sustained dislocations, 2 were treated with closed reduction and maintenance of implants, and 1 with revision THA. Complications in the control group included 3 infections, 4 dislocations, and 12 cases of extensive blood loss (Table 2).
In patients with long-term follow-up, mean postoperative modified HHS was 81.33 (range, 34.1-100.1). Twelve patients had an excellent score (>90), 10 a good score (80-89), 4 a fair score (70-79), and 6 a poor score (<70). Mean HHS was 84.2 for the 16 patients with a femoral head or neck fracture, 77.7 for the 6 patients with an intertrochanteric fracture, and 84.3 for the 9 patients with an acetabular fracture. Nine patients reported using a cane, 3 required walkers, 2 required wheelchairs, and 18 did not require any walking support. Four (12.5%) of the 32 patients required THA revision a mean of 3.5 years (range, 2 months–8 years) after initial arthroplasty. Reasons for revision were infections (2 patients), multiple dislocations (1), and dissociation of acetabular lining (1) (Table 3). Two of the patients who underwent THA revision had a cemented femoral stem, and 2 did not have any cemented implants. Additional details of the femoral stem components were not available for either group.
Discussion
Patients who develop posttraumatic OA of the hip have limited options. THA has emerged as an excellent option in cases of failed repair of fractures about the hip joint. The results of the present study are consistent with earlier findings of the effectiveness of THA in salvaging posttraumatic hips.2-7 THA for patients with posttraumatic arthritis of the hip after acetabular or proximal femur fracture is longer and more complicated than THA for primary OA, and there is significantly more blood loss. In addition, the rate of early failure appears to be higher.9
In this study, mean amount of blood transfused for patients with previous acetabular fracture was 0.65 unit, much less than the mean of 3.5 units noted by Weber and colleagues.6 In their study, complications associated with THA were increased in patients with posttraumatic OA from acetabular fractures. The authors attributed these complications to scarring from previous surgery, retained hardware, heterotopic bone, and residual osseous deformity and deficiency. Our results support their conclusion. Operating times were longer, as well as blood loss and the need for blood transfusions and other blood products were increased in the patients with posttraumatic OA, as compared with patients with primary OA. Fifteen percent of patients with an acetabular fracture had undergone removal of heterotopic bone at time of surgery—similar to the rate of 18% noted in the Weber study.6
Our results showed that the rate of revision THA was also higher than in patients with primary THA within the general population—reported to be about 4%.9 The higher rate may be the result of the additional surgeries performed on patients with fractures, or hardware retention increasing the infection risk over the years. Our revision rate of 12.5% was similar to the 19% found by Ranawat and colleagues7 in their study.
A majority of the patients in our study had favorable long-term HHS. Mean overall HHS was 83, slightly better than the 79 reported by Srivastav and colleagues.4 We found that patients with intertrochanteric fractures ultimately had worse outcome scores than patients with acetabular or femoral neck fractures. These results are consistent with findings reported by Mehlhoff and colleagues5 in a study comparing patients with femoral neck and intertrochanteric fractures. Mean HHS for the intertrochanteric fracture patients in our study was 77.7, comparable to the mean of 78 reported by Mehlhoff and colleagues.5 Mean HHS for the femoral neck or head fractures in our study was 84.2, similar to the mean of 81 they noted. Patients with a previous acetabular fracture in our study had a mean HHS of 84.3, consistent with the 84 reported by Ranawat and colleagues7 for patients who had initially undergone ORIF for acetabular fracture. Mean HHS in our study (83) was slightly less than the 88.5 reported by Shi and colleagues10 in their study of primary THAs.
Few studies have been conducted exclusively on one type of hip fracture (acetabular) or another (proximal femur), and all except 1 did not perform a comparison. Tabsh and colleagues2 compared similar cohorts but focused solely on patients with previous proximal femur fractures. The present study included a control group and both acetabular and proximal femur fractures, which allowed us to compare patients with and without previous fracture fixation and to consider the 2 different fracture types and see if they affected outcomes.
The strengths of this study include the large control group and the relatively short data-collection period. The shorter period decreased the influence of improvements in implants on patient outcomes. In addition, the control group was our own population, as we did not compare our cohort of patients with previous internal fixation and patients who had primary THAs in other studies, aside from comparisons for revision rates and HHS.
Although the ultimate long-term follow-up rate for patients with previous internal fixation was 50%, our sample size was still larger than that in most reported studies. Another weakness of our study was the large number of surgeons (17), representing an array of techniques, approaches, and surgical experience. All these factors could have influenced patient outcomes and operative data. In addition, data on revision rates and HHS were not available for our control group, so we could not directly compare these outcomes with those of the posttraumatic group. However, we used previously reported data on revision rates and HHS in primary THAs for comparison with the posttraumatic group.9,10
Conclusion
In this study, THA was a viable option for patients with posttraumatic arthritis from a previous acetabular or proximal femur fracture. The outcomes, however, were less reliable than the outcomes of primary THA for degenerative arthritis, and the complication rates were higher. Surgeons should counsel patients about the complexity of the procedure as well as its ultimately favorable outcomes. Surgeons should expect additional technical difficulties in the operating room when treating this patient population.
1. Brauer CA, Coca-Perraillon M, Cutler DM, Rosen AB. Incidence and mortality of hip fractures in the United States. JAMA. 2009;302(14):1573-1579.
2. Tabsh I, Waddell JP, Morton J. Total hip arthroplasty for complications of proximal femoral fractures. J Orthop Trauma. 1997;11(3):166-169.
3. Haidukewych GJ, Berry DJ. Hip arthroplasty for salvage of failed treatment of intertrochanteric hip fractures. J Bone Joint Surg Am. 2003;85(5):899-904.
4. Srivastav S, Mittal V, Agarwal S. Total hip arthroplasty following failed fixation of proximal hip fractures. Indian J Orthop. 2008;42(3):279-286.
5. Mehlhoff T, Landon GC, Tullos HS. Total hip arthroplasty following failed internal fixation of hip fractures. Clin Orthop Relat Res. 1991;(269):32-37.
6. Weber M, Berry DJ, Harmsen WS. Total hip arthroplasty after operative treatment of an acetabular fracture. J Bone Joint Surg Am. 1998;80(9):1295-1305.
7. Ranawat A, Zelken J, Helfet D, Buly R. Total hip arthroplasty for posttraumatic arthritis after acetabular fracture. J Arthroplasty. 2009;24(5):759-767.
8. Harris WH. Traumatic arthritis of the hip after dislocation and acetabular fractures: treatment by mold arthroplasty. An end-result study using a new method of result evaluation. J Bone Joint Surg Am. 1969;51(4):737-755.
9. Mahomed NN, Barrett JA, Katz JN, et al. Rates and outcomes of primary and revision total hip replacement in the United States Medicare population. J Bone Joint Surg Am. 2003;85(1):27-32.
10. Shi HY, Mau LW, Chang JK, Wang JW, Chiu HC. Responsiveness of the Harris Hip Score and the SF-36: five years after total hip arthroplasty. Qual Life Res. 2009;18(8):1053-1060.
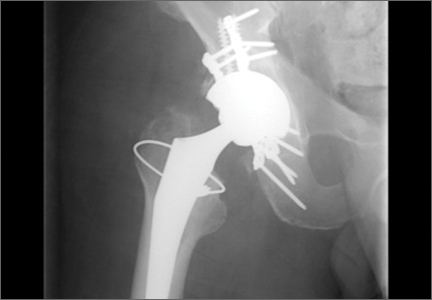
The Role of Vitamin C in Orthopedic Trauma and Bone Health
L-ascorbic acid, more commonly know as vitamin C, is an essential micronutrient used in numerous metabolic pathways. It functions physiologically as a water-soluble antioxidant by virtue of its high reducing power, playing a key role in the function of leukocytes, protein metabolism, and production of neurotransmitters.1-3 Vitamin C also contributes to musculoskeletal health through biosynthesis of carnitine and collagen4 and enhancement of intestinal absorption of dietary iron5 from plants and vegetables. Unlike most animals, humans are unable to synthesize this essential vitamin and therefore require intake from natural dietary sources or supplements.6 The ability of vitamin C to prevent or treat disease has been an area of research interest since the vitamin was identified and isolated by Szent-Györgyi in the 1930s.7-16 Research in orthopedic surgery has focused on the effects of vitamin C on fracture healing, its potential use in preventing complex regional pain syndrome (CRPS), and its role in the pathophysiology of osteoarthritis. In this article, we review the basics of vitamin C metabolism and summarize the evidence surrounding the role of vitamin C supplementation in orthopedics.
Sources and Metabolism
Vitamin C is found naturally in many fruits and vegetables (Table 1) and is a common fortification in cereals, juices, and multivitamins. Daily recommended intake (Table 2) depends on age and smoking status. Absorption occurs in the distal small intestine, with blood plasma vitamin C concentrations reflecting dietary intake. Pharmacokinetic studies have shown that vitamin C concentrations are tightly regulated through absorption, tissue accumulation, and renal resorption, with plasma concentrations rarely exceeding 100 μmol/L without additional supplementation.17 Although the usual dietary doses of 100 mg/d (adult) are almost completely absorbed, producing a plasma concentration of 60 μmol/L, higher intake results in an increasingly smaller fraction absorbed.1,18 Intake of more than 1000 mg/d results in less than 50% absorption19 (unmetabolized vitamin C is excreted in stool and urine1). Even at higher doses, vitamin C has low toxicity3; the most common complaints are diarrhea, nausea, and abdominal cramps caused by the osmotic effect of unabsorbed vitamin C in the gastrointestinal tract.1
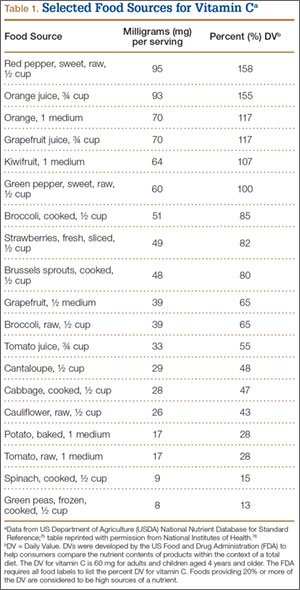
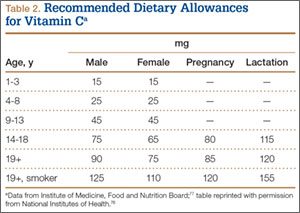
Vitamin C Deficiency
The relationship between vitamin C deficiency and the development of scurvy has been documented for centuries. Symptoms are described in the ancient Egyptian, Greek, and Roman literature.20 Ascorbic acid is essential for normal collagen function, as it is a required cofactor for enzymatic transfer of hydroxyl groups to select proline and lysine residues during procollagen formation. Hydroxylysine contributes to the intermolecular cross-links in collagen, and hydroxyproline stabilizes the triple-helix structure of collagen.21 Insufficient vitamin C during this process results in collagen that is non-cross-linked, nonhelical, structurally unstable, and weak.21 Clinical manifestations of scurvy stem from an underlying impairment of collagen production causing a systemic decrease in connective tissue integrity, capillary fragility, poor wound healing, fatigue, myalgias, arthritis, and even death.22 Vitamin C deficiency has also been implicated as a cause of diffuse bleeding in surgical patients with normal coagulation parameters secondary to capillary fragility.23 In the United States, the 2003–2004 National Health and Nutrition Examination Survey (NHANES) measured serum vitamin C concentrations in 7277 noninstitutionalized patients 6 years old or older.24 Age-adjusted incidence of subnormal serum vitamin C levels (<28 μmol/L) was 19.6%, and incidence of frank vitamin C deficiency (<11.4 μmol/L) was 7.1%. Reported rates of vitamin C deficiency in hospitalized patients are much higher, with 47% to 60% having subnormal values (<28 μmol/L) and 17% to 19% being vitamin C–deficient (<11.4 μmol/L).22,25 Identified risk factors for hypovitaminosis C include advanced age, obesity, low socioeconomic status, unemployment, male sex, and concomitant alcohol and tobacco consumption.22,24,25
Fracture Healing and Prevention
The effects of vitamin C deficiency on bone healing have been studied with animal models as early as the 1940s.26,27 Early experiments using guinea pigs demonstrated failure of bone graft incorporation, delayed collagen maturation, and decreased collagen and callus formation in scorbutic animals compared with controls that received vitamin C supplementation.26,27 Based on his work with guinea pigs, Bourne26 reported in 1942 that vitamin C deficiency significantly inhibited the reparative process in damaged bone and that patients with fractures should receive vitamin C supplementation. Building on this early research, Yilmaz and colleagues28 found faster histologic healing for tibia fractures in a rat model for animals that received a single injection of vitamin C 0.5 mg/kg compared with a nonscorbutic control group, and Sarisözen and colleagues29 showed significantly accelerated histologic bone formation and mineralization at the fracture site for rats that received vitamin C supplementation. Moreover, Kipp and colleagues30 found that scorbutic guinea pigs had lower bone mineral density (BMD), decreased bone mineral content, and impaired collagen synthesis of articular cartilage and tendons compared with nondeficient controls.
Besides promoting bone formation, vitamin C improves the mechanical strength of callus formation. Alcantara-Martos and colleagues31 used an osteogenic disorder Shionogi (ODS) rat model to examine the effects of vitamin C intake on femoral fracture healing. This particular animal model is unable to produce its own vitamin C. The groups with lower serum vitamin C levels demonstrated lower mechanical resistance of the fracture callus to torsional loads 5 weeks after fracture. Moreover, the group that received vitamin C supplementation showed higher histologic grade of callus formation and demonstrated faster healing rates. The authors suggested that subclinical vitamin C deficiency can delay fracture healing and that vitamin C supplementation in nondeficient patients would improve bone healing.
Other research has demonstrated a link between vitamin C and mesenchymal cell differentiation. Mohan and colleagues32 used an sfx mouse model to show that vitamin C deficiency results in decreased bone formation secondary to impaired osteoblast differentiation, diminished bone density, and development of spontaneous fractures. The authors indicated that not only is vitamin C essential for maintenance of differentiated functions of osteoblasts, but deficiency during early active growth may affect peak BMD levels in humans. Additional studies have demonstrated the role of vitamin C in endochondral bone formation through both induction of osteoblast differentiation and modulation of gene expression in hypertrophic chondrocytes.33-36 Chronic vitamin C deficiency has been found to depress osteoblast function and differentiation of chondrocytes.37 More recently, Kim and colleagues38 examined the effect of vitamin C insufficiency in Gulo-deficient mice, which are unable to synthesize ascorbic acid. Ascorbic acid insufficiency over 4 weeks led to decreased plasma levels of osteocalcin and bone formation in vivo as well as significantly diminished metaphyseal trabecular bone. Despite all the evidence demonstrating the importance of vitamin C in bone formation and maintenance, many of the underlying processes in this relationship have yet to be determined.
Bone Mineral Density
Several observational studies have found a positive association between vitamin C intake and BMD in postmenopausal women. In a retrospective, cross-sectional study by Hall and Greendale,39 a positive association was found between vitamin C intake and BMD of the femoral neck in 775 participants in the Postmenopausal Estrogen/Progestin Interventions trial. After calcium intake, physical activity level, smoking, estrogen use, age, and body mass index were adjusted for, each 100-mg increase in dietary vitamin C was associated with a 0.017 g/cm2 increase in BMD. Wang and colleagues40 found a positive association between dietary vitamin C intake and femoral neck BMD in a retrospective analysis of 125 postmenopausal Mexican American women. Other observational studies have reported that decreased intake of vitamin C is associated with osteoporosis41 and increased rates of BMD loss42 and that supplementation with vitamin C may suppress bone resorption in postmenopausal women.43
The results of these studies contrast with the findings of Leveille and colleagues,44 who examined the relationship between dietary vitamin C and hip BMD in 1892 postmenopausal women. Although the authors found that women (age, 55-64 years) using vitamin C supplements for more than 10 years had an average BMD 6.7% higher than that of nonusers, they did not find any association between dietary vitamin C intake and BMD. Moreover, NHANES III also found inconsistent associations between vitamin C and BMD among 13,080 adults surveyed in the United States.45 Although for premenopausal women dietary ascorbic acid was associated with increased BMD, for postmenopausal women with a history of smoking and estrogen replacement, it was actually associated with lower BMD values. For other subgroups in the study, the relationship was also inconsistent or nonlinear.
The exact mechanism by which ascorbic acid contributes to BMD is not fully delineated. However, it likely is related to the known role of vitamin C in collagen formation, bone matrix development, osteoblast differentiation, and its antioxidant effects limiting bone resorption.44,46
Hip Fractures
Besides demonstrating positive effects of vitamin C on bone healing and BMD, epidemiologic studies have found evidence of a protective effect of vitamin C on hip fracture risk. In a study of the Swedish Mammography cohort, 66,651 women (age, 40-76 years) were prospectively followed.47 The authors found that the odds ratio (OR) for hip fractures among smokers with a low intake of vitamin E (median intake, ≤6.2 mg/d) was 3.0 (95% CI, 1.6-5.4) and for vitamin C (median intake, ≤67 mg/d) was 3.0 (95% CI, 1.6-5.6). Moreover, in smokers with a low intake of both vitamins E and C, OR increased to 4.9 (95% CI, 2.2-11.0). In addition, the Utah Study of Nutrition and Bone Health matched 1215 cases of hip fractures in patients who had ever smoked (age, >50 years) with 1349 controls and found that vitamin C intake above 159 mg/d had a significant protective effect on the incidence of hip fracture; however, a graded relationship was not observed.48 Despite the inconsistencies in the NHANES III study regarding the relationship between vitamin C and BMD, Simon and Hudes45 found that serum vitamin C was associated with lower risk for self-reported fracture in postmenopausal women who had ever smoked and had a history of estrogen therapy (OR, 0.51; 95% CI, 0.36-0.70). Finally, Sahni and colleagues49 followed 958 Framingham cohort men and women (mean age, 75 years) over 17 years and found that those in the highest tertile of total vitamin C intake (median, 313 mg/d) had significantly fewer hip fractures and nonvertebral fractures compared with those in the lowest tertile of intake (median, 94 mg/d). Dietary vitamin C intake was not associated with fracture risk in this study.
Complex Regional Pain Syndrome
Type 1 CRPS is a debilitating condition characterized by severe pain, swelling, and vasomotor instability. It is commonly precipitated by an injury or surgery to an extremity and is a dreaded sequelae in orthopedics,50 with incidence rates of 10% to 22% in wrist fractures51-53 and 10% after foot and ankle surgery.54 Although the pathophysiology of CRPS remains unknown, dysregulation and increased permeability of the vasculature caused by free radicals are thought to play an important role.55 In dermal burns, high doses of vitamin C therapy slowed progression of vascular permeability and therefore reduced extravascular leakage of fluids and protein.56,57 The ability of vitamin C to prevent CRPS has been studied in only a handful of trials.
In a double-blind trial, Zollinger and colleagues51 randomized 127 conservatively treated distal radius fractures to receive either vitamin C 500 mg or placebo daily for 50 days starting on day of injury. Incidence of CRPS (using the diagnostic criteria proposed by Veldman and colleagues58) at 1-year follow-up was 22% in the placebo group and 7% in the vitamin C group (95% CI for difference, 2%-26%). Complaints while wearing the cast and fracture type increased the risk for developing CRPS. This initial study was followed up by a prospective, randomized, double-blind multicenter trial by the same authors,52 who had 416 patients with 427 wrist fractures receive either placebo or vitamin C 200 mg/d, 500 mg/d, or 1500 mg/d for 50 days. This follow-up study included both operative (11%) and nonoperative (89%) distal radius fractures. Incidence of CRPS was 10.1% in the placebo group and 2.4% in the vitamin C group (P < .002). Although there was an appreciable drop in the relative risk (RR) of developing CRPS between the vitamin C 200-mg/d and 500-mg/d groups (0.41-0.17), there was no additional benefit in the 1500-mg/d group. Pooling the data for these 2 randomized trials showed that the overall RR for developing CRPS was lower with vitamin C supplementation (RR, 0.28; 95% CI, 0.14-0.56; P = .0003).59
Results of the 2 trials by Zollinger and colleagues51,52 have been met with several concerns.60-62 As a corollary to the unclear etiology of CRPS, several different sets of diagnostic criteria exist, and the criteria are somewhat subjective and imprecise. Although both trials used the Veldman criteria,58 the incidence of CRPS in the placebo group dropped unexpectedly between trials, from 22% to 10.1%, and the results may have been different had other criteria been used. Moreover, the idea that toxic oxygen radicals have a role in CRPS and that vitamin C can scavenge these radicals is based on limited data.61 In the absence of a clear pathophysiologic explanation, some surgeons have been reluctant to treat patients with vitamin C supplementation.
Cazeneuve and colleagues53 also studied the effect of vitamin C supplementation on CRPS in patients with distal radius fractures treated with reduction and intrafocal pinning. Group 1 consisted of 100 patients (treated from 1995 to 1998) who did not receive vitamin C supplementation, and group 2 consisted of 95 patients (treated from 1998 to 2002) who received vitamin C 1000 mg/d for 45 days starting on day of fracture. Patients were followed for up to 90 days after surgery. Incidence of CRPS type 1 was 10% in the untreated group and 2.1% in the group that received vitamin C supplementation.
Vitamin C prophylaxis for CRPS has also been studied in foot and ankle surgery. Besse and colleagues54 prospectively compared 2 chronologically successive groups that received (235 feet) or did not receive (185 feet) vitamin C 1000-mg/d supplementation for 45 days. Incidence of CRPS type 1 as diagnosed with International Association for the Study of Pain (IASP) criteria dropped from 9.6% to 1.7% with vitamin C supplementation. In a case series, Zollinger and colleagues63 examined CRPS type 1 rates after performing cementless total trapeziometacarpal semiconstrained joint prosthesis implantations for trapeziometacarpal arthritis. Forty implantations were performed in 34 patients. All patients received vitamin C 500 mg/d for CRPS prevention starting 2 days before surgery for 50 days. There were no cases of CRPS in the postoperative period, according to Veldman or IASP criteria. Although the results of the studies by Cazeneuve and colleagues53 and Besse and colleagues54 agree with those of the distal radius fracture trials by Zollinger and colleagues,51,52 the quasi-experimental design and the lack of blinding and randomization temper the conclusions that can be drawn because of the risk for significant bias.
In a recent systematic review examining the effectiveness of vitamin C supplementation in preventing CRPS in trauma and surgery in the extremities, Shibuya and colleagues64 concluded that taking at least 500 mg of vitamin C daily for 45 to 50 days after injury or surgery may help decrease the incidence of CRPS after a traumatic event.
Osteoarthritis
Damage caused by free radicals has long been thought to play an important role in osteoarthritis (OA).65-67 A cross-sectional study in knee OA found that amounts of joint fluid antioxidants were lower in patients with severe arthritis than in those with intact cartilage, further implicating free radicals in the pathophysiology of OA.68 Use of vitamin C for prophylaxis against development or progression of OA is therefore a hot research topic. Thus far, animal studies have had mixed results—several showing a chondroprotective effect of vitamin C69,70 and others finding either no effect or even a positive association with the development of arthritis.71
The literature on human subjects, chiefly observational studies, is just as controversial. Wang and colleagues40 found vitamin C intake associated with both a 50% risk reduction of bone marrow lesions on magnetic resonance imaging over a 10-year interval (OR, 0.5; 95% CI, 0.29-0.87) and inversely associated with the tibial plateau bone area. Similarly, the Clearwater Osteoarthritis Study, which followed 1023 patients (age, >40 years), showed that participants who took vitamin C supplements were 11% less likely to develop radiographic evidence of OA (RR, 0.89; 95% CI, 0.85-0.93).72 Nonetheless, other studies have failed to show such associations73 or have demonstrated the opposite effect. Chaganti and colleagues74 analyzed levels of vitamins C and E in the Multicenter Osteoarthritis Study (MOST) cohort of 3026 men and women (age, 50-79 years) and found higher vitamin levels were not protective against incidence of radiographic whole-knee OA and may even have been associated with increased risk.
Conclusion
Vitamin C is an essential micronutrient and a powerful water-soluble antioxidant in numerous biochemical pathways that influence bone health. It has been implicated in the biology of fracture healing, and vitamin C supplementation has been proposed as prophylaxis against hip fractures based on observational data. Results of 2 high-quality double-blind randomized trials support use of vitamin C as prophylaxis against CRPS in wrist fractures treated conservatively and operatively; the evidence for foot and ankle surgery is weaker. Use of vitamin C in OA prevention has tremendous potential, though animal and human study results are controversial. Heterogeneous results and lack of prospective trials preclude any recommendation at this time.
1. Jacob RA, Sotoudeh G. Vitamin C function and status in chronic disease. Nutr Clin Care. 2002;5(2):66-74.
2. Frei B, England L, Ames BN. Ascorbate is an outstanding antioxidant in human blood plasma. Proc Natl Acad Sci U S A. 1989;86(16):6377-6381.
3. Monsen ER. Dietary reference intakes for the antioxidant nutrients: vitamin C, vitamin E, selenium, and carotenoids. J Am Diet Assoc. 2000;100(6):637-640.
4. Padh H. Vitamin C: newer insights into its biochemical functions. Nutr Rev. 1991;49(3):65-70.
5. Gershoff SN. Vitamin C (ascorbic acid): new roles, new requirements? Nutr Rev. 1993;51(11):313-326.
6. Li Y, Schellhorn HE. New developments and novel therapeutic perspectives for vitamin C. J Nutr. 2007;137(10):2171-2184.
7. Szent-Györgyi A. On the function of hexuronic acid in the respiration of the cabbage leaf. J Biol Chem. 1931;90(1):385-393.
8. Svirbely JL, Szent-Györgyi A. The chemical nature of vitamin C. Biochem J. 1933;27(1):279-285.
9. Pauling L. Vitamin C and the Common Cold. San Francisco, CA: Freeman; 1970.
10. Spittle CR. Atherosclerosis and vitamin C. Lancet. 1971;2(7737):1280-1281.
11. Chappell LC, Seed PT, Briley AL, et al. Effect of antioxidants on the occurrence of pre-eclampsia in women at increased risk: a randomised trial. Lancet. 1999;354(9181):810-816.
12. Block G. Vitamin C and cancer prevention: the epidemiologic evidence. Am J Clin Nutr. 1991;53(1 suppl):270S-282S.
13. Creagan ET, Moertel CG, O’Fallon JR, et al. Failure of high-dose vitamin C (ascorbic acid) therapy to benefit patients with advanced cancer. A controlled trial. N Engl J Med. 1979;301(13):687-690.
14. Hemila H, Chalker E. Vitamin C for preventing and treating the common cold. Cochrane Database Syst Rev. 2013;1:CD000980.
15. Poston L, Briley AL, Seed PT, Kelly FJ, Shennan AH; Vitamins in Pre-eclampsia (VIP) Trial Consortium. Vitamin C and vitamin E in pregnant women at risk for pre-eclampsia (VIP trial): randomised placebo-controlled trial. Lancet. 2006;367(9517):1145-1154.
16. Roberts JM, Myatt L, Spong CY, et al; Eunice Kennedy Shriver National Institute of Child Health and Human Development Maternal-Fetal Medicine Units Network. Vitamins C and E to prevent complications of pregnancy-associated hypertension. N Engl J Med. 2010;362(14):1282-1291.
17. Levine M, Padayatty SJ, Espey MG. Vitamin C: a concentration-function approach yields pharmacology and therapeutic discoveries. Adv Nutr. 2011;2(2):78-88.
18. Levine M, Rumsey SC, Daruwala R, Park JB, Wang Y. Criteria and recommendations for vitamin C intake. JAMA. 1999;281(15):1415-1423.
19. Glatthaar BE, Hornig DH, Moser U. The role of ascorbic acid in carcinogenesis. Adv Exp Med Biol. 1986;206:357-377.
20. Carpenter KJ. The History of Scurvy and Vitamin C. New York, NY: Cambridge University Press; 1986.
21. Murad S, Grove D, Lindberg KA, Reynolds G, Sivarajah A, Pinnell SR. Regulation of collagen synthesis by ascorbic acid. Proc Natl Acad Sci U S A. 1981;78(5):2879-2882.
22. Fain O, Pariés J, Jacquart B, et al. Hypovitaminosis C in hospitalized patients. Eur J Intern Med. 2003;14(7):419-425.
23. Blee TH, Cogbill TH, Lambert PJ. Hemorrhage associated with vitamin C deficiency in surgical patients. Surgery. 2002;131(4):408-412.
24. Schleicher RL, Carroll MD, Ford ES, Lacher DA. Serum vitamin C and the prevalence of vitamin C deficiency in the United States: 2003–2004 National Health and Nutrition Examination Survey (NHANES). Am J Clin Nutr. 2009;90(5):1252-1263.
25. Gan R, Eintracht S, Hoffer LJ. Vitamin C deficiency in a university teaching hospital. J Am Coll Nutr. 2008;27(3):428-433.
26. Bourne G. The effect of graded doses of vitamin C upon the regeneration of bone in guinea-pigs on a scorbutic diet. J Physiol. 1942;101(3):327-336.
27. Bourne GH. The relative importance of periosteum and endosteum in bone healing and the relationship of vitamin C to their activities. Proc R Soc Med. 1944;37(6):275-279.
28. Yilmaz C, Erdemli E, Selek H, Kinik H, Arikan M, Erdemli B. The contribution of vitamin C to healing of experimental fractures. Arch Orthop Trauma Surg. 2001;121(7):426-428.
29. Sarisözen B, Durak K, Dinçer G, Bilgen OF. The effects of vitamins E and C on fracture healing in rats. J Int Med Res. 2002;30(3):309-313.
30. Kipp DE, McElvain M, Kimmel DB, Akhter MP, Robinson RG, Lukert BP. Scurvy results in decreased collagen synthesis and bone density in the guinea pig animal model. Bone. 1996;18(3):281-288.
31. Alcantara-Martos T, Delgado-Martinez AD, Vega MV, Carrascal MT, Munuera-Martinez L. Effect of vitamin C on fracture healing in elderly osteogenic disorder Shionogi rats. J Bone Joint Surg Br. 2007;89(3):402-407.
32. Mohan S, Kapoor A, Singgih A, et al. Spontaneous fractures in the mouse mutant sfx are caused by deletion of the gulonolactone oxidase gene, causing vitamin C deficiency. J Bone Miner Res. 2005;20(9):1597-1610.
33. Aronow MA, Gerstenfeld LC, Owen TA, Tassinari MS, Stein GS, Lian JB. Factors that promote progressive development of the osteoblast phenotype in cultured fetal rat calvaria cells. J Cell Physiol. 1990;143(2):213-221.
34. Franceschi RT, Iyer BS. Relationship between collagen synthesis and expression of the osteoblast phenotype in MC3T3-E1 cells. J Bone Miner Res. 1992;7(2):235-246.
35. Leboy PS, Vaias L, Uschmann B, Golub E, Adams SL, Pacifici M. Ascorbic acid induces alkaline phosphatase, type X collagen, and calcium deposition in cultured chick chondrocytes. J Biol Chem. 1989;264(29):17281-17286.
36. Xiao G, Cui Y, Ducy P, Karsenty G, Franceschi RT. Ascorbic acid–dependent activation of the osteocalcin promoter in MC3T3-E1 preosteoblasts: requirement for collagen matrix synthesis and the presence of an intact OSE2 sequence. Mol Endocrinol. 1997;11(8):1103-1113.
37. Sakamoto Y, Takano Y. Morphological influence of ascorbic acid deficiency on endochondral ossification in osteogenic disorder Shionogi rat. Anat Rec. 2002;268(2):93-104.
38. Kim W, Bae S, Kim H, et al. Ascorbic acid insufficiency induces the severe defect on bone formation via the down-regulation of osteocalcin production. Anat Cell Biol. 2013;46(4):254-261.
39. Hall SL, Greendale GA. The relation of dietary vitamin C intake to bone mineral density: results from the PEPI study. Calcif Tissue Int. 1998;63(3):183-189.
40. Wang Y, Hodge AM, Wluka AE, et al. Effect of antioxidants on knee cartilage and bone in healthy, middle-aged subjects: a cross-sectional study. Arthritis Res Ther. 2007;9(4):R66.
41. Maggio D, Barabani M, Pierandrei M, et al. Marked decrease in plasma antioxidants in aged osteoporotic women: results of a cross-sectional study. J Clin Endocrinol Metab. 2003;88(4):1523-1527.
42. Kaptoge S, Welch A, McTaggart A, et al. Effects of dietary nutrients and food groups on bone loss from the proximal femur in men and women in the 7th and 8th decades of age. Osteoporosis Int. 2003;14(5):418-428.
43. Pasco JA, Henry MJ, Wilkinson LK, Nicholson GC, Schneider HG, Kotowicz MA. Antioxidant vitamin supplements and markers of bone turnover in a community sample of nonsmoking women. J Womens Health. 2006;15(3):295-300.
44. Leveille SG, LaCroix AZ, Koepsell TD, Beresford SA, Van Belle G, Buchner DM. Dietary vitamin C and bone mineral density in postmenopausal women in Washington state, USA. J Epidemiol Community Health. 1997;51(5):479-485.
45. Simon JA, Hudes ES. Relation of ascorbic acid to bone mineral density and self-reported fractures among US adults. Am J Epidemiol. 2001;154(5):427-433.
46. Wolf RL, Cauley JA, Pettinger M, et al. Lack of a relation between vitamin and mineral antioxidants and bone mineral density: results from the Women’s Health Initiative. Am J Clin Nutr. 2005;82(3):581-588.
47. Melhus H, Michaelsson K, Holmberg L, Wolk A, Ljunghall S. Smoking, antioxidant vitamins, and the risk of hip fracture. J Bone Miner Res. 1999;14(1):129-135.
48. Zhang J, Munger RG, West NA, Cutler DR, Wengreen HJ, Corcoran CD. Antioxidant intake and risk of osteoporotic hip fracture in Utah: an effect modified by smoking status. Am J Epidemiol. 2006;163(1):9-17.
49. Sahni S, Hannan MT, Blumberg J, Cupples LA, Kiel DP, Tucker KL. Protective effect of total carotenoid and lycopene intake on the risk of hip fracture: a 17-year follow-up from the Framingham Osteoporosis Study. J Bone Miner Res. 2009;24(6):1086-1094.
50. Rho RH, Brewer RP, Lamer TJ, Wilson PR. Complex regional pain syndrome. Mayo Clin Proc. 2002;77(2):174-180.
51. Zollinger PE, Tuinebreijer WE, Kreis RW, Breederveld RS. Effect of vitamin C on frequency of reflex sympathetic dystrophy in wrist fractures: a randomised trial. Lancet. 1999;354(9195):2025-2028.
52. Zollinger PE, Tuinebreijer WE, Breederveld RS, Kreis RW. Can vitamin C prevent complex regional pain syndrome in patients with wrist fractures? A randomized, controlled, multicenter dose–response study. J Bone Joint Surg Am. 2007;89(7):1424-1431.
53. Cazeneuve JF, Leborgne JM, Kermad K, Hassan Y. Vitamin C and prevention of reflex sympathetic dystrophy following surgical management of distal radius fractures [in French]. Acta Orthop Belg. 2002;68(5):481-484.
54. Besse JL, Gadeyne S, Galand-Desme S, Lerat JL, Moyen B. Effect of vitamin C on prevention of complex regional pain syndrome type I in foot and ankle surgery. Foot Ankle Surg. 2009;15(4):179-182.
55. Goris RJ, Dongen LM, Winters HA. Are toxic oxygen radicals involved in the pathogenesis of reflex sympathetic dystrophy? Free Radic Res Commun. 1987;3(1-5):13-18.
56. Matsuda T, Tanaka H, Shimazaki S, et al. High-dose vitamin C therapy for extensive deep dermal burns. Burns. 1992;18(2):127-131.
57. Matsuda T, Tanaka H, Hanumadass M, et al. Effects of high-dose vitamin C administration on postburn microvascular fluid and protein flux. J Burn Care Rehabil. 1992;13(5):560-566.
58. Veldman PH, Reynen HM, Arntz IE, Goris RJ. Signs and symptoms of reflex sympathetic dystrophy: prospective study of 829 patients. Lancet. 1993;342(8878):1012-1016.
59. Zollinger PE. The administration of vitamin C in prevention of CRPS-I after distal radial fractures and hand surgery—a review of two RCTs and one observational prospective study. Open Conference Proc J. 2011;2:1-4.
60. Rogers BA, Ricketts DM. Can vitamin C prevent complex regional pain syndrome in patients with wrist fractures? J Bone Joint Surg Am. 2008;90(2):447-448.
61. Amadio PC. Vitamin C reduced the incidence of reflex sympathetic dystrophy after wrist fracture. J Bone Joint Surg Am. 2000;82(6):873.
62. Frolke JP. Can vitamin C prevent complex regional pain syndrome in patients with wrist fractures? J Bone Joint Surg Am. 2007;89(11):2550-2551.
63. Zollinger PE, Unal H, Ellis ML, Tuinebreijer WE. Clinical results of 40 consecutive basal thumb prostheses and no CRPS type I after vitamin C prophylaxis. Open Orthop J. 2010;4:62-66.
64. Shibuya N, Humphers JM, Agarwal MR, Jupiter DC. Efficacy and safety of high-dose vitamin C on complex regional pain syndrome in extremity trauma and surgery—systematic review and meta-analysis. J Foot Ankle Surg. 2013;52(1):62-66.
65. Henrotin Y, Deby-Dupont G, Deby C, De Bruyn M, Lamy M, Franchimont P. Production of active oxygen species by isolated human chondrocytes. Br J Rheumatol. 1993;32(7):562-567.
66. McAlindon TE, Jacques P, Zhang Y, et al. Do antioxidant micronutrients protect against the development and progression of knee osteoarthritis? Arthritis Rheum. 1996;39(4):648-656.
67. Kaiki G, Tsuji H, Yonezawa T, et al. Osteoarthrosis induced by intra-articular hydrogen peroxide injection and running load. J Orthop Res. 1990;8(5):731-740.
68. Regan EA, Bowler RP, Crapo JD. Joint fluid antioxidants are decreased in osteoarthritic joints compared to joints with macroscopically intact cartilage and subacute injury. Osteoarthritis Cartilage. 2008;16(4):515-521.
69. Meacock SC, Bodmer JL, Billingham ME. Experimental osteoarthritis in guinea-pigs. J Exp Pathol. 1990;71(2):279-293.
70. Kurz B, Jost B, Schunke M. Dietary vitamins and selenium diminish the development of mechanically induced osteoarthritis and increase the expression of antioxidative enzymes in the knee joint of STR/1N mice. Osteoarthritis Cartilage. 2002;10(2):119-126.
71. Kraus VB, Huebner JL, Stabler T, et al. Ascorbic acid increases the severity of spontaneous knee osteoarthritis in a guinea pig model. Arthritis Rheum. 2004;50(6):1822-1831.
72. Peregoy J, Wilder FV. The effects of vitamin C supplementation on incident and progressive knee osteoarthritis: a longitudinal study. Public Health Nutr. 2011;14(4):709-715.
73. Hill J, Bird HA. Failure of selenium-ace to improve osteoarthritis. Br J Rheumatol. 1990;29(3):211-213.
74. Chaganti RK, Tolstykh I, Javaid MK, et al; Multicenter Osteoarthritis Study Group (MOST). High plasma levels of vitamin C and E are associated with incident radiographic knee osteoarthritis. Osteoarthritis Cartilage. 2014;22(2):190-196.
75. US Department of Agriculture, Agricultural Research Service. USDA National Nutrient Database for Standard Reference. Release 26. http://www.ars.usda.gov/Services/docs.htm?docid=24936. Published August 2013. Revised November 2013. Accessed May 14, 2015.
76. National Institutes of Health, Office of Dietary Supplements. Vitamin C: fact sheet for health professionals. National Institutes of Health website. http://ods.od.nih.gov/factsheets/VitaminC-HealthProfessional/. Reviewed June 5, 2013. Accessed May 14, 2015.
77. Institute of Medicine, Food and Nutrition Board. Dietary Reference Intakes for Vitamin C, Vitamin E, Selenium, and Carotenoids. Washington, DC: National Academy Press; 2000.
L-ascorbic acid, more commonly know as vitamin C, is an essential micronutrient used in numerous metabolic pathways. It functions physiologically as a water-soluble antioxidant by virtue of its high reducing power, playing a key role in the function of leukocytes, protein metabolism, and production of neurotransmitters.1-3 Vitamin C also contributes to musculoskeletal health through biosynthesis of carnitine and collagen4 and enhancement of intestinal absorption of dietary iron5 from plants and vegetables. Unlike most animals, humans are unable to synthesize this essential vitamin and therefore require intake from natural dietary sources or supplements.6 The ability of vitamin C to prevent or treat disease has been an area of research interest since the vitamin was identified and isolated by Szent-Györgyi in the 1930s.7-16 Research in orthopedic surgery has focused on the effects of vitamin C on fracture healing, its potential use in preventing complex regional pain syndrome (CRPS), and its role in the pathophysiology of osteoarthritis. In this article, we review the basics of vitamin C metabolism and summarize the evidence surrounding the role of vitamin C supplementation in orthopedics.
Sources and Metabolism
Vitamin C is found naturally in many fruits and vegetables (Table 1) and is a common fortification in cereals, juices, and multivitamins. Daily recommended intake (Table 2) depends on age and smoking status. Absorption occurs in the distal small intestine, with blood plasma vitamin C concentrations reflecting dietary intake. Pharmacokinetic studies have shown that vitamin C concentrations are tightly regulated through absorption, tissue accumulation, and renal resorption, with plasma concentrations rarely exceeding 100 μmol/L without additional supplementation.17 Although the usual dietary doses of 100 mg/d (adult) are almost completely absorbed, producing a plasma concentration of 60 μmol/L, higher intake results in an increasingly smaller fraction absorbed.1,18 Intake of more than 1000 mg/d results in less than 50% absorption19 (unmetabolized vitamin C is excreted in stool and urine1). Even at higher doses, vitamin C has low toxicity3; the most common complaints are diarrhea, nausea, and abdominal cramps caused by the osmotic effect of unabsorbed vitamin C in the gastrointestinal tract.1
Vitamin C Deficiency
The relationship between vitamin C deficiency and the development of scurvy has been documented for centuries. Symptoms are described in the ancient Egyptian, Greek, and Roman literature.20 Ascorbic acid is essential for normal collagen function, as it is a required cofactor for enzymatic transfer of hydroxyl groups to select proline and lysine residues during procollagen formation. Hydroxylysine contributes to the intermolecular cross-links in collagen, and hydroxyproline stabilizes the triple-helix structure of collagen.21 Insufficient vitamin C during this process results in collagen that is non-cross-linked, nonhelical, structurally unstable, and weak.21 Clinical manifestations of scurvy stem from an underlying impairment of collagen production causing a systemic decrease in connective tissue integrity, capillary fragility, poor wound healing, fatigue, myalgias, arthritis, and even death.22 Vitamin C deficiency has also been implicated as a cause of diffuse bleeding in surgical patients with normal coagulation parameters secondary to capillary fragility.23 In the United States, the 2003–2004 National Health and Nutrition Examination Survey (NHANES) measured serum vitamin C concentrations in 7277 noninstitutionalized patients 6 years old or older.24 Age-adjusted incidence of subnormal serum vitamin C levels (<28 μmol/L) was 19.6%, and incidence of frank vitamin C deficiency (<11.4 μmol/L) was 7.1%. Reported rates of vitamin C deficiency in hospitalized patients are much higher, with 47% to 60% having subnormal values (<28 μmol/L) and 17% to 19% being vitamin C–deficient (<11.4 μmol/L).22,25 Identified risk factors for hypovitaminosis C include advanced age, obesity, low socioeconomic status, unemployment, male sex, and concomitant alcohol and tobacco consumption.22,24,25
Fracture Healing and Prevention
The effects of vitamin C deficiency on bone healing have been studied with animal models as early as the 1940s.26,27 Early experiments using guinea pigs demonstrated failure of bone graft incorporation, delayed collagen maturation, and decreased collagen and callus formation in scorbutic animals compared with controls that received vitamin C supplementation.26,27 Based on his work with guinea pigs, Bourne26 reported in 1942 that vitamin C deficiency significantly inhibited the reparative process in damaged bone and that patients with fractures should receive vitamin C supplementation. Building on this early research, Yilmaz and colleagues28 found faster histologic healing for tibia fractures in a rat model for animals that received a single injection of vitamin C 0.5 mg/kg compared with a nonscorbutic control group, and Sarisözen and colleagues29 showed significantly accelerated histologic bone formation and mineralization at the fracture site for rats that received vitamin C supplementation. Moreover, Kipp and colleagues30 found that scorbutic guinea pigs had lower bone mineral density (BMD), decreased bone mineral content, and impaired collagen synthesis of articular cartilage and tendons compared with nondeficient controls.
Besides promoting bone formation, vitamin C improves the mechanical strength of callus formation. Alcantara-Martos and colleagues31 used an osteogenic disorder Shionogi (ODS) rat model to examine the effects of vitamin C intake on femoral fracture healing. This particular animal model is unable to produce its own vitamin C. The groups with lower serum vitamin C levels demonstrated lower mechanical resistance of the fracture callus to torsional loads 5 weeks after fracture. Moreover, the group that received vitamin C supplementation showed higher histologic grade of callus formation and demonstrated faster healing rates. The authors suggested that subclinical vitamin C deficiency can delay fracture healing and that vitamin C supplementation in nondeficient patients would improve bone healing.
Other research has demonstrated a link between vitamin C and mesenchymal cell differentiation. Mohan and colleagues32 used an sfx mouse model to show that vitamin C deficiency results in decreased bone formation secondary to impaired osteoblast differentiation, diminished bone density, and development of spontaneous fractures. The authors indicated that not only is vitamin C essential for maintenance of differentiated functions of osteoblasts, but deficiency during early active growth may affect peak BMD levels in humans. Additional studies have demonstrated the role of vitamin C in endochondral bone formation through both induction of osteoblast differentiation and modulation of gene expression in hypertrophic chondrocytes.33-36 Chronic vitamin C deficiency has been found to depress osteoblast function and differentiation of chondrocytes.37 More recently, Kim and colleagues38 examined the effect of vitamin C insufficiency in Gulo-deficient mice, which are unable to synthesize ascorbic acid. Ascorbic acid insufficiency over 4 weeks led to decreased plasma levels of osteocalcin and bone formation in vivo as well as significantly diminished metaphyseal trabecular bone. Despite all the evidence demonstrating the importance of vitamin C in bone formation and maintenance, many of the underlying processes in this relationship have yet to be determined.
Bone Mineral Density
Several observational studies have found a positive association between vitamin C intake and BMD in postmenopausal women. In a retrospective, cross-sectional study by Hall and Greendale,39 a positive association was found between vitamin C intake and BMD of the femoral neck in 775 participants in the Postmenopausal Estrogen/Progestin Interventions trial. After calcium intake, physical activity level, smoking, estrogen use, age, and body mass index were adjusted for, each 100-mg increase in dietary vitamin C was associated with a 0.017 g/cm2 increase in BMD. Wang and colleagues40 found a positive association between dietary vitamin C intake and femoral neck BMD in a retrospective analysis of 125 postmenopausal Mexican American women. Other observational studies have reported that decreased intake of vitamin C is associated with osteoporosis41 and increased rates of BMD loss42 and that supplementation with vitamin C may suppress bone resorption in postmenopausal women.43
The results of these studies contrast with the findings of Leveille and colleagues,44 who examined the relationship between dietary vitamin C and hip BMD in 1892 postmenopausal women. Although the authors found that women (age, 55-64 years) using vitamin C supplements for more than 10 years had an average BMD 6.7% higher than that of nonusers, they did not find any association between dietary vitamin C intake and BMD. Moreover, NHANES III also found inconsistent associations between vitamin C and BMD among 13,080 adults surveyed in the United States.45 Although for premenopausal women dietary ascorbic acid was associated with increased BMD, for postmenopausal women with a history of smoking and estrogen replacement, it was actually associated with lower BMD values. For other subgroups in the study, the relationship was also inconsistent or nonlinear.
The exact mechanism by which ascorbic acid contributes to BMD is not fully delineated. However, it likely is related to the known role of vitamin C in collagen formation, bone matrix development, osteoblast differentiation, and its antioxidant effects limiting bone resorption.44,46
Hip Fractures
Besides demonstrating positive effects of vitamin C on bone healing and BMD, epidemiologic studies have found evidence of a protective effect of vitamin C on hip fracture risk. In a study of the Swedish Mammography cohort, 66,651 women (age, 40-76 years) were prospectively followed.47 The authors found that the odds ratio (OR) for hip fractures among smokers with a low intake of vitamin E (median intake, ≤6.2 mg/d) was 3.0 (95% CI, 1.6-5.4) and for vitamin C (median intake, ≤67 mg/d) was 3.0 (95% CI, 1.6-5.6). Moreover, in smokers with a low intake of both vitamins E and C, OR increased to 4.9 (95% CI, 2.2-11.0). In addition, the Utah Study of Nutrition and Bone Health matched 1215 cases of hip fractures in patients who had ever smoked (age, >50 years) with 1349 controls and found that vitamin C intake above 159 mg/d had a significant protective effect on the incidence of hip fracture; however, a graded relationship was not observed.48 Despite the inconsistencies in the NHANES III study regarding the relationship between vitamin C and BMD, Simon and Hudes45 found that serum vitamin C was associated with lower risk for self-reported fracture in postmenopausal women who had ever smoked and had a history of estrogen therapy (OR, 0.51; 95% CI, 0.36-0.70). Finally, Sahni and colleagues49 followed 958 Framingham cohort men and women (mean age, 75 years) over 17 years and found that those in the highest tertile of total vitamin C intake (median, 313 mg/d) had significantly fewer hip fractures and nonvertebral fractures compared with those in the lowest tertile of intake (median, 94 mg/d). Dietary vitamin C intake was not associated with fracture risk in this study.
Complex Regional Pain Syndrome
Type 1 CRPS is a debilitating condition characterized by severe pain, swelling, and vasomotor instability. It is commonly precipitated by an injury or surgery to an extremity and is a dreaded sequelae in orthopedics,50 with incidence rates of 10% to 22% in wrist fractures51-53 and 10% after foot and ankle surgery.54 Although the pathophysiology of CRPS remains unknown, dysregulation and increased permeability of the vasculature caused by free radicals are thought to play an important role.55 In dermal burns, high doses of vitamin C therapy slowed progression of vascular permeability and therefore reduced extravascular leakage of fluids and protein.56,57 The ability of vitamin C to prevent CRPS has been studied in only a handful of trials.
In a double-blind trial, Zollinger and colleagues51 randomized 127 conservatively treated distal radius fractures to receive either vitamin C 500 mg or placebo daily for 50 days starting on day of injury. Incidence of CRPS (using the diagnostic criteria proposed by Veldman and colleagues58) at 1-year follow-up was 22% in the placebo group and 7% in the vitamin C group (95% CI for difference, 2%-26%). Complaints while wearing the cast and fracture type increased the risk for developing CRPS. This initial study was followed up by a prospective, randomized, double-blind multicenter trial by the same authors,52 who had 416 patients with 427 wrist fractures receive either placebo or vitamin C 200 mg/d, 500 mg/d, or 1500 mg/d for 50 days. This follow-up study included both operative (11%) and nonoperative (89%) distal radius fractures. Incidence of CRPS was 10.1% in the placebo group and 2.4% in the vitamin C group (P < .002). Although there was an appreciable drop in the relative risk (RR) of developing CRPS between the vitamin C 200-mg/d and 500-mg/d groups (0.41-0.17), there was no additional benefit in the 1500-mg/d group. Pooling the data for these 2 randomized trials showed that the overall RR for developing CRPS was lower with vitamin C supplementation (RR, 0.28; 95% CI, 0.14-0.56; P = .0003).59
Results of the 2 trials by Zollinger and colleagues51,52 have been met with several concerns.60-62 As a corollary to the unclear etiology of CRPS, several different sets of diagnostic criteria exist, and the criteria are somewhat subjective and imprecise. Although both trials used the Veldman criteria,58 the incidence of CRPS in the placebo group dropped unexpectedly between trials, from 22% to 10.1%, and the results may have been different had other criteria been used. Moreover, the idea that toxic oxygen radicals have a role in CRPS and that vitamin C can scavenge these radicals is based on limited data.61 In the absence of a clear pathophysiologic explanation, some surgeons have been reluctant to treat patients with vitamin C supplementation.
Cazeneuve and colleagues53 also studied the effect of vitamin C supplementation on CRPS in patients with distal radius fractures treated with reduction and intrafocal pinning. Group 1 consisted of 100 patients (treated from 1995 to 1998) who did not receive vitamin C supplementation, and group 2 consisted of 95 patients (treated from 1998 to 2002) who received vitamin C 1000 mg/d for 45 days starting on day of fracture. Patients were followed for up to 90 days after surgery. Incidence of CRPS type 1 was 10% in the untreated group and 2.1% in the group that received vitamin C supplementation.
Vitamin C prophylaxis for CRPS has also been studied in foot and ankle surgery. Besse and colleagues54 prospectively compared 2 chronologically successive groups that received (235 feet) or did not receive (185 feet) vitamin C 1000-mg/d supplementation for 45 days. Incidence of CRPS type 1 as diagnosed with International Association for the Study of Pain (IASP) criteria dropped from 9.6% to 1.7% with vitamin C supplementation. In a case series, Zollinger and colleagues63 examined CRPS type 1 rates after performing cementless total trapeziometacarpal semiconstrained joint prosthesis implantations for trapeziometacarpal arthritis. Forty implantations were performed in 34 patients. All patients received vitamin C 500 mg/d for CRPS prevention starting 2 days before surgery for 50 days. There were no cases of CRPS in the postoperative period, according to Veldman or IASP criteria. Although the results of the studies by Cazeneuve and colleagues53 and Besse and colleagues54 agree with those of the distal radius fracture trials by Zollinger and colleagues,51,52 the quasi-experimental design and the lack of blinding and randomization temper the conclusions that can be drawn because of the risk for significant bias.
In a recent systematic review examining the effectiveness of vitamin C supplementation in preventing CRPS in trauma and surgery in the extremities, Shibuya and colleagues64 concluded that taking at least 500 mg of vitamin C daily for 45 to 50 days after injury or surgery may help decrease the incidence of CRPS after a traumatic event.
Osteoarthritis
Damage caused by free radicals has long been thought to play an important role in osteoarthritis (OA).65-67 A cross-sectional study in knee OA found that amounts of joint fluid antioxidants were lower in patients with severe arthritis than in those with intact cartilage, further implicating free radicals in the pathophysiology of OA.68 Use of vitamin C for prophylaxis against development or progression of OA is therefore a hot research topic. Thus far, animal studies have had mixed results—several showing a chondroprotective effect of vitamin C69,70 and others finding either no effect or even a positive association with the development of arthritis.71
The literature on human subjects, chiefly observational studies, is just as controversial. Wang and colleagues40 found vitamin C intake associated with both a 50% risk reduction of bone marrow lesions on magnetic resonance imaging over a 10-year interval (OR, 0.5; 95% CI, 0.29-0.87) and inversely associated with the tibial plateau bone area. Similarly, the Clearwater Osteoarthritis Study, which followed 1023 patients (age, >40 years), showed that participants who took vitamin C supplements were 11% less likely to develop radiographic evidence of OA (RR, 0.89; 95% CI, 0.85-0.93).72 Nonetheless, other studies have failed to show such associations73 or have demonstrated the opposite effect. Chaganti and colleagues74 analyzed levels of vitamins C and E in the Multicenter Osteoarthritis Study (MOST) cohort of 3026 men and women (age, 50-79 years) and found higher vitamin levels were not protective against incidence of radiographic whole-knee OA and may even have been associated with increased risk.
Conclusion
Vitamin C is an essential micronutrient and a powerful water-soluble antioxidant in numerous biochemical pathways that influence bone health. It has been implicated in the biology of fracture healing, and vitamin C supplementation has been proposed as prophylaxis against hip fractures based on observational data. Results of 2 high-quality double-blind randomized trials support use of vitamin C as prophylaxis against CRPS in wrist fractures treated conservatively and operatively; the evidence for foot and ankle surgery is weaker. Use of vitamin C in OA prevention has tremendous potential, though animal and human study results are controversial. Heterogeneous results and lack of prospective trials preclude any recommendation at this time.
1. Jacob RA, Sotoudeh G. Vitamin C function and status in chronic disease. Nutr Clin Care. 2002;5(2):66-74.
2. Frei B, England L, Ames BN. Ascorbate is an outstanding antioxidant in human blood plasma. Proc Natl Acad Sci U S A. 1989;86(16):6377-6381.
3. Monsen ER. Dietary reference intakes for the antioxidant nutrients: vitamin C, vitamin E, selenium, and carotenoids. J Am Diet Assoc. 2000;100(6):637-640.
4. Padh H. Vitamin C: newer insights into its biochemical functions. Nutr Rev. 1991;49(3):65-70.
5. Gershoff SN. Vitamin C (ascorbic acid): new roles, new requirements? Nutr Rev. 1993;51(11):313-326.
6. Li Y, Schellhorn HE. New developments and novel therapeutic perspectives for vitamin C. J Nutr. 2007;137(10):2171-2184.
7. Szent-Györgyi A. On the function of hexuronic acid in the respiration of the cabbage leaf. J Biol Chem. 1931;90(1):385-393.
8. Svirbely JL, Szent-Györgyi A. The chemical nature of vitamin C. Biochem J. 1933;27(1):279-285.
9. Pauling L. Vitamin C and the Common Cold. San Francisco, CA: Freeman; 1970.
10. Spittle CR. Atherosclerosis and vitamin C. Lancet. 1971;2(7737):1280-1281.
11. Chappell LC, Seed PT, Briley AL, et al. Effect of antioxidants on the occurrence of pre-eclampsia in women at increased risk: a randomised trial. Lancet. 1999;354(9181):810-816.
12. Block G. Vitamin C and cancer prevention: the epidemiologic evidence. Am J Clin Nutr. 1991;53(1 suppl):270S-282S.
13. Creagan ET, Moertel CG, O’Fallon JR, et al. Failure of high-dose vitamin C (ascorbic acid) therapy to benefit patients with advanced cancer. A controlled trial. N Engl J Med. 1979;301(13):687-690.
14. Hemila H, Chalker E. Vitamin C for preventing and treating the common cold. Cochrane Database Syst Rev. 2013;1:CD000980.
15. Poston L, Briley AL, Seed PT, Kelly FJ, Shennan AH; Vitamins in Pre-eclampsia (VIP) Trial Consortium. Vitamin C and vitamin E in pregnant women at risk for pre-eclampsia (VIP trial): randomised placebo-controlled trial. Lancet. 2006;367(9517):1145-1154.
16. Roberts JM, Myatt L, Spong CY, et al; Eunice Kennedy Shriver National Institute of Child Health and Human Development Maternal-Fetal Medicine Units Network. Vitamins C and E to prevent complications of pregnancy-associated hypertension. N Engl J Med. 2010;362(14):1282-1291.
17. Levine M, Padayatty SJ, Espey MG. Vitamin C: a concentration-function approach yields pharmacology and therapeutic discoveries. Adv Nutr. 2011;2(2):78-88.
18. Levine M, Rumsey SC, Daruwala R, Park JB, Wang Y. Criteria and recommendations for vitamin C intake. JAMA. 1999;281(15):1415-1423.
19. Glatthaar BE, Hornig DH, Moser U. The role of ascorbic acid in carcinogenesis. Adv Exp Med Biol. 1986;206:357-377.
20. Carpenter KJ. The History of Scurvy and Vitamin C. New York, NY: Cambridge University Press; 1986.
21. Murad S, Grove D, Lindberg KA, Reynolds G, Sivarajah A, Pinnell SR. Regulation of collagen synthesis by ascorbic acid. Proc Natl Acad Sci U S A. 1981;78(5):2879-2882.
22. Fain O, Pariés J, Jacquart B, et al. Hypovitaminosis C in hospitalized patients. Eur J Intern Med. 2003;14(7):419-425.
23. Blee TH, Cogbill TH, Lambert PJ. Hemorrhage associated with vitamin C deficiency in surgical patients. Surgery. 2002;131(4):408-412.
24. Schleicher RL, Carroll MD, Ford ES, Lacher DA. Serum vitamin C and the prevalence of vitamin C deficiency in the United States: 2003–2004 National Health and Nutrition Examination Survey (NHANES). Am J Clin Nutr. 2009;90(5):1252-1263.
25. Gan R, Eintracht S, Hoffer LJ. Vitamin C deficiency in a university teaching hospital. J Am Coll Nutr. 2008;27(3):428-433.
26. Bourne G. The effect of graded doses of vitamin C upon the regeneration of bone in guinea-pigs on a scorbutic diet. J Physiol. 1942;101(3):327-336.
27. Bourne GH. The relative importance of periosteum and endosteum in bone healing and the relationship of vitamin C to their activities. Proc R Soc Med. 1944;37(6):275-279.
28. Yilmaz C, Erdemli E, Selek H, Kinik H, Arikan M, Erdemli B. The contribution of vitamin C to healing of experimental fractures. Arch Orthop Trauma Surg. 2001;121(7):426-428.
29. Sarisözen B, Durak K, Dinçer G, Bilgen OF. The effects of vitamins E and C on fracture healing in rats. J Int Med Res. 2002;30(3):309-313.
30. Kipp DE, McElvain M, Kimmel DB, Akhter MP, Robinson RG, Lukert BP. Scurvy results in decreased collagen synthesis and bone density in the guinea pig animal model. Bone. 1996;18(3):281-288.
31. Alcantara-Martos T, Delgado-Martinez AD, Vega MV, Carrascal MT, Munuera-Martinez L. Effect of vitamin C on fracture healing in elderly osteogenic disorder Shionogi rats. J Bone Joint Surg Br. 2007;89(3):402-407.
32. Mohan S, Kapoor A, Singgih A, et al. Spontaneous fractures in the mouse mutant sfx are caused by deletion of the gulonolactone oxidase gene, causing vitamin C deficiency. J Bone Miner Res. 2005;20(9):1597-1610.
33. Aronow MA, Gerstenfeld LC, Owen TA, Tassinari MS, Stein GS, Lian JB. Factors that promote progressive development of the osteoblast phenotype in cultured fetal rat calvaria cells. J Cell Physiol. 1990;143(2):213-221.
34. Franceschi RT, Iyer BS. Relationship between collagen synthesis and expression of the osteoblast phenotype in MC3T3-E1 cells. J Bone Miner Res. 1992;7(2):235-246.
35. Leboy PS, Vaias L, Uschmann B, Golub E, Adams SL, Pacifici M. Ascorbic acid induces alkaline phosphatase, type X collagen, and calcium deposition in cultured chick chondrocytes. J Biol Chem. 1989;264(29):17281-17286.
36. Xiao G, Cui Y, Ducy P, Karsenty G, Franceschi RT. Ascorbic acid–dependent activation of the osteocalcin promoter in MC3T3-E1 preosteoblasts: requirement for collagen matrix synthesis and the presence of an intact OSE2 sequence. Mol Endocrinol. 1997;11(8):1103-1113.
37. Sakamoto Y, Takano Y. Morphological influence of ascorbic acid deficiency on endochondral ossification in osteogenic disorder Shionogi rat. Anat Rec. 2002;268(2):93-104.
38. Kim W, Bae S, Kim H, et al. Ascorbic acid insufficiency induces the severe defect on bone formation via the down-regulation of osteocalcin production. Anat Cell Biol. 2013;46(4):254-261.
39. Hall SL, Greendale GA. The relation of dietary vitamin C intake to bone mineral density: results from the PEPI study. Calcif Tissue Int. 1998;63(3):183-189.
40. Wang Y, Hodge AM, Wluka AE, et al. Effect of antioxidants on knee cartilage and bone in healthy, middle-aged subjects: a cross-sectional study. Arthritis Res Ther. 2007;9(4):R66.
41. Maggio D, Barabani M, Pierandrei M, et al. Marked decrease in plasma antioxidants in aged osteoporotic women: results of a cross-sectional study. J Clin Endocrinol Metab. 2003;88(4):1523-1527.
42. Kaptoge S, Welch A, McTaggart A, et al. Effects of dietary nutrients and food groups on bone loss from the proximal femur in men and women in the 7th and 8th decades of age. Osteoporosis Int. 2003;14(5):418-428.
43. Pasco JA, Henry MJ, Wilkinson LK, Nicholson GC, Schneider HG, Kotowicz MA. Antioxidant vitamin supplements and markers of bone turnover in a community sample of nonsmoking women. J Womens Health. 2006;15(3):295-300.
44. Leveille SG, LaCroix AZ, Koepsell TD, Beresford SA, Van Belle G, Buchner DM. Dietary vitamin C and bone mineral density in postmenopausal women in Washington state, USA. J Epidemiol Community Health. 1997;51(5):479-485.
45. Simon JA, Hudes ES. Relation of ascorbic acid to bone mineral density and self-reported fractures among US adults. Am J Epidemiol. 2001;154(5):427-433.
46. Wolf RL, Cauley JA, Pettinger M, et al. Lack of a relation between vitamin and mineral antioxidants and bone mineral density: results from the Women’s Health Initiative. Am J Clin Nutr. 2005;82(3):581-588.
47. Melhus H, Michaelsson K, Holmberg L, Wolk A, Ljunghall S. Smoking, antioxidant vitamins, and the risk of hip fracture. J Bone Miner Res. 1999;14(1):129-135.
48. Zhang J, Munger RG, West NA, Cutler DR, Wengreen HJ, Corcoran CD. Antioxidant intake and risk of osteoporotic hip fracture in Utah: an effect modified by smoking status. Am J Epidemiol. 2006;163(1):9-17.
49. Sahni S, Hannan MT, Blumberg J, Cupples LA, Kiel DP, Tucker KL. Protective effect of total carotenoid and lycopene intake on the risk of hip fracture: a 17-year follow-up from the Framingham Osteoporosis Study. J Bone Miner Res. 2009;24(6):1086-1094.
50. Rho RH, Brewer RP, Lamer TJ, Wilson PR. Complex regional pain syndrome. Mayo Clin Proc. 2002;77(2):174-180.
51. Zollinger PE, Tuinebreijer WE, Kreis RW, Breederveld RS. Effect of vitamin C on frequency of reflex sympathetic dystrophy in wrist fractures: a randomised trial. Lancet. 1999;354(9195):2025-2028.
52. Zollinger PE, Tuinebreijer WE, Breederveld RS, Kreis RW. Can vitamin C prevent complex regional pain syndrome in patients with wrist fractures? A randomized, controlled, multicenter dose–response study. J Bone Joint Surg Am. 2007;89(7):1424-1431.
53. Cazeneuve JF, Leborgne JM, Kermad K, Hassan Y. Vitamin C and prevention of reflex sympathetic dystrophy following surgical management of distal radius fractures [in French]. Acta Orthop Belg. 2002;68(5):481-484.
54. Besse JL, Gadeyne S, Galand-Desme S, Lerat JL, Moyen B. Effect of vitamin C on prevention of complex regional pain syndrome type I in foot and ankle surgery. Foot Ankle Surg. 2009;15(4):179-182.
55. Goris RJ, Dongen LM, Winters HA. Are toxic oxygen radicals involved in the pathogenesis of reflex sympathetic dystrophy? Free Radic Res Commun. 1987;3(1-5):13-18.
56. Matsuda T, Tanaka H, Shimazaki S, et al. High-dose vitamin C therapy for extensive deep dermal burns. Burns. 1992;18(2):127-131.
57. Matsuda T, Tanaka H, Hanumadass M, et al. Effects of high-dose vitamin C administration on postburn microvascular fluid and protein flux. J Burn Care Rehabil. 1992;13(5):560-566.
58. Veldman PH, Reynen HM, Arntz IE, Goris RJ. Signs and symptoms of reflex sympathetic dystrophy: prospective study of 829 patients. Lancet. 1993;342(8878):1012-1016.
59. Zollinger PE. The administration of vitamin C in prevention of CRPS-I after distal radial fractures and hand surgery—a review of two RCTs and one observational prospective study. Open Conference Proc J. 2011;2:1-4.
60. Rogers BA, Ricketts DM. Can vitamin C prevent complex regional pain syndrome in patients with wrist fractures? J Bone Joint Surg Am. 2008;90(2):447-448.
61. Amadio PC. Vitamin C reduced the incidence of reflex sympathetic dystrophy after wrist fracture. J Bone Joint Surg Am. 2000;82(6):873.
62. Frolke JP. Can vitamin C prevent complex regional pain syndrome in patients with wrist fractures? J Bone Joint Surg Am. 2007;89(11):2550-2551.
63. Zollinger PE, Unal H, Ellis ML, Tuinebreijer WE. Clinical results of 40 consecutive basal thumb prostheses and no CRPS type I after vitamin C prophylaxis. Open Orthop J. 2010;4:62-66.
64. Shibuya N, Humphers JM, Agarwal MR, Jupiter DC. Efficacy and safety of high-dose vitamin C on complex regional pain syndrome in extremity trauma and surgery—systematic review and meta-analysis. J Foot Ankle Surg. 2013;52(1):62-66.
65. Henrotin Y, Deby-Dupont G, Deby C, De Bruyn M, Lamy M, Franchimont P. Production of active oxygen species by isolated human chondrocytes. Br J Rheumatol. 1993;32(7):562-567.
66. McAlindon TE, Jacques P, Zhang Y, et al. Do antioxidant micronutrients protect against the development and progression of knee osteoarthritis? Arthritis Rheum. 1996;39(4):648-656.
67. Kaiki G, Tsuji H, Yonezawa T, et al. Osteoarthrosis induced by intra-articular hydrogen peroxide injection and running load. J Orthop Res. 1990;8(5):731-740.
68. Regan EA, Bowler RP, Crapo JD. Joint fluid antioxidants are decreased in osteoarthritic joints compared to joints with macroscopically intact cartilage and subacute injury. Osteoarthritis Cartilage. 2008;16(4):515-521.
69. Meacock SC, Bodmer JL, Billingham ME. Experimental osteoarthritis in guinea-pigs. J Exp Pathol. 1990;71(2):279-293.
70. Kurz B, Jost B, Schunke M. Dietary vitamins and selenium diminish the development of mechanically induced osteoarthritis and increase the expression of antioxidative enzymes in the knee joint of STR/1N mice. Osteoarthritis Cartilage. 2002;10(2):119-126.
71. Kraus VB, Huebner JL, Stabler T, et al. Ascorbic acid increases the severity of spontaneous knee osteoarthritis in a guinea pig model. Arthritis Rheum. 2004;50(6):1822-1831.
72. Peregoy J, Wilder FV. The effects of vitamin C supplementation on incident and progressive knee osteoarthritis: a longitudinal study. Public Health Nutr. 2011;14(4):709-715.
73. Hill J, Bird HA. Failure of selenium-ace to improve osteoarthritis. Br J Rheumatol. 1990;29(3):211-213.
74. Chaganti RK, Tolstykh I, Javaid MK, et al; Multicenter Osteoarthritis Study Group (MOST). High plasma levels of vitamin C and E are associated with incident radiographic knee osteoarthritis. Osteoarthritis Cartilage. 2014;22(2):190-196.
75. US Department of Agriculture, Agricultural Research Service. USDA National Nutrient Database for Standard Reference. Release 26. http://www.ars.usda.gov/Services/docs.htm?docid=24936. Published August 2013. Revised November 2013. Accessed May 14, 2015.
76. National Institutes of Health, Office of Dietary Supplements. Vitamin C: fact sheet for health professionals. National Institutes of Health website. http://ods.od.nih.gov/factsheets/VitaminC-HealthProfessional/. Reviewed June 5, 2013. Accessed May 14, 2015.
77. Institute of Medicine, Food and Nutrition Board. Dietary Reference Intakes for Vitamin C, Vitamin E, Selenium, and Carotenoids. Washington, DC: National Academy Press; 2000.
New tools aid decisions on length of dual-antiplatelet therapy
PARIS – A novel method of quantifying the risks of major bleeding and stent thrombosis may guide decisions about the duration of dual-antiplatelet therapy in stent recipients, according to Dr. Francesco Costa.
It’s a two-pronged approach that relies upon a CRUSADE bleeding risk score greater than 40 as a red flag cautioning against 24 months of dual-antiplatelet therapy (DAPT) in favor of 6 months, while also taking into consideration the anatomic location of an individual’s coronary artery disease as a guide to ischemic risk, such as stent thrombosis, Dr. Costa said at the annual congress of the European Association of Percutaneous Cardiovascular Interventions.
A patient with at least 30% luminal narrowing of the left main coronary artery and/or the proximal LAD (left anterior descending) artery is at markedly reduced risk of stent thrombosis with a DAPT regimen of 24 months rather than 6 months, according to Dr. Costa of Erasmus University in Rotterdam, the Netherlands. These findings were borne out in a retrospective analysis of data from the previously published PRODIGY trial, in which 2,013 patients undergoing percutaneous coronary intervention were randomized to receive a first- or second-generation drug-eluting stent or a bare metal stent, and then further randomized to 6 or 24 months of DAPT (Circulation 2012;125:2015-26).
As these findings about how to guide DAPT duration come from an exploratory retrospective analysis, Dr. Costa stressed, they must be considered hypothesis generating. A definitive prospective randomized trial is warranted to confirm the hypothesis. Such a trial is sorely needed, the cardiologist added.
“International guidelines suggest tailoring DAPT duration according to a patient’s ischemic and bleeding risks. However, currently a reproducible method of weighing these risks has not yet been proposed,” he said. “I think if we put 10 different [physicians] in front of a patient and asked them to define that patient’s bleeding risk, almost everyone would have a different idea.”
The PRODIGY-tested approach, while not ideal, is a definite step forward, according to Dr. Costa.
He and his coworkers evaluated three different bleeding risk scoring systems – HAS-BLED, ACUITY, and CRUSADE – before concluding that a CRUSADE score greater than 40 was superior as a predictor of major bleeding in the PRODIGY population.
Roughly 16% of participants in this all-comers study had a CRUSADE score above 40. A 24-month course of DAPT in this group was associated with a 2.7-fold increased risk of major bleeding events, compared with a 6-month course. The number-needed-to-harm with a 24-month course of DAPT was 17, compared with a number-needed-to-harm of 67 in an unselected population. In contrast, there was no significant increase in major bleeding risk with 24 months of DAPT in patients with a CRUSADE score of 40 or less.
Patients with a CRUSADE score greater than 40 also had a sharply increased need for RBC transfusion if they were on 24 months of DAPT.
The investigators chose 30% luminal narrowing of the left main or proximal LAD coronary arteries as their cutpoint for increased risk of ischemic events during follow-up because they consider it a good marker for more diffuse atherosclerotic disease.
PRODIGY participants with luminal narrowing at either location were 55% less likely to experience stent thrombosis with 24 months of DAPT than with 6.
Dr. Andreas Baumbach said the DAPT decision-making aid presented by Dr. Costa is just what interventional cardiologists have been looking for.
“We’re always talking about patients at high bleeding risk and high ischemic risk, but we haven’t really had a tool to identify those other than our clinical judgment, thinking that high bleeding risk comes with age and renal impairment. So to have a score that’s almost validated for this purpose is really important,” according to Dr. Baumbach, professor of interventional cardiology at the University of Bristol (England).
This analysis was conducted without external funding. Dr. Costa reported having no relevant financial conflicts.
AT EuroPCR 2015
Key clinical point: Stent location and CRUSADE score can inform decisions about the duration of dual-antiplatelet therapy.
Major finding: Coronary stent recipients with a CRUSADE bleeding risk score above 40 had a 2.7-fold greater risk of a major bleeding event if randomized to 24 months rather than 6 months of dual-antiplatelet therapy.
Data source: A retrospective, hypothesis-generating secondary analysis of the 2,103-patient prospective randomized PRODIGY study.
Disclosures: This analysis was conducted without external funding. The presenter reported having no relevant financial conflicts.
Medicare Payments to Physicians Rise in 2013
Medicare, the government-run health insurance program for elderly and disabled Americans, paid physicians $90 billion in 2013, up 17% from $77 billion in 2012, U.S. healthcare officials reported earlier this month.
Physician payments accounted for less than one-fifth of Medicare's 2013 net outlays of $492 billion, which rose from $466 billion in 2012. Payments to hospitals for the top 100 inpatient stays cost Medicare $62 billion in 2013, while the rest went for drugs, privately run Medicare Advantage plans, and other program costs.
The single-greatest hospital expense was to replace knees, hips, and other joints in 446,148 operations, with $6.6 billion paid to hospitals.
The second-greatest hospital payment, $5.6 billion, went for 398,004 cases of septicemia, or blood poisoning, often a sign of poor inpatient care. TH
—Reuters Health