User login
Use of Post-Acute Facility Care in Children Hospitalized With Acute Respiratory Illness
Respiratory illness (RI) is one of the most common reasons for pediatric hospitalization.1 Examples of RI include acute illness, such as bronchiolitis, bacterial pneumonia, and asthma, as well as chronic conditions, such as obstructive sleep apnea and chronic respiratory insufficiency. Hospital care for RI includes monitoring and treatment to optimize oxygenation, ventilation, hydration, and other body functions. Most previously healthy children hospitalized with RI stay in the hospital for a limited duration (eg, a few days) because the severity of their illness is short lived and they quickly return to their previous healthy status.2 However, hospital care is increasing for children with fragile and tenuous health due to complex medical conditions.3 RI is a common reason for hospitalization among these children as well and recovery of respiratory health and function can be slow and protracted for some of them.4 Weeks, months, or longer periods of time may be necessary for the children to return to their previous respiratory baseline health and function after hospital discharge; other children may not return to their baseline.5,6
Hospitalized older adults with high-severity RI are routinely streamlined for transfer to post-acute facility care (PAC) shortly (eg, a few days) after acute-care hospitalization. Nearly 70% of elderly Medicare beneficiaries use PAC following a brief length of stay (LOS) in the acute-care hospital.7 It is believed that PAC helps optimize the patients’ health and functional status and relieves the family caregiving burden that would have occurred at home.8-10 PAC use also helps to shorten acute-care hospitalization for RI while avoiding readmission.8-10 In contrast with adult patients, use of PAC for hospitalized children is not routine.11 While PAC use in children is infrequent, RI is one of the most common reasons for acute admission among children who use it.12
For some children with RI, PAC might be positioned to offer a safe, therapeutic, and high-value setting for pulmonary rehabilitation, as well as related medical, nutritional, functional, and family cares.6 PAC, by design, could possibly help some of the children transition back into their homes and communities. As studies continue to emerge that assess the value of PAC in children, it is important to learn more about the use of PAC in children hospitalized with RI. The objectives were to (1) assess which children admitted with RI are the most likely to use PAC services for recovery and (2) estimate how many hospitalized children not using PAC had the same characteristics as those who did.
METHODS
Study Design, Setting, and Population
We conducted a retrospective cohort analysis of 609,800 hospitalizations for RI occurring from January 1, 2010 to December 31, 2015, in 43 freestanding children’s hospitals in the Pediatric Health Information Systems (PHIS) dataset. All hospitals participating in PHIS are members of the Children’s Hospital Association.13 The Boston Children’s Hospital Institutional Review Board approved this study with a waiver for informed consent.
RI was identified using the Agency for Healthcare Research and Quality (AHRQ) Clinical Classification System (CCS).14 Using diagnosis CCS category 8 (“Diseases of the Respiratory System”) and the procedure CCS category 6 (“Operations on the Respiratory System”), we identified all hospitalizations from the participating hospitals with a principal diagnosis or procedure International Classification of Diseases, 9th Revision, Clinical Modification (ICD-9-CM) code for an RI.
Main Outcome Measure
Discharge disposition following the acute-care hospitalization for RI was the main outcome measure. We used PHIS uniform disposition coding to classify the discharge disposition as transfer to PAC (ie, rehabilitation facility, skilled nursing facility, etc.) vs all other dispositions (ie, routine to home, against medical advice, etc.).12 The PAC disposition category was derived from the Centers for Medicare & Medicaid Services Patient Discharge Status Codes and Hospital Transfer Policies as informed by the National Uniform Billing Committee Official UB-04 Data Specifications Manual, 2008. PAC transfer included disposition to external PAC facilities, as well as to internal, embedded PAC units residing in a few of the acute-care children’s hospitals included in the cohort.
Demographic and Clinical Characteristics
We assessed patient demographic and clinical characteristics that might correlate with PAC use following acute-care hospitalization for RI. Demographic characteristics included gender, age at admission in years, payer (public, private, and other), and race/ethnicity (Hispanic, non-Hispanic black, non-Hispanic white, other).
Clinical characteristics included chronic conditions (type and number) and assistance with medical technology. Chronic condition and medical technology characteristics were assessed with ICD-9-CM diagnosis codes. PHIS contain up to 41 ICD-9-CM diagnosis codes per hospital discharge record. To identify the presence and number of chronic conditions, we used the AHRQ Chronic Condition Indicator system, which categorizes over 14,000 ICD-9-CM diagnosis codes into chronic vs non-chronic conditions.14,15 Children hospitalized with a chronic condition were further classified as having a complex chronic condition (CCC) using Feudtner and colleagues’ ICD-9-CM diagnosis classification scheme.16 CCCs represent defined diagnosis groupings expected to last longer than 12 months and involving either a single organ system, severe enough to require specialty pediatric care and hospitalization, or multiple organ systems.17,18 Hospitalized children who were assisted with medical technology were identified with ICD-9-CM codes indicating the use of a medical device to manage and treat a chronic illness (eg, ventricular shunt to treat hydrocephalus) or to maintain basic body functions necessary for sustaining life (eg, a tracheostomy tube for breathing).19,20 We distinguished children undergoing tracheotomy during hospitalization using ICD-9-CM procedure codes 31.1 and 31.2.
Acute-Care Hospitalization Characteristics
We also assessed the relationship between acute-care hospitalization characteristics and use of PAC after discharge, including US census region, LOS, use of intensive care, number of medication classes administered, and use of enhanced respiratory support. Enhanced respiratory support was defined as use of continuous or bilevel positive airway pressure (CPAP or BiPAP) or mechanical ventilation during the acute-care hospitalization for RI. These respiratory supports were identified using billing data in PHIS.
Statistical Analysis
In bivariable analysis, we compared demographic, clinical, and hospitalization characteristics of hospitalized children with vs without discharge to PAC using Rao-Scott chi-square tests and Wilcoxon rank-sum tests as appropriate. In multivariable analysis, we derived a generalized linear mix effects model with fixed effects for demographic, clinical, and hospitalization characteristics that were associated with PAC at P < 0.1 in bivariable analysis (ie, age, gender, race/ethnicity, payer, medical technology, use of intensive care unit [ICU], use of positive pressure or mechanical ventilation, hospital region, LOS, new tracheostomy, existing tracheostomy, other technologies, number of medications, number of chronic conditions [of any complexity], and type of complex chronic conditions). We controlled for clustering of patients within hospitals by including a random intercept for each hospital. We also assessed combinations of patient characteristics on the likelihood of PAC use with classification and regression tree (CART) modeling. Using CART, we determined which characteristic combinations were associated with the highest and lowest use of PAC using binary split and post-pruning, goodness of fit rules.21 All statistical analyses were performed using SAS v.9.4 (SAS Institute, Cary, NC), and R v.3.2 (R Foundation for Statistical Computing, Vienna, Austria) using the “party” package. The threshold for statistical significance was set at P < 0.05.
RESULTS
Of the 609,800 hospitalizations for RI, PAC use after discharge occurred for 2660 (0.4%). RI discharges to PAC accounted for 2.1% (n = 67,405) of hospital days and 2.7% ($280 million) of hospital cost of all RI hospitalizations. For discharges to PAC, the most common RI were pneumonia (29.1% [n = 773]), respiratory failure or insufficiency (unspecified reason; 22.0% [n = 584]), and upper respiratory infection (12.2% [n = 323]).
Demographic Characteristics


Median age at acute-care admission was higher for PAC vs non-PAC discharges (6 years [interquartile range {IQR} 1-15] vs 2 years [0-7], P < 0.001; Table 1). Hispanic patients accounted for a smaller percentage of RI discharges to PAC vs non-PAC (14.1% vs 21.8%, P < 0.001) and a higher percentage to PAC were for patients with public insurance (75.9% vs 62.5, P < 0.001; Table 1).
Clinical Characteristics
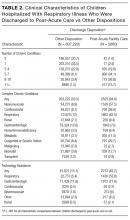
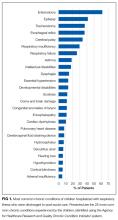
A greater percentage of RI hospitalizations discharged to PAC vs not-PAC had ≥1 CCC (94.9% vs 33.5%), including a neuromuscular CCC (57.5% vs 8.9%) or respiratory CCC (62.5% vs 12.0%), P < 0.001 for all (Table 2). A greater percentage discharged to PAC was assisted with medical technology (83.2% vs 15.1%), including respiratory technology (eg, tracheostomy; 53.8% vs 5.4%) and gastrointestinal technology (eg, gastrostomy; 71.9% vs 11.8%), P < 0.001 for all. Of the children with respiratory technology, 14.8% (n = 394) underwent tracheotomy during the acute-care hospitalization. Children discharged to PAC had a higher percentage of multiple chronic conditions. For example, the percentages of children discharged to PAC vs not with ≥7 conditions were 54.5% vs 7.0% (P < 0.001; Table 2). The most common chronic conditions experienced by children discharged to PAC included epilepsy (41.2%), gastroesophageal reflux (36.6%), cerebral palsy (28.2%), and asthma (18.2%).
Hospitalization Characteristics

Acute-care RI hospitalization median LOS was longer for discharges to PAC vs non-PAC (10 days [IQR 4-27] vs 2 days [IQR 1-4], P < 0.001; Table 1). A greater percentage of discharges to PAC were administered medications from multiple classes during the acute-care RI admission (eg, 54.8% vs 13.4% used medications from ≥7 classes, P < 0.001). A greater percentage of discharges to PAC used intensive care services during the acute-care admission (65.6% vs 22.4%, P < 0.001). A greater percentage of discharges to PAC received CPAP (10.6 vs 5.0%), BiPAP (19.8% vs 11.4%), or mechanical ventilation (52.7% vs 9.1%) during the acute-care RI hospitalization (P < 0.001 for all; Table 1).
Multivariable Analysis of the Likelihood of Post-Acute Care Use Following Discharge
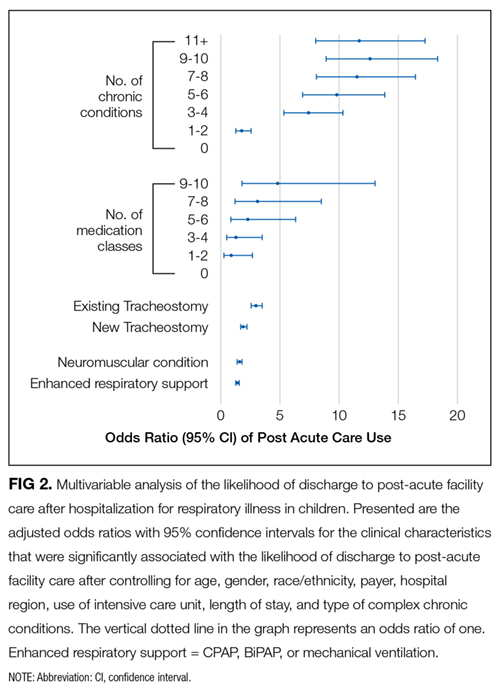
In multivariable analysis, the patient characteristics associated with the highest likelihood of discharge to PAC included ≥11 vs no chronic conditions (odds ratio [OR] 11.8 , 95% CI, 8.0-17.2), ≥9 classes vs no classes of medications administered during the acute-care hospitalization (OR 4.8 , 95% CI, 1.8-13.0), and existing tracheostomy (OR 3.0, [95% CI, 2.6-3.5; Figure 2 and eTable). Patient characteristics associated with a more modest likelihood of discharge to PAC included public vs private insurance (OR 1.8, 95% CI, 1.6-2.0), neuromuscular complex chronic condition (OR 1.6, 95% CI, 1.5-1.8), new tracheostomy (OR 1.9, 95% CI, 1.7-2.2), and use of any enhanced respiratory support (ie, CPAP/BiPAP/mechanical ventilation) during the acute-care hospitalization (OR 1.4, 95% CI, 1.3-1.6; Figure 2 and Supplementary Table).
Classification and Regression Tree Analysis

In the CART analysis, the highest percentage (6.3%) of children hospitalized with RI who were discharged to PAC had the following combination of characteristics: ≥6 chronic conditions, ≥7 classes of medications administered, and respiratory technology. Median (IQR) length of acute-care LOS for children with these attributes who were transferred to PAC was 19 (IQR 8-56; range 1-1005) days; LOS remained long (median 13 days [IQR 6-41, range 1-1413]) for children with the same attributes not transferred to PAC (n = 9448). Between these children transferred vs not to PAC, 79.3% vs 65.9% received ICU services; 74.4% vs 73.5% received CPAP, BiPAP, or mechanical ventilation; and 31.0% vs 22.7% underwent tracheotomy during the acute-care hospitalization. Of these children who were not transferred to PAC, 18.9% were discharged to home nursing services.
DISCUSSION
The findings from the present study suggest that patients with RI hospitalization in children’s hospitals who use PAC are medically complex, with high rates of multiple chronic conditions—including cerebral palsy, asthma, chronic respiratory insufficiency, dysphagia, epilepsy, and gastroesophageal reflux—and high rates of technology assistance including enterostomy and tracheostomy. The characteristics of patients most likely to use PAC include long LOS, a large number of chronic conditions, many types of medications administered during the acute-care hospitalization, respiratory technology use, and an underlying neuromuscular condition. Specifically, the highest percentage of children hospitalized with RI who were discharged to PAC had ≥6 chronic conditions, ≥7 classes of medications administered, and respiratory technology. Our analysis suggests that there may be a large population of children with these same characteristics who experienced a prolonged LOS but were not transferred to PAC.
There are several reasons to explain why children hospitalized with RI who rely on medical technology, such as existing tracheostomy, are more likely to use PAC. Tracheostomy often indicates the presence of life-limiting impairment in oxygenation or ventilation, thereby representing a high degree of medical fragility. Tracheostomy, in some cases, offers enhanced ability to assist with RI treatment, including establishment of airway clearance of secretions (ie, suctioning and chest physiotherapy), administration of antimicrobials (eg, nebulized antibiotics), and optimization of ventilation (eg, non-invasive positive airway pressure). However, not all acute-care inpatient clinicians have experience and clinical proficiencies in the care of children with pediatric tracheostomy.23 As a result, a more cautious approach, with prolonged LOS and gradual arrival to hospital discharge, is often taken in the acute-care hospital setting for children with tracheostomy. Tracheostomy care delivered during recovery from RI by trained and experienced teams of providers in the PAC setting may be best positioned to help optimize respiratory health and ensure proper family education and readiness to continue care at home.6
Further investigation is needed of the long LOS in children not transferred to PAC who had similar characteristics to those who were transferred. In hospitalized adult patients with RI, PAC is routinely introduced early in the admission process, with anticipated transfer within a few days into the hospitalization. In the current study, LOS was nearly 2 weeks or longer in many children not transferred to PAC who had similar characteristics to those who were transferred. Perhaps some of the children not transferred experienced long LOS in the acute-care hospital because of a limited number of pediatric PAC beds in their local area. Some families of these children may have been offered but declined use of PAC. PAC may not have been offered to some because illness acuity was too high or there was lack of PAC awareness as a possible setting for recovery.
There are several limitations to this study. PHIS does not contain non-freestanding children’s hospitals; therefore, the study results may generalize best to children’s hospitals. PHIS does not contain information on the amount (eg, number of days used), cost, or treatments provided in PAC. Therefore, we were unable to determine the true reasons why children used PAC services following RI hospitalization (eg, for respiratory rehabilitation vs other reasons, such as epilepsy or nutrition/hydration management). Moreover, we could not assess which children truly used PAC for short-term recovery vs longer-term care because they were unable to reside at home (eg, they were too medically complex). We were unable to assess PAC availability (eg, number of beds) in the surrounding areas of the acute-care hospitals in the PHIS database. Although we assessed use of medical technology, PHIS does not contain data on functional status or activities of daily living, which correlate with the use of PAC in adults. We could not distinguish whether children receiving BiPAP, CPAP, or mechanical ventilation during hospitalization were using it chronically. Although higher PAC use was associated with public insurance, due to absent information on the children’s home, family, and social environment, we were unable to assess whether PAC use was influenced by limited caregiving support or resources.
Data on the type and number of chronic conditions are limited by the ICD-9-CM codes available to distinguish them. Although several patient demographic and clinical characteristics were significantly associated with the use of PAC, significance may have occurred because of the large sample size and consequent robust statistical power. This is why we elected to highlight and discuss the characteristics with the strongest and most clinically meaningful associations (eg, multiple chronic conditions). There may be additional characteristics, including social, familial, and community resources, that are not available to assess in PHIS that could have affected PAC use.
Despite these limitations, the current study suggests that the characteristics of children hospitalized with RI who use PAC for recovery are evident and that there is a large population of children with these characteristics who experienced a prolonged LOS that did not result in transfer to PAC. These findings could be used in subsequent studies to help create the base of a matched cohort of children with similar clinical, demographic, and hospitalization characteristics who used vs didn’t use PAC. Comparison of the functional status, health trajectory, and family and/or social attributes of these 2 groups of children, as well as their post-discharge outcomes and utilization (eg, length of PAC stay, emergency department revisits, and acute-care hospital readmissions), could occur with chart review, clinician and parent interview, and other methods. This body of work might ultimately lead to an assessment of value in PAC and potentially help us understand the need for PAC capacity in various communities. In the meantime, clinicians may find it useful to consider the results of the current study when contemplating PAC use in their hospitalized children with RI, including exploration of health system opportunities of clinical collaboration between acute-care children’s hospitals and PAC facilities. Ultimately, all of this work will generate meaningful knowledge regarding the most appropriate, safe, and cost-effective settings for hospitalized children with RI to regain their health.
Acknowledgments
Dr. Berry was supported by the Agency for Healthcare Research and Quality (R21 HS023092-01), the Lucile Packard Foundation for Children’s Health, and Franciscan Hospital for Children. The funders were not involved in the design and conduct of the study; collection, management, analysis, and interpretation of the data; and preparation, review, or approval of the manuscript; and decision to submit the manuscript for publication.
Disclosure: The authors have no financial relationships relevant to this article to disclose.
1. Friedman B, Berdahl T, Simpson LA, et al. Annual report on health care for children and youth in the United States: focus on trends in hospital use and quality. Acad Pediatr. 2011;11(4):263-279. PubMed
2. Srivastava R, Homer CJ. Length of stay for common pediatric conditions: teaching versus nonteaching hospitals. Pediatrics. 2003;112(2):278-281. PubMed
3. Berry JG, Hall M, Hall DE, et al. Inpatient growth and resource use in 28 children’s hospitals: a longitudinal, multi-institutional study. JAMA Pediatr. 2013;167(2):170-177. PubMed
4. Gold JM, Hall M, Shah SS, et al. Long length of hospital stay in children with medical complexity. J Hosp Med. 2016;11(11):750-756. PubMed
5. Faultner J. Integrating medical plans within family life. JAMA Pediatr. 2014;168(10):891-892. PubMed
6. O’Brien JE, Haley SM, Dumas HM, et al. Outcomes of post-acute hospital episodes for young children requiring airway support. Dev Neurorehabil. 2007;10(3):241-247. PubMed
7. Morley M, Bogasky S, Gage B, et al. Medicare post-acute care episodes and payment bundling. Medicare Medicaid Res Rev. 2014;4(1):mmrr.004.01.b02. PubMed
8. Mentro AM, Steward DK. Caring for medically fragile children in the home: an alternative theoretical approach. Res Theory Nurs Pract. 2002;16(3):161-177. PubMed
9. Thyen U, Kuhlthau K, Perrin JM. Employment, child care, and mental health of mothers caring for children assisted by technology. Pediatrics. 1999;103(6 Pt 1):1235-1242. PubMed
10. Thyen U, Terres NM, Yazdgerdi SR, Perrin JM. Impact of long-term care of children assisted by technology on maternal health. J Dev Behav Pediatr. 1998;19(4):273-282. PubMed
11. O’Brien JE, Berry J, Dumas H. Pediatric Post-acute hospital care: striving for identity and value. Hosp Pediatr. 2015;5(10):548-551. PubMed
12. Berry JG, Hall M, Dumas H, et al. Pediatric hospital discharges to home health and postacute facility care: a national study. JAMA Pediatr. 2016;170(4):326-333. PubMed
13. Children’s Hospital Association. Pediatric Health Information System. https://childrenshospitals.org/Programs-and-Services/Data-Analytics-and-Research/Pediatric-Analytic-Solutions/Pediatric-Health-Information-System. Accessed June 12, 2017.
14. Agency for Healthcare Research and Quality. Chronic Condition Indicator. http://www.hcup-us.ahrq.gov/toolssoftware/chronic/chronic.jsp. Accessed on June 19, 2017.
15. Berry JG, Ash AS, Cohen E, Hasan F, Feudtner C, Hall M. Contributions of children with multiple chronic conditions to pediatric hospitalizations in the United States: A Retrospective Cohort Analysis [published online ahead of print June 20, 2017]. Hosp Pediatr. 2017 Jun 20. doi: 10.1542/hpeds.2016-0179. PubMed
16. Feudtner C, Feinstein JA, Zhong W, Hall M, Dai D. Pediatric complex chronic conditions classification system version 2: updated for ICD-10 and complex medical technology dependence and transplantation. BMC Pediatr. 2014;14:199. PubMed
17. Cohen E, Kuo DZ, Agrawal R, et al. Children with medical complexity: an emerging population for clinical and research initiatives. Pediatrics. 2011;127(3):529-538. PubMed
18. Feudtner C, Christakis DA, Connell FA. Pediatric deaths attributable to complex chronic conditions: a population-based study of Washington State, 1980-1997. Pediatrics. 2000;106(1 Pt 2):205-209. PubMed
19. Palfrey JS, Walker DK, Haynie M, et al. Technology’s children: report of a statewide census of children dependent on medical supports. Pediatrics. 1991;87(5):611-618. PubMed
20. Feudtner C, Villareale NL, Morray B, Sharp V, Hays RM, Neff JM. Technology-dependency among patients discharged from a children’s hospital: a retrospective cohort study. BMC Pediatr. 2005;5(1):8. PubMed
21. Breiman L, Freidman J, Stone CJ, Olshen RA. Classification and Regression Trees. Belmont, CA: Wadsworth International; 1984.
22. Thomson J, Hall M, Ambroggio L, et al. Aspiration and Non-Aspiration Pneumonia in Hospitalized Children With Neurologic Impairment. Pediatrics. 2016;137(2):e20151612. PubMed
23. Berry JG, Goldmann DA, Mandl KD, et al. Health information management and perceptions of the quality of care for children with tracheotomy: a qualitative study. BMC Health Serv Res. 2011;11:117. PubMed
Respiratory illness (RI) is one of the most common reasons for pediatric hospitalization.1 Examples of RI include acute illness, such as bronchiolitis, bacterial pneumonia, and asthma, as well as chronic conditions, such as obstructive sleep apnea and chronic respiratory insufficiency. Hospital care for RI includes monitoring and treatment to optimize oxygenation, ventilation, hydration, and other body functions. Most previously healthy children hospitalized with RI stay in the hospital for a limited duration (eg, a few days) because the severity of their illness is short lived and they quickly return to their previous healthy status.2 However, hospital care is increasing for children with fragile and tenuous health due to complex medical conditions.3 RI is a common reason for hospitalization among these children as well and recovery of respiratory health and function can be slow and protracted for some of them.4 Weeks, months, or longer periods of time may be necessary for the children to return to their previous respiratory baseline health and function after hospital discharge; other children may not return to their baseline.5,6
Hospitalized older adults with high-severity RI are routinely streamlined for transfer to post-acute facility care (PAC) shortly (eg, a few days) after acute-care hospitalization. Nearly 70% of elderly Medicare beneficiaries use PAC following a brief length of stay (LOS) in the acute-care hospital.7 It is believed that PAC helps optimize the patients’ health and functional status and relieves the family caregiving burden that would have occurred at home.8-10 PAC use also helps to shorten acute-care hospitalization for RI while avoiding readmission.8-10 In contrast with adult patients, use of PAC for hospitalized children is not routine.11 While PAC use in children is infrequent, RI is one of the most common reasons for acute admission among children who use it.12
For some children with RI, PAC might be positioned to offer a safe, therapeutic, and high-value setting for pulmonary rehabilitation, as well as related medical, nutritional, functional, and family cares.6 PAC, by design, could possibly help some of the children transition back into their homes and communities. As studies continue to emerge that assess the value of PAC in children, it is important to learn more about the use of PAC in children hospitalized with RI. The objectives were to (1) assess which children admitted with RI are the most likely to use PAC services for recovery and (2) estimate how many hospitalized children not using PAC had the same characteristics as those who did.
METHODS
Study Design, Setting, and Population
We conducted a retrospective cohort analysis of 609,800 hospitalizations for RI occurring from January 1, 2010 to December 31, 2015, in 43 freestanding children’s hospitals in the Pediatric Health Information Systems (PHIS) dataset. All hospitals participating in PHIS are members of the Children’s Hospital Association.13 The Boston Children’s Hospital Institutional Review Board approved this study with a waiver for informed consent.
RI was identified using the Agency for Healthcare Research and Quality (AHRQ) Clinical Classification System (CCS).14 Using diagnosis CCS category 8 (“Diseases of the Respiratory System”) and the procedure CCS category 6 (“Operations on the Respiratory System”), we identified all hospitalizations from the participating hospitals with a principal diagnosis or procedure International Classification of Diseases, 9th Revision, Clinical Modification (ICD-9-CM) code for an RI.
Main Outcome Measure
Discharge disposition following the acute-care hospitalization for RI was the main outcome measure. We used PHIS uniform disposition coding to classify the discharge disposition as transfer to PAC (ie, rehabilitation facility, skilled nursing facility, etc.) vs all other dispositions (ie, routine to home, against medical advice, etc.).12 The PAC disposition category was derived from the Centers for Medicare & Medicaid Services Patient Discharge Status Codes and Hospital Transfer Policies as informed by the National Uniform Billing Committee Official UB-04 Data Specifications Manual, 2008. PAC transfer included disposition to external PAC facilities, as well as to internal, embedded PAC units residing in a few of the acute-care children’s hospitals included in the cohort.
Demographic and Clinical Characteristics
We assessed patient demographic and clinical characteristics that might correlate with PAC use following acute-care hospitalization for RI. Demographic characteristics included gender, age at admission in years, payer (public, private, and other), and race/ethnicity (Hispanic, non-Hispanic black, non-Hispanic white, other).
Clinical characteristics included chronic conditions (type and number) and assistance with medical technology. Chronic condition and medical technology characteristics were assessed with ICD-9-CM diagnosis codes. PHIS contain up to 41 ICD-9-CM diagnosis codes per hospital discharge record. To identify the presence and number of chronic conditions, we used the AHRQ Chronic Condition Indicator system, which categorizes over 14,000 ICD-9-CM diagnosis codes into chronic vs non-chronic conditions.14,15 Children hospitalized with a chronic condition were further classified as having a complex chronic condition (CCC) using Feudtner and colleagues’ ICD-9-CM diagnosis classification scheme.16 CCCs represent defined diagnosis groupings expected to last longer than 12 months and involving either a single organ system, severe enough to require specialty pediatric care and hospitalization, or multiple organ systems.17,18 Hospitalized children who were assisted with medical technology were identified with ICD-9-CM codes indicating the use of a medical device to manage and treat a chronic illness (eg, ventricular shunt to treat hydrocephalus) or to maintain basic body functions necessary for sustaining life (eg, a tracheostomy tube for breathing).19,20 We distinguished children undergoing tracheotomy during hospitalization using ICD-9-CM procedure codes 31.1 and 31.2.
Acute-Care Hospitalization Characteristics
We also assessed the relationship between acute-care hospitalization characteristics and use of PAC after discharge, including US census region, LOS, use of intensive care, number of medication classes administered, and use of enhanced respiratory support. Enhanced respiratory support was defined as use of continuous or bilevel positive airway pressure (CPAP or BiPAP) or mechanical ventilation during the acute-care hospitalization for RI. These respiratory supports were identified using billing data in PHIS.
Statistical Analysis
In bivariable analysis, we compared demographic, clinical, and hospitalization characteristics of hospitalized children with vs without discharge to PAC using Rao-Scott chi-square tests and Wilcoxon rank-sum tests as appropriate. In multivariable analysis, we derived a generalized linear mix effects model with fixed effects for demographic, clinical, and hospitalization characteristics that were associated with PAC at P < 0.1 in bivariable analysis (ie, age, gender, race/ethnicity, payer, medical technology, use of intensive care unit [ICU], use of positive pressure or mechanical ventilation, hospital region, LOS, new tracheostomy, existing tracheostomy, other technologies, number of medications, number of chronic conditions [of any complexity], and type of complex chronic conditions). We controlled for clustering of patients within hospitals by including a random intercept for each hospital. We also assessed combinations of patient characteristics on the likelihood of PAC use with classification and regression tree (CART) modeling. Using CART, we determined which characteristic combinations were associated with the highest and lowest use of PAC using binary split and post-pruning, goodness of fit rules.21 All statistical analyses were performed using SAS v.9.4 (SAS Institute, Cary, NC), and R v.3.2 (R Foundation for Statistical Computing, Vienna, Austria) using the “party” package. The threshold for statistical significance was set at P < 0.05.
RESULTS
Of the 609,800 hospitalizations for RI, PAC use after discharge occurred for 2660 (0.4%). RI discharges to PAC accounted for 2.1% (n = 67,405) of hospital days and 2.7% ($280 million) of hospital cost of all RI hospitalizations. For discharges to PAC, the most common RI were pneumonia (29.1% [n = 773]), respiratory failure or insufficiency (unspecified reason; 22.0% [n = 584]), and upper respiratory infection (12.2% [n = 323]).
Demographic Characteristics
Median age at acute-care admission was higher for PAC vs non-PAC discharges (6 years [interquartile range {IQR} 1-15] vs 2 years [0-7], P < 0.001; Table 1). Hispanic patients accounted for a smaller percentage of RI discharges to PAC vs non-PAC (14.1% vs 21.8%, P < 0.001) and a higher percentage to PAC were for patients with public insurance (75.9% vs 62.5, P < 0.001; Table 1).
Clinical Characteristics
A greater percentage of RI hospitalizations discharged to PAC vs not-PAC had ≥1 CCC (94.9% vs 33.5%), including a neuromuscular CCC (57.5% vs 8.9%) or respiratory CCC (62.5% vs 12.0%), P < 0.001 for all (Table 2). A greater percentage discharged to PAC was assisted with medical technology (83.2% vs 15.1%), including respiratory technology (eg, tracheostomy; 53.8% vs 5.4%) and gastrointestinal technology (eg, gastrostomy; 71.9% vs 11.8%), P < 0.001 for all. Of the children with respiratory technology, 14.8% (n = 394) underwent tracheotomy during the acute-care hospitalization. Children discharged to PAC had a higher percentage of multiple chronic conditions. For example, the percentages of children discharged to PAC vs not with ≥7 conditions were 54.5% vs 7.0% (P < 0.001; Table 2). The most common chronic conditions experienced by children discharged to PAC included epilepsy (41.2%), gastroesophageal reflux (36.6%), cerebral palsy (28.2%), and asthma (18.2%).
Hospitalization Characteristics
Acute-care RI hospitalization median LOS was longer for discharges to PAC vs non-PAC (10 days [IQR 4-27] vs 2 days [IQR 1-4], P < 0.001; Table 1). A greater percentage of discharges to PAC were administered medications from multiple classes during the acute-care RI admission (eg, 54.8% vs 13.4% used medications from ≥7 classes, P < 0.001). A greater percentage of discharges to PAC used intensive care services during the acute-care admission (65.6% vs 22.4%, P < 0.001). A greater percentage of discharges to PAC received CPAP (10.6 vs 5.0%), BiPAP (19.8% vs 11.4%), or mechanical ventilation (52.7% vs 9.1%) during the acute-care RI hospitalization (P < 0.001 for all; Table 1).
Multivariable Analysis of the Likelihood of Post-Acute Care Use Following Discharge
In multivariable analysis, the patient characteristics associated with the highest likelihood of discharge to PAC included ≥11 vs no chronic conditions (odds ratio [OR] 11.8 , 95% CI, 8.0-17.2), ≥9 classes vs no classes of medications administered during the acute-care hospitalization (OR 4.8 , 95% CI, 1.8-13.0), and existing tracheostomy (OR 3.0, [95% CI, 2.6-3.5; Figure 2 and eTable). Patient characteristics associated with a more modest likelihood of discharge to PAC included public vs private insurance (OR 1.8, 95% CI, 1.6-2.0), neuromuscular complex chronic condition (OR 1.6, 95% CI, 1.5-1.8), new tracheostomy (OR 1.9, 95% CI, 1.7-2.2), and use of any enhanced respiratory support (ie, CPAP/BiPAP/mechanical ventilation) during the acute-care hospitalization (OR 1.4, 95% CI, 1.3-1.6; Figure 2 and Supplementary Table).
Classification and Regression Tree Analysis
In the CART analysis, the highest percentage (6.3%) of children hospitalized with RI who were discharged to PAC had the following combination of characteristics: ≥6 chronic conditions, ≥7 classes of medications administered, and respiratory technology. Median (IQR) length of acute-care LOS for children with these attributes who were transferred to PAC was 19 (IQR 8-56; range 1-1005) days; LOS remained long (median 13 days [IQR 6-41, range 1-1413]) for children with the same attributes not transferred to PAC (n = 9448). Between these children transferred vs not to PAC, 79.3% vs 65.9% received ICU services; 74.4% vs 73.5% received CPAP, BiPAP, or mechanical ventilation; and 31.0% vs 22.7% underwent tracheotomy during the acute-care hospitalization. Of these children who were not transferred to PAC, 18.9% were discharged to home nursing services.
DISCUSSION
The findings from the present study suggest that patients with RI hospitalization in children’s hospitals who use PAC are medically complex, with high rates of multiple chronic conditions—including cerebral palsy, asthma, chronic respiratory insufficiency, dysphagia, epilepsy, and gastroesophageal reflux—and high rates of technology assistance including enterostomy and tracheostomy. The characteristics of patients most likely to use PAC include long LOS, a large number of chronic conditions, many types of medications administered during the acute-care hospitalization, respiratory technology use, and an underlying neuromuscular condition. Specifically, the highest percentage of children hospitalized with RI who were discharged to PAC had ≥6 chronic conditions, ≥7 classes of medications administered, and respiratory technology. Our analysis suggests that there may be a large population of children with these same characteristics who experienced a prolonged LOS but were not transferred to PAC.
There are several reasons to explain why children hospitalized with RI who rely on medical technology, such as existing tracheostomy, are more likely to use PAC. Tracheostomy often indicates the presence of life-limiting impairment in oxygenation or ventilation, thereby representing a high degree of medical fragility. Tracheostomy, in some cases, offers enhanced ability to assist with RI treatment, including establishment of airway clearance of secretions (ie, suctioning and chest physiotherapy), administration of antimicrobials (eg, nebulized antibiotics), and optimization of ventilation (eg, non-invasive positive airway pressure). However, not all acute-care inpatient clinicians have experience and clinical proficiencies in the care of children with pediatric tracheostomy.23 As a result, a more cautious approach, with prolonged LOS and gradual arrival to hospital discharge, is often taken in the acute-care hospital setting for children with tracheostomy. Tracheostomy care delivered during recovery from RI by trained and experienced teams of providers in the PAC setting may be best positioned to help optimize respiratory health and ensure proper family education and readiness to continue care at home.6
Further investigation is needed of the long LOS in children not transferred to PAC who had similar characteristics to those who were transferred. In hospitalized adult patients with RI, PAC is routinely introduced early in the admission process, with anticipated transfer within a few days into the hospitalization. In the current study, LOS was nearly 2 weeks or longer in many children not transferred to PAC who had similar characteristics to those who were transferred. Perhaps some of the children not transferred experienced long LOS in the acute-care hospital because of a limited number of pediatric PAC beds in their local area. Some families of these children may have been offered but declined use of PAC. PAC may not have been offered to some because illness acuity was too high or there was lack of PAC awareness as a possible setting for recovery.
There are several limitations to this study. PHIS does not contain non-freestanding children’s hospitals; therefore, the study results may generalize best to children’s hospitals. PHIS does not contain information on the amount (eg, number of days used), cost, or treatments provided in PAC. Therefore, we were unable to determine the true reasons why children used PAC services following RI hospitalization (eg, for respiratory rehabilitation vs other reasons, such as epilepsy or nutrition/hydration management). Moreover, we could not assess which children truly used PAC for short-term recovery vs longer-term care because they were unable to reside at home (eg, they were too medically complex). We were unable to assess PAC availability (eg, number of beds) in the surrounding areas of the acute-care hospitals in the PHIS database. Although we assessed use of medical technology, PHIS does not contain data on functional status or activities of daily living, which correlate with the use of PAC in adults. We could not distinguish whether children receiving BiPAP, CPAP, or mechanical ventilation during hospitalization were using it chronically. Although higher PAC use was associated with public insurance, due to absent information on the children’s home, family, and social environment, we were unable to assess whether PAC use was influenced by limited caregiving support or resources.
Data on the type and number of chronic conditions are limited by the ICD-9-CM codes available to distinguish them. Although several patient demographic and clinical characteristics were significantly associated with the use of PAC, significance may have occurred because of the large sample size and consequent robust statistical power. This is why we elected to highlight and discuss the characteristics with the strongest and most clinically meaningful associations (eg, multiple chronic conditions). There may be additional characteristics, including social, familial, and community resources, that are not available to assess in PHIS that could have affected PAC use.
Despite these limitations, the current study suggests that the characteristics of children hospitalized with RI who use PAC for recovery are evident and that there is a large population of children with these characteristics who experienced a prolonged LOS that did not result in transfer to PAC. These findings could be used in subsequent studies to help create the base of a matched cohort of children with similar clinical, demographic, and hospitalization characteristics who used vs didn’t use PAC. Comparison of the functional status, health trajectory, and family and/or social attributes of these 2 groups of children, as well as their post-discharge outcomes and utilization (eg, length of PAC stay, emergency department revisits, and acute-care hospital readmissions), could occur with chart review, clinician and parent interview, and other methods. This body of work might ultimately lead to an assessment of value in PAC and potentially help us understand the need for PAC capacity in various communities. In the meantime, clinicians may find it useful to consider the results of the current study when contemplating PAC use in their hospitalized children with RI, including exploration of health system opportunities of clinical collaboration between acute-care children’s hospitals and PAC facilities. Ultimately, all of this work will generate meaningful knowledge regarding the most appropriate, safe, and cost-effective settings for hospitalized children with RI to regain their health.
Acknowledgments
Dr. Berry was supported by the Agency for Healthcare Research and Quality (R21 HS023092-01), the Lucile Packard Foundation for Children’s Health, and Franciscan Hospital for Children. The funders were not involved in the design and conduct of the study; collection, management, analysis, and interpretation of the data; and preparation, review, or approval of the manuscript; and decision to submit the manuscript for publication.
Disclosure: The authors have no financial relationships relevant to this article to disclose.
1. Friedman B, Berdahl T, Simpson LA, et al. Annual report on health care for children and youth in the United States: focus on trends in hospital use and quality. Acad Pediatr. 2011;11(4):263-279. PubMed
2. Srivastava R, Homer CJ. Length of stay for common pediatric conditions: teaching versus nonteaching hospitals. Pediatrics. 2003;112(2):278-281. PubMed
3. Berry JG, Hall M, Hall DE, et al. Inpatient growth and resource use in 28 children’s hospitals: a longitudinal, multi-institutional study. JAMA Pediatr. 2013;167(2):170-177. PubMed
4. Gold JM, Hall M, Shah SS, et al. Long length of hospital stay in children with medical complexity. J Hosp Med. 2016;11(11):750-756. PubMed
5. Faultner J. Integrating medical plans within family life. JAMA Pediatr. 2014;168(10):891-892. PubMed
6. O’Brien JE, Haley SM, Dumas HM, et al. Outcomes of post-acute hospital episodes for young children requiring airway support. Dev Neurorehabil. 2007;10(3):241-247. PubMed
7. Morley M, Bogasky S, Gage B, et al. Medicare post-acute care episodes and payment bundling. Medicare Medicaid Res Rev. 2014;4(1):mmrr.004.01.b02. PubMed
8. Mentro AM, Steward DK. Caring for medically fragile children in the home: an alternative theoretical approach. Res Theory Nurs Pract. 2002;16(3):161-177. PubMed
9. Thyen U, Kuhlthau K, Perrin JM. Employment, child care, and mental health of mothers caring for children assisted by technology. Pediatrics. 1999;103(6 Pt 1):1235-1242. PubMed
10. Thyen U, Terres NM, Yazdgerdi SR, Perrin JM. Impact of long-term care of children assisted by technology on maternal health. J Dev Behav Pediatr. 1998;19(4):273-282. PubMed
11. O’Brien JE, Berry J, Dumas H. Pediatric Post-acute hospital care: striving for identity and value. Hosp Pediatr. 2015;5(10):548-551. PubMed
12. Berry JG, Hall M, Dumas H, et al. Pediatric hospital discharges to home health and postacute facility care: a national study. JAMA Pediatr. 2016;170(4):326-333. PubMed
13. Children’s Hospital Association. Pediatric Health Information System. https://childrenshospitals.org/Programs-and-Services/Data-Analytics-and-Research/Pediatric-Analytic-Solutions/Pediatric-Health-Information-System. Accessed June 12, 2017.
14. Agency for Healthcare Research and Quality. Chronic Condition Indicator. http://www.hcup-us.ahrq.gov/toolssoftware/chronic/chronic.jsp. Accessed on June 19, 2017.
15. Berry JG, Ash AS, Cohen E, Hasan F, Feudtner C, Hall M. Contributions of children with multiple chronic conditions to pediatric hospitalizations in the United States: A Retrospective Cohort Analysis [published online ahead of print June 20, 2017]. Hosp Pediatr. 2017 Jun 20. doi: 10.1542/hpeds.2016-0179. PubMed
16. Feudtner C, Feinstein JA, Zhong W, Hall M, Dai D. Pediatric complex chronic conditions classification system version 2: updated for ICD-10 and complex medical technology dependence and transplantation. BMC Pediatr. 2014;14:199. PubMed
17. Cohen E, Kuo DZ, Agrawal R, et al. Children with medical complexity: an emerging population for clinical and research initiatives. Pediatrics. 2011;127(3):529-538. PubMed
18. Feudtner C, Christakis DA, Connell FA. Pediatric deaths attributable to complex chronic conditions: a population-based study of Washington State, 1980-1997. Pediatrics. 2000;106(1 Pt 2):205-209. PubMed
19. Palfrey JS, Walker DK, Haynie M, et al. Technology’s children: report of a statewide census of children dependent on medical supports. Pediatrics. 1991;87(5):611-618. PubMed
20. Feudtner C, Villareale NL, Morray B, Sharp V, Hays RM, Neff JM. Technology-dependency among patients discharged from a children’s hospital: a retrospective cohort study. BMC Pediatr. 2005;5(1):8. PubMed
21. Breiman L, Freidman J, Stone CJ, Olshen RA. Classification and Regression Trees. Belmont, CA: Wadsworth International; 1984.
22. Thomson J, Hall M, Ambroggio L, et al. Aspiration and Non-Aspiration Pneumonia in Hospitalized Children With Neurologic Impairment. Pediatrics. 2016;137(2):e20151612. PubMed
23. Berry JG, Goldmann DA, Mandl KD, et al. Health information management and perceptions of the quality of care for children with tracheotomy: a qualitative study. BMC Health Serv Res. 2011;11:117. PubMed
© 2017 Society of Hospital Medicine
If You Book It, Will They Come? Attendance at Postdischarge Follow-Up Visits Scheduled by Inpatient Providers
Given growing incentives to reduce readmission rates, predischarge checklists and bundles have recommended that inpatient providers schedule postdischarge follow-up visits (PDFVs) for their hospitalized patients.1-4 PDFVs have been linked to lower readmission rates in patients with chronic conditions, including congestive heart failure, psychiatric illnesses, and chronic obstructive pulmonary disease.5-8 In contrast, the impact of PDFVs on readmissions in hospitalized general medicine populations has been mixed.9-12 Beyond the presence or absence of PDFVs, it may be a patient’s inability to keep scheduled PDFVs that contributes more strongly to preventable readmissions.11
This challenge, dealing with the 12% to 37% of patients who miss their visits (“no-shows”), is not new.13-17 In high-risk patient populations, such as those with substance abuse, diabetes, or human immunodeficiency virus, no-shows (NSs) have been linked to poorer short-term and long-term clinical outcomes.16,18-20 Additionally, NSs pose a challenge for outpatient clinics and the healthcare system at large. The financial cost of NSs ranges from approximately $200 per patient in 2 analyses to $7 million in cumulative lost revenue per year at 1 large academic health system.13,17,21 As such, increasing attendance at PDFVs is a potential target for improving both patient outcomes and clinic productivity.
Most prior PDFV research has focused on readmission risk rather than PDFV attendance as the primary outcome.5-12 However, given the patient-oriented benefits of attending PDFVs and the clinic-oriented benefits of avoiding vacant time slots, NS PDFVs represent an important missed opportunity for our healthcare delivery system. To our knowledge, risk factors for PDFV nonattendance have not yet been systematically studied. The aim of our study was to analyze PDFV nonattendance, particularly NSs and same-day cancellations (SDCs), for hospitalizations and clinics within our healthcare system.
METHODS
Study Design
We conducted an observational cohort study of adult patients from 10 medical units at the Hospital of the University of Pennsylvania (a 789-bed quaternary-care hospital within an urban, academic medical system) who were scheduled with at least 1 PDFV. Specifically, the patients included in our analysis were hospitalized on general internal medicine services or medical subspecialty services with discharge dates between April 1, 2014, and March 31, 2015. Hospitalizations included in our study had at least 1 PDFV scheduled with an outpatient provider affiliated with the University of Pennsylvania Health System (UPHS). PDFVs scheduled with unaffiliated providers were not examined.
Each PDFV was requested by a patient’s inpatient care team. Once the care team had determined that a PDFV was clinically warranted, a member of the team (generally a resident, advanced practice provider, medical student, or designee) either called the UPHS clinic to schedule an appointment time or e-mailed the outpatient UPHS provider directly to facilitate a more urgent PDFV appointment time. Once a PDFV time was confirmed, PDFV details (ie, date, time, location, and phone number) were electronically entered into the patient’s discharge instructions by the inpatient care team. At the time of discharge, nurses reviewed these instructions with their patients. All patients left the hospital with a physical copy of these instructions. As part of routine care at our institution, patients then received automated telephone reminders from their UPHS-affiliated outpatient clinic 48 hours prior to each PDFV.
Data Collection
Our study was determined to meet criteria for quality improvement by the University of Pennsylvania’s Institutional Review Board. We used our healthcare system’s integrated electronic medical record system to track the dates of initial PDFV requests, the dates of hospitalization, and actual PDFV dates. PDFVs were included if the appointment request was made while a patient was hospitalized, including the day of discharge. Our study methodology only allowed us to investigate PDFVs scheduled with UPHS outpatient providers. We did not review discharge instructions or survey non-UPHS clinics to quantify visits scheduled with other providers, for example, community health centers or external private practices.
Exclusion criteria included the following: (1) office visits with nonproviders, for example, scheduled diagnostic procedures or pharmacist appointments for warfarin dosing; (2) visits cancelled by inpatient providers prior to discharge; (3) visits for patients not otherwise eligible for UPHS outpatient care because of insurance reasons; and (4) visits scheduled for dates after a patient’s death. Our motivation for the third exclusion criterion was the infrequent and irregular process by which PDFVs were authorized for these patients. These patients and their characteristics are described in Supplementary Table 1 in more detail.
For each PDFV, we recorded age, gender, race, insurance status, driving distance, length of stay for index hospitalization, discharging service (general internal medicine vs subspecialty), postdischarge disposition (home, home with home care services such as nursing or physical therapy, or facility), the number of PDFVs scheduled per index hospitalization, PDFV specialty type (oncologic subspecialty, nononcologic medical subspecialty, nononcologic surgical subspecialty, primary care, or other specialty), PDFV season, and PDFV lead time (the number of days between the discharge date and PDFV). We consolidated oncologic specialties into 1 group given the integrated nature of our healthcare system’s comprehensive cancer center. “Other” PDFV specialty subtypes are described in Supplementary Table 2. Driving distances between patient postal codes and our hospital were calculated using Excel VBA Master (Salt Lake City, Utah) and were subsequently categorized into patient-level quartiles for further analysis. For cancelled PDFVs, we collected dates of cancellation relative to the date of the appointment itself.
Study Outcomes
The primary study outcome was PDFV attendance. Each PDFV’s status was categorized by outpatient clinic staff as attended, cancelled, or NS. For cancelled appointments, cancellation dates and reasons (if entered by clinic representatives) were collected. In keeping with prior studies investigating outpatient nonattendance,we calculated collective NS/SDC rates for the variables listed above.17,22-25 We additionally calculated NS/SDC and attendance-as-scheduled rates stratified by the number of PDFVs per patient to assess for a “high-utilizer” effect with regard to PDFV attendance.
Statistical Analysis
We used multivariable mixed-effects regression with a logit link to assess associations between age, gender, race, insurance, driving distance quartile, length of stay, discharging service, postdischarge disposition, the number of PDFVs per hospitalization, PDFV specialty type, PDFV season, PDFV lead time, and our NS/SDC outcome. The mixed-effects approach was used to account for correlation structures induced by patients who had multiple visits and for patients with multiple hospitalizations. Specifically, our model specified 2 levels of nesting (PDFVs nested within each hospitalization, which were nested within each patient) to obtain appropriate standard error estimates for our adjusted odds ratios (ORs). Correlation matrices and multivariable variance inflation factors were used to assess collinearity among the predictor variables. These assessments did not indicate strong collinearity; hence, all predictors were included in the model. Only driving distance had a small amount of missing data (0.18% of driving distances were unavailable), so multiple imputation was not undertaken. Analyses were performed using R version 3.3.1 (R Foundation for Statistical Computing, Vienna, Austria).
RESULTS
Baseline Characteristics
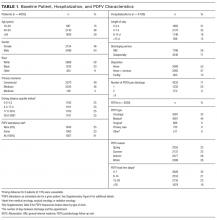

During the 1-year study period, there were 11,829 discrete hospitalizations in medical units at our hospital. Of these hospitalizations, 6136 (52%) had at least 1 UPHS-affiliated PDFV meeting our inclusion and exclusion criteria, as detailed in the Figure. Across these hospitalizations, 9258 PDFVs were scheduled on behalf of 4653 patients. Demographic characteristics for these patients, hospitalizations, and visits are detailed in Table 1. The median age of patients in our cohort was 61 years old (interquartile range [IQR] 49-70, range 18-101). The median driving distance was 17 miles (IQR 4.3-38.8, range 0-2891). For hospitalizations, the median length of stay was 5 days (IQR 3-10, range 0-97). The median PDFV lead time, which is defined as the number of days between discharge and PDFV, was 12 days (IQR 6-23, range 1-60). Overall, 41% of patients (n = 1927) attended all of their PDFVs as scheduled; Supplementary Figure 1 lists patient-level PDFV attendance-as-scheduled percentages in more detail.
Incidence of NSs and SDCs
Twenty-five percent of PDFVs (n = 2303) were ultimately NS/SDCs; this included 1658 NSs (18% of all appointments) and 645 SDCs (7% of all appointments). Fifty-two percent of PDFVs (n = 4847) were kept as scheduled, while 23% (n = 2108) were cancelled before the day of the visit. Of the 2558 cancellations with valid cancellation dates, 49% (n = 1252) were cancelled 2 or fewer days beforehand, as shown in Supplementary Figure 2.
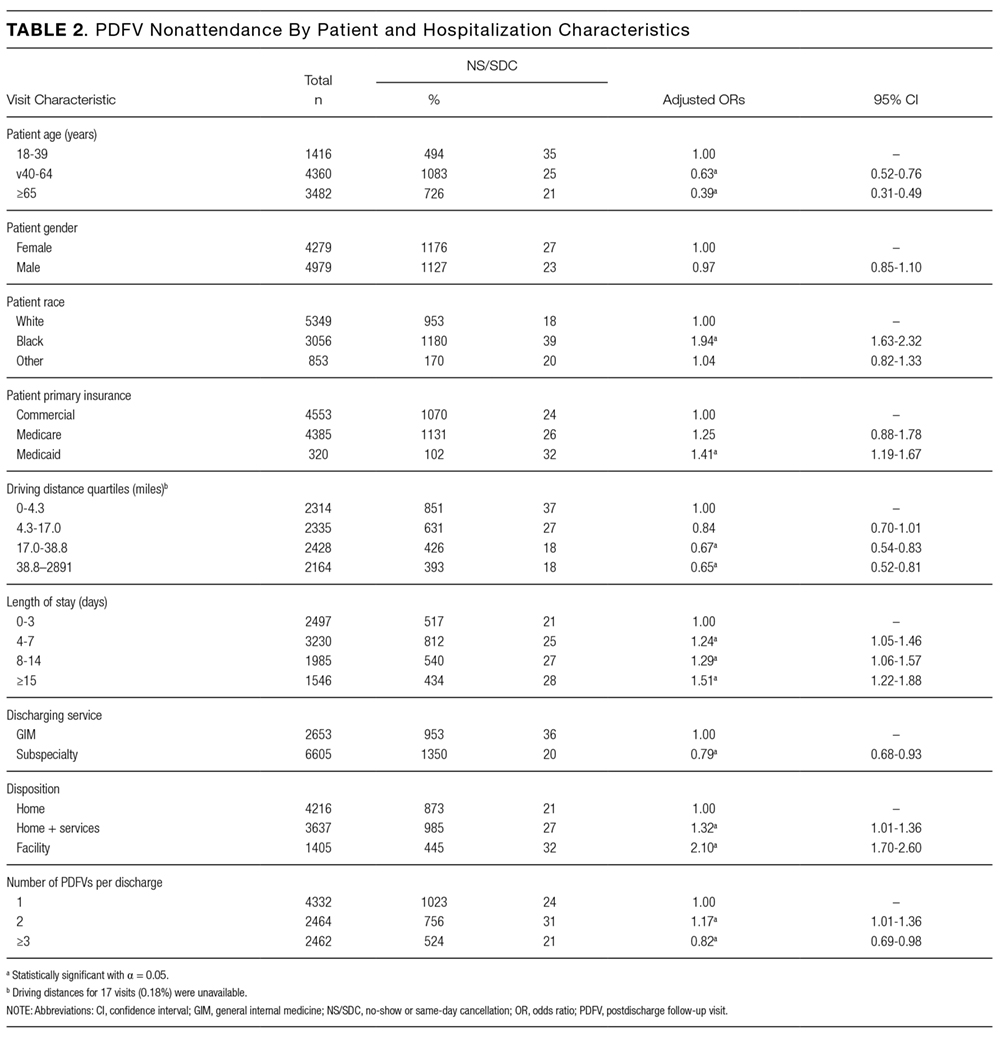
The presence of exactly 2 PDFVs per hospitalization was also associated with higher NS/SDC rates (OR 1.17, 95% CI, 1.01-1.36), compared to a single PDFV per hospitalization; however, the presence of more than 2 PDFVs per hospitalization was associated with lower NS/SDC rates (OR 0.82, 95% CI, 0.69-0.98). A separate analysis (data not shown) of potential high utilizers revealed a 15% NS/SDC rate for the top 0.5% of patients (median: 18 PDFVs each) and an 18% NS/SDC rate for the top 1% of patients (median: 14 PDFVs each) with regard to the numbers of PDFVs scheduled, compared to the 25% overall NS/SDC rate for all patients.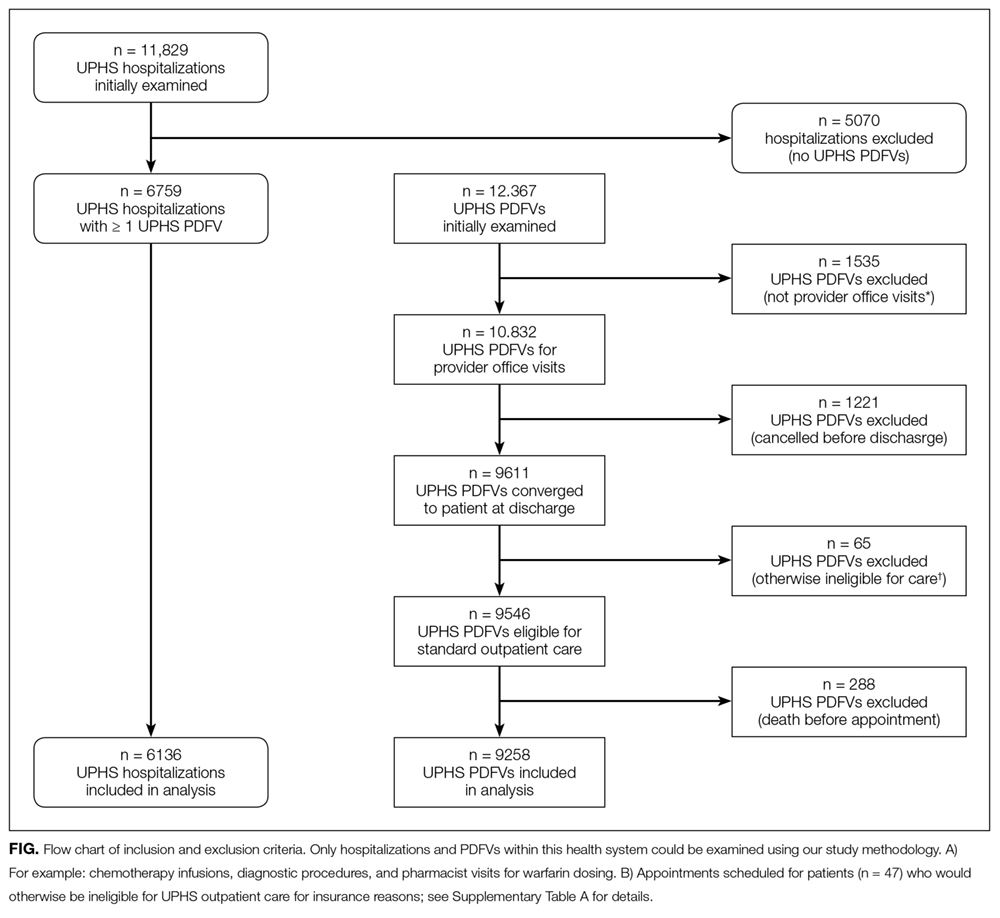
NS/SDC rates and adjusted ORs with regard to individual PDFV characteristics are displayed in Table 3. Nononcologic visits had higher NS/SDC rates than oncologic visits; for example, the NS/SDC rate for primary care visits was 39% (OR 2.62, 95% CI, 2.03-3.38), compared to 12% for oncologic visits. Appointments in the “other” specialty category also had high nonattendance rates, as further described in Supplementary Table B. Summertime appointments were more likely to be attended (OR 0.81, 95% CI, 0.68-0.97) compared to those in the spring. PDFV lead time (the time interval between the discharge date and appointment date) was not associated with changes in visit attendance.
DISCUSSION
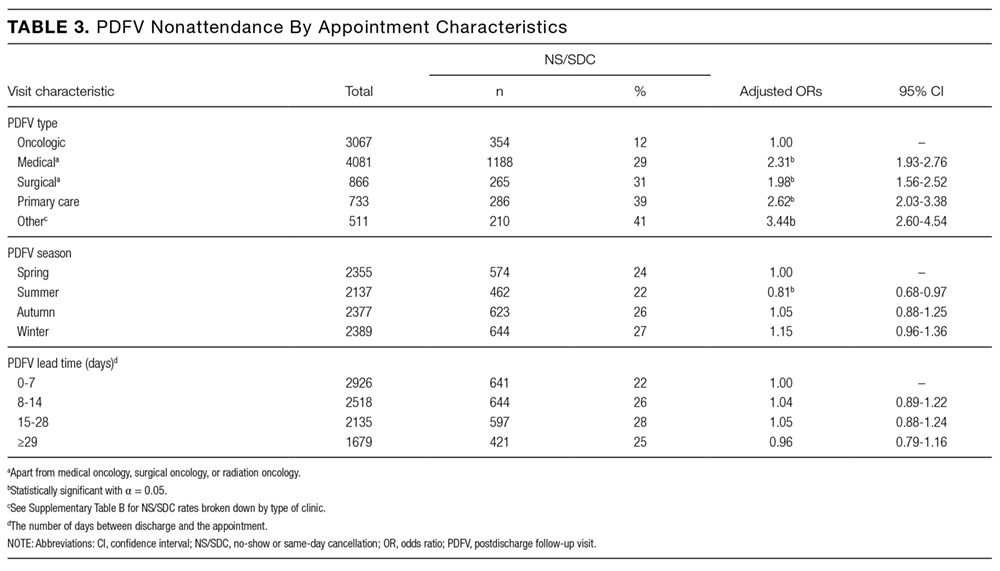
When comparing PDFV characteristics themselves, oncologic visits had the lowest NS/SDC incidence of any group analyzed in our study. This may be related to the inherent life-altering nature of a cancer diagnosis or our cancer center’s use of patient navigators.23,30 In contrast, primary care clinics suffered from NS/SDC rates approaching 40%, which is a concerning finding given the importance of primary care coordination in the posthospitalization period.9,31 Why are primary care appointments so commonly missed? Some studies suggest that forgetting about a primary care appointment is a leading reason.15,32,33 For PDFVs, this phenomenon may be augmented because the visits are not scheduled by patients themselves. Additionally, patients may paradoxically undervalue the benefit of an all-encompassing primary care visit, compared to a PDFV focused on a specific problem, (eg, a cardiology follow-up appointment for a patient with congestive heart failure). In particular, patients with limited health literacy may potentially undervalue the capabilities of their primary care clinics.34,35
The low absolute number of primary care PDFVs (only 8% of all visits) scheduled for patients at our hospital was an unexpected finding. This low percentage is likely a function of the patient population hospitalized at our large, urban quaternary-care facility. First, an unknown number of patients may have had PDFVs manually scheduled with primary care providers external to our health system; these PDFVs were not captured within our study. Second, 71% of the hospitalizations in our study occurred in subspecialty services, for which specific primary care follow-up may not be as urgent. Supporting this fact, further analysis of the 6136 hospitalizations in our study (data not shown) revealed that 28% of the hospitalizations in general internal medicine were scheduled with at least 1 primary care PDFV as opposed to only 5% of subspecialty-service hospitalizations.
In contrast to several previous studies of outpatient nonattendance,we did not find that visits scheduled for time points further in the future were more likely to be missed.14,24,25,36,37 Unlike other appointments, it may be that PDFV lead time does not affect attendance because of the unique manner in which PDFV times are scheduled and conveyed to patients. Unlike other appointments, patients do not schedule PDFVs themselves but instead learn about their PDFV dates as part of a large set of discharge instructions. This practice may result in poor recall of PDFV dates in recently hospitalized patients38, regardless of the lead time between discharge and the visit itself.
Supplementary Table 1 details a 51% NS/SDC rate for the small number of PDFVs (n = 65) that were excluded a priori from our analysis because of general ineligibility for UPHS outpatient care. We specifically chose to exclude this population because of the infrequent and irregular process by which these PDFVs were authorized on a case-by-case basis, typically via active engagement by our hospital’s social work department. We did not study this population further but postulate that the 51% NS/SDC rate may reflect other social determinants of health that contribute to appointment nonadherence in a predominantly uninsured population.
Beyond their effect on patient outcomes, improving PDFV-related processes has the potential to boost both inpatient and outpatient provider satisfaction. From the standpoint of frontline inpatient providers (often resident physicians), calling outpatient clinics to request PDFVs is viewed as 1 of the top 5 administrative tasks that interfere with house staff education.39 Future interventions that involve patients in the PDFV scheduling process may improve inpatient workflow while simultaneously engaging patients in their own care. For example, asking clinic representatives to directly schedule PDFVs with hospitalized patients, either by phone or in person, has been shown in pilot studies to improve PDFV attendance and decrease readmissions.40-42 Conversely, NS/SDC visits harm outpatient provider productivity and decrease provider availability for other patients.13,17,43 Strategies to mitigate the impact of unfilled appointment slots (eg, deliberately overbooking time slots in advance) carry their own risks, including provider burnout.44 As such, preventing NSs may be superior to curing their adverse impacts. Many such strategies exist in the ambulatory setting,13,43,45 for example, better communication with patients through texting or goal-directed, personalized phone reminders.46-48Our study methodology has several limitations. Most importantly, we were unable to measure PDFVs made with providers unaffiliated with UPHS. As previously noted, our low proportion of primary care PDFVs may specifically reflect patients with primary care providers outside of our health system. Similarly, our low percentage of Medicaid patients receiving PDFVs may be related to follow-up visits with nonaffiliated community health centers. We were unable to measure patient acuity and health literacy as potential predictors of NS/SDC rates. Driving distances were calculated from patient postal codes to our hospital, not to individual outpatient clinics. However, the majority of our hospital-affiliated clinics are located adjacent to our hospital; additionally, we grouped driving distances into quartiles for our analysis. We had initially attempted to differentiate between clinic-initiated and patient-initiated cancellations, but unfortunately, we found that the data were too unreliable to be used for further analysis (outlined in Supplementary Table 3). Lastly, because we studied patients in medical units at a single large, urban, academic center, our results are not generalizable to other settings (eg, community hospitals, hospitals with smaller networks of outpatient providers, or patients being discharged from surgical services or observation units).
CONCLUSION
Given national efforts to enhance postdischarge transitions of care, we aimed to analyze attendance at provider-scheduled PDFV appointments. Our finding that 25% of PDFVs resulted in NS/SDCs raises both questions and opportunities for inpatient and outpatient providers. Further research is needed to understand why so many patients miss their PDFVs, and we should work as a field to develop creative solutions to improve PDFV scheduling and attendance.
Acknowledgments
The authors acknowledge Marie Synnestvedt, PhD, and Manik Chhabra, MD, for their assistance with data gathering and statistical analysis. They also acknowledge Allison DeKosky, MD, Michael Serpa, BS, Michael McFall, and Scott Schlegel, MBA, for their assistance with researching this topic. They did not receive external compensation for their assistance outside of their usual salary support.
DISCLOSURE
Nothing to report.
1. Halasyamani L, Kripalani S, Coleman E, et al. Transition of care for hospitalized elderly patients - development of a discharge checklist for hospitalists. J Hosp Med. 2006;1(6):354-360. PubMed
2. Koehler BE, Richter KM, Youngblood L, et al. Reduction of 30-day postdischarge hospital readmission or emergency department (ED) visit rates in high-risk elderly medical patients through delivery of a targeted care bundle. J Hosp Med. 2009;4(4):211-218. PubMed
3. Soong C, Daub S, Lee JG, et al. Development of a checklist of safe discharge practices for hospital patients. J Hosp Med. 2013;8(8):444-449. PubMed
4. Rice YB, Barnes CA, Rastogi R, Hillstrom TJ, Steinkeler CN. Tackling 30-day, all-cause readmissions with a patient-centered transitional care bundle. Popul Health Manag. 2016;19(1):56-62. PubMed
5. Nelson EA, Maruish MM, Axler JL. Effects of discharge planning and compliance with outpatient appointments on readmission rates. Psych Serv. 2000;51(7):885-889. PubMed
6. Gavish R, Levy A, Dekel OK, Karp E, Maimon N. The association between hospital readmission and pulmonologist follow-up visits in patients with chronic obstructive pulmonary disease. Chest. 2015;148(2):375-381. PubMed
7. Jackson C, Shahsahebi M, Wedlake T, DuBard CA. Timeliness of outpatient follow-up: an evidence-based approach for planning after hospital discharge. Ann Fam Med. 2015;13(2):115-122. PubMed
8. Donaho EK, Hall AC, Gass JA, et al. Protocol-driven allied health post-discharge transition clinic to reduce hospital readmissions in heart failure. J Am Heart Assoc. 2015;4(12):e002296. PubMed
9. Misky GJ, Wald HL, Coleman EA. Post-hospitalization transitions: Examining the effects of timing of primary care provider follow-up. J Hosp Med. 2010;5(7):392-397. PubMed
10. Grafft CA, McDonald FS, Ruud KL, Liesinger JT, Johnson MG, Naessens JM. Effect of hospital follow-up appointment on clinical event outcomes and mortality. Arch Intern Med. 2010;171(11):955-960. PubMed
11. Auerbach AD, Kripalani S, Vasilevskis EE, et al. Preventability and causes of readmissions in a national cohort of general medicine patients. JAMA Intern Med. 2016;176(4):484-493. PubMed
12. Field TS, Ogarek J, Garber L, Reed G, Gurwitz JH. Association of early post-discharge follow-up by a primary care physician and 30-day rehospitalization among older adults. J Gen Intern Med. 2015;30(5):565-571. PubMed
13. Quinn K. It’s no-show time! Med Group Manage Assoc Connexion. 2007;7(6):44-49. PubMed
14. Whittle J, Schectman G, Lu N, Baar B, Mayo-Smith MF. Relationship of scheduling interval to missed and cancelled clinic appointments. J Ambulatory Care Manage. 2008;31(4):290-302. PubMed
15. Kaplan-Lewis E, Percac-Lima S. No-show to primary care appointments: Why patients do not come. J Prim Care Community Health. 2013;4(4):251-255. PubMed
16. Molfenter T. Reducing appointment no-shows: Going from theory to practice. Subst Use Misuse. 2013;48(9):743-749. PubMed
17. Kheirkhah P, Feng Q, Travis LM, Tavakoli-Tabasi S, Sharafkhaneh A. Prevalence, predictors and economic consequences of no-shows. BMC Health Serv Res. 2016;16(1):13. PubMed
18. Colubi MM, Perez-Elias MJ, Elias L, et al. Missing scheduled visits in the outpatient clinic as a marker of short-term admissions and death. HIV Clin Trials. 2012;13(5):289-295. PubMed
19. Obialo CI, Hunt WC, Bashir K, Zager PG. Relationship of missed and shortened hemodialysis treatments to hospitalization and mortality: Observations from a US dialysis network. Clin Kidney J. 2012;5(4):315-319. PubMed
20. Hwang AS, Atlas SJ, Cronin P, et al. Appointment “no-shows” are an independent predictor of subsequent quality of care and resource utilization outcomes. J Gen Intern Med. 2015;30(10):1426-1433. PubMed
21. Perez FD, Xie J, Sin A, et al. Characteristics and direct costs of academic pediatric subspecialty outpatient no-show events. J Healthc Qual. 2014;36(4):32-42. PubMed
22. Huang Y, Zuniga P. Effective cancellation policy to reduce the negative impact of patient no-show. Journal of the Operational Research Society. 2013;65(5):605-615.
23. Percac-Lima S, Cronin PR, Ryan DP, Chabner BA, Daly EA, Kimball AB. Patient navigation based on predictive modeling decreases no-show rates in cancer care. Cancer. 2015;121(10):1662-1670. PubMed
24. Torres O, Rothberg MB, Garb J, Ogunneye O, Onyema J, Higgins T. Risk factor model to predict a missed clinic appointment in an urban, academic, and underserved setting. Popul Health Manag. 2015;18(2):131-136. PubMed
25. Eid WE, Shehata SF, Cole DA, Doerman KL. Predictors of nonattendance at an endocrinology outpatient clinic. Endocr Pract. 2016;22(8):983-989. PubMed
26. Kashiwagi DT, Burton MC, Kirkland LL, Cha S, Varkey P. Do timely outpatient follow-up visits decrease hospital readmission rates? Am J Med Qual. 2012;27(1):11-15. PubMed
27. Miller AJ, Chae E, Peterson E, Ko AB. Predictors of repeated “no-showing” to clinic appointments. Am J Otolaryngol. 2015;36(3):411-414. PubMed
28. ASCO. Billing challenges for residents of Skilled Nursing Facilities. J Oncol Pract. 2008;4(5):245-248. PubMed
29. Centers for Medicare & Medicaid Services (2013). “SE0433: Skilled Nursing Facility consolidated billing as it relates to ambulance services.” Medicare Learning Network Matters. https://www.cms.gov/Outreach-and-Education/Medicare-Learning-Network-MLN/MLNMattersArticles/downloads/se0433.pdf. Accessed on February 14, 2017.
30. Luckett R, Pena N, Vitonis A, Bernstein MR, Feldman S. Effect of patient navigator program on no-show rates at an academic referral colposcopy clinic. J Womens Health (Larchmt). 2015;24(7):608-615. PubMed
31. Jones CD, Vu MB, O’Donnell CM, et al. A failure to communicate: A qualitative exploration of care coordination between hospitalists and primary care providers around patient hospitalizations. J Gen Intern Med. 2015;30(4):417-424. PubMed
32. George A, Rubin G. Non-attendance in general practice: a systematic review and its implications for access to primary health care. Fam Pract. 2003;20(2):178-184. 2016;31(12):1460-1466.J Gen Intern Med. PubMed
48. Shah SJ, Cronin P, Hong CS, et al. Targeted reminder phone calls to patients at high risk of no-show for primary care appointment: A randomized trial. 2010;123(6):542-548.Am J Med. PubMed
47. Parikh A, Gupta K, Wilson AC, Fields K, Cosgrove NM, Kostis JB. The effectiveness of outpatient appointment reminder systems in reducing no-show rates. 2009;20:142-144.Int J STD AIDS. PubMed
46. Price H, Waters AM, Mighty D, et al. Texting appointment reminders reduces ‘Did not attend’ rates, is popular with patients and is cost-effective. 2009;25(3):166-170.J Med Practice Management. PubMed
45. Hills LS. How to handle patients who miss appointments or show up late.
2009;39(3):271-287.Interfaces. PubMed
44. Kros J, Dellana S, West D. Overbooking Increases Patient Access at East Carolina University’s Student Health Services Clinic. 2012;344(3):211-219.Am J Med Sci.
43. Stubbs ND, Geraci SA, Stephenson PL, Jones DB, Sanders S. Methods to reduce outpatient non-attendance. PubMed
42. Haftka A, Cerasale MT, Paje D. Direct patient participation in discharge follow-up appointment scheduling. Paper presented at: Society of Hospital Medicine, Annual Meeting 2015; National Harbor, MD. 2012;5(1):27-32.Patient.
41. Chang R, Spahlinger D, Kim CS. Re-engineering the post-discharge appointment process for general medicine patients. PubMed
40. Coffey C, Kufta J. Patient-centered post-discharge appointment scheduling improves readmission rates. Paper presented at: Society of Hospital Medicine, Annual Meeting 2011; Grapevine, Texas. 2006;81(1):76-81.Acad Med.
39. Vidyarthi AR, Katz PP, Wall SD, Wachter RM, Auerbach AD. Impact of reduced duty hours on residents’ education satistfaction at the University of California, San Francisco.
2013;173(18):1715-1722.JAMA Intern Med. PubMed
38. Horwitz LI, Moriarty JP, Chen C, et al. Quality of discharge practices and patient understanding at an academic medical center. 2010;16(4):246-259.Health Informatics J. PubMed
37. Daggy J, Lawley M, Willis D, et al. Using no-show modeling to improve clinic performance. 2005;5:51.BMC Health Serv Res. PubMed
36. Lee VJ, Earnest A, Chen MI, Krishnan B. Predictors of failed attendances in a multi-specialty outpatient centre using electronic databases. 2013;3(9):e003212.BMJ Open. PubMed
35. Long T, Genao I, Horwitz LI. Reasons for readmission in an underserved high-risk population: A qualitative analysis of a series of inpatient interviews. 2013;32(7):1196-1203.Health Aff (Millwood). PubMed
34. Kangovi S, Barg FK, Carter T, Long JA, Shannon R, Grande D. Understanding why patients of low socioeconomic status prefer hospitals over ambulatory care. 2015;54(10):976-982.Clin Pediatr (Phila). PubMed
33. Samuels RC, Ward VL, Melvin P, et al. Missed Appointments: Factors Contributing to High No-Show Rates in an Urban Pediatrics Primary Care Clinic. PubMed
Given growing incentives to reduce readmission rates, predischarge checklists and bundles have recommended that inpatient providers schedule postdischarge follow-up visits (PDFVs) for their hospitalized patients.1-4 PDFVs have been linked to lower readmission rates in patients with chronic conditions, including congestive heart failure, psychiatric illnesses, and chronic obstructive pulmonary disease.5-8 In contrast, the impact of PDFVs on readmissions in hospitalized general medicine populations has been mixed.9-12 Beyond the presence or absence of PDFVs, it may be a patient’s inability to keep scheduled PDFVs that contributes more strongly to preventable readmissions.11
This challenge, dealing with the 12% to 37% of patients who miss their visits (“no-shows”), is not new.13-17 In high-risk patient populations, such as those with substance abuse, diabetes, or human immunodeficiency virus, no-shows (NSs) have been linked to poorer short-term and long-term clinical outcomes.16,18-20 Additionally, NSs pose a challenge for outpatient clinics and the healthcare system at large. The financial cost of NSs ranges from approximately $200 per patient in 2 analyses to $7 million in cumulative lost revenue per year at 1 large academic health system.13,17,21 As such, increasing attendance at PDFVs is a potential target for improving both patient outcomes and clinic productivity.
Most prior PDFV research has focused on readmission risk rather than PDFV attendance as the primary outcome.5-12 However, given the patient-oriented benefits of attending PDFVs and the clinic-oriented benefits of avoiding vacant time slots, NS PDFVs represent an important missed opportunity for our healthcare delivery system. To our knowledge, risk factors for PDFV nonattendance have not yet been systematically studied. The aim of our study was to analyze PDFV nonattendance, particularly NSs and same-day cancellations (SDCs), for hospitalizations and clinics within our healthcare system.
METHODS
Study Design
We conducted an observational cohort study of adult patients from 10 medical units at the Hospital of the University of Pennsylvania (a 789-bed quaternary-care hospital within an urban, academic medical system) who were scheduled with at least 1 PDFV. Specifically, the patients included in our analysis were hospitalized on general internal medicine services or medical subspecialty services with discharge dates between April 1, 2014, and March 31, 2015. Hospitalizations included in our study had at least 1 PDFV scheduled with an outpatient provider affiliated with the University of Pennsylvania Health System (UPHS). PDFVs scheduled with unaffiliated providers were not examined.
Each PDFV was requested by a patient’s inpatient care team. Once the care team had determined that a PDFV was clinically warranted, a member of the team (generally a resident, advanced practice provider, medical student, or designee) either called the UPHS clinic to schedule an appointment time or e-mailed the outpatient UPHS provider directly to facilitate a more urgent PDFV appointment time. Once a PDFV time was confirmed, PDFV details (ie, date, time, location, and phone number) were electronically entered into the patient’s discharge instructions by the inpatient care team. At the time of discharge, nurses reviewed these instructions with their patients. All patients left the hospital with a physical copy of these instructions. As part of routine care at our institution, patients then received automated telephone reminders from their UPHS-affiliated outpatient clinic 48 hours prior to each PDFV.
Data Collection
Our study was determined to meet criteria for quality improvement by the University of Pennsylvania’s Institutional Review Board. We used our healthcare system’s integrated electronic medical record system to track the dates of initial PDFV requests, the dates of hospitalization, and actual PDFV dates. PDFVs were included if the appointment request was made while a patient was hospitalized, including the day of discharge. Our study methodology only allowed us to investigate PDFVs scheduled with UPHS outpatient providers. We did not review discharge instructions or survey non-UPHS clinics to quantify visits scheduled with other providers, for example, community health centers or external private practices.
Exclusion criteria included the following: (1) office visits with nonproviders, for example, scheduled diagnostic procedures or pharmacist appointments for warfarin dosing; (2) visits cancelled by inpatient providers prior to discharge; (3) visits for patients not otherwise eligible for UPHS outpatient care because of insurance reasons; and (4) visits scheduled for dates after a patient’s death. Our motivation for the third exclusion criterion was the infrequent and irregular process by which PDFVs were authorized for these patients. These patients and their characteristics are described in Supplementary Table 1 in more detail.
For each PDFV, we recorded age, gender, race, insurance status, driving distance, length of stay for index hospitalization, discharging service (general internal medicine vs subspecialty), postdischarge disposition (home, home with home care services such as nursing or physical therapy, or facility), the number of PDFVs scheduled per index hospitalization, PDFV specialty type (oncologic subspecialty, nononcologic medical subspecialty, nononcologic surgical subspecialty, primary care, or other specialty), PDFV season, and PDFV lead time (the number of days between the discharge date and PDFV). We consolidated oncologic specialties into 1 group given the integrated nature of our healthcare system’s comprehensive cancer center. “Other” PDFV specialty subtypes are described in Supplementary Table 2. Driving distances between patient postal codes and our hospital were calculated using Excel VBA Master (Salt Lake City, Utah) and were subsequently categorized into patient-level quartiles for further analysis. For cancelled PDFVs, we collected dates of cancellation relative to the date of the appointment itself.
Study Outcomes
The primary study outcome was PDFV attendance. Each PDFV’s status was categorized by outpatient clinic staff as attended, cancelled, or NS. For cancelled appointments, cancellation dates and reasons (if entered by clinic representatives) were collected. In keeping with prior studies investigating outpatient nonattendance,we calculated collective NS/SDC rates for the variables listed above.17,22-25 We additionally calculated NS/SDC and attendance-as-scheduled rates stratified by the number of PDFVs per patient to assess for a “high-utilizer” effect with regard to PDFV attendance.
Statistical Analysis
We used multivariable mixed-effects regression with a logit link to assess associations between age, gender, race, insurance, driving distance quartile, length of stay, discharging service, postdischarge disposition, the number of PDFVs per hospitalization, PDFV specialty type, PDFV season, PDFV lead time, and our NS/SDC outcome. The mixed-effects approach was used to account for correlation structures induced by patients who had multiple visits and for patients with multiple hospitalizations. Specifically, our model specified 2 levels of nesting (PDFVs nested within each hospitalization, which were nested within each patient) to obtain appropriate standard error estimates for our adjusted odds ratios (ORs). Correlation matrices and multivariable variance inflation factors were used to assess collinearity among the predictor variables. These assessments did not indicate strong collinearity; hence, all predictors were included in the model. Only driving distance had a small amount of missing data (0.18% of driving distances were unavailable), so multiple imputation was not undertaken. Analyses were performed using R version 3.3.1 (R Foundation for Statistical Computing, Vienna, Austria).
RESULTS
Baseline Characteristics
During the 1-year study period, there were 11,829 discrete hospitalizations in medical units at our hospital. Of these hospitalizations, 6136 (52%) had at least 1 UPHS-affiliated PDFV meeting our inclusion and exclusion criteria, as detailed in the Figure. Across these hospitalizations, 9258 PDFVs were scheduled on behalf of 4653 patients. Demographic characteristics for these patients, hospitalizations, and visits are detailed in Table 1. The median age of patients in our cohort was 61 years old (interquartile range [IQR] 49-70, range 18-101). The median driving distance was 17 miles (IQR 4.3-38.8, range 0-2891). For hospitalizations, the median length of stay was 5 days (IQR 3-10, range 0-97). The median PDFV lead time, which is defined as the number of days between discharge and PDFV, was 12 days (IQR 6-23, range 1-60). Overall, 41% of patients (n = 1927) attended all of their PDFVs as scheduled; Supplementary Figure 1 lists patient-level PDFV attendance-as-scheduled percentages in more detail.
Incidence of NSs and SDCs
Twenty-five percent of PDFVs (n = 2303) were ultimately NS/SDCs; this included 1658 NSs (18% of all appointments) and 645 SDCs (7% of all appointments). Fifty-two percent of PDFVs (n = 4847) were kept as scheduled, while 23% (n = 2108) were cancelled before the day of the visit. Of the 2558 cancellations with valid cancellation dates, 49% (n = 1252) were cancelled 2 or fewer days beforehand, as shown in Supplementary Figure 2.
The presence of exactly 2 PDFVs per hospitalization was also associated with higher NS/SDC rates (OR 1.17, 95% CI, 1.01-1.36), compared to a single PDFV per hospitalization; however, the presence of more than 2 PDFVs per hospitalization was associated with lower NS/SDC rates (OR 0.82, 95% CI, 0.69-0.98). A separate analysis (data not shown) of potential high utilizers revealed a 15% NS/SDC rate for the top 0.5% of patients (median: 18 PDFVs each) and an 18% NS/SDC rate for the top 1% of patients (median: 14 PDFVs each) with regard to the numbers of PDFVs scheduled, compared to the 25% overall NS/SDC rate for all patients.
NS/SDC rates and adjusted ORs with regard to individual PDFV characteristics are displayed in Table 3. Nononcologic visits had higher NS/SDC rates than oncologic visits; for example, the NS/SDC rate for primary care visits was 39% (OR 2.62, 95% CI, 2.03-3.38), compared to 12% for oncologic visits. Appointments in the “other” specialty category also had high nonattendance rates, as further described in Supplementary Table B. Summertime appointments were more likely to be attended (OR 0.81, 95% CI, 0.68-0.97) compared to those in the spring. PDFV lead time (the time interval between the discharge date and appointment date) was not associated with changes in visit attendance.
DISCUSSION
When comparing PDFV characteristics themselves, oncologic visits had the lowest NS/SDC incidence of any group analyzed in our study. This may be related to the inherent life-altering nature of a cancer diagnosis or our cancer center’s use of patient navigators.23,30 In contrast, primary care clinics suffered from NS/SDC rates approaching 40%, which is a concerning finding given the importance of primary care coordination in the posthospitalization period.9,31 Why are primary care appointments so commonly missed? Some studies suggest that forgetting about a primary care appointment is a leading reason.15,32,33 For PDFVs, this phenomenon may be augmented because the visits are not scheduled by patients themselves. Additionally, patients may paradoxically undervalue the benefit of an all-encompassing primary care visit, compared to a PDFV focused on a specific problem, (eg, a cardiology follow-up appointment for a patient with congestive heart failure). In particular, patients with limited health literacy may potentially undervalue the capabilities of their primary care clinics.34,35
The low absolute number of primary care PDFVs (only 8% of all visits) scheduled for patients at our hospital was an unexpected finding. This low percentage is likely a function of the patient population hospitalized at our large, urban quaternary-care facility. First, an unknown number of patients may have had PDFVs manually scheduled with primary care providers external to our health system; these PDFVs were not captured within our study. Second, 71% of the hospitalizations in our study occurred in subspecialty services, for which specific primary care follow-up may not be as urgent. Supporting this fact, further analysis of the 6136 hospitalizations in our study (data not shown) revealed that 28% of the hospitalizations in general internal medicine were scheduled with at least 1 primary care PDFV as opposed to only 5% of subspecialty-service hospitalizations.
In contrast to several previous studies of outpatient nonattendance,we did not find that visits scheduled for time points further in the future were more likely to be missed.14,24,25,36,37 Unlike other appointments, it may be that PDFV lead time does not affect attendance because of the unique manner in which PDFV times are scheduled and conveyed to patients. Unlike other appointments, patients do not schedule PDFVs themselves but instead learn about their PDFV dates as part of a large set of discharge instructions. This practice may result in poor recall of PDFV dates in recently hospitalized patients38, regardless of the lead time between discharge and the visit itself.
Supplementary Table 1 details a 51% NS/SDC rate for the small number of PDFVs (n = 65) that were excluded a priori from our analysis because of general ineligibility for UPHS outpatient care. We specifically chose to exclude this population because of the infrequent and irregular process by which these PDFVs were authorized on a case-by-case basis, typically via active engagement by our hospital’s social work department. We did not study this population further but postulate that the 51% NS/SDC rate may reflect other social determinants of health that contribute to appointment nonadherence in a predominantly uninsured population.
Beyond their effect on patient outcomes, improving PDFV-related processes has the potential to boost both inpatient and outpatient provider satisfaction. From the standpoint of frontline inpatient providers (often resident physicians), calling outpatient clinics to request PDFVs is viewed as 1 of the top 5 administrative tasks that interfere with house staff education.39 Future interventions that involve patients in the PDFV scheduling process may improve inpatient workflow while simultaneously engaging patients in their own care. For example, asking clinic representatives to directly schedule PDFVs with hospitalized patients, either by phone or in person, has been shown in pilot studies to improve PDFV attendance and decrease readmissions.40-42 Conversely, NS/SDC visits harm outpatient provider productivity and decrease provider availability for other patients.13,17,43 Strategies to mitigate the impact of unfilled appointment slots (eg, deliberately overbooking time slots in advance) carry their own risks, including provider burnout.44 As such, preventing NSs may be superior to curing their adverse impacts. Many such strategies exist in the ambulatory setting,13,43,45 for example, better communication with patients through texting or goal-directed, personalized phone reminders.46-48Our study methodology has several limitations. Most importantly, we were unable to measure PDFVs made with providers unaffiliated with UPHS. As previously noted, our low proportion of primary care PDFVs may specifically reflect patients with primary care providers outside of our health system. Similarly, our low percentage of Medicaid patients receiving PDFVs may be related to follow-up visits with nonaffiliated community health centers. We were unable to measure patient acuity and health literacy as potential predictors of NS/SDC rates. Driving distances were calculated from patient postal codes to our hospital, not to individual outpatient clinics. However, the majority of our hospital-affiliated clinics are located adjacent to our hospital; additionally, we grouped driving distances into quartiles for our analysis. We had initially attempted to differentiate between clinic-initiated and patient-initiated cancellations, but unfortunately, we found that the data were too unreliable to be used for further analysis (outlined in Supplementary Table 3). Lastly, because we studied patients in medical units at a single large, urban, academic center, our results are not generalizable to other settings (eg, community hospitals, hospitals with smaller networks of outpatient providers, or patients being discharged from surgical services or observation units).
CONCLUSION
Given national efforts to enhance postdischarge transitions of care, we aimed to analyze attendance at provider-scheduled PDFV appointments. Our finding that 25% of PDFVs resulted in NS/SDCs raises both questions and opportunities for inpatient and outpatient providers. Further research is needed to understand why so many patients miss their PDFVs, and we should work as a field to develop creative solutions to improve PDFV scheduling and attendance.
Acknowledgments
The authors acknowledge Marie Synnestvedt, PhD, and Manik Chhabra, MD, for their assistance with data gathering and statistical analysis. They also acknowledge Allison DeKosky, MD, Michael Serpa, BS, Michael McFall, and Scott Schlegel, MBA, for their assistance with researching this topic. They did not receive external compensation for their assistance outside of their usual salary support.
DISCLOSURE
Nothing to report.
1. Halasyamani L, Kripalani S, Coleman E, et al. Transition of care for hospitalized elderly patients - development of a discharge checklist for hospitalists. J Hosp Med. 2006;1(6):354-360. PubMed
2. Koehler BE, Richter KM, Youngblood L, et al. Reduction of 30-day postdischarge hospital readmission or emergency department (ED) visit rates in high-risk elderly medical patients through delivery of a targeted care bundle. J Hosp Med. 2009;4(4):211-218. PubMed
3. Soong C, Daub S, Lee JG, et al. Development of a checklist of safe discharge practices for hospital patients. J Hosp Med. 2013;8(8):444-449. PubMed
4. Rice YB, Barnes CA, Rastogi R, Hillstrom TJ, Steinkeler CN. Tackling 30-day, all-cause readmissions with a patient-centered transitional care bundle. Popul Health Manag. 2016;19(1):56-62. PubMed
5. Nelson EA, Maruish MM, Axler JL. Effects of discharge planning and compliance with outpatient appointments on readmission rates. Psych Serv. 2000;51(7):885-889. PubMed
6. Gavish R, Levy A, Dekel OK, Karp E, Maimon N. The association between hospital readmission and pulmonologist follow-up visits in patients with chronic obstructive pulmonary disease. Chest. 2015;148(2):375-381. PubMed
7. Jackson C, Shahsahebi M, Wedlake T, DuBard CA. Timeliness of outpatient follow-up: an evidence-based approach for planning after hospital discharge. Ann Fam Med. 2015;13(2):115-122. PubMed
8. Donaho EK, Hall AC, Gass JA, et al. Protocol-driven allied health post-discharge transition clinic to reduce hospital readmissions in heart failure. J Am Heart Assoc. 2015;4(12):e002296. PubMed
9. Misky GJ, Wald HL, Coleman EA. Post-hospitalization transitions: Examining the effects of timing of primary care provider follow-up. J Hosp Med. 2010;5(7):392-397. PubMed
10. Grafft CA, McDonald FS, Ruud KL, Liesinger JT, Johnson MG, Naessens JM. Effect of hospital follow-up appointment on clinical event outcomes and mortality. Arch Intern Med. 2010;171(11):955-960. PubMed
11. Auerbach AD, Kripalani S, Vasilevskis EE, et al. Preventability and causes of readmissions in a national cohort of general medicine patients. JAMA Intern Med. 2016;176(4):484-493. PubMed
12. Field TS, Ogarek J, Garber L, Reed G, Gurwitz JH. Association of early post-discharge follow-up by a primary care physician and 30-day rehospitalization among older adults. J Gen Intern Med. 2015;30(5):565-571. PubMed
13. Quinn K. It’s no-show time! Med Group Manage Assoc Connexion. 2007;7(6):44-49. PubMed
14. Whittle J, Schectman G, Lu N, Baar B, Mayo-Smith MF. Relationship of scheduling interval to missed and cancelled clinic appointments. J Ambulatory Care Manage. 2008;31(4):290-302. PubMed
15. Kaplan-Lewis E, Percac-Lima S. No-show to primary care appointments: Why patients do not come. J Prim Care Community Health. 2013;4(4):251-255. PubMed
16. Molfenter T. Reducing appointment no-shows: Going from theory to practice. Subst Use Misuse. 2013;48(9):743-749. PubMed
17. Kheirkhah P, Feng Q, Travis LM, Tavakoli-Tabasi S, Sharafkhaneh A. Prevalence, predictors and economic consequences of no-shows. BMC Health Serv Res. 2016;16(1):13. PubMed
18. Colubi MM, Perez-Elias MJ, Elias L, et al. Missing scheduled visits in the outpatient clinic as a marker of short-term admissions and death. HIV Clin Trials. 2012;13(5):289-295. PubMed
19. Obialo CI, Hunt WC, Bashir K, Zager PG. Relationship of missed and shortened hemodialysis treatments to hospitalization and mortality: Observations from a US dialysis network. Clin Kidney J. 2012;5(4):315-319. PubMed
20. Hwang AS, Atlas SJ, Cronin P, et al. Appointment “no-shows” are an independent predictor of subsequent quality of care and resource utilization outcomes. J Gen Intern Med. 2015;30(10):1426-1433. PubMed
21. Perez FD, Xie J, Sin A, et al. Characteristics and direct costs of academic pediatric subspecialty outpatient no-show events. J Healthc Qual. 2014;36(4):32-42. PubMed
22. Huang Y, Zuniga P. Effective cancellation policy to reduce the negative impact of patient no-show. Journal of the Operational Research Society. 2013;65(5):605-615.
23. Percac-Lima S, Cronin PR, Ryan DP, Chabner BA, Daly EA, Kimball AB. Patient navigation based on predictive modeling decreases no-show rates in cancer care. Cancer. 2015;121(10):1662-1670. PubMed
24. Torres O, Rothberg MB, Garb J, Ogunneye O, Onyema J, Higgins T. Risk factor model to predict a missed clinic appointment in an urban, academic, and underserved setting. Popul Health Manag. 2015;18(2):131-136. PubMed
25. Eid WE, Shehata SF, Cole DA, Doerman KL. Predictors of nonattendance at an endocrinology outpatient clinic. Endocr Pract. 2016;22(8):983-989. PubMed
26. Kashiwagi DT, Burton MC, Kirkland LL, Cha S, Varkey P. Do timely outpatient follow-up visits decrease hospital readmission rates? Am J Med Qual. 2012;27(1):11-15. PubMed
27. Miller AJ, Chae E, Peterson E, Ko AB. Predictors of repeated “no-showing” to clinic appointments. Am J Otolaryngol. 2015;36(3):411-414. PubMed
28. ASCO. Billing challenges for residents of Skilled Nursing Facilities. J Oncol Pract. 2008;4(5):245-248. PubMed
29. Centers for Medicare & Medicaid Services (2013). “SE0433: Skilled Nursing Facility consolidated billing as it relates to ambulance services.” Medicare Learning Network Matters. https://www.cms.gov/Outreach-and-Education/Medicare-Learning-Network-MLN/MLNMattersArticles/downloads/se0433.pdf. Accessed on February 14, 2017.
30. Luckett R, Pena N, Vitonis A, Bernstein MR, Feldman S. Effect of patient navigator program on no-show rates at an academic referral colposcopy clinic. J Womens Health (Larchmt). 2015;24(7):608-615. PubMed
31. Jones CD, Vu MB, O’Donnell CM, et al. A failure to communicate: A qualitative exploration of care coordination between hospitalists and primary care providers around patient hospitalizations. J Gen Intern Med. 2015;30(4):417-424. PubMed
32. George A, Rubin G. Non-attendance in general practice: a systematic review and its implications for access to primary health care. Fam Pract. 2003;20(2):178-184. 2016;31(12):1460-1466.J Gen Intern Med. PubMed
48. Shah SJ, Cronin P, Hong CS, et al. Targeted reminder phone calls to patients at high risk of no-show for primary care appointment: A randomized trial. 2010;123(6):542-548.Am J Med. PubMed
47. Parikh A, Gupta K, Wilson AC, Fields K, Cosgrove NM, Kostis JB. The effectiveness of outpatient appointment reminder systems in reducing no-show rates. 2009;20:142-144.Int J STD AIDS. PubMed
46. Price H, Waters AM, Mighty D, et al. Texting appointment reminders reduces ‘Did not attend’ rates, is popular with patients and is cost-effective. 2009;25(3):166-170.J Med Practice Management. PubMed
45. Hills LS. How to handle patients who miss appointments or show up late.
2009;39(3):271-287.Interfaces. PubMed
44. Kros J, Dellana S, West D. Overbooking Increases Patient Access at East Carolina University’s Student Health Services Clinic. 2012;344(3):211-219.Am J Med Sci.
43. Stubbs ND, Geraci SA, Stephenson PL, Jones DB, Sanders S. Methods to reduce outpatient non-attendance. PubMed
42. Haftka A, Cerasale MT, Paje D. Direct patient participation in discharge follow-up appointment scheduling. Paper presented at: Society of Hospital Medicine, Annual Meeting 2015; National Harbor, MD. 2012;5(1):27-32.Patient.
41. Chang R, Spahlinger D, Kim CS. Re-engineering the post-discharge appointment process for general medicine patients. PubMed
40. Coffey C, Kufta J. Patient-centered post-discharge appointment scheduling improves readmission rates. Paper presented at: Society of Hospital Medicine, Annual Meeting 2011; Grapevine, Texas. 2006;81(1):76-81.Acad Med.
39. Vidyarthi AR, Katz PP, Wall SD, Wachter RM, Auerbach AD. Impact of reduced duty hours on residents’ education satistfaction at the University of California, San Francisco.
2013;173(18):1715-1722.JAMA Intern Med. PubMed
38. Horwitz LI, Moriarty JP, Chen C, et al. Quality of discharge practices and patient understanding at an academic medical center. 2010;16(4):246-259.Health Informatics J. PubMed
37. Daggy J, Lawley M, Willis D, et al. Using no-show modeling to improve clinic performance. 2005;5:51.BMC Health Serv Res. PubMed
36. Lee VJ, Earnest A, Chen MI, Krishnan B. Predictors of failed attendances in a multi-specialty outpatient centre using electronic databases. 2013;3(9):e003212.BMJ Open. PubMed
35. Long T, Genao I, Horwitz LI. Reasons for readmission in an underserved high-risk population: A qualitative analysis of a series of inpatient interviews. 2013;32(7):1196-1203.Health Aff (Millwood). PubMed
34. Kangovi S, Barg FK, Carter T, Long JA, Shannon R, Grande D. Understanding why patients of low socioeconomic status prefer hospitals over ambulatory care. 2015;54(10):976-982.Clin Pediatr (Phila). PubMed
33. Samuels RC, Ward VL, Melvin P, et al. Missed Appointments: Factors Contributing to High No-Show Rates in an Urban Pediatrics Primary Care Clinic. PubMed
662-7919; E-mail: [email protected]
Excess Readmission vs Excess Penalties: Maximum Readmission Penalties as a Function of Socioeconomics and Geography
INTRODUCTION
According to Centers for Medicare & Medicaid Services (CMS), approximately 1 in 5 patients discharged from a hospital will be readmitted within 30 days.1 The Hospital Readmission Reduction Program (HRRP) is designed to reduce readmission by withholding up to 3% of all Medicare reimbursement from hospitals with “excess” readmissions; however, absent from the HRRP is adjustment for socioeconomic status (SES), which CMS holds may undermine incentives to reduce health disparities and institutionalize lower standards for hospitals serving disadvantaged populations.2
Lack of SES adjustment has been criticized by those who point to evidence highlighting postdischarge environment and patient SES as drivers of readmission and suggest hospitals that serve low SES individuals will bear a disproportionate share of penalties.3-6 Single-center,3,7,8 regional,9,10 and nationwide6,11 studies highlight census tract level socioeconomic variables as predictive of readmission. Single-center studies, robust in controlling for confounders, including staffing, training, electronic medical record utilization, and transitional care processes, do not allow comparisons between hospitals, limiting utility in HRRP evaluation. Multicenter cohorts, on the other hand, allow for comparisons between high and low penalty hospitals, pioneered by Joynt et al12 after the first round of HRRP penalties; yet this technique may not account for confounding caused by extensive demographic, socioeconomic, and hospital characteristic heterogeneity inherent in a national cohort. Analysis of the 2015 HRRP penalty data by Sjoding et al.6 revealed higher chronic obstructive pulmonary disease (COPD) readmission rates in the Mid-Atlantic, Midwest, and South relative to other regions; however, the magnitude of small-area variation and its relationship to population SES have yet to be characterized.
Therefore, we conducted a matched case-control design, whereby each maximum penalty hospital was matched to a nonpenalty hospital using key hospital characteristics. We then used geographic matching to isolate SES factors predictive of readmission within specific geographies in an effort to control for regional population differences. We hypothesized that, among both matched and localized hospital pairs, the disparities in population SES are the most significant predictors of a maximum penalty. Now in the 3rd year of the HRRP with approximately 75% of eligible hospitals to receive penalties worth an estimated $428 million in the 2015 fiscal year,13 we offer a small-area analysis of bipolar extremes to inform debate surrounding the HRRP with evidence regarding the causes and implications of readmission penalties.
METHODS
Study Design and Sample
This study relies on a case-control design. The cases were defined as US hospitals to receive the maximum 3% HRRP penalty in fiscal year 2015. Controls were drawn from the cohort of hospitals potentially subject to HRRP penalties that received no readmission penalty in the 2015 fiscal year with at least 1 admission for any of the following conditions: heart failure (HF), acute myocardial infarction (AMI), pneumonia (PN), total knee arthroscopy or total hip arthroscopy (THA/TKA), or chronic obstructive pulmonary disease (COPD).
Data Sources
Penalty data were drawn from the 2015 master penalty file,14 which were accessed via CMS.gov. County-level demographic and socioeconomic data were gathered from the 2015 American Community Survey (ACS), a subsidiary of the US Census. Data on hospital characteristics, capacity, and regional healthcare utilization were drawn from 2012 Dartmouth Atlas,15 2012 Medicare Cost Report,16 2012 American Hospital Association Hospital Statistics Database, and 2014 Hospital Care Downloadable Database.
Hospital-level CMS data were linked to the master 2015 penalty file. Dartmouth Atlas data were subsequently linked to the file using the Dartmouth Atlas “Hospital to HSA/HRR Crosswalk” file (accessed via DartmouthAtlas.org.) Each hospital was assigned the profile of the hospital service area (HSA) and hospital referral region (HRR) in which it is located. An HSA is a geographic region defined by hospital admissions; the majority, but not entirety, of residents of a given HSA utilize the corresponding hospital. Similarly, an HRR is a geographic region defined by referrals for major cardiovascular and neurosurgery procedures. County-level socioeconomic data were linked to the dataset by county name; thus, hospital socioeconomic profiles are based on the county in which they are located.
Case-Control Matching
In the primary analysis, coarsened exact matching (CEM) matched controls to cases by potential confounding hospital characteristics, including the following: ownership, number of beds, case mix index (measure of acuity), ambulatory care visit rates within 14 days of discharge, and total number of penalty-eligible cases, including HF, AMI, COPD, PN, and THA/TKA.
In the secondary analysis, hospitals were geocoded by zip code. Geographic Information Systems mapping software (ESRI ArcGIS, Redlands, CA) relied upon Euclidean allocation distance spatial analysis17,18 to match each maximum-penalty hospital to the nearest nonpenalty hospital. Each case was matched to a distinct control; duplicate controls were replaced with the nearest unmatched no-penalty hospital.
Statistical Analysis
Univariate analyses utilized unpaired Student t tests (primary analysis) and paired Student t tests (secondary analysis). The CEM algorithm matches by strata rather than pairs, precluding paired Student t tests in the primary analysis. Statistical analyses were conducted using STATA (StataCorp. 2013. Stata Statistical Software: Release 13. College Station, TX).
RESULTS
Maximum Penalty and Nonpenalty Hospital Matching
Of 3383 hospitals eligible for the HRRP, 39 received the maximum penalty and 770 received no penalty. Thirty-eight control hospitals were identified using CEM algorithm; 1 maximum-penalty hospital could not be matched and was excluded from primary analy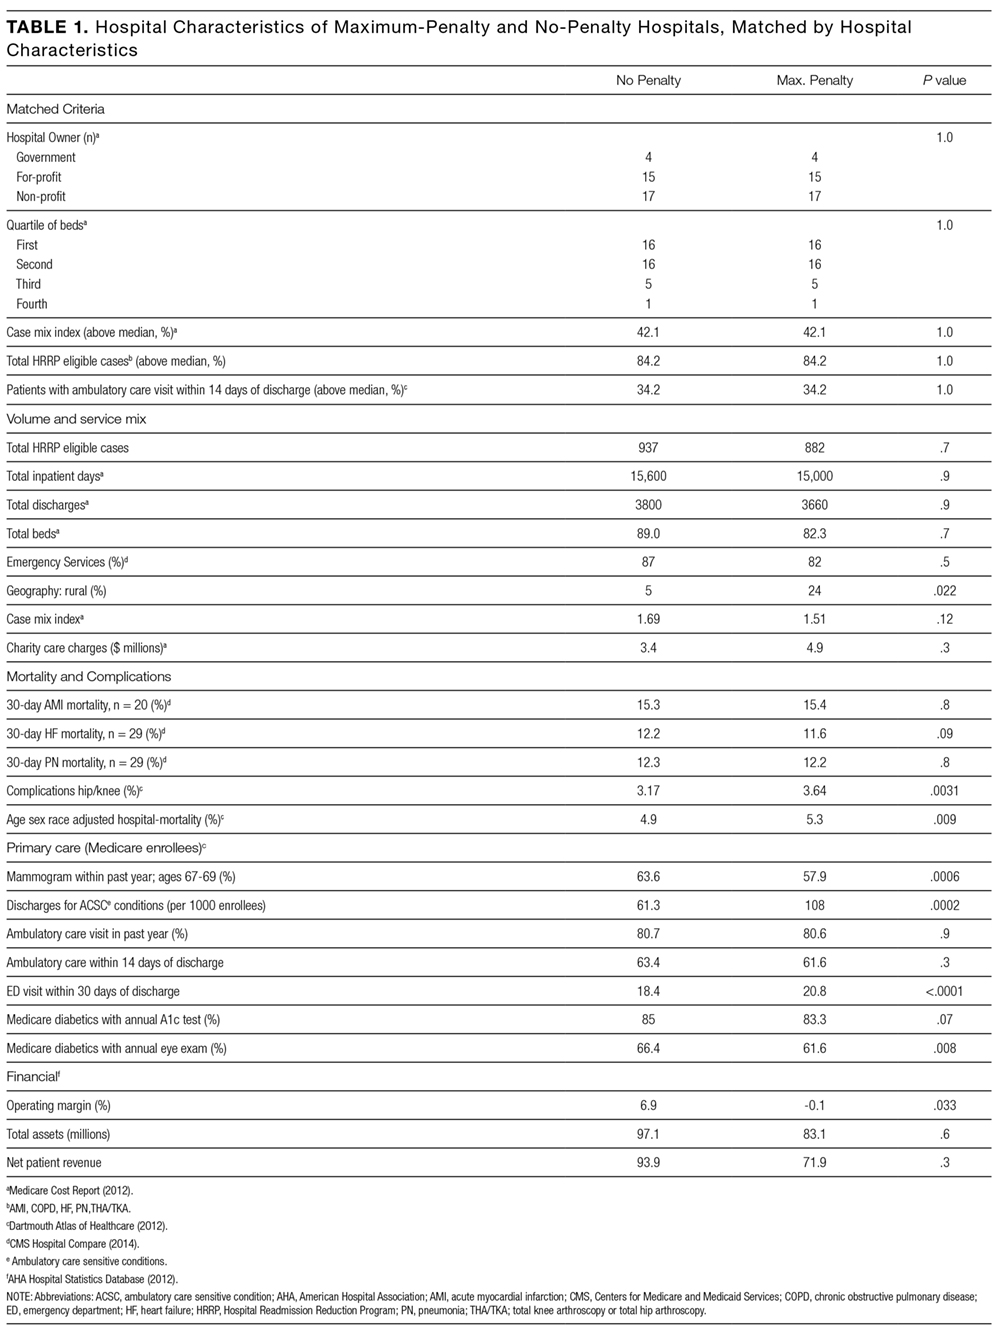
Hospital Characteristics
Case and control profiles are presented in Table 1. Cases and controls were matched by characteristics which may impact readmission rates (Table 1). CEM yielded cohorts similar across a spectrum of metrics, and identical in terms of matching criteria including ownership, beds (quartile), case mix index (above median), ambulatory care visit within 14 days of discharge (above median), and total number of penalty-eligible cases (above median). Relative to no-penalty hospitals, maximum-penalty hospitals were more likely rural (n = 9 vs n = 2, P = 0.022) and have a less profitable operating margin (0.1% vs 6.9%), and location within HSAs with higher age, sex, and race adjusted hospital-wide mortality rate (5.3% vs 4.9%, P = 0.009) and higher rates of discharge for ambulatory care sensitive conditions (108 vs 63 discharges per 1000 Medicare enrollees).
Demographic and Socioeconomic Characteristics
As presented in Table 2, cases a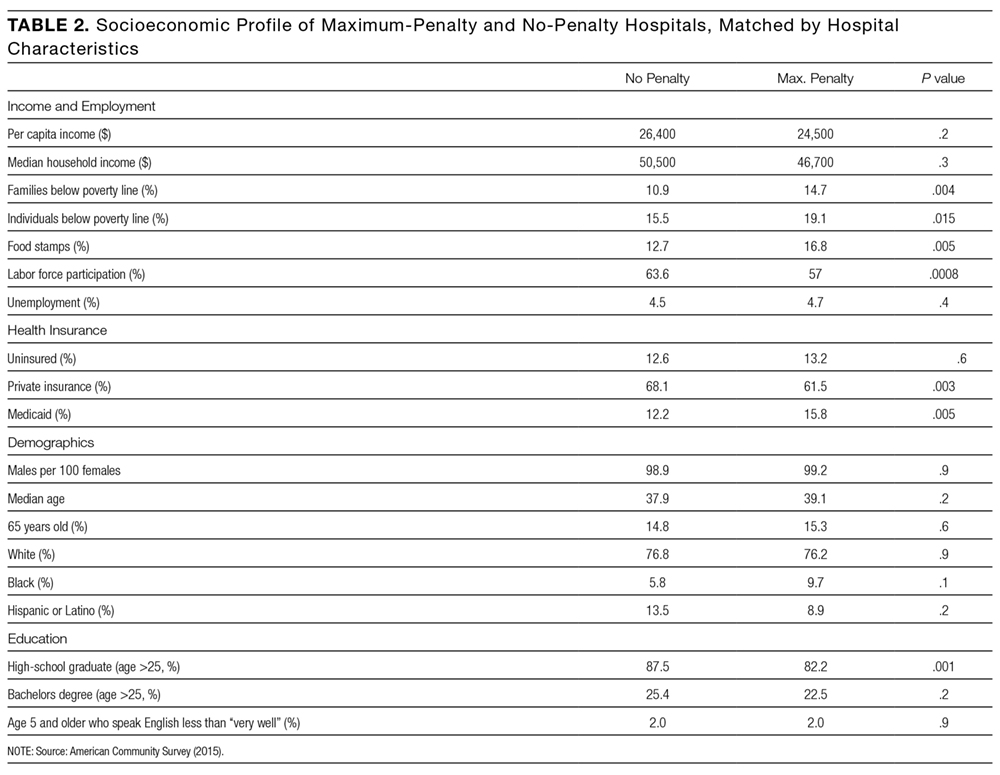
Secondary Analysis: Geographical Matching
Secondary analysis matched each maximum-penalty hospital to the nearest no-penalty hospital using a global information system vector analysis algorithm. As shown in the Figure, median distance between the case and the control was 42.5 miles (interquartile range: 25th percentile, 15.4 miles; 75th percentile, 98.4 miles). Seventeen pairs (44%) were in the same HRR, 6 of which were in the same HSA. Seven pairs (18%) were within the same county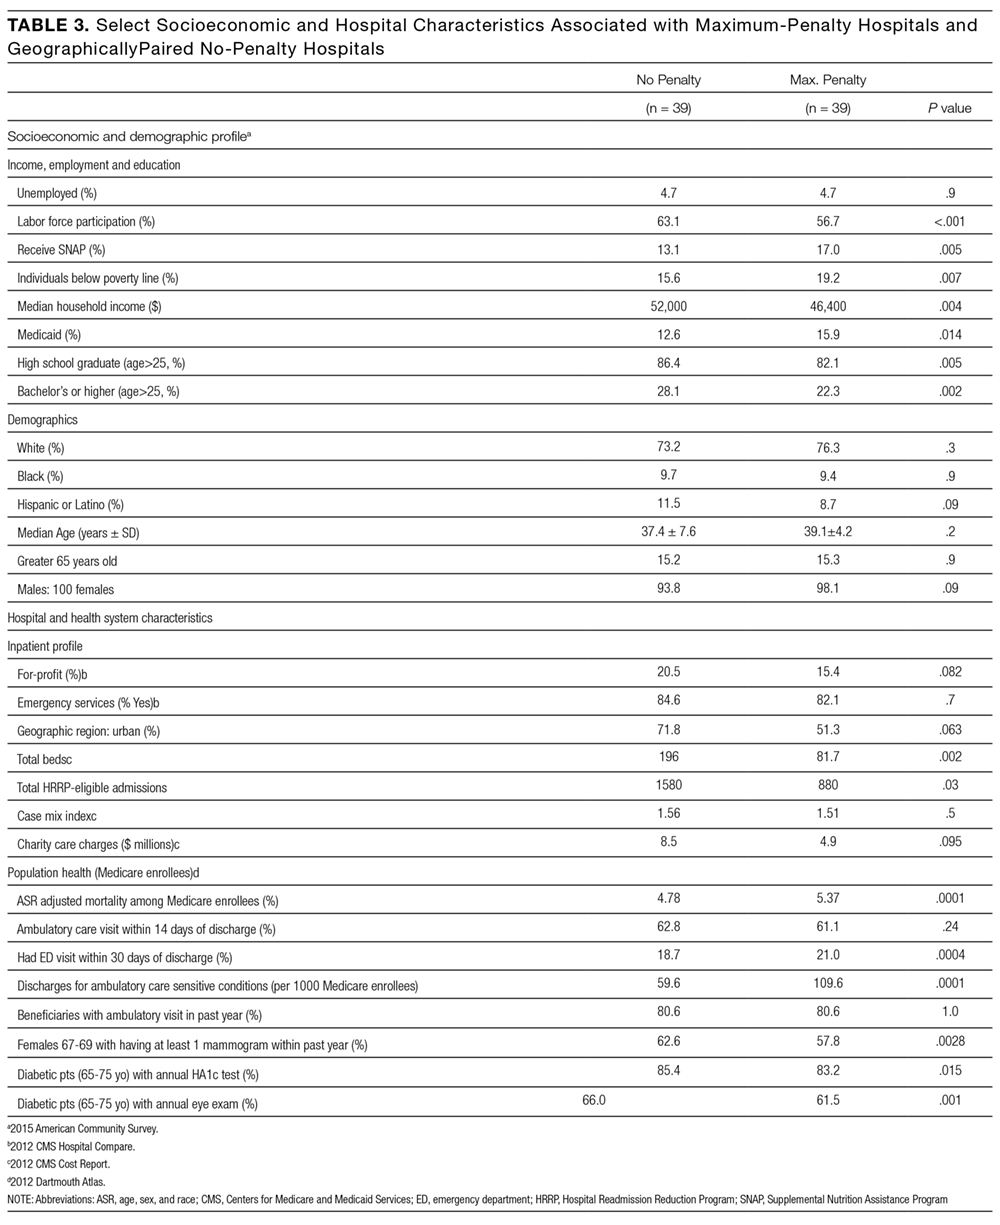
Secondary Analysis: Economic and Demographic Profiles of Geographically Matched Pairs
Demographic and socioeconomic profiles are presented in Table 3. The cases and controls are in counties with similar age, sex, and ethnicity distributions. Relative to no-penalty hospitals, maximum-penalty hospitals are in counties with lower socioeconomic profiles, including increased rates of poverty (15.6% vs 19.2%, P = 0.007) and lower rates of high school (86.4% vs 82.1%, P = 0.005) or college graduation (22.3% vs 28.1%, P = 0.002). Seven pairs were in the same county; a sensitivity analysis excluding these hospitals revealed similarly lower SES profile in cases relative to controls (Supplementary Table 1).
DISCUSSION
Our analysis reveals that county-level socioeconomic profiles are predictors of maximum HRRP penalties. Specifically, after matching cases and controls on 5 hospital characteristics that may influence readmission, maximum-penalty hospitals were more likely to be in rural counties with higher rates of poverty and lower rates of education relative to no-penalty hospitals. We observed no difference between cases and controls with respect to age, sex, or ethnicity.
Our study complement
Maximum Penalties as a Function of Population Health
The Dartmouth Atlas of Healthcare measures health outcomes, which are regionally aggregated among local hospitals by either HSA or HRR; see Methods. Such small-area aggregation does not precisely reflect outcomes from a specific hospital, but rather it describes the health status of localities. Disparities in health outcomes exist between maximum-penalty and no-penalty HSAs. Complication rates were slightly higher in maximum penalty HSAs, consistent with studies highlighting complications as drivers of surgical readmissions.22,23 Moreover, hospital-wide mortality rates were higher in maximum-penalty areas relative to nonpenalty HSAs (5.3 vs 4.9, P = 0.009).
Using national data, Krumholz et al. found no correlation between rates of readmission and mortality for HF, AMI, and PN24, which is a phenomenon acknowledged by the Medicare Payment Advisory Commission (MedPac) in a 2013 report titled, “Refining the hospital readmission reduction program.”25 In large national studies, others have shown low SES to be associated with elevated readmission but not mortality.10,11 In contrast, we restricted our analysis to matched cohorts and are, to our knowledge, the first to present evidence of an association between readmission and hospital-wide mortality adjusted for age, sex, and ethnicity.
Our results suggest maximum readmission penalties are a function of population health and public health capacity. The rates of ambulatory care sensitive condition (ACSC) discharges were substantially higher in HSAs of maximum penalty hospitals relative to nonpenalty hospitals (108 vs 63 per 1000 Medicare enrollees, P < 0.001). ACSC discharges have been used to measure primary care quality for 30 years, with the assumption being that admission for chronic conditions, such as HF, can be prevented with effective primary care.26,27 Moreover, patients discharged from maximum-penalty hospitals were more likely to have an emergency room visit within 30 days of discharge (20.8% vs 18.4%, P < 0.001). Higher rates of ACSCs and postdischarge emergency department visits suggest outpatient resources in maximum-penalty service areas struggle to manage the disease burden of high-risk populations. Geography may be a contributor; maximum-penalty hospitals were more likely to be rural than no-penalty hospitals (24% vs 5%, P = 0.022).
Our findings suggest hospitals providing care to vulnerable communities (defined by low income, low education, and high rates of ambulatory sensitive discharges) are disproportionately penalized. McHugh et al. revealed high nurse staffing levels to be protective against readmission penalties28, yet high penalties to low-margin hospitals may encourage reduced rather than increased staff. It may be better policy to direct resources rather than penalties to underserved communities; our findings echo others with concern about disproportionate penalties to hospitals serving low SES patients.2,5,6,29
Secondary Analysis: Geographic Matching
Geographic matching paired each maximum-penalty hospital to the nearest no-penalty hospital in an attempt to control for unmeasured regional factors that may confound an association between socioeconomic profile and health outcomes. For example, cost of living 30, 31 and obesity 32,33 vary regionally. Our study was unequipped to assess potential regional confounders; we attempted to control for them with geographical matching.
Median distance between maximum-penalty and no-penalty hospitals was 42.5 miles. Seven pairs were located within the same county, thus both case and control were assigned the same socioeconomic profile. Despite close proximity and identical SES profile in 7 of 39 pairs, maximum-penalty hospitals were in counties with lower income and lower rates of education, strengthening the association between SES and maximum readmission penalties.
Implications and Future Directions
In response to criticism surrounding the HRRP, the National Quality Forum endorsed the general concept of SES adjustment for hospital quality measures.34 Subsequently, in a briefing dated March 24, 2015, MedPAC, a government agency which provides Medicare policy analysis to Congress, proposed an SES adjustment methodology of “dividing hospitals into peer groups based on their overall share of low-income Medicare patients, and then setting a benchmark readmissions target for each peer group”;35 in other words, lower standards for hospitals that serve low-income populations. MedPAC’s proposal will reduce penalties to “safety net” institutions, which is progress but not a solution. Although the HRRP appears to be working, according to the US Department of Health and Human Services, readmissions fell by 150,000 between January 2012 and February 2013,36 we are concerned neither the HRRP nor the MedPac revision proposal considers geographic and environmental components of readmission. The HRRP promotes national improvement in exchange for regional regression.
Fair quality measures are key to value-based reimbursement models; yet, implicit in penalties for excess readmissions is the assumed ability to calculate hospital performance targets. Benchmarks for safety, timely care, and patient satisfaction can be uniform; rates of central line infections should not be influenced by patient mix. However, 9 of the 39 maximum-penalty hospitals under the HRRP are in rural Kentucky; one could hypothesize many reasons why rural Kentucky is a hotbed for excess readmission, including the regional production of tobacco and bourbon.
The fundamental question raised by our study is whether poor performance on quality measures is a function of underperforming hospitals or a manifestation of underserved communities. Moving forward, we encourage data systems and study designs that focus research on geospatial distribution of population health within the context of social and behavioral health determinants.37 Small-area studies of factors that drive health outcomes will inform rational alignment of healthcare policies and resources (including penalties and incentives) with underlying population needs.
Strengths and Weaknesses
Matching is a strength of the study. Primary analysis matched case and controls by hospital characteristics, generating cohorts similar across a spectrum of hospital metrics. Therefore, variation in readmission rates was less likely confounded by hospital characteristics. The secondary analysis was matched by geography in an effort to adjust for unmeasured, regional factors, including obesity and cost of living that may confound an association between SES and health outcomes. Geographic matching adds strength to our assertion that SES drives distinction between maximum-penalty hospitals and nonpenalty hospitals.
One weakness was the regional unit of analysis for socioeconomic and Dartmouth Atlas data, which is not a precise profile of the corresponding hospital. Each hospital was assigned a county-level socioeconomic profile. A more robust methodology would analyze patient-level SES data; this was impractical given a cohort of 78 hospitals. Regional health outcomes data limits analysis of readmission penalties as a function of hospital quality. Instead, regional data facilitated associations between readmission and population health, consistent with the aim of our study.
We analyzed 116 of 3668 hospitals eligible for the HRRP (3.2%), limiting the generalizability of our findings. Eighty-four percent of hospitals in the primary analysis have below the median number of beds, and none of them are teaching hospitals. Our analysis, restricted to maximum-penalty and no-penalty cohorts, does not address potential association between submaximal readmission penalties and socioeconomics.
Both matching techniques potentially controlled for similar SES factors and skewed our results towards null, especially in terms of race and ethnicity. Geographic matching generated 7 pairs (18%) within in the same county; both maximum-penalty and no-penalty hospitals were assigned the same socioeconomic profile, as well as 6 pairs (15%) within the same HSA, and both cases and controls had identical Dartmouth Atlas health outcomes profiles. We retained these pairs in our analysis to avoid artificially inflating SES and population health differences between cohorts.
Thirty-nine hospitals received a maximum penalty in the 3rd year of the HRRP. Relative to geographically matched no-penalty hospitals, maximum-penalty hospitals were more likely to be rural and located in counties with less educational attainment, more poverty and more poorly controlled chronic disease. In contrast to nationwide studies, a matched analysis plan revealed no difference between the cohorts in terms of race and ethnicity and provided evidence that maximum penalty hospitals had higher rates of age-, sex-, and race-adjusted hospital-wide mortality.
Our results highlight potential consequences of nationally derived benchmarks for phenomena underpinned by social, behavioral, and environmental factors and raise the question of whether maximum HRRP penalties are a consequence of underperforming hospitals or a manifestation of underserved communities. We are encouraged by MedPAC’s proposal to stratify HRRP by SES, yet recommend further small-area geographic analyses to better align quality measures, penalties, and incentives with resources and needs of distinct populations.
Acknowledgments
The authors thank William Hisey, who laid the foundation for the analysis and without whom the project would not have been possible.
DISCLOSURE
The authors certify that none of the material in this manuscript has been previously published and that none of this material is currently under consideration for publication elsewhere. This project received no funding. None of the authors on this manuscript have any commercial relationships to disclose in relation to this manuscript. All authors have reviewed and approved this manuscript and have contributed significantly to the design, conduct, and/or analysis of the research. No authors have any financial interests to disclose. No authors have any potential conflicts of interest to disclose. No authors have financial or personal relationships with any of the subject material presented in the manuscript.
1. Jencks SF, Williams MV, Coleman EA. Rehospitalizations among patients in the Medicare fee-for-service program. N Engl J Med. 2009;360(14):1418-1428. PubMed
30. Bethell C, Simpson L, Stumbo S, Carle AC, Gombojav N. National, state and local disparities in childhood obesity. Health Aff. 2010; 29(3): 347-356. PubMed
31. Singh GK, Kogan MD, van Dyck PC. Changes in state-specific childhood obesity and overweight prevalence in the United States from 2003 to 2007. Arch Pediatr Adolesc Med. 2010;164(7):598-607. PubMed
32. Aten BH, Figueroa EB, Martin TB. Regional Price Parities for States and Metropolitan Areas, 2006–2010. Survey of Current Business 2012;92:229-242.
33. Dubay L, Wheaton L, Zedlewski S. Geographic variation in the cost of living: implications for poverty guidelines and program eligibility. Urban Institute. 2013. https://aspe.hhs.gov/system/files/pdf/174186/UrbanGeographicVariation.pdf. Accessed on February 22, 2017. Last accessed July 10, 2017
34. National Quality Forum. Risk Adjustment for Socioeconomic Status or Other Sociodemographic Factors: a Technical Report. 2014. http://www.qualityforum. org/Publications/2014/08/Risk_Adjustment_for_Socioeconomic_Status_or_Other_Sociodemographic_Factors.aspx. Accessed July 10, 2017.
36. Services CfMaM. New HHS Data Shows Major Strides Made in Patient Safety, Leading to Improved Care and Savings. In: Services USDoHaH, ed. https://innovation.cms.gov/Files/reports/patient-safety-results.pdf. Accessed July 10, 2017.
37. Harrison KM, Dean HD. Use of data systems to address social determinants of health: a need to do more. Public Health Reports (Washington, DC:1974). 2011;126 Suppl 3:1-5. PubMed
INTRODUCTION
According to Centers for Medicare & Medicaid Services (CMS), approximately 1 in 5 patients discharged from a hospital will be readmitted within 30 days.1 The Hospital Readmission Reduction Program (HRRP) is designed to reduce readmission by withholding up to 3% of all Medicare reimbursement from hospitals with “excess” readmissions; however, absent from the HRRP is adjustment for socioeconomic status (SES), which CMS holds may undermine incentives to reduce health disparities and institutionalize lower standards for hospitals serving disadvantaged populations.2
Lack of SES adjustment has been criticized by those who point to evidence highlighting postdischarge environment and patient SES as drivers of readmission and suggest hospitals that serve low SES individuals will bear a disproportionate share of penalties.3-6 Single-center,3,7,8 regional,9,10 and nationwide6,11 studies highlight census tract level socioeconomic variables as predictive of readmission. Single-center studies, robust in controlling for confounders, including staffing, training, electronic medical record utilization, and transitional care processes, do not allow comparisons between hospitals, limiting utility in HRRP evaluation. Multicenter cohorts, on the other hand, allow for comparisons between high and low penalty hospitals, pioneered by Joynt et al12 after the first round of HRRP penalties; yet this technique may not account for confounding caused by extensive demographic, socioeconomic, and hospital characteristic heterogeneity inherent in a national cohort. Analysis of the 2015 HRRP penalty data by Sjoding et al.6 revealed higher chronic obstructive pulmonary disease (COPD) readmission rates in the Mid-Atlantic, Midwest, and South relative to other regions; however, the magnitude of small-area variation and its relationship to population SES have yet to be characterized.
Therefore, we conducted a matched case-control design, whereby each maximum penalty hospital was matched to a nonpenalty hospital using key hospital characteristics. We then used geographic matching to isolate SES factors predictive of readmission within specific geographies in an effort to control for regional population differences. We hypothesized that, among both matched and localized hospital pairs, the disparities in population SES are the most significant predictors of a maximum penalty. Now in the 3rd year of the HRRP with approximately 75% of eligible hospitals to receive penalties worth an estimated $428 million in the 2015 fiscal year,13 we offer a small-area analysis of bipolar extremes to inform debate surrounding the HRRP with evidence regarding the causes and implications of readmission penalties.
METHODS
Study Design and Sample
This study relies on a case-control design. The cases were defined as US hospitals to receive the maximum 3% HRRP penalty in fiscal year 2015. Controls were drawn from the cohort of hospitals potentially subject to HRRP penalties that received no readmission penalty in the 2015 fiscal year with at least 1 admission for any of the following conditions: heart failure (HF), acute myocardial infarction (AMI), pneumonia (PN), total knee arthroscopy or total hip arthroscopy (THA/TKA), or chronic obstructive pulmonary disease (COPD).
Data Sources
Penalty data were drawn from the 2015 master penalty file,14 which were accessed via CMS.gov. County-level demographic and socioeconomic data were gathered from the 2015 American Community Survey (ACS), a subsidiary of the US Census. Data on hospital characteristics, capacity, and regional healthcare utilization were drawn from 2012 Dartmouth Atlas,15 2012 Medicare Cost Report,16 2012 American Hospital Association Hospital Statistics Database, and 2014 Hospital Care Downloadable Database.
Hospital-level CMS data were linked to the master 2015 penalty file. Dartmouth Atlas data were subsequently linked to the file using the Dartmouth Atlas “Hospital to HSA/HRR Crosswalk” file (accessed via DartmouthAtlas.org.) Each hospital was assigned the profile of the hospital service area (HSA) and hospital referral region (HRR) in which it is located. An HSA is a geographic region defined by hospital admissions; the majority, but not entirety, of residents of a given HSA utilize the corresponding hospital. Similarly, an HRR is a geographic region defined by referrals for major cardiovascular and neurosurgery procedures. County-level socioeconomic data were linked to the dataset by county name; thus, hospital socioeconomic profiles are based on the county in which they are located.
Case-Control Matching
In the primary analysis, coarsened exact matching (CEM) matched controls to cases by potential confounding hospital characteristics, including the following: ownership, number of beds, case mix index (measure of acuity), ambulatory care visit rates within 14 days of discharge, and total number of penalty-eligible cases, including HF, AMI, COPD, PN, and THA/TKA.
In the secondary analysis, hospitals were geocoded by zip code. Geographic Information Systems mapping software (ESRI ArcGIS, Redlands, CA) relied upon Euclidean allocation distance spatial analysis17,18 to match each maximum-penalty hospital to the nearest nonpenalty hospital. Each case was matched to a distinct control; duplicate controls were replaced with the nearest unmatched no-penalty hospital.
Statistical Analysis
Univariate analyses utilized unpaired Student t tests (primary analysis) and paired Student t tests (secondary analysis). The CEM algorithm matches by strata rather than pairs, precluding paired Student t tests in the primary analysis. Statistical analyses were conducted using STATA (StataCorp. 2013. Stata Statistical Software: Release 13. College Station, TX).
RESULTS
Maximum Penalty and Nonpenalty Hospital Matching
Of 3383 hospitals eligible for the HRRP, 39 received the maximum penalty and 770 received no penalty. Thirty-eight control hospitals were identified using CEM algorithm; 1 maximum-penalty hospital could not be matched and was excluded from primary analy
Hospital Characteristics
Case and control profiles are presented in Table 1. Cases and controls were matched by characteristics which may impact readmission rates (Table 1). CEM yielded cohorts similar across a spectrum of metrics, and identical in terms of matching criteria including ownership, beds (quartile), case mix index (above median), ambulatory care visit within 14 days of discharge (above median), and total number of penalty-eligible cases (above median). Relative to no-penalty hospitals, maximum-penalty hospitals were more likely rural (n = 9 vs n = 2, P = 0.022) and have a less profitable operating margin (0.1% vs 6.9%), and location within HSAs with higher age, sex, and race adjusted hospital-wide mortality rate (5.3% vs 4.9%, P = 0.009) and higher rates of discharge for ambulatory care sensitive conditions (108 vs 63 discharges per 1000 Medicare enrollees).
Demographic and Socioeconomic Characteristics
As presented in Table 2, cases a
Secondary Analysis: Geographical Matching
Secondary analysis matched each maximum-penalty hospital to the nearest no-penalty hospital using a global information system vector analysis algorithm. As shown in the Figure, median distance between the case and the control was 42.5 miles (interquartile range: 25th percentile, 15.4 miles; 75th percentile, 98.4 miles). Seventeen pairs (44%) were in the same HRR, 6 of which were in the same HSA. Seven pairs (18%) were within the same county
Secondary Analysis: Economic and Demographic Profiles of Geographically Matched Pairs
Demographic and socioeconomic profiles are presented in Table 3. The cases and controls are in counties with similar age, sex, and ethnicity distributions. Relative to no-penalty hospitals, maximum-penalty hospitals are in counties with lower socioeconomic profiles, including increased rates of poverty (15.6% vs 19.2%, P = 0.007) and lower rates of high school (86.4% vs 82.1%, P = 0.005) or college graduation (22.3% vs 28.1%, P = 0.002). Seven pairs were in the same county; a sensitivity analysis excluding these hospitals revealed similarly lower SES profile in cases relative to controls (Supplementary Table 1).
DISCUSSION
Our analysis reveals that county-level socioeconomic profiles are predictors of maximum HRRP penalties. Specifically, after matching cases and controls on 5 hospital characteristics that may influence readmission, maximum-penalty hospitals were more likely to be in rural counties with higher rates of poverty and lower rates of education relative to no-penalty hospitals. We observed no difference between cases and controls with respect to age, sex, or ethnicity.
Our study complement
Maximum Penalties as a Function of Population Health
The Dartmouth Atlas of Healthcare measures health outcomes, which are regionally aggregated among local hospitals by either HSA or HRR; see Methods. Such small-area aggregation does not precisely reflect outcomes from a specific hospital, but rather it describes the health status of localities. Disparities in health outcomes exist between maximum-penalty and no-penalty HSAs. Complication rates were slightly higher in maximum penalty HSAs, consistent with studies highlighting complications as drivers of surgical readmissions.22,23 Moreover, hospital-wide mortality rates were higher in maximum-penalty areas relative to nonpenalty HSAs (5.3 vs 4.9, P = 0.009).
Using national data, Krumholz et al. found no correlation between rates of readmission and mortality for HF, AMI, and PN24, which is a phenomenon acknowledged by the Medicare Payment Advisory Commission (MedPac) in a 2013 report titled, “Refining the hospital readmission reduction program.”25 In large national studies, others have shown low SES to be associated with elevated readmission but not mortality.10,11 In contrast, we restricted our analysis to matched cohorts and are, to our knowledge, the first to present evidence of an association between readmission and hospital-wide mortality adjusted for age, sex, and ethnicity.
Our results suggest maximum readmission penalties are a function of population health and public health capacity. The rates of ambulatory care sensitive condition (ACSC) discharges were substantially higher in HSAs of maximum penalty hospitals relative to nonpenalty hospitals (108 vs 63 per 1000 Medicare enrollees, P < 0.001). ACSC discharges have been used to measure primary care quality for 30 years, with the assumption being that admission for chronic conditions, such as HF, can be prevented with effective primary care.26,27 Moreover, patients discharged from maximum-penalty hospitals were more likely to have an emergency room visit within 30 days of discharge (20.8% vs 18.4%, P < 0.001). Higher rates of ACSCs and postdischarge emergency department visits suggest outpatient resources in maximum-penalty service areas struggle to manage the disease burden of high-risk populations. Geography may be a contributor; maximum-penalty hospitals were more likely to be rural than no-penalty hospitals (24% vs 5%, P = 0.022).
Our findings suggest hospitals providing care to vulnerable communities (defined by low income, low education, and high rates of ambulatory sensitive discharges) are disproportionately penalized. McHugh et al. revealed high nurse staffing levels to be protective against readmission penalties28, yet high penalties to low-margin hospitals may encourage reduced rather than increased staff. It may be better policy to direct resources rather than penalties to underserved communities; our findings echo others with concern about disproportionate penalties to hospitals serving low SES patients.2,5,6,29
Secondary Analysis: Geographic Matching
Geographic matching paired each maximum-penalty hospital to the nearest no-penalty hospital in an attempt to control for unmeasured regional factors that may confound an association between socioeconomic profile and health outcomes. For example, cost of living 30, 31 and obesity 32,33 vary regionally. Our study was unequipped to assess potential regional confounders; we attempted to control for them with geographical matching.
Median distance between maximum-penalty and no-penalty hospitals was 42.5 miles. Seven pairs were located within the same county, thus both case and control were assigned the same socioeconomic profile. Despite close proximity and identical SES profile in 7 of 39 pairs, maximum-penalty hospitals were in counties with lower income and lower rates of education, strengthening the association between SES and maximum readmission penalties.
Implications and Future Directions
In response to criticism surrounding the HRRP, the National Quality Forum endorsed the general concept of SES adjustment for hospital quality measures.34 Subsequently, in a briefing dated March 24, 2015, MedPAC, a government agency which provides Medicare policy analysis to Congress, proposed an SES adjustment methodology of “dividing hospitals into peer groups based on their overall share of low-income Medicare patients, and then setting a benchmark readmissions target for each peer group”;35 in other words, lower standards for hospitals that serve low-income populations. MedPAC’s proposal will reduce penalties to “safety net” institutions, which is progress but not a solution. Although the HRRP appears to be working, according to the US Department of Health and Human Services, readmissions fell by 150,000 between January 2012 and February 2013,36 we are concerned neither the HRRP nor the MedPac revision proposal considers geographic and environmental components of readmission. The HRRP promotes national improvement in exchange for regional regression.
Fair quality measures are key to value-based reimbursement models; yet, implicit in penalties for excess readmissions is the assumed ability to calculate hospital performance targets. Benchmarks for safety, timely care, and patient satisfaction can be uniform; rates of central line infections should not be influenced by patient mix. However, 9 of the 39 maximum-penalty hospitals under the HRRP are in rural Kentucky; one could hypothesize many reasons why rural Kentucky is a hotbed for excess readmission, including the regional production of tobacco and bourbon.
The fundamental question raised by our study is whether poor performance on quality measures is a function of underperforming hospitals or a manifestation of underserved communities. Moving forward, we encourage data systems and study designs that focus research on geospatial distribution of population health within the context of social and behavioral health determinants.37 Small-area studies of factors that drive health outcomes will inform rational alignment of healthcare policies and resources (including penalties and incentives) with underlying population needs.
Strengths and Weaknesses
Matching is a strength of the study. Primary analysis matched case and controls by hospital characteristics, generating cohorts similar across a spectrum of hospital metrics. Therefore, variation in readmission rates was less likely confounded by hospital characteristics. The secondary analysis was matched by geography in an effort to adjust for unmeasured, regional factors, including obesity and cost of living that may confound an association between SES and health outcomes. Geographic matching adds strength to our assertion that SES drives distinction between maximum-penalty hospitals and nonpenalty hospitals.
One weakness was the regional unit of analysis for socioeconomic and Dartmouth Atlas data, which is not a precise profile of the corresponding hospital. Each hospital was assigned a county-level socioeconomic profile. A more robust methodology would analyze patient-level SES data; this was impractical given a cohort of 78 hospitals. Regional health outcomes data limits analysis of readmission penalties as a function of hospital quality. Instead, regional data facilitated associations between readmission and population health, consistent with the aim of our study.
We analyzed 116 of 3668 hospitals eligible for the HRRP (3.2%), limiting the generalizability of our findings. Eighty-four percent of hospitals in the primary analysis have below the median number of beds, and none of them are teaching hospitals. Our analysis, restricted to maximum-penalty and no-penalty cohorts, does not address potential association between submaximal readmission penalties and socioeconomics.
Both matching techniques potentially controlled for similar SES factors and skewed our results towards null, especially in terms of race and ethnicity. Geographic matching generated 7 pairs (18%) within in the same county; both maximum-penalty and no-penalty hospitals were assigned the same socioeconomic profile, as well as 6 pairs (15%) within the same HSA, and both cases and controls had identical Dartmouth Atlas health outcomes profiles. We retained these pairs in our analysis to avoid artificially inflating SES and population health differences between cohorts.
Thirty-nine hospitals received a maximum penalty in the 3rd year of the HRRP. Relative to geographically matched no-penalty hospitals, maximum-penalty hospitals were more likely to be rural and located in counties with less educational attainment, more poverty and more poorly controlled chronic disease. In contrast to nationwide studies, a matched analysis plan revealed no difference between the cohorts in terms of race and ethnicity and provided evidence that maximum penalty hospitals had higher rates of age-, sex-, and race-adjusted hospital-wide mortality.
Our results highlight potential consequences of nationally derived benchmarks for phenomena underpinned by social, behavioral, and environmental factors and raise the question of whether maximum HRRP penalties are a consequence of underperforming hospitals or a manifestation of underserved communities. We are encouraged by MedPAC’s proposal to stratify HRRP by SES, yet recommend further small-area geographic analyses to better align quality measures, penalties, and incentives with resources and needs of distinct populations.
Acknowledgments
The authors thank William Hisey, who laid the foundation for the analysis and without whom the project would not have been possible.
DISCLOSURE
The authors certify that none of the material in this manuscript has been previously published and that none of this material is currently under consideration for publication elsewhere. This project received no funding. None of the authors on this manuscript have any commercial relationships to disclose in relation to this manuscript. All authors have reviewed and approved this manuscript and have contributed significantly to the design, conduct, and/or analysis of the research. No authors have any financial interests to disclose. No authors have any potential conflicts of interest to disclose. No authors have financial or personal relationships with any of the subject material presented in the manuscript.
1. Jencks SF, Williams MV, Coleman EA. Rehospitalizations among patients in the Medicare fee-for-service program. N Engl J Med. 2009;360(14):1418-1428. PubMed
30. Bethell C, Simpson L, Stumbo S, Carle AC, Gombojav N. National, state and local disparities in childhood obesity. Health Aff. 2010; 29(3): 347-356. PubMed
31. Singh GK, Kogan MD, van Dyck PC. Changes in state-specific childhood obesity and overweight prevalence in the United States from 2003 to 2007. Arch Pediatr Adolesc Med. 2010;164(7):598-607. PubMed
32. Aten BH, Figueroa EB, Martin TB. Regional Price Parities for States and Metropolitan Areas, 2006–2010. Survey of Current Business 2012;92:229-242.
33. Dubay L, Wheaton L, Zedlewski S. Geographic variation in the cost of living: implications for poverty guidelines and program eligibility. Urban Institute. 2013. https://aspe.hhs.gov/system/files/pdf/174186/UrbanGeographicVariation.pdf. Accessed on February 22, 2017. Last accessed July 10, 2017
34. National Quality Forum. Risk Adjustment for Socioeconomic Status or Other Sociodemographic Factors: a Technical Report. 2014. http://www.qualityforum. org/Publications/2014/08/Risk_Adjustment_for_Socioeconomic_Status_or_Other_Sociodemographic_Factors.aspx. Accessed July 10, 2017.
36. Services CfMaM. New HHS Data Shows Major Strides Made in Patient Safety, Leading to Improved Care and Savings. In: Services USDoHaH, ed. https://innovation.cms.gov/Files/reports/patient-safety-results.pdf. Accessed July 10, 2017.
37. Harrison KM, Dean HD. Use of data systems to address social determinants of health: a need to do more. Public Health Reports (Washington, DC:1974). 2011;126 Suppl 3:1-5. PubMed
Fixed-Dose Combination Pills Enhance Adherence and Persistence to Antihypertensive Medications
Study Overview
Objective. To evaluate long-term adherence to antihypertensive therapy among patients on fixed-dose combination medication as well as antihypertensive monotherapy; and to identify demographic and clinical risk factors associated with selection of and adherence and persistence to antihypertensive medication therapy.
Design. Retrospective cohort study using claims data from a large nationwide insurer.
Setting and participants. The study population included patients older than age 18 who initiated antihypertensive medication between 1 January 2009 and 31 December 2012 and who were continually enrolled at least 180 days before and 365 days after the index date, defined as the date of initiation of antihypertensive therapy. Patients were excluded from the study if they had previously filled any antihypertensive medication at any time prior to the index date. Patients were categorized based on the number and type of antihypertensive medications (fixed-dose combination, defined as a single pill containing multiple medications; multi-pill combination, defined as 2 or more distinct antihypertensive tablets or capsules; or single therapy, defined as only 1 medication) using National Drug Codes (NDC). Study authors also measured patient baseline characteristics, such as age, region, gender, diagnoses as defined by ICD-9 codes, patient utilization characteristics (both outpatient visits and hospitalizations) and characteristics of the initiated medication, including patient copayment and number of days of medication supplied.
Main outcome measures. The primary outcome of inte-rest was persistence, defined as having supply for any antihypertensive medication that overlapped with the 365th day after initiation (index date), whether the initiated medication or other antihypertensive. Additional outcomes included adherence to at least 1 antihypertensive in the 12 months after initiation and refilling at least 1 antihypertensive medication. To determine adherence, the study authors calculated the proportion of days the patient had any antihypertensive available to them (proportion of days covered; PDC). PDC > 80% to at least 1 antihypertensive in the 12 months after initiation was defined as “fully adherent.”
Statistical analysis utilized modified multivariable Poisson regression models and sensitivity analyses were performed. The main study comparisons focused on patients initiating fixed-dose combination therapy and monotherapy because these groups were more comparable in terms of baseline characteristics and medications initiated than the multi-pill combination group.
Main results. The study sample consisted of 484,493 patients who initiated an oral antihypertensive, including 78,958 patient initiating fixed-dose combinations, 380,269 filled a single therapy, and 22,266 who initiated multi-pill combinations. The most frequently initiated fixed-dose combination was lisinopril-hydrochlorothiazide. Lisinopril, hydrochlorothiazide, and amlodipine with the most frequently initiated monotherapy. The mean age of the study population was 47.2 years and 51.8% were women. Patients initiating multiple pill combinations were older (mean age 52.5) and tended to be sicker with more comorbidities than fixed-dose combinations or monotherapy. Patients initiating fixed-dose combination had higher prescription copayments than patients using single medication (prescription copay $14.4 versus $9.6). Patients initiating fixed-dose combinations were 9% more likely to be persistent (relative risk [RR] 1.09, 95% CI 1.08–1.10) and 13% more likely to be adherent (RR 1.13, 95% CI 1.11–1.14) than those who started on a monotherapy. Refill rates were also slightly higher among fixed-dose combination initiators (RR 1.06, 95% CI 1.05-1.07).
Conclusion. Compared with monotherapy, fixed-dose combination therapy appears to improve adherence and persistence to antihypertensive medications.
Commentary
Approximately half of US of individuals with diagnosed hypertension obtain control of their condition based on currently defined targets [1]. The most effective approach to blood pressure management has been controversial. The JNC8 [2] guidelines liberalized blood pressure targets, while recent results from the SPRINT (systolic blood pressure intervention trial) [3] indicates that lower blood pressure targets are able to prevent hypertension-related complications without significant additional risk. Given these conflicts, there is clearly ambiguity in the most effective approach to initiating antihypertensive treatment. Prior studies have shown that fewer than 50% of patients continue to take their medications just 12 months after initiation [4,5].
Fixed-dose combination therapy for blood pressure management has been cited as better for adherence and is now making its way into clinical guidelines [6–8]. However, it should be noted that fixed-dose combination therapy for blood pressure management limits dosing flexibility. Dose titration may be needed, potentially leading to additional prescriptions, thus potentially complicating the drug regimen and adding additional cost. Complicating matters further, quality metrics and reporting requirements for hypertension require primary care providers to achieve blood pressure control while also ensuring patient adherence and concomitantly avoiding side effects related to medication therapy.
This study was conducted using claims data for commercially insured patients or those with Medicare Advan-tage and is unlikely to be representative of the entire population. Additionally, the study authors did not have detailed clinical information about patients, limiting the ability to understand the true clinical implications. Further, patients may have initiated medications for indications other than hypertension. In addition, causality cannot be established given the retrospective observational cohort nature of this study.
Applications for Clinical Practice
Primary care physicians face substantial challenges in the treatment of hypertension, including with respect to selection of initial medication therapy. Results from this study add to the evidence base that fixed-dose combination therapy is more effective in obtaining blood pressure control than monotherapy or multiple-pill therapy. Medication adherence in primary care practice is challenging. Strategies such as fixed-dose combination therapy are reasonable to employ to improve medication adherence; however, costs must be considered.
—Ajay Dharod, MD, Wake Forest School of Medicine, Winston-Salem, NC
1. Gu Q, Burt VL, Dillon CF, Yoon S. Trends in antihypertensive medication use and blood pressure control among United States adults with hypertension. Circulation 2012;126:2105–14.
2. James PA, Oparil S, Carter BL, et al. 2014 Evidence-based guideline for the management of high blood pressure in adults: report from the panel members appointed to the Eighth Joint National Committee (JNC 8). JAMA 2014;311:507–20.
3. Group TSR. A randomized trial of intensive versus standard blood-pressure control. N Engl J Med 2015;373:2103–16.
4. Yeaw J, Benner JS, Walt JG, et al. Comparing adherence and persistence across 6 chronic medication classes. J Manag Care Pharm 2009;15:728–40.
5. Baroletti S, Dell’Orfano H. Medication adherence in cardiovascular disease. Circulation 2010;121:1455–8.
6. Bangalore S, Kamalakkannan G, Parkar S, Messerli FH. Fixed-dose combinations improve medication compliance: a meta-analysis. Am J Med 2007;120:713–9.
7. Gupta AK, Arshad S, Poulter NR. Compliance, safety, and effectiveness of fixed-dose combinations of antihypertensive agents. Hypertension 2010;55:399–407.
8. Pan F, Chernew ME, Fendrick AM. Impact of fixed-dose combination drugs on adherence to prescription medications. J Gen Intern Med 2008;23:611–4.
Study Overview
Objective. To evaluate long-term adherence to antihypertensive therapy among patients on fixed-dose combination medication as well as antihypertensive monotherapy; and to identify demographic and clinical risk factors associated with selection of and adherence and persistence to antihypertensive medication therapy.
Design. Retrospective cohort study using claims data from a large nationwide insurer.
Setting and participants. The study population included patients older than age 18 who initiated antihypertensive medication between 1 January 2009 and 31 December 2012 and who were continually enrolled at least 180 days before and 365 days after the index date, defined as the date of initiation of antihypertensive therapy. Patients were excluded from the study if they had previously filled any antihypertensive medication at any time prior to the index date. Patients were categorized based on the number and type of antihypertensive medications (fixed-dose combination, defined as a single pill containing multiple medications; multi-pill combination, defined as 2 or more distinct antihypertensive tablets or capsules; or single therapy, defined as only 1 medication) using National Drug Codes (NDC). Study authors also measured patient baseline characteristics, such as age, region, gender, diagnoses as defined by ICD-9 codes, patient utilization characteristics (both outpatient visits and hospitalizations) and characteristics of the initiated medication, including patient copayment and number of days of medication supplied.
Main outcome measures. The primary outcome of inte-rest was persistence, defined as having supply for any antihypertensive medication that overlapped with the 365th day after initiation (index date), whether the initiated medication or other antihypertensive. Additional outcomes included adherence to at least 1 antihypertensive in the 12 months after initiation and refilling at least 1 antihypertensive medication. To determine adherence, the study authors calculated the proportion of days the patient had any antihypertensive available to them (proportion of days covered; PDC). PDC > 80% to at least 1 antihypertensive in the 12 months after initiation was defined as “fully adherent.”
Statistical analysis utilized modified multivariable Poisson regression models and sensitivity analyses were performed. The main study comparisons focused on patients initiating fixed-dose combination therapy and monotherapy because these groups were more comparable in terms of baseline characteristics and medications initiated than the multi-pill combination group.
Main results. The study sample consisted of 484,493 patients who initiated an oral antihypertensive, including 78,958 patient initiating fixed-dose combinations, 380,269 filled a single therapy, and 22,266 who initiated multi-pill combinations. The most frequently initiated fixed-dose combination was lisinopril-hydrochlorothiazide. Lisinopril, hydrochlorothiazide, and amlodipine with the most frequently initiated monotherapy. The mean age of the study population was 47.2 years and 51.8% were women. Patients initiating multiple pill combinations were older (mean age 52.5) and tended to be sicker with more comorbidities than fixed-dose combinations or monotherapy. Patients initiating fixed-dose combination had higher prescription copayments than patients using single medication (prescription copay $14.4 versus $9.6). Patients initiating fixed-dose combinations were 9% more likely to be persistent (relative risk [RR] 1.09, 95% CI 1.08–1.10) and 13% more likely to be adherent (RR 1.13, 95% CI 1.11–1.14) than those who started on a monotherapy. Refill rates were also slightly higher among fixed-dose combination initiators (RR 1.06, 95% CI 1.05-1.07).
Conclusion. Compared with monotherapy, fixed-dose combination therapy appears to improve adherence and persistence to antihypertensive medications.
Commentary
Approximately half of US of individuals with diagnosed hypertension obtain control of their condition based on currently defined targets [1]. The most effective approach to blood pressure management has been controversial. The JNC8 [2] guidelines liberalized blood pressure targets, while recent results from the SPRINT (systolic blood pressure intervention trial) [3] indicates that lower blood pressure targets are able to prevent hypertension-related complications without significant additional risk. Given these conflicts, there is clearly ambiguity in the most effective approach to initiating antihypertensive treatment. Prior studies have shown that fewer than 50% of patients continue to take their medications just 12 months after initiation [4,5].
Fixed-dose combination therapy for blood pressure management has been cited as better for adherence and is now making its way into clinical guidelines [6–8]. However, it should be noted that fixed-dose combination therapy for blood pressure management limits dosing flexibility. Dose titration may be needed, potentially leading to additional prescriptions, thus potentially complicating the drug regimen and adding additional cost. Complicating matters further, quality metrics and reporting requirements for hypertension require primary care providers to achieve blood pressure control while also ensuring patient adherence and concomitantly avoiding side effects related to medication therapy.
This study was conducted using claims data for commercially insured patients or those with Medicare Advan-tage and is unlikely to be representative of the entire population. Additionally, the study authors did not have detailed clinical information about patients, limiting the ability to understand the true clinical implications. Further, patients may have initiated medications for indications other than hypertension. In addition, causality cannot be established given the retrospective observational cohort nature of this study.
Applications for Clinical Practice
Primary care physicians face substantial challenges in the treatment of hypertension, including with respect to selection of initial medication therapy. Results from this study add to the evidence base that fixed-dose combination therapy is more effective in obtaining blood pressure control than monotherapy or multiple-pill therapy. Medication adherence in primary care practice is challenging. Strategies such as fixed-dose combination therapy are reasonable to employ to improve medication adherence; however, costs must be considered.
—Ajay Dharod, MD, Wake Forest School of Medicine, Winston-Salem, NC
1. Gu Q, Burt VL, Dillon CF, Yoon S. Trends in antihypertensive medication use and blood pressure control among United States adults with hypertension. Circulation 2012;126:2105–14.
2. James PA, Oparil S, Carter BL, et al. 2014 Evidence-based guideline for the management of high blood pressure in adults: report from the panel members appointed to the Eighth Joint National Committee (JNC 8). JAMA 2014;311:507–20.
3. Group TSR. A randomized trial of intensive versus standard blood-pressure control. N Engl J Med 2015;373:2103–16.
4. Yeaw J, Benner JS, Walt JG, et al. Comparing adherence and persistence across 6 chronic medication classes. J Manag Care Pharm 2009;15:728–40.
5. Baroletti S, Dell’Orfano H. Medication adherence in cardiovascular disease. Circulation 2010;121:1455–8.
6. Bangalore S, Kamalakkannan G, Parkar S, Messerli FH. Fixed-dose combinations improve medication compliance: a meta-analysis. Am J Med 2007;120:713–9.
7. Gupta AK, Arshad S, Poulter NR. Compliance, safety, and effectiveness of fixed-dose combinations of antihypertensive agents. Hypertension 2010;55:399–407.
8. Pan F, Chernew ME, Fendrick AM. Impact of fixed-dose combination drugs on adherence to prescription medications. J Gen Intern Med 2008;23:611–4.
How to sell your ObGyn practice
For ObGyns, 2 intensely stressful career milestones are the day you start your practice and the day you decide to put it up for sale.
One of us, Dr. Baum, started a practice in 1976. At that time, many clinicians seemed to work right up until the day they died—in mid-examination or with scalpel in hand! Today, clinicians seriously contemplate leaving an active practice at age 55, 60, or, more traditionally, 65.
ObGyns in group practice, even those with only 1 or 2 partners, presumably have in place a well-thought-out and properly drafted contract with buyout and phase-down provisions. For members of a group practice, it is imperative to critically review and discuss contractual arrangements periodically and decide if they make sense as much now as they did at the start. ObGyns who continually revisit their contracts probably have an exit strategy that is fairly self-executing and effective and that will provide the seller with a seamless transition to retirement.
A solo ObGyn who is selling a practice has 3 basic options: find a successor physician, sell to a hospital or to a larger group, or close the practice.
Related article:
ObGyns’ choice of practice environment is a big deal
Preparing your practice for sale
Regardless of who will take over your practice, you need to prepare for its transition.
The most important aspect of selling your practice is knowing its finances and ensuring that they are in order. Any serious buyer will ask to examine your books, see how you are running the business, and assess its vitality and potential growth. Simply, a buyer will want to know where your revenue comes from and where it goes.
Your practice will be attractive to a buyer if it shows a stable or growing revenue base, an attractive payer mix, reasonable overhead, and personal income that is steady if not increasing. If your earning capacity is low or declining, you will need to explain why.
Timing is key
We strongly recommend beginning the process 3 to 5 years before your intended exit.
By starting early, up to 5 years in advance, you can maximize the likelihood that your practice will retain all or most of its value. Moreover, you can use the long lead time to thoroughly explore all available options and find a committed buyer.
Selling a practice can be a complicated affair, and many ObGyns do not have the requisite skills. So much of the success in selling depends on the specifics of the practice, the physician, and the market (the hospital and physician environment).
Identifying potential buyers
Other ObGyns. Recruiting an ObGyn to take over your practice seems to be the best option but can prove very difficult in today’s environment. Many younger clinicians are either joining large groups or becoming hospital employees.
Other physician groups. While working your way down your list of potential buyers, you should also be quietly, subtly, and tactfully assessing other practices, even your competitors, to see if any are candidates for merging with and/or acquiring yours and all your charts, records, and referring physicians.
Hospitals. In today’s health care environment, in which more than half of clinicians are becoming hospital employees, selling to your associated hospital may be a viable option.
Your practice is probably contributing millions of dollars in income to that hospital each year, and of course the hospital would like to maintain this revenue stream. You should consider talking to the hospital’s CEO or medical director.
Hospitals also know that, if you leave and the market cannot absorb the resulting increase in demand for care, patients may go elsewhere, to a competing hospital or outside the community. Rather than lose your market share, a hospital may consider the obvious solution: recruit a replacement ObGyn for your practice.
Your goal here is to negotiate an agreement in which your hospital will recruit a replacement ObGyn, provide financial support, and transition your practice to that ObGyn over a specified period.
The hospital could acquire your practice and either employ you during the transition or provide recruiting support and an income guarantee to help your practice pay the new physician’s salary. Whether to sell or remain independent is often driven by the needs and desires of the recruit. As the vast majority of clinicians coming out of training are seeking employment, in most cases the agreement will require a sale.
Selling to a hospital a few years before your retirement can be a plus. You might find employment a welcome respite from the daunting responsibility of managing your own practice. Life can become much less stressful as you introduce and transition your patients to the new ObGyn. You will be working less, taking fewer calls, and maintaining or even increasing your income, all without the burden of managing the practice.
Read about determining your practice’s value
Putting a monetary value on your practice
After deciding to sell your practice, you need to determine its value. Buying a practice may be the largest financial transaction a young ObGyn will ever make. For a retiring physician, valuation of a practice may reflect a career’s worth of “sweat equity.”
What is your practice worth?
All ObGyns believe their practice is worth far more than any young ObGyn or hospital is willing to pay for it. After all, you have spent a medical lifetime creating, building, and nurturing your practice. You have cared for several thousand patients, who have been loyal and may want to stay with the practice under its new ObGyn. So, how does a retiring physician put a value on his or her practice and then “cast the net” to the marketplace? How do you find a buyer who will pay the asking price and then help the practice make the transition from seller to buyer and continue to serve their patients?
The buyer’s perspective on value. In a pure sense, the value of any asset is what a potential buyer is willing to pay. From a value standpoint, the price that potential buyers are willing to pay varies by the specifics of the situation, regardless of what a valuation or practice appraisal might indicate.
For example, once your plan to retire becomes known, why would a young ObGyn agree to pay X dollars for all your medical records? After all, the potential buyer knows that your existing patients and your referral base will need to seek care from another ObGyn after you leave, and they will likely stay with the practice if they feel they will be treated well by the new clinician.
A hospital may take a similar tack but more often will be willing to pay fair market value for your practice. Hospitals, however, cannot legally pay more than fair market value as determined by an independent appraiser.
Related article:
Four pillars of a successful practice: 1. Keep your current patients happy
Valuation methods
The valuation of any business generally is approached in terms of market, assets, and income.
The market approach usually is taken only with regard to office real estate. Given the lack of reliable and comparable sales information, this approach is seldom used in the valuation of medical practices. If you own your office real estate, a real estate appraiser will establish its fair market value.
In the assets approach, the individual assets of a medical practice are valued on the basis of their current market values. These assets are either tangible or intangible.
Tangible assets can be seen and touched. Furniture, equipment, and office real estate are examples.
The fair market value of used furniture and equipment is most often determined by replacement cost. The value of these items is limited. Usually it starts at 50% of the cost of buying new furniture or equipment of the same utility. From there, the value is lowered on the basis of the age and condition of the items.
Often, the market value of major ObGyn office equipment, such as a DXA (dual-energy x-ray absorptiometry) scanner, is based on similar items for sale or recently sold in the used secondary equipment market.
Tangible assets may include accounts receivable (A/R). A/R represents uncollected payment for work performed. Most buyers want to avoid paying for A/R and assuming the risk of collections. Generally, you should expect to retain your A/R and pay a small or nominal fee to have the buyer handle the collections after you have retired.
Intangible assets are not physical. Examples include the physician’s name, phone number, reputation, referral base, trained staff, and medical records—in other words, what gets patients to keep coming back. Most physicians value these goodwill or “blue-sky” assets highly. Today, unfortunately, most sellers are unable to reap any financial benefit from their intangible assets.
The income approach is based on the premise that the value of any business is in the income it generates for its owner. In simple terms, value in the income approach is a multiple of the cash the business generates after expenses.
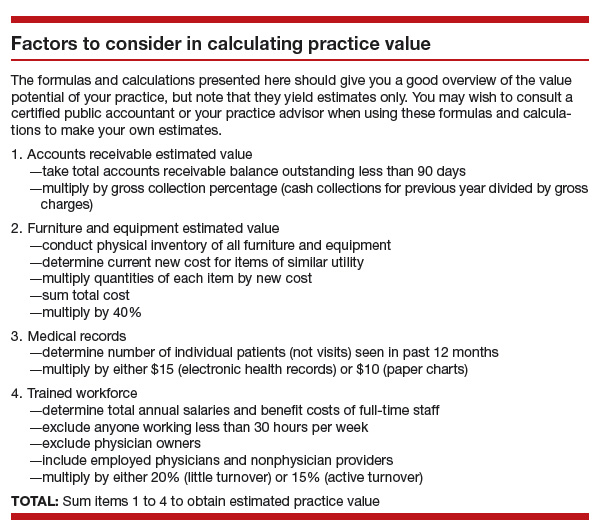
Read important keys to transitioning the practice
Transitioning the practice: Role of the seller and the buyer
First and very important is the contract agreement regarding the overlap period, when both the exiting ObGyn and the new ObGyn are at the practice. We suggest making the overlap a minimum of 6 months and a maximum of 1 year. During this period, the exiting physician can introduce the incoming physician to the patients. A face-to-face introduction can amount to an endorsement, which can ease a patient’s mind and help her decide to take on the new ObGyn and philosophy rather than search elsewhere for obstetric and gynecologic care. The new ObGyn also can use the overlap period to become familiar and comfortable with the staff and learn the process for physician and staff management of case flow, from scheduling and examination to insurance and patient follow-up.
We suggest that the exiting ObGyn send a farewell/welcome letter to patients and referring physicians. The letter should state the exiting ObGyn’s intention to leave (or retire from) the practice and should introduce the ObGyn who will be taking over.
The exiting ObGyn should also take the new ObGyn to meet the physicians who have been providing referrals over the years. We suggest visiting each referring physician’s office to make the introduction. Another good way to introduce a new ObGyn to referring physicians and other professionals—endocrinologists, cardiologists, nurses, pharmaceutical representatives—is to host an open house at your practice. Invite the staff members of the referring physicians as well, since they can be invaluable in making referrals.
We recommend that the exiting ObGyn spend the money to update all the practice’s stationery, brochures, and print materials and ensure they look professional. Note that it is not acceptable to place the new ObGyn’s name under the exiting ObGyn’s name. If the practice has a website, introduce the new physician there and make any necessary updates regarding office hours and accepted insurance plans.
If the exiting ObGyn’s practice lacks a robust Internet and social media presence, the new ObGyn should establish one. We recommend setting up an interactive website that patients can use to make appointments and pay bills. The website should have an email component that can be used to ask questions, raise concerns, and get answers. We also recommend opening Facebook, YouTube, and Twitter accounts for the practice and being active on these social media.
In our experience, smoothly transitioning practices can achieve patient retention rates as high as 90% to 95%. For practices without a plan, however, these rates may be as low as 50%, or worse. Therefore, work out a plan in advance, and include the steps described here, so that on arrival the new ObGyn can hit the ground running.
Acquiring a successful medical practice is doable and offers many advantages, such as autonomy and the ability to make business decisions affecting the practice. Despite all the changes happening in health care, we still think this is the best way to go.
Related article:
Four pillars of a successful practice: 4. Motivate your staff
Bottom line
Selling an ObGyn practice can be a daunting process. However, deciding to sell your practice, performing the valuation, and ensuring a smooth transition are part and parcel of making the transfer a success, equitable for both the buyer and the seller.
Share your thoughts! Send your Letter to the Editor to [email protected]. Please include your name and the city and state in which you practice.

Mr. Bauman is a practice management consultant and CEO of Delta Health Care, Brentwood, Tennessee.

Dr. Baum is a Professor of Clinical Urology at Tulane Medical School, New Orleans, Louisiana, and is the author of The Complete Business Guide for a Successful Medical Practice (Springer, 2016). He is an OBG
The authors report no financial relationships relevant to this article.
Mr. Bauman is a practice management consultant and CEO of Delta Health Care, Brentwood, Tennessee.
Dr. Baum is a Professor of Clinical Urology at Tulane Medical School, New Orleans, Louisiana, and is the author of The Complete Business Guide for a Successful Medical Practice (Springer, 2016). He is an OBG
The authors report no financial relationships relevant to this article.
For ObGyns, 2 intensely stressful career milestones are the day you start your practice and the day you decide to put it up for sale.
One of us, Dr. Baum, started a practice in 1976. At that time, many clinicians seemed to work right up until the day they died—in mid-examination or with scalpel in hand! Today, clinicians seriously contemplate leaving an active practice at age 55, 60, or, more traditionally, 65.
ObGyns in group practice, even those with only 1 or 2 partners, presumably have in place a well-thought-out and properly drafted contract with buyout and phase-down provisions. For members of a group practice, it is imperative to critically review and discuss contractual arrangements periodically and decide if they make sense as much now as they did at the start. ObGyns who continually revisit their contracts probably have an exit strategy that is fairly self-executing and effective and that will provide the seller with a seamless transition to retirement.
A solo ObGyn who is selling a practice has 3 basic options: find a successor physician, sell to a hospital or to a larger group, or close the practice.
Related article:
ObGyns’ choice of practice environment is a big deal
Preparing your practice for sale
Regardless of who will take over your practice, you need to prepare for its transition.
The most important aspect of selling your practice is knowing its finances and ensuring that they are in order. Any serious buyer will ask to examine your books, see how you are running the business, and assess its vitality and potential growth. Simply, a buyer will want to know where your revenue comes from and where it goes.
Your practice will be attractive to a buyer if it shows a stable or growing revenue base, an attractive payer mix, reasonable overhead, and personal income that is steady if not increasing. If your earning capacity is low or declining, you will need to explain why.
Timing is key
We strongly recommend beginning the process 3 to 5 years before your intended exit.
By starting early, up to 5 years in advance, you can maximize the likelihood that your practice will retain all or most of its value. Moreover, you can use the long lead time to thoroughly explore all available options and find a committed buyer.
Selling a practice can be a complicated affair, and many ObGyns do not have the requisite skills. So much of the success in selling depends on the specifics of the practice, the physician, and the market (the hospital and physician environment).
Identifying potential buyers
Other ObGyns. Recruiting an ObGyn to take over your practice seems to be the best option but can prove very difficult in today’s environment. Many younger clinicians are either joining large groups or becoming hospital employees.
Other physician groups. While working your way down your list of potential buyers, you should also be quietly, subtly, and tactfully assessing other practices, even your competitors, to see if any are candidates for merging with and/or acquiring yours and all your charts, records, and referring physicians.
Hospitals. In today’s health care environment, in which more than half of clinicians are becoming hospital employees, selling to your associated hospital may be a viable option.
Your practice is probably contributing millions of dollars in income to that hospital each year, and of course the hospital would like to maintain this revenue stream. You should consider talking to the hospital’s CEO or medical director.
Hospitals also know that, if you leave and the market cannot absorb the resulting increase in demand for care, patients may go elsewhere, to a competing hospital or outside the community. Rather than lose your market share, a hospital may consider the obvious solution: recruit a replacement ObGyn for your practice.
Your goal here is to negotiate an agreement in which your hospital will recruit a replacement ObGyn, provide financial support, and transition your practice to that ObGyn over a specified period.
The hospital could acquire your practice and either employ you during the transition or provide recruiting support and an income guarantee to help your practice pay the new physician’s salary. Whether to sell or remain independent is often driven by the needs and desires of the recruit. As the vast majority of clinicians coming out of training are seeking employment, in most cases the agreement will require a sale.
Selling to a hospital a few years before your retirement can be a plus. You might find employment a welcome respite from the daunting responsibility of managing your own practice. Life can become much less stressful as you introduce and transition your patients to the new ObGyn. You will be working less, taking fewer calls, and maintaining or even increasing your income, all without the burden of managing the practice.
Read about determining your practice’s value
Putting a monetary value on your practice
After deciding to sell your practice, you need to determine its value. Buying a practice may be the largest financial transaction a young ObGyn will ever make. For a retiring physician, valuation of a practice may reflect a career’s worth of “sweat equity.”
What is your practice worth?
All ObGyns believe their practice is worth far more than any young ObGyn or hospital is willing to pay for it. After all, you have spent a medical lifetime creating, building, and nurturing your practice. You have cared for several thousand patients, who have been loyal and may want to stay with the practice under its new ObGyn. So, how does a retiring physician put a value on his or her practice and then “cast the net” to the marketplace? How do you find a buyer who will pay the asking price and then help the practice make the transition from seller to buyer and continue to serve their patients?
The buyer’s perspective on value. In a pure sense, the value of any asset is what a potential buyer is willing to pay. From a value standpoint, the price that potential buyers are willing to pay varies by the specifics of the situation, regardless of what a valuation or practice appraisal might indicate.
For example, once your plan to retire becomes known, why would a young ObGyn agree to pay X dollars for all your medical records? After all, the potential buyer knows that your existing patients and your referral base will need to seek care from another ObGyn after you leave, and they will likely stay with the practice if they feel they will be treated well by the new clinician.
A hospital may take a similar tack but more often will be willing to pay fair market value for your practice. Hospitals, however, cannot legally pay more than fair market value as determined by an independent appraiser.
Related article:
Four pillars of a successful practice: 1. Keep your current patients happy
Valuation methods
The valuation of any business generally is approached in terms of market, assets, and income.
The market approach usually is taken only with regard to office real estate. Given the lack of reliable and comparable sales information, this approach is seldom used in the valuation of medical practices. If you own your office real estate, a real estate appraiser will establish its fair market value.
In the assets approach, the individual assets of a medical practice are valued on the basis of their current market values. These assets are either tangible or intangible.
Tangible assets can be seen and touched. Furniture, equipment, and office real estate are examples.
The fair market value of used furniture and equipment is most often determined by replacement cost. The value of these items is limited. Usually it starts at 50% of the cost of buying new furniture or equipment of the same utility. From there, the value is lowered on the basis of the age and condition of the items.
Often, the market value of major ObGyn office equipment, such as a DXA (dual-energy x-ray absorptiometry) scanner, is based on similar items for sale or recently sold in the used secondary equipment market.
Tangible assets may include accounts receivable (A/R). A/R represents uncollected payment for work performed. Most buyers want to avoid paying for A/R and assuming the risk of collections. Generally, you should expect to retain your A/R and pay a small or nominal fee to have the buyer handle the collections after you have retired.
Intangible assets are not physical. Examples include the physician’s name, phone number, reputation, referral base, trained staff, and medical records—in other words, what gets patients to keep coming back. Most physicians value these goodwill or “blue-sky” assets highly. Today, unfortunately, most sellers are unable to reap any financial benefit from their intangible assets.
The income approach is based on the premise that the value of any business is in the income it generates for its owner. In simple terms, value in the income approach is a multiple of the cash the business generates after expenses.
Read important keys to transitioning the practice
Transitioning the practice: Role of the seller and the buyer
First and very important is the contract agreement regarding the overlap period, when both the exiting ObGyn and the new ObGyn are at the practice. We suggest making the overlap a minimum of 6 months and a maximum of 1 year. During this period, the exiting physician can introduce the incoming physician to the patients. A face-to-face introduction can amount to an endorsement, which can ease a patient’s mind and help her decide to take on the new ObGyn and philosophy rather than search elsewhere for obstetric and gynecologic care. The new ObGyn also can use the overlap period to become familiar and comfortable with the staff and learn the process for physician and staff management of case flow, from scheduling and examination to insurance and patient follow-up.
We suggest that the exiting ObGyn send a farewell/welcome letter to patients and referring physicians. The letter should state the exiting ObGyn’s intention to leave (or retire from) the practice and should introduce the ObGyn who will be taking over.
The exiting ObGyn should also take the new ObGyn to meet the physicians who have been providing referrals over the years. We suggest visiting each referring physician’s office to make the introduction. Another good way to introduce a new ObGyn to referring physicians and other professionals—endocrinologists, cardiologists, nurses, pharmaceutical representatives—is to host an open house at your practice. Invite the staff members of the referring physicians as well, since they can be invaluable in making referrals.
We recommend that the exiting ObGyn spend the money to update all the practice’s stationery, brochures, and print materials and ensure they look professional. Note that it is not acceptable to place the new ObGyn’s name under the exiting ObGyn’s name. If the practice has a website, introduce the new physician there and make any necessary updates regarding office hours and accepted insurance plans.
If the exiting ObGyn’s practice lacks a robust Internet and social media presence, the new ObGyn should establish one. We recommend setting up an interactive website that patients can use to make appointments and pay bills. The website should have an email component that can be used to ask questions, raise concerns, and get answers. We also recommend opening Facebook, YouTube, and Twitter accounts for the practice and being active on these social media.
In our experience, smoothly transitioning practices can achieve patient retention rates as high as 90% to 95%. For practices without a plan, however, these rates may be as low as 50%, or worse. Therefore, work out a plan in advance, and include the steps described here, so that on arrival the new ObGyn can hit the ground running.
Acquiring a successful medical practice is doable and offers many advantages, such as autonomy and the ability to make business decisions affecting the practice. Despite all the changes happening in health care, we still think this is the best way to go.
Related article:
Four pillars of a successful practice: 4. Motivate your staff
Bottom line
Selling an ObGyn practice can be a daunting process. However, deciding to sell your practice, performing the valuation, and ensuring a smooth transition are part and parcel of making the transfer a success, equitable for both the buyer and the seller.
Share your thoughts! Send your Letter to the Editor to [email protected]. Please include your name and the city and state in which you practice.
IN THIS ARTICLE

How Often Are EEGs Overread?
BOSTON—Between 30% and 40% of patients diagnosed with intractable epilepsy do not have epilepsy, according to an overview presented at the 69th Annual Meeting of the American Academy of Neurology. A combination of overreading and overemphasizing EEGs can contribute to misdiagnosis, said Selim R. Benbadis, MD, Professor of Neurology and Director of the Comprehensive Epilepsy Program at the University of South Florida in Tampa.

Neurologists overread EEGs “because of the perception that there is less risk in overdiagnosing epilepsy, as opposed to underdiagnosing [the disease], and that is not correct,” said Dr. Benbadis.
The consequences of an epilepsy misdiagnosis can be serious. Patients can lose driving privileges, which may limit their employment opportunities. Epilepsy also is associated with a stigma that can be difficult to dispel, said Dr. Benbadis. In addition, patients misdiagnosed with epilepsy can have side effects from seizure medications.
Why Are EEGs Overread?
Two of the major reasons for misinterpration of EEGs are lack of training and inexperience, said Dr. Benbadis. Currently, it is not mandatory to learn how to read an EEG during neurology residency. Many neurology programs do require EEG training, but many do not. “If you are not experienced in looking at [an EEG], you will overread and think that everything is abnormal,” said Dr. Benbadis. Many normal variants and artifacts can look like epileptiform discharges to neurologists who are inexperienced in reading EEG.
Commonly overread EEG patterns include normal variants such as wicket rhythms, nonspecific temporal fluctuations, and rhythmic midtemporal theta of drowsiness. In addition, one study found that most patients were misdiagnosed with epilepsy because of overread EEGs; nonspecific fluctuations in the temporal region were misread as sharp waves.
The idea that “phase reversals” represent EEG abnormalities is a misconception, said Dr. Benbadis. A phase reversal, which identifies the location of maximum voltage, does not indicate abnormalities. Every normal waveform can have phase reversals, he said. A “history bias” can also lead to a misdiagnosis of epilepsy. For example, if a patient has a history of seizures or suspected seizures, a neurologist might be biased toward a diagnosis of epilepsy, and “look too hard” when reading the EEG, said Dr. Benbadis.
Steps to Improve EEG Interpretation
When deciding whether a discharge is epileptiform, neurologists should look for waves with an asymmetric contour that clearly stand out from the ongoing background of an EEG. About 98% of the time, with clear epileptiform discharges, neurologists can be sure that they indicate epilepsy without knowing the patient’s history, said Dr. Benbadis. Experts should develop consensus guidelines for EEG interpretation, and all neurology residents should be required to train in the EEG laboratory, said Dr. Benbadis. In addition, when there is doubt about whether an EEG was abnormal, “we must obtain the
—Erica Tricarico
Suggested Reading
Benbadis SR. “Just like EKGs!” Should EEGs undergo a confirmatory interpretation by a clinical neurophysiologist? Neurology. 2013; 80(1 Suppl 1):S47-S51.
BOSTON—Between 30% and 40% of patients diagnosed with intractable epilepsy do not have epilepsy, according to an overview presented at the 69th Annual Meeting of the American Academy of Neurology. A combination of overreading and overemphasizing EEGs can contribute to misdiagnosis, said Selim R. Benbadis, MD, Professor of Neurology and Director of the Comprehensive Epilepsy Program at the University of South Florida in Tampa.
Neurologists overread EEGs “because of the perception that there is less risk in overdiagnosing epilepsy, as opposed to underdiagnosing [the disease], and that is not correct,” said Dr. Benbadis.
The consequences of an epilepsy misdiagnosis can be serious. Patients can lose driving privileges, which may limit their employment opportunities. Epilepsy also is associated with a stigma that can be difficult to dispel, said Dr. Benbadis. In addition, patients misdiagnosed with epilepsy can have side effects from seizure medications.
Why Are EEGs Overread?
Two of the major reasons for misinterpration of EEGs are lack of training and inexperience, said Dr. Benbadis. Currently, it is not mandatory to learn how to read an EEG during neurology residency. Many neurology programs do require EEG training, but many do not. “If you are not experienced in looking at [an EEG], you will overread and think that everything is abnormal,” said Dr. Benbadis. Many normal variants and artifacts can look like epileptiform discharges to neurologists who are inexperienced in reading EEG.
Commonly overread EEG patterns include normal variants such as wicket rhythms, nonspecific temporal fluctuations, and rhythmic midtemporal theta of drowsiness. In addition, one study found that most patients were misdiagnosed with epilepsy because of overread EEGs; nonspecific fluctuations in the temporal region were misread as sharp waves.
The idea that “phase reversals” represent EEG abnormalities is a misconception, said Dr. Benbadis. A phase reversal, which identifies the location of maximum voltage, does not indicate abnormalities. Every normal waveform can have phase reversals, he said. A “history bias” can also lead to a misdiagnosis of epilepsy. For example, if a patient has a history of seizures or suspected seizures, a neurologist might be biased toward a diagnosis of epilepsy, and “look too hard” when reading the EEG, said Dr. Benbadis.
Steps to Improve EEG Interpretation
When deciding whether a discharge is epileptiform, neurologists should look for waves with an asymmetric contour that clearly stand out from the ongoing background of an EEG. About 98% of the time, with clear epileptiform discharges, neurologists can be sure that they indicate epilepsy without knowing the patient’s history, said Dr. Benbadis. Experts should develop consensus guidelines for EEG interpretation, and all neurology residents should be required to train in the EEG laboratory, said Dr. Benbadis. In addition, when there is doubt about whether an EEG was abnormal, “we must obtain the
—Erica Tricarico
Suggested Reading
Benbadis SR. “Just like EKGs!” Should EEGs undergo a confirmatory interpretation by a clinical neurophysiologist? Neurology. 2013; 80(1 Suppl 1):S47-S51.
For the management of labor, patience is a virtue
During the past 45 years, the cesarean delivery (CD) rate in the United States has increased from 5.5% in 1970 to 33% from 2009 to 2013, followed by a small decrease to 32% in 2014 and 2015.1 Many clinical problems cause clinicians and patients to decide that CD is an optimal birth route, including: abnormal labor progress, abnormal or indeterminate fetal heart rate pattern, breech presentation, multiple gestation, macrosomia, placental and cord abnormalities, preeclampsia, prior uterine surgery, and prior CD.2 Recent secular trends that contribute to the current rate of CD include an adversarial liability environment,3,4 increasing rates of maternal obesity,5 and widespread use of continuous fetal-heart monitoring during labor.6
Wide variation in CD rate has been reported among countries, states, and hospitals. The variation is due, in part, to different perspectives about balancing the harms and benefits of vaginal delivery versus CD. In Europe, in 2010 the CD rates in Sweden and Italy were 17.1% and 38%, respectively.7 In 2010, among the states, Alaska had the lowest rate of CD at 22% and Kentucky had the highest rate at 40%.8 In 2015, the highest rate was 38%, in Mississippi (FIGURE).9 In 2014, among Massachusetts hospitals with more than 2,500 births, the CD rate ranged from a low of 22% to a high of 37%.10
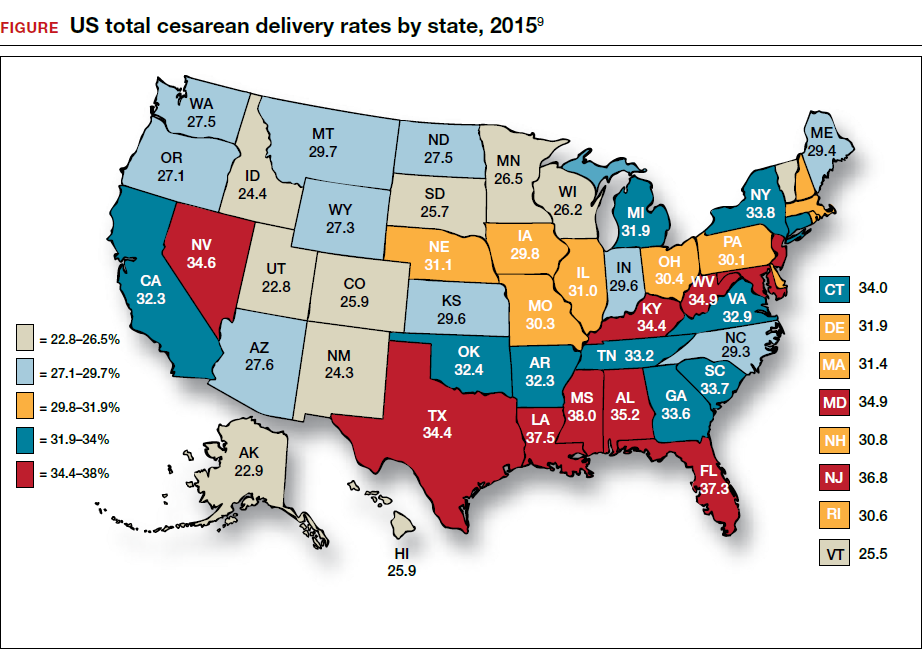
Clinicians, patients, policy experts, and the media are perplexed and troubled by the “high” US CD rate and the major variation in rate among countries, states, and hospitals. Labor management practices likely influence the rate of CD and diverse approaches to labor management likely account for the wide variation in CD rates.
A nationwide effort to standardize and continuously improve labor management might result in a decrease in the CD rate. Building on this opportunity, the American College of Obstetricians and Gynecologists (ACOG) and the Society of Maternal-Fetal Medicine (SMFM) have jointly recommended new labor management guidelines that may reduce the primary CD rate.8
The ACOG/SMFM guidelines encourage obstetricians to extend the time for labor progress in both the 1st and 2nd stages prior to recommending a CD.8 These new guidelines emphasize that for a modern obstetrician, patience is a virtue. There are 2 important caveats to this statement: to safely extend the length of time of labor requires both (1) a reassuring fetal heart rate tracing and (2) stable maternal health. If the fetus demonstrates a persistent worrisome Category II or a Category IIIheart-rate tracing, decisive intervention is necessary and permitting an extended labor would not be optimal. Similarly, if the mother has rapidly worsening preeclampsia it may not be wise to extend an induction of labor (IOL) over many days.
There are risks with extending the length of labor. An extended duration of the 1st stage of labor is associated with an increased rate of maternal chorioamnionitis and shoulder dystocia at birth.11 An extended duration of the 2nd stage of labor is associated with an increase in the rate of maternal chorioamnionitis, anal sphincter injury, uterine atony, and neonatal admission to an intensive care unit.12 Clinicians who adopt practices that permit an extended length of labor must weigh the benefits of avoiding a CD against these maternal and fetal complications.
Active phase redefined
Central to the ACOG/SMFM guidelines is a new definition of the active phase of labor. The research of Dr. Emmanuel Friedman indicated that at approximately 4 cm of cervical dilation many women in labor transition from the latent phase, a time of slow change in cervical dilation, to the active phase, a time of more rapid change in cervical dilation.13,14 However, more recent research indicates that the transition between the latent and active phase is difficult to precisely define, but more often occurs at about 6 cm of cervical dilation and not 4 cm of dilation.15 Adopting these new norms means that laboring women will spend much more time in the latent phase, a phase of labor in which patience is a virtue.
The ACOG/SMFM guidelines
Main takeaways from the ACOG/SMFM guidelines are summarized below. Interventions that address common obstetric issues and labor abnormalities are outlined below.
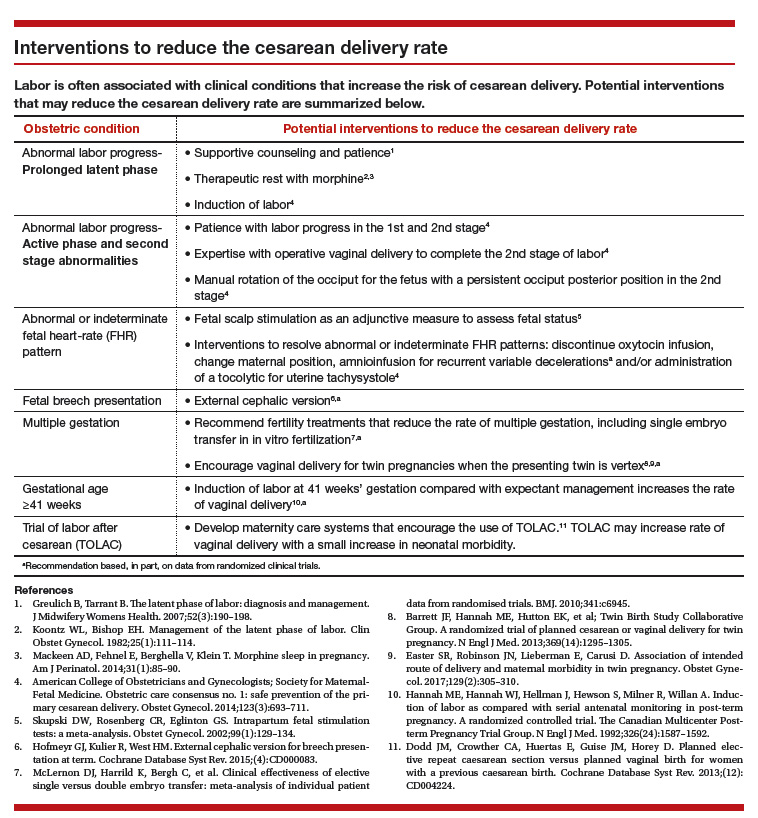
Do not perform CD for a prolonged latent phase of labor, defined as regular contractions of >20 hours duration in nulliparous women and >14 hours duration in multiparous women. Patience with a prolonged latent phase will be rewarded by the majority of women entering the active phase of labor. Alternatively, if appropriate, cervical ripening followed by oxytocin IOL and amniotomy will help the patient with a prolonged latent phase to enter the active phase of labor.16
For women with an unfavorable cervix as assessed by the Bishop score, cervical ripening should be performed prior to IOL. Use of cervical ripening prior to IOL increases the chance of achieving vaginal delivery within 24 hours and may result in a modest decrease in the rate of CD.17,18
Related article:
Should oxytocin and a Foley catheter be used concurrently for cervical ripening in induction of labor?
Failed IOL in the latent phase should only be diagnosed following 12 to 18 hours of both ruptured membranes and adequate contractions stimulated with oxytocin. The key ingredients for the successful management of the latent phase of labor are patience, oxytocin, and amniotomy.16
CD for the indication of active phase arrest requires cervical dilation ≥6 cm with ruptured membranes and no change in cervical dilation for ≥4 hours of adequate uterine activity. In the past, most obstetricians defined active phase arrest, a potential indication for CD, as the absence of cervical change for 2 or more hours in the presence of adequate uterine contractions and cervical dilation of at least 4 cm. Given the new definition of active phase arrest, slow but progressive progress in the 1st stage of labor is not an indication for CD.11,19
“A specific absolute maximum length of time spent in the 2nd stage beyond which all women should be offered an operative delivery has not been identified.”8 Diagnosis of arrest of labor in the 2nd stage may be considered after at least 2 hours of pushing in multiparous women and 3 hours of pushing in nulliparous women, especially if no fetal descent is occurring. The guidelines also state “longer durations may be appropriate on an individualized basis (eg, with use of epidural analgesia or with fetal malposition)” as long as fetal descent is observed.
Patience is a virtue, especially in the management of the 2nd stage of labor. Extending the 2nd stage up to 4 hours appears to be reasonably safe if the fetal status is reassuring and the mother is physiologically stable. In a study from San Francisco of 42,268 births with normal newborn outcomes, the 95th percentile for the length of the 2nd stage of labor for nulliparous women was 3.3 hours without an epidural and 5.6 hours with an epidural.20
In a study of 53,285 births, longer duration of pushing was associated with a small increase in the rate of neonatal adverse outcomes. In nulliparous women the rate of adverse neonatal outcomes increased from 1.3% with less than 60 minutes of pushing to 2.4% with greater than 240 minutes of pushing. Remarkably, even after 4 hours of pushing, 78% of nulliparous women who continued to push had a vaginal delivery.21 In this study, among nulliparous women the rate of anal sphincter injury increased from 5% with less than 60 minutes of pushing to 16% with greater than 240 minutes of pushing, and the rate of postpartum hemorrhage increased from 1% with less than 60 minutes of pushing to 3.3% with greater than 240 minutes of pushing.
I am not enthusiastic about patiently watching a labor extend into the 5th hour of the 2nd stage, especially if the fetus is at +2 station or lower. In a nulliparous woman, after 4 hours of managing the 2nd stage of labor, my patience is exhausted and I am inclined to identify a clear plan for delivery, either by enhanced labor coaching, operative vaginal delivery, or CD.
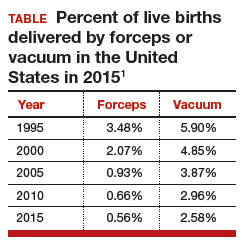
Operative vaginal delivery in the 2nd stage of labor is an acceptable alternative to CD. The rate of operative vaginal delivery in the United States has declined over the past 2 decades (TABLE). In Sweden in 2010 the operative vaginal delivery rate was 7.6% with a CD rate of 17.1%.7 In the United States in 2010 the operative delivery rate was 3.6%, and the CD rate was 33%.1 A renewed focus on operative vaginal delivery with ongoing training and team simulation for the procedure would increase our use of operative delivery and decrease the overall rate of CD.
Related article:
STOP using instruments to assist with delivery of the head at cesarean
Encourage the detection of persistent fetal occiput posterior position by physical examination and/or ultrasound and consider manual rotation of the fetal occiput from the posterior to anterior position in the 2nd stage. Persistent occiput posterior is the most common fetal malposition.22 This malposition is associated with an increased rate of CD.23 There are few randomized trials of manual rotation of the fetal occiput from posterior to anterior position in the 2nd stage of labor, and the evidence is insufficient to determine the efficacy of manual rotation.24 Small nonrandomized studies report that manual rotation of the occiput from posterior to anterior position may reduce the CD rate.25–27
For persistent 2nd stage fetal occiput posterior position in a woman with an adequate pelvis, where manual rotation was not successful and the fetus is at +2 station or below, operative vaginal delivery is an option. “Vacuum or forceps?” and “If forceps, to rotate or not to rotate?” those are the clinical questions. Forceps delivery is more likely to be successfulthan vacuum delivery.28 Direct forceps delivery of the occiput posterior fetus is associated with more anal sphincter injuries than forceps delivery after successful rotation, but few clinicians regularly perform rotational forceps.29 In a study of 2,351 women in the 2nd stage of labor with the fetus at +2 station or below, compared with either forceps or vacuum delivery, CD was associated with more maternal infections and fewer perineal lacerations. Neonatal composite morbidity was not significantly different among the 3 routes of operative delivery.30
Amnioinfusion for repetitive variable decelerations of the fetal heart rate may reduce the risk of CD for an indeterminate fetal heart-rate pattern.31
IOL in a well-dated pregnancy at 41 weeks will reduce the risk of CD. In a large clinical trial, 3,407 women at 41 weeks of gestation were randomly assigned to IOL or expectant management. The rate of CD was significantly lower in the women assigned to IOL compared with expectant management (21% vs 25%, respectively; P = .03).32 The rate of neonatal morbidity was similar in the 2 groups.
Women with twin gestations and the first twin in a cephalic presentation may elect vaginal delivery. In a large clinical trial, 1,398 women with a twin gestation and the first twin in a cephalic presentation were randomly assigned to planned vaginal delivery (with cesarean only if necessary) or planned CD.33 The rate of CD was 44% and 91% for the women in the planned-vaginal and planned-cesarean groups, respectively. There was no significant difference in composite fetal or neonatal death or serious morbidity. The authors concluded that, for twin pregnancy with the presenting twin in the cephalic presentation, there were no demonstrated benefits of planned CD.
Develop maternity care systems that encourage the use of trial of labor after cesarean (TOLAC). The ACOG/SMFM guidelines focus on interventions to reduce the rate of primary CD and do not address the role of TOLAC in reducing CD rates. There are little data from clinical trials to assess the benefits and harms from TOLAC versus scheduled repeat CD.34 However, our experience with TOLAC in the 1990s strongly suggests that encouraging TOLAC will decrease the rate of CD. In 1996 the US rate of vaginal birth after cesarean (VBAC) peaked at 28%, and the rate of CD achieved a recent historic nadir of 21%. Growing concerns that TOLAC occasionally results in fetal harm was followed by a decrease in the VBAC rate to 12% in 2015.1 A recent study of obstetric practices in countries with high and low VBAC rates concluded that patient and clinician commitment and comfort with prioritizing TOLAC over scheduled repeat CD greatly influenced the VBAC rate.35
Related article:
Should lower uterine segment thickness measurement be included in the TOLAC decision-making process?
Labor management is an art
During labor obstetricians must balance the unique needs of mother and fetus, which requires great clinical skill and patience. Evolving concepts of normal labor progress necessitate that we change our expectations concerning the acceptable rate of progress in the 1st and 2nd stage of labor. Consistent application of these new labor guidelines may help to reduce the rate of CD.
- Martin JA, Hamilton BE, Osterman MJ, Driscoll AK, Matthews TJ. Births: final data for 2015. Natl Vital Stat Rep. 2017;66(1):1–70. https://www.cdc.gov/nchs/data/nvsr/nvsr66/nvsr66_01.pdf. Accessed July 5, 2017.
- Barber EL, Lundsberg LS, Belanger K, Pettker CM, Funai EF, Illuzzi JL. Indications contributing to the increasing cesarean delivery rate. Obstet Gynecol. 2011;118(1):29–38.
- Localio AR, Lawthers AG, Bengtson JM, et al. Relationship between malpractice claims and cesarean delivery. JAMA. 1993;269(3):366–373.
- Cheng YW, Snowden JM, Handler SJ, Tager IB, Hubbard AE, Caughey AB. Litigation in obstetrics: does defensive medicine contribute to increases in cesarean delivery? J Matern Fetal Neonatal Med. 2014;27(16):1668–1675.
- Graham LE, Brunner Huber LR, Thompson ME, Ersek JL. Does amount of weight gain during pregnancy modify the association between obesity and cesarean section delivery? Birth. 2014;41(1):93–99.
- Alfirevic Z, Devane D, Gyte GM. Continuous cardiotocography (CTG) as a form of electronic fetal monitoring (EFM) for fetal assessment during labour. Cochrane Database Syst Rev. 2013;(5):CD006066.
- European Perinatal Health Report. Euro-Peristat website. http://www.europeristat.com/. Published 2012. Accessed July 5, 2017.
- American College of Obstetricians and Gynecologists; Society for Maternal-Fetal Medicine. Obstetric care consensus no. 1: safe prevention of the primary cesarean delivery. Obstet Gynecol. 2014;123(3):693–711.
- Cesarean delivery rate by state, 2015. Centers for Disease Control and Prevention website. https://www.cdc.gov/nchs/pressroom/sosmap/cesarean_births/cesareans.htm. Updated January 9, 2017. Accessed July 18, 2017.
- Baker CD, Land T; Massachusetts Department of Public Health. Massachusetts Births 2014. Massachusetts Executive Office of Health and Human Services website. http://www.mass.gov/eohhs/gov/departments/dph/programs/admin/dmoa/repi/birth-data.html. Published September 2015. Accessed July 5, 2017.
- Henry DE, Cheng YW, Shaffer BL, Kaimal AJ, Bianco K, Caughey AB. Perinatal outcomes in the setting of active phase arrest of labor. Obstet Gynecol. 2008;112(5):1109–1115.
- Rouse DJ, Weiner SJ, Bloom SL, et al; Eunice Kennedy Shriver National Institute of Child Health and Human Development Maternal-Fetal Medicine Units Network. Second-stage labor duration in nulliparous women: relationship to maternal and perinatal outcomes. Am J Obstet Gynecol. 2009;201(4):357.e1–e7.
- Friedman EZ. Labour: Clinical evaluation and management. Appleton-Century-Crofts: New York, NY; 1967.
- Friedman E. The graphic analysis of labor. Am J Obstet Gynecol. 1954;68(6):1568–1575.
- Zhang J, Landy HJ, Branch DW, et al; Consortium on Safe Labor. Contemporary patterns of spontaneous labor with normal neonatal outcomes. Obstet Gynecol. 2010;116(6):1281–1287.
- Wei S, Wo BL, Qi HP, et al. Early amniotomy and early oxytocin for prevention of, or therapy for, delay in first stage spontaneous labour compared with routine care. Cochrane Database Syst Rev. 2013;(8):CD006794.
- Thomas J, Fairclough A, Kavanagh J, Kelly AJ. Vaginal prostaglandin (PGE2 and PGF2a) for induction of labour at term. Cochrane Database Syst Rev. 2014;(6):CD003101.
- Alfirevic Z, Kelly AJ, Dowswell T. Intravenous oxytocin alone for cervical ripening and induction of labour. Cochrane Database Syst Rev. 2009;(4):CD003246.
- Rouse DJ, Owen J, Savage KG, Hauth JC. Active phase labor arrest: revisiting the 2-hour minimum. Obstet Gynecol. 2001;98(4):550–554.
- Cheng YW, Shaffer BL, Nicholson JM, Caughey AB. Second stage of labor and epidural use: a larger effect than previously suggested. Obstet Gynecol. 2014;123(3):527–535.
- Grobman WA, Bailit J, Lai Y, et al; Eunice Kennedy Shriver National Institute of Child and Human Development (NICHD) Maternal-Fetal Medicine Units (MFMU) Network. Association of the duration of active pushing with obstetric outcomes. Obstet Gynecol. 2016;127(4):667–673.
- Barth WH Jr. Persistent occiput posterior. Obstet Gynecol. 2015;125(3):695–709.
- Carseldine WJ, Phipps H, Zawada SF, et al. Does occiput posterior position in the second stage of labour increase the operative delivery rate? Aust N Z J Obstet Gynaecol. 2013;53(3):265–270.
- Phipps H, de Vries B, Hyett J, Osborn DA. Prophylactic manual rotation for fetal malposition to reduce operative delivery. Cochrane Database Syst Rev. 2014;(12):CD009298.
- Shaffer BL, Cheng YW, Vargas JE, Caughey AB. Manual rotation to reduce caesarean delivery in persistent occiput posterior or transverse position. J Matern Fetal Neonatal Med. 2011;24(1):65–72.
- Le Ray C, Serres P, Schmitz T, Cabrol D, Goffinet F. Manual rotation in occiput posterior or transverse positions: risk factors and consequences on the cesarean delivery rate. Obstet Gynecol. 2007;110(4):873–879.
- Reichman O, Gdansky E, Latinsky B, Labi S, Samueloff A. Digital rotation from occipito-posterior to occipito-anterior decreases the need for cesarean section. Eur J Obstet Gynecol Repro Biol. 2008;136:25–28.
- O’Mahony F, Hofmeyr GJ, Menon V. Choice of instruments for assisted vaginal delivery. Cochrane Database Syst Rev. 2010;(11):CD005455.
- Hirsch E, Elue R, Wagner A Jr, et al. Severe perineal laceration during operative vaginal delivery: the impact of occiput posterior position. J Perinatol. 2014;34(12):898–900.
- Bailit JL, Grobman WA, Rice MM, et al; Eunice Kennedy Shriver National Institute of Child Health and Human Development Maternal-Fetal Medicine Units Network. Evaluation of delivery options for second-stage events. Am J Obstet Gynecol. 2016;214(5):638.e1–e10.
- Hofmeyr GJ, Lawrie TA. Amnioinfusion for potential or suspected umbilical cord compression in labour. Cochrane Database Syst Rev. 2012;1:CD000013.
- Hannah ME, Hannah WJ, Hellmann J, Hewson S, Milner R, Willan A. Induction of labor as compared with serial antenatal monitoring in post-term pregnancy. A randomized controlled trial. The Canadian Multicenter Post-term Pregnancy Trial Group. N Engl J Med. 1992;326(24): 1587–1592.
- Barrett JF, Hannah ME, Hutton EK, et al; Twin Birth Study Collaborative Group. A randomized trial of planned cesarean or vaginal delivery for twin pregnancy. N Engl J Med. 2013;369(14):1295–1305.
- Dodd JM, Crowther CA, Huertas E, Guise JM, Horey D. Planned elective repeat cesarean section versus planned vaginal birth for women with a previous caesarean birth. Cochrane Database Syst Rev. 2013;(12):CD004224.
- Lundgren I, van Limbeek E, Vehvilainen-Julkunen K, Nilsson C. Clinicians’ views of factors of importance for improving the rate of VBAC (vaginal birth after caesarean section): a qualitative study from countries with high VBAC rates. BMC Pregnancy Childbirth. 2015;15:196.

Dr. Barbieri is Editor in Chief, OBG Management; Chair, Obstetrics and Gynecology, Brigham and Women’s Hospital; and Kate Macy Ladd Professor of Obstetrics, Gynecology, and Reproductive Biology, Harvard Medical School, Boston, Massachusetts.
Dr. Barbieri reports no financial relationships relevant to this article.
During the past 45 years, the cesarean delivery (CD) rate in the United States has increased from 5.5% in 1970 to 33% from 2009 to 2013, followed by a small decrease to 32% in 2014 and 2015.1 Many clinical problems cause clinicians and patients to decide that CD is an optimal birth route, including: abnormal labor progress, abnormal or indeterminate fetal heart rate pattern, breech presentation, multiple gestation, macrosomia, placental and cord abnormalities, preeclampsia, prior uterine surgery, and prior CD.2 Recent secular trends that contribute to the current rate of CD include an adversarial liability environment,3,4 increasing rates of maternal obesity,5 and widespread use of continuous fetal-heart monitoring during labor.6
Wide variation in CD rate has been reported among countries, states, and hospitals. The variation is due, in part, to different perspectives about balancing the harms and benefits of vaginal delivery versus CD. In Europe, in 2010 the CD rates in Sweden and Italy were 17.1% and 38%, respectively.7 In 2010, among the states, Alaska had the lowest rate of CD at 22% and Kentucky had the highest rate at 40%.8 In 2015, the highest rate was 38%, in Mississippi (FIGURE).9 In 2014, among Massachusetts hospitals with more than 2,500 births, the CD rate ranged from a low of 22% to a high of 37%.10
Clinicians, patients, policy experts, and the media are perplexed and troubled by the “high” US CD rate and the major variation in rate among countries, states, and hospitals. Labor management practices likely influence the rate of CD and diverse approaches to labor management likely account for the wide variation in CD rates.
A nationwide effort to standardize and continuously improve labor management might result in a decrease in the CD rate. Building on this opportunity, the American College of Obstetricians and Gynecologists (ACOG) and the Society of Maternal-Fetal Medicine (SMFM) have jointly recommended new labor management guidelines that may reduce the primary CD rate.8
The ACOG/SMFM guidelines encourage obstetricians to extend the time for labor progress in both the 1st and 2nd stages prior to recommending a CD.8 These new guidelines emphasize that for a modern obstetrician, patience is a virtue. There are 2 important caveats to this statement: to safely extend the length of time of labor requires both (1) a reassuring fetal heart rate tracing and (2) stable maternal health. If the fetus demonstrates a persistent worrisome Category II or a Category IIIheart-rate tracing, decisive intervention is necessary and permitting an extended labor would not be optimal. Similarly, if the mother has rapidly worsening preeclampsia it may not be wise to extend an induction of labor (IOL) over many days.
There are risks with extending the length of labor. An extended duration of the 1st stage of labor is associated with an increased rate of maternal chorioamnionitis and shoulder dystocia at birth.11 An extended duration of the 2nd stage of labor is associated with an increase in the rate of maternal chorioamnionitis, anal sphincter injury, uterine atony, and neonatal admission to an intensive care unit.12 Clinicians who adopt practices that permit an extended length of labor must weigh the benefits of avoiding a CD against these maternal and fetal complications.
Active phase redefined
Central to the ACOG/SMFM guidelines is a new definition of the active phase of labor. The research of Dr. Emmanuel Friedman indicated that at approximately 4 cm of cervical dilation many women in labor transition from the latent phase, a time of slow change in cervical dilation, to the active phase, a time of more rapid change in cervical dilation.13,14 However, more recent research indicates that the transition between the latent and active phase is difficult to precisely define, but more often occurs at about 6 cm of cervical dilation and not 4 cm of dilation.15 Adopting these new norms means that laboring women will spend much more time in the latent phase, a phase of labor in which patience is a virtue.
The ACOG/SMFM guidelines
Main takeaways from the ACOG/SMFM guidelines are summarized below. Interventions that address common obstetric issues and labor abnormalities are outlined below.
Do not perform CD for a prolonged latent phase of labor, defined as regular contractions of >20 hours duration in nulliparous women and >14 hours duration in multiparous women. Patience with a prolonged latent phase will be rewarded by the majority of women entering the active phase of labor. Alternatively, if appropriate, cervical ripening followed by oxytocin IOL and amniotomy will help the patient with a prolonged latent phase to enter the active phase of labor.16
For women with an unfavorable cervix as assessed by the Bishop score, cervical ripening should be performed prior to IOL. Use of cervical ripening prior to IOL increases the chance of achieving vaginal delivery within 24 hours and may result in a modest decrease in the rate of CD.17,18
Related article:
Should oxytocin and a Foley catheter be used concurrently for cervical ripening in induction of labor?
Failed IOL in the latent phase should only be diagnosed following 12 to 18 hours of both ruptured membranes and adequate contractions stimulated with oxytocin. The key ingredients for the successful management of the latent phase of labor are patience, oxytocin, and amniotomy.16
CD for the indication of active phase arrest requires cervical dilation ≥6 cm with ruptured membranes and no change in cervical dilation for ≥4 hours of adequate uterine activity. In the past, most obstetricians defined active phase arrest, a potential indication for CD, as the absence of cervical change for 2 or more hours in the presence of adequate uterine contractions and cervical dilation of at least 4 cm. Given the new definition of active phase arrest, slow but progressive progress in the 1st stage of labor is not an indication for CD.11,19
“A specific absolute maximum length of time spent in the 2nd stage beyond which all women should be offered an operative delivery has not been identified.”8 Diagnosis of arrest of labor in the 2nd stage may be considered after at least 2 hours of pushing in multiparous women and 3 hours of pushing in nulliparous women, especially if no fetal descent is occurring. The guidelines also state “longer durations may be appropriate on an individualized basis (eg, with use of epidural analgesia or with fetal malposition)” as long as fetal descent is observed.
Patience is a virtue, especially in the management of the 2nd stage of labor. Extending the 2nd stage up to 4 hours appears to be reasonably safe if the fetal status is reassuring and the mother is physiologically stable. In a study from San Francisco of 42,268 births with normal newborn outcomes, the 95th percentile for the length of the 2nd stage of labor for nulliparous women was 3.3 hours without an epidural and 5.6 hours with an epidural.20
In a study of 53,285 births, longer duration of pushing was associated with a small increase in the rate of neonatal adverse outcomes. In nulliparous women the rate of adverse neonatal outcomes increased from 1.3% with less than 60 minutes of pushing to 2.4% with greater than 240 minutes of pushing. Remarkably, even after 4 hours of pushing, 78% of nulliparous women who continued to push had a vaginal delivery.21 In this study, among nulliparous women the rate of anal sphincter injury increased from 5% with less than 60 minutes of pushing to 16% with greater than 240 minutes of pushing, and the rate of postpartum hemorrhage increased from 1% with less than 60 minutes of pushing to 3.3% with greater than 240 minutes of pushing.
I am not enthusiastic about patiently watching a labor extend into the 5th hour of the 2nd stage, especially if the fetus is at +2 station or lower. In a nulliparous woman, after 4 hours of managing the 2nd stage of labor, my patience is exhausted and I am inclined to identify a clear plan for delivery, either by enhanced labor coaching, operative vaginal delivery, or CD.
Operative vaginal delivery in the 2nd stage of labor is an acceptable alternative to CD. The rate of operative vaginal delivery in the United States has declined over the past 2 decades (TABLE). In Sweden in 2010 the operative vaginal delivery rate was 7.6% with a CD rate of 17.1%.7 In the United States in 2010 the operative delivery rate was 3.6%, and the CD rate was 33%.1 A renewed focus on operative vaginal delivery with ongoing training and team simulation for the procedure would increase our use of operative delivery and decrease the overall rate of CD.
Related article:
STOP using instruments to assist with delivery of the head at cesarean
Encourage the detection of persistent fetal occiput posterior position by physical examination and/or ultrasound and consider manual rotation of the fetal occiput from the posterior to anterior position in the 2nd stage. Persistent occiput posterior is the most common fetal malposition.22 This malposition is associated with an increased rate of CD.23 There are few randomized trials of manual rotation of the fetal occiput from posterior to anterior position in the 2nd stage of labor, and the evidence is insufficient to determine the efficacy of manual rotation.24 Small nonrandomized studies report that manual rotation of the occiput from posterior to anterior position may reduce the CD rate.25–27
For persistent 2nd stage fetal occiput posterior position in a woman with an adequate pelvis, where manual rotation was not successful and the fetus is at +2 station or below, operative vaginal delivery is an option. “Vacuum or forceps?” and “If forceps, to rotate or not to rotate?” those are the clinical questions. Forceps delivery is more likely to be successfulthan vacuum delivery.28 Direct forceps delivery of the occiput posterior fetus is associated with more anal sphincter injuries than forceps delivery after successful rotation, but few clinicians regularly perform rotational forceps.29 In a study of 2,351 women in the 2nd stage of labor with the fetus at +2 station or below, compared with either forceps or vacuum delivery, CD was associated with more maternal infections and fewer perineal lacerations. Neonatal composite morbidity was not significantly different among the 3 routes of operative delivery.30
Amnioinfusion for repetitive variable decelerations of the fetal heart rate may reduce the risk of CD for an indeterminate fetal heart-rate pattern.31
IOL in a well-dated pregnancy at 41 weeks will reduce the risk of CD. In a large clinical trial, 3,407 women at 41 weeks of gestation were randomly assigned to IOL or expectant management. The rate of CD was significantly lower in the women assigned to IOL compared with expectant management (21% vs 25%, respectively; P = .03).32 The rate of neonatal morbidity was similar in the 2 groups.
Women with twin gestations and the first twin in a cephalic presentation may elect vaginal delivery. In a large clinical trial, 1,398 women with a twin gestation and the first twin in a cephalic presentation were randomly assigned to planned vaginal delivery (with cesarean only if necessary) or planned CD.33 The rate of CD was 44% and 91% for the women in the planned-vaginal and planned-cesarean groups, respectively. There was no significant difference in composite fetal or neonatal death or serious morbidity. The authors concluded that, for twin pregnancy with the presenting twin in the cephalic presentation, there were no demonstrated benefits of planned CD.
Develop maternity care systems that encourage the use of trial of labor after cesarean (TOLAC). The ACOG/SMFM guidelines focus on interventions to reduce the rate of primary CD and do not address the role of TOLAC in reducing CD rates. There are little data from clinical trials to assess the benefits and harms from TOLAC versus scheduled repeat CD.34 However, our experience with TOLAC in the 1990s strongly suggests that encouraging TOLAC will decrease the rate of CD. In 1996 the US rate of vaginal birth after cesarean (VBAC) peaked at 28%, and the rate of CD achieved a recent historic nadir of 21%. Growing concerns that TOLAC occasionally results in fetal harm was followed by a decrease in the VBAC rate to 12% in 2015.1 A recent study of obstetric practices in countries with high and low VBAC rates concluded that patient and clinician commitment and comfort with prioritizing TOLAC over scheduled repeat CD greatly influenced the VBAC rate.35
Related article:
Should lower uterine segment thickness measurement be included in the TOLAC decision-making process?
Labor management is an art
During labor obstetricians must balance the unique needs of mother and fetus, which requires great clinical skill and patience. Evolving concepts of normal labor progress necessitate that we change our expectations concerning the acceptable rate of progress in the 1st and 2nd stage of labor. Consistent application of these new labor guidelines may help to reduce the rate of CD.
- Martin JA, Hamilton BE, Osterman MJ, Driscoll AK, Matthews TJ. Births: final data for 2015. Natl Vital Stat Rep. 2017;66(1):1–70. https://www.cdc.gov/nchs/data/nvsr/nvsr66/nvsr66_01.pdf. Accessed July 5, 2017.
- Barber EL, Lundsberg LS, Belanger K, Pettker CM, Funai EF, Illuzzi JL. Indications contributing to the increasing cesarean delivery rate. Obstet Gynecol. 2011;118(1):29–38.
- Localio AR, Lawthers AG, Bengtson JM, et al. Relationship between malpractice claims and cesarean delivery. JAMA. 1993;269(3):366–373.
- Cheng YW, Snowden JM, Handler SJ, Tager IB, Hubbard AE, Caughey AB. Litigation in obstetrics: does defensive medicine contribute to increases in cesarean delivery? J Matern Fetal Neonatal Med. 2014;27(16):1668–1675.
- Graham LE, Brunner Huber LR, Thompson ME, Ersek JL. Does amount of weight gain during pregnancy modify the association between obesity and cesarean section delivery? Birth. 2014;41(1):93–99.
- Alfirevic Z, Devane D, Gyte GM. Continuous cardiotocography (CTG) as a form of electronic fetal monitoring (EFM) for fetal assessment during labour. Cochrane Database Syst Rev. 2013;(5):CD006066.
- European Perinatal Health Report. Euro-Peristat website. http://www.europeristat.com/. Published 2012. Accessed July 5, 2017.
- American College of Obstetricians and Gynecologists; Society for Maternal-Fetal Medicine. Obstetric care consensus no. 1: safe prevention of the primary cesarean delivery. Obstet Gynecol. 2014;123(3):693–711.
- Cesarean delivery rate by state, 2015. Centers for Disease Control and Prevention website. https://www.cdc.gov/nchs/pressroom/sosmap/cesarean_births/cesareans.htm. Updated January 9, 2017. Accessed July 18, 2017.
- Baker CD, Land T; Massachusetts Department of Public Health. Massachusetts Births 2014. Massachusetts Executive Office of Health and Human Services website. http://www.mass.gov/eohhs/gov/departments/dph/programs/admin/dmoa/repi/birth-data.html. Published September 2015. Accessed July 5, 2017.
- Henry DE, Cheng YW, Shaffer BL, Kaimal AJ, Bianco K, Caughey AB. Perinatal outcomes in the setting of active phase arrest of labor. Obstet Gynecol. 2008;112(5):1109–1115.
- Rouse DJ, Weiner SJ, Bloom SL, et al; Eunice Kennedy Shriver National Institute of Child Health and Human Development Maternal-Fetal Medicine Units Network. Second-stage labor duration in nulliparous women: relationship to maternal and perinatal outcomes. Am J Obstet Gynecol. 2009;201(4):357.e1–e7.
- Friedman EZ. Labour: Clinical evaluation and management. Appleton-Century-Crofts: New York, NY; 1967.
- Friedman E. The graphic analysis of labor. Am J Obstet Gynecol. 1954;68(6):1568–1575.
- Zhang J, Landy HJ, Branch DW, et al; Consortium on Safe Labor. Contemporary patterns of spontaneous labor with normal neonatal outcomes. Obstet Gynecol. 2010;116(6):1281–1287.
- Wei S, Wo BL, Qi HP, et al. Early amniotomy and early oxytocin for prevention of, or therapy for, delay in first stage spontaneous labour compared with routine care. Cochrane Database Syst Rev. 2013;(8):CD006794.
- Thomas J, Fairclough A, Kavanagh J, Kelly AJ. Vaginal prostaglandin (PGE2 and PGF2a) for induction of labour at term. Cochrane Database Syst Rev. 2014;(6):CD003101.
- Alfirevic Z, Kelly AJ, Dowswell T. Intravenous oxytocin alone for cervical ripening and induction of labour. Cochrane Database Syst Rev. 2009;(4):CD003246.
- Rouse DJ, Owen J, Savage KG, Hauth JC. Active phase labor arrest: revisiting the 2-hour minimum. Obstet Gynecol. 2001;98(4):550–554.
- Cheng YW, Shaffer BL, Nicholson JM, Caughey AB. Second stage of labor and epidural use: a larger effect than previously suggested. Obstet Gynecol. 2014;123(3):527–535.
- Grobman WA, Bailit J, Lai Y, et al; Eunice Kennedy Shriver National Institute of Child and Human Development (NICHD) Maternal-Fetal Medicine Units (MFMU) Network. Association of the duration of active pushing with obstetric outcomes. Obstet Gynecol. 2016;127(4):667–673.
- Barth WH Jr. Persistent occiput posterior. Obstet Gynecol. 2015;125(3):695–709.
- Carseldine WJ, Phipps H, Zawada SF, et al. Does occiput posterior position in the second stage of labour increase the operative delivery rate? Aust N Z J Obstet Gynaecol. 2013;53(3):265–270.
- Phipps H, de Vries B, Hyett J, Osborn DA. Prophylactic manual rotation for fetal malposition to reduce operative delivery. Cochrane Database Syst Rev. 2014;(12):CD009298.
- Shaffer BL, Cheng YW, Vargas JE, Caughey AB. Manual rotation to reduce caesarean delivery in persistent occiput posterior or transverse position. J Matern Fetal Neonatal Med. 2011;24(1):65–72.
- Le Ray C, Serres P, Schmitz T, Cabrol D, Goffinet F. Manual rotation in occiput posterior or transverse positions: risk factors and consequences on the cesarean delivery rate. Obstet Gynecol. 2007;110(4):873–879.
- Reichman O, Gdansky E, Latinsky B, Labi S, Samueloff A. Digital rotation from occipito-posterior to occipito-anterior decreases the need for cesarean section. Eur J Obstet Gynecol Repro Biol. 2008;136:25–28.
- O’Mahony F, Hofmeyr GJ, Menon V. Choice of instruments for assisted vaginal delivery. Cochrane Database Syst Rev. 2010;(11):CD005455.
- Hirsch E, Elue R, Wagner A Jr, et al. Severe perineal laceration during operative vaginal delivery: the impact of occiput posterior position. J Perinatol. 2014;34(12):898–900.
- Bailit JL, Grobman WA, Rice MM, et al; Eunice Kennedy Shriver National Institute of Child Health and Human Development Maternal-Fetal Medicine Units Network. Evaluation of delivery options for second-stage events. Am J Obstet Gynecol. 2016;214(5):638.e1–e10.
- Hofmeyr GJ, Lawrie TA. Amnioinfusion for potential or suspected umbilical cord compression in labour. Cochrane Database Syst Rev. 2012;1:CD000013.
- Hannah ME, Hannah WJ, Hellmann J, Hewson S, Milner R, Willan A. Induction of labor as compared with serial antenatal monitoring in post-term pregnancy. A randomized controlled trial. The Canadian Multicenter Post-term Pregnancy Trial Group. N Engl J Med. 1992;326(24): 1587–1592.
- Barrett JF, Hannah ME, Hutton EK, et al; Twin Birth Study Collaborative Group. A randomized trial of planned cesarean or vaginal delivery for twin pregnancy. N Engl J Med. 2013;369(14):1295–1305.
- Dodd JM, Crowther CA, Huertas E, Guise JM, Horey D. Planned elective repeat cesarean section versus planned vaginal birth for women with a previous caesarean birth. Cochrane Database Syst Rev. 2013;(12):CD004224.
- Lundgren I, van Limbeek E, Vehvilainen-Julkunen K, Nilsson C. Clinicians’ views of factors of importance for improving the rate of VBAC (vaginal birth after caesarean section): a qualitative study from countries with high VBAC rates. BMC Pregnancy Childbirth. 2015;15:196.

Free water in brain marks Parkinson’s progression
Free water in the posterior substantia nigra brain region increased as clinical Parkinson’s disease progressed in a 4-year longitudinal study of participants in the Parkinson’s Progression Markers Initiative.
Free water in this brain region is measurable via diffusion MRI, and this study – the first to look at free water in Parkinson’s patients across this time frame – suggests it to be a viable biomarker of disease progression that could be used in clinical trials evaluating Parkinson’s therapies.

Dr. Burciu and her colleagues found that free water increased over the first year post diagnosis in Parkinson’s patients but not in controls (P = .043), confirming similar results from an earlier study (Neurobiol Aging. 2015a;36:1097-104; Brain. 2015b;138:2322-31).
The researchers also looked at data from 46 Parkinson’s patients in the cohort who underwent imaging at 2 and 4 years to learn whether the observed increases in free water corresponded to progression measured on the Hoehn and Yahr scale, a widely used measure of Parkinson’s symptom severity.
Free water continued to increase in the Parkinson’s patients through 4 years, and increases in the first and second years after diagnosis were significantly associated with worsening of symptoms through 4 years (P less than .05 for both). Moreover, the investigators noted, men saw greater 4-year increases in free water levels, compared with women.
“The short-term increase in free water is related to the long-term progression of motor symptoms. Moreover, sex and baseline free water levels significantly predicted the rate of change in free water in [the posterior substantia nigra] over 4 years,” the investigators wrote.
The results were consistent across study sites, they found.
Dr. Burciu and her colleagues disclosed funding from the PPMI, which is supported by the Michael J. Fox Foundation and a consortium of pharmaceutical, biotech, and financial firms. The researchers also received funding from the National Institutes of Health. None disclosed financial conflicts of interest.
Free water in the posterior substantia nigra brain region increased as clinical Parkinson’s disease progressed in a 4-year longitudinal study of participants in the Parkinson’s Progression Markers Initiative.
Free water in this brain region is measurable via diffusion MRI, and this study – the first to look at free water in Parkinson’s patients across this time frame – suggests it to be a viable biomarker of disease progression that could be used in clinical trials evaluating Parkinson’s therapies.
Dr. Burciu and her colleagues found that free water increased over the first year post diagnosis in Parkinson’s patients but not in controls (P = .043), confirming similar results from an earlier study (Neurobiol Aging. 2015a;36:1097-104; Brain. 2015b;138:2322-31).
The researchers also looked at data from 46 Parkinson’s patients in the cohort who underwent imaging at 2 and 4 years to learn whether the observed increases in free water corresponded to progression measured on the Hoehn and Yahr scale, a widely used measure of Parkinson’s symptom severity.
Free water continued to increase in the Parkinson’s patients through 4 years, and increases in the first and second years after diagnosis were significantly associated with worsening of symptoms through 4 years (P less than .05 for both). Moreover, the investigators noted, men saw greater 4-year increases in free water levels, compared with women.
“The short-term increase in free water is related to the long-term progression of motor symptoms. Moreover, sex and baseline free water levels significantly predicted the rate of change in free water in [the posterior substantia nigra] over 4 years,” the investigators wrote.
The results were consistent across study sites, they found.
Dr. Burciu and her colleagues disclosed funding from the PPMI, which is supported by the Michael J. Fox Foundation and a consortium of pharmaceutical, biotech, and financial firms. The researchers also received funding from the National Institutes of Health. None disclosed financial conflicts of interest.
FROM BRAIN
Key clinical point:
Major finding: Increases measured in years 1 or 2 after diagnosis were associated with worsening of symptoms through year 4 (P less than .05)
Data source: Analysis of 103 patients and 49 controls from a large, multisite, international, observational, longitudinal study seeking Parkinson’s biomarkers.
Disclosures: The National Institutes of Health and the Parkinson’s Progression Markers Initiative (PPMI) funded this analysis. The PPMI receives broad funding from industry and foundations. None of the researchers disclosed financial conflicts of interest.
VIDEO: Less follow-up proposed for low-risk thyroid cancer
BOSTON – , Bryan R. Haugen, MD, suggested in a keynote lecture during the World Congress on Thyroid Cancer.
Traditionally, thyroid cancer specialists have monitored these patients for persistent or recurrent disease as often as every 6 or 12 months. “But what we’ve realized with recent assessments of response to treatment is that some patients do well without a recurrence over many years; so, the concept of doing less monitoring and less imaging, especially in patients with an excellent response [to their initial treatment], is being studied,” Dr. Haugen said in a video interview following his talk.
He estimated that perhaps two-thirds or as many as three-quarters of patients with differentiated thyroid cancer fall into the category of having low- or intermediate-risk disease with an excellent or good response to treatment, and hence they are potential candidates for eventually transitioning to less frequent follow-up.
During his talk, Dr. Haugen suggested that after several years with no sign of disease recurrence, lower-risk patients with an excellent treatment response may be able to stop undergoing regular monitoring, and those with a good treatment response may be able to safely have their monitoring intervals extended.
According to the most recent (2015) guidelines for differentiated thyroid cancer management from the American Thyroid Association, lower-risk patients with an excellent treatment response should have their serum thyroglobulin measured every 12-24 months and undergo an ultrasound examination every 3-5 years, while patients with a good response are targeted for serum thyroglobulin measurement annually with an ultrasound every 1-3 years (Thyroid. 2016 Jan;26[1]:1-133). Dr. Haugen chaired the expert panel that wrote these guidelines.
In another provocative suggestion, Dr. Haugen proposed that once well-responsive, lower-risk patients have remained disease free for several years, their less frequent follow-up monitoring could be continued by a primary care physician or another less specialized clinician.
At some time in the future, “a patient’s primary care physician could follow a simple tumor marker, thyroglobulin, maybe once every 5 years,” said Dr. Haugen, professor of medicine and head of the division of endocrinology, metabolism, and diabetes at the University of Colorado in Aurora. “At the University of Colorado, we use advanced-practice providers to do long-term follow-up” for lower-risk, treatment-responsive patients, he said.
The video associated with this article is no longer available on this site. Please view all of our videos on the MDedge YouTube channel
On Twitter @mitchelzoler
AT WCTC 2017

FDA advisory panel backs safety of new hepatitis B vaccine for adults
The Food and Drug Administration’s Vaccines and Related Biological Products Advisory Committee approved licensure for Heplisav-B, a new two-dose recombinant hepatitis B vaccination, after voting that presented data proved the vaccine to be safe for adults 18 and over.
At an advisory meeting, after hearing testimony from government researchers and representatives of Dynavax Technologies Corporation, the manufacturer of Heplisav-B, 11 members voted to approve the drug, 1 member voted no, and 3 abstained.
There are more than 20,000 new infections each year, with a reported increase of 21% between 2014 and 2015, according to research presented by William Schaffner, MD, professor of preventative medicine and infectious diseases at Vanderbilt University, Nashville, Tenn.
There are two approved immunizations for hepatitis B: Engerix-B, manufactured by GlaxoSmithKline, and Recombivax HB, by Merck. Both are three-dose, recombinant vaccines produced from yeast cells.
Like the current vaccines, Heplisav-B is a recombinant hepatitis B surface antigen that is derived from yeast; however, this vaccine would be administered in two doses over 1 month, as opposed to three doses over 6 months as is the schedule for currently approved vaccines. Both manufacturing representatives and approving members of the committee stressed this as an important factor due to vaccination dropout rates.
“We have a problem with hepatitis B infections in this country as well as problems with the current vaccines,“ said John Ward, MD, director of the division of viral hepatitis at the Centers for Disease Control and Prevention, “and they happen in these populations where, in terms of data, both of those audiences have problems about going for the second and third dose.”
Patients that drop out before the third dose are at high risk of infection, as only 20%-50% of adults have the appropriate seroprotection after two doses. However, only 54% of patients in a vaccine safety Datalink study reported completing the vaccination series, with 81% reporting having received two doses, according to Dr. Schaffner.
While the committee did approve the safety research as sufficient to approve use of Heplisav-B in adults 18 years and older, members of the committee had an issue with the drug’s correlation with myocardial infarction.
In one of the studies presented, Heplisav-B’s acute myocardial infarction (AMI) events (14 patients) greatly outnumbered those of Engerix-B (1 patient), presenting an AMI relative risk of 6.97.
Dynavax representatives, in response to this concern, presented intention to conduct a postmarketing analysis of the risk of MI in patients who have been administered Heplisav-B, which committee members considered to be a crucial contingency for approval.
“I would like to say I am for the approval of this vaccine, I just think as a statistician that the safety was inconclusive,” said Mei-Ling Ting Lee, PhD, director of the Biostatistics and Risk Assessment Center at the University of Maryland. “But I think for the pharmacological vigilance plan, I think that it will be good to have specific analysis for the myocardial infarction and other risks.”
Dynavax intends to introduce the vaccine commercially in the United States by the middle of 2018, according to a press release.
[email protected]
On Twitter @eaztweets