User login
Adult insomnia associated with childhood behavioral problems

Yohannes Adama Melaku, MPH, PhD, of the Adelaide (Australia) Institute for Sleep Health at Flinders University and coauthors drew data from the 1970 UK Birth Cohort Study. This study followed an initial cohort of 16,571 babies who were born during a single week, with follow-up at ages 5, 10, 16, 26, 30, 38, 42, and 46 years. For the purposes of this study, the investigators looked at participants who, at 42 years of age, were alive and not lost to follow-up and who responded to an invitation to be interviewed; the sample sizes in the analysis were 8,050 participants aged 5 years, 9,090 participants aged 10 years, 9,653 participants aged 16 years, and 9,841 participants aged 42 years.
Behavior was measured at ages 5 years and 16 years using the Rutter Behavioral Scale (RBS) and at age 10 years using a visual analog scale, and insomnia symptoms were assessed through interviewing participants in adulthood about duration of sleep, difficulty initiating sleep, difficulty maintaining sleep, and not feeling rested on waking. Participants were organized into normal behavior (less than or equal to 80th percentile on RBS), moderate behavioral problems (greater than the 80th percentile but less than or equal to the 95th percentile), and severe behavioral problems (above 95th percentile). The investigators then devised two models for their analysis: Model 1 adjusted for sex, parent’s social class and educational level, marital status, educational status, and social class, and model 2 adjusted for physical activity level and body mass index (BMI) trajectory (from 10 to 42 years), perceived health status, and number of noncommunicable diseases, although this latter model yielded fewer statistically significant results in some analyses.
Odds for difficulty initiating or maintaining sleep as an adult was increased among participants with severe behavioral problems at age 5 years in model 1 (adjusted odds ratio, 1.50; 95% confidence interval, 1.14-1.96; P = .004), as well as for those with severe problems at 10 years (aOR, 1.30; 95% CI, 1.14-1.63; P = .001), and at 16 years (aOR, 2.17; 95% CI, 1.59-2.91; P less than .001). The aORs also were higher individually for difficulty initiating sleep and for difficulty maintaining sleep in all age groups.
The association with adulthood insomnia was stronger in participants with externalizing behavioral problems such as lying, bullying, restlessness, and fighting than it was in those with internalizing behavioral problems such as worry, fearfulness, and solitariness.
“Although early sleep problems should be identified, we should additionally identify children with moderate to severe behavioral problems that persist throughout childhood as potential beneficiaries of early intervention with a sleep health focus,” the authors wrote.
One of the study’s limitations was a lack of standardized insomnia measures in the cohort study; however, the researchers suggested that the symptoms included reflect those of standardized measures and diagnostic criteria.
“This study is the first, to our knowledge, to suggest an unfavorable association of early-life behavioral problems with adulthood sleep health, underlining the importance of treating behavioral problems in children and addressing insomnia from a life-course perspective,” they concluded.
No study sponsor was identified. The authors reported no relevant financial disclosures.
SOURCE: Melaku YA et al. JAMA Netw Open. 2019 Sep 6. doi: 10.1001/jamanetworkopen.2019.10861.
FROM JAMA NETWORK OPEN
Reversal agents for direct-acting oral anticoagulants
Summary of guidelines published in the Journal of Hospital Medicine
When on call for admissions, a hospitalist receives a request from a colleague to admit an octogenarian man with an acute uncomplicated deep vein thrombosis to start heparin, bridging to warfarin. The patient has no evidence of postphlebitic syndrome, pulmonary embolism, or right-sided heart strain. The hospitalist asks her colleague if he had considered treating the patient in the ambulatory setting using a direct-acting oral anticoagulant (DOAC). After all, this would save the patient an unnecessary hospitalization, weekly international normalized ratio checks, and other important lifestyle changes. In response, the colleague voices concern that the “new drugs don’t have antidotes.”

DOACs have several benefits over vitamin K antagonists (VKAs) and heparins. DOACs have quicker onset of action, can be taken by mouth, in general do not require dosage adjustment, and have fewer dietary and lifestyle modifications, compared with VKAs and heparins. In atrial fibrillation, DOACs have been shown to have lower all-cause and bleeding-related mortality than warfarin (see Table 1).1 Observational studies also suggest less risk of major bleeding with DOACs over warfarin but no difference in overall mortality when used to treat venous thromboembolism (see Table 2).2 Because of these combined advantages, DOACs are increasingly prescribed, accounting for approximately half of all oral anticoagulant prescriptions in 2014.3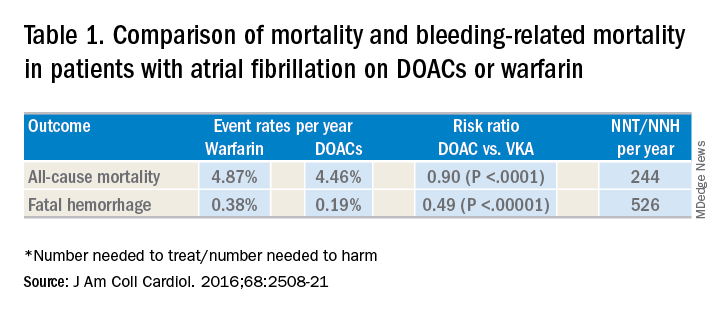
Although DOACs have been shown to be as good if not superior to VKAs and heparins in these circumstances, there are situations where a DOAC should not be used. There is limited data on the safety of DOACs in patients with mechanical heart valves, liver failure, and chronic kidney disease with a creatinine clearance less than 30 mL/min.4 Therefore, warfarin is still the preferred agent in these settings. There is some data that apixaban may be safe in patients with a creatinine clearance of greater than 10 mL/min, but long-term safety studies have not been performed in patients with end-stage renal disease on hemodialysis.5 Finally, in patients requiring concomitant inducers or inhibitors of the P-glycoprotein or cytochrome P450 enzymes like antiepileptics and protease inhibitors, VKAs and heparins are favored.4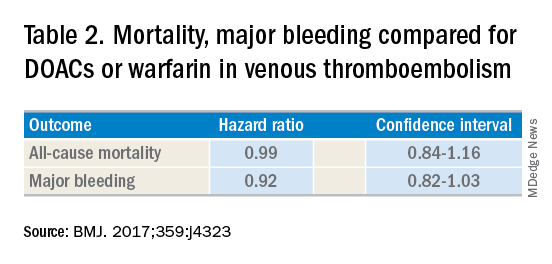
Notwithstanding their advantages, when DOACs first hit the market there were concerns that reversal agents were not available. In the August issue of the Journal of Hospital Medicine’s Clinical Guideline Highlights for the Hospitalist, Emily Gottenborg, MD, and Gregory Misky, MD, summarized guideline recommendations for reversal of the newer agents.6 This includes use of idarucizumab for patients on dabigatran and use of prothrombin complex concentrate (PCC) or recombinant coagulation factor Xa (andexanet alfa) for patients on apixaban or rivaroxaban for the treatment of life-threatening bleeding.
Idarucizumab is a monoclonal antibody developed to reverse the effects of dabigatran, the only DOAC that directly inhibits thrombin. In 2017, researchers reported on a cohort of subjects receiving idarucizumab for uncontrolled bleeding or who were on dabigatran and about to undergo an urgent procedure.7 Of those with uncontrolled bleeding, two-thirds had confirmed bleeding cessation within 24 hours. Periprocedural hemostasis was achieved in 93.4% of patients undergoing urgent procedures. However, it should be noted that use of idarucizumab conferred an increase risk (6.3%) of thrombosis within 90 days. Based on these findings, guidelines recommend use of idarucizumab in patients experiencing life-threatening bleeding, balanced against the risk of thrombosis.8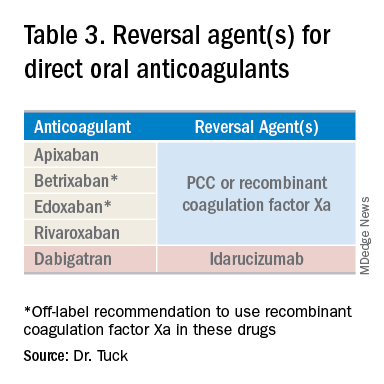
In 2018, the Food and Drug Administration approved recombinant coagulation factor Xa for treatment of life-threatening or uncontrolled bleeding in patients on apixaban or rivaroxaban.9 The approval came after a study by the ANNEXA-4 investigators showed that recombinant coagulation factor Xa quickly and effectively achieved hemostasis.10 Full study results were published in April 2019, demonstrating 82% of patients receiving the drug attained clinical hemostasis.11 However, as with idarucizumab, up to 10% of patients had a thrombotic event in the follow-up period. Use of recombinant coagulation factor Xa for treatment of life-threatening bleeding related to betrixaban and edoxaban is considered off label but is recommended by guidelines.8 Studies on investigational reversal agents for betrixaban and edoxaban are ongoing.
Both unactivated and activated PCC contain clotting factor X. Their use to control bleeding related to DOAC use is based on observational studies. In a systematic review of the nonrandomized studies, the efficacy of PCC to stem major bleeding was 69% and the risk for thromboembolism was 4%.12 There are no head-to-head studies comparing use of recombinant coagulation factor Xa and PCC. Therefore, guidelines are to use either recombinant factor Xa or PCC for the treatment of life-threatening bleeding related to DOAC use.7
As thrombosis risk heightens after use of any reversal agent, the recommendations are to resume anticoagulation within 90 days if the patient is at moderate or high risk for recurrent thromboembolism.8
After discussion with the hospitalist about the new agents available to reverse anticoagulation, the colleague decided to place the patient on a DOAC and keep the patient in his nursing home. Thankfully, the patient did not thereafter experience sustained bleeding necessitating use of these reversal agents. More importantly for the patient, he was able to stay in the comfort of his home.
Dr. Tuck is associate section chief for hospital medicine at the Veterans Affairs Medical Center in Washington, D.C.
References
1. Gómez-Outes A et al. Causes of death in anticoagulated patients with atrial fibrillation. J Am Coll Cardiol. 2016;68:2508-21.
2. Jun M et al. Comparative safety of direct oral anticoagulants and warfarin in venous thromboembolism: multicentre, population-based, observational study. BMJ. 2017;359:j4323.
3. Barnes GD et al. National trends in ambulatory oral anticoagulant use. Am J Med. 2015;128:(1300-5).e2.
4. Reddy P et al. Practical approach to VTE management in hospitalized patients. Am J Ther. 2017;24(4):e442-67.
5. Kimachi M et al. Direct oral anticoagulants versus warfarin for preventing stroke and systemic embolic events among atrial fibrillation patients with chronic kidney disease. Cochrane Database Syst Rev. 2017 Nov 6;11:CD011373.
6. Gottenborg E et al. Clinical guideline highlights for the hospitalist: The management of anticoagulation in the hospitalized adult. J Hosp Med. 2019; 14(8):499-500.
7. Pollack CV Jr et al. Idarucizumab for dabigatran reversal – full cohort analysis. N Engl J Med. 2017;377(5):431-41.
8. Witt DM et al. American Society of Hematology 2018 guidelines for management of venous thromboembolism: Optimal management of anticoagulation therapy. Blood Adv. 2018;2(22):3257-91.
9. Malarky M et al. FDA accelerated approval letter. Retrieved July 15, 2019. https://www.fda.gov/media/113285/download
10. Connolly SJ et al. Andexanet alfa for acute major bleeding associated with factor Xa inhibitors. N Engl J Med. 2016;375(12):1131-41.
11. Connolly SJ et al. Full study report of andexanet alfa for bleeding associated with factor xa inhibitors. N Engl J Med. 2019;380(14):1326-35.
12. Piran S et al. Management of direct factor Xa inhibitor–related major bleeding with prothrombin complex concentrate: A meta-analysis. Blood Adv. 2019;3(2):158-67.
Summary of guidelines published in the Journal of Hospital Medicine
Summary of guidelines published in the Journal of Hospital Medicine
When on call for admissions, a hospitalist receives a request from a colleague to admit an octogenarian man with an acute uncomplicated deep vein thrombosis to start heparin, bridging to warfarin. The patient has no evidence of postphlebitic syndrome, pulmonary embolism, or right-sided heart strain. The hospitalist asks her colleague if he had considered treating the patient in the ambulatory setting using a direct-acting oral anticoagulant (DOAC). After all, this would save the patient an unnecessary hospitalization, weekly international normalized ratio checks, and other important lifestyle changes. In response, the colleague voices concern that the “new drugs don’t have antidotes.”
DOACs have several benefits over vitamin K antagonists (VKAs) and heparins. DOACs have quicker onset of action, can be taken by mouth, in general do not require dosage adjustment, and have fewer dietary and lifestyle modifications, compared with VKAs and heparins. In atrial fibrillation, DOACs have been shown to have lower all-cause and bleeding-related mortality than warfarin (see Table 1).1 Observational studies also suggest less risk of major bleeding with DOACs over warfarin but no difference in overall mortality when used to treat venous thromboembolism (see Table 2).2 Because of these combined advantages, DOACs are increasingly prescribed, accounting for approximately half of all oral anticoagulant prescriptions in 2014.3
Although DOACs have been shown to be as good if not superior to VKAs and heparins in these circumstances, there are situations where a DOAC should not be used. There is limited data on the safety of DOACs in patients with mechanical heart valves, liver failure, and chronic kidney disease with a creatinine clearance less than 30 mL/min.4 Therefore, warfarin is still the preferred agent in these settings. There is some data that apixaban may be safe in patients with a creatinine clearance of greater than 10 mL/min, but long-term safety studies have not been performed in patients with end-stage renal disease on hemodialysis.5 Finally, in patients requiring concomitant inducers or inhibitors of the P-glycoprotein or cytochrome P450 enzymes like antiepileptics and protease inhibitors, VKAs and heparins are favored.4
Notwithstanding their advantages, when DOACs first hit the market there were concerns that reversal agents were not available. In the August issue of the Journal of Hospital Medicine’s Clinical Guideline Highlights for the Hospitalist, Emily Gottenborg, MD, and Gregory Misky, MD, summarized guideline recommendations for reversal of the newer agents.6 This includes use of idarucizumab for patients on dabigatran and use of prothrombin complex concentrate (PCC) or recombinant coagulation factor Xa (andexanet alfa) for patients on apixaban or rivaroxaban for the treatment of life-threatening bleeding.
Idarucizumab is a monoclonal antibody developed to reverse the effects of dabigatran, the only DOAC that directly inhibits thrombin. In 2017, researchers reported on a cohort of subjects receiving idarucizumab for uncontrolled bleeding or who were on dabigatran and about to undergo an urgent procedure.7 Of those with uncontrolled bleeding, two-thirds had confirmed bleeding cessation within 24 hours. Periprocedural hemostasis was achieved in 93.4% of patients undergoing urgent procedures. However, it should be noted that use of idarucizumab conferred an increase risk (6.3%) of thrombosis within 90 days. Based on these findings, guidelines recommend use of idarucizumab in patients experiencing life-threatening bleeding, balanced against the risk of thrombosis.8
In 2018, the Food and Drug Administration approved recombinant coagulation factor Xa for treatment of life-threatening or uncontrolled bleeding in patients on apixaban or rivaroxaban.9 The approval came after a study by the ANNEXA-4 investigators showed that recombinant coagulation factor Xa quickly and effectively achieved hemostasis.10 Full study results were published in April 2019, demonstrating 82% of patients receiving the drug attained clinical hemostasis.11 However, as with idarucizumab, up to 10% of patients had a thrombotic event in the follow-up period. Use of recombinant coagulation factor Xa for treatment of life-threatening bleeding related to betrixaban and edoxaban is considered off label but is recommended by guidelines.8 Studies on investigational reversal agents for betrixaban and edoxaban are ongoing.
Both unactivated and activated PCC contain clotting factor X. Their use to control bleeding related to DOAC use is based on observational studies. In a systematic review of the nonrandomized studies, the efficacy of PCC to stem major bleeding was 69% and the risk for thromboembolism was 4%.12 There are no head-to-head studies comparing use of recombinant coagulation factor Xa and PCC. Therefore, guidelines are to use either recombinant factor Xa or PCC for the treatment of life-threatening bleeding related to DOAC use.7
As thrombosis risk heightens after use of any reversal agent, the recommendations are to resume anticoagulation within 90 days if the patient is at moderate or high risk for recurrent thromboembolism.8
After discussion with the hospitalist about the new agents available to reverse anticoagulation, the colleague decided to place the patient on a DOAC and keep the patient in his nursing home. Thankfully, the patient did not thereafter experience sustained bleeding necessitating use of these reversal agents. More importantly for the patient, he was able to stay in the comfort of his home.
Dr. Tuck is associate section chief for hospital medicine at the Veterans Affairs Medical Center in Washington, D.C.
References
1. Gómez-Outes A et al. Causes of death in anticoagulated patients with atrial fibrillation. J Am Coll Cardiol. 2016;68:2508-21.
2. Jun M et al. Comparative safety of direct oral anticoagulants and warfarin in venous thromboembolism: multicentre, population-based, observational study. BMJ. 2017;359:j4323.
3. Barnes GD et al. National trends in ambulatory oral anticoagulant use. Am J Med. 2015;128:(1300-5).e2.
4. Reddy P et al. Practical approach to VTE management in hospitalized patients. Am J Ther. 2017;24(4):e442-67.
5. Kimachi M et al. Direct oral anticoagulants versus warfarin for preventing stroke and systemic embolic events among atrial fibrillation patients with chronic kidney disease. Cochrane Database Syst Rev. 2017 Nov 6;11:CD011373.
6. Gottenborg E et al. Clinical guideline highlights for the hospitalist: The management of anticoagulation in the hospitalized adult. J Hosp Med. 2019; 14(8):499-500.
7. Pollack CV Jr et al. Idarucizumab for dabigatran reversal – full cohort analysis. N Engl J Med. 2017;377(5):431-41.
8. Witt DM et al. American Society of Hematology 2018 guidelines for management of venous thromboembolism: Optimal management of anticoagulation therapy. Blood Adv. 2018;2(22):3257-91.
9. Malarky M et al. FDA accelerated approval letter. Retrieved July 15, 2019. https://www.fda.gov/media/113285/download
10. Connolly SJ et al. Andexanet alfa for acute major bleeding associated with factor Xa inhibitors. N Engl J Med. 2016;375(12):1131-41.
11. Connolly SJ et al. Full study report of andexanet alfa for bleeding associated with factor xa inhibitors. N Engl J Med. 2019;380(14):1326-35.
12. Piran S et al. Management of direct factor Xa inhibitor–related major bleeding with prothrombin complex concentrate: A meta-analysis. Blood Adv. 2019;3(2):158-67.
Early infusion of mononuclear cells may benefit stroke patients
, results from a single-arm, phase I trial demonstrated. Unlike autologous mesenchymal stem cells, mononuclear cells (MNCs) do not require passage in culture, which allows for testing in the early poststroke time therapy window.

Bone marrow MNCs are attractive in regenerative medicine studies because they can be rapidly isolated; are enriched with hematopoietic, mesenchymal, and endothelial progenitor cells; and permit autologous applications. “The regenerative potential of bone marrow–derived MNCs is attributed to various mechanisms that impact stroke recovery,” researchers led by Sean I. Savitz, MD, wrote in a study published online Sept. 17 in Stem Cells. “These cells migrate to the site of injury, release cytokines and other trophic factors, decrease proinflammatory and upregulate anti-inflammatory pathways, and enhance angiogenesis, neurogenesis, and synaptogenesis.”
For the trial, Dr. Savitz, MD, director of the Institute for Stroke and Cerebrovascular Disease at UTHealth, Houston, and colleagues recruited 25 patients to receive an IV dose of their own bone marrow mononuclear cells within 72 hours after stroke onset, a time frame supported by previous preclinical studies. They followed the patients for 1 year and compared the results with a control group of 185 patients who received conventional poststroke treatment. Primary outcomes were study-related serious adverse events and the proportion of patients successfully completing study intervention.
The researchers reported results from 25 patients who received bone marrow MNCs. The mean age of patients in the MNC and control groups were 61 and 63 years, respectively, 53% were female, and 69% were white. No study-related adverse events were observed in the MNC group, but three (12%) had infarct expansion between enrollment and harvest and underwent elective hemicraniectomy after cell infusion.
Advanced magnetic resonance imaging revealed that the average mean fractional anisotropy (FA), a measure of structural integrity and directional coherence of axonal fibers, within the ipsilesional pons was decreased between 1 and 3 months after stroke, “which translated to a relative FA [rFA] comparable with prior reports at this time point,” the researchers wrote. “However, by 6 months, mean rFA began to increase and by 2 years it was significantly higher than at 1 month. This increasing trend in rFA may imply an increase in axonal and fiber coherence as well as thickness in myelin sheets, suggesting microstructural repair. However, without a comparable group of stroke patients not treated with MNCs, we cannot directly ascribe the white matter changes to MNC treatment.”
In light of the findings, the researchers concluded that MNCs “pose no additional harm in ischemic stroke patients when given during the acute phase, doses up to 10 million cells per kilogram are tolerated, and it is feasible to perform a bone marrow harvest and reinfusion of MNCs for a wide range of stroke patients. Well-designed RCTs are needed to further assess safety and efficacy of this novel investigational approach to enhance stroke recovery.”
The study was supported by grants from the National Institutes of Health. Dr. Savitz and many of his coauthors disclosed having numerous financial ties to the pharmaceutical and biotechnology industries.
, results from a single-arm, phase I trial demonstrated. Unlike autologous mesenchymal stem cells, mononuclear cells (MNCs) do not require passage in culture, which allows for testing in the early poststroke time therapy window.
Bone marrow MNCs are attractive in regenerative medicine studies because they can be rapidly isolated; are enriched with hematopoietic, mesenchymal, and endothelial progenitor cells; and permit autologous applications. “The regenerative potential of bone marrow–derived MNCs is attributed to various mechanisms that impact stroke recovery,” researchers led by Sean I. Savitz, MD, wrote in a study published online Sept. 17 in Stem Cells. “These cells migrate to the site of injury, release cytokines and other trophic factors, decrease proinflammatory and upregulate anti-inflammatory pathways, and enhance angiogenesis, neurogenesis, and synaptogenesis.”
For the trial, Dr. Savitz, MD, director of the Institute for Stroke and Cerebrovascular Disease at UTHealth, Houston, and colleagues recruited 25 patients to receive an IV dose of their own bone marrow mononuclear cells within 72 hours after stroke onset, a time frame supported by previous preclinical studies. They followed the patients for 1 year and compared the results with a control group of 185 patients who received conventional poststroke treatment. Primary outcomes were study-related serious adverse events and the proportion of patients successfully completing study intervention.
The researchers reported results from 25 patients who received bone marrow MNCs. The mean age of patients in the MNC and control groups were 61 and 63 years, respectively, 53% were female, and 69% were white. No study-related adverse events were observed in the MNC group, but three (12%) had infarct expansion between enrollment and harvest and underwent elective hemicraniectomy after cell infusion.
Advanced magnetic resonance imaging revealed that the average mean fractional anisotropy (FA), a measure of structural integrity and directional coherence of axonal fibers, within the ipsilesional pons was decreased between 1 and 3 months after stroke, “which translated to a relative FA [rFA] comparable with prior reports at this time point,” the researchers wrote. “However, by 6 months, mean rFA began to increase and by 2 years it was significantly higher than at 1 month. This increasing trend in rFA may imply an increase in axonal and fiber coherence as well as thickness in myelin sheets, suggesting microstructural repair. However, without a comparable group of stroke patients not treated with MNCs, we cannot directly ascribe the white matter changes to MNC treatment.”
In light of the findings, the researchers concluded that MNCs “pose no additional harm in ischemic stroke patients when given during the acute phase, doses up to 10 million cells per kilogram are tolerated, and it is feasible to perform a bone marrow harvest and reinfusion of MNCs for a wide range of stroke patients. Well-designed RCTs are needed to further assess safety and efficacy of this novel investigational approach to enhance stroke recovery.”
The study was supported by grants from the National Institutes of Health. Dr. Savitz and many of his coauthors disclosed having numerous financial ties to the pharmaceutical and biotechnology industries.
FROM STEM CELLS
Does this patient have bacterial conjunctivitis?
A 54-year-old pharmacist with a history of gout, hypertension, and conjunctivitis presents for evaluation of pink eye in the summer. The morning before coming into the office, he noticed that his right eye was red and inflamed. He self-treated with saline washes and eye drops, but upon awakening the next day, he found his right eye to be crusted shut with surrounding yellow discharge. He has not had any changes to his vision but endorses a somewhat uncomfortable, “gritty” sensation. He reports no recent cough, nasal congestion, or allergies, and he has not been around any sick contacts. His blood pressure is 102/58 mm Hg, pulse is 76 bpm, and body mass index is 27.3 kg/m2. His eye exam reveals unilateral conjunctival injections but no hyperemia of the conjunctiva adjacent to the cornea. Mucopurulent discharge was neither found on the undersurface of the eyelid nor emerging from the eye. Which of the following is the best treatment for this patient’s condition?
A) Erythromycin 5 mg/gram ophthalmic ointment.
B) Ofloxacin 0.3% ophthalmic drops.
C) Antihistamine drops.
D) Eye lubricant drops.
E) No treatment necessary.
This patient is an adult presenting with presumed conjunctivitis. Because he is presenting in the summer without observed purulent discharge, his condition is unlikely to be bacterial. This patient does not need treatment, although eye lubricant drops could reduce his discomfort.
After ruling out serious eye disease, clinicians need to determine which cases of suspected conjunctivitis are most likely to be bacterial to allow for judicious use of antibiotic eye drops. This is an important undertaking as most patients assume that antibiotics are needed.

How do we know which history and clinical exam findings to lean on when attempting to categorize conjunctivitis as bacterial or not? If a patient reports purulent discharge, doesn’t that mean it is bacterial? Surprisingly, a systematic review published in 2016 by Narayana and McGee found that a patient’s self-report of “purulent drainage” is diagnostically unhelpful, but if a clinician finds it on exam, the likelihood of a bacterial etiology increases.3
Narayana and McGee analyzed three studies that enrolled a total of 281 patients with presumed conjunctivitis who underwent bacterial cultures. They then determined which findings increased the probability of positive bacterial culture. From strongest to weakest, the best indicators of a bacterial cause were found to be: complete redness of the conjunctival membrane obscuring tarsal vessels (the vessels visible on the inside of everted upper or lower eyelids) (likelihood ratio, 4.6), observed purulent discharge (LR, 3.9), matting of both eyes in the morning (LR, 3.6), and presence during winter/spring months (LR, 1.9). On the other hand, failure to observe a red eye at 20 feet (LR, 0.2), absence of morning gluing of either eye (LR, 0.3), and presentation during summer months (LR, 0.4) all decreased the probability of a bacterial cause. This review and different study by Stenson et al. unfortunately have conflicting evidence regarding whether the following findings are diagnostically helpful: qualities of eye discomfort (such as burning or itching), preauricular adenopathy, conjunctival follicles, and conjunctival papillae.3,4 Rietveld and colleagues found that a history of conjunctivitis decreased the likelihood of bacterial conjunctivitis.5

Ultimately, if the former indicators are kept in mind, primary care clinicians should be able to decrease the prescribing of topical antimicrobials to patients with non-bacterial conjunctivitis.
Pearl: The best indicators of a bacterial cause in patients with presumed conjunctivitis are complete redness of the conjunctival membrane obscuring tarsal vessels, observed purulent discharge, and matting of both eyes in the morning. Presentation during the summer months and having a history of conjunctivitis decreases the likelihood of bacterial conjunctivitis.
Ms. Momany is a fourth-year medical student at University of Washington, Seattle. Dr. Paauw is professor of medicine in the division of general internal medicine at the University of Washington and serves as third-year medical student clerkship director at that university. Contact Dr. Paauw at [email protected].
References
1. Azari AA and Barney NP. JAMA. 2013 Oct 23; 310(16):1721-9.
2. Smith AF and Waycaster C. BMC Ophthalmol. 2009 Nov 25. doi: 10.1186/1471-2415-9-13.
3) Narayana S and McGee S. Am J Med. 2015;128(11):1220-4.e1.
4) Stenson S et al. Arch Ophthalmol. 1982;100(8):1275-7.
5) Rietveld RP et al. BMJ. 2004 Jul 24;329(7459):206-10.
A 54-year-old pharmacist with a history of gout, hypertension, and conjunctivitis presents for evaluation of pink eye in the summer. The morning before coming into the office, he noticed that his right eye was red and inflamed. He self-treated with saline washes and eye drops, but upon awakening the next day, he found his right eye to be crusted shut with surrounding yellow discharge. He has not had any changes to his vision but endorses a somewhat uncomfortable, “gritty” sensation. He reports no recent cough, nasal congestion, or allergies, and he has not been around any sick contacts. His blood pressure is 102/58 mm Hg, pulse is 76 bpm, and body mass index is 27.3 kg/m2. His eye exam reveals unilateral conjunctival injections but no hyperemia of the conjunctiva adjacent to the cornea. Mucopurulent discharge was neither found on the undersurface of the eyelid nor emerging from the eye. Which of the following is the best treatment for this patient’s condition?
A) Erythromycin 5 mg/gram ophthalmic ointment.
B) Ofloxacin 0.3% ophthalmic drops.
C) Antihistamine drops.
D) Eye lubricant drops.
E) No treatment necessary.
This patient is an adult presenting with presumed conjunctivitis. Because he is presenting in the summer without observed purulent discharge, his condition is unlikely to be bacterial. This patient does not need treatment, although eye lubricant drops could reduce his discomfort.
After ruling out serious eye disease, clinicians need to determine which cases of suspected conjunctivitis are most likely to be bacterial to allow for judicious use of antibiotic eye drops. This is an important undertaking as most patients assume that antibiotics are needed.
How do we know which history and clinical exam findings to lean on when attempting to categorize conjunctivitis as bacterial or not? If a patient reports purulent discharge, doesn’t that mean it is bacterial? Surprisingly, a systematic review published in 2016 by Narayana and McGee found that a patient’s self-report of “purulent drainage” is diagnostically unhelpful, but if a clinician finds it on exam, the likelihood of a bacterial etiology increases.3
Narayana and McGee analyzed three studies that enrolled a total of 281 patients with presumed conjunctivitis who underwent bacterial cultures. They then determined which findings increased the probability of positive bacterial culture. From strongest to weakest, the best indicators of a bacterial cause were found to be: complete redness of the conjunctival membrane obscuring tarsal vessels (the vessels visible on the inside of everted upper or lower eyelids) (likelihood ratio, 4.6), observed purulent discharge (LR, 3.9), matting of both eyes in the morning (LR, 3.6), and presence during winter/spring months (LR, 1.9). On the other hand, failure to observe a red eye at 20 feet (LR, 0.2), absence of morning gluing of either eye (LR, 0.3), and presentation during summer months (LR, 0.4) all decreased the probability of a bacterial cause. This review and different study by Stenson et al. unfortunately have conflicting evidence regarding whether the following findings are diagnostically helpful: qualities of eye discomfort (such as burning or itching), preauricular adenopathy, conjunctival follicles, and conjunctival papillae.3,4 Rietveld and colleagues found that a history of conjunctivitis decreased the likelihood of bacterial conjunctivitis.5
Ultimately, if the former indicators are kept in mind, primary care clinicians should be able to decrease the prescribing of topical antimicrobials to patients with non-bacterial conjunctivitis.
Pearl: The best indicators of a bacterial cause in patients with presumed conjunctivitis are complete redness of the conjunctival membrane obscuring tarsal vessels, observed purulent discharge, and matting of both eyes in the morning. Presentation during the summer months and having a history of conjunctivitis decreases the likelihood of bacterial conjunctivitis.
Ms. Momany is a fourth-year medical student at University of Washington, Seattle. Dr. Paauw is professor of medicine in the division of general internal medicine at the University of Washington and serves as third-year medical student clerkship director at that university. Contact Dr. Paauw at [email protected].
References
1. Azari AA and Barney NP. JAMA. 2013 Oct 23; 310(16):1721-9.
2. Smith AF and Waycaster C. BMC Ophthalmol. 2009 Nov 25. doi: 10.1186/1471-2415-9-13.
3) Narayana S and McGee S. Am J Med. 2015;128(11):1220-4.e1.
4) Stenson S et al. Arch Ophthalmol. 1982;100(8):1275-7.
5) Rietveld RP et al. BMJ. 2004 Jul 24;329(7459):206-10.
High mortality rates trail tracheostomy patients
findings of a large retrospective study suggest.

Current outcome prediction tools to support decision making regarding tracheostomies are limited, wrote Anuj B. Mehta, MD, of National Jewish Health in Denver, and colleagues. “This study provides novel and in-depth insight into mortality and health care utilization following tracheostomy not previously described at the population-level.”
In a study published in Critical Care Medicine, the researchers reviewed data from 8,343 nonsurgical patients seen in California hospitals from 2012 to 2013 who received a tracheostomy for acute respiratory failure.
Overall, the 1-year mortality rate for patients who had tracheostomies (the primary outcome) was 46.5%, with in-hospital mortality of 18.9% and 30-day mortality of 22.1%. Pneumonia was the most common diagnosis for patients with respiratory failure (79%) and some had an additional diagnosis, such as severe sepsis (56%).
Patients aged 65 years and older had significantly higher mortality than those under 65 (54.7% vs. 36.5%). The average age of the patients was 65 years; approximately 46% were women and 48% were white. The median survival for adults aged 65 years and older was 175 days, compared with median survival of more than a year for younger patients.
Secondary outcomes included discharge destination, hospital readmission, and health care utilization. A majority (86%) of patients were discharged to a long-term care facility, while 11% were sent home and approximately 3% were discharged to other destinations.
Nearly two-thirds (60%) of patients were readmitted to the hospital within a year of tracheostomy, and readmission was more common among older adults, compared with younger (66% vs. 55%).
In addition, just over one-third of all patients (36%) spent more than 50% of their days alive in the hospital in short-term acute care, and this rate was significantly higher for patients aged 65 years and older, compared with those under 65 (43% vs. 29%). On average, the total hospital cost for patients who survived the first year after tracheostomy was $215,369, with no significant difference in average cost among age groups.
The study findings were limited by several factors including the use of data from a single state, possible misclassification of billing codes, and inability to measure quality of life, the researchers noted.
However, “our findings of high mortality, low median survival for older patients, high readmission rates, potentially burdensome cost, and informative outcome trajectories provide significant insight into long-term outcomes following tracheostomy,” they concluded.
Dr. Mehta and several colleagues reported receiving funding from the National Institutes of Health. The researchers had no financial conflicts to disclose.
SOURCE: Mehta AB et al. Crit Care Med. 2019 Aug 8. doi: 10.1097/CCM.0000000000003959.
findings of a large retrospective study suggest.
Current outcome prediction tools to support decision making regarding tracheostomies are limited, wrote Anuj B. Mehta, MD, of National Jewish Health in Denver, and colleagues. “This study provides novel and in-depth insight into mortality and health care utilization following tracheostomy not previously described at the population-level.”
In a study published in Critical Care Medicine, the researchers reviewed data from 8,343 nonsurgical patients seen in California hospitals from 2012 to 2013 who received a tracheostomy for acute respiratory failure.
Overall, the 1-year mortality rate for patients who had tracheostomies (the primary outcome) was 46.5%, with in-hospital mortality of 18.9% and 30-day mortality of 22.1%. Pneumonia was the most common diagnosis for patients with respiratory failure (79%) and some had an additional diagnosis, such as severe sepsis (56%).
Patients aged 65 years and older had significantly higher mortality than those under 65 (54.7% vs. 36.5%). The average age of the patients was 65 years; approximately 46% were women and 48% were white. The median survival for adults aged 65 years and older was 175 days, compared with median survival of more than a year for younger patients.
Secondary outcomes included discharge destination, hospital readmission, and health care utilization. A majority (86%) of patients were discharged to a long-term care facility, while 11% were sent home and approximately 3% were discharged to other destinations.
Nearly two-thirds (60%) of patients were readmitted to the hospital within a year of tracheostomy, and readmission was more common among older adults, compared with younger (66% vs. 55%).
In addition, just over one-third of all patients (36%) spent more than 50% of their days alive in the hospital in short-term acute care, and this rate was significantly higher for patients aged 65 years and older, compared with those under 65 (43% vs. 29%). On average, the total hospital cost for patients who survived the first year after tracheostomy was $215,369, with no significant difference in average cost among age groups.
The study findings were limited by several factors including the use of data from a single state, possible misclassification of billing codes, and inability to measure quality of life, the researchers noted.
However, “our findings of high mortality, low median survival for older patients, high readmission rates, potentially burdensome cost, and informative outcome trajectories provide significant insight into long-term outcomes following tracheostomy,” they concluded.
Dr. Mehta and several colleagues reported receiving funding from the National Institutes of Health. The researchers had no financial conflicts to disclose.
SOURCE: Mehta AB et al. Crit Care Med. 2019 Aug 8. doi: 10.1097/CCM.0000000000003959.
FROM CRITICAL CARE MEDICINE
Combo could be new standard for transplant-eligible, newly diagnosed myeloma patients
BOSTON — Daratumumab plus bortezomib, lenalidomide, and dexamethasone (D-RVd) may be a new standard of care for transplant-eligible patients with newly diagnosed multiple myeloma, according to a speaker at the International Myeloma Workshop.
In the phase 2 GRIFFIN trial, adding daratumumab to RVd deepened responses at all time points and improved rates of stringent complete response and minimal residual disease (MRD) negativity post consolidation.
These results might convince “early adopters of therapy” to change their practice, said Peter M. Voorhees, MD, of Levine Cancer Institute at Atrium Health in Charlotte, N.C., who presented results from GRIFFIN as a late-breaking abstract at the workshop, which is held by the International Myeloma Society.
“But I think you do have to be careful,” Dr. Voorhees added. “We’ll have to see how these patients do over time. Is the MRD sustained, and does that MRD negativity improve progression-free survival?”
Dr. Voorhees presented data on 207 adults with transplant-eligible, newly diagnosed multiple myeloma who were enrolled in the GRIFFIN trial. The patients received RVd, with or without daratumumab, for induction (cycles 1-4). They received granulocyte colony stimulating factor, with or without plerixafor, for stem cell mobilization, and melphalan for conditioning prior to transplant.
Patients received consolidation with D-RVd or RVd (cycles 5-6) and maintenance with lenalidomide alone or in combination with daratumumab (cycles 7-32). Patients could continue maintenance with lenalidomide alone beyond cycle 32.
The D-RVd arm comprised 104 patients, and the RVd arm comprised 103 patients. Baseline characteristics were well balanced between the treatment arms. The median age was 59 years (range, 29-70 years) in the D-RVd arm and 61 years (range, 40-70 years) in the RVd arm.
Most patients had stage I (47% in the D-RVd arm and 49% in the RVd arm) or stage II disease (39% and 36%, respectively) according to the International Staging System. And most patients had standard risk cytogenetics (84% and 86%, respectively).
Response, MRD, and engraftment
The study’s primary endpoint was stringent complete response by the end of consolidation, which was achieved by 42.4% of patients in the D-RVd arm and 32.0% in the RVd arm (odds ratio [OR] = 1.57; P = .068). The overall response rate at that time point was 99.0% and 91.8%, respectively (P = .0160).
Responses deepened over time, and response rates were greater for D-RVd than for RVd at all time points. The complete response rate was 19.2% in the D-RVd arm and 13.4% in the RVd arm at the end of induction; 27.3% and 19.6%, respectively, at the end of transplant; 51.5% and 42.3%, respectively, at the end of consolidation; and 62.6% and 47.4%, respectively, at the clinical cutoff.
D-RVd also improved MRD negativity (10-5) rates at the end of consolidation. MRD negativity was 44.2% in the D-RVd arm and 14.6% in the RVd arm (OR = 4.70; P less than .0001). The rate of MRD negativity in patients with a complete response or better was 28.8% and 9.7%, respectively (OR = 3.73; P = .0007).
Dr. Voorhees noted that D-RVd was favored across all subgroups for MRD negativity and stringent compete response, except among patients with high-risk cytogenetics and stage III disease.
He also pointed out that stem cell mobilization was “feasible” in the D-RVd arm, and daratumumab did not impact engraftment. The median time to neutrophil engraftment was 12 days in both treatment arms. The median time to platelet engraftment was 13 days in the D-RVd arm and 12 days in the RVd arm.
Safety
“The adverse events are what you would expect,” Dr. Voorhees said. “Grade 3 and 4 neutropenia and thrombocytopenia were seen more often in the dara arm of the trial compared to the RVd arm.”
The most common grade 3/4 treatment-emergent adverse events (in the D-RVd and RVd arms, respectively) were neutropenia (32% and 15%), lymphopenia (23% in both), thrombocytopenia (16% and 8%), and leukopenia (15% and 7%).
“Nonhematologic toxicities were generally equal between the two groups, but I do want to stress that there was a higher rate of infection in the dara arm,” Dr. Voorhees noted.
The incidence of infection was 82% in the D-RVd arm and 55% in the RVd arm, but the rate of grade 3/4 infection was 17% in both arms. The rate of pneumonia was 10% in the D-RVd arm and 9% in the RVd arm.
All-grade infusion-related reactions occurred in 41% of patients in the D-RVd arm, and grade 3/4 infusion-related reactions occurred in 5%.
The trial was sponsored by Janssen. Dr. Voorhees reported relationships with Janssen and several other companies.
SOURCE: Voorhees PM et al. IMW 2019. Abstract OAB-087.
FROM IMW 2019
ACR looks for continued growth in awareness of rheumatic diseases with latest annual campaign
With the help of a key celebrity spokesperson, the American College of Rheumatology is hoping Rheumatic Disease Awareness Month (RDAM) will continue to raise the profile of the related illnesses and help more patients recognize their symptoms and get on the road to treatment.
This year, the celebrity tapped to lead the now-annual campaign that began in September 2016 is tennis champion Venus Williams, who has been competing while battling Sjögren’s syndrome. She was diagnosed in 2011.
Having a high-profile individual like Venus Williams will “bring more awareness to not a specific illness but just rheumatic diseases in general,” Suleman Bhana, MD, chair of the ACR’s marketing and communications committee, said in an interview, adding that it is a way to help get attention from patients and their family members to be more aware of what they are facing when afflicted with a rheumatic disease.
It also helps to drive traffic to a website (simpletasks.org) set up to help build a community around rheumatic diseases, he noted.
“By signing up on the website, patients and others can get connected with wellness articles and can be informed about any advocacy opportunities in their local area or the national level,” said Dr. Bhana, a rheumatologist with Crystal Run Healthcare in Middletown, N.Y. “It helps us a lot from an ACR point of view just by getting the word out about rheumatic diseases.”
Dr. Bhana said that part of the success of the RDAM campaign is being measured by the number of people who sign up for the website. “Last year we had about 1,600 people sign up, which was more than double from the previous year and we are hoping to do even better this year now that we have Venus Williams as our spokesperson.”
But the campaign involves more than just a celebrity spokesperson and an online community to build awareness for rheumatic diseases and their associated symptoms and treatments. The ACR is working with patients to make sure their voices are heard on Capitol Hill to help ensure proper access to medical care and those treatments.
This year, the ACR – along with more than 100 advocates – met with members of Congress to push for policies that will benefit people with rheumatic diseases. One key item on the agenda targets the use of step therapy.
“This year the ACR’s Government Affairs Committee had a list of several pieces of legislation that they are looking at heavily. [One bill is about] having brakes on what is called step therapy, which is a fairly egregious practice by many insurers that forces patients to use different medications than what the physician and patient decide in their mutual doctor-patient relationship before they can use the medicine that was originally decided upon,” he said. “The reasons for this practice mostly are financial in that insurers get kickbacks from certain pharmaceutical companies, and that is what they term as preferred drugs. It’s a lot more than just cost savings. It’s about the insurers financially benefiting from patients rather than doing the right thing and preserving the doctor-patient relationship.”
One bill in particular that has been highlighted by the ACR is the Safe Step Act of 2019 (H.R. 2279), introduced by Rep. Raul Ruiz, MD (D-Calif.), and Rep. Brad Wenstrup, DPM (R-Ohio), would put limits on step therapy and create a clear process for patients and physicians to seek exemptions.
Other legislative actions that patients and the ACR were advocating for during the visits for RDAM included the EMPOWER for Health Act (H.R. 2781), which would help increase the number of pediatric subspecialists, including pediatric rheumatologists, through loan repayment for health professionals who agree to work at least 2 years in pediatric medicine, and the REDI Act (H.R. 1554), which would defer the accumulation on student loan interest while future doctors serve in a medical internship or residency program.
“The reality of pediatrics is that they don’t get well compensated as a pediatric rheumatologist subspecialist, so there is an ultimate financial disincentive for training pediatricians to go into rheumatology,” Dr. Bhana said. “So we are trying to get support for loan repayment for pediatric rheumatologists or rheumatology fellowship programs, which may help to incentivize young pediatricians to go into rheumatology to at least expand access to care.”
The RDAM campaign also provides useful contacts for an annual survey that the ACR conducts. This year’s survey found that access issues for both physicians and treatments persist, informing the agenda for the advocacy on Capitol Hill.
For example, the 2019 survey found that more than 60% of respondents had to wait at least 31 days from a physician referral to an initial rheumatologist appointment. Dr. Bhana noted that, in his practice, the wait can be 3 months or longer. A little more than 36% of respondents were able to get that initial appointment after referral in 30 days or less.
Additionally, nearly 47% of respondents were subjected to step therapy in the past year.
Treatment pricing was also raised as a concern in the survey, with a little more than 57% of respondents reporting difficulty affording treatments in the past year, and 25% reporting annual out-of-pocket spending at greater than $1,000, with more than 6% reporting annual out-of-pocket spending of greater than $5,000.
Despite all the challenges that lay ahead, Dr. Bhana believes that, as the campaign continues in its fourth year, it is having a positive impact.
“I think there is more awareness among patients to look up their symptoms and prompt their providers to look into, if not test for, rheumatic diseases, direct referrals, and I think because of these campaigns, we’ve gotten some indication that from a social media awareness that more patients are talking about it, about trying to get into seeing a physician.”
Adding elotuzumab to lenalidomide/dexamethasone can prolong survival in relapsed/refractory myeloma
BOSTON – Adding elotuzumab to lenalidomide and dexamethasone can prolong overall survival in patients with relapsed/refractory multiple myeloma, according to final results from the ELOQUENT-2 trial.
At a minimum follow-up of 6 years, elotuzumab plus lenalidomide/dexamethasone (ELd) reduced the risk of death by 18% and prolonged the median overall survival by 8.7 months when compared to treatment with lenalidomide/dexamethasone (Ld).
“The combination of elotuzumab with lenalidomide and dexamethasone demonstrated a statistically significant and clinically meaningful 18% reduction in the risk of death,” said Meletios A. Dimopoulos, MD, PhD, of the National and Kapodistrian University of Athens. “This treatment combination is the only approved antibody-based regimen shown to prolong overall survival significantly in patients with relapsed or refractory myeloma in the context of a large, prospective, randomized trial.”
Dr. Dimopoulos presented results from this phase 3 trial at the International Myeloma Workshop, held by the International Myeloma Society.
The final analysis of ELOQUENT-2 included 646 patients with relapsed/refractory multiple myeloma who had received one to three prior lines of therapy at baseline. There were 321 patients randomized to ELd and 325 randomized to Ld. Baseline characteristics were well balanced between the treatment arms.
At the data cutoff of Oct. 3, 2018, 319 patients in the ELd arm and 316 in the Ld arm had received their assigned treatment. Ten percent (n = 33) of patients in the ELd arm and 4% (n = 14) in the Ld arm were still receiving their assigned treatment at the cutoff date.
The median number of treatment cycles was 19 (range, 9-42) in the ELd arm and 14 (range, 6-25) in the Ld arm. Most patients discontinued treatment due to disease progression (56% in the ELd arm and 57% in the Ld arm) or treatment-related toxicity (12% and 14%, respectively).
Survival
At a minimum follow-up of 71 months, the median overall survival was 48.3 months in the ELd arm and 39.6 months in the Ld arm. The hazard ratio was 0.82 (P = .0408).
The overall survival advantage with ELd was observed in all prespecified patient subgroups, Dr. Dimopoulos said. For example, overall survival favored ELd in patients aged 75 years and older (HR, 0.69), patients with International Staging System stage III disease at enrollment (HR, 0.74), those who had received two to three prior lines of therapy (HR, 0.71), and patients with del(17p) (HR, 0.71).
There were 212 deaths in the ELd arm and 225 in the Ld arm (67% and 71%, respectively). The most common causes of death were disease progression (41% in the ELd arm and 45% in the Ld arm), infection (9% and 6%, respectively), and “other” or unknown causes (7% and 9%, respectively). Two percent of patients in each arm (n = 7 in both) died from study treatment–related toxicity.
Dr. Dimopoulos pointed out that there were no imbalances in subsequent therapies between the ELd and Ld arms. The most common subsequent therapies (in the ELd and Ld arms, respectively) were bortezomib (38% and 42%), cyclophosphamide (30% in both arms), pomalidomide (26% and 29%), and lenalidomide (18% and 22%).
Safety
“Most of the adverse events which occurred throughout the study were due to the known side effects of lenalidomide and dexamethasone,” Dr. Dimopoulos said. “The contribution of elotuzumab to any kind of toxicity was minimal.”
Nearly all patients in both arms (99%) experienced adverse events. Serious adverse events were observed in 75% of patients in the ELd arm and 61% in the Ld arm. Adverse events leading to treatment discontinuation occurred in 36% and 33%, respectively, and grade 3-4 events leading to discontinuation occurred in 21% and 20%, respectively.
Grade 3-4 adverse events of special interest (in the ELd and Ld arms, respectively) were infections (35% and 27%), renal and urinary disorders (5% in both), cardiac disorders (6% and 8%), and lymphopenia (8% and 4%). Second primary malignancies occurred in 12% of patients in the ELd arm and 9% in the Ld arm.
This trial was sponsored by Bristol-Myers Squibb in collaboration with AbbVie. Dr. Dimopoulos reported relationships with Bristol-Myers Squibb, Amgen, Celgene, Janssen, and Takeda.
SOURCE: Dimopoulos MA et al. IMW 2019, Abstract OAB-021.
FROM IMW 2019
CT103A elicits responses after prior CAR T-cell relapse
BOSTON – CT103A, a chimeric antigen receptor (CAR) T-cell therapy, is “active and effective” in patients with relapsed/refractory multiple myeloma, according to a speaker at the International Myeloma Workshop, held by the International Myeloma Society.

The anti–B-cell maturation antigen (BCMA) CAR T-cell therapy produced a 100% response rate in patients with heavily pretreated multiple myeloma, and three of four patients who had failed a prior CAR T-cell therapy achieved a stringent complete response after CT103A.
Chunrui Li, MD, PhD, of Tongji Hospital and Tongji Medical College, Huazhong University of Science, Wuhan, China, presented these results at the workshop.
Dr. Li noted that anti-BCMA CAR T-cell therapy has produced responses in myeloma patients, but approximately half of patients typically relapse in about a year. CAR T-cell infusions after relapse have not been effective in these patients.
In an effort to change that, Dr. Li and his colleagues developed CT103A, a lentiviral vector containing a CAR structure with a fully human single-chain fragment variant; CD8a hinger; and transmembrane, 4-1BB co-stimulatory, and CD3z activation domains.
Dr. Li and his colleagues evaluated CT103A in a phase 0 trial (ChiCTR1800018137) of 18 patients who had received at least three prior lines of therapy and had disease refractory to a proteasome inhibitor and an immunomodulatory agent.
The patients’ median age was 53.3 years (range, 38-66 years), and their median time since diagnosis was 32 months (range, 8-92 months). They had received a median of 4 (range, 3-6) prior therapies. All had received prior bortezomib and lenalidomide, seven had undergone a transplant, and four had been treated on a trial of murine anti-BCMA CAR T-cell therapy.
For the current trial, patients received lymphodepletion with cyclophosphamide and fludarabine, followed by CT103A at 1x10⁶, 3x10⁶, or 6x10⁶ CAR T cells/kg.
There was one dose-limiting toxicity at the highest dose level – grade 4 cytokine release syndrome (CRS) in a patient who died at day 19 after CT103A infusion.
In all, 17 patients developed CRS, four with grade 1, eight with grade 2, four with grade 3, and one with grade 4 CRS. None of the patients developed neurologic toxicity.
Serious adverse events related to lymphodepletion and/or CT103A included prolonged cytopenia (n = 3), pulmonary infection (n = 2), herpes zoster (n = 1), pleuritis (n = 1), and hypoxemia (n = 1).
There were 17 patients evaluable for efficacy, and all of them achieved a response at some point. In eight patients, responses have lasted more than 200 days.
At the data cutoff, there were 10 stringent complete responses, two complete responses, and three very good partial responses. One patient progressed after achieving a very good partial response, and one patient achieved a partial response but ultimately died (likely of respiratory failure attributable to a lung infection).
Of the four patients who had previously received murine CAR T-cell therapy, one progressed, and three achieved a stringent complete response.
This study was funded by Nanjing Iaso Biotherapeutics. Dr. Li did not disclose any conflicts of interest.
SOURCE: Li C et al. IMW 2019, Abstract OAB-033.
BOSTON – CT103A, a chimeric antigen receptor (CAR) T-cell therapy, is “active and effective” in patients with relapsed/refractory multiple myeloma, according to a speaker at the International Myeloma Workshop, held by the International Myeloma Society.
The anti–B-cell maturation antigen (BCMA) CAR T-cell therapy produced a 100% response rate in patients with heavily pretreated multiple myeloma, and three of four patients who had failed a prior CAR T-cell therapy achieved a stringent complete response after CT103A.
Chunrui Li, MD, PhD, of Tongji Hospital and Tongji Medical College, Huazhong University of Science, Wuhan, China, presented these results at the workshop.
Dr. Li noted that anti-BCMA CAR T-cell therapy has produced responses in myeloma patients, but approximately half of patients typically relapse in about a year. CAR T-cell infusions after relapse have not been effective in these patients.
In an effort to change that, Dr. Li and his colleagues developed CT103A, a lentiviral vector containing a CAR structure with a fully human single-chain fragment variant; CD8a hinger; and transmembrane, 4-1BB co-stimulatory, and CD3z activation domains.
Dr. Li and his colleagues evaluated CT103A in a phase 0 trial (ChiCTR1800018137) of 18 patients who had received at least three prior lines of therapy and had disease refractory to a proteasome inhibitor and an immunomodulatory agent.
The patients’ median age was 53.3 years (range, 38-66 years), and their median time since diagnosis was 32 months (range, 8-92 months). They had received a median of 4 (range, 3-6) prior therapies. All had received prior bortezomib and lenalidomide, seven had undergone a transplant, and four had been treated on a trial of murine anti-BCMA CAR T-cell therapy.
For the current trial, patients received lymphodepletion with cyclophosphamide and fludarabine, followed by CT103A at 1x10⁶, 3x10⁶, or 6x10⁶ CAR T cells/kg.
There was one dose-limiting toxicity at the highest dose level – grade 4 cytokine release syndrome (CRS) in a patient who died at day 19 after CT103A infusion.
In all, 17 patients developed CRS, four with grade 1, eight with grade 2, four with grade 3, and one with grade 4 CRS. None of the patients developed neurologic toxicity.
Serious adverse events related to lymphodepletion and/or CT103A included prolonged cytopenia (n = 3), pulmonary infection (n = 2), herpes zoster (n = 1), pleuritis (n = 1), and hypoxemia (n = 1).
There were 17 patients evaluable for efficacy, and all of them achieved a response at some point. In eight patients, responses have lasted more than 200 days.
At the data cutoff, there were 10 stringent complete responses, two complete responses, and three very good partial responses. One patient progressed after achieving a very good partial response, and one patient achieved a partial response but ultimately died (likely of respiratory failure attributable to a lung infection).
Of the four patients who had previously received murine CAR T-cell therapy, one progressed, and three achieved a stringent complete response.
This study was funded by Nanjing Iaso Biotherapeutics. Dr. Li did not disclose any conflicts of interest.
SOURCE: Li C et al. IMW 2019, Abstract OAB-033.
REPORTING FROM IMW 2019
Antisuicide program promotes resilience, peer support
As youth suicides continue to climb nationwide, a growing body of research shows that the deaths are happening at higher rates in rural communities.
In 2017, suicides reached their highest point since 2000, a trend driven by a sharp rise in male suicides and in youth aged 15-19 years, according to an analysis published recently in JAMA (2019 Jun 18. doi: 10.1001/jama.2019.5054). Among youth aged 15-19 years, the suicide rate was 12 per 100,000 in 2017 (18 per 100,000 in males and 5 per 100,000 in females), compared with 8 per 100,000 in 2000, the study found. Across all age groups, the highest suicide rates and greatest rate increases are in rural counties, according to data from the Centers for Disease Control and Prevention (CDC).
Now, a unique initiative in New Mexico is working to combat those alarming trends through an alliance of community leaders that strives to strengthen resilience and build peer support for at-risk youth.
The Alliance-Building for Suicide Prevention & Youth Resilience (ASPYR) program, created by the University of New Mexico (UNM), Albuquerque, focuses on training professionals and advocates within New Mexico communities in a strength-based, youth-directed, collaborative approach for the assessment and treatment of suicidality. A diversity of community members undergo the training, including health and behavioral health care providers, peer support and community support workers, youth and community advocates, educators, and first responders. The initiative also supports and facilitates the development of a communitywide crisis intervention plan that promotes youth safety and resilience.
“ASPYR is unique, in that we actively involve youth to guide our program, versus an adult-only led program,” says Laura Rombach, program manager for ASPYR and a senior program therapist in the department of psychiatry and behavioral sciences at UNM. “Youth offer feedback about our training and ideas about how to best prevent suicide in their schools and communities. New Mexico is underresourced, and individuals living in rural/frontier areas do not always have access to licensed behavioral health providers, so our training is developed for licensed providers as well as peers and paraprofessionals to increase the knowledge of care for individuals experiencing a suicidal crisis.”
Rural populations present challenges
The many rural pockets of New Mexico pose numerous obstacles for antisuicide advocates.
Of the 33 counties in New Mexico, six are identified by the Census Bureau as completely “rural,” and an additional six are defined as mostly rural, according to the University of New Mexico Bureau of Business & Economic Research. Even among counties considered “urban” however, a considerable amount of the population lives in rural areas, according to the bureau. San Juan County, for example, which is considered urban by the Census Bureau, had an estimated 34% of residents living in rural areas in 2010.
Poverty adds to the difficulty. In 2017, nearly one in five New Mexicans (20%) lived below the poverty line, and the state had the second-highest rate of children under 18 years living in poverty in the country, according to a report by the New Mexico Department of Workforce Solutions.
“New Mexico is an impoverished state with limited capacity, especially in regards to behavioral health services,” said Avi Kriechman, MD, principal investigator for ASPYR at UNM and a child, adolescent, and family psychiatrist at the university. “It is also challenging to create a truly statewide effort where there is limited public transportation, problematic Internet connection, and other barriers to involving those who live and work in rural and frontier New Mexico.”
Addressing suicide among the many native and Indigenous people in rural New Mexico presents another unique set of challenges, said Mary Roessel, MD, a Santa Fe, N.M.–based psychiatrist who specializes in cultural psychiatry. Native and Indigenous residents often have a general mistrust of outsiders and a stigma against mental illnesses, Dr. Roessel said in an interview.
“One of the problems is being able to identify when a person has attempted suicide in some of these small, private, Pueblo communities because they are very closed,” she said. “At times, we don’t get the information to go in and help them. They’re trying to address or deal with the problem themselves.”
To address the many barriers of rural New Mexico, ASPYR works hard to recognize, identify, and support preexisting community resources that are often neglected in needs assessment and stakeholder identification, Dr. Kriechman said. This can include food banks, church care committees, youth advocacy groups, local caregiving, and spiritual traditions, among others. Frequently, many community caregivers and agencies have not connected or communicated with one another and often are unaware of all they have to offer, he said.
“We try to build capacity through community trainings, which include a widely diverse group of providers, advocates, and supports,” he continued. “Our trainings involve highlighting and building upon local and cultural practices and traditions of healing, caregiving, and support. A significant part of our onsite training involves assembling a representative group of local providers in health care, behavioral health care, peer & community support and advocacy, education, first responders to community crises, and government and nonprofit agencies, then facilitating a community conversation between the panel and training attendees about how best to move forward in a synergistic and systemic manner to support youth safety and resilience.”
Peers support peers
While ASPYR encompasses elements of other suicide prevention models, two unique cornerstones of the program are its emphasis on resilience and promotion of peer support. The strength-based, youth-directed approach includes creating a youth-directed safety plan, enlisting peers as support and reducing access to lethal means.
Regarding the youth safety plan, Dr. Kriechman explained that, rather than being prescribed and instructed in expert-selected and expert-driven coping skills, youth are offered a menu of options that most speak to their strengths, values, experience, and preferences. Young people also select a peer who, if they wish, accompanies them to sessions, and supports and coaches them at home.
“Peers are often more influential than parents, siblings, family members, and adults regarding youth behavior,” Dr. Kriechman said. “Most often, it is a peer that a youth-at-risk turns to for support, counsel, role models, and understanding. Youth who wish to offer their peers support can quickly be trained to provide early identification of youth at risk, motivational support to seek help, and a ‘warm hand-off’ to community resources.”
In addition, a Youth Advisory Council established as part of the program draws from young people across New Mexico to participate in state and national conferences, and conduct outreach efforts to peers.
ASPYR Youth council member Serenity Gomez, a senior at the Public Academy for Performing Arts in Albuquerque, became interested in ASPYR after volunteering for the American Foundation for Suicide Prevention in 2016. As a youth council member, Ms. Gomez said she helps create projects to raise suicide awareness, whether through posters, stickers, social media, poetry, or songs.
“My experience as a youth council member has really opened my eyes and has made me more motivated to help others,” she said in an interview. “It has also showed me that talking about suicide doesn’t always have to be a slideshow of facts. You can reach people through music, poetry, storytelling, and so much more. Many people are afraid to talk about suicide because it’s such a scary idea, but if we all talk about it and bring more awareness, then we can find the support everyone needs. In ASPYR, specifically, I hope to reach youth and help all youth learn to support each other.”
Since ASPYR launched in 2017, the program has provided both onsite and online trainings to hundreds of New Mexicans, and has helped rural and frontier communities start working on collaborative approaches to promoting youth safety and resilience, Dr. Kriechman said. Following community consultations, numerous rural communities have since formed systems of care to identify, support, and treat youth at risk. In addition to the youth council, an Advisory Community Council has also been established that welcomes any New Mexico resident interested in working on the mission of preventing youth suicide.
For example, the program shifts from “no-suicide contracts” to safety planning, focusing on reasons for living rather than reasons for dying, and shifting from prescribing coping skills to strengthening preexisting coping skills in young people.
“An ultimate hope for ASPYR is emphasizing that recovery from any of life’s challenges is far more than symptom reduction or agency collaboration,” Dr. Kriechman said. “It is the understanding that a life of value and meaning, the instillation of hope and support for the unique strengths, competencies, skills, and understandings of each individual, is honored, respected, and supported.”